Embed Size (px)
Citation preview

Gawler River Floodplain Management Authority
Gawler River 2016 Flood Review
HYDROLOGY REVIEW
September 2017
Project Team
Ben Taylor
Dr David Kemp
Dr Michael Di Matteo
Geoff Fisher


Gawler River Floodplain Management Authority AWE
P17069, Gawler River 2016 Flood Review i
Document History and Status
Issue Version Issued to Qty Date Project Manager
Approved
Working Draft
V1 DH 1 21/9/2017 GF GF
Printed: September 21, 2017
Last Saved: September 21, 2017
File Name: P17069 R002 Gawler River Hydrology Review v1.3 170918
Project Manager: Geoff Fisher
Client: Gawler River Floodplain Management Authority
Project: Gawler River 2016 Flood Review
Name of Document: Hydrology Review
Document Version: V1
Job Number: P17069
Cover Photograph:
Please cite this report as: Gawler River 2016 Hydrology Review
Disclaimer
This document is for the exclusive use of the client for which it was prepared and is not to be relied upon by any other
person. AWE has made reasonable efforts to ensure that the information provided is accurate but errors and omissions can
occur and circumstances can change from the time that the report or document was prepared. Therefore, except for any
liability that cannot be excluded by law, AWE excludes any liability for loss or damage, direct or indirect, from any person
relying (directly or indirectly) on opinions, forecasts, conclusions, recommendations or other information in this report or
document.

AWE Gawler River Floodplain Management Authority
ii P17069, Gawler River 2016 Flood Review
Table of Contents
1 Introduction ................................................................................................................................................. 1
2 RRR Model Calibration Evaluation............................................................................................................... 2
2.1 Hydrological Review ......................................................................................................................... 2
2.2 PEST Parameter Calibration .............................................................................................................. 3
3 Flood Frequency Analysis ............................................................................................................................ 9
3.1 Penrice .............................................................................................................................................. 9
3.2 Yaldara ............................................................................................................................................ 11
4 Rating Review ............................................................................................................................................ 15
4.1 Introduction .................................................................................................................................... 15
4.2 Gauging Sites Under Review ........................................................................................................... 15
4.3 Modelling Approach ....................................................................................................................... 16
4.4 Results and Discussion .................................................................................................................... 17
5 Summary and Recommendations ............................................................................................................. 19
List of Tables
Table 1: Mount McKenzie RRR Calibration Results ................................................................................................ 3
Table 2: Penrice RRR Calibration Results ................................................................................................................ 4
Table 3: Yaldara RRR Calibration Results ................................................................................................................ 6
Table 4: South East of Gawler RRR Calibration Results .......................................................................................... 7
Table 5: North Para at Penrice Annual Maximum Flows ...................................................................................... 10
Table 6: Penrice GEV Flood Frequency Flows ....................................................................................................... 11
Table 7: North Para at Yaldara Peak Annual Flows ............................................................................................... 11
Table 8: Yaldara GEV Flood Frequency Flows ....................................................................................................... 14
Table 9: Gawler River Gauging Sites Selected for Review .................................................................................... 15
Table 10: Calibration Events for Rating Review .................................................................................................... 16
Table 11: Recommendations from Rating Curve Review ..................................................................................... 18
List of Figures
Figure 2-1: 2016 Calibration Plot at Mount McKenzie ........................................................................................... 4
Figure 2-2: 2016 Calibration Plot at Penrice ........................................................................................................... 5
Figure 2-3: 2016 Calibration at Yaldara .................................................................................................................. 6
Figure 2-4: 2016 Calibration Plot at South East Gawler ......................................................................................... 8
Figure 3-1: Penrice GEV Probability Plot............................................................................................................... 10
Figure 3-2: Yaldara GEV Probability Plot ............................................................................................................... 14
Figure 4-1: Estimating Ratings (Wright and Malone, 2008) .................................................................................. 17
Appendices
Appendix A : Rating Curve Assessment

Gawler River Floodplain Management Authority AWE
P17069, Gawler River 2016 Flood Review 1
1 Introduction The 2016 flood was the first flood that had occurred following the completion of flood mitigation
works on both the North Para and South Para. This flood therefore provided the first opportunity to
review the performance of the mitigation measures, and to evaluate the hydrological model setup
and calibration for the Gawler River.
The overall effectiveness of the measures in reducing the magnitude of the 2016 is described in the
main Project Report, Australian Water Environments (2016). The results of this hydrology report
verified the information provided in the main project report.
This Hydrology Review report therefore focuses on the additional years flow data available since the
last review in 2014, and whether this information suggest that the floodplain mapping and design
flows for the Gawler River need to be further updated.
The review was undertaken in three parts:
An assessment of model parameters at the key model calibration points. This involved a
detailed review of the 2016 flood event for the key calibration points as per the previous
hydrological modelling for Gawler River. A PEST calibration run was undertaken to assess
the process lag parameters and initial and proportional losses. Losses for the
September2016 flood event were compared against the calibrated parameter values for
earlier flood events.
The information from the 2016 flood was used to review the flood frequency analysis for
key model calibration points; and
Further assessment was also undertaken on a number of stage discharge relationships
(rating curves) at gauging stations in the Gawler River catchment. The function of the rating
review was to provide comment on the suitability of the existing rating curves and identify
locations that could be subject to further review and refinement.

AWE Gawler River Floodplain Management Authority
2 P17069, Gawler River 2016 Flood Review
2 RRR Model Calibration Evaluation
2.1 Hydrological Review
Flow data from the available monitoring stations was received for the September 2016 flood event.
These stations included the following sites:
Mount McKenzie (H523308)
Penrice (H523314)
Yaldara (H523312)
Turretfield (H523141)
South East Gawler (H523048)
These were the key sites used for calibration of the RRR1 model of the Gawler River, both in 2007
2
and 20143. Water level data for the September 2016 flood data was provided by both the Bureau of
Meteorology (BoM) and also the Department of Environment, Water and Natural Resources
(DEWNR).
Water level recordings generally appeared to be steady and reflective of the changes through the
flood event at all locations with the exception of the Yaldara site.
Recordings at Yaldara contained instabilities around the initial peak of the event. Discussions with
Mr Damian Rowely, the Hydrographer managing the site for DEWNR, indicated that this may relate
to an instrument issue (thought to be the float tape slipping on the shaft encoder). This appears to
have occurred for a period of several hours before the issue self corrected and the problem
rectified. A post flood site inspection (several months later) by Mr Rowely indicated that the station
was once again operating correctly.
Upon closer review of the data sets provided, it was identified that there were differences in the
rating curves from BoM and DEWNR used to convert the recorded water level to flow rate at two
locations. These differences were limited to the higher end of the flow range but the range relevant
for flood flow estimation.
Selection of the most appropriate rating curve for Yaldara for this investigation was based on a back
calculation method from the estimated hydrograph at Bruce Eastick North Para Flood Mitigation
Dam. That process supported the BoM hydrograph which estimated a peak flow rate of 200 m3/s
(compared to 158 m3/s if the DEWNR rating curve were applied). This process was further supported
by a linear regression comparison using historic flow data between the Turretfield flow gauge (now
decommissioned) and the Yaldara flow gauge.
Nevertheless, the issue of the two different rating curves has not been completely resolved through
this project and further discussion should occur between BoM and DEWNR to agree on a consistent
rating for future hydrograph calculation. Resolution is likely to require additional field survey data
collection along with numerical modelling.
1 Kemp, 2002
2 Department for Transport, Energy & Infrastructure, 2007
3 Australian Water Environments, 2014

Gawler River Floodplain Management Authority AWE
P17069, Gawler River 2016 Flood Review 3
Whilst the water level recordings at the Penrice site appeared to be stable there was also a similar
issue with respect to different ratting curves being applied. Again the model results suggested that
the BoM rating was possible more reliable.
2.2 PEST Parameter Calibration
The Gawler River Hydrological Assessment from 2007 undertook calibration of hydrological
parameters for the RRR model at the above mentioned gauge locations. This utilised the modelling
tool referred to as PEST (Parameter Estimation). PEST allows for the automation of modifying
variable parameters, so that a wide range of values can be assessed and results compared with
historical observations to support the model calibration process.
This process was repeated for the 2016 flood event and results for model parameters compared
with the previous modelling results.
A summary of the results for each key site is provided in the following sections.
2.2.1 Mt Mckenzie Mount McKenzie was previously calibrated to six (6) high flow events with peak flows ranging from
9.6 to 33.5 m3/s. In all cases it was deemed that all runoff was derived from RRR model Process 1
and Process 2.
Calibration to the 2016 event however indicated the best fit would be achieved using all three
runoff processes that are incorporated within the RRR model.
A table showing the PEST calibration results for all events and a plot of the fit for the 2016 flood
event is shown below.
The peak flow for the 2016 event was 36.2 m3/s. Mean error was also relatively low for the 2016
event which gave this event a relatively high weighting in the overall calibration process. However,
the inclusion of this event had a relatively low impact overall on the parameter values, except for
the inclusion of process 3 runoff. As a result there would be minimal impact on the design
hydrographs generated for the flood assessment and mapping purposes.
TABLE 1: MOUNT MCKENZIE RRR CALIBRATION RESULTS
Start Date Peak Flow
(m3/s) PL1 IL2 PL2 IL3 PL3 k 1/kp1 1/kp2
1992 Aug 33.7 0.927 17.310 0.493 - - 2.096 4.745 0.509
1992 Oct 24.0 0.878 5.170 0.526 - - 2.722 3.276 0.901
1992 Dec 20.6 0.630 21.608 0.655 - - 1.125 7.161 0.268
2005 Oct 9.5 0.897 5.215 0.718 - - 1.545 1.822 0.928
2005 Nov 26.4 0.898 8.945 0.661 - - 2.098 2.002 0.616
2016 Sept 34.5 0.887 15.570 0.576 49.680 0.884 1.920 2.870 0.710
Weighted Mean
(previous) - 0.880 9.255 0.629 - - 2.012 2.872 0.706
Weighted Mean
(updated) - 0.882 10.653 0.617 49.680 0.884 1.992 2.872 0 0.707

AWE Gawler River Floodplain Management Authority
4 P17069, Gawler River 2016 Flood Review
FIGURE 2-1: 2016 CALIBRATION PLOT AT MOUNT MCKENZIE
2.2.2 Penrice Penrice was previously calibrated to two (2) high flow events with peak flows of 17.3 and 42.7 m
3/s.
In these previous calibration events it was deemed that all runoff was derived from Process 2.
The calibration to the 2016 event indicated the best fit would be achieved using a hydrological
model that incorporated runoff from Process 2 and Process 3. The 2016 event had an observed peak
flow of 138.6 m3/s but a slightly high mean error.
The weighting for the 2016 storm event was significantly higher than for the previous two
calibration events which significantly altered the Process 2 loss parameters and process lag.
A table showing the PEST calibration results for all events and a plot of the fit is shown below. The
changes to the parameters may alter the shape of the design hydrograph at this location but the
peak flows will be similar.
TABLE 2: PENRICE RRR CALIBRATION RESULTS
Start Date Peak Flow
(m3/s) PL1 IL2 PL2 IL3 PL3 k 1/kp1 1/kp2
2003 Aug 17.3 - 21.260 0.556 - - 0.592 - 0.230
2004 Aug 42.7 - 9.970 0.296 - - 1.504 - 0.436
2016 Sept 138.6 - 23.770 0.278 44.740 0 1.163 0.659
Weighted Mean
(previous) - - 15.361 0.420 - - 1.069 - 0.338
Weighted Mean
(updated) - - 20.024 0.341 44.740 0 1.121 - 0.150
0
5
10
15
20
25
30
35
40
0 20 40 60 80 100 120
Flo
w (
m3
/s)
Time (hrs)
Mount McKenzie - 3 Process
Measured
Modelled
Gawler River Floodplain Management Authority AWE
P17069, Gawler River 2016 Flood Review 5
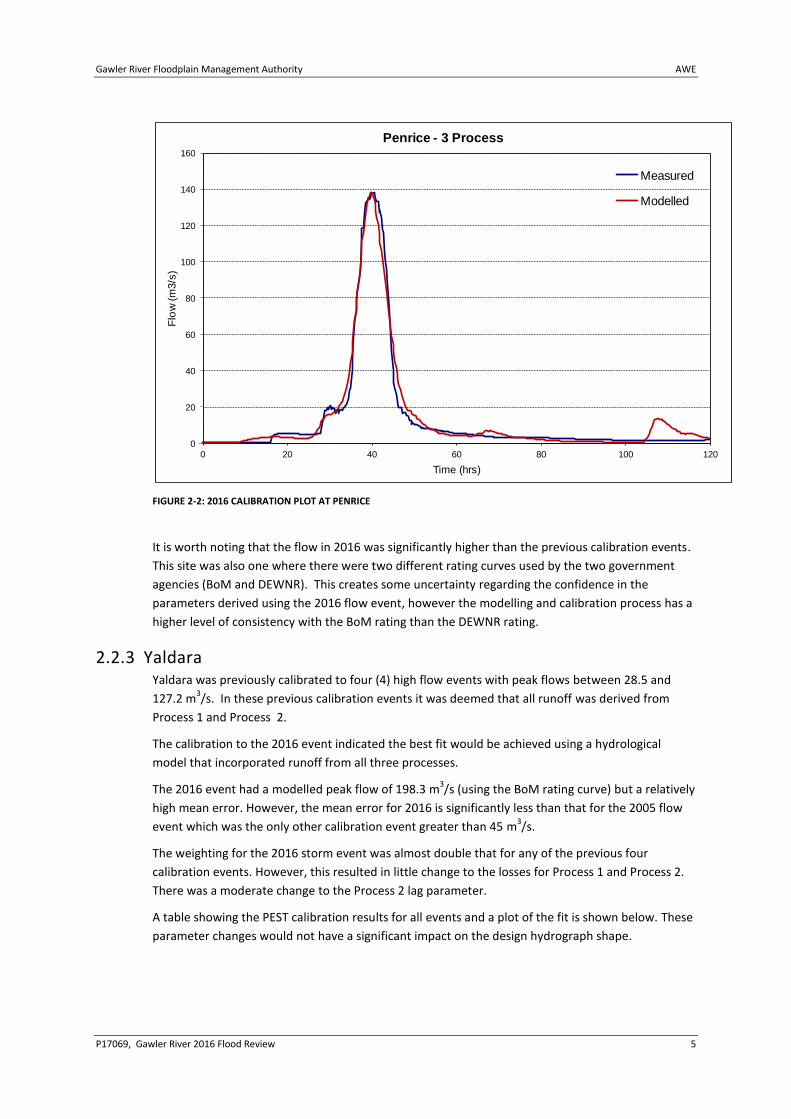
FIGURE 2-2: 2016 CALIBRATION PLOT AT PENRICE
It is worth noting that the flow in 2016 was significantly higher than the previous calibration events.
This site was also one where there were two different rating curves used by the two government
agencies (BoM and DEWNR). This creates some uncertainty regarding the confidence in the
parameters derived using the 2016 flow event, however the modelling and calibration process has a
higher level of consistency with the BoM rating than the DEWNR rating.
2.2.3 Yaldara Yaldara was previously calibrated to four (4) high flow events with peak flows between 28.5 and
127.2 m3/s. In these previous calibration events it was deemed that all runoff was derived from
Process 1 and Process 2.
The calibration to the 2016 event indicated the best fit would be achieved using a hydrological
model that incorporated runoff from all three processes.
The 2016 event had a modelled peak flow of 198.3 m3/s (using the BoM rating curve) but a relatively
high mean error. However, the mean error for 2016 is significantly less than that for the 2005 flow
event which was the only other calibration event greater than 45 m3/s.
The weighting for the 2016 storm event was almost double that for any of the previous four
calibration events. However, this resulted in little change to the losses for Process 1 and Process 2.
There was a moderate change to the Process 2 lag parameter.
A table showing the PEST calibration results for all events and a plot of the fit is shown below. These
parameter changes would not have a significant impact on the design hydrograph shape.
0
20
40
60
80
100
120
140
160
0 20 40 60 80 100 120
Flo
w (m
3/s
)
Time (hrs)
Penrice - 3 Process
Measured
Modelled

AWE Gawler River Floodplain Management Authority
6 P17069, Gawler River 2016 Flood Review
TABLE 3: YALDARA RRR CALIBRATION RESULTS
Start Date Peak Flow
(m3/s) PL1 IL2 PL2 IL3 PL3 k 1/kp1 1/kp2
2003 Aug 29.8 0.796 40.031 0.626 - - 0.969 1.775 0.563
2004 Aug 34.8 - 44.136 0.785 - - 0.921 - 3.290
2005 Oct 28.5 0.994 21.365 0.001 - - 1.763 3.759 2.255
2005 Nov 127.2 0.758 30.583 0.697 - - 1.139 3.923 0.149
2016 Sept 198.3 0.837 31.890 0.493 60.300 0.793 1.382 3.113 0.182
Weighted Mean
(previous) - 0.854 35.023 0.534 - - 1.177 2.988 1.687
Weighted Mean
(updated) - 0.847 33.944 0.520 60.300 0.793 1.248 3.041 1.169
FIGURE 2-3: 2016 CALIBRATION AT YALDARA
As for the Penrice site, the 2016 peak flow was significantly higher than the previous calibration
events and within the range where large discrepancies in the peak flow estimation are noted
between the rating curve from BoM and DEWNR.
This site also had further issues with equipment malfunctioning near the peak of the flood event, as
described earlier. These factors reduce the confidence in the parameters derived using the 2016
flow event.
0
40
80
120
160
200
0 10 20 30 40 50 60 70 80
Flo
w (
m^
3/s
ec
)
Time (hrs)
Yaldara - 3 Process
Measured
Modelled

Gawler River Floodplain Management Authority AWE
P17069, Gawler River 2016 Flood Review 7
2.2.4 South East of Gawler The gauge south east of Gawler was previously calibrated to five (5) high flow events with peak
flows of 26.5 and 132 m3/s. In these previous calibration events it was deemed that all runoff was
derived from Process 1 and Process 2. However, for the 2004 event it was determined that Process
1 accounted for very little runoff and so was ignored. Similarly, Process 2 was considered to account
for very little runoff in the November 2005 event and so was ignored.
Calibration to the 2016 event indicated the best fit would be achieved using a hydrological model
that incorporated runoff from Process 1 and Process 2. (Note the model was previously modified to
incorporate the changes to the South Para Reservoir Spillway).
The 2016 event had a peak flow of 67.3 m3/s with an intermediate mean error. Weighting for the
2016 storm event was in the mid range when compared with the other calibration events.
Consequently, there was little change to the weighted values although there were some moderate
differences in the losses for Process 2.
A table showing the PEST calibration results for all events and a plot of the fit is shown below.
TABLE 4: SOUTH EAST OF GAWLER RRR CALIBRATION RESULTS
Start Date Peak Flow
(m3/s) PL1 IL2 PL2 IL3 PL3 k 1/kp1 1/kp2
1992 Oct 132 0.608 11.478 0.738 - - 2.509 1.840 1.215
1996 Sept 105 0.803 20.810 0.456 - - 1.200 2.583 0.848
2004 Aug 26 0.996 14.827 0.487 - - 1.142 1.415 1.041
2005 Oct 23 0.700 16.750 0.126 - - 4.780 5.865 0.674
2005 Nov 129 0.386 15.006 0.950 1.297 1.748 0.487
2016 Sept 67 0.721 32.7 0.24 - - 1.779 3.848 0.814
Weighted Mean (previous)
0.677 16.887 0.416 - - 2.505 3.329 0.891
Weighted Mean (updated)
0.685 19.821 0.383 - - 2.864 3.421 0.876

AWE Gawler River Floodplain Management Authority
8 P17069, Gawler River 2016 Flood Review
FIGURE 2-4: 2016 CALIBRATION PLOT AT SOUTH EAST GAWLER
0
10
20
30
40
50
60
70
80
90
0 20 40 60 80 100 120 140
Flo
w (
m3
/s)
Time (hrs)
South East Gawler - 2 Process
Measured
Calculated

Gawler River Floodplain Management Authority AWE
P17069, Gawler River 2016 Flood Review 9
3 Flood Frequency Analysis An assessment was made of all new flow data at stations used in the 2007 and 2014 hydrology
reviews to determine if the flood frequency information should be further updated and design flows
amended accordingly.
The key sites there were used for model flood frequency analysis in the previous investigations were
as follows:
North Para - Turretfield
North Para - Yaldara
North Para - Penrice
South Para – South East of Gawler
Gawler River – Gawler Junction
Of these sites both Gawler Junction and Turretfield have been decommissioned and hence no new
data is available to update the flood frequency analysis at these sites. The South East of Gawler site
on the South Para is downstream of the South Para Resevoir. The flood mitigation works on the
reservoir spillway have now been completed and hence there is no longer a homogeneous data set
beyond 2014.
The flood frequency analysis was the updated for the only two remaining sites, Yaldara and Penrice
to determine if a change in design flows was warranted.
3.1 Penrice
The flood frequency analysis for Penrice at the end of the 2014 review included 36 years of flow
record. Three further years have been added to this record. In 2014 and 2015 the peak flows were
generally low and below the threshold where the rating curves provided by DEWNR and BoM begin
to diverge so there is greater confidence in these years data.
The peak for the flood event in 2016 varies significantly depending on whether the BoM or DEWNR
rating curve is accepted as correct. It has been assumed that the BoM estimate of 139 m3/s is
correct for the purposes of the flood frequency analysis. This is the second highest flow in the
annual flow series.
GEV probability plot (see Figure 3-1) results were compared with the flood frequency analysis
outcomes from 2014 and results from the 2007 hydrology review. The hydrology review in 2014
resulted in a small reduction in the design flow rates. This current review has resulted in the peak
flow rates shifting back towards the original design flow rates from the 2007 review for the lower
frequency flow events and a small reduction for the higher frequency events.
Overall, the inclusion of the additional three years of data, which includes the high flow event of
2016, resulted in only very minor variations to the design flow rates.

AWE Gawler River Floodplain Management Authority
10 P17069, Gawler River 2016 Flood Review
TABLE 5: NORTH PARA AT PENRICE ANNUAL MAXIMUM FLOWS
Year Annual Maximum Flow
(m3/sec)
Year Annual Maximum Flow
(m3/sec)
1978 27.7 1998 0.65
1979 49.5 1999 0.31
1980 14.3 2000 13.7
1981 25.9 2001 10.1
1982 0.16 2002 0.07
1983 211.9 2003 17.3
1984 33.4 2004 42.7
1985 5.54 2005 71.7
1986 11.0 2006 0.1
1987 21.7 2007 0.3
1988 21.9 2008 0.1
1989 10.2 2009 7.9
1990 17.0 2010 27.3
1991 21.6 2011 3.3
1992 67.4 2012 3.3
1993 0.40 2013 8.2
1994 0.14 2014 12.4
1995 8.36 2015 0.1
1996 32.9 2016 138 (BoM)
1997 1.49
FIGURE 3-1: PENRICE GEV PROBABILITY PLOT

Gawler River Floodplain Management Authority AWE
P17069, Gawler River 2016 Flood Review 11
TABLE 6: PENRICE GEV FLOOD FREQUENCY FLOWS
ARI
1968 – 2005 Predicted
Flow (m
3/sec)
5% Confidence
Limit (m
3/sec)
95% Confidence
Limit (m
3/sec)
1968 – 2016 Predicted
Flow (m
3/sec)
5% Confidence
Limit (m
3/sec)
95% Confidence
Limit (m
3/sec)
10 54.9 40.3 73.6 50.5 37.9 66.6
20 74.5 55.8 98.1 70.4 53.7 91.6
50 104 78.1 137 102 77.1 134
100 129 96 175 130 96.4 180
If the rating curve from DEWNR was applied to this event and the resultant peak flow of 111 m3/s.
Adopting this peak flow rate for 2016 would slightly impact on the flood frequency analysis. The 1 in
100 year ARI would reduce from 130 m3/s to 127 m
3/s. This would bring the design flow rate back to
within 2% of the predicted 1 in 100 year ARI flow rate from the 2007 hydrological review. There was
a slight reduction to the predicted flows for the ARI events but these changes were also very minor.
3.2 Yaldara
The flood frequency analysis for Yaldara at the end of the 2014 review included 77 years of flow
record and the estimated peak flow for 1889. Three further years have been added to this record. In
2014 and 2015 the peak flows were generally low and below the threshold where the rating curves
provided by DEWNR and BoM begin to diverge so there is greater confidence in these years data.
The peak for the flood event in 2016 varies significantly depending on whether the BoM or DEWNR
rating curve is accepted as correct. It has been assumed that the BoM estimate of 200 m3/s is
correct for the purposes of the flood frequency analysis. This is the third highest flow in the annual
flow series.
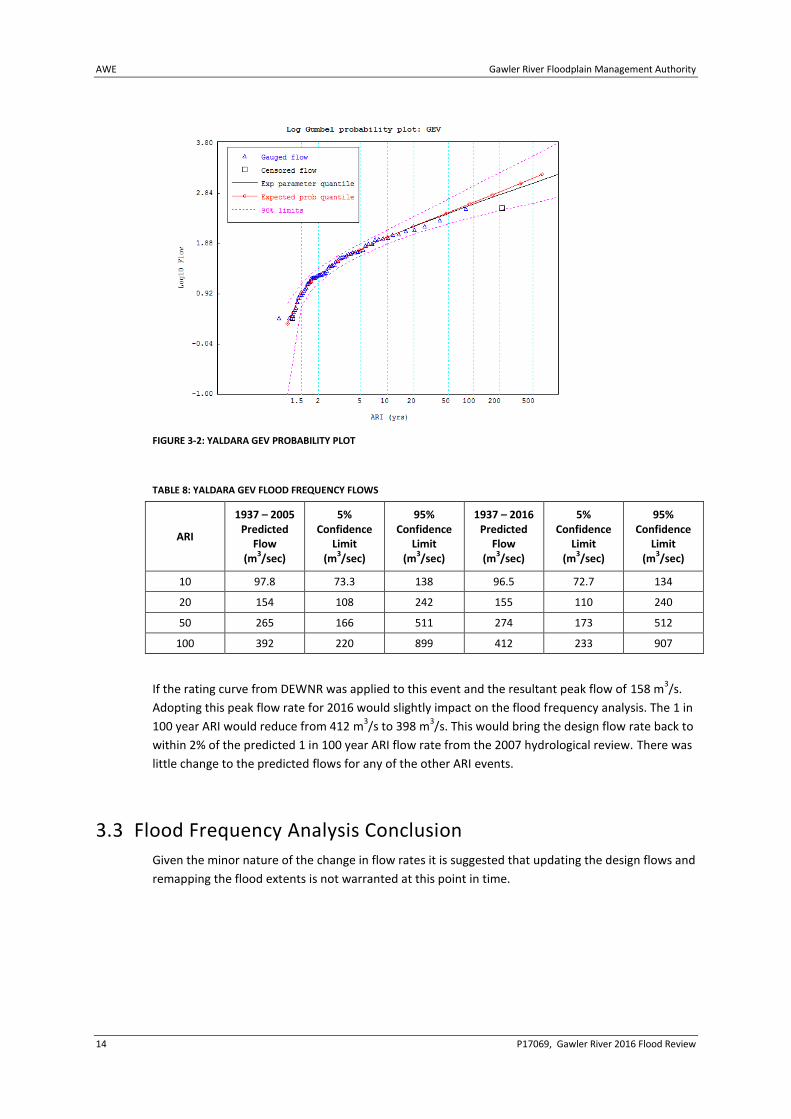
TABLE 7: NORTH PARA AT YALDARA PEAK ANNUAL FLOWS
Year Date (where available) Maximum Annual Flow
(LDC,1991) m3/s
Maximum Annual Flow (DWLBC) m
3/s
1889 17 April 345 -
1937 2 September 66.5 -
1938 28 August 8.5 -
1939 30 August 22.1 -
1940 14 July 0.28 -
1941 10 September 7.9 -
1942 1 September 17.0 -
1943 9 August 7.6 -
1944 0.28 -
1945 0.85 -
1946 5.7 -
1947 16 July 18.1 14.1
1948 12.7 -
AWE Gawler River Floodplain Management Authority
12 P17069, Gawler River 2016 Flood Review
Year Date (where available) Maximum Annual Flow
(LDC,1991) m3/s
Maximum Annual Flow (DWLBC) m
3/s
1949 2.8 -
1950 1.1 -
1951 110 -
1952 94.5 -
1953 15 August 38.2 -
1954 0.57 -
1955 18 June 90.6 -
1956 5 July 43.6 40.9?
1957 21 July 4.0 3.8
1958 11 September 53.2 20.0?
1959 31 March 0.28 0.23
1960 13 May 49.3 48.2
1961 1 September 9.11 8.97
1962 1 August 9.91 11.0
1963 7 July 87.8 47.9?
1964 12 October 40.2 29.9?
1965 22 August 4 3.72
1966 22 September 40 15.5?
1967 13 August 1 0.08?
1968 4 June 34 27.4
1969 22 July 16 16.0
1970 26 August 51 51.3
1971 31 July 72 72.0
1972 11 August 11 10.9
1973 27 August 40 39.8
1974 4 October 126 126
1975 25 October 47 46.5
1976 7 October 1 0.96
1977 3 August 1 1.14
1978 22 September 50 50.1
1979 12 October 90 89.5
1980 2 July 26 25.8
1981 25 June 56 56.2
1982 28 April - 0.44
1983 3 March 331 331
1984 25 August 45 47.1
1985 23 August 15 16.3
1986 3 August 17 19.0
1987 24 June 30 27.9
1988 6 June 18 33.4

Gawler River Floodplain Management Authority AWE
P17069, Gawler River 2016 Flood Review 13
Year Date (where available) Maximum Annual Flow
(LDC,1991) m3/s
Maximum Annual Flow (DWLBC) m
3/s
1989 8 August 13 13.6
1990 19.8
1991 28.8
1992 155
1993 2.77
1994 0.57
1995 20.3
1996 71.8
1997 6.88
1998 3.14
1999 4.36
2000 16.3
2001 18.9
2002 1.40
2003 29.8
2004 34.8
2005 131.8
2006 1.6
2007 1.7
2008 1.8
2009 13
2010 107
2011 17.9
2012 2.8
2013 15.9
2014 19.7
2015 1.0
2016 200 (BoM)
GEV probability plot (see Figure 2-3) results were compared with the flood frequency analysis
outcomes from 2014 and results from the 2007 hydrology review. The hydrology review in 2014
resulted in a small reduction in the design flow rates for the more frequent flood events but an
increase for the lower frequency events (see Table 8). This current review has resulted in the peak
flow rates shifting back towards the original design flow rates from the 2007 review.
Overall, the inclusion of the additional three years of data, which includes the high flow event of
2016, resulted in only minor variations to the design flow rates.
AWE Gawler River Floodplain Management Authority
14 P17069, Gawler River 2016 Flood Review
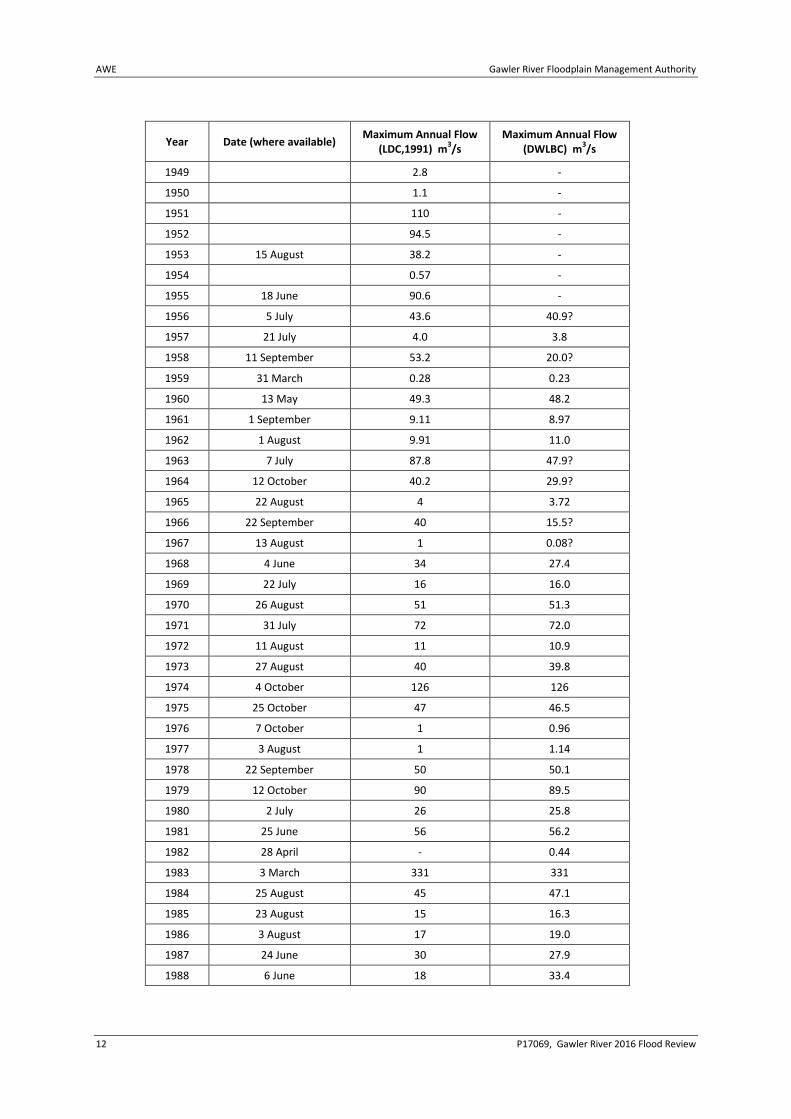
FIGURE 3-2: YALDARA GEV PROBABILITY PLOT
TABLE 8: YALDARA GEV FLOOD FREQUENCY FLOWS
ARI
1937 – 2005 Predicted
Flow (m
3/sec)
5% Confidence
Limit (m
3/sec)
95% Confidence
Limit (m
3/sec)
1937 – 2016 Predicted
Flow (m
3/sec)
5% Confidence
Limit (m
3/sec)
95% Confidence
Limit (m
3/sec)
10 97.8 73.3 138 96.5 72.7 134
20 154 108 242 155 110 240
50 265 166 511 274 173 512
100 392 220 899 412 233 907
If the rating curve from DEWNR was applied to this event and the resultant peak flow of 158 m3/s.
Adopting this peak flow rate for 2016 would slightly impact on the flood frequency analysis. The 1 in
100 year ARI would reduce from 412 m3/s to 398 m
3/s. This would bring the design flow rate back to
within 2% of the predicted 1 in 100 year ARI flow rate from the 2007 hydrological review. There was
little change to the predicted flows for any of the other ARI events.
3.3 Flood Frequency Analysis Conclusion
Given the minor nature of the change in flow rates it is suggested that updating the design flows and
remapping the flood extents is not warranted at this point in time.

Gawler River Floodplain Management Authority AWE
P17069, Gawler River 2016 Flood Review 15
4 Rating Review
4.1 Introduction
A review of stage-discharge curves, or ‘rating curves’, was carried out for a number gauging stations
in the Gawler River catchment. The review was performed to provide comment on, or suggest
improvements to, the existing mathematical relationships linking a water depth at the gauging
station or spillway to the estimated flow rate.
A number of gauging stations were selected for review. The rating curves from these stations were
compared with water level height versus modelled flows for flood events at the station location.
4.2 Gauging Sites Under Review
Table 9 lists the gauging sites selected for review, along with providing relevant information for each
site such as a brief description of the site, catchment area, and maximum recorded flow and
maximum rated flow. All sites have maximum recorded flows 41% or less than the maximum
estimated by the rating curves provided. This indicates that the higher flows, which are most
relevant to the flood forecasting, are well beyond the flow range where there have been field
verification of the rating curve. Hence, there is only high confidence in the peak flow recordings for
smaller flood event at most locations. At most sites there the flow estimates are made from
extrapolated relationships that may have relatively low levels of confidence associated with them.
TABLE 9: GAWLER RIVER GAUGING SITES SELECTED FOR REVIEW
Gauging site name Site number Description Catchment Area (km
2)
Maximum Stream Gauging (m
3/s)
Maximum Estimated Flow (m
3/s)
Ratio Measured/ Estimated (%)
North Para River at Yaldara
A5050502 Sharp crested stepped weir
375.9 53 331 16
North Para River upstream Tanunda Creek Junction
A5050536 Low profile concrete V-notch weir
254.4 5.9 50 12
Duck Ponds Creek upstream Pipeline
A5050543 Low profile flat 'V' weir
- 2 67.5 3
Tanunda Creek at Bethany
A5050535 Concrete low profile V crump weir
21.2 5.5 20 27
South Para SE of Gawler Station
AW505503 Full width sharp crested 'V' weir
324.1 104.6 255 41
South Para River at South Para Reservoir
A5050516 Spillway 227 - - -
North Para River at Penrice
A5050517 Triangular 'V' Weir
117.3 7.9 217 27
North Para River at Mount McKenzie
A5050533 Concrete crump weir in natural rock bar
44.4 12.4 44.8 28

AWE Gawler River Floodplain Management Authority
16 P17069, Gawler River 2016 Flood Review
Further details for each of the sites can be found at the WaterConnect Surface Water Data website
https://www.waterconnect.sa.gov.au/Systems/SWD/Pages/Default.aspx.
It is noted that the rating curves shown in Appendix A are those provided by DEWNR. As discussed
earlier in this report, there have been some discrepancies identified between the rating curves
supplied by DEWNR and BOM for at least the Yaldara and Penrice sites. Further consideration needs
to be given to selecting the final agreed rating curve for each site where discrepancies exist.
4.3 Modelling Approach
The review was carried out by inspecting plots of the rating curve and the gauged water level versus
modelled flows for each site, using the technique described by Wright and Malone (2008).
The hydrology review completed in 2007, established the set of XP-RAFTS models for the Gawler
River and its catchments that make up the RRR model for the catchment. These models were
further refined in 2014 (AWE, 2014).
This current review used the 2014 model layout and parameters as a starting point, and that model
was then further updated to incorporate the weighted mean calibrated values as outlined earlier in
this report. Hydrographs at the points of interest for the rating review were extracted from the
calibration events.
The XP-RAFTS models were calibrated using PEST to optimize the estimates of the initial loss,
proportional loss, and base flow parameters to the observed hydrographs for the flood events in
Table 10.
TABLE 10: CALIBRATION EVENTS FOR RATING REVIEW
Start date/time Duration (mins)
Stations
29/08/1992 04:00 2880 Mt McKenzie,
07/10/1992 20:00 6000 Mt McKenzie, South Para, Turretfield
17/12/1992 05:00 2880 Mt McKenzie
28/09/1996 09:00 7500 South Para, Turretfield
21/08/2003 00:00 7500 Penrice, Turretfield
02/08/2004 00:00 9000 Penrice, Yaldara, South Para
23/10/2005 07:00 7500 Mt McKenzie, Penrice, Yaldara, South Para SE of Gawler, Turretfield
07/11/2005 00:00 6000 Mt McKenzie, Penrice, Yaldara, South Para SE of Gawler, Turretfield
28/09/2016 09:00 7500 Mt McKenzie, Penrice, South Para SE of Gawler
Note: Turretfield station used in these calibrations no longer exists.
The recorded water levels for flood events for each site were plotted against the modelled flow
following the example in Figure 4-1 , from Wright and Malone (2008). The site rating curve to be
reviewed was added to each plot.

Gawler River Floodplain Management Authority AWE
P17069, Gawler River 2016 Flood Review 17
Each site rating curve and hysteresis curves plot was analysed by visual inspection in consultation
with Mr Chris Wright (formerly at Bureau of Meteorology) who developed the rating review
technique and is experienced with gauging stations within the Gawler River catchment.
FIGURE 4-1: ESTIMATING RATINGS (WRIGHT AND MALONE, 2008)
4.4 Results and Discussion
Site photos and plots of existing rating curves and hysteresis curves for available flood events are
shown in Appendix A. The rising limb of peak flood events is plotted.
The rating curve is less likely to overestimate flow rates for the rising limb of a flood. This is because
tailwater effects are less likely influence the rising limb (for at least a portion of the event) and
influence the water height at a site as water levels rise.
At lower flow rates, there was a higher degree of variability in water level height versus modelled
flow. This is expected for the stations located within natural channel reaches, that can be blocked by
debris that alters the water height for a given flow rate running past the station. The model
calibration is also biased towards peak flood flow estimates for flood forecasting purposes, and the
accuracy of low flow estimation is less reliable but also less critical.
At higher flow rates, there appears to be a reasonable match of the peak flow rate from the model
to the rating curve for the majority of the flood modelling events for the majority of sites.
The results were less favourable for the rating curve for the North Para River upstream Tanunda
Creek Junction (A5050536). It is suggested that this rating curve be refined because the existing
rating curve appears to over-estimate peak flows.
The analysis was further complicated by the Penrice and Yaldara sites having two rating curves, with
the rating curve used by the BoM being significantly different in the high flow range at both sites.
Most flow events lay within the zone where the rating curves used by BoM and DEWNR are the
same, and the existing rating curves in that range appear to be reasonable. The RRR modelling
results suggest that of the two rating curves the BoM rating curve is superior at the high flow range.

AWE Gawler River Floodplain Management Authority
18 P17069, Gawler River 2016 Flood Review
TABLE 11: RECOMMENDATIONS FROM RATING CURVE REVIEW
Gauging site name Site Basis to change curve?
Comments
North Para River at Yaldara A5050502 Y Resolve differences between DEWNR and BoM rating curves.
North Para River upstream Tanunda Creek Junction
A5050536 Y Imprecise higher flows due to extrapolation from rating curve derived within weir height
Duck Ponds Creek upstream Pipeline
A5050543 N Ignore October 2005 event curve
Tanunda Creek at Bethany A5050535 N Likely blockage in November 2005 event
South Para SE of Gawler Station A5050503 N Likely blockage in November 2005 event
South Para River at South Para Dam
A5050516 N
North Para River at Penrice A5050517 Y Resolve differences between DEWNR and BoM rating curves.
North Para River at Mount McKenzie
A5050533 N

Gawler River Floodplain Management Authority AWE
P17069, Gawler River 2016 Flood Review 19
5 Summary and Recommendations The 2016 flood event was a relatively large flow when comparing with the annual flow series at a
number of key gauging locations through the catchments. This was particularly true along the North
Para where the 2016 peak flow was the second and third highest flows recorded at Penrice and
Yaldara respectively.
When reviewing the gauging data to be used for the model calibration it was identified that for
higher flows the rating curves provided by DEWNR and BoM yielded significantly different peak flow
rates. Back calculation from the inflow hydrograph to Turretfield indicated that the BoM rating
curve was more likely to generate a more accurate hydrograph at Yaldara in the higher flow range.
The hydrographs derived from the BoM rating curves were then adopted through the flood
frequency analysis and parameter calibration phase. However, it is considered that further review
should be undertaken to establish how these difference have been derived and which rating curve
should be considered the most accurate for each gauging location.
Calibration of the hydrological model parameters to the 2016 flow event was considered necessary
given the high relative high flow rate which would result in a high weighting provided the mean
errors were not large. For Mount McKenzie, Penrice and Yaldara the PEST calibration indicated the
best fit would be achieved with three processes contribution to runoff. This was different to the
calibration runs for previous high flow events. However, this was also the highest flow event to be
calibrated which may explain why the surface flow runoff component was identified in this event
but not previously.
Flood frequency analysis was completed for Penrice and Yaldara. These are the only two gauging
locations utilised in the Gawler River hydrology design flood modelling that have not been impacted
by recent flood mitigation works at Turretfield or at South Para Reservoir. Peak flow values from the
BoM derived rating curve were adopted which led to subtle increases in the predicted 1 in 100 year
ARI flow rate. A sensitivity analysis was completed with the lower values derived from the DEWNR
rating curves which lowered the predicted flow rates. These changes were relatively small and
resulted in peak flow rates within 2% of the flood frequency analysis documented in the 2007
Gawler River hydrology report.
A review of rating curves was carried out for a number gauging stations in the Gawler River
catchment. The rating curves from the selected stations were compared with water level height
versus modelled flows for flood events at the station location. Several flow events were plotted for
each station and compared with the rating curve.
For all stations, except for Upstream of Tanunda Creek on North Para, the outcomes of the rating
review did not support modification to the existing rating curves. At the gauge Upstream of Tanunda
Creek the rating curve appears to be based on an extrapolation from the rating derived within the
weir height range. Above this weir height a small increase in flood height equates to a significant
increase in flow.

AWE Gawler River Floodplain Management Authority
20 P17069, Gawler River 2016 Flood Review
6 References Australian Water Environments, 2014. “A Findings Report for the Gawler River Flood Mitigation
Scheme - Hydrology Report”, September 2014. Prepared for the Gawler River Floodplain
Management Authority.
Australian Water Environments, 2016. “Gawler River 2016 Flood Review – Project Report”,
September 2017. Prepared for the Gawler River Floodplain Management Authority.
Department for Transport, Energy & Infrastructure, 2007 “Hydrological Study of the Gawler River
Catchment”, March 2007
KEMP, D.J “The Development of a Rainfall-Runoff-Routing (RRR) Model” PhD Thesis, University of
Adelaide, August 2002.
Wright and Malone (2008). “Hydrological Techniques for Checking River Flow Ratings”. Water
Down Under Adelaide 2008 Conference Papers. pages 272-282. ISBN 0-858-25735-1.
Gawler River Floodplain Management Authority AWE
P17069, Gawler River 2016 Flood Review 21

AWE Gawler River Floodplain Management Authority
22 P17069, Gawler River 2016 Flood Review

Appendix A : Rating Curve Assessment

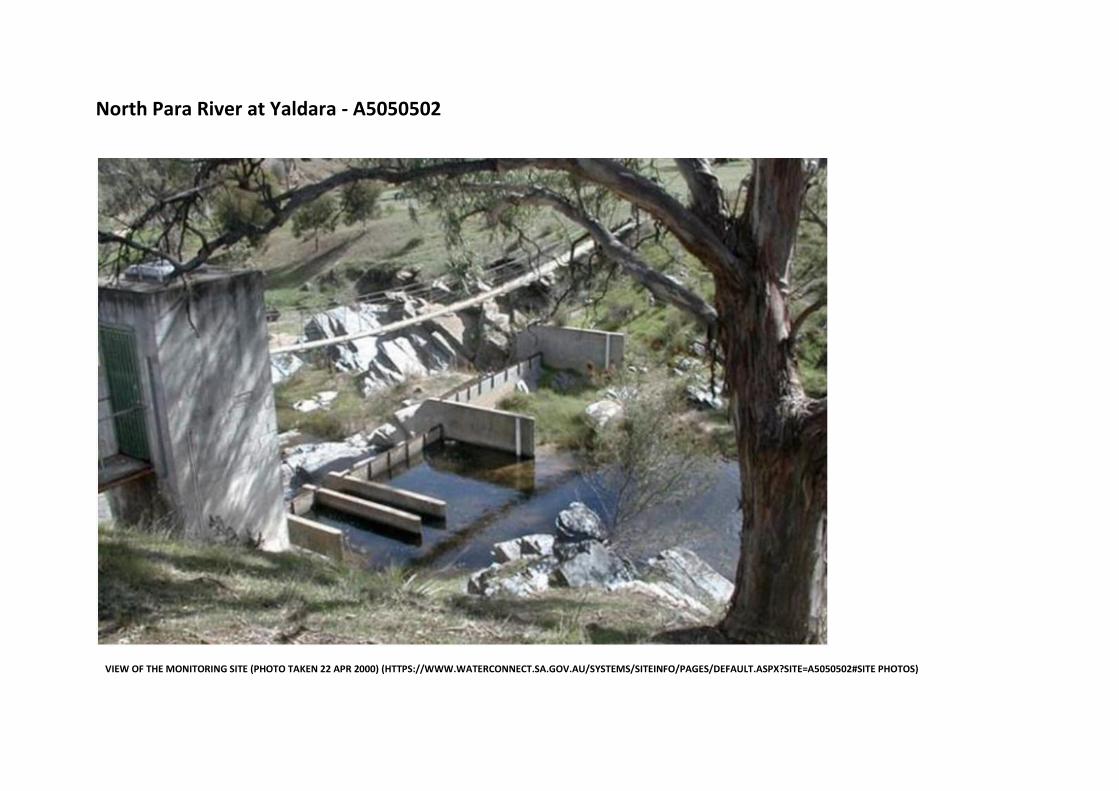
North Para River at Yaldara - A5050502
VIEW OF THE MONITORING SITE (PHOTO TAKEN 22 APR 2000) (HTTPS://WWW.WATERCONNECT.SA.GOV.AU/SYSTEMS/SITEINFO/PAGES/DEFAULT.ASPX?SITE=A5050502#SITE PHOTOS)

NORTH PARA RIVER AT YALDARA - SHARP CRESTED STEPPED WEIR
-0.5
0.0
0.5
1.0
1.5
2.0
2.5
3.0
3.5
4.0
0 20 40 60 80 100 120 140
Re
cord
ed
He
igh
t (m
)
Modelled Flow (m3/s)
North Para River at Yaldara - A5050502
August 2004 August 2004 - Rising October 2005 October 2005 - Rising November 2005 Novermber 2005 - Rising

North Para River upstream Tanunda Creek Junction - A5050536
VIEW UPSTREAM FROM THE SITE (HTTPS://WWW.WATERCONNECT.SA.GOV.AU/SYSTEMS/SITEINFO/PAGES/DEFAULT.ASPX?SITE=A5050536#SITE PHOTOS)

NORTH PARA RIVER UPSTREAM TANUNDA CREEK JUNCTION - LOW PROFILE CONCRETE V-NOTCH WEIR
0
1
2
3
4
5
6
0 10 20 30 40 50 60
Re
cord
ed
He
igh
t (m
)
Modelled Flow (m3/s)
North Para River upstream Tanunda Creek Junction - A5050536
August 2004 August 2004 - Rising Rating Curve

Duck Ponds Creek upstream Pipeline - A5050543
VIEW OF THE MONITORING SITE (PHOTO TAKEN 28 OCT 2009) (HTTPS://WWW.WATERCONNECT.SA.GOV.AU/SYSTEMS/SITEINFO/PAGES/DEFAULT.ASPX?SITE=A5050543#SITE PHOTOS)

DUCK PONDS CREEK UPSTREAM PIPELINE - LOW PROFILE FLAT 'V' WEIR
1.0
1.1
1.2
1.3
1.4
1.5
1.6
1.7
1.8
1.9
2.0
0 2 4 6 8 10
Re
cord
ed
He
igh
t (m
)
Modelled Flow (m3/s)
Duck Ponds Creek upstream Pipeline - A5050543
August 2004
August 2004 - Rising
October 2005
October 2005 - Rising
November 2005
November 2005 - Rising
Rating Curve (0-2.0m only)

Tanunda Creek at Bethany - A5050535
VIEW OF THE MONITORING SITE (PHOTO TAKEN 6 APR 2000) (HTTPS://WWW.WATERCONNECT.SA.GOV.AU/SYSTEMS/SITEINFO/PAGES/DEFAULT.ASPX?SITE=A5050535#SITE PHOTOS)

TANUNDA CREEK AT BETHANY - CONCRETE LOW PROFILE V CRUMP WEIR
1
1.2
1.4
1.6
1.8
2
2.2
0 5 10 15 20
Re
cord
ed
He
igh
t (m
)
Modelled Flow (m3/s)
Tanunda Creek at Bethany - A5050535
August 2004 August 2004 - Rising November 2005 November 2005 - Rising Rating Curve

South Para SE of Gawler Station - AW5050503
SITE CONTROL MECHANISM (PHOTO TAKEN 13 NOV 2008) (HTTPS://WWW.WATERCONNECT.SA.GOV.AU/SYSTEMS/SITEINFO/PAGES/DEFAULT.ASPX?SITE=A5050503#SITE PHOTOS)

SOUTH PARA SE OF GAWLER STATION - FULL WIDTH SHARP CRESTED 'V' WEIR
1
1.5
2
2.5
3
3.5
4
4.5
5
0 50 100 150 200 250
Re
cord
ed
He
igh
t (m
)
Modelled Flow (m3/s)
South Para SE of Gawler Station - AW5050503
October 2005 October 2005 - Rising November 2005 November 2005 - Rising September 2016 September 2016 - rising Rating Curve

South Para River at South Para Dam - A5050516
VIEW DOWNSTREAM FROM THE SITE (HTTPS://WWW.WATERCONNECT.SA.GOV.AU/SYSTEMS/SITEINFO/PAGES/DEFAULT.ASPX?SITE=A5050516#SITE PHOTOS)

SOUTH PARA RIVER AT SOUTH PARA DAM - SPILLWAY
28.9
29
29.1
29.2
29.3
29.4
29.5
29.6
29.7
29.8
29.9
0 50 100 150 200 250
Re
cord
ed
He
igh
t (m
)
Modelled Flow (m3/s)
South Para River at South Para Dam - A5050516
September 1996 September 1996 - Rising October 1992 October 1992 - Rising November 2005 November 2005 - Rising

North Para River at Penrice - A5050517
VIEW OF THE MONITORING SITE (PHOTO TAKEN 4 APR 2011) (HTTPS://WWW.WATERCONNECT.SA.GOV.AU/SYSTEMS/SITEINFO/PAGES/DEFAULT.ASPX?SITE=A5050517#SITE PHOTOS)

NORTH PARA RIVER AT PENRICE - TRIANGULAR 'V' WEIR
0
0.5
1
1.5
2
2.5
3
3.5
4
4.5
5
0 50 100 150 200
Re
cord
ed
He
igh
t (f
rom
flo
w)
(m)
Modelled flow (m3/s)
North Para River at Penrice - A5050517
Penrice Aug 2004 Penrice Aug 2004 - Rising Penrice Aug 2003 Penrice Aug 2003 - Rising September 2016 September 2016 - rising Rating Curve (0-5.0m only)
1
1.2
1.4
1.6
1.8
2
2.2
2.4
0 5 10 15 20 25

North Para River at Mount McKenzie - A5050533
VIEW OF THE MONITORING SITE (PHOTO TAKEN 22 OCT 2009) (HTTPS://WWW.WATERCONNECT.SA.GOV.AU/SYSTEMS/SITEINFO/PAGES/DEFAULT.ASPX?SITE=A5050533#SITE PHOTOS)

North Para River at Mount McKenzie - Concrete crump weir in natural rock bar
0.0
0.5
1.0
1.5
2.0
2.5
3.0
3.5
0 10 20 30 40 50
Re
cord
ed
He
igh
t (f
rom
flo
w)
(m)
Modelled Flow (m3/s)
North Para River at Mount McKenzie - A5050533
Rating Curve August 1992 August 1992 - Rising October 1992 October 1992 - Rising December 1992 December 1992 - Rising October 2005 October 2005 - Rising September 2016 September 2016 - Rising