Embed Size (px)
Citation preview
The Gavialis--Tomistoma debate: the contribution of skull ontogenetic
allometry and growth trajectories to the study of crocodylian
relationships
Paolo Piras,a,b,� Paolo Colangelo,c Dean C. Adams,d Angela Buscalioni,e Jorge Cubo,f
Tassos Kotsakis,a,b Carlo Meloro,g and Pasquale Raiah,b
aDipartimento di Scienze Geologiche, Universita Roma Tre, Largo San Leonardo Murialdo, 1, 00146 Roma, ItalybCenter for Evolutionary Ecology, Largo San Leonardo Murialdo, 1, 00146 Roma, ItalycDipartimento di Biologia e Biotecnologie ‘‘Charles Darwin,’’ Universita di Roma ‘‘La Sapienza’’, via Borelli 50, 00161 Roma,
ItalydDepartment of Ecology, Evolution, and Organismal Biology, Iowa State University, Ames, IA 50011, USAeUnidad de Paleontologıa, Departamento de Biologıa, Facultad de Ciencias, Universidad Autonoma de Madrid, 28049 Madrid,
SpainfUniversite Pierre et Marie Curie-Paris 6, UMR CNRS 7193-iSTeP, Equipe Biomineralisations, 4 Pl Jussieu, BC 19, Paris
75005, FrancegHull York Medical School, The University of Hull, Cottingham Road, Hull HU6 7RX, UKhDipartimento di Scienze della Terra, Universita‘ degli Studi Federico II, L.go San Marcellino 10, 80138 Napoli, Italy�Author for correspondence (email: [email protected])
SUMMARY The phylogenetic placement of Tomistoma andGavialis crocodiles depends largely upon whether molecular ormorphological data are utilized. Molecular analyses considerthem as sister taxa, whereas morphological/paleontologicalanalyses set Gavialis apart from Tomistoma and othercrocodylian species. Here skull allometric trajectories ofTomistoma and Gavialis were contrasted with those of twolongirostral crocodylian taxa, Crocodylus acutus and Mecistopscataphractus, to examine similarities in growth trajectories inlight of this phylogenetic controversy. Entire skull shape and itstwo main modules, rostrum and postrostrum, were analyzedseparately. We tested differences for both multivariate anglesbetween trajectories and for shape differences at early and late
stages of development. Based on a multivariate regression ofshape data and size, Tomistoma seems to possess a peculiarrate of growth in comparison to the remaining taxa. However, itsmorphology at both juvenile and adult sizes is always closer tothose of Brevirostres crocodylians, for the entire head shape,as well as the shape of the postrostrum and rostrum. Bycontrast, the allometric trajectory of Gavialis always begins andends in a unique region of the multidimensional morphospace.These findings concur with a morphological hypothesis thatplaces Gavialis separate from Brevirostres, and Tomistomacloser to other crocodylids, and provides an additional, andindependent, data set to inform on this ongoing phylogeneticdiscussion.
INTRODUCTION
The phylogenetic relationships between the true-gharial (Ga-
vialis gangeticus) and the false-gharial (Tomistoma schlegelii)
continue to be discussed because the outcomes of molecular
and morphological analyses are so contradictory. Specifically,
analyses of various and distinct molecular data sets support a
close evolutionary relationship between these two genera, with
an Eocene or mid-Miocene divergence (Fig. 1A). Thus, from a
molecular perspective, Gavialis and Tomistoma are each oth-
ers’ closest living relatives. By contrast, morphological data
support the placement of Gavialis basal to Crocodylia, im-
plying that Gavials and Tomistoma are morphologically sim-
ilar longirostrine forms, that have evolved this morphology
multiple times, and stratigraphic data imply that this split
occurred by the Late Cretaceous (Fig. 1B). Both views are well
supported by multiple recent studies (Brochu and Densmore
2001; Brochu 2003; Gatesy et al. 2003; Harshman et al. 2003;
Janke et al. 2006; Xue-Feng et al. 2006; McAliley et al. 2006,
among others), and because resolution across data types has
not yet been found, the Gavialis/Tomistoma debate represents
a classic phylogenetic conflict in the literature (Brochu 2003).
Typically, explanations for the discrepancy between these
phylogenetic hypotheses are grounded on the nature of the
phylogenetic methods applied and their potential limitations
(i.e., rooting problems, long-branch attraction due to taxon-
EVOLUTION & DEVELOPMENT 12:6, 568 –579 (2010)
DOI: 10.1111/j.1525-142X.2010.00442.x
& 2010 Wiley Periodicals, Inc.568

sampling, different phylogenetic histories between genes and
species), as well as morphological or physiological conver-
gence. For example, previous authors have investigated the
differential contribution of phylogeny and functional perfor-
mance on the biomechanical properties of rostrum in extant
Crocodylia (Piras et al. 2009), and on the differences in rostral
architecture in extant and extinct Crocodylomorpha (Busbey,
1995). However, a detailed study focusing on the ontogenetic
development of the morphological differences between Ga-
vialis and Tomistoma has not been performed. Here we an-
alyzed and compared ontogenetic trajectories of several
species in order to bring new evidence to the Tomistoma–
Gavialis phylogeny debate. Studies of ontogenetic variation
quantify aspects of morphogenetic change during growth. In
interspecific comparisons, early ontogenetic stages may or
may be not closer to each other than adult stages (Zelditch
et al. 2004). For example, if shapes become more and more
similar during growth, then morphological resemblance of
adult forms may be the outcome of evolutionary convergence
or parallelism. In such cases, phylogenetic reconstructions
based on adult morphology alone may not accurately esti-
mate evolutionary history, because it does not include the
allometric processes responsible of the final product of onto-
genesis, that is adult phenotypes, without taking into account
common factors in development between species. Conversely,
increasingly divergent ontogenies may indicate that the adult
forms appear very different in spite of small phylogenetic
distance as an outcome of morphological adaptation.
We used an ontogenetic approach to determine whether
Gavialis and Tomistoma displayed convergent growth patterns
(ontogenetic convergence: sensu Adams and Nistri 2010). We
explored the pattern of shape variation along the ontogeny of
both Tomistoma and Gavialis, as well as two other species of
Crocodylia (Crocodylus acutus and Mecistops cataphractus).
The latter two species are of interest because they possess a
long snout (i.e., longirostral), and our samples cover nearly all
posthatching ontogenetic stages; allowing a rigorous assess-
ment of the ontogenetic development of this trait. Of the
species we examined, only Gavialis ‘‘gharial’’ is a strictly pi-
scivorous species, while the other three species can consume
prey that are relatively larger than fishes, despite their longi-
rostral condition. The rationale for usingM. cataphractus and
C. acutus is both their phylogenetic placement, and the fact
that they represent morphological extremes. Specifically, M.
cataphractus displays the least derived morphology of species
of Crocodylinae, and C. acutus is one of the most longirostral
species within Crocodylus.
We used landmark-based Geometric Morphometrics (GM)
to analyze phenotypic differences and ontogenetic trajectories
covering all the long-snouted genera of crocodylians. First, we
analyzed the complete skull geometry found from all land-
marks, to investigate general patterns on skull ontogeny. Sec-
ond, we partitioned the landmark data set was into two units
(the rostrum and the postrostrum), which were analyzed sep-
arately.Using these threedata setswe testedanumberof specific
biological hypotheseswith respect to size and shape variation in
these species. First, we tested the hypothesis that different spe-
cies possess similar allometry by analyzing differences in multi-
variate slopes. Second we determined whether the ontogenetic
trajectories for species are parallel, convergent, or divergent in
Fig. 1. Competing hypotheses aboutphylogenetic relationships for Gavialisand Tomistoma. (A) Molecular topology;dashed line indicates the oldest split pro-posed by a molecular study (Janke et al.2006); (B) morphological/paleontologicaltopology. From Brochu (2003), redrawn.
Gavialis and Tomistoma skull ontogeny 569Piras et al.
the multidimensional morphogenetic space. If Tomistoma was
phylogenetically related to Crocodylidae, we predicted that
there would be strong similarities between its ontogenetic
growth pattern and those of other members of that clade.
MATERIAL AND METHODS
GMA total of 93 skull specimens spanning nearly all posthatching sizes
of T. schlegelii (n517), M. cataphractus (n524), C. acutus
(n532), and G. gangeticus (n520) were analyzed (see supporting
information Appendix S1). Only complete skulls of individuals
captured in the wild and lacking evident bone abnormalities were
included. We used landmark-based GM methods to quantify over-
all skull shape (Bookstein 1991; Rohlf and Marcus 1993; Adams
et al. 2004; Zelditch et al. 2004; Mitteroecker and Gunz 2009).
These methods quantify the shape of anatomical objects from the
coordinates of repeatable locations, after the effects of nonshape
variation are mathematically held constant. For each specimen, 90
3-dimensional landmarks were digitized (using an Immersion Mi-
croscribe G2) from the left side of the skull to capture skull ge-
ometry. Landmark definitions, positions and their corresponding
configurations are shown in Fig. 2. This landmark configuration
was then divided into two parts assumed to behave as separate
developmental modules: a ‘‘rostral’’ module and a ‘‘postrostral’’
module (Brochu, 2001). Twenty-one landmarks defined the ros-
trum and 41 landmarks defined the postrostrum. We aligned the set
of landmark coordinates using a generalized Procrustes Analysis
(GPA), which superimposes specimens to a common coordinate
system after accounting for differences in position, orientation, and
scale (Rohlf and Slice 1990; Bookstein 1991; Goodall 1991). From
the aligned specimens, Procrustes shape coordinates were obtained,
and used as shape variables in subsequent statistical analyses (e.g.,
Bookstein 1986; Mitteroecker et al. 2004; Mitteroecker and Book-
stein 2008). Centroid size was also retained for subsequent allo-
metric analyses. A separate GPA was performed on the entire data
set, as well as on each developmental module.
Comparing ontogenetic allometryTo test the hypothesis that species differ in their allometric tra-
jectories, we used permutational MANCOVA, with species, size,
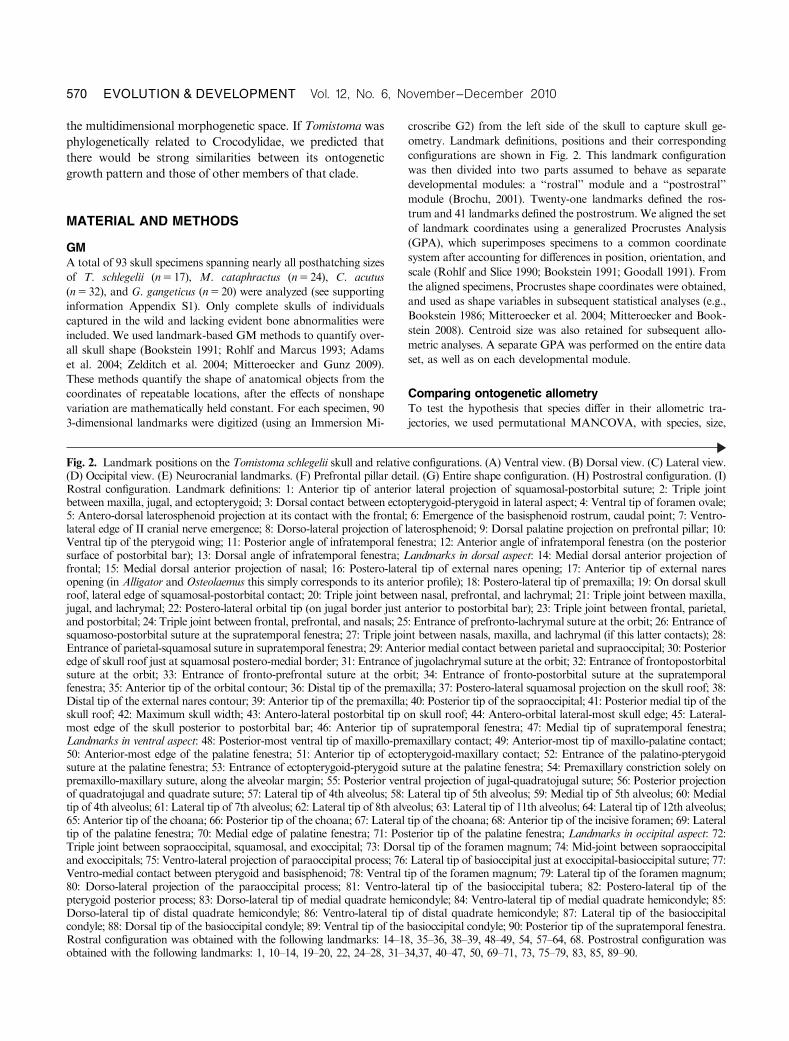
Fig. 2. Landmark positions on the Tomistoma schlegelii skull and relative configurations. (A) Ventral view. (B) Dorsal view. (C) Lateral view.(D) Occipital view. (E) Neurocranial landmarks. (F) Prefrontal pillar detail. (G) Entire shape configuration. (H) Postrostral configuration. (I)Rostral configuration. Landmark definitions: 1: Anterior tip of anterior lateral projection of squamosal-postorbital suture; 2: Triple jointbetween maxilla, jugal, and ectopterygoid; 3: Dorsal contact between ectopterygoid-pterygoid in lateral aspect; 4: Ventral tip of foramen ovale;5: Antero-dorsal laterosphenoid projection at its contact with the frontal; 6: Emergence of the basisphenoid rostrum, caudal point; 7: Ventro-lateral edge of II cranial nerve emergence; 8: Dorso-lateral projection of laterosphenoid; 9: Dorsal palatine projection on prefrontal pillar; 10:Ventral tip of the pterygoid wing; 11: Posterior angle of infratemporal fenestra; 12: Anterior angle of infratemporal fenestra (on the posteriorsurface of postorbital bar); 13: Dorsal angle of infratemporal fenestra; Landmarks in dorsal aspect: 14: Medial dorsal anterior projection offrontal; 15: Medial dorsal anterior projection of nasal; 16: Postero-lateral tip of external nares opening; 17: Anterior tip of external naresopening (in Alligator and Osteolaemus this simply corresponds to its anterior profile); 18: Postero-lateral tip of premaxilla; 19: On dorsal skullroof, lateral edge of squamosal-postorbital contact; 20: Triple joint between nasal, prefrontal, and lachrymal; 21: Triple joint between maxilla,jugal, and lachrymal; 22: Postero-lateral orbital tip (on jugal border just anterior to postorbital bar); 23: Triple joint between frontal, parietal,and postorbital; 24: Triple joint between frontal, prefrontal, and nasals; 25: Entrance of prefronto-lachrymal suture at the orbit; 26: Entrance ofsquamoso-postorbital suture at the supratemporal fenestra; 27: Triple joint between nasals, maxilla, and lachrymal (if this latter contacts); 28:Entrance of parietal-squamosal suture in supratemporal fenestra; 29: Anterior medial contact between parietal and supraoccipital; 30: Posterioredge of skull roof just at squamosal postero-medial border; 31: Entrance of jugolachrymal suture at the orbit; 32: Entrance of frontopostorbitalsuture at the orbit; 33: Entrance of fronto-prefrontal suture at the orbit; 34: Entrance of fronto-postorbital suture at the supratemporalfenestra; 35: Anterior tip of the orbital contour; 36: Distal tip of the premaxilla; 37: Postero-lateral squamosal projection on the skull roof; 38:Distal tip of the external nares contour; 39: Anterior tip of the premaxilla; 40: Posterior tip of the sopraoccipital; 41: Posterior medial tip of theskull roof; 42: Maximum skull width; 43: Antero-lateral postorbital tip on skull roof; 44: Antero-orbital lateral-most skull edge; 45: Lateral-most edge of the skull posterior to postorbital bar; 46: Anterior tip of supratemporal fenestra; 47: Medial tip of supratemporal fenestra;Landmarks in ventral aspect: 48: Posterior-most ventral tip of maxillo-premaxillary contact; 49: Anterior-most tip of maxillo-palatine contact;50: Anterior-most edge of the palatine fenestra; 51: Anterior tip of ectopterygoid-maxillary contact; 52: Entrance of the palatino-pterygoidsuture at the palatine fenestra; 53: Entrance of ectopterygoid-pterygoid suture at the palatine fenestra; 54: Premaxillary constriction solely onpremaxillo-maxillary suture, along the alveolar margin; 55: Posterior ventral projection of jugal-quadratojugal suture; 56: Posterior projectionof quadratojugal and quadrate suture; 57: Lateral tip of 4th alveolus; 58: Lateral tip of 5th alveolus; 59: Medial tip of 5th alveolus; 60: Medialtip of 4th alveolus; 61: Lateral tip of 7th alveolus; 62: Lateral tip of 8th alveolus; 63: Lateral tip of 11th alveolus; 64: Lateral tip of 12th alveolus;65: Anterior tip of the choana; 66: Posterior tip of the choana; 67: Lateral tip of the choana; 68: Anterior tip of the incisive foramen; 69: Lateraltip of the palatine fenestra; 70: Medial edge of palatine fenestra; 71: Posterior tip of the palatine fenestra; Landmarks in occipital aspect: 72:Triple joint between sopraoccipital, squamosal, and exoccipital; 73: Dorsal tip of the foramen magnum; 74: Mid-joint between sopraoccipitaland exoccipitals; 75: Ventro-lateral projection of paraoccipital process; 76: Lateral tip of basioccipital just at exoccipital-basioccipital suture; 77:Ventro-medial contact between pterygoid and basisphenoid; 78: Ventral tip of the foramen magnum; 79: Lateral tip of the foramen magnum;80: Dorso-lateral projection of the paraoccipital process; 81: Ventro-lateral tip of the basioccipital tubera; 82: Postero-lateral tip of thepterygoid posterior process; 83: Dorso-lateral tip of medial quadrate hemicondyle; 84: Ventro-lateral tip of medial quadrate hemicondyle; 85:Dorso-lateral tip of distal quadrate hemicondyle; 86: Ventro-lateral tip of distal quadrate hemicondyle; 87: Lateral tip of the basioccipitalcondyle; 88: Dorsal tip of the basioccipital condyle; 89: Ventral tip of the basioccipital condyle; 90: Posterior tip of the supratemporal fenestra.Rostral configuration was obtained with the following landmarks: 14–18, 35–36, 38–39, 48–49, 54, 57–64, 68. Postrostral configuration wasobtained with the following landmarks: 1, 10–14, 19–20, 22, 24–28, 31–34,37, 40–47, 50, 69–71, 73, 75–79, 83, 85, 89–90.
570 EVOLUTION & DEVELOPMENT Vol. 12, No. 6, November--December 2010
and species � size as factors. Permutational MANCOVA is based
on the Euclidean (Procrustes) distances among individuals,
and was used because the number of shape variables greatly ex-
ceeded the number of specimens. The statistical significance of
terms in the model was determined using 10,000 permutations
(for details see Anderson 2001). Subsequent to this analysis, differ-
ences between pairs of allometric trajectories were assessed using
a modification of phenotypic trajectory analysis (Collyer and
Adams 2007; Adams and Collyer 2007; Adams and Collyer 2009).
Here, the observed allometric trajectory for each species was
estimated by the set of regression coefficients of a regression of
shape on size. Because the number of shape variables exceeded
the number of specimens, we performed a principal component
analysis of shape, and retained only those dimensions that
contained variation. Differences between trajectories were then
calculated as the Euclidean distance between vectors of slopes,
disregarding the intercept. Regression vectors without the inter-
cept are ‘‘centered’’ at the origin; thus, distances between vectors
of slopes are equivalent to the angle between their multivariate
regression lines. Next, residuals from a reduced model contain-
ing only species and size (without the interaction term) were
obtained, and were permuted among species. Regression
coefficients from the randomized data were then obtained, and
differences between randomized allometric trajectories were
estimated. The observed differences between allometric trajecto-
ries were then compared with a randomly generated distribution
of trajectories, consisting of 999 iterations obtained by permu-
ting the residuals as above. Given that six pairwise comparisons
were made, significance level was set to an experiment-wise error
rate of a50.05, using Bonferroni’s correction (apairwise50.05/6
50.0083).
In order to explore shape differences at the onset of
posthatching growth we calculated predicted shapes for each spe-
cies at the smallest comparable sizes recorded for any species. We
then calculated the observed Euclidean (Procrustes) distances be-
tween them, and compared this to a distribution of random dis-
tances, using the permutation procedure described above. Finally,
in order to graphically assess the similarities in multivariate growth
trajectories and in early posthatching stage differences, we gener-
ated UPGMA dendrograms based on distances between multi-
variate angles and between predicted shapes at smallest and largest
comparable sizes.
Gavialis and Tomistoma skull ontogeny 571Piras et al.
Testing for convergence and parallelismTo determine whether developmental trajectories were convergent,
parallel, or divergent we followed the procedure of Adams and
Nistri (2010). First, we quantified the Procrustes distances between
predicted shapes among species at both the smallest and largest
comparable size values. We then calculate pairwise distances be-
tween species at both small and large sizes and contrasted them. If
the morphological distance between two species is significantly
smaller at adult stages as compared with at juvenile stages, this
pattern provides evidence for ontogenetic convergence; if distance
remains the same (i.e., the difference was not statistically signifi-
cant) there is evidence for parallelism, and if the distance between
species is significantly larger in adults than in juveniles there is
evidence for divergence. We statistically assessed these patterns us-
ing a permutation procedure (with 9999 randomizations), where
the Procrustes shape coordinates for individuals were shuffled with
respect to size, and the differences in Procrustes distances between
simulated datasets of large and small individuals among species
were recalculated and compared with the observed values (for a
related approach for assessing parallel evolution see Adams 2010).
Visualizing ontogenetic allometryThe visualization of phenotypic growth trajectories from GM data
is challenging, because shape data are highly multivariate. We used
several approaches to visualize allometric trends. First, we used
principal components analysis to examine patterns of variation
using the set of Procrustes shape variables. We visualized shape
variation along the first three principal component axes. Addition-
ally, we included size in this plot, by scaling each point propor-
tional to the centroid size of each specimen. This allowed us to
incorporate allometry into the visualization. Second, we visualized
allometric trajectories using predicted shapes along the regression
curve (Mitteroecker and Bookstein 2005). Here, separate linear
regressions of shape on size (log10CS) are performed for each
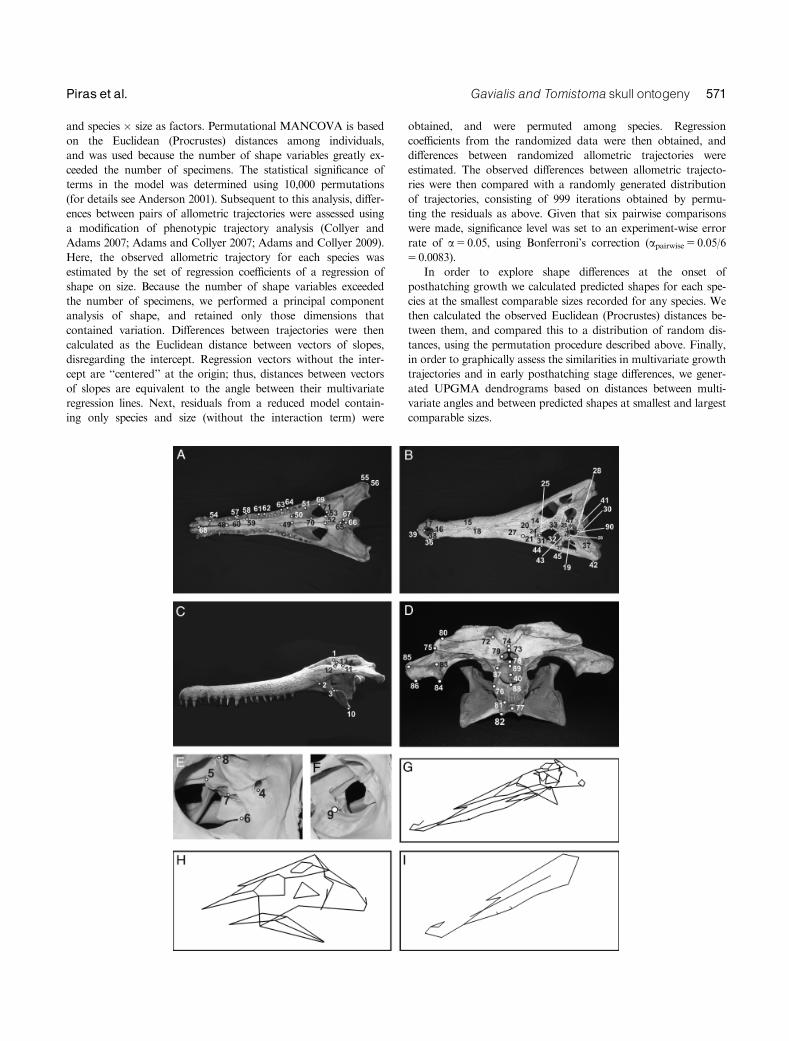
Table 1. Multivariate angular distances between
ontogenetic trajectories of species
Angles
Entire shape Ca Mcat Gg Ts
Ca 0.000
Mcat 0.055 0.000
Gg 0.102 0.067 0.000
Ts 0.157 0.120 0.106 0.000
P-value
Ca Mcat Gg Ts
Ca 1.000
Mcat 0.021 1.000
Gg 0.001 0.013 1.000
Ts 0.003 0.014 0.035 1.000
Angles
Postrostrum Ca Mcat Gg Ts
Ca 0.000
Mcat 0.048 0.000
Gg 0.117 0.107 0.000
Ts 0.111 0.094 0.094 0.000
P-value
Ca Mcat Gg Ts
Ca 1.000
Mcat 0.230 1.000
Gg 0.001 0.001 1.000
Ts 0.021 0.105 0.097 1.000
Angles
Rostrum Ca Mcat Gg Ts
Ca 0.000
Mcat 0.058 0.000
Gg 0.115 0.079 0.000
Ts 0.189 0.152 0.166 0.000
P-value
Ca Mcat Gg Ts
Ca 1
Mcat 0.085 1
Gg 0.001 0.028 1
Ts 0.013 0.03 0.022 1
Significance based on 1000 randomizations. In bold significant differ-ences. Significance level was set at 0.008, following Bonferroni’s adjust-ment.
Fig. 3. UPGMA clusters generated from pairwise angular simi-larities in the direction of ontogenetic trajectories in morphospace.Ca, Crocodylus acutus; Mcat, Mecistops cataphractus; Gg, Gavialisgangeticus; Ts, Tomistoma schlegelii.
572 EVOLUTION & DEVELOPMENT Vol. 12, No. 6, November--December 2010
species, and predicted values are obtained. We then summarized
this variation by using principal components, and plotted variation
along predicted allometric trajectories in the first three dimensions.
As with patterns in Procrustes shape variables, each point in mo-
rphospace was scaled by its centroid size, allowing a visual assess-
ment of allometry.
RESULTS
Ontogeny: entire shape, postrostrum, androstrum
Using multivariate regression, patterns of shape allometry we
found that Tomistoma has a different growth trajectory, rel-
ative to the other species. This is best seen in the differences of
multivariate angles between species in their allometric trajec-
tories (Table 1), and in the UPGMA dendrograms summa-
rizing these relationships (Fig. 3). Further, Procrustes
distances between small and large individuals for each spe-
cies revealed that Tomistoma displayed a greater change in
shape per unit size than did the remaining species. Therefore,
this species attains a higher ‘‘rate of growth’’ in terms of shape
change per unit size (not age). Individual analyses of species-
specific multivariate allometry identified that Gavialis and
Mecistops had the smallest covariation between rostrum
shape and size, while Tomistoma had similar values as com-
pared with Crocodylus. In addition, Gavialis had the largest
degree of covariation between postrostrum shape and size
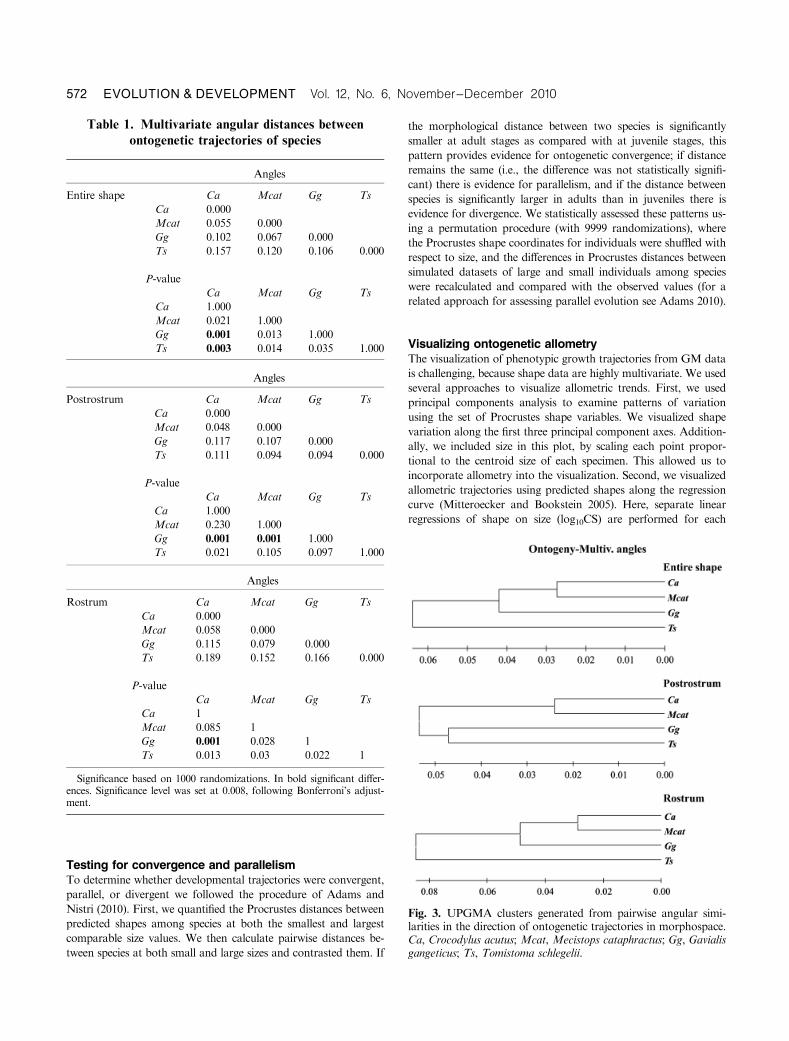
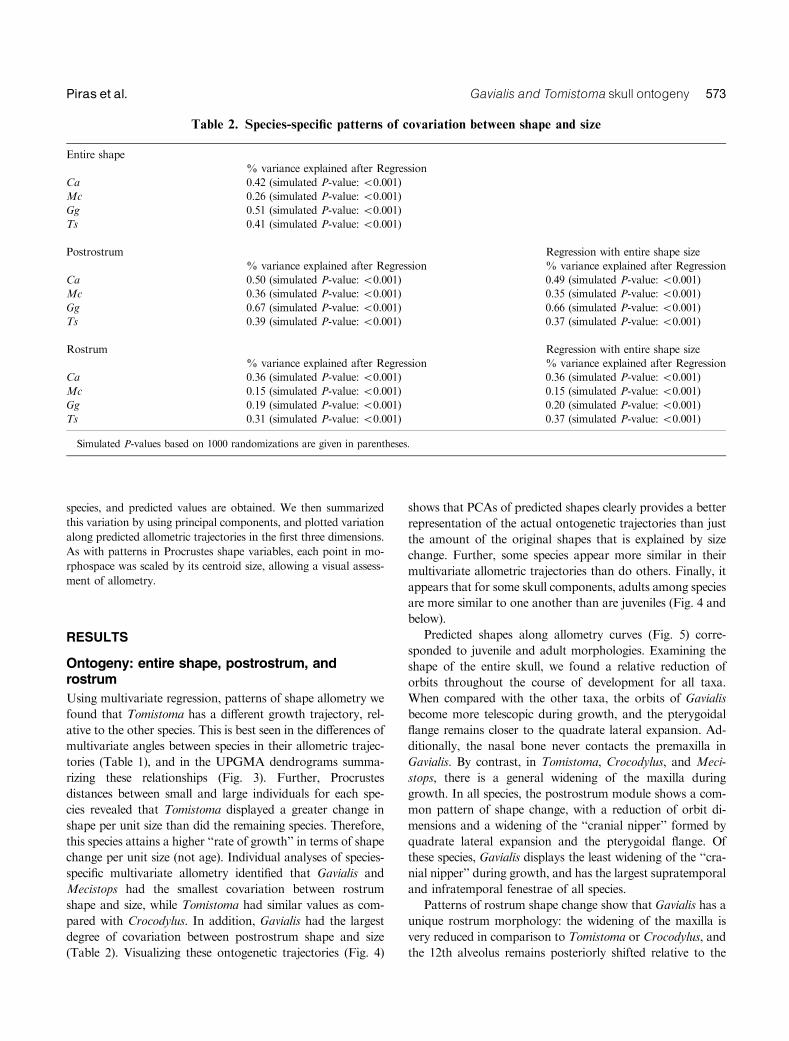
(Table 2). Visualizing these ontogenetic trajectories (Fig. 4)
shows that PCAs of predicted shapes clearly provides a better
representation of the actual ontogenetic trajectories than just
the amount of the original shapes that is explained by size
change. Further, some species appear more similar in their
multivariate allometric trajectories than do others. Finally, it
appears that for some skull components, adults among species
are more similar to one another than are juveniles (Fig. 4 and
below).
Predicted shapes along allometry curves (Fig. 5) corre-
sponded to juvenile and adult morphologies. Examining the
shape of the entire skull, we found a relative reduction of
orbits throughout the course of development for all taxa.
When compared with the other taxa, the orbits of Gavialis
become more telescopic during growth, and the pterygoidal
flange remains closer to the quadrate lateral expansion. Ad-
ditionally, the nasal bone never contacts the premaxilla in
Gavialis. By contrast, in Tomistoma, Crocodylus, and Meci-
stops, there is a general widening of the maxilla during
growth. In all species, the postrostrum module shows a com-
mon pattern of shape change, with a reduction of orbit di-
mensions and a widening of the ‘‘cranial nipper’’ formed by
quadrate lateral expansion and the pterygoidal flange. Of
these species, Gavialis displays the least widening of the ‘‘cra-
nial nipper’’ during growth, and has the largest supratemporal
and infratemporal fenestrae of all species.
Patterns of rostrum shape change show that Gavialis has a
unique rostrum morphology: the widening of the maxilla is
very reduced in comparison to Tomistoma or Crocodylus, and
the 12th alveolus remains posteriorly shifted relative to the
Table 2. Species-specific patterns of covariation between shape and size
Entire shape
% variance explained after Regression
Ca 0.42 (simulated P-value: o0.001)
Mc 0.26 (simulated P-value: o0.001)
Gg 0.51 (simulated P-value: o0.001)
Ts 0.41 (simulated P-value: o0.001)
Postrostrum Regression with entire shape size
% variance explained after Regression % variance explained after Regression
Ca 0.50 (simulated P-value: o0.001) 0.49 (simulated P-value: o0.001)
Mc 0.36 (simulated P-value: o0.001) 0.35 (simulated P-value: o0.001)
Gg 0.67 (simulated P-value: o0.001) 0.66 (simulated P-value: o0.001)
Ts 0.39 (simulated P-value: o0.001) 0.37 (simulated P-value: o0.001)
Rostrum Regression with entire shape size
% variance explained after Regression % variance explained after Regression
Ca 0.36 (simulated P-value: o0.001) 0.36 (simulated P-value: o0.001)
Mc 0.15 (simulated P-value: o0.001) 0.15 (simulated P-value: o0.001)
Gg 0.19 (simulated P-value: o0.001) 0.20 (simulated P-value: o0.001)
Ts 0.31 (simulated P-value: o0.001) 0.37 (simulated P-value: o0.001)
Simulated P-values based on 1000 randomizations are given in parentheses.
Gavialis and Tomistoma skull ontogeny 573Piras et al.

anterior tip of frontal spine during growth. On the other
hand, Crocodyus andMecistops are similar to Gavialis in their
juvenile morphologies, but display a converse pattern as
adults, where the anterior tip of the frontal spine is posteriorly
shifted relative to 12th alveolus position. Tomistoma is pecu-
liar in this regard because the 12th alveolus is anteriorly
shifted relative to the anterior tip of the frontal spine at both
the juvenile and adult stages of development.
Fig. 4. Ontogenetic trajectories for each of the three morphological data sets (entire skull, postrostrum, and rostrum), computed from PCAsof predicted shapes, after species-specific linear regressions of shape on size (A, C, and E) and on Procrustes residuals (B, D, and F).Separate Procrustes fits have been performed for the three landmark data sets. The size of each symbol is proportional to the size of thespecimen, indicating the direction of ontogenetic change (small ! large). Ca, Crocodylus acutus;Mcat,Mecistops cataphractus; Gg, Gavialisgangeticus; Ts, Tomistoma schlegelii.
574 EVOLUTION & DEVELOPMENT Vol. 12, No. 6, November--December 2010

Test for ontogenetic convergence
Using multivariate ontogenetic trajectories, we observed sig-
nificant convergence in entire shape between Gavialis and the
other taxa, but not between Tomistoma and any of the other
taxa (Table 3). Ontogenetic convergence was also present be-
tween Crocodylus and Mecistops. The remaining trajectories
were not statistically different from one another, implying on-
togenetic parallelism in their patterns of growth. The analysis
of postrostral shape suggests divergence between Gavialis and
all other taxa (Table 3), while the remaining species display
parallelism in their ontogenetic trajectories. The exception to
this is the Mecistops and Crocodylus, whose ontogenetic tra-
jectories diverge in relatively different adult morphologies.
In terms of rostral shape, most species exhibit parallel
trajectories. The exception to this was Gavialis, which is
Fig. 5. Ontogenetic morphological chan-ges visualized after species-specific multi-variate regressions of shape on size forthe three landmark data sets.
Gavialis and Tomistoma skull ontogeny 575Piras et al.

convergent with both Crocodylus and Mecistops. Dendro-
grams based on Procrustes distances between predicted shapes
at comparable small and large sizes among species visually
confirm these findings (Fig. 6). Gavialis is the most peculiar
taxon in terms of skull shape, regardless of whether small or
large individuals are examined. This pattern is congruent with
the morphological phylogeny for the species, implying that at
both the onset of posthatching growth and at late develop-
mental stages, the morphology of Gavialis is quite distinct
from that observed in the other taxa.
DISCUSSION
The difference between molecular and morphological
crocodilian phylogenies, and the relative positions of Gavialis
and Tomistoma in particular, have proven difficult to recon-
cile. Combined morphological-molecular analyses reiterate
the ‘‘morphological’’ topology when fossil species are in-
cluded, a pattern similarly observed in the molecular data,
when they are limited to the 12S ribosome sequences (Brochu,
2003). However, when larger molecular data sets are used
(e.g., Gatesy et al. 2003, 2004), phylogenetic patterns converge
on an alternative topology (Brochu 2003). The differential
signals between data types have also proven to be highly sta-
ble when new data or taxa are added. Here we addressed this
puzzling issue from a completely different perspective, exam-
ining the signal in ontogenetic growth trajectories that are
responsible for adult morphology. We tested whether the
close resemblance between Tomistoma and Gavialis may be
produced by evolutionary convergence, as the morphological
phylogeny proposes, or whether this similarity is derived from
shared ontogeny (homology), as the molecular data suggests.
Adult phenotypes (the raw material in systematics), are the
result of complex developmental programs. How much spe-
cies actually share their ontogenies depends in part on their
phylogenetic relatedness, and on several interrelated pro-
cesses, including selection, shared evolutionary history, and
developmental ‘‘constraints.’’
When the direction of ontogenetic trajectories were exam-
ined, we found that Tomistoma possesses a unique direction
and rate of growth in comparison to the other taxa. For the
entire skull and for the rostrum, this difference is always sig-
nificant, while for the postrostrum, Tomistoma differed sig-
nificantly only from Crocodylus. These findings suggest that
Tomistoma evolved a unique rate and trajectory of growth.
Table 3. Tests for ontogenetic convergence
Entire shape Postrostrum Rostrum
Differences between small and large Procrustes distance between species
Ca Mcat Gg Ts Ca Mcat Gg Ts Ca Mcat Gg Ts
Ca 0.00000 Ca 0.00000 Ca 0.00000
Mcat 0.00769 0.00000 Mcat � 0.01061 0.00000 Mcat 0.01196 0.00000
Gg 0.03524 0.01502 0.00000 Gg � 0.05971 � 0.04800 0.00000 Gg 0.03733 0.02196 0.00000
Ts 0.07372 0.03911 0.00406 0.00000 Ts 0.00417 � 0.00602 � 0.02828 0.00000 Ts 0.03620 � 0.00520 0.05436 0.00000
Procrustes distance at small sizes
Ca Mcat Gg Ts Ca Mcat Gg Ts Ca Mcat Gg Ts
Ca 0.00000 Ca 0.00000 Ca 0.00000
Mcat 0.09057 0.00000 Mcat 0.08988 0.00000 Mcat 0.13927 0.00000
Gg 0.29033 0.23698 0.00000 Gg 0.18343 0.18787 0.00000 Gg 0.55243 0.46097 0.00000
Ts 0.20471 0.13339 0.18050 0.00000 Ts 0.12897 0.09393 0.19273 0.00000 Ts 0.30683 0.18327 0.35697 0.00000
Procrustes distance at large sizes
Ca Mcat Gg Ts Ca Mcat Gg Ts Ca Mcat Gg Ts
Ca 0.00000 Ca 0.00000 Ca 0.00000
Mcat 0.08288 0.00000 Mcat 0.10048 0.00000 Mcat 0.12731 0.00000
Gg 0.25508 0.22195 0.00000 Gg 0.24314 0.23587 0.00000 Gg 0.51510 0.43902 0.00000
Ts 0.13099 0.09428 0.17644 0.00000 Ts 0.12481 0.09995 0.22101 0.00000 Ts 0.27062 0.18847 0.30261 0.00000
Simulated P-value for significance in differences after 10,000 permutations
Ca Mcat Gg Ts Ca Mcat Gg Ts Ca Mcat Gg Ts
Ca 1.00000 Ca 1.00000 Ca 1.00000
Mcat 0.0014C 1.00000 Mcat 0.0025D 1.00000 Mcat 0.0224P 1.00000
Gg 0.0001C 0.0001C 1.00000 Gg 0.0001D 0.0001D 1.00000 Gg 0.0001C 0.0001C 1.00000
Ts 0.0109P 0.1262P 0.0342P 1.00000 Ts 0.105P 0.3881P 0.005D 1.00000 Ts 0.0601P 0.2929P 0.0255P 1.00000
Significant differences in bold. Significance level was set at 0.008, based on Bonferroni’s adjustment.C, convergence; D, divergence; P, parallelism.
576 EVOLUTION & DEVELOPMENT Vol. 12, No. 6, November--December 2010
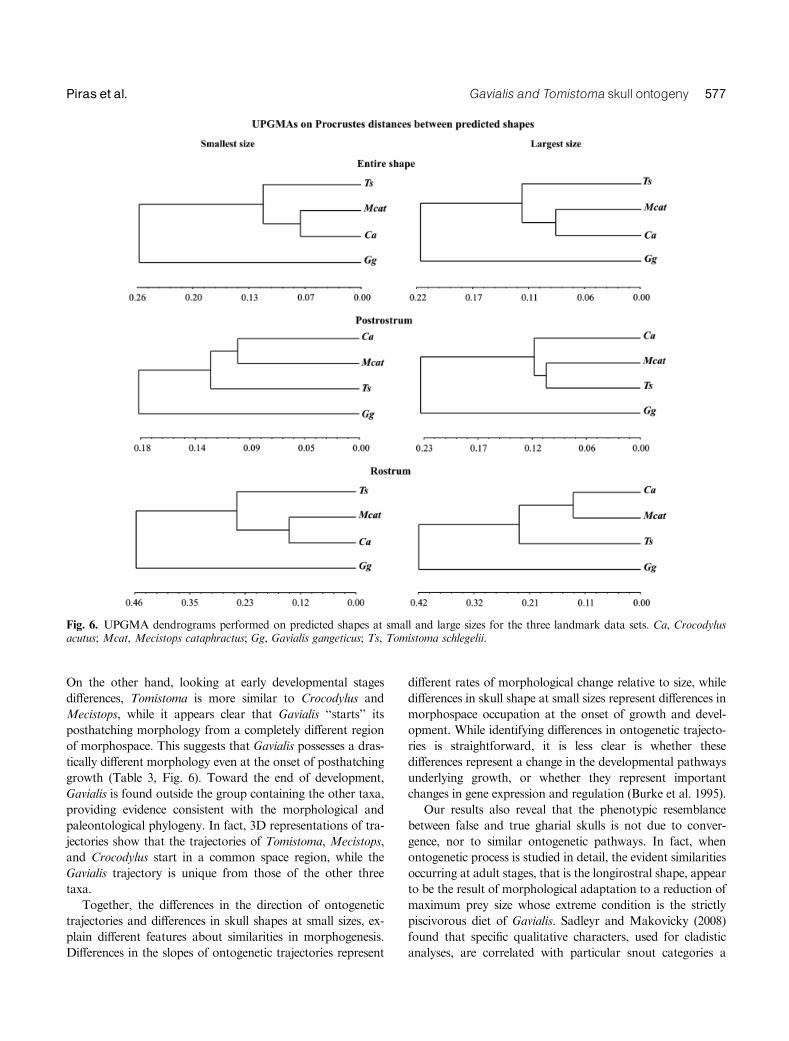
On the other hand, looking at early developmental stages
differences, Tomistoma is more similar to Crocodylus and
Mecistops, while it appears clear that Gavialis ‘‘starts’’ its
posthatching morphology from a completely different region
of morphospace. This suggests that Gavialis possesses a dras-
tically different morphology even at the onset of posthatching
growth (Table 3, Fig. 6). Toward the end of development,
Gavialis is found outside the group containing the other taxa,
providing evidence consistent with the morphological and
paleontological phylogeny. In fact, 3D representations of tra-
jectories show that the trajectories of Tomistoma, Mecistops,
and Crocodylus start in a common space region, while the
Gavialis trajectory is unique from those of the other three
taxa.
Together, the differences in the direction of ontogenetic
trajectories and differences in skull shapes at small sizes, ex-
plain different features about similarities in morphogenesis.
Differences in the slopes of ontogenetic trajectories represent
different rates of morphological change relative to size, while
differences in skull shape at small sizes represent differences in
morphospace occupation at the onset of growth and devel-
opment. While identifying differences in ontogenetic trajecto-
ries is straightforward, it is less clear is whether these
differences represent a change in the developmental pathways
underlying growth, or whether they represent important
changes in gene expression and regulation (Burke et al. 1995).
Our results also reveal that the phenotypic resemblance
between false and true gharial skulls is not due to conver-
gence, nor to similar ontogenetic pathways. In fact, when
ontogenetic process is studied in detail, the evident similarities
occurring at adult stages, that is the longirostral shape, appear
to be the result of morphological adaptation to a reduction of
maximum prey size whose extreme condition is the strictly
piscivorous diet of Gavialis. Sadleyr and Makovicky (2008)
found that specific qualitative characters, used for cladistic
analyses, are correlated with particular snout categories a
Fig. 6. UPGMA dendrograms performed on predicted shapes at small and large sizes for the three landmark data sets. Ca, Crocodylusacutus; Mcat, Mecistops cataphractus; Gg, Gavialis gangeticus; Ts, Tomistoma schlegelii.
Gavialis and Tomistoma skull ontogeny 577Piras et al.

priori defined. However, rostral variation is continuously dis-
tributed in Crocodylia (Piras et al. 2009) and a GM analysis is
capable of capturing the complexity of this pattern. As hy-
pothesized by Sadleyr and Makovicky (2008), differences in
ontogenetic trajectories reveal possible atavism or conver-
gence/parallelism that underlies adult snout similarity. Fur-
ther, even if one assumes that Gavialis and Tomistoma are
sister taxa (as is found based on molecular data), this would
not necessarily indicate that the long, slender snout was in-
herited from their last common ancestor. Such an inference
would depend on where fossils were placed relative to extant
taxa in the molecular phylogeny. For instance, if the primitive
tomistomines Maroccosuchus and Kentisuchus (from Early
Eocene of Morocco and England respectively, about 50Ma)
were closer to Tomistoma than to Gavialis, this placement
would infer that a slender (stenorostrine) snout was the an-
cestral condition in the Tomistoma/Gavialis clade, while a
truly long (longirostrine) snout might not be. However, this
scenario ignores the placement of all fossil Gavialoidea that,
from their oldest representatives (Eothoracosaurus mississip-
piensis, from Late Cretaceous of North America, about
70Ma) showed an extreme longirostral condition.
When computing allometric trajectories of the four taxa
separately we found much smaller covariation between shape
and size in Gavialis rostrum than in Tomistoma’s: a further
indication that the growth patterns of the two species for this
module are quite different, and that Gavialis skull has a dis-
tinct growth pattern. On the other hand, Gavialis displays
large covariation between postrostrum shape and size. Thus,
comparing these patterns between taxa suggests that the two
are quite distinct from a developmental point of view. Based
on the results presented here, the distinct ontogenetic trajec-
tories, as well as the distinct juvenile shapes, provide evidence
that gharial shapes are distinct, and that there remains a close
similarity between Tomistoma and the other brevirostres,
supporting the morphological phylogenetic hypothesis.
CONCLUSIONS
Morphological and molecular approaches to crocodile phy-
logeny point to very different tree topologies. The morpho-
logical topology proposes that the Schlegel’s crocodile, T.
schlegelii, is closer to brevirostrine forms than to gharials,
despite its long and slender rostrum and general morpholog-
ical similarity to the latter. Here we argue that the long-
irostrine condition in Tomistoma and Gavialis is due to
adaptive parallelism, probably generated by the very similar
feeding habits of these species. Despite being longirostrine in
skull shape, Tomistoma’s ontogenetic trajectories computed
for both the skull as a whole and for its prominent modules
(the rostrum and the postrostrum) are all much more similar
to brevirostres’ than to Gavialis. True gharial skull ontogeny
is very unique. While the aberrant ontogeny of G. gangeticus
makes its phylogenetic position problematic with the molec-
ular approach, a close resemblance between Tomistoma and
the other brevirostres is clearly supported.
AcknowledgmentsWe are very grateful to Michael Collyer for its important contribu-tions on some statistical tests used in this paper. Paolo Piras hadaccess to the collections of the Natural History Museum in London,the Institut Royal des Sciences Naturelles in Brussels and the Mu-seum d’Histoire Naturelle in Paris thanks to the SYNTHESYS pro-gram, and to the collection of the Field Museum in Chicago thanksto the Visiting Scholarship Program. DCA was supported in part byNSF grant DEB-0446758.
REFERENCES
Adams, D. C. 2010. Paralell evolution of character displacement driven bycompetitive selection in terrestrial salamanders. BMC Evol. Biol. 10(72):1–10.
Adams, D. C., and Collyer, M. L. 2007. Analysis of character divergencealong environmental gradients and other covariates. Evolution 61: 510–515.
Adams, D. C., and Collyer, M. L. 2009. A general framework for theanalysis of phenotypic change in evolutionary studies. Evolution 63:1143–1154.
Adams, D. C., and Nistri, A. 2010. Ontogenetic convergence and evolutionof foot morphology in European cave salamanders (Family: Pletho-dontidae). BMC Evol. Biol. 10(216): 1–10.
Adams, D. C., Rohlf, F. J., and Slice, D. E. 2004. Geometric morphomet-rics: ten years of progress following the ‘revolution’. It. J. Zool. 71: 5–16.
Anderson, M. J. 2001. A new method for non-parametric multivariateanalysis of variance. Aust. Ecol. 26: 32–46.
Bookstein, F. L. 1986. Size and shape spaces for landmark data in twodimensions. Stat. Sci. 1: 181–222.
Bookstein, E. L. 1991. Morphometric tools for Landmark data: Geometryand Biology. Cambridge University Press, New York.
Brochu, C. A. 2001. Crocodylian snouts in space and time: phylogeneticapproaches toward adaptive radiation. Am. Zool. 41: 564–585.
Brochu, C. A. 2003. Phylogenetic approaches toward crocodylian history.Ann. Rev. E. Plan. Sci. 31: 357–397.
Brochu, C. A., and Densmore, L. D. 2001. Crocodile phylogenetics: a re-view of current progress. In G. Grigg, F. Seebacher, and C. E. Franklin(eds.). Crocodilian Biology and Evolution. Surrey Beatty & Sons NewSouth Wales, Australia, pp. 3–8.
Burke, A. C., Nelson, C. E., Morgan, B. A., and Tabin, C. 1995. Hoxgenes and the evolution of vertebrate axial morphology. Development121: 333–346.
Busbey, A. B. 1995. The structural consequences of skull flattening incrocodilians. In J. J. Thomason (ed.). Functional Morphology inVertebrate Paleontology. Cambridge University Press, New York,pp. 173–192.
Collyer, M. L., and Adams, D. C. 2007. Analysis of two-state multivariatephenotypic change in ecological studies. Ecology 88: 683–692.
Gatesy, J., Amato, G., Norell, M., De Salle, R., and Hayashi, C. 2003.Total evidence support for extreme taxic atavism in gavialine crocodili-ans. Syst. Biol. 52: 403–422.
Gatesy, J., Baker, R. H., and Hayashi, C. 2004. Inconsistencies in argu-ments for the supertree approach: supermatrices versus supertrees ofcrocodylia. Syst. Biol. 53: 342–355.
Goodall, C. R. 1991. Procrustes methods in the statistical analysis of shape.J. R. Stat. Soc. B 53: 285–339.
Harshman, J., Huddleston, C., Bollback, J., Parsons, T., and Braun, M.2003. True and false gharials: a nuclear gene phylogeny of crocodylia.Syst. Biol. 52: 386–402.
578 EVOLUTION & DEVELOPMENT Vol. 12, No. 6, November--December 2010
Janke, A., Gullberg, A., Hughes, S., Aggarwal, R. K., and Arnason, U.2006. Mitogenomic analyses place the gharial (Gavialis gangeticus) on thecrocodile tree and provide pre-K/T divergence times for most crocodili-ans. J. Mol. Evol. 61: 620–626.
McAliley, L. R., Willis, R. E., Ray, D. A., Scott White, P., Brochu, C. A.,and Densmore, L. D. III 2006. Are crocodiles really monophyletic? Ev-idence for subdivisions from sequence and morphological data. Mol.Phylogenet. Evol. 39: 16–32.
Mitteroecker, P., and Bookstein, F. L. 2005. Heterochrony and geometricmorphometrics: a comparison of cranial growth in Pan paniscus versusPan troglodytes. Evol. Dev. 7: 244–258.
Mitteroecker, P., and Bookstein, F. L. 2008. The evolutionary role of mod-ularity and integration in the hominoid cranium. Evolution 62: 943–958.
Mitteroecker, P., and Gunz, P. 2009. Advances in geometric morphomet-rics. Evol. Biol. 36: 235–247.
Mitteroecker, P., Gunz, P., Bernhard, M., Schaefer, K., and Bookstein,F. L. 2004. Comparison of cranialontogenetic trajectories amonghominoids. J. Hum. Evol. 46: 679–698.
Piras, P., Teresi, L., Buscalioni, A. D. G., and Cubo, J. 2009. The shadow offorgotten ancestors differently constrains the fate of alligatoroidea andcrocodyloidea. Glob. Ecol. Biogeogr. 18: 30–40.
Rohlf, F. J., and Marcus, L. F. 1993. A revolution in morphometrics.Trends Ecol. Evol. 8: 129–132.
Rohlf, F. J., and Slice, D. E. 1990. Extensions of the procrustes method forthe optimal superimposition of landmarks. Syst. Zool. 39: 40–59.
Sadleyr, R. W., and Makovicky, P. J. 2008. Cranial shape and correlatedcharacters in crocodilian evolution. J. Evol. Biol. 21: 1578–1596.
Xue-Feng, J., Xiao-Bing, W., Yan, L., Peng, Y., and Amato, G. 2006. Themitochondrial genome of Crocodylus niloticus with implications forphylogenetic relationships among crocodilian species. Acta Zool. Sin. 52:810–818.
Zelditch, M. L., Swiderski, D. L., Sheets, H. D., and Fink, W. L. 2004.Geometric Morphometrics for Biologists: A Primer. Elsevier AcademicPress, New York and London.
SUPPORTING INFORMATION
Additional Supporting Information may be found in the on-
line version of this article:
Appendix S1. Material used for this study.
Please note: Wiley-Blackwell are not responsible for the
content or functionality of any supporting materials sup-
plied by the authors. Any queries (other than missing mate-
rial) should be directed to the corresponding author for the
article.
Gavialis and Tomistoma skull ontogeny 579Piras et al.