Embed Size (px)
Citation preview
Gatwick Airport Flight Performance Team Report covering the period October to December 2018 0
Gatwick Airport Flight Performance Report This report covers the period (1st October – 31st December 2018)
Gatwick Airport Flight Performance Team Report covering the period October to December 2018 1
Contents
Introduction ........................................................................................................................................................................................ 2
Runway Direction ................................................................................................................................................................................ 4
The Aeronautical Information Publication .......................................................................................................................................... 5
Departures - Noise Infringements ....................................................................................................................................................... 5
Departures - Initial Climb Performance ............................................................................................................................................... 6
Departures - Track Keeping ................................................................................................................................................................. 7
Departures – Over Congested Areas ................................................................................................................................................. 11
Arrivals – Continuous Descent Operations (CDO) ............................................................................................................................. 14
Arrivals – Over Congested Areas ....................................................................................................................................................... 18
Go-Around Statistics ......................................................................................................................................................................... 21
Night Flights ...................................................................................................................................................................................... 23
Noise Complaints .............................................................................................................................................................................. 25
Ground Noise Complaints ................................................................................................................................................................. 29
Glossary ............................................................................................................................................................................................. 30
Gatwick Airport Flight Performance Team Report covering the period October to December 2018 2
Introduction ABOUT THIS REPORT
This report is produced by the Gatwick Flight Performance
Team (FPT). This team is responsible for recording,
investigating and responding to aircraft noise enquiries as
well as monitoring airline compliance to noise mitigation
measures as detailed in the UK Aeronautical Information
Publication (AIP). This department also actively engages with
the airlines to improve their adherence to the above noise
mitigation measures and in addition manages the night-time
restrictions on flying at Gatwick.
This report contains detailed data on aircraft activity at
Gatwick including the adherence to the noise mitigation
measures detailed in the UK AIP, a report on night flying
during the period, and an analysis of noise complaints
received during the period.
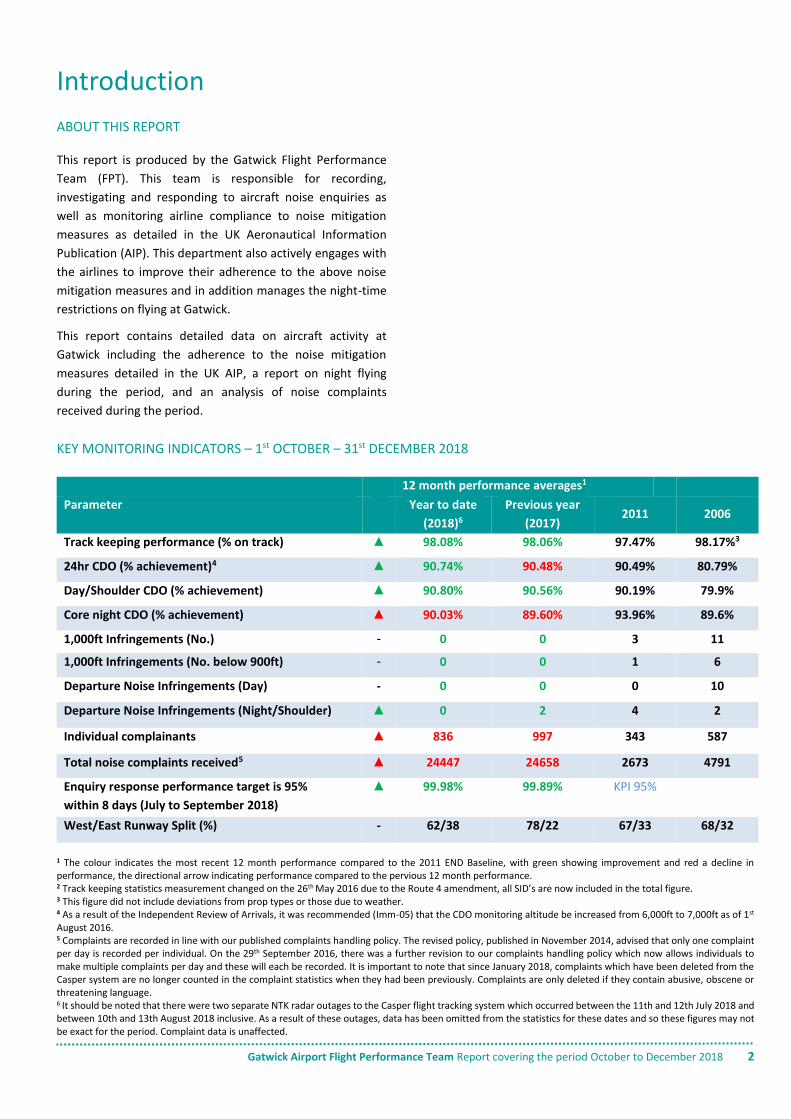
KEY MONITORING INDICATORS – 1st OCTOBER – 31st DECEMBER 2018
12 month performance averages1
Parameter Year to date
(2018)6
Previous year
(2017) 2011 2006
Track keeping performance (% on track) ▲ 98.08% 98.06% 97.47% 98.17%3
24hr CDO (% achievement)4 ▲ 90.74% 90.48% 90.49% 80.79%
Day/Shoulder CDO (% achievement) ▲ 90.80% 90.56% 90.19% 79.9%
Core night CDO (% achievement) ▲ 90.03% 89.60% 93.96% 89.6%
1,000ft Infringements (No.) - 0 0 3 11
1,000ft Infringements (No. below 900ft) - 0 0 1 6
Departure Noise Infringements (Day) - 0 0 0 10
Departure Noise Infringements (Night/Shoulder) ▲ 0 2 4 2
Individual complainants ▲ 836 997 343 587
Total noise complaints received5 ▲ 24447 24658 2673 4791
Enquiry response performance target is 95%
within 8 days (July to September 2018)
▲ 99.98% 99.89% KPI 95%
West/East Runway Split (%) - 62/38 78/22 67/33 68/32
1 The colour indicates the most recent 12 month performance compared to the 2011 END Baseline, with green showing improvement and red a decline in performance, the directional arrow indicating performance compared to the pervious 12 month performance. 2 Track keeping statistics measurement changed on the 26th May 2016 due to the Route 4 amendment, all SID’s are now included in the total figure. 3 This figure did not include deviations from prop types or those due to weather. 4 As a result of the Independent Review of Arrivals, it was recommended (Imm-05) that the CDO monitoring altitude be increased from 6,000ft to 7,000ft as of 1st August 2016. 5 Complaints are recorded in line with our published complaints handling policy. The revised policy, published in November 2014, advised that only one complaint per day is recorded per individual. On the 29th September 2016, there was a further revision to our complaints handling policy which now allows individuals to make multiple complaints per day and these will each be recorded. It is important to note that since January 2018, complaints which have been deleted from the Casper system are no longer counted in the complaint statistics when they had been previously. Complaints are only deleted if they contain abusive, obscene or threatening language. 6 It should be noted that there were two separate NTK radar outages to the Casper flight tracking system which occurred between the 11th and 12th July 2018 and between 10th and 13th August 2018 inclusive. As a result of these outages, data has been omitted from the statistics for these dates and so these figures may not be exact for the period. Complaint data is unaffected.
Gatwick Airport Flight Performance Team Report covering the period October to December 2018 3
Executive Summary Performance Headlines
AIRPORT OPERATIONS
Between 1st October and 31st December 2018, there were a
total of 64,872 fixed wing aircraft movements at Gatwick, an
increase in traffic of over 1% compared to the same period in
2017. The direction of operation is determined by wind
direction and this was split 62% on the westerly runway and
38% on the easterly runway for the period. The rolling 16 year
average for the split in runway usage is approximately 68%
westerly and 32% easterly.
STANDBY RUNWAY (26R/08L) USAGE
Although Gatwick has the main runway and the ‘reserve’ or
standby runway, they cannot be operated simultaneously.
The standby runway is normally only utilised during the night
when maintenance on the main runway is planned. During
these three months, there were a total of 98 movements from
the standby runway.
TRACK KEEPING
Track keeping performance has increased slightly compared
to the previous years performance, details of which will
follow later in this report. As part of our continuing
commitment to increase on-track performance, the FPT also
continues to engage with the airlines directly and through the
Flight Operations Performance and Safety Committee
(FLOPSC) on a range of initiatives to monitor compliance.
WOULD YOU LIKE TO KNOW MORE ABOUT AIRCRAFT
NOISE OR TRACK A FLIGHT?
To track aircraft, see noise readings or make a complaint
about aircraft noise at Gatwick you can visit our website:
http://www.gatwickairport.com/aircraftnoiseandairspace
The website provides detailed maps on aircraft traffic around
the airport as well as useful information on noise and
statistics on aircraft movements. It also details the work we
undertake with others in the aviation industry to try and
alleviate the impact of our operations on both the local and
wider community.
CONTINUOUS DESCENT OPERATIONS (CDO)
PERFORMANCE
While the Noise and Track Keeping (NTK) system utilises the
most up-to-date format of radar data currently available, the
algorithm that measures CDO performance has remained
unchanged since the definition was initially defined several
years ago. As part of a development project to improve the
accuracy of CDO measurement, the Flight Performance Team
has worked closely with NATS to upgrade the current
algorithm. The core algorithm remains unaltered, although
some additional rules have been added with the result that
some marginal profiles, previously classified as CDO
compliant, will now be re-classified as non-CDO flights. These
changes came into effect from May 2015 and the resulting
variance in recorded levels of performance is in the order of
1%, therefore we expect to see a minor drop off in recorded
performance from this date. Historical observations have
consistently shown a reduction in performance during the
winter months due to instances of inclement weather.
It is important to note that as recommended by the
Independent Review of Arrivals, the altitude at which CDO is
measured has changed as of 1st August 2016, more details
later in the report.
COMMUNITY NOISE MONITORING
In addition to fixed monitors located close to the ends of the
runway, there are currently mobile noise monitors deployed
at sites in Lingfield, Rusper, Cowden, Charlwood, South
Holmwood, Withyham and Hever Castle.
For several years, we have run a programme of noise
monitoring to get a better understanding of the levels of
aircraft noise in the communities surrounding Gatwick
Airport. The noise monitors provide a method of monitoring
and recording noise from both aircraft, and background
sources. This allows us to evaluate trends and make
comparisons between the noise environments at different locations.
COMPLAINTS
The number of recorded complaints has decreased compared
to the previous twelve months as well as the number of
complainants which has also decreased. Although the airport
has been just as busy as it has in recent years, there has also
been a large amount of publicity surrounding the community
issues related to the Route 4 amendment and the airport’s
Draft Master Plan Consultation, which may be contributing
factors for the number of complaints in 2018.
The postcode areas with the greatest number of enquiries
during the three month period were Outwood, Horley and
Newdigate. The number of individual complainants between
October and December was 241. Complaints about aircraft
operations are processed in accordance with our published
Complaints Handling Policy. Details of this policy are available
on our website.
Gatwick Airport Flight Performance Team Report covering the period October to December 2018 4
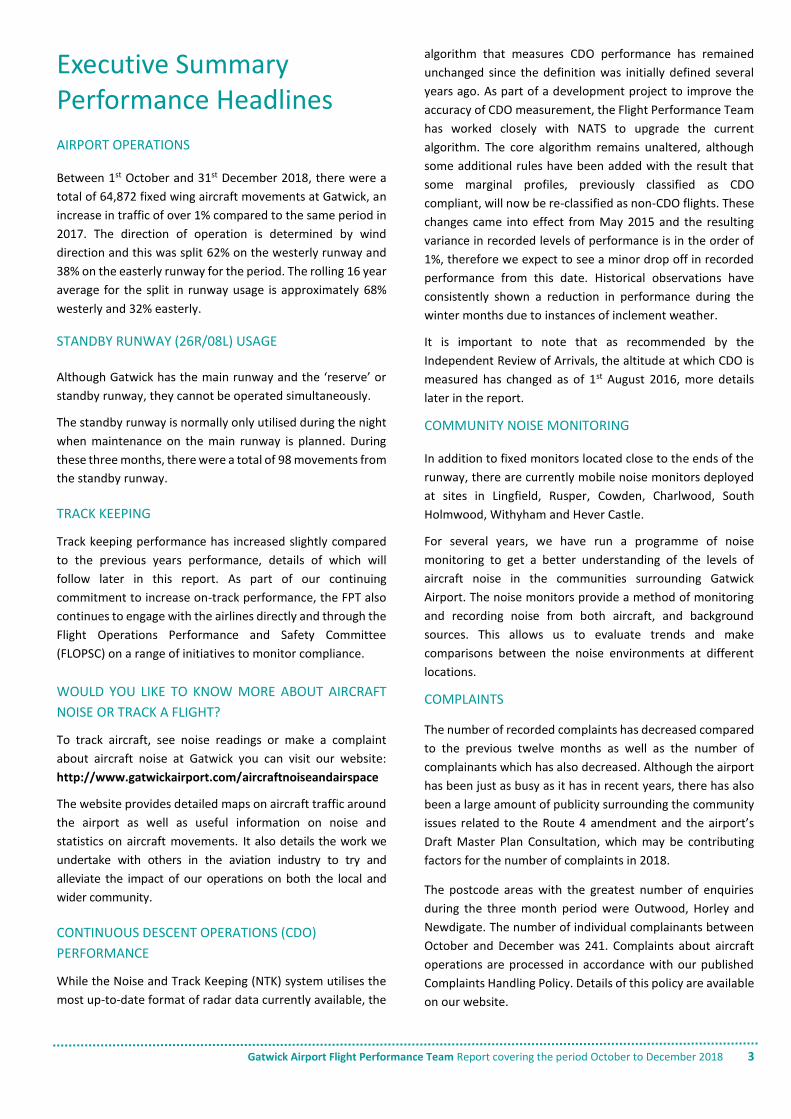
Runway Direction
The graph below represents the direction of runway
operation at Gatwick. Aircraft operating in a westerly
direction take off towards the west and land from the east.
Aircraft operating in an easterly direction take off towards the
east and land from the west.
Although the long term average is approximately 68:32 in
favour of westerly operations, it is not unusual to experience
long periods of prolonged operation in either one direction or
another.
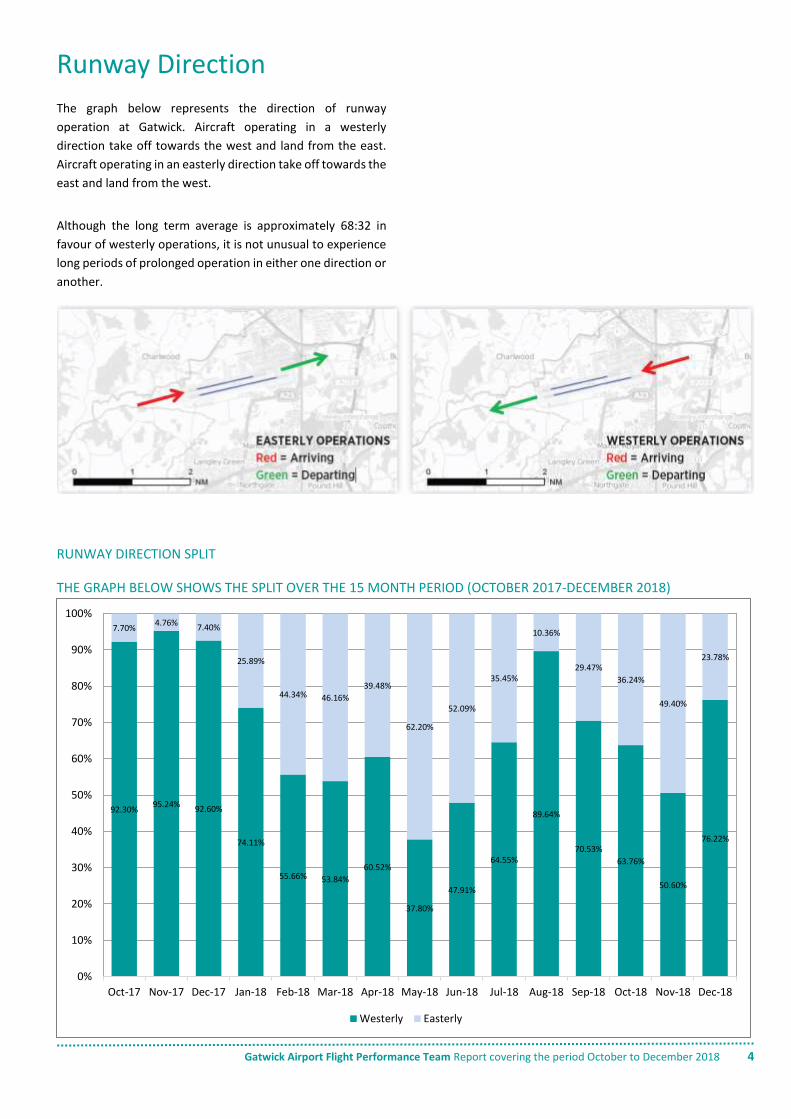
RUNWAY DIRECTION SPLIT
THE GRAPH BELOW SHOWS THE SPLIT OVER THE 15 MONTH PERIOD (OCTOBER 2017-DECEMBER 2018)
92.30%95.24%
92.60%
74.11%
55.66% 53.84%
60.52%
37.80%
47.91%
64.55%
89.64%
70.53%
63.76%
50.60%
76.22%
7.70%4.76%
7.40%
25.89%
44.34% 46.16%
39.48%
62.20%
52.09%
35.45%
10.36%
29.47%
36.24%
49.40%
23.78%
0%
10%
20%
30%
40%
50%
60%
70%
80%
90%
100%
Oct-17 Nov-17 Dec-17 Jan-18 Feb-18 Mar-18 Apr-18 May-18 Jun-18 Jul-18 Aug-18 Sep-18 Oct-18 Nov-18 Dec-18
Westerly Easterly
Gatwick Airport Flight Performance Team Report covering the period October to December 2018 5
The Aeronautical Information Publication
An Aeronautical Information Publication (or AIP) is defined by
the International Civil Aviation Organisation (ICAO) as a
publication issued by or with the authority of a state and
containing aeronautical information of a lasting character
essential to air navigation.
It is designed to be a manual containing thorough details of
regulations, procedures and other information pertinent to
flying aircraft in the particular country to which it relates. It is
usually issued by or on behalf of the respective civil aviation
administration.
The structure and contents of AIPs are standardized by
international agreement through ICAO. AIPs normally have
three parts - GEN (general), ENR (en route) and AD
(aerodromes).
The Gatwick Aerodrome AIP contains details regarding the
noise mitigation measures in place and adherence to these is
reported in this section.
ADHERENCE TO NOISE MITIGATION MEASURES AS
DETAILED IN THE GATWICK AIP
Each element of this report is preceded, where applicable, by
the relevant Aeronautical Information Publication (AIP)
reference and summary text detailing the purpose of the
requirement. Data is then presented on current performance.
It should be noted that Gatwick is 202ft above mean sea level
(AMSL) and the Noise and Track Keeping system (NTK)
measures height relative to Gatwick elevation and not sea level.
References in the AIP are usually above sea level (quoted as
Gatwick QNH) and therefore need to be reduced by 202ft to be
comparable with heights, as measured by the NTK. For
example, the requirement to join the ILS at 3,000ft would
equate to 2,798ft in the NTK system.
No account is taken of the variability of heights as measured by
the radar which, depending on the distance from the radar
head, can be +/- 200ft from that indicated. This is obviously
allowed for by NATS and ANS when managing operations.
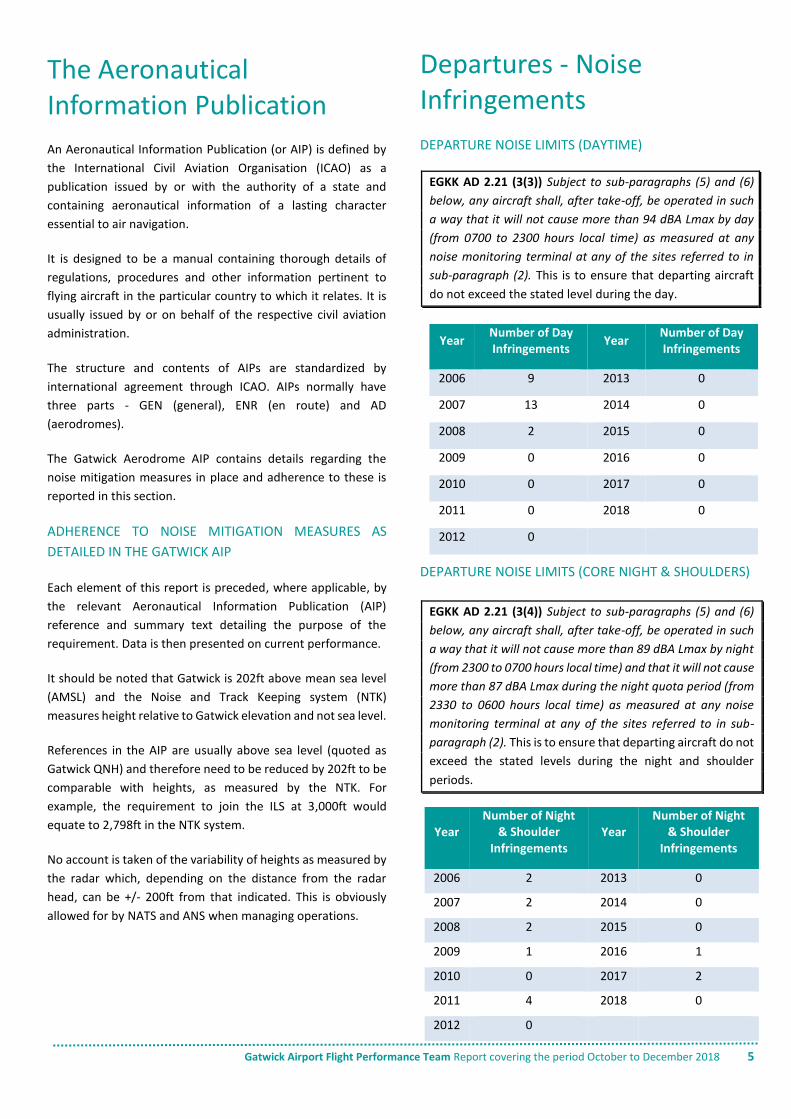
Departures - Noise Infringements
DEPARTURE NOISE LIMITS (DAYTIME)
EGKK AD 2.21 (3(3)) Subject to sub-paragraphs (5) and (6)
below, any aircraft shall, after take-off, be operated in such
a way that it will not cause more than 94 dBA Lmax by day
(from 0700 to 2300 hours local time) as measured at any
noise monitoring terminal at any of the sites referred to in
sub-paragraph (2). This is to ensure that departing aircraft
do not exceed the stated level during the day.
Year Number of Day Infringements
Year Number of Day Infringements
2006 9 2013 0
2007 13 2014 0
2008 2 2015 0
2009 0 2016 0
2010 0 2017 0
2011 0 2018 0
2012 0
DEPARTURE NOISE LIMITS (CORE NIGHT & SHOULDERS)
EGKK AD 2.21 (3(4)) Subject to sub-paragraphs (5) and (6)
below, any aircraft shall, after take-off, be operated in such
a way that it will not cause more than 89 dBA Lmax by night
(from 2300 to 0700 hours local time) and that it will not cause
more than 87 dBA Lmax during the night quota period (from
2330 to 0600 hours local time) as measured at any noise
monitoring terminal at any of the sites referred to in sub-
paragraph (2). This is to ensure that departing aircraft do not
exceed the stated levels during the night and shoulder
periods.
Year Number of Night
& Shoulder Infringements
Year Number of Night
& Shoulder Infringements
2006 2 2013 0
2007 2 2014 0
2008 2 2015 0
2009 1 2016 1
2010 0 2017 2
2011 4 2018 0
2012 0
Gatwick Airport Flight Performance Team Report covering the period October to December 2018 6
Departures - Initial Climb Performance
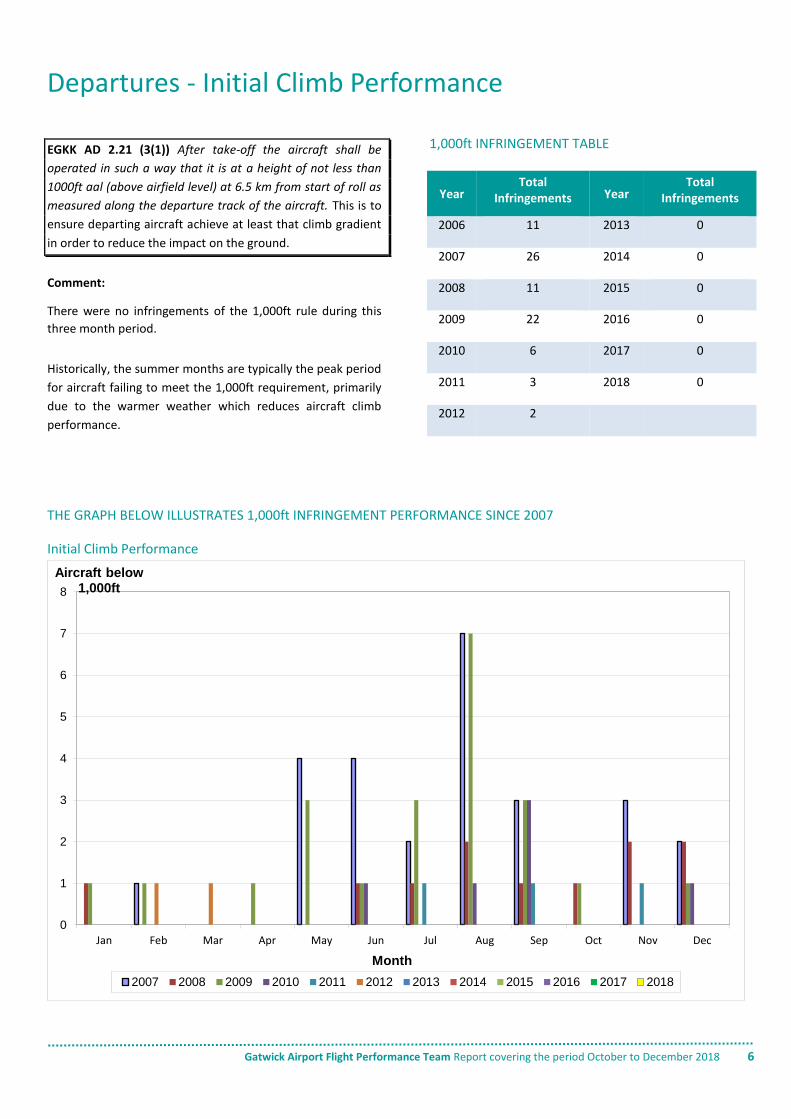
EGKK AD 2.21 (3(1)) After take-off the aircraft shall be
operated in such a way that it is at a height of not less than
1000ft aal (above airfield level) at 6.5 km from start of roll as
measured along the departure track of the aircraft. This is to
ensure departing aircraft achieve at least that climb gradient
in order to reduce the impact on the ground.
Comment:
There were no infringements of the 1,000ft rule during this
three month period.
Historically, the summer months are typically the peak period
for aircraft failing to meet the 1,000ft requirement, primarily
due to the warmer weather which reduces aircraft climb
performance.
1,000ft INFRINGEMENT TABLE
Year Total
Infringements Year Total
Infringements
2006 11 2013 0
2007 26 2014 0
2008 11 2015 0
2009 22 2016 0
2010 6 2017 0
2011 3 2018 0
2012 2
THE GRAPH BELOW ILLUSTRATES 1,000ft INFRINGEMENT PERFORMANCE SINCE 2007
Initial Climb Performance
0
1
2
3
4
5
6
7
8
Jan Feb Mar Apr May Jun Jul Aug Sep Oct Nov Dec
Aircraft below 1,000ft
Month
2007 2008 2009 2010 2011 2012 2013 2014 2015 2016 2017 2018
Gatwick Airport Flight Performance Team Report covering the period October to December 2018 7
Departures – Track Keeping
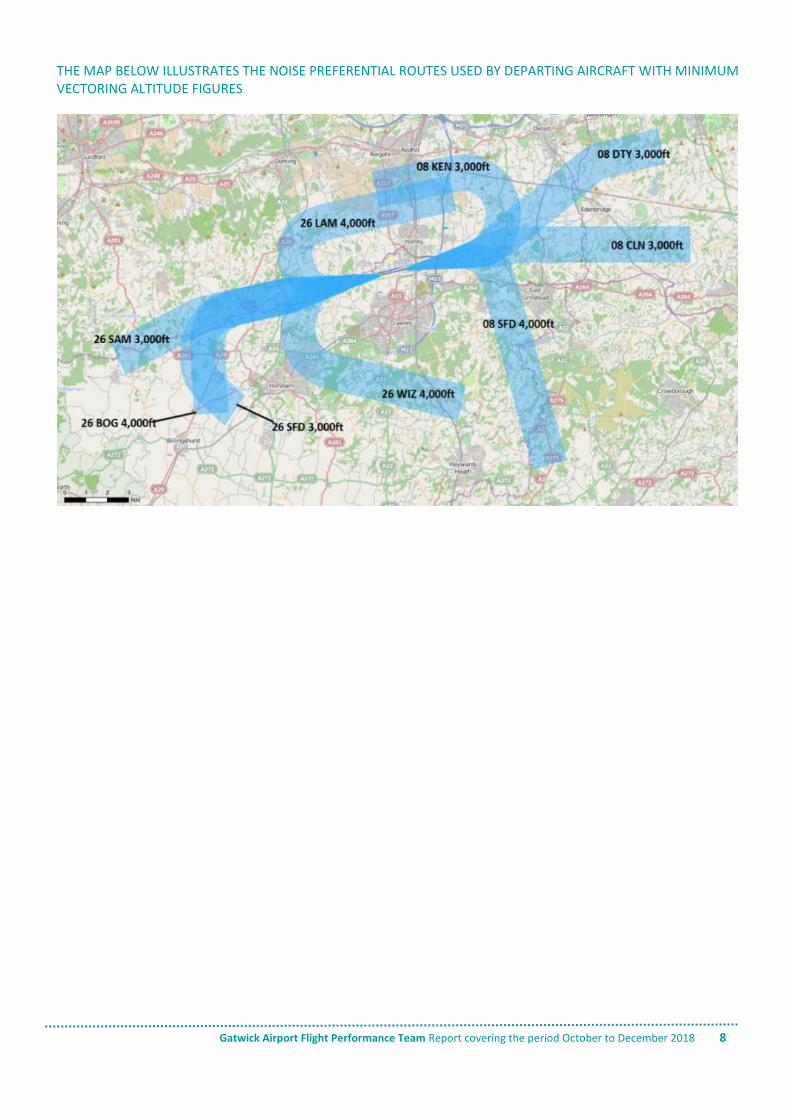
All jet aircraft leaving Gatwick Airport should follow flight
paths known as Noise Preferential Routes (NPR’s) up to a
height of 3,000ft or 4,000ft depending on the route. An NPR
consists of a ‘centreline’ and an associate compliance
monitoring swathe (3km across, i.e. 1.5km either side of the
NPR centreline). As long as aircraft remain within the corridor
boundaries, they are deemed to be on-track. A map
illustrating the Noise Preferential Routes at Gatwick is
available overleaf.
Air Traffic Control (ATC) are responsible for the routing of
aircraft once airborne and when 3,000 or 4,000ft has been
reached, they may give a flight a more direct heading, known
as vectoring, off of the route. This is subject to certain factors,
including weather conditions and other traffic in the vicinity.
Flights leaving the route below the required height are
automatically flagged and details are sent to the airline for
investigation. Our Flight Operations Performance & Safety
Committee (FLOPSC) regularly review track keeping
performance.
In 2012, Gatwick Airport publicly consulted on the
implementation of a more modern form of aircraft navigation
called P-RNAV (Precision Route Navigation). After having
assessed all consultation feedback, the Civil Aviation
Authority (CAA) granted the airport permission to implement
P-RNAV on all of our departure routes. Implementing P-RNAV
on the published departure routes has resulted in the tracks
of departing aircraft being more concentrated within the
boundaries of the current NPR’s, with one exception. This is
the NPR designed 26LAM/Route 4 that heads west then turns
back on itself and passes to the north of the airfield. This route
has always presented a challenge for modern jets as it was
designed to accommodate propeller-driven aircraft and early
jets that were around in the 1960’s.
Implementing P-RNAV on this route required aircraft to fly
outside of the current NPR. Therefore, as approved by the
CAA, aircraft with a P-RNAV departure SID on this route were
not classified as off-track as they were following the published
route.
Following the introduction of P-RNAV at Gatwick Airport, the
CAA conducted a Post Implementation Review (PIR) on all
routes. The Review recommended that this particular route
(Route 4) be modified so that departing aircraft are compliant
and remain within the published NPR swathe. It now requires
all Standard Instrument Departure routes (SID's) to be
counted in the track keeping statistics whereas previously,
the Route 4 P-RNAV SID’s were not included. Following the
PIR and consultation, the CAA concluded that the modified
Route 4 SID’s achieve a satisfactory replication of the nominal
track of the corrected conventional SID and confirmed the P-
RNAV SID designs currently published in the UK Aeronautical
Information Publication (AIP) as permanent.
Following the quashing of the CAA’s April 2017 decision by
consent, Gatwick are working to revert the Route 4
conventional SID’s to their position as they were before 7th
April 2017. In support of this, Gatwick completed a
comprehensive safety review. Following validation by an
independent Instrument Flight Procedure Designer, the
changes were submitted to the CAA for approval in May 2018.
(Note: as previously briefed this will not change the
distribution of traffic).
Route 4 P-RNAV SIDs will remain in place but have reverted
to a temporary status, as was the case prior to the CAA’s
decision in April 2017. A redesign of the Route 4 P-RNAV SIDs
will be necessary through the development of a new Route 4
airspace change proposal. We expect these changes to be
introduced by the end of the year following the necessary
changes to air traffic control systems and aeronautical
publications. This is subject to CAA resource availability.
The airport is focused on following the correct procedure
taking into account the various relevant factors to achieve an
end result as soon as possible. This required rigorous legal
process and does however mean that a final outcome is likely
to take up to two years to achieve. An airspace change
proposal will be developed in due course and will be
consulted widely so communities will have the opportunity to
contribute and influence.
There has also been a modification to our 08CLN/Route 5 NPR
which has been in place since the 30th March 2017, as advised
by the CAA. Previously, aircraft were flying slightly to the
south of the NPR centreline and this modification aims to
better replicate the existing conventional SID route and bring
aircraft back towards the centre. This was monitored by the
CAA for a six month period until the 30th September 2017 to
ensure the aircraft were operating as anticipated. Gatwick is
awaiting a decision from the CAA regarding its status.
Gatwick Airport Flight Performance Team Report covering the period October to December 2018 8
THE MAP BELOW ILLUSTRATES THE NOISE PREFERENTIAL ROUTES USED BY DEPARTING AIRCRAFT WITH MINIMUM VECTORING ALTITUDE FIGURES
Gatwick Airport Flight Performance Team Report covering the period October to December 2018 9
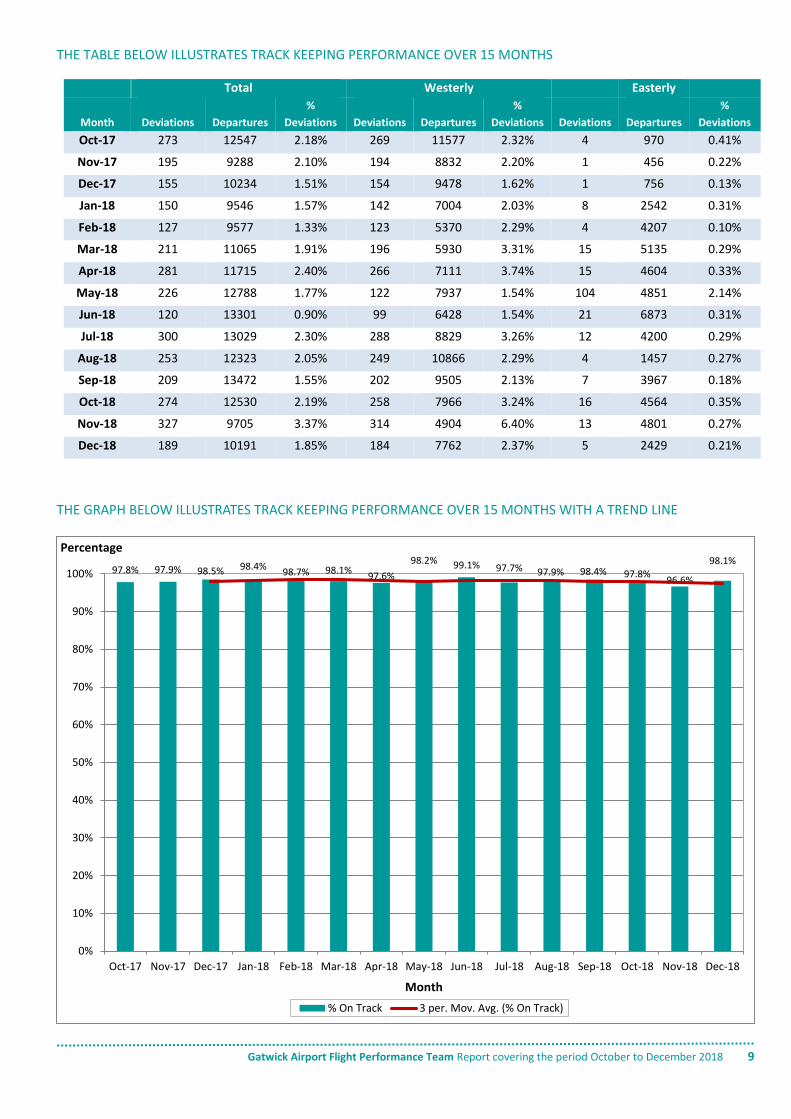
THE TABLE BELOW ILLUSTRATES TRACK KEEPING PERFORMANCE OVER 15 MONTHS
Total Westerly Easterly
Month Deviations Departures
%
Deviations Deviations Departures
%
Deviations Deviations Departures
%
Deviations
Oct-17 273 12547 2.18% 269 11577 2.32% 4 970 0.41%
Nov-17 195 9288 2.10% 194 8832 2.20% 1 456 0.22%
Dec-17 155 10234 1.51% 154 9478 1.62% 1 756 0.13%
Jan-18 150 9546 1.57% 142 7004 2.03% 8 2542 0.31%
Feb-18 127 9577 1.33% 123 5370 2.29% 4 4207 0.10%
Mar-18 211 11065 1.91% 196 5930 3.31% 15 5135 0.29%
Apr-18 281 11715 2.40% 266 7111 3.74% 15 4604 0.33%
May-18 226 12788 1.77% 122 7937 1.54% 104 4851 2.14%
Jun-18 120 13301 0.90% 99 6428 1.54% 21 6873 0.31%
Jul-18 300 13029 2.30% 288 8829 3.26% 12 4200 0.29%
Aug-18 253 12323 2.05% 249 10866 2.29% 4 1457 0.27%
Sep-18 209 13472 1.55% 202 9505 2.13% 7 3967 0.18%
Oct-18 274 12530 2.19% 258 7966 3.24% 16 4564 0.35%
Nov-18 327 9705 3.37% 314 4904 6.40% 13 4801 0.27%
Dec-18 189 10191 1.85% 184 7762 2.37% 5 2429 0.21%
THE GRAPH BELOW ILLUSTRATES TRACK KEEPING PERFORMANCE OVER 15 MONTHS WITH A TREND LINE
97.8% 97.9% 98.5% 98.4%98.7% 98.1%
97.6%
98.2% 99.1% 97.7% 97.9% 98.4% 97.8%96.6%
98.1%
0%
10%
20%
30%
40%
50%
60%
70%
80%
90%
100%
Oct-17 Nov-17 Dec-17 Jan-18 Feb-18 Mar-18 Apr-18 May-18 Jun-18 Jul-18 Aug-18 Sep-18 Oct-18 Nov-18 Dec-18
Percentage
Month
% On Track 3 per. Mov. Avg. (% On Track)
Gatwick Airport Flight Performance Team Report covering the period October to December 2018 10
UNUSUAL TRACKS
Some ‘unusual tracks’ taken by departing aircraft are recorded by our Noise and Track Keeping system and these can occur for a
number of reasons, such as weather avoidance. These can result in the aircraft leaving the NPR below the required altitude or
aircraft that have vectored at the required altitude and then misdirected to avoid conflict with traffic from other airports. All
unusual tracks are investigated with the airline concerned.
Comment: During this three month period, there were no unusual tracks identified.
Gatwick Airport Flight Performance Team Report covering the period October to December 2018 11
Departures – Over Congested Areas
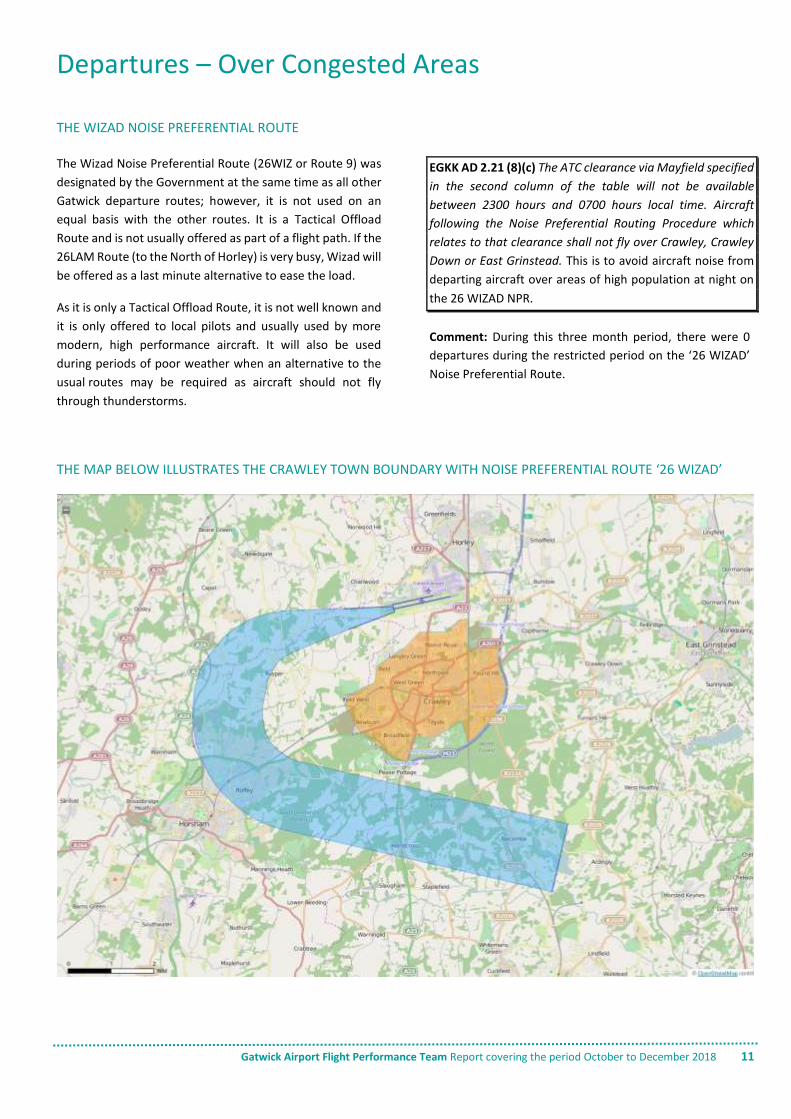
THE WIZAD NOISE PREFERENTIAL ROUTE
The Wizad Noise Preferential Route (26WIZ or Route 9) was
designated by the Government at the same time as all other
Gatwick departure routes; however, it is not used on an
equal basis with the other routes. It is a Tactical Offload
Route and is not usually offered as part of a flight path. If the
26LAM Route (to the North of Horley) is very busy, Wizad will
be offered as a last minute alternative to ease the load.
As it is only a Tactical Offload Route, it is not well known and
it is only offered to local pilots and usually used by more
modern, high performance aircraft. It will also be used
during periods of poor weather when an alternative to the
usual routes may be required as aircraft should not fly
through thunderstorms.
EGKK AD 2.21 (8)(c) The ATC clearance via Mayfield specified
in the second column of the table will not be available
between 2300 hours and 0700 hours local time. Aircraft
following the Noise Preferential Routing Procedure which
relates to that clearance shall not fly over Crawley, Crawley
Down or East Grinstead. This is to avoid aircraft noise from
departing aircraft over areas of high population at night on
the 26 WIZAD NPR.
Comment: During this three month period, there were 0
departures during the restricted period on the ‘26 WIZAD’
Noise Preferential Route.
THE MAP BELOW ILLUSTRATES THE CRAWLEY TOWN BOUNDARY WITH NOISE PREFERENTIAL ROUTE ‘26 WIZAD’
Gatwick Airport Flight Performance Team Report covering the period October to December 2018 12
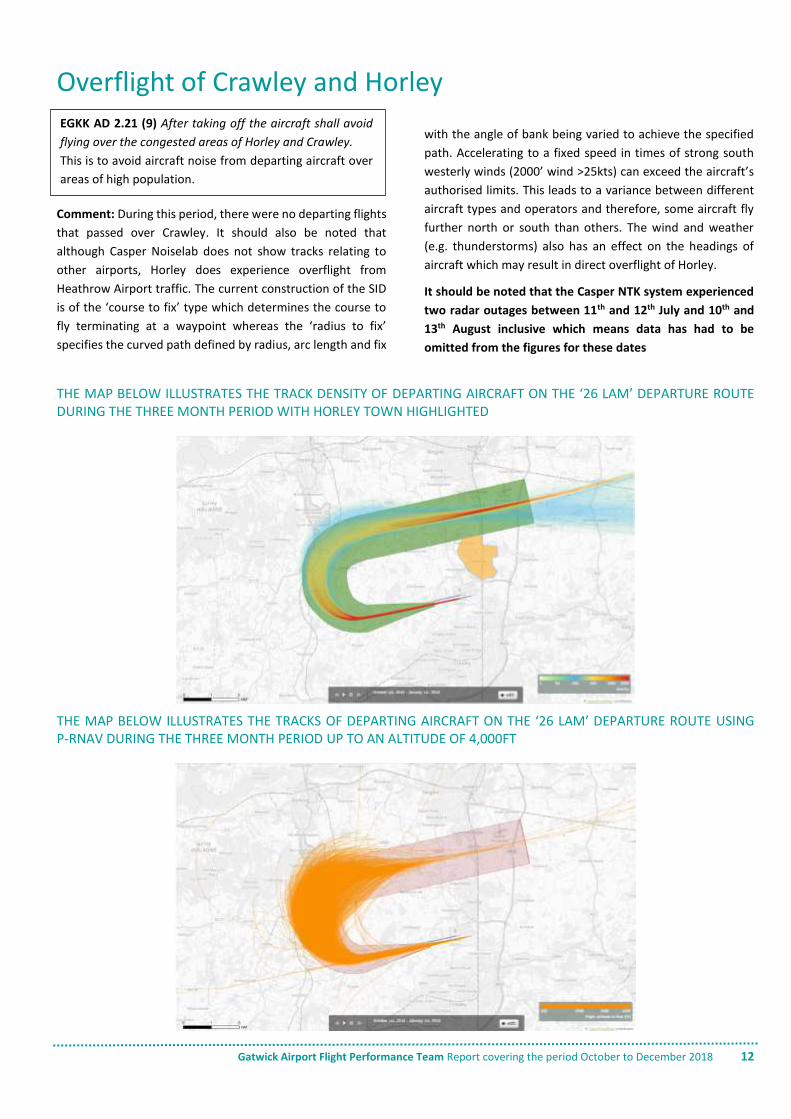
Overflight of Crawley and Horley
Comment: During this period, there were no departing flights
that passed over Crawley. It should also be noted that
although Casper Noiselab does not show tracks relating to
other airports, Horley does experience overflight from
Heathrow Airport traffic. The current construction of the SID
is of the ‘course to fix’ type which determines the course to
fly terminating at a waypoint whereas the ‘radius to fix’
specifies the curved path defined by radius, arc length and fix
with the angle of bank being varied to achieve the specified
path. Accelerating to a fixed speed in times of strong south
westerly winds (2000’ wind >25kts) can exceed the aircraft’s
authorised limits. This leads to a variance between different
aircraft types and operators and therefore, some aircraft fly
further north or south than others. The wind and weather
(e.g. thunderstorms) also has an effect on the headings of
aircraft which may result in direct overflight of Horley.
It should be noted that the Casper NTK system experienced
two radar outages between 11th and 12th July and 10th and
13th August inclusive which means data has had to be
omitted from the figures for these dates
THE MAP BELOW ILLUSTRATES THE TRACK DENSITY OF DEPARTING AIRCRAFT ON THE ‘26 LAM’ DEPARTURE ROUTE DURING THE THREE MONTH PERIOD WITH HORLEY TOWN HIGHLIGHTED
THE MAP BELOW ILLUSTRATES THE TRACKS OF DEPARTING AIRCRAFT ON THE ‘26 LAM’ DEPARTURE ROUTE USING P-RNAV DURING THE THREE MONTH PERIOD UP TO AN ALTITUDE OF 4,000FT
EGKK AD 2.21 (9) After taking off the aircraft shall avoid
flying over the congested areas of Horley and Crawley.
This is to avoid aircraft noise from departing aircraft over
areas of high population.
Gatwick Airport Flight Performance Team Report covering the period October to December 2018 13
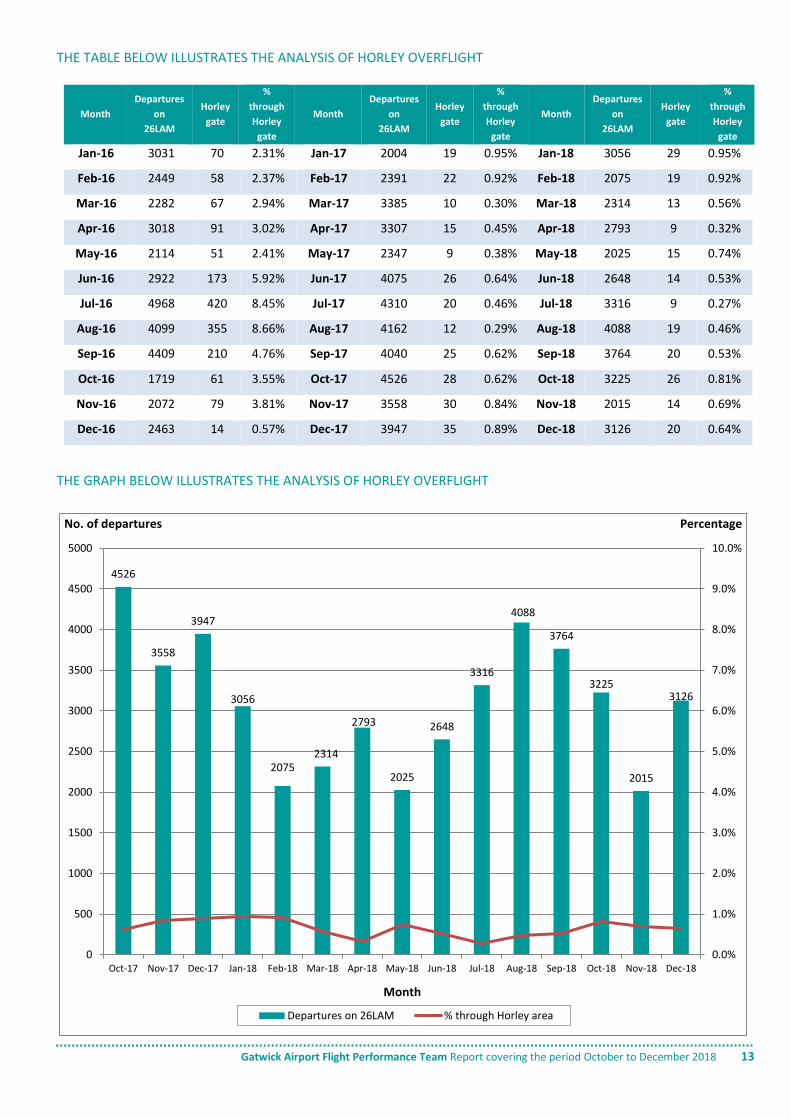
THE TABLE BELOW ILLUSTRATES THE ANALYSIS OF HORLEY OVERFLIGHT
Month
Departures
on
26LAM
Horley
gate
%
through
Horley
gate
Month
Departures
on
26LAM
Horley
gate
%
through
Horley
gate
Month
Departures
on
26LAM
Horley
gate
%
through
Horley
gate
Jan-16 3031 70 2.31% Jan-17 2004 19 0.95% Jan-18 3056 29 0.95%
Feb-16 2449 58 2.37% Feb-17 2391 22 0.92% Feb-18 2075 19 0.92%
Mar-16 2282 67 2.94% Mar-17 3385 10 0.30% Mar-18 2314 13 0.56%
Apr-16 3018 91 3.02% Apr-17 3307 15 0.45% Apr-18 2793 9 0.32%
May-16 2114 51 2.41% May-17 2347 9 0.38% May-18 2025 15 0.74%
Jun-16 2922 173 5.92% Jun-17 4075 26 0.64% Jun-18 2648 14 0.53%
Jul-16 4968 420 8.45% Jul-17 4310 20 0.46% Jul-18 3316 9 0.27%
Aug-16 4099 355 8.66% Aug-17 4162 12 0.29% Aug-18 4088 19 0.46%
Sep-16 4409 210 4.76% Sep-17 4040 25 0.62% Sep-18 3764 20 0.53%
Oct-16 1719 61 3.55% Oct-17 4526 28 0.62% Oct-18 3225 26 0.81%
Nov-16 2072 79 3.81% Nov-17 3558 30 0.84% Nov-18 2015 14 0.69%
Dec-16 2463 14 0.57% Dec-17 3947 35 0.89% Dec-18 3126 20 0.64%
THE GRAPH BELOW ILLUSTRATES THE ANALYSIS OF HORLEY OVERFLIGHT
4526
3558
3947
3056
20752314
2793
2025
2648
3316
4088
3764
3225
2015
3126
0.0%
1.0%
2.0%
3.0%
4.0%
5.0%
6.0%
7.0%
8.0%
9.0%
10.0%
0
500
1000
1500
2000
2500
3000
3500
4000
4500
5000
Oct-17 Nov-17 Dec-17 Jan-18 Feb-18 Mar-18 Apr-18 May-18 Jun-18 Jul-18 Aug-18 Sep-18 Oct-18 Nov-18 Dec-18
PercentageNo. of departures
Month
Departures on 26LAM % through Horley area
Gatwick Airport Flight Performance Team Report covering the period October to December 2018 14
Arrivals – Continuous Descent Operations (CDO)
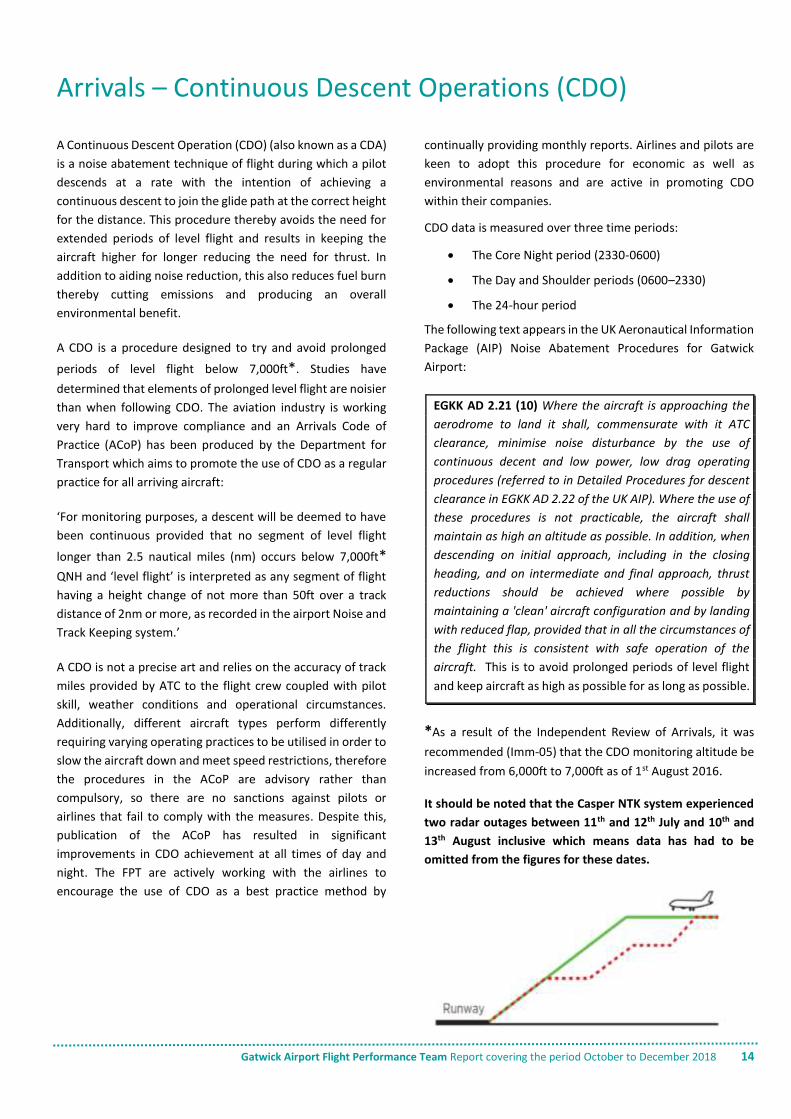
A Continuous Descent Operation (CDO) (also known as a CDA)
is a noise abatement technique of flight during which a pilot
descends at a rate with the intention of achieving a
continuous descent to join the glide path at the correct height
for the distance. This procedure thereby avoids the need for
extended periods of level flight and results in keeping the
aircraft higher for longer reducing the need for thrust. In
addition to aiding noise reduction, this also reduces fuel burn
thereby cutting emissions and producing an overall
environmental benefit.
A CDO is a procedure designed to try and avoid prolonged
periods of level flight below 7,000ft*. Studies have
determined that elements of prolonged level flight are noisier
than when following CDO. The aviation industry is working
very hard to improve compliance and an Arrivals Code of
Practice (ACoP) has been produced by the Department for
Transport which aims to promote the use of CDO as a regular
practice for all arriving aircraft:
‘For monitoring purposes, a descent will be deemed to have
been continuous provided that no segment of level flight
longer than 2.5 nautical miles (nm) occurs below 7,000ft*
QNH and ‘level flight’ is interpreted as any segment of flight
having a height change of not more than 50ft over a track
distance of 2nm or more, as recorded in the airport Noise and
Track Keeping system.’
A CDO is not a precise art and relies on the accuracy of track
miles provided by ATC to the flight crew coupled with pilot
skill, weather conditions and operational circumstances.
Additionally, different aircraft types perform differently
requiring varying operating practices to be utilised in order to
slow the aircraft down and meet speed restrictions, therefore
the procedures in the ACoP are advisory rather than
compulsory, so there are no sanctions against pilots or
airlines that fail to comply with the measures. Despite this,
publication of the ACoP has resulted in significant
improvements in CDO achievement at all times of day and
night. The FPT are actively working with the airlines to
encourage the use of CDO as a best practice method by
continually providing monthly reports. Airlines and pilots are
keen to adopt this procedure for economic as well as
environmental reasons and are active in promoting CDO
within their companies.
CDO data is measured over three time periods:
The Core Night period (2330-0600)
The Day and Shoulder periods (0600–2330)
The 24-hour period
The following text appears in the UK Aeronautical Information
Package (AIP) Noise Abatement Procedures for Gatwick
Airport:
EGKK AD 2.21 (10) Where the aircraft is approaching the
aerodrome to land it shall, commensurate with it ATC
clearance, minimise noise disturbance by the use of
continuous decent and low power, low drag operating
procedures (referred to in Detailed Procedures for descent
clearance in EGKK AD 2.22 of the UK AIP). Where the use of
these procedures is not practicable, the aircraft shall
maintain as high an altitude as possible. In addition, when
descending on initial approach, including in the closing
heading, and on intermediate and final approach, thrust
reductions should be achieved where possible by
maintaining a 'clean' aircraft configuration and by landing
with reduced flap, provided that in all the circumstances of
the flight this is consistent with safe operation of the
aircraft. This is to avoid prolonged periods of level flight
and keep aircraft as high as possible for as long as possible.
*As a result of the Independent Review of Arrivals, it was
recommended (Imm-05) that the CDO monitoring altitude be
increased from 6,000ft to 7,000ft as of 1st August 2016.
It should be noted that the Casper NTK system experienced
two radar outages between 11th and 12th July and 10th and
13th August inclusive which means data has had to be
omitted from the figures for these dates.
Gatwick Airport Flight Performance Team Report covering the period October to December 2018 15
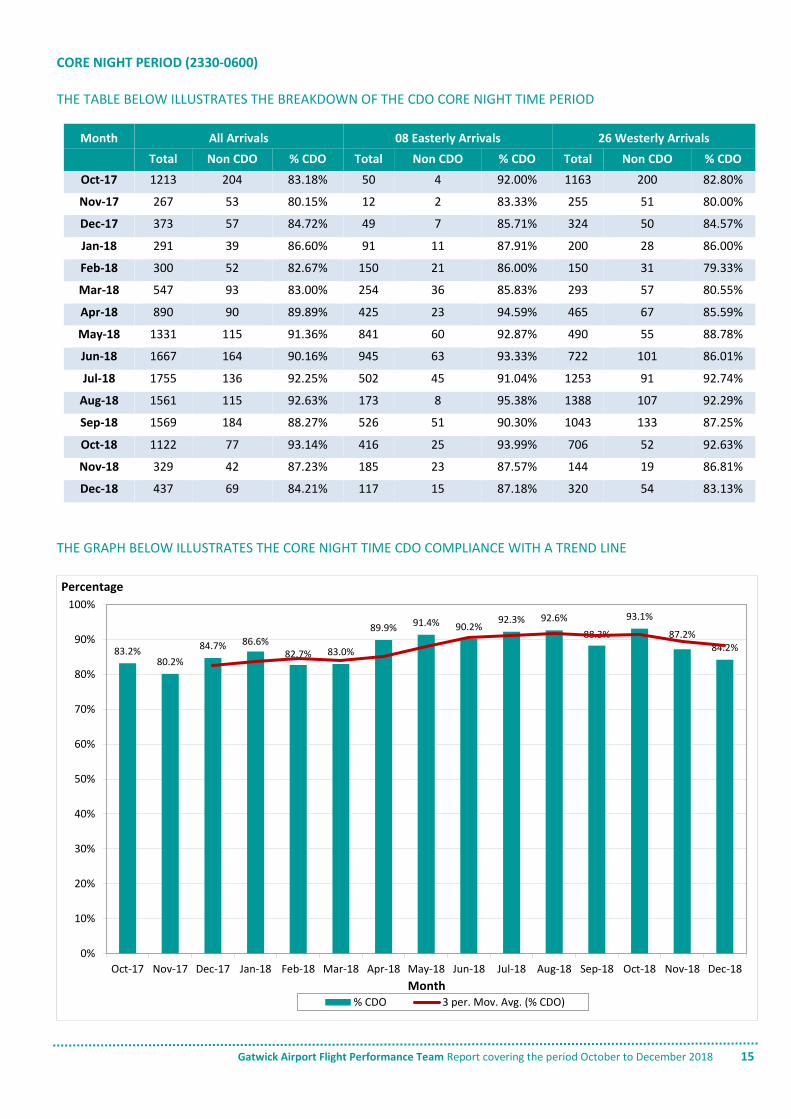
CORE NIGHT PERIOD (2330-0600)
THE TABLE BELOW ILLUSTRATES THE BREAKDOWN OF THE CDO CORE NIGHT TIME PERIOD
Month All Arrivals 08 Easterly Arrivals 26 Westerly Arrivals
Total Non CDO % CDO Total Non CDO % CDO Total Non CDO % CDO
Oct-17 1213 204 83.18% 50 4 92.00% 1163 200 82.80%
Nov-17 267 53 80.15% 12 2 83.33% 255 51 80.00%
Dec-17 373 57 84.72% 49 7 85.71% 324 50 84.57%
Jan-18 291 39 86.60% 91 11 87.91% 200 28 86.00%
Feb-18 300 52 82.67% 150 21 86.00% 150 31 79.33%
Mar-18 547 93 83.00% 254 36 85.83% 293 57 80.55%
Apr-18 890 90 89.89% 425 23 94.59% 465 67 85.59%
May-18 1331 115 91.36% 841 60 92.87% 490 55 88.78%
Jun-18 1667 164 90.16% 945 63 93.33% 722 101 86.01%
Jul-18 1755 136 92.25% 502 45 91.04% 1253 91 92.74%
Aug-18 1561 115 92.63% 173 8 95.38% 1388 107 92.29%
Sep-18 1569 184 88.27% 526 51 90.30% 1043 133 87.25%
Oct-18 1122 77 93.14% 416 25 93.99% 706 52 92.63%
Nov-18 329 42 87.23% 185 23 87.57% 144 19 86.81%
Dec-18 437 69 84.21% 117 15 87.18% 320 54 83.13%
THE GRAPH BELOW ILLUSTRATES THE CORE NIGHT TIME CDO COMPLIANCE WITH A TREND LINE
83.2%80.2%
84.7% 86.6%82.7% 83.0%
89.9% 91.4% 90.2%92.3% 92.6%
88.3%
93.1%
87.2%84.2%
0%
10%
20%
30%
40%
50%
60%
70%
80%
90%
100%
Oct-17 Nov-17 Dec-17 Jan-18 Feb-18 Mar-18 Apr-18 May-18 Jun-18 Jul-18 Aug-18 Sep-18 Oct-18 Nov-18 Dec-18
Percentage
Month% CDO 3 per. Mov. Avg. (% CDO)
Gatwick Airport Flight Performance Team Report covering the period October to December 2018 16
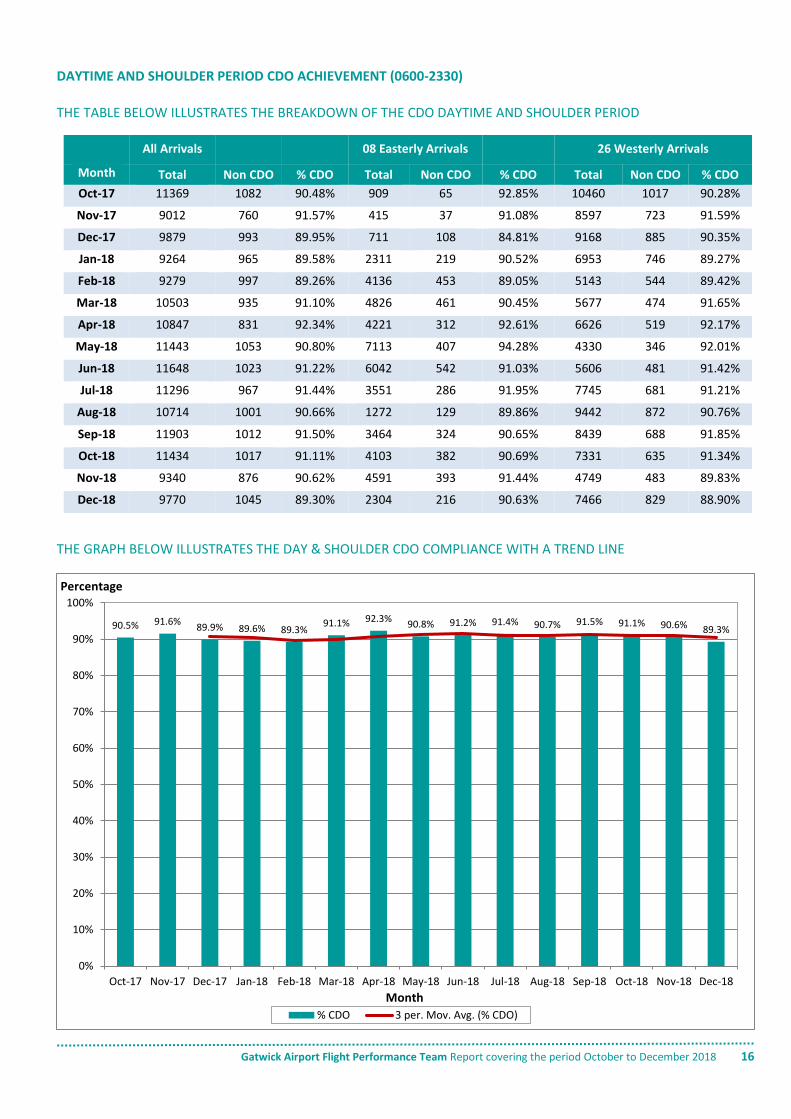
DAYTIME AND SHOULDER PERIOD CDO ACHIEVEMENT (0600-2330)
THE TABLE BELOW ILLUSTRATES THE BREAKDOWN OF THE CDO DAYTIME AND SHOULDER PERIOD
THE GRAPH BELOW ILLUSTRATES THE DAY & SHOULDER CDO COMPLIANCE WITH A TREND LINE
90.5% 91.6%89.9% 89.6% 89.3%
91.1% 92.3%90.8% 91.2% 91.4% 90.7% 91.5% 91.1% 90.6% 89.3%
0%
10%
20%
30%
40%
50%
60%
70%
80%
90%
100%
Oct-17 Nov-17 Dec-17 Jan-18 Feb-18 Mar-18 Apr-18 May-18 Jun-18 Jul-18 Aug-18 Sep-18 Oct-18 Nov-18 Dec-18
Percentage
Month
% CDO 3 per. Mov. Avg. (% CDO)
All Arrivals 08 Easterly Arrivals 26 Westerly Arrivals
Month Total Non CDO % CDO Total Non CDO % CDO Total Non CDO % CDO
Oct-17 11369 1082 90.48% 909 65 92.85% 10460 1017 90.28%
Nov-17 9012 760 91.57% 415 37 91.08% 8597 723 91.59%
Dec-17 9879 993 89.95% 711 108 84.81% 9168 885 90.35%
Jan-18 9264 965 89.58% 2311 219 90.52% 6953 746 89.27%
Feb-18 9279 997 89.26% 4136 453 89.05% 5143 544 89.42%
Mar-18 10503 935 91.10% 4826 461 90.45% 5677 474 91.65%
Apr-18 10847 831 92.34% 4221 312 92.61% 6626 519 92.17%
May-18 11443 1053 90.80% 7113 407 94.28% 4330 346 92.01%
Jun-18 11648 1023 91.22% 6042 542 91.03% 5606 481 91.42%
Jul-18 11296 967 91.44% 3551 286 91.95% 7745 681 91.21%
Aug-18 10714 1001 90.66% 1272 129 89.86% 9442 872 90.76%
Sep-18 11903 1012 91.50% 3464 324 90.65% 8439 688 91.85%
Oct-18 11434 1017 91.11% 4103 382 90.69% 7331 635 91.34%
Nov-18 9340 876 90.62% 4591 393 91.44% 4749 483 89.83%
Dec-18 9770 1045 89.30% 2304 216 90.63% 7466 829 88.90%
Gatwick Airport Flight Performance Team Report covering the period October to December 2018 17
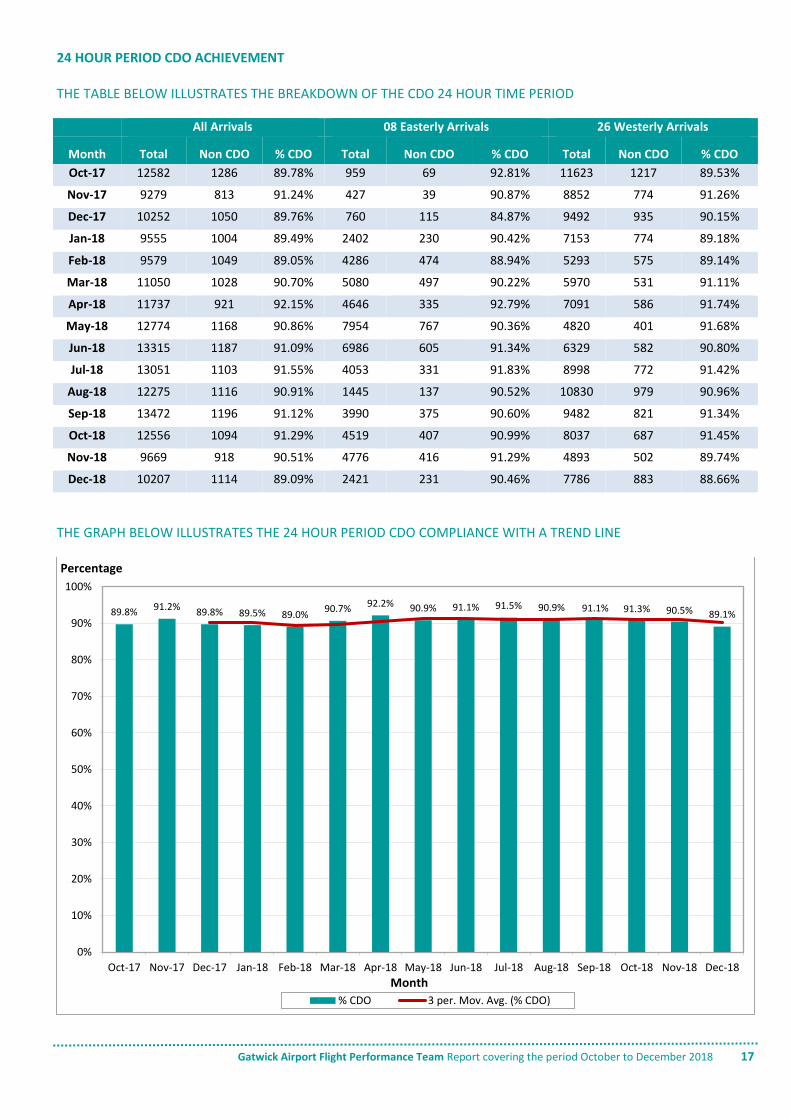
24 HOUR PERIOD CDO ACHIEVEMENT THE TABLE BELOW ILLUSTRATES THE BREAKDOWN OF THE CDO 24 HOUR TIME PERIOD
All Arrivals 08 Easterly Arrivals 26 Westerly Arrivals
Month Total Non CDO % CDO Total Non CDO % CDO Total Non CDO % CDO
Oct-17 12582 1286 89.78% 959 69 92.81% 11623 1217 89.53%
Nov-17 9279 813 91.24% 427 39 90.87% 8852 774 91.26%
Dec-17 10252 1050 89.76% 760 115 84.87% 9492 935 90.15%
Jan-18 9555 1004 89.49% 2402 230 90.42% 7153 774 89.18%
Feb-18 9579 1049 89.05% 4286 474 88.94% 5293 575 89.14%
Mar-18 11050 1028 90.70% 5080 497 90.22% 5970 531 91.11%
Apr-18 11737 921 92.15% 4646 335 92.79% 7091 586 91.74%
May-18 12774 1168 90.86% 7954 767 90.36% 4820 401 91.68%
Jun-18 13315 1187 91.09% 6986 605 91.34% 6329 582 90.80%
Jul-18 13051 1103 91.55% 4053 331 91.83% 8998 772 91.42%
Aug-18 12275 1116 90.91% 1445 137 90.52% 10830 979 90.96%
Sep-18 13472 1196 91.12% 3990 375 90.60% 9482 821 91.34%
Oct-18 12556 1094 91.29% 4519 407 90.99% 8037 687 91.45%
Nov-18 9669 918 90.51% 4776 416 91.29% 4893 502 89.74%
Dec-18 10207 1114 89.09% 2421 231 90.46% 7786 883 88.66%
THE GRAPH BELOW ILLUSTRATES THE 24 HOUR PERIOD CDO COMPLIANCE WITH A TREND LINE
89.8% 91.2%89.8% 89.5% 89.0%
90.7% 92.2% 90.9% 91.1% 91.5% 90.9% 91.1% 91.3% 90.5% 89.1%
0%
10%
20%
30%
40%
50%
60%
70%
80%
90%
100%
Oct-17 Nov-17 Dec-17 Jan-18 Feb-18 Mar-18 Apr-18 May-18 Jun-18 Jul-18 Aug-18 Sep-18 Oct-18 Nov-18 Dec-18
Percentage
Month
% CDO 3 per. Mov. Avg. (% CDO)
Gatwick Airport Flight Performance Team Report covering the period October to December 2018 18
Arrivals – Over Congested Areas
OVERFLIGHT OF CONGESTED AREAS
Comment: There were no arriving flights which passed over
the towns of Crawley, Horley or East Grinstead other than a
small number of go-arounds. The map overleaf illustrates
these analysis zones. A polygon located over the urban area
at about 7 nautical miles (nm) from touchdown is normally
used to analyse tracks over the Lingfield area.
During the analysis period, there were a total of 66 arrivals
that passed through this area. Aircraft tracks were analysed
for October, November and December 2018 and there were
no flights which passed over Lingfield below the altitude of
1,698ft (2,000ft Gatwick QNH).
It should be noted that the Casper NTK system experienced
two radar outages between 11th and 12th July and between
10th and 13th August inclusive which means data has had to
be omitted from the figures for these dates.
AD 2-EGKK1-12 (11) Before landing at the aerodrome the
aircraft shall maintain as high an altitude as practicable
and shall not fly over the congested areas of Crawley, East
Grinstead, Horley and Horsham at an altitude of less than
3,000ft (Gatwick QNH) nor over the congested area of
Lingfield at an altitude of less than 2,000ft (Gatwick QNH).
N.B. 2,000ft – (202ft (airfield elevation) + 100ft (radar/ILS tolerance)) = 1,698ft on Airports Noise & Aircraft Tracking System
Gatwick Airport Flight Performance Team Report covering the period October to December 2018 19
A) DAY TIME JOINING HEIGHT (0700-2300)
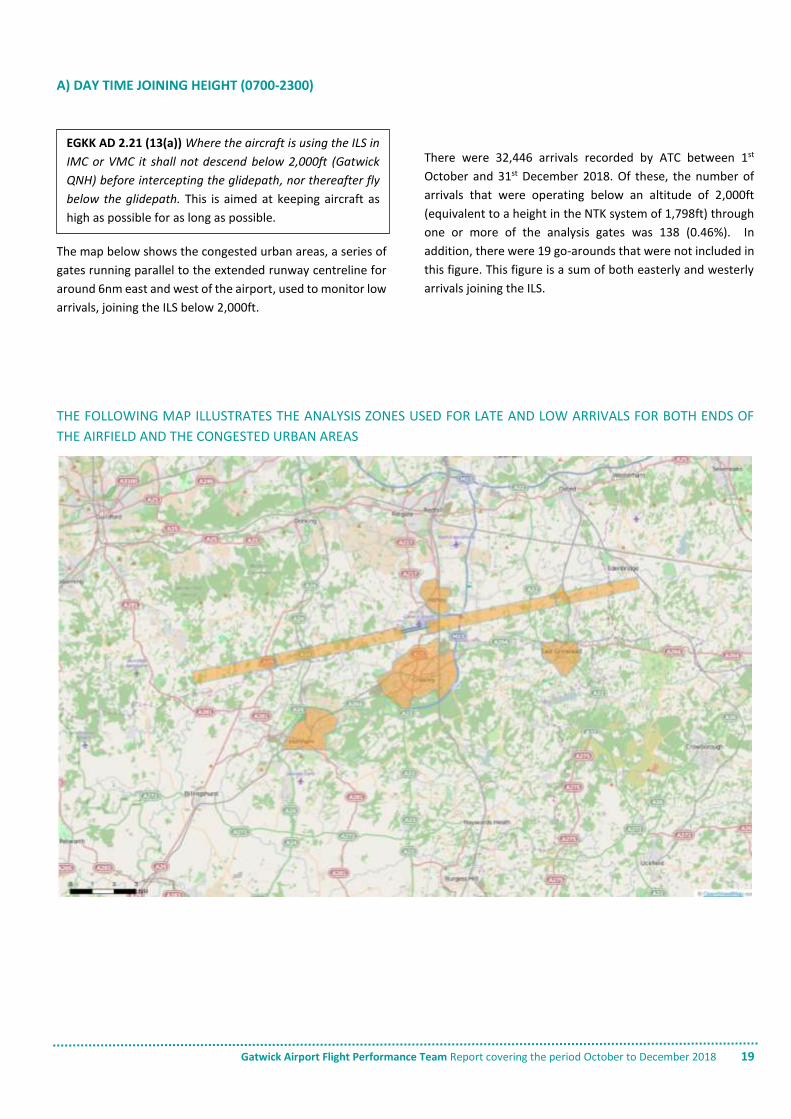
The map below shows the congested urban areas, a series of
gates running parallel to the extended runway centreline for
around 6nm east and west of the airport, used to monitor low
arrivals, joining the ILS below 2,000ft.
There were 32,446 arrivals recorded by ATC between 1st
October and 31st December 2018. Of these, the number of
arrivals that were operating below an altitude of 2,000ft
(equivalent to a height in the NTK system of 1,798ft) through
one or more of the analysis gates was 138 (0.46%). In
addition, there were 19 go-arounds that were not included in
this figure. This figure is a sum of both easterly and westerly
arrivals joining the ILS.
THE FOLLOWING MAP ILLUSTRATES THE ANALYSIS ZONES USED FOR LATE AND LOW ARRIVALS FOR BOTH ENDS OF
THE AIRFIELD AND THE CONGESTED URBAN AREAS
EGKK AD 2.21 (13(a)) Where the aircraft is using the ILS in
IMC or VMC it shall not descend below 2,000ft (Gatwick
QNH) before intercepting the glidepath, nor thereafter fly
below the glidepath. This is aimed at keeping aircraft as
high as possible for as long as possible.
Gatwick Airport Flight Performance Team Report covering the period October to December 2018 20
B) NIGHT TIME JOINING HEIGHT AND DISTANCE (2300-0700)
During the standby runway operations, usually during the
night period during maintenance of the main runway, as the
threshold is in a different location that the main runway, a
different radar map is used for the extended centreline, so
the 10 nautical mile (nm) marker is in a slightly different
location. As we are complying with 10nm on the standby
runway, this may be flagged as a join inside 10nm on the
main runway. This means the percentage joining below
10nm may be slightly higher in recent months as there has
been an increased use of standby runway operations at
night.
It should be noted that the Casper NTK system experienced
two radar outages between 11th and 12th July and 10th and
13th August inclusive which means data has had to be
omitted from the figures for these dates.
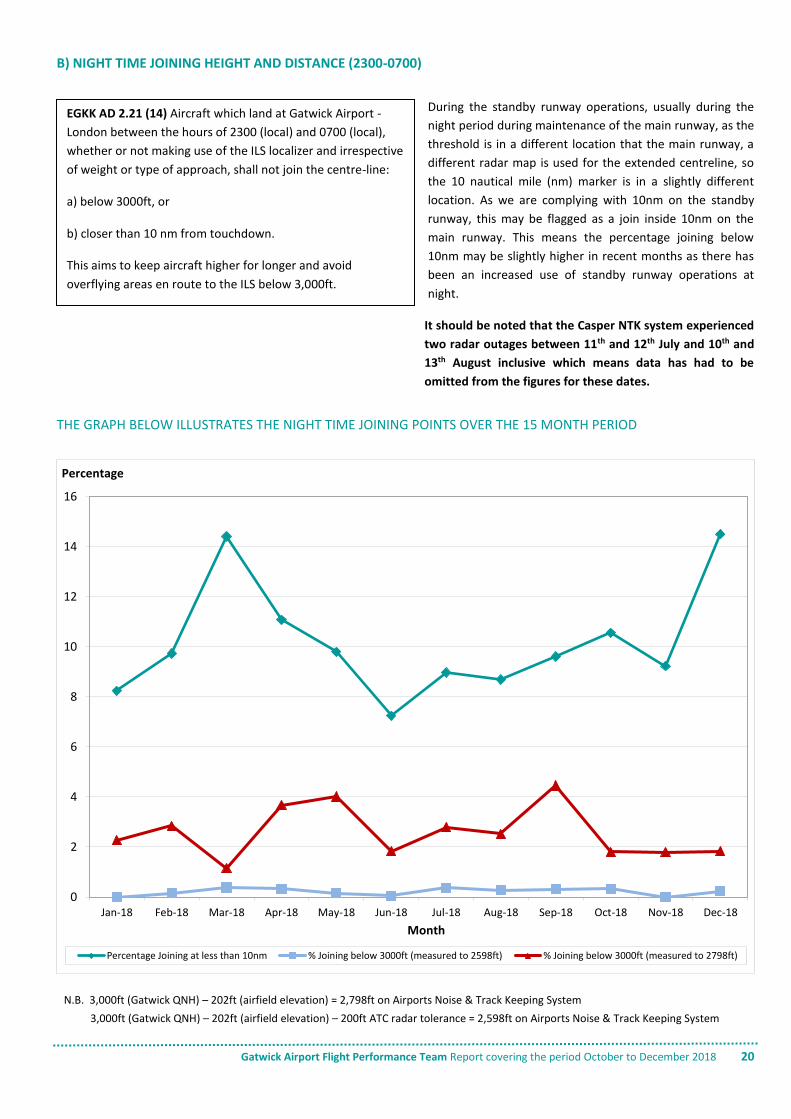
THE GRAPH BELOW ILLUSTRATES THE NIGHT TIME JOINING POINTS OVER THE 15 MONTH PERIOD
N.B. 3,000ft (Gatwick QNH) – 202ft (airfield elevation) = 2,798ft on Airports Noise & Track Keeping System
3,000ft (Gatwick QNH) – 202ft (airfield elevation) – 200ft ATC radar tolerance = 2,598ft on Airports Noise & Track Keeping System
0
2
4
6
8
10
12
14
16
Jan-18 Feb-18 Mar-18 Apr-18 May-18 Jun-18 Jul-18 Aug-18 Sep-18 Oct-18 Nov-18 Dec-18
Percentage
Month
Percentage Joining at less than 10nm % Joining below 3000ft (measured to 2598ft) % Joining below 3000ft (measured to 2798ft)
EGKK AD 2.21 (14) Aircraft which land at Gatwick Airport -
London between the hours of 2300 (local) and 0700 (local),
whether or not making use of the ILS localizer and irrespective
of weight or type of approach, shall not join the centre-line:
a) below 3000ft, or
b) closer than 10 nm from touchdown.
This aims to keep aircraft higher for longer and avoid
overflying areas en route to the ILS below 3,000ft.
Gatwick Airport Flight Performance Team Report covering the period October to December 2018 21
Go-Around Statistics 2004 - 2018 A go-around is a procedure adopted when an arriving aircraft
on final approach aborts landing by applying take-off power
and climbing away from the airport. It is a set procedure to be
followed by the flight crew in the event of an aircraft being
unable to land. The procedure is published so that Air Traffic
Control (ATC) and the pilots can anticipate where the aircraft
will go following the decision to go-around.
The standard missed approach procedure applicable to
Gatwick Airport requires aircraft that are aborting their
approach to climb to 3,000ft straight ahead, then, on passing
2,000ft or 1DME (distance measuring equipment) (whichever
is later), turn heading 180. This may or may not result in
aircraft overflying the town of Crawley or outlying areas.
The number and reasons for go-arounds are routinely
discussed at FLOPSC meetings and Pilot Forums. All parties
are focussed on minimising the number of occasions when a
go-around is required, but expect some to occur given the
fact that Gatwick is a busy single runway airport.
It should be stated that there are well established standard
procedures which both pilots and controllers are trained in
and are familiar with. Gatwick Airport Limited, as the airport
operator, actively encourages airlines operating at the
airport to fly to the best possible environmental standards;
however, safety must and always will be the number one
priority.
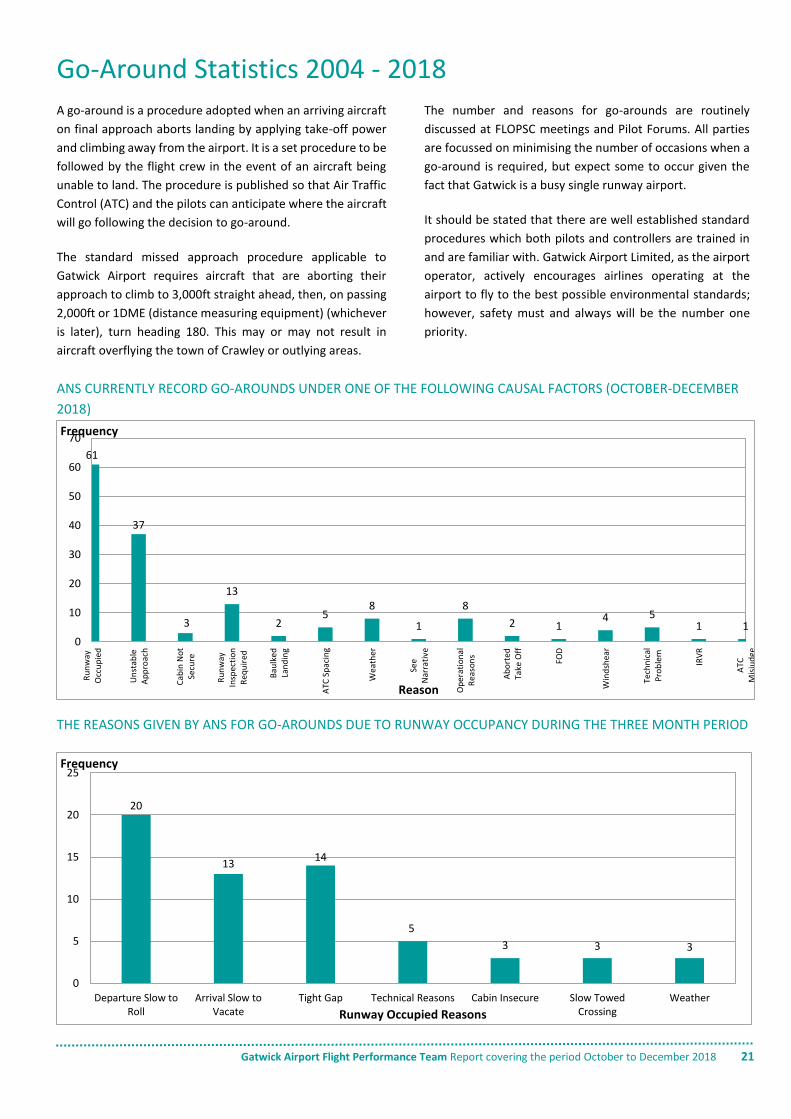
ANS CURRENTLY RECORD GO-AROUNDS UNDER ONE OF THE FOLLOWING CAUSAL FACTORS (OCTOBER-DECEMBER
2018)
THE REASONS GIVEN BY ANS FOR GO-AROUNDS DUE TO RUNWAY OCCUPANCY DURING THE THREE MONTH PERIOD
61
37
3
13
25
8
1
8
2 14 5
1 1
0
10
20
30
40
50
60
70
Ru
nw
ayO
ccu
pie
d
Un
stab
leA
pp
roac
h
Cab
in N
ot
Secu
re
Ru
nw
ayIn
spec
tio
nR
equ
ired
Bau
lked
Lan
din
g
ATC
Sp
acin
g
Wea
ther
See
Nar
rati
ve
Op
erat
ion
alR
easo
ns
Ab
ort
edTa
ke O
ff
FOD
Win
dsh
ear
Tech
nic
alP
rob
lem
IRV
R
ATC
Mis
jud
ge
Frequency
Reason
20
1314
5
3 3 3
0
5
10
15
20
25
Departure Slow toRoll
Arrival Slow toVacate
Tight Gap Technical Reasons Cabin Insecure Slow TowedCrossing
Weather
Frequency
Runway Occupied Reasons
Gatwick Airport Flight Performance Team Report covering the period October to December 2018 22
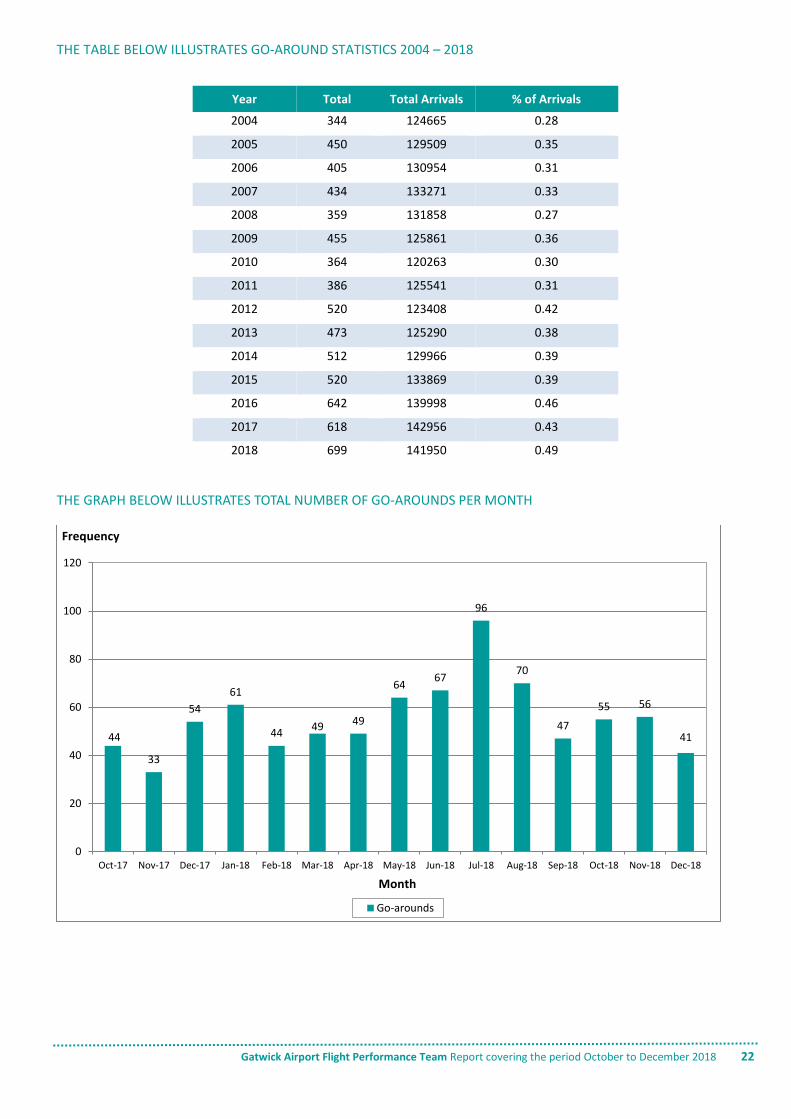
THE TABLE BELOW ILLUSTRATES GO-AROUND STATISTICS 2004 – 2018
Year Total Total Arrivals % of Arrivals
2004 344 124665 0.28
2005 450 129509 0.35
2006 405 130954 0.31
2007 434 133271 0.33
2008 359 131858 0.27
2009 455 125861 0.36
2010 364 120263 0.30
2011 386 125541 0.31
2012 520 123408 0.42
2013 473 125290 0.38
2014 512 129966 0.39
2015 520 133869 0.39
2016 642 139998 0.46
2017 618 142956 0.43
2018 699 141950 0.49
THE GRAPH BELOW ILLUSTRATES TOTAL NUMBER OF GO-AROUNDS PER MONTH
44
33
54
61
4449 49
6467
96
70
47
55 56
41
0
20
40
60
80
100
120
Oct-17 Nov-17 Dec-17 Jan-18 Feb-18 Mar-18 Apr-18 May-18 Jun-18 Jul-18 Aug-18 Sep-18 Oct-18 Nov-18 Dec-18
Frequency
Month
Go-arounds
Gatwick Airport Flight Performance Team Report covering the period October to December 2018 23
Night FlightsThe Secretary of State, in exercise of his powers under Section
78 of the Civil Aviation Act 1982, has imposed restrictions at
Gatwick Airport on aircraft operating at night. These
restrictions are in place to limit and mitigate noise disturbance
from aircraft operating at night and to prohibit aircraft of
specified descriptions from operating, also to limit the number
of occasions on which other aircraft may take-off or land.
The night flying restrictions are divided into summer and winter
seasons which coincide with the start and end of British
Summer Time. They consist of a movement limit and a quota
count system. The quota count (QC) means that points are
allocated to different aircraft types according to how noisy they
are. The noisier the aircraft type, the higher the points
allocated. This provides an incentive for airlines to use quieter
aircraft types. Aircraft are certified by the International Civil
Aviation Organisation (ICAO) according to the noise they
produce and are classified separately for both take-off and
landing.
For the purposes of night flying operations, the night quota
period is defined as the period between 2330-0600 (local time).
In addition, there are two further shoulder periods of 2300–
2330 and 0600–0700 (local time), where other restrictions
apply to the scheduling and operation of aircraft of specified
descriptions.
The new restrictions on night flying came into force in October
2017, to remain in force until 2022 for all the London airports.
At Gatwick, the new regime maintains the status quo for
movements and quota count (QC) until the winter season in
2018/19. This season sees a reduction in the QC limit and a new
QC value of 0.125 applied to some aircraft which are currently
classified as QC0. As of October 2017, all aircraft movements
have counted towards the night quota limit, including those
previously exempt. This will further incentivise the use of
quieter aircraft as an airport can continue the use of its
movement allowance but the average noise produced by an
aircraft cannot increase.
Overleaf is a mid-season report for winter 2018 which
commenced at 02:00 on the 28th October 2018 and will end at
01:00 on the 31st March 2019. The total number of movements
available for the winter season is 3250.
DISPENSATIONS
In accordance with the DfT guidelines, there may be times
when an aircraft can be disregarded from the night flight
restrictions. As a general rule these are unforeseen
circumstances outside the control of either the Airport or
airline resulting in the unscheduled use of a night flight slot.
Examples of such instances include humanitarian relief flights,
emergencies, VIP visits, delays as a result of disruption leading
to passenger hardship, Air Traffic Control disruption or airspace
closure caused by a volcanic ash cloud. The rules related to
dispensations are strictly adhered to and all instances are
reported to the DfT within 7 days.
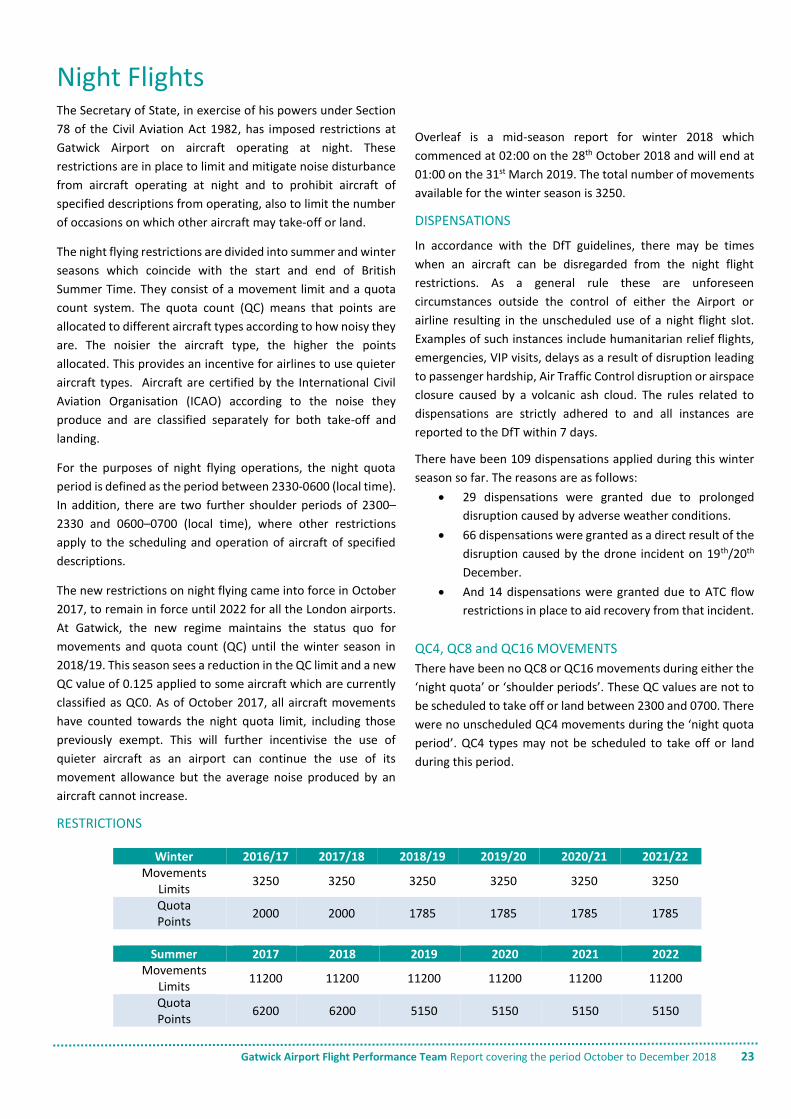
There have been 109 dispensations applied during this winter
season so far. The reasons are as follows:
29 dispensations were granted due to prolonged
disruption caused by adverse weather conditions.
66 dispensations were granted as a direct result of the
disruption caused by the drone incident on 19th/20th
December.
And 14 dispensations were granted due to ATC flow
restrictions in place to aid recovery from that incident.
QC4, QC8 and QC16 MOVEMENTS
There have been no QC8 or QC16 movements during either the
‘night quota’ or ‘shoulder periods’. These QC values are not to
be scheduled to take off or land between 2300 and 0700. There
were no unscheduled QC4 movements during the ‘night quota
period’. QC4 types may not be scheduled to take off or land
during this period.
RESTRICTIONS
Winter 2016/17 2017/18 2018/19 2019/20 2020/21 2021/22 Movements
Limits 3250 3250 3250 3250 3250 3250
Quota Points
2000 2000 1785 1785 1785 1785
Summer 2017 2018 2019 2020 2021 2022 Movements
Limits 11200 11200 11200 11200 11200 11200
Quota Points
6200 6200 5150 5150 5150 5150
Gatwick Airport Flight Performance Team Report covering the period October to December 2018 24
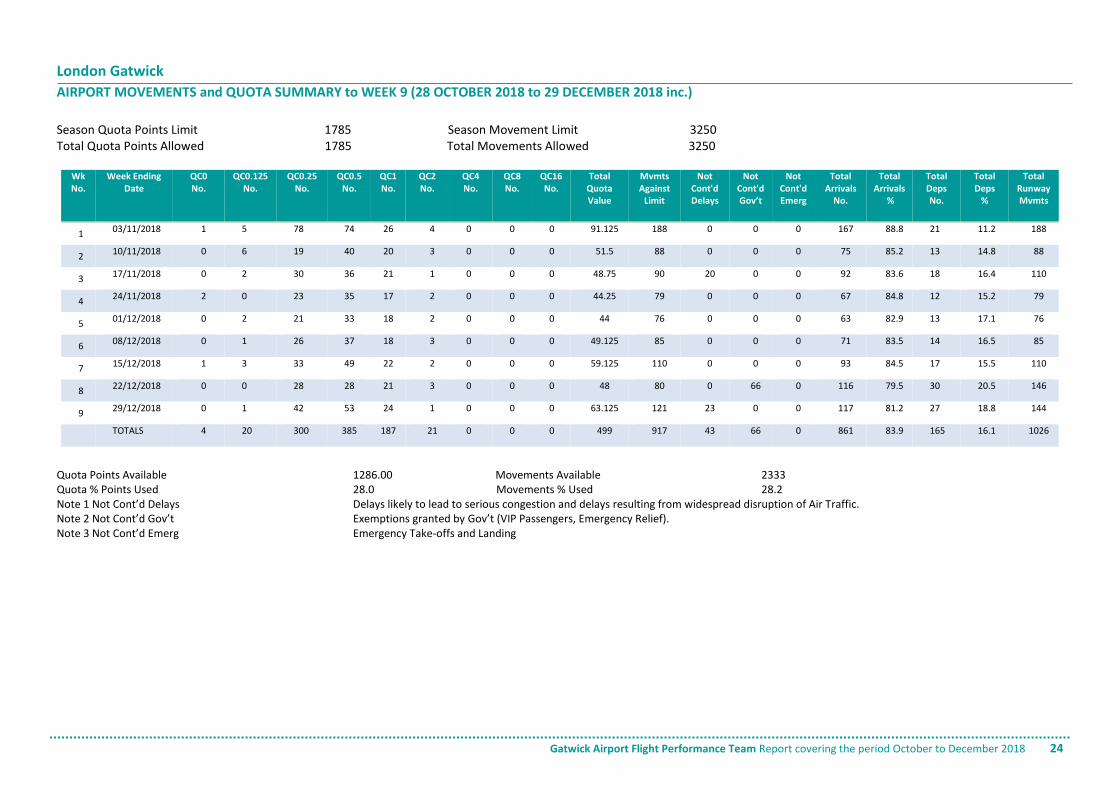
London Gatwick
AIRPORT MOVEMENTS and QUOTA SUMMARY to WEEK 9 (28 OCTOBER 2018 to 29 DECEMBER 2018 inc.)
Season Quota Points Limit 1785 Season Movement Limit 3250 Total Quota Points Allowed 1785 Total Movements Allowed 3250
Wk No.
Week Ending Date
QC0 No.
QC0.125 No.
QC0.25 No.
QC0.5 No.
QC1 No.
QC2 No.
QC4 No.
QC8 No.
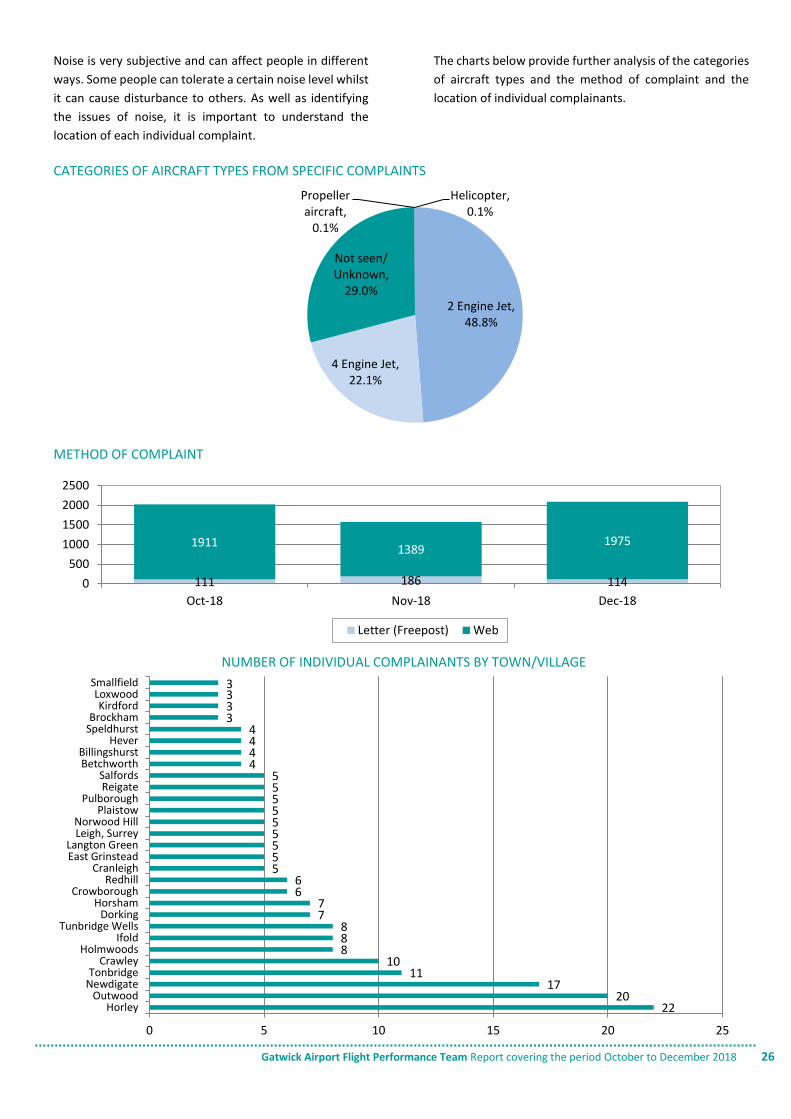
QC16 No.
Total Quota Value
Mvmts Against
Limit
Not Cont'd Delays
Not Cont'd Gov’t
Not Cont'd Emerg
Total Arrivals
No.
Total Arrivals
%
Total Deps No.
Total Deps
%
Total Runway Mvmts
1 03/11/2018 1 5 78 74 26 4 0 0 0 91.125 188 0 0 0 167 88.8 21 11.2 188
2 10/11/2018 0 6 19 40 20 3 0 0 0 51.5 88 0 0 0 75 85.2 13 14.8 88
3 17/11/2018 0 2 30 36 21 1 0 0 0 48.75 90 20 0 0 92 83.6 18 16.4 110
4 24/11/2018 2 0 23 35 17 2 0 0 0 44.25 79 0 0 0 67 84.8 12 15.2 79
5 01/12/2018 0 2 21 33 18 2 0 0 0 44 76 0 0 0 63 82.9 13 17.1 76
6 08/12/2018 0 1 26 37 18 3 0 0 0 49.125 85 0 0 0 71 83.5 14 16.5 85
7 15/12/2018 1 3 33 49 22 2 0 0 0 59.125 110 0 0 0 93 84.5 17 15.5 110
8 22/12/2018 0 0 28 28 21 3 0 0 0 48 80 0 66 0 116 79.5 30 20.5 146
9 29/12/2018 0 1 42 53 24 1 0 0 0 63.125 121 23 0 0 117 81.2 27 18.8 144
TOTALS 4 20 300 385 187 21 0 0 0 499 917 43 66 0 861 83.9 165 16.1 1026
Quota Points Available 1286.00 Movements Available 2333 Quota % Points Used 28.0 Movements % Used 28.2 Note 1 Not Cont’d Delays Delays likely to lead to serious congestion and delays resulting from widespread disruption of Air Traffic. Note 2 Not Cont’d Gov’t Exemptions granted by Gov’t (VIP Passengers, Emergency Relief). Note 3 Not Cont’d Emerg Emergency Take-offs and Landing
Gatwick Airport Flight Performance Team Report covering the period October to December 2018 25
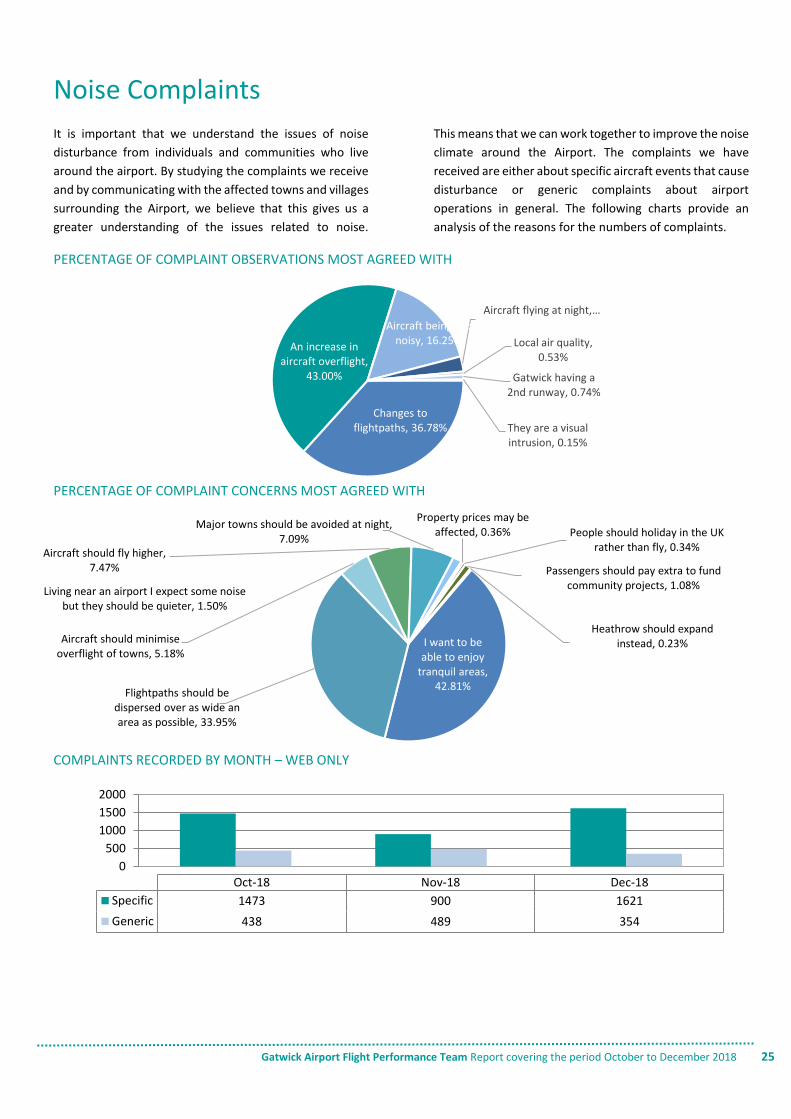
Noise Complaints
It is important that we understand the issues of noise
disturbance from individuals and communities who live
around the airport. By studying the complaints we receive
and by communicating with the affected towns and villages
surrounding the Airport, we believe that this gives us a
greater understanding of the issues related to noise.
This means that we can work together to improve the noise
climate around the Airport. The complaints we have
received are either about specific aircraft events that cause
disturbance or generic complaints about airport
operations in general. The following charts provide an
analysis of the reasons for the numbers of complaints.
PERCENTAGE OF COMPLAINT OBSERVATIONS MOST AGREED WITH
PERCENTAGE OF COMPLAINT CONCERNS MOST AGREED WITH
COMPLAINTS RECORDED BY MONTH – WEB ONLY
Changes to flightpaths, 36.78%
An increase in aircraft overflight,
43.00%
Aircraft being too noisy, 16.25%
Aircraft flying at night, …
Local air quality, 0.53%
Gatwick having a 2nd runway, 0.74%
They are a visual intrusion, 0.15%
I want to be able to enjoy
tranquil areas, 42.81%
Flightpaths should be dispersed over as wide an area as possible, 33.95%
Aircraft should minimise overflight of towns, 5.18%
Aircraft should fly higher, 7.47%
Major towns should be avoided at night, 7.09%
Living near an airport I expect some noise but they should be quieter, 1.50%
Property prices may be affected, 0.36% People should holiday in the UK
rather than fly, 0.34%
Passengers should pay extra to fund community projects, 1.08%
Heathrow should expand instead, 0.23%
0
500
1000
1500
2000
Oct-18 Nov-18 Dec-18
Specific 1473 900 1621
Generic 438 489 354
Gatwick Airport Flight Performance Team Report covering the period October to December 2018 26
Noise is very subjective and can affect people in different
ways. Some people can tolerate a certain noise level whilst
it can cause disturbance to others. As well as identifying
the issues of noise, it is important to understand the
location of each individual complaint.
The charts below provide further analysis of the categories
of aircraft types and the method of complaint and the
location of individual complainants.
CATEGORIES OF AIRCRAFT TYPES FROM SPECIFIC COMPLAINTS
METHOD OF COMPLAINT
NUMBER OF INDIVIDUAL COMPLAINANTS BY TOWN/VILLAGE
111 186 114
19111389
1975
0
500
1000
1500
2000
2500
Oct-18 Nov-18 Dec-18
Letter (Freepost) Web
2220
1711
10888
77
66
555555555
4444
3333
0 5 10 15 20 25
HorleyOutwood
NewdigateTonbridge
CrawleyHolmwoods
IfoldTunbridge Wells
DorkingHorsham
CrowboroughRedhill
CranleighEast GrinsteadLangton Green
Leigh, SurreyNorwood Hill
PlaistowPulborough
ReigateSalfords
BetchworthBillingshurst
HeverSpeldhurstBrockham
KirdfordLoxwood
Smallfield
2 Engine Jet, 48.8%
4 Engine Jet, 22.1%
Not seen/Unknown,
29.0%
Propeller aircraft,
0.1%
Helicopter, 0.1%
Gatwick Airport Flight Performance Team Report covering the period October to December 2018 27
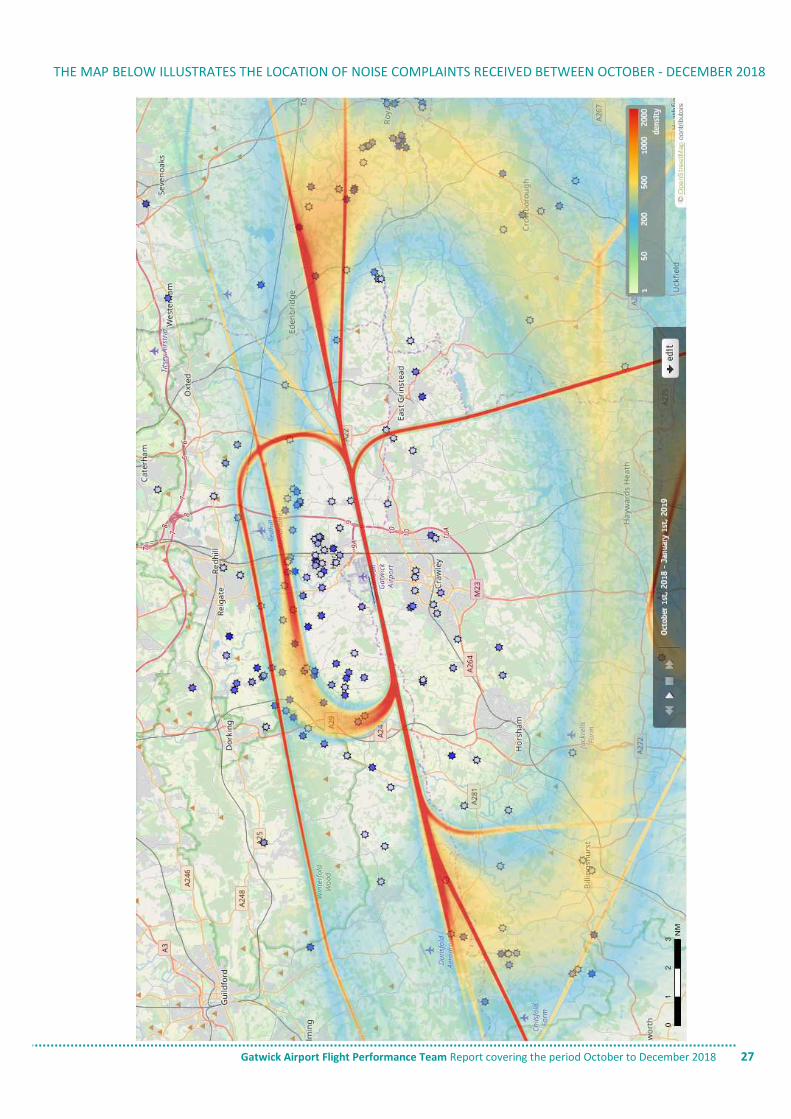
THE MAP BELOW ILLUSTRATES THE LOCATION OF NOISE COMPLAINTS RECEIVED BETWEEN OCTOBER - DECEMBER 2018
Gatwick Airport Flight Performance Team Report covering the period October to December 2018 28
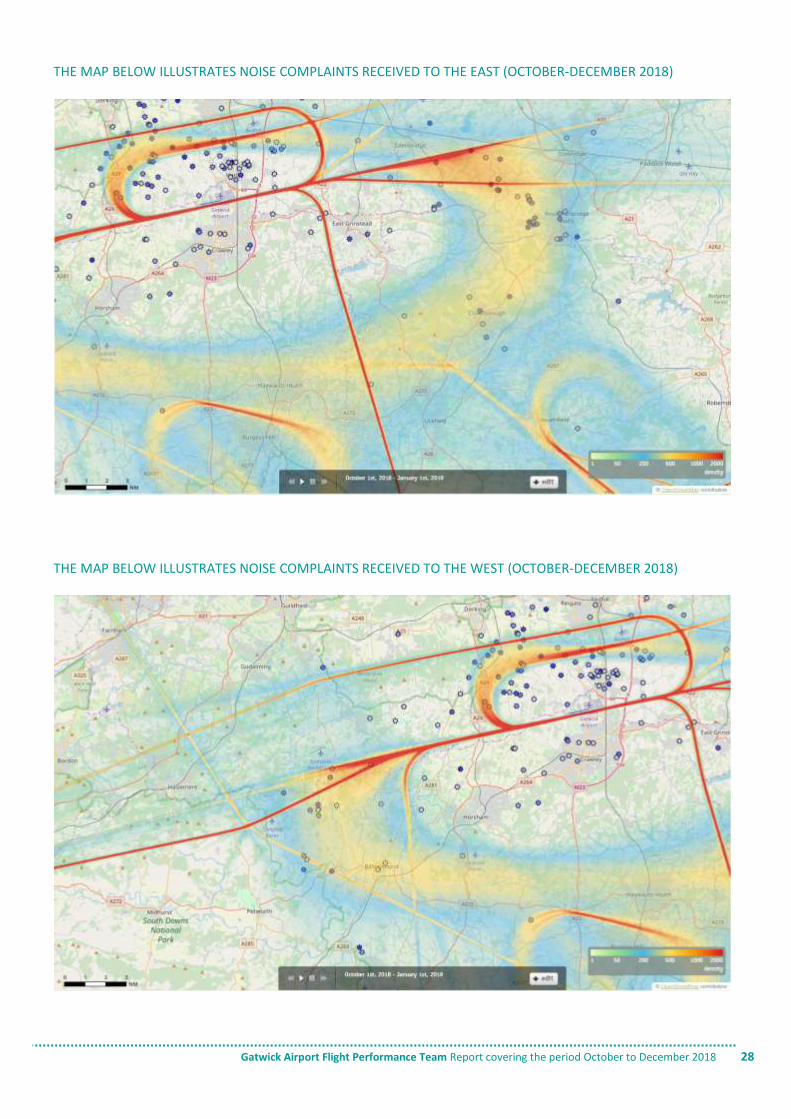
THE MAP BELOW ILLUSTRATES NOISE COMPLAINTS RECEIVED TO THE EAST (OCTOBER-DECEMBER 2018)
THE MAP BELOW ILLUSTRATES NOISE COMPLAINTS RECEIVED TO THE WEST (OCTOBER-DECEMBER 2018)
Gatwick Airport Flight Performance Team Report covering the period October to December 2018 29
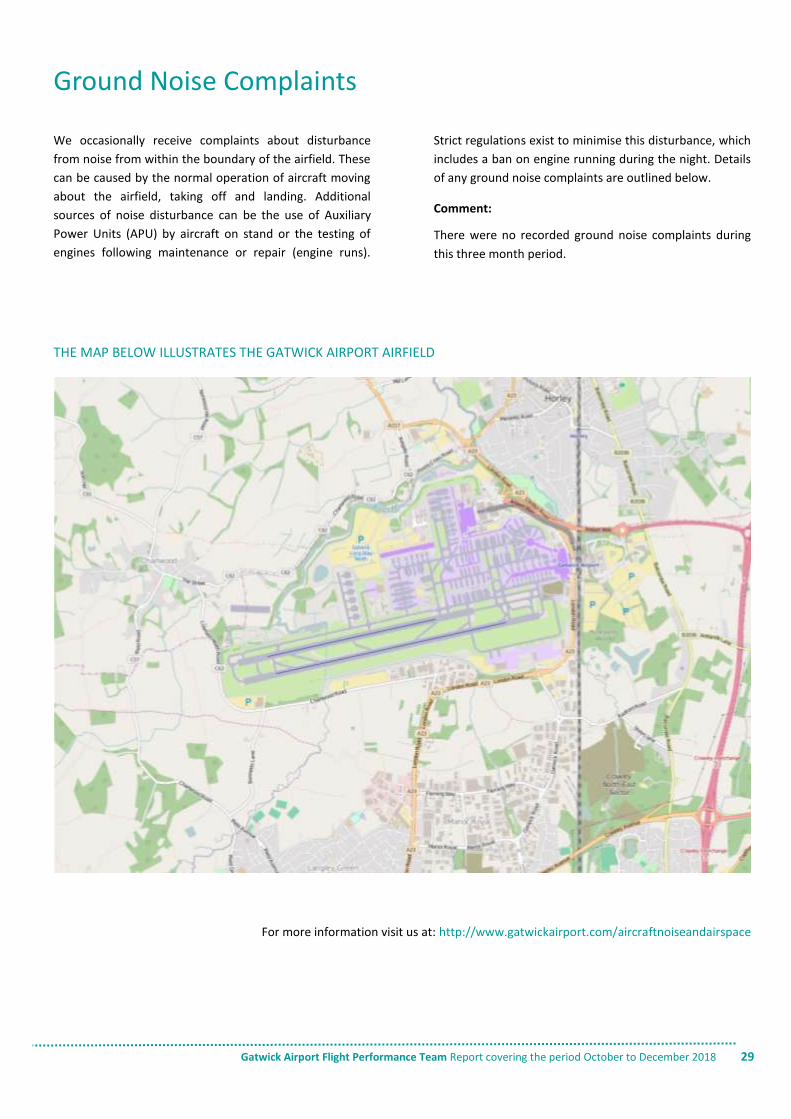
Ground Noise Complaints
We occasionally receive complaints about disturbance
from noise from within the boundary of the airfield. These
can be caused by the normal operation of aircraft moving
about the airfield, taking off and landing. Additional
sources of noise disturbance can be the use of Auxiliary
Power Units (APU) by aircraft on stand or the testing of
engines following maintenance or repair (engine runs).
Strict regulations exist to minimise this disturbance, which
includes a ban on engine running during the night. Details
of any ground noise complaints are outlined below.
Comment:
There were no recorded ground noise complaints during
this three month period.
THE MAP BELOW ILLUSTRATES THE GATWICK AIRPORT AIRFIELD
For more information visit us at: http://www.gatwickairport.com/aircraftnoiseandairspace
Gatwick Airport Flight Performance Team Report covering the period October to December 2018 30
Glossary ACoP – Arrivals Code of Practice
AIP – Aeronautical Information Publication
AMSL – Above Mean Sea Level
ANS – Air Navigation Solutions
APU – Auxiliary Power Unit - A small auxiliary engine on an aircraft used to provide electrical power when the main engines are
shut down.
ATC – Air Traffic Control
CAA – Civil Aviation Authority
CDO – Continuous Descent Operations - A noise abatement procedure for arrivals used to avoid periods of level flight, reducing
noise and emissions.
dBA – A-weighted decibels that takes closest account of human hearing. It is used to measure aircraft noise.
DfT – Department for Transport
DME – Distance measuring equipment
EGKK or LGW – London Gatwick Airport
FLOPSC – Flight Operations Performance and Safety Committee
FPT – Flight Performance Team
Go-Around – A go-around is an aborted landing of an aircraft which is on approach to the runway.
ICAO – International Civil Aviation Organisation
ILS – Instrument Landing System
IMC – Instrument Meteorological Conditions
KPI – Key Performance Indicators
Lmax – Maximum noise level
NATS – National Air Traffic Services
nm – Nautical Miles
NPR – Noise Preferential Route
NTK – Noise and Track Keeping monitoring system using Casper.
P-RNAV – Precision Route Navigation
QC – Quota Count
QNH – The barometric pressure at sea level (QFE is the barometric pressure at the Airport).
SID – Standard Instrument Departure - A route out of UK airspace assigned to departing aircraft with an NPR in the first section.
Vectoring – Air Traffic Control procedure turning a departure off an NPR onto a more direct heading.
VMC – Visual Meteorological Conditions

Gatwick Airport Flight Performance Team Report covering the period October to December 2018 31