Embed Size (px)
Citation preview
(6.4.1) Learning Episode 3: Water Data Graph Analysis
Standard 6.4.1 Learning Episode 3 Title: Water Data Graph Analysis Overview: Students will analyze water data
graphs by combining “I see” statements with “it means” inferences to create a caption that summarizes the graphed data.
Overarching Performance Expectations (Standard): 6.4.1 Analyze data to provide evidence for the effects of resource availability on organisms and populations in an ecosystem. Ask questions to predict how changes in resource availability affects organisms in those ecosystems. Examples could include water, food, and living space in Utah environments. Lesson Performance Expectations: Students presented with a graph will identify patterns that they see and infer an explanation that interprets the data. CCC: patterns, cause and effect SEP: Analyzing and Interpreting Data
GATHER Student Purpose
1. Students look at the graph on their papers titled, Graph 1: Water Temperature. Students think of one thing they can “see” on the graph. When students have figured out an observation they will raise their hands to let the teacher know they can describe 1 thing about the graph.
2. Three students will write their examples on the board for everyone to reference as a model. The rest of the class will write three “I see” statements on their own papers next to Graph 1. These “I see” statements should reflect the patterns seen on the graph, i.e., changing slopes, comparisons between amounts, highest point, lowest point, what the points represent.
3. Students add arrows connecting “I see” statements to the spot on the graph that is being referenced.
4. Students will further share observations in a class discussion.
Teacher Guidance
1. Set up graph so students can see it as a projection at the front of class.
2. Pass out Water Data Analysis Graph sheet.
3. Incorporating the BSCS I2 approach, (see link below), direct the students to look at, Graph 1: Water Temperature. Ask all students to observe one thing they “see” on the graph. Tell students to raise their hands when they think they can state an observation they “see”. Select 3 students to write their “I see” observations on the board next to the graph.
4. Direct students to draw an arrow that connects their “I see” statement to where it is on the graph.
5. Give students time (5 minutes) to write their own three “I see statements” on the first graph.
6. Walk around the class to assess what students are noticing, provide some of these examples to the class for students to compare with their own “I see” statements. Focus student attention on the proper use of axis labels and number details.
Teacher Preparation Copies of sample graphs needed for each student.
(6.4.1) Learning Episode 3: Water Data Graph Analysis
Projection of Graphs that can be written on for class to see as a model. Management Strategies This site gives examples for how to use the BSCS I2 strategy to analyze data on a graph. https://bscs.org/sites/default/files/_legacy/BSCS_PDI_Notebooking_Student_Version_NSTA_2012.pdfNotes for setting up this unit
REASON Student Purpose
1. Students write an “it means” inference next to one of their “I see” statements.
2. Students share these ideas with each other.
3. Students who heard thoughtful examples will nominate these students to write their answers on the projected class model.
4. All students fill in “it means” statements on their own papers, using the class model as an example.
5. Start with one student and ask if they agree or disagree with the class projected model statements. If possible, the student provides evidence for why they agree or disagree with the “It means” statement. 4 to 5 more students will provide feedback on the classroom graph.
Teacher Guidance
1. Have students think of one “it means” statement to write next to one of their “I see” statements. Have students turn and share these statements with one another. Examples: I see that the temperature increases more slowly at the beginning of the year as compared to the decrease of temperature in the fall months. It could mean that the snowmelt may have slowed the warming of the water. Or it could mean the weather was cooler in the spring than in the fall.
2. Have students who listened to “it means” statements nominate students to fill in the “it means” statements on the board while the rest of the class fills these in on their own papers.
3. Facilitate a class discussion using the Agreements strategy* see link below for description. 5 to 6 students are asked if they agree or disagree with the “it means” statements written on the board model. More advanced students may be able to add evidence for why they agree or disagree.
Teacher Preparation: Projection of Graph 1: Water Temperature that can be written on for the class to see as a model. Management Strategies: https://www.edutopia.org/blog/make-class-discussions-more-exciting-richard-curwin use this website that describes 5 ways to make classroom discussions better. In this lesson incorporate the agreements strategy
(6.4.1) Learning Episode 3: Water Data Graph Analysis
COMMUNICATE Student Purpose
1. Student groups work together to create a detailed caption for Graph 1: Water Temperature. Since this is their first graph, students can simplify this process by choosing their favorite “I see”, “it means” combination for a caption statement.
2. Students who understand the I2 approach continue to practice their analysis with Graph 2: pH.
3. When students have finished Graph 2: pH, they should share their ideas with a partner. If they discover new facts from sharing, these facts can be added to their graphs and incorporated into the captions.
4. Direct students who finish early to write their ideas on the class model for other students to reference.
5. Have students evaluate their first two graphs by using the graph scavenger hunt check list.
6. Students will first review the check list, one student from each group can alternate reading the criteria to the class while the students evaluate their first two graphs by coloring in the smiley face they think represents how well they matched the criteria.
7. Graph 3: Oxygen and Temperature will be used as a student assessment. Students may do this on their own or with their practice group.
8. When students complete Graph 3 they will exchange their graphs with another group for editing. If more details are needed student groups will advise one another what can be added to make the caption more complete. Editors should ask students to define what is meant by “it” and “they” pronouns. More and less should be defined by specific measurement numbers. Patterns should be identified and inferences should infer why the pattern is
Teacher Guidance 1. Offer a challenge to student groups.
Have them work together to create a caption statement that combines the “I see” with the “it means” statements to best explain the patterns seen on Graph 1: Water Temperatures. If groups are struggling to combine the three statements, have them choose their favorite “I see”, “it means” combination to put together a caption.
2. Students will practice the I2 approach on Graph 2: pH. If students need this simplified start again with “I see” statements. After these are completed, students can then focus on the “It means” inferences. At this point students may be able to do both simultaneously.
3. Direct groups to share ideas they have about graph 2. Select students to write examples on the board for Graph 2: pH.
4. Pass out the graph scavenger hunt check list so students can evaluate their first two graphs. Direct one student to read each part to the class (in case students have questions about the meaning of the descriptions) while students color in the smiley face that indicates how they think their graph analysis compares to the criteria.
5. Use Graph 3: Oxygen and Temperature as an assessment. Students can work alone or in groups to complete the analysis.
6. Students exchange graphs for peer review. Have the group critique captions by determining if the caption is a detailed description of the graph (i.e. the description includes the names of both x and y axis, titles, and numbers to analyze and infer the relationships between variables). Have peer editors use the Graph Caption Scavenger Hunt check list to help guide their critique.
(6.4.1) Learning Episode 3: Water Data Graph Analysis
present. Editors will identify this on the Graph Caption Scavenger Hunt check list. Graphs are then returned to the original students so they can review edits and make corrections.
7. Have groups exchange graphs with checklists back to the original author for review and corrections.
Teacher Preparation: Projection of Graphs that can be written on for class to see the writing of a caption as a model. Copies of Graph 3: Oxygen and Temperature Copies of Graph Scavenger Hunt checklist Management Strategies: Use a Graph checklist as a scavenger hunt tool for self and peer editing. See copy below.
Assessment of Student Learning: Use Graph 3: Oxygen and Temperature as an assessment. Students should work on these individually. Collect Graph papers when students are finished editing. Students with an advanced understanding (4) will use the axis labels to describe the relationship between variables. They will notice oxygen goes up when temperature goes down and/or vice versa. These students will include numbers when comparing measurements. Students at grade level (3) will identify the pattern of the relationship, up or down, but may not use specific numbers to compare. They will still be able to identify the variables being measured. Students at the basic level (2) will notice the up and down patterns but will explain these using pronouns (if and they) instead of using specific axis labels. Students not meeting standard (1) will reference parts that are not on the graph or are not in context with what is being graphed.
Return papers and scaffold as needed. Match 4’s and 3’s with 1’s and 2’s to help students modify their examples. Give 1’s and 2’s a chance to analyze a different graph to reach grade level understanding.
(6.4.1) Learning Episode 3: Water Data Graph Analysis
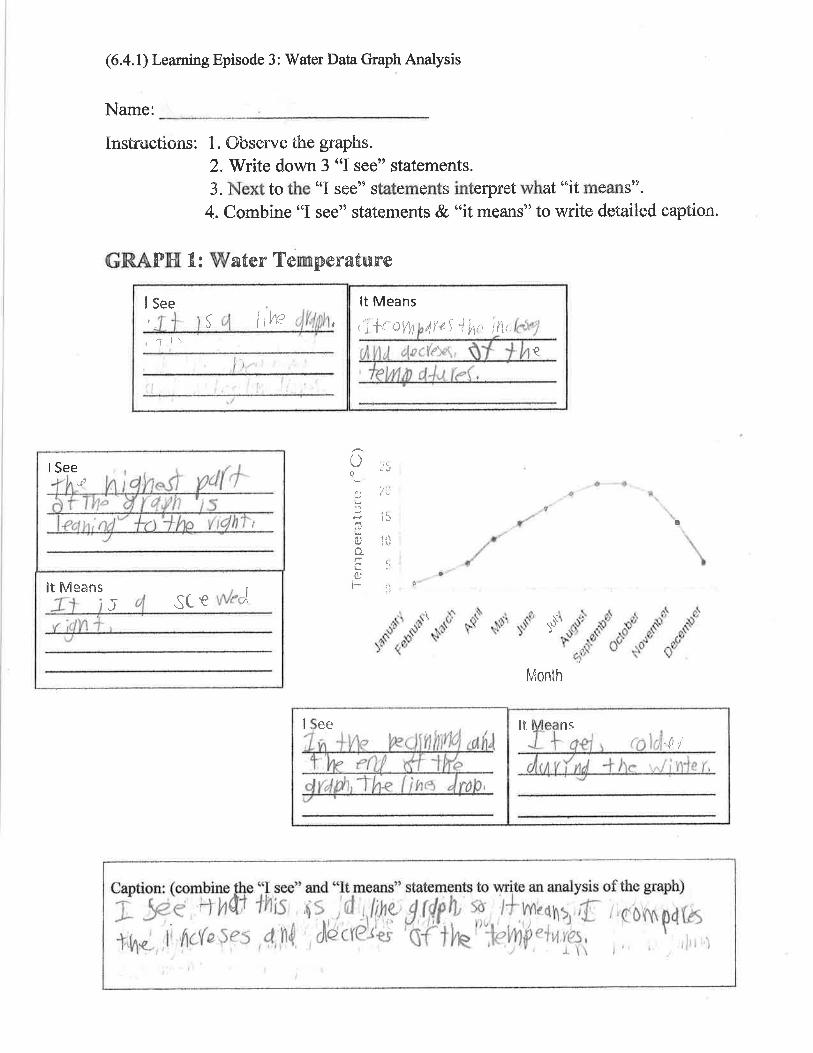
Name: _____________________________
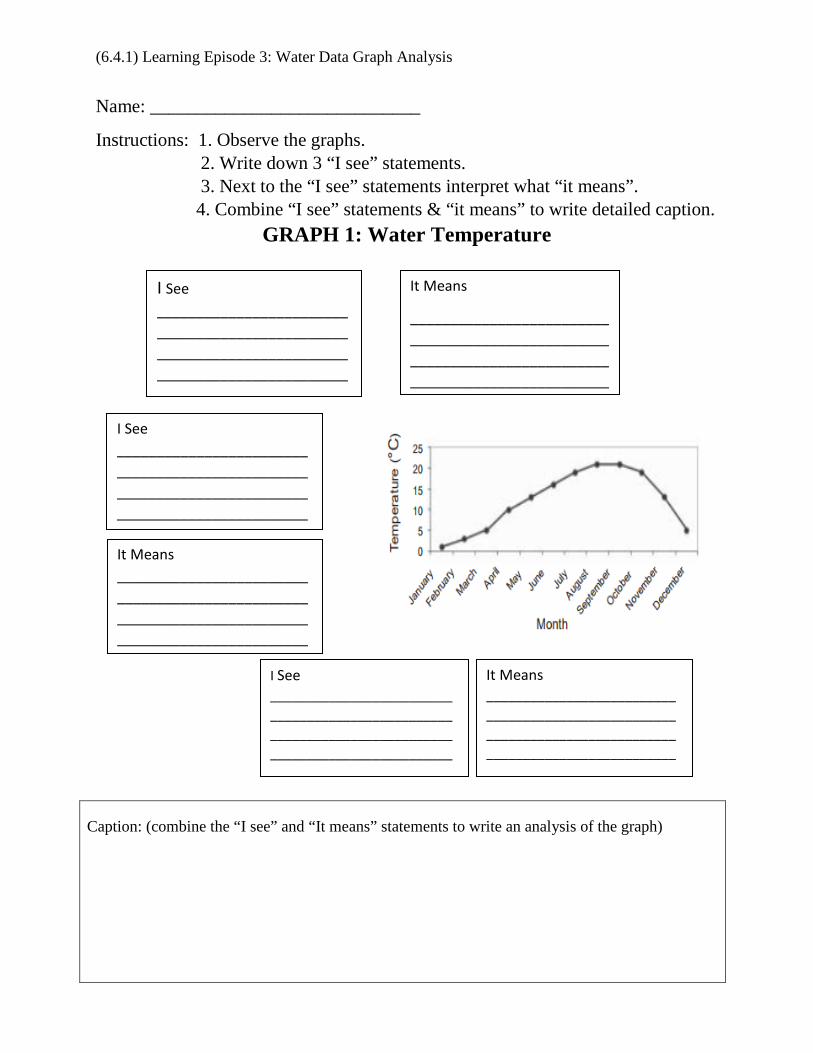
Instructions: 1. Observe the graphs. 2. Write down 3 “I see” statements. 3. Next to the “I see” statements interpret what “it means”.
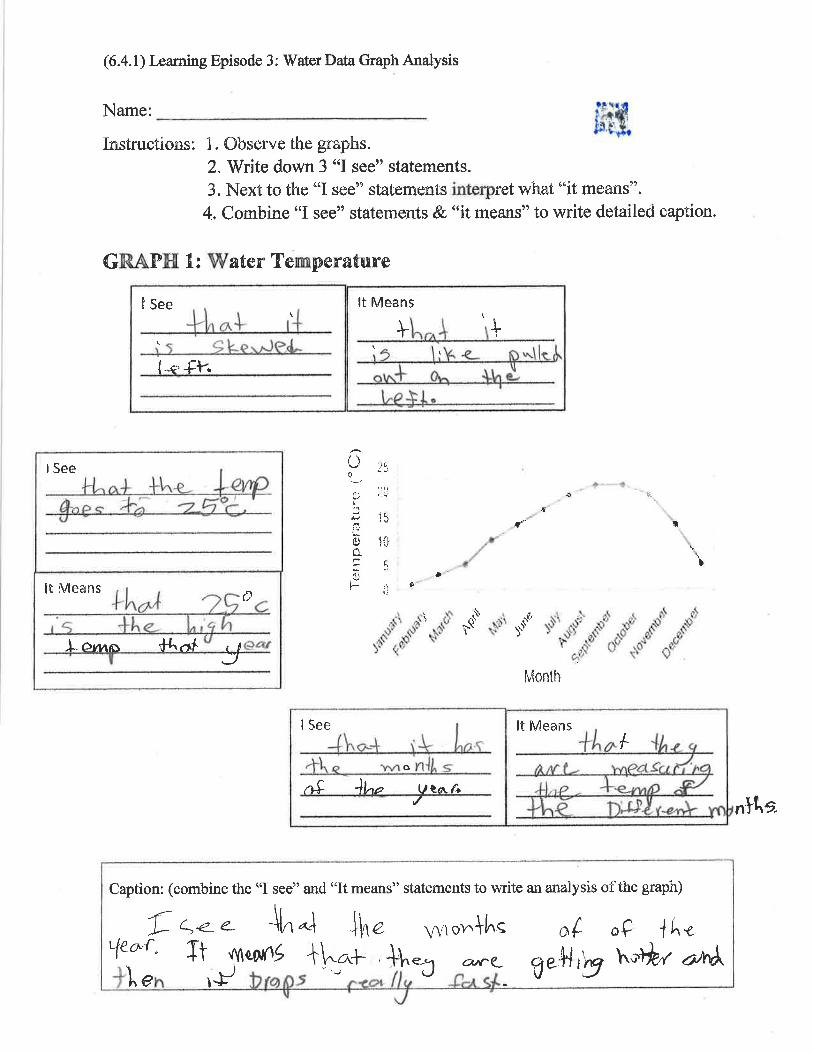
4. Combine “I see” statements & “it means” to write detailed caption. GRAPH 1: Water Temperature
Caption: (combine the “I see” and “It means” statements to write an analysis of the graph)
I See ________________________________________________________________________________________________
It Means
____________________________________________________________________________________________________
I See ____________________________________________________________________________________________________
It Means ________________________________________________________________________________________________________
I See ________________________________________________________________________________________________
It Means ________________________________________________________________________________________________
(6.4.1) Learning Episode 3: Water Data Graph Analysis
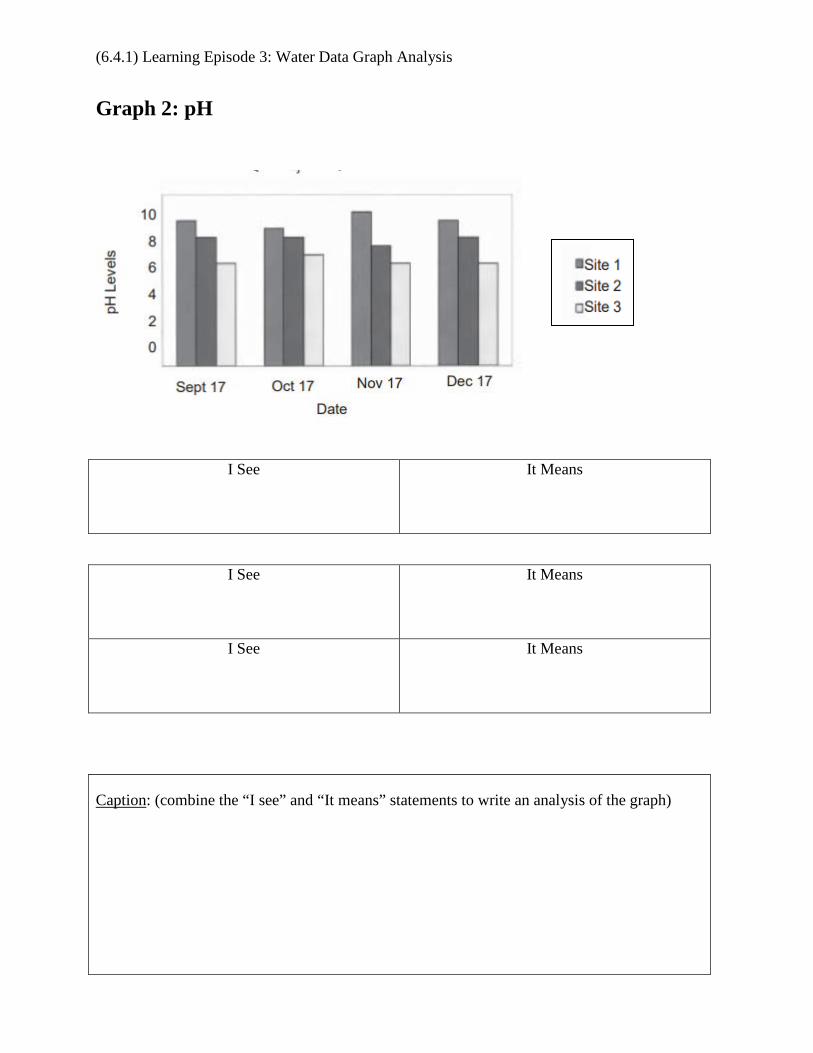
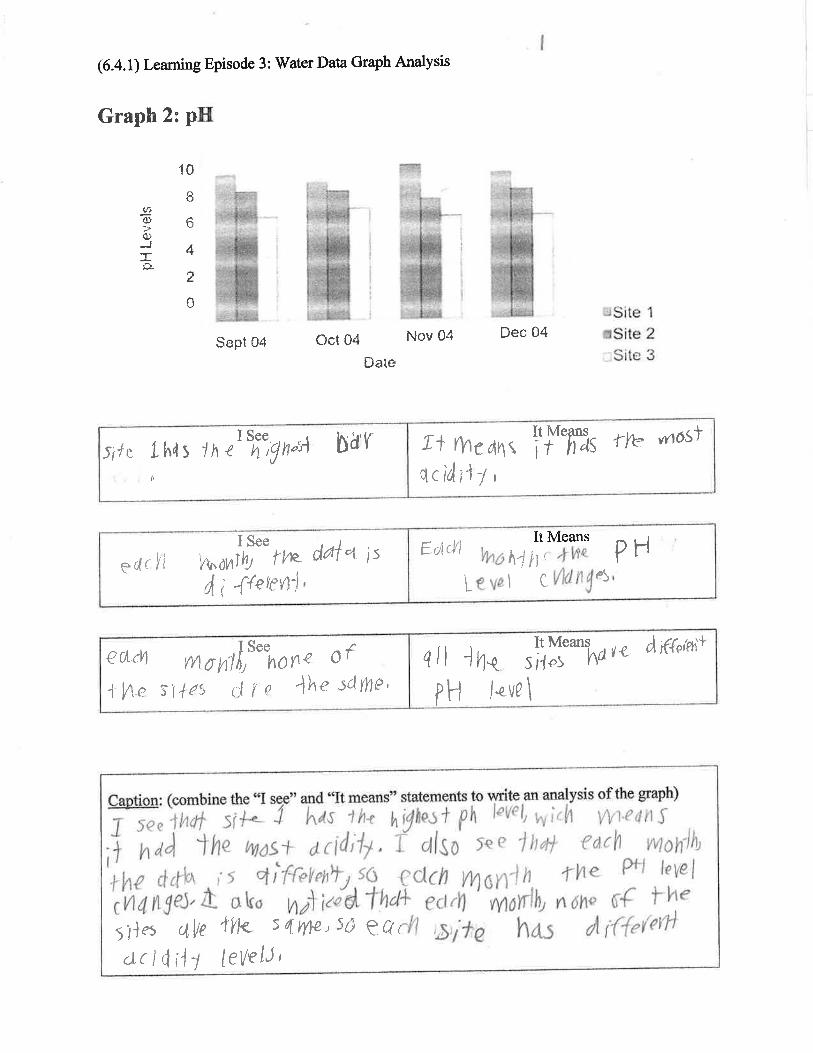
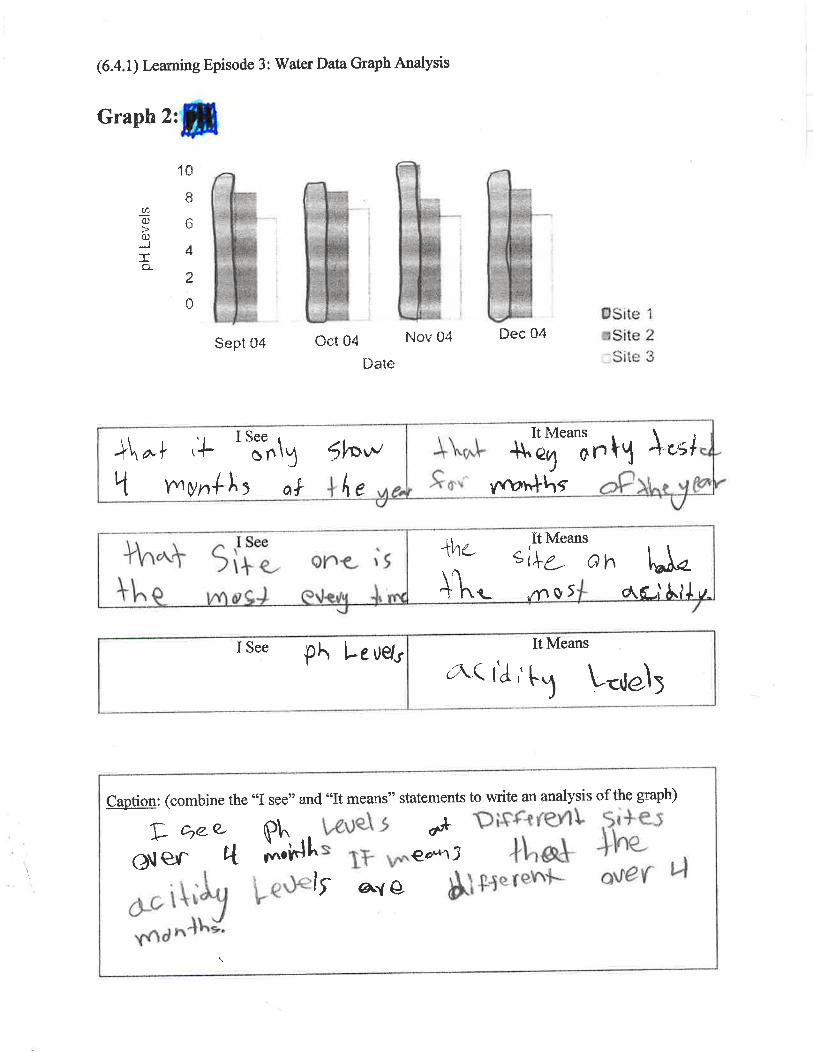
Graph 2: pH
I See It Means
I See It Means
I See It Means
Caption: (combine the “I see” and “It means” statements to write an analysis of the graph)
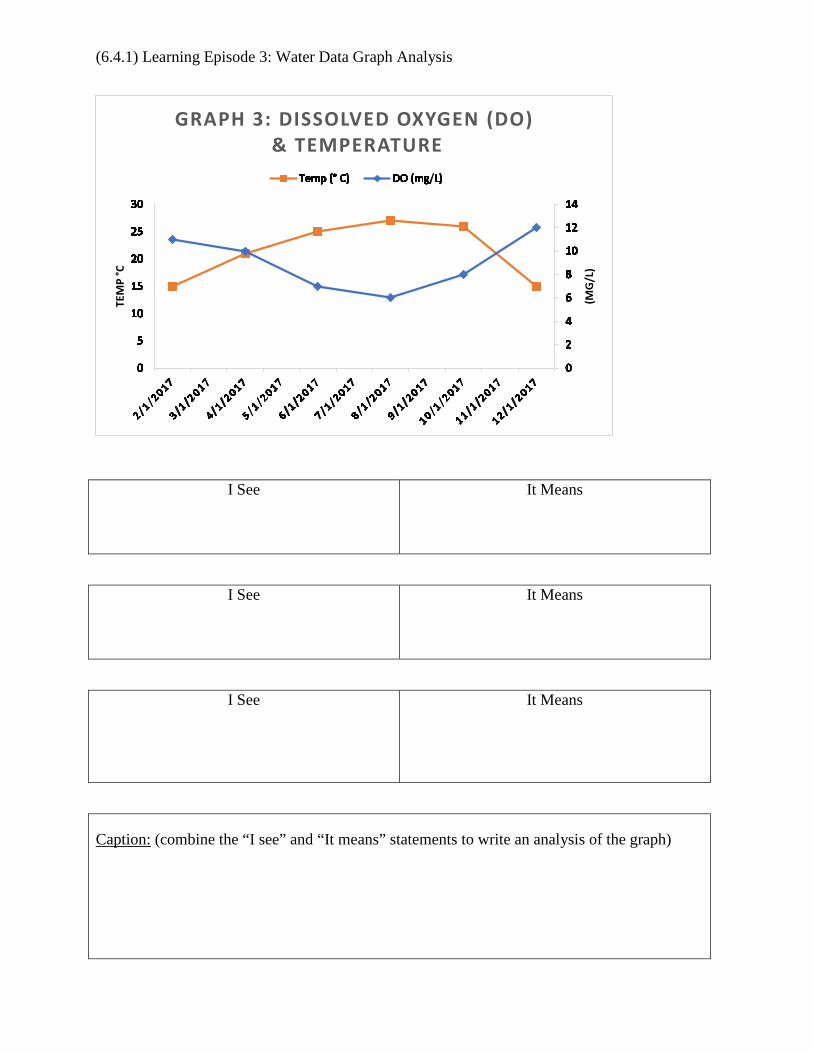
(6.4.1) Learning Episode 3: Water Data Graph Analysis
I See It Means
I See It Means
I See
It Means
Caption: (combine the “I see” and “It means” statements to write an analysis of the graph)
(MG
/L)
TEM
P °C
GRAPH 3: DISSOLVED OXYGEN (DO)
& TEMPERATURE
(6.4.1) Learning Episode 3: Water Data Graph Analysis
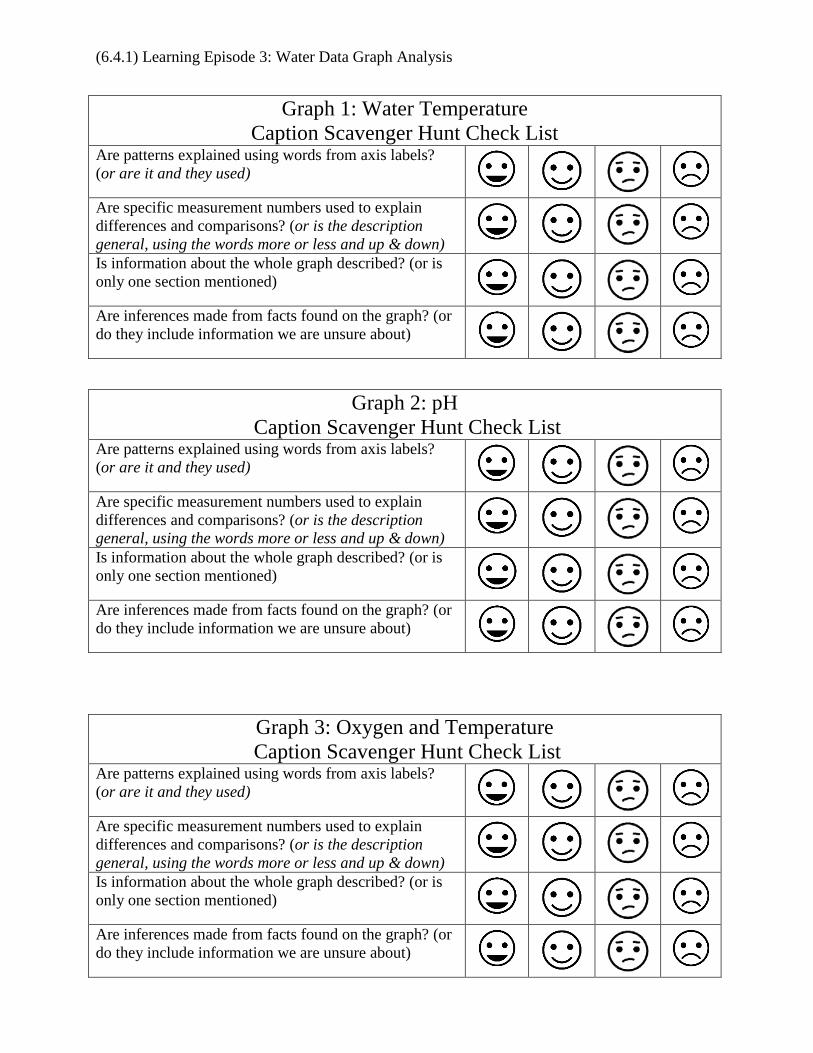
Graph 1: Water Temperature Caption Scavenger Hunt Check List
Are patterns explained using words from axis labels? (or are it and they used)
Are specific measurement numbers used to explain differences and comparisons? (or is the description general, using the words more or less and up & down) Is information about the whole graph described? (or is only one section mentioned)
Are inferences made from facts found on the graph? (or do they include information we are unsure about)
Graph 2: pH Caption Scavenger Hunt Check List
Are patterns explained using words from axis labels? (or are it and they used)
Are specific measurement numbers used to explain differences and comparisons? (or is the description general, using the words more or less and up & down) Is information about the whole graph described? (or is only one section mentioned)
Are inferences made from facts found on the graph? (or do they include information we are unsure about)
Graph 3: Oxygen and Temperature Caption Scavenger Hunt Check List
Are patterns explained using words from axis labels? (or are it and they used)
Are specific measurement numbers used to explain differences and comparisons? (or is the description general, using the words more or less and up & down) Is information about the whole graph described? (or is only one section mentioned)
Are inferences made from facts found on the graph? (or do they include information we are unsure about)
(6.4.1) Learning Episode 3: Water Data Graph Analysis
Name:
Instructions: 1. Observe the graphs.
2. Write down 3 'oI see" statements.
3. Next to the "I see" staternents interpret what'nit Tneans".
4. Combine 'nI see" stâtements & "it means') to write detailed caption.
GR.A,PT{ 1: WaÉen TempereÉEåre
I Seei 5 !¡W t
, T l'
It Means
t'¡lt-"ot¡¿ 4f+l a, h¡i tÍl i fr'o¿tJ
q
I Seer)
i
It MeansSC € vV*,{J
,$t:;.'-$.--- .f =g *'s *si*u-ruut',-,---t^-*c
a
0
f.
i-¡
i:J
i3
ti;
:l.. ç
t
*
l,4entlr
êÊ Ir ns
{i
Caotion: lcombine the
T JeE thqJl,h*, l' Íw\fu se>
"I see" and "It means" statements to write an analysis of the graph)
'ï',lnuu fu.l-f{f {YThl u.1* il:î}}g 0 Òi$ p4{^
(6.4.1) Learning Episode 3: \Mater Data Crraph Analysis
Graph 2: pH
1* l'?j"_1
I6
I.+
2
n
¡tiü
J
{}-
Sepî 04 Õct Û4 Nav ü4 Dec ü4*¡Site t*Site 2
'Sile 3Date
Silt t h4l I h 1r'fr",1n",+ hä'r¡\
Tt rhe dnt0crdi4, )
îi'rut rw vllósl
i-I
I See
WmIU fYE
fl ¡ {tersv1J,
døl q ¡s. l, I
eürffldd''!
It Means
PHVnøh,t ¡ r .fbe
Le v¿l ( úAngau
eú,cl1 rnon"Å,t"h,ßu çf4l4e rl'{ss r"J I P 4he sdftte'
. It Meansqll -ii1q si-{c! hd
PH l¿vø \
t( á($tø;+
Cpptiofr: (combine the *I sep" and "It means" statements to g'l:,* alafVsis of the graph)
,+ "ù¿ lhc tw¿s+ aridilr , i ølso )e e I tra¡ €acþ wuwlh
'i,i,fofí't,,r' 'o ,i'Tyrþ;+hfro:!,,r-il:;i,,, {i^: i {ç'
5, i+* '
,,,,V, tW< s q'-W, sÕ ? a dl6,¡':*q has si ÉTrv'øf+¿c i r);4 j IeVelJ ,
(6.4.1) Learning Episode 3: Water Data Graph Analysis
Name:
Instructions: 1. Observe the graphs.
2. Write down 3 'oI see" statements.
ffi$
3. Next to the "I see" staternents hteqpret what "it means".
4. Combine'oI see" statements & "it trneans" to write detailed caption.
GR.APH 1: Waten Tempereture
! See
{-+" .å]ì-.
It Means
++I
.f
\J i\'liì
,,Ë ç'i
i ..i;f.uJ liJfåþ\4r i
F- 4 &"
.þ- ¡t6 Þ_
6
rt
L
,r.'t$t+.'-- ooù .lt' ,s $--i--uini,,----.o,.f
lr:10*ti'¡
I See
o
n-ç llno uta./l
It illeanst-
nll',s"
I see
It [Vleans t
.l. o¡no +f".:Êtt { îpJa¡J
Caption: (combine the "I see" and "It means" statements to write an analysis of the graph)
$ ¿ J\,\" rnn qr^,lhc
a¡rQ-
L\{*{"
#ge*4tþI
¡ ì¡.)., et\^t+ }t".J
c>4 e- oÇ t Á<.
h"ì+/ ó"Å,{t {,ilqûnç
(6.4.1) Leaming Episode 3: \Mater Data Graph Analysis
Graph r,t1ü
tJ>
û;J-?-
(J
i)
1+
¿.
s
Sepî $4 Õct S4 NÛr¡ ü4 Ðec ü49$ite 1
sSiïe 2.$iie 3ilate
\\wþ$'**'
It Means
l\^ eon onJ
À*ç/t,.1
ynn*¡,f\ç)\ ^J"
-.l-.
4 rnyn+Ir a&
\
e4
1 1lçrt¿I See
on
lì^^h\\" e
a. .I See
5i+<- on<- içt¡rì üEJ erlsr-l rx
\\u\\,*_
It Meansçi^-o ah ïrl*/nùt o\Lll"fl ¿
I See ph Le uel¡It Means
^çr,á i !.1 L.¡el:
Cpptiq+: (combine the'oI see" and o'It means'o statements to write an analysis of the graph)
"Wuo,.+.9,\'rYîi'**f, "iät iff- ,
"tÒ-ür\;ai" çaÙ*fr ää ùì+¡niEnÇ ou€r tl
"*n"t4t'i