Embed Size (px)
Citation preview

Gateway Conference
April 2011
Entrepreneurship & China
Where Do We Move in the Future


What We Want To Talk About Today
• China great success• Success driven by policy not entrepreneurship• Entrepreneurship in China today large numbers
– firms very small in size• Why entrepreneurship is where it is why?• Contrast to India• Future for China entrepreneurship is critical• As scholars what do we need to look at?

MACRO – China Growth Impressive
-2.0%
0.0%
2.0%
4.0%
6.0%
8.0%
10.0%
12.0%
GROWTH OF REAL GDP PER HEAD (per cent a year)
1971-1980 1981-1990 1991-2000 2001-2009Source: World Bank

MACRO – China Growth
• China’s share in global exports has risen from 1.2 per cent in 1982 to 10 per cent & continues to grow.
• Over the ten years 1999-2008, the volume of China’s exports grew at 23 per cent a year, twice the rate of the growth of world trade.
• Between 1979 and 2001, China’s terms of trade deteriorated by 30 percent, while her export volume increased 17-fold
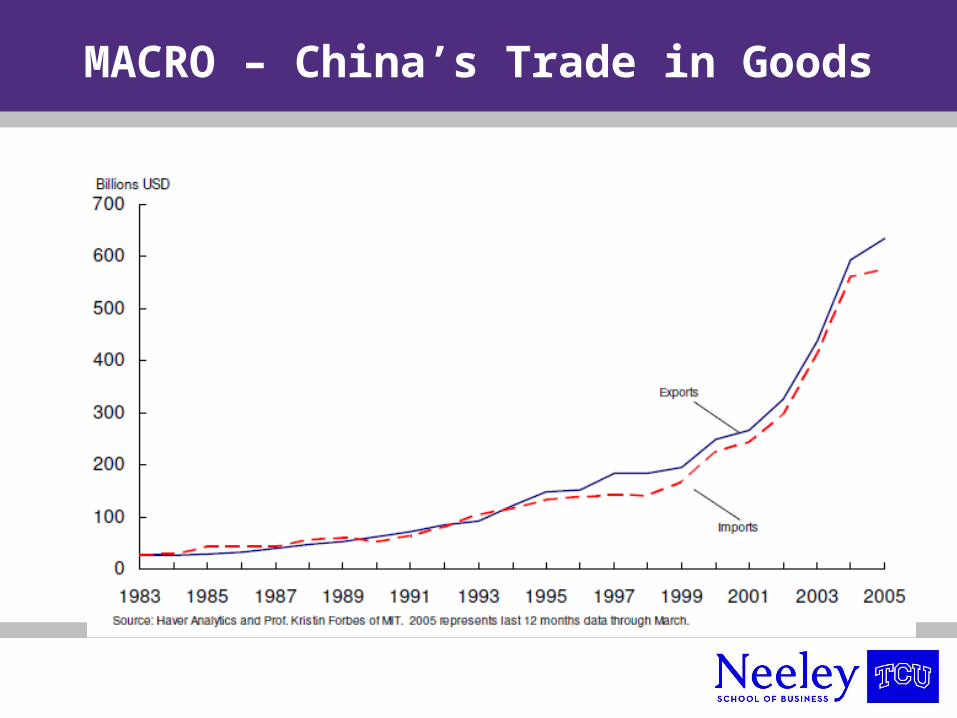
MACRO – China’s Trade in Goods

MACRO
• Asia’s rise is the fourth largest transformation in relative economic power since the industrial revolution
– Early 19th century: rise of the UK
– Late 19th and early 20th centuries: rise of US and Germany
– Post-second world war: Japanese miracle
– 1970 onwards: rise of the rest of Asia, including China and India

GDP, standard and PPP Calculations
2009Country GDP Standard and PPP
United States $ 14.12 trillion $ 14.12 trillion
Japan $ 5.07 trillion $ 4.14 trillion
Germany $ 3.33 trillion $ 2.97 trillion
China $4.99 trillion $ 9.09 trillion
India $ 1.31 trillion $ 3.78 trillion
Korea (Rep. of) $0.83 trillion $ 1.32 trillion
World $ 58.14 trillion $ 72.44 trillion

Entrepreneurship Given Credit
• National Bureau of Statistics– 70% of GDP by firms not majority state
owned
• Keystone Capital – 75% of profits by firms not majority state
owned
• Weak measure– China has complex ownership structures
with mixed models more predominate today
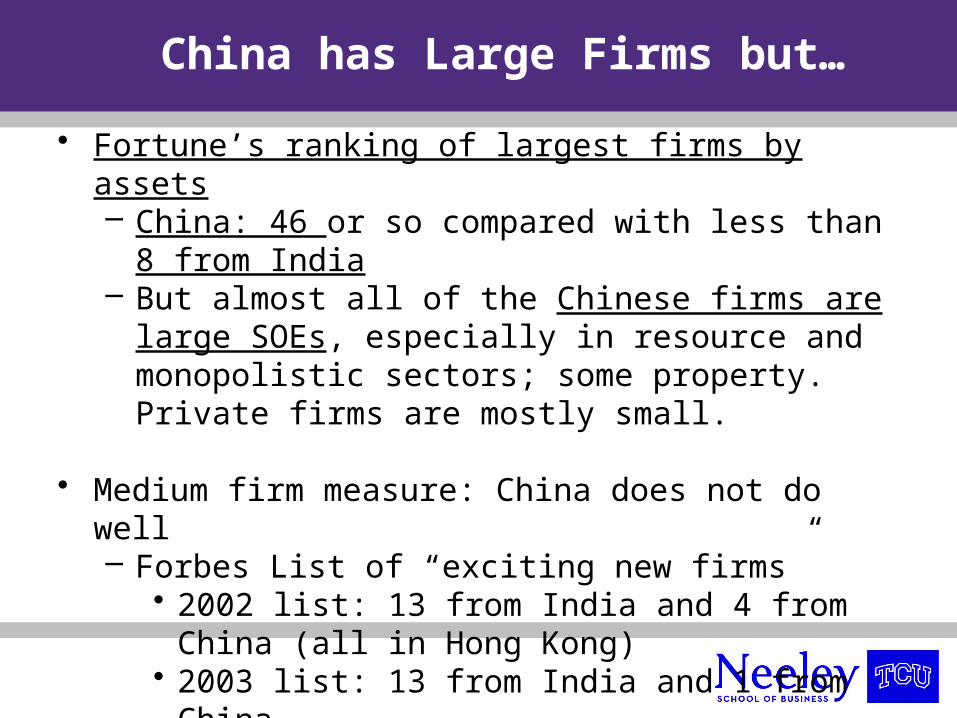
China has Large Firms but…
• Fortune’s ranking of largest firms by assets– China: 46 or so compared with less than 8 from India– But almost all of the Chinese firms are large SOEs,
especially in resource and monopolistic sectors; some property. Private firms are mostly small.
• Medium firm measure: China does not do well– Forbes List of “exciting new firms”
• 2002 list: 13 from India and 4 from China (all in Hong Kong)
• 2003 list: 13 from India and 1 from China
• China is a policy story, not a growth story.
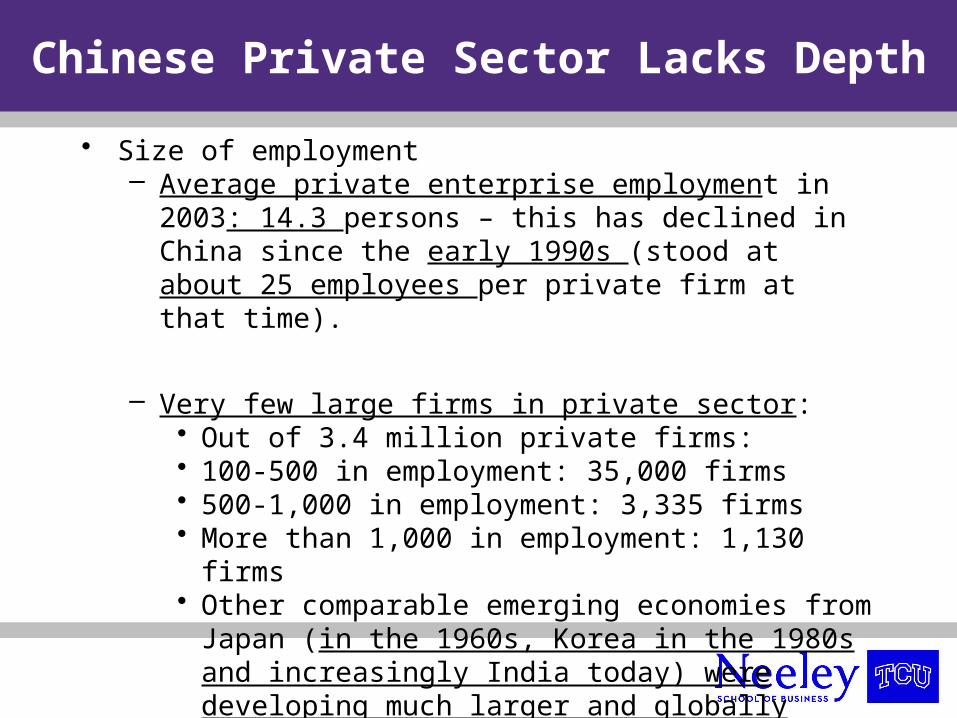
Chinese Private Sector Lacks Depth
• Size of employment– Average private enterprise employment in 2003: 14.3
persons – this has declined in China since the early 1990s (stood at about 25 employees per private firm at that time).
– Very few large firms in private sector:• Out of 3.4 million private firms:• 100-500 in employment: 35,000 firms• 500-1,000 in employment: 3,335 firms• More than 1,000 in employment: 1,130 firms• Other comparable emerging economies from Japan (in
the 1960s, Korea in the 1980s and increasingly India today) were developing much larger and globally competitive private firms.

Entrepreneurship in China Today
• Private sector firms are large in aggregate but small individually
• Collectively, private sector is a large part of China’s economy:– Between 30 to 40% of China’s non-agricultural GDP– Rapid growth
• Employment: 3.7 million in 1993; 47 million 1st half of 2004
• Output value: 42.2 billion yuan in 1989; 2 trillion yuan in 2003
• Dominant in some regions of the country

One Reason:
Ease of doing Business
Country 2008 Ranking 2009 Ranking
United States 3 3
Japan 12 12
China 90 83
India 120 122
Republic of Korea 22 23
Taiwan, China 58 61
Hong Kong, China 4 4
Singapore 1 1
Rankings out of 181 economies
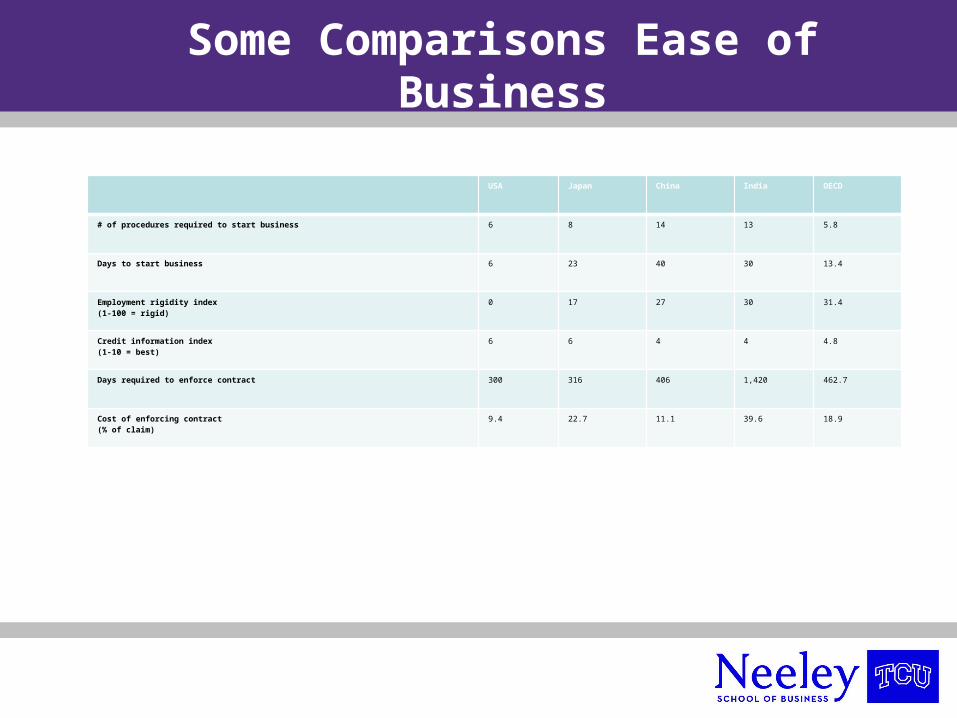
Some Comparisons Ease of Business
USA Japan China India OECD
# of procedures required to start business 6 8 14 13 5.8
Days to start business 6 23 40 30 13.4
Employment rigidity index (1-100 = rigid)
0 17 27 30 31.4
Credit information index (1-10 = best)
6 6 4 4 4.8
Days required to enforce contract 300 316 406 1,420 462.7
Cost of enforcing contract (% of claim)
9.4 22.7 11.1 39.6 18.9
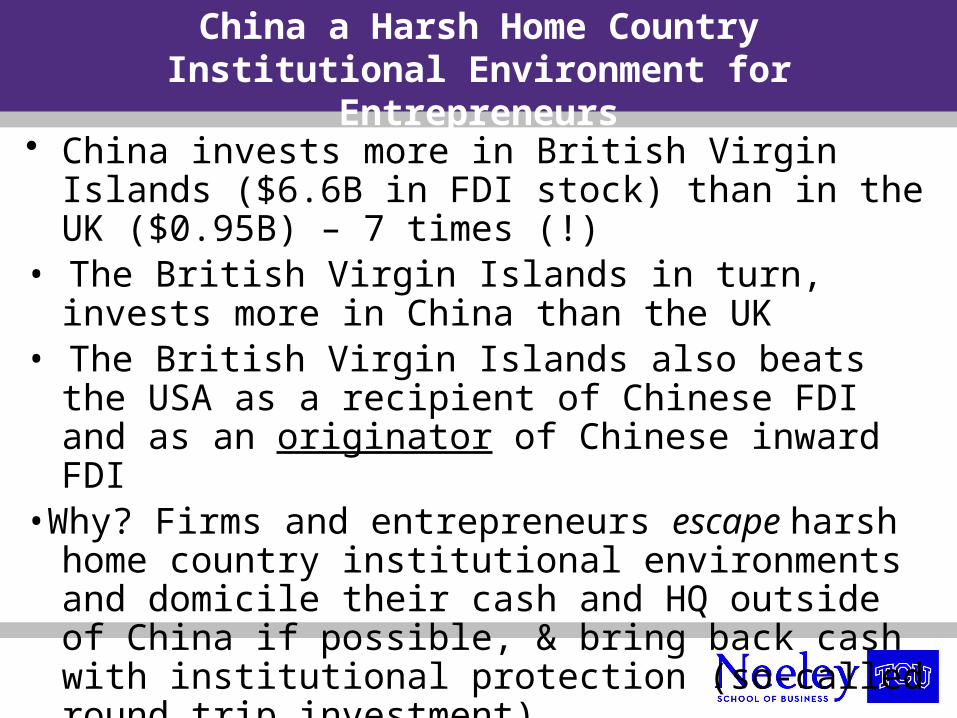
China a Harsh Home Country Institutional Environment for Entrepreneurs
• China invests more in British Virgin Islands ($6.6B in FDI stock) than in the UK ($0.95B) – 7 times (!)
• The British Virgin Islands in turn, invests more in China than the UK
• The British Virgin Islands also beats the USA as a recipient of Chinese FDI and as an originator of Chinese inward FDI
•Why? Firms and entrepreneurs escape harsh home country institutional environments and domicile their cash and HQ outside of China if possible, & bring back cash with institutional protection (so-called round trip investment).

Additional Factors in
Entrepreneurship Environments
Availability of high-risk capital Angels, venture capital firms, bank lending policies
People willing to work for start-up companies Workers: education level, skill sets, costs Managers: experienced - - willing to work with
entrepreneur
Difficulty of acquiring early customers Availability of mentors Exit options Social valuation of entrepreneurial careers

Continuing Problems For Encouraging
Growth Entrepreneurship in China• Still lots of pitfalls:
– Entrepreneurs extremely reluctant to give up control• They grew their businesses in this extraordinarily difficult
environment• 2004 survey: Average equity by the single entrepreneur was
70%– Difficult business environment breeds difficult firms
• Very suspicions of outsiders• Do not listen to venture capitalists and banks• A habit of false accounting to avoid government suppression
and (varying) tax bills• Short-term horizon: Cheating on business partners and
overseas alliance partners.
Greatest Entrepreneurship Success –
Low Cost
• To date greatest success in low cost manufacturing
• But value creation and greatest impact on society comes from technology and greater value added activities
• But high technology entrepreneurship challenged
High Technology Entrepreneurship –
Issues to Consider
• Protection of intellectual property• Expansion of financing for small firms• Increase international integration• Education - barrier
–Computer Science v s MIS–Test driven system
• Education/Culture – barrier– Credential society
– The best people work for large corporations

Continued Low Investment in R&D and Technology Indigenization: R&D by Region, 2006
Japan21.5%North America 43.7%
Europe 28.9%
Rest of Asia 4.8%China & India 0.6% Other 0.5%
Total $478bn
Source: Booz Allen Hamilton as cited in The Economist, 2007
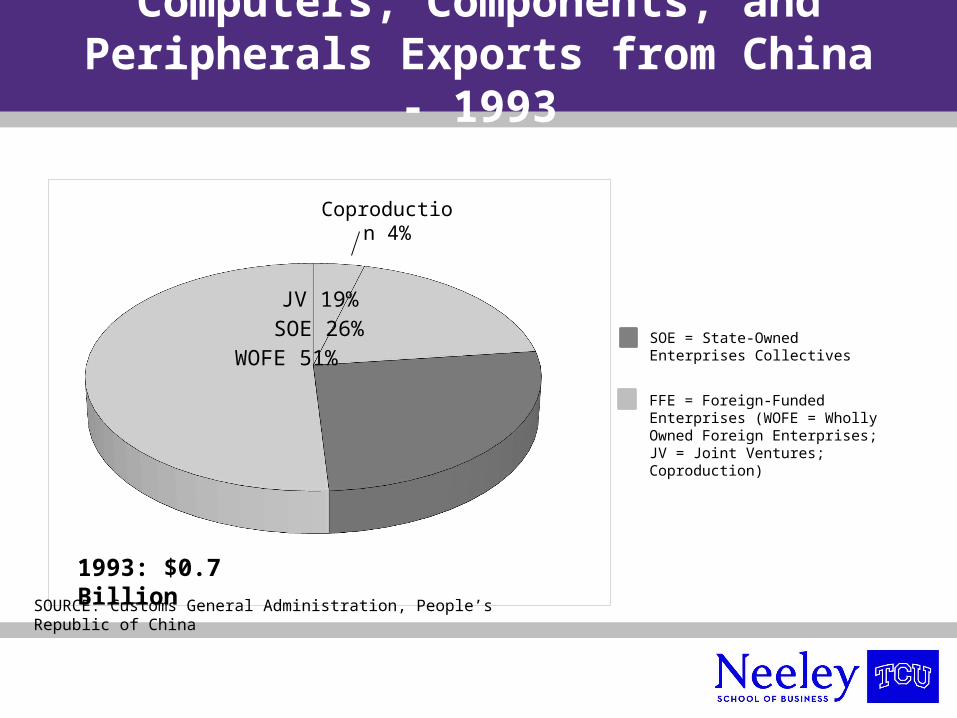
Coproduction 4%
Computers, Components, and Peripherals Exports from China - 1993
JV 19%SOE 26%
WOFE 51%
SOE = State-Owned Enterprises Collectives
FFE = Foreign-Funded Enterprises (WOFE = Wholly Owned Foreign Enterprises; JV = Joint Ventures; Coproduction)
1993: $0.7 Billion
SOURCE: Customs General Administration, People’s Republic of China

Computers, Components, and
Peripherals Exports from China - 2003
WOFE 75%JV 15%
Pri-vate 1%
Col-lec-tive 1% SOE 6%
SOE = State-Owned Enterprises Collectives
FFE = Foreign-Funded Enterprises (WOFE = Wholly Owned Foreign Enterprises; JV = Joint Ventures; Coproduction)
2003: $41 Billion
Coproduction 3%
SOURCE: Customs General Administration, People’s Republic of China
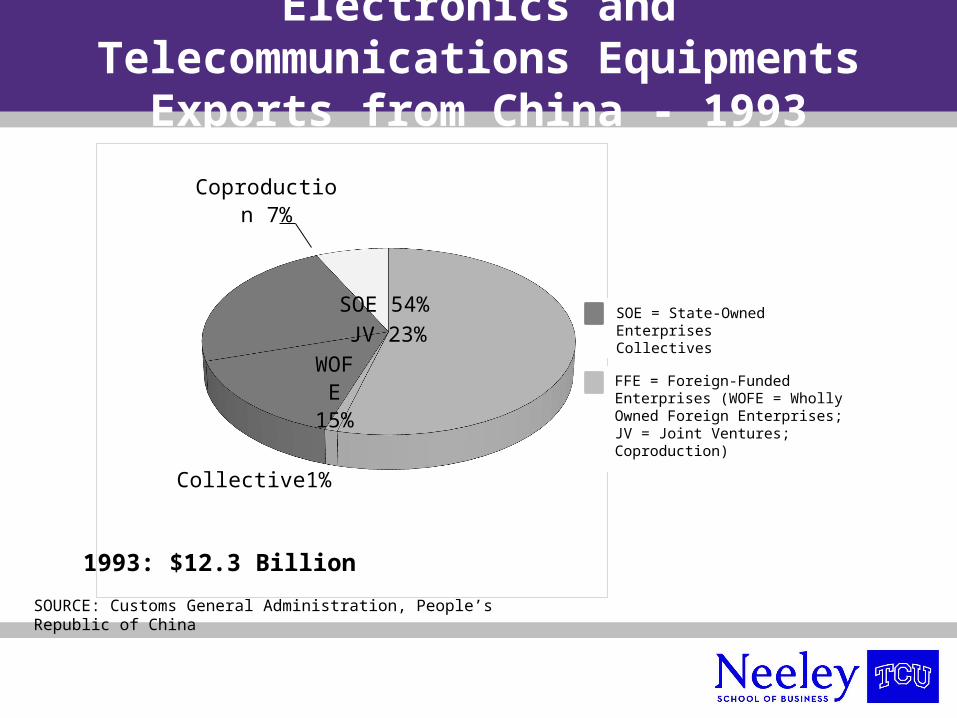
Electronics and Telecommunications
Equipments Exports from China - 1993
SOE 54%
Collective1%
WOFE
15%
JV 23%
Coproduction 7%
SOE = State-Owned Enterprises Collectives
FFE = Foreign-Funded Enterprises (WOFE = Wholly Owned Foreign Enterprises; JV = Joint Ventures; Coproduction)
1993: $12.3 Billion
SOURCE: Customs General Administration, People’s Republic of China

Electronics and Telecommunications
Equipments Exports from China - 2003
WOFE 43%
JV 28%SOE 18%
Collec-tive 3%
Private 5%
Coproduction 3%
SOE = State-Owned Enterprises Collectives
FFE = Foreign-Funded Enterprises (WOFE = Wholly Owned Foreign Enterprises; JV = Joint Ventures; Coproduction)
2003: $89 Billion
SOURCE: Customs General Administration, People’s Republic of China

China Challenges Many of Our
Assumptions on Entrepreneurship
• But have to take great care with the emphasis that over stresses entrepreneurship in China today
• Great success but impact not necessarily what expect
• Looking deeper at China there are other challenges to popular misconceptions
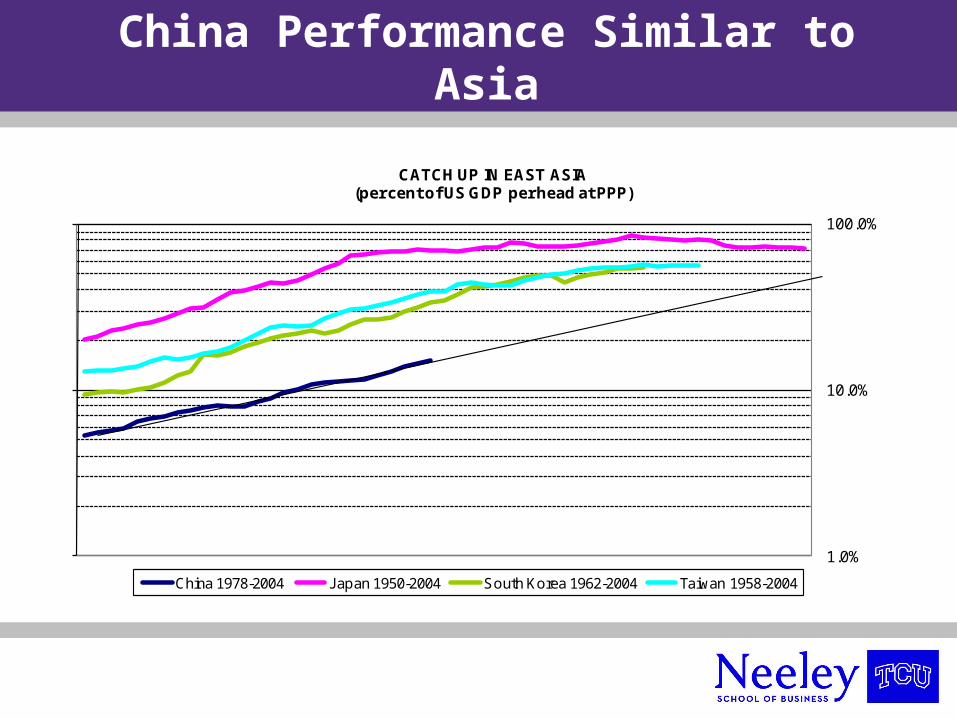
China Performance Similar to Asia
1.0%
10.0%
100.0%
CATCH UP IN EAST ASIA(per cent of US GDP per head at PPP)
China 1978-2004 Japan 1950-2004 South Korea 1962-2004 Taiwan 1958-2004

India & China Also Similar Patterns

China & Japan Economic Source of
Growth Different
• Japan in the early 1980s?– Beginning of the rise of Japanese corporate giants &
outward investment– Japan: These firms created “lean production”,
“Toyota way” all created by domestic Japanese firms– Nothing similar China
• A story of two ratios– Japan (1981): 25.8 times {outward FDI over its
inward FDI}– China (2004): 33.6 times {inward FDI over its
outward FDI}

India vs China

Trade – China & India
• In 1990 $270m trade between China & India
• Approximately $60 billion trade in 2010
• 70% of trade from India – natural resources – ie iron ore
• Core competency of each nation – knowledge & services India & China manufacturing

China Has Export Dominance
Over India• Percent share of world export in garment:
– Identical shares in early 1980s: China: 3.93%; India: 3.95%– Late 1990s: China: 20.5%; India: 5.3%– Apparel export to US: China is five times that of India (by
quantity)– Same story in fabrics, leather and leather manufactures,
textiles• China even did better in jewelry exports:
– 1998-2000: China: 9.48%; India: 4.61%– Not constrained by quotas
• Labor-intensive FDI in China– About 50% of China’s FDI was in labor-intensive industries in
the 1990s: between $15 to $20 billion– Total FDI inflow to India: $4 to $5 billion

But Future Is Complex
GROWTH OF THE TWO GIANTS - 2000-2050(per cent a year)
0.0%
1.0%
2.0%
3.0%
4.0%
5.0%
6.0%
7.0%
8.0%
9.0%
China India
2000-2005 2005-2010 2010-2015 2015-2020 2020-2025 2025-2030 2030-2035 2035-2040
2040-2045 2045-2050
Source: Goldman Sachs

Economic Growth
• Chinese economy is four times bigger
• India’s economic growth rate will overtake China’s by 2013
• Then India will grow faster than any other large country over the next 25

Issues – China vs India
• Government – India’s democracy chaotic but result is patronage government is non-factor
• Protection of intellectual property better India – critical as move to more knowledge economy in future
• Age of people in nation
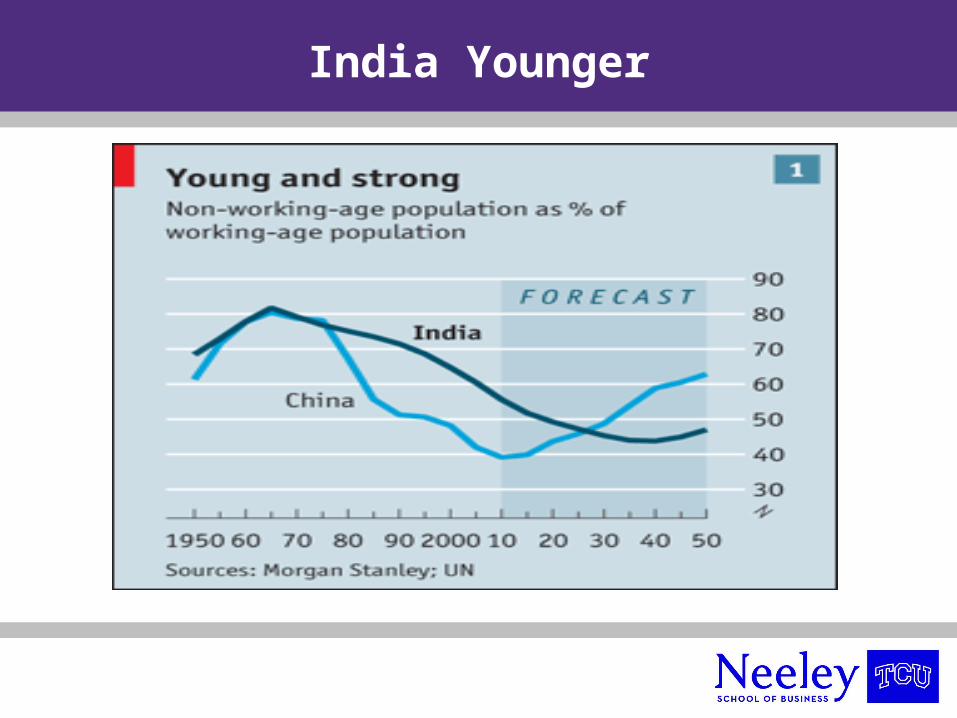
India Younger
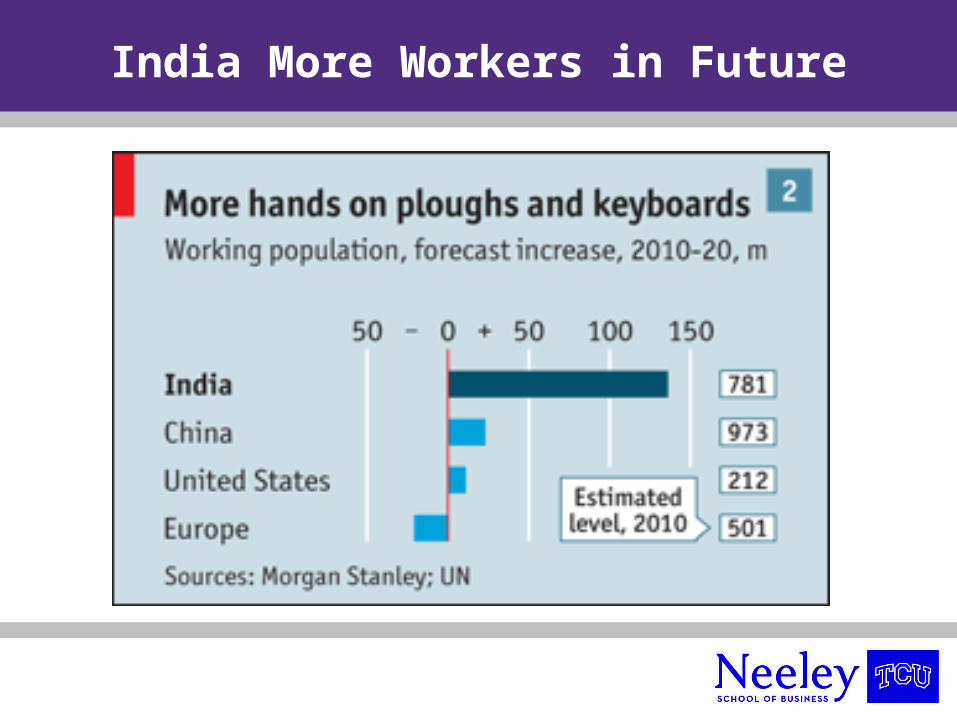
India More Workers in Future

Pharmaceutical Industry as a
Case Study
• China– Larger market as measured by sales– Larger export value– More FDI-dominant but also a large state sector
• India– More competitive firms– Export higher value-added– Higher operating margins– More R&D intensive– Declining MNCs’ market share but almost no public
sector presence in this industry

China has the Scale in
Pharmaceutical Industry
• Size of market: Annual sales– India: $8.2 billion (2010)– China: $22.9 billion (2009)
• Export– India: $9.4 billion in 2009; $3.2 billion in 2003– China exports more, about $24.6 billion (2007)– China second only to the US in pharmaceutical
chemicals

…but India has the Depth
• Export– Yes, China exports more– But mainly pharmaceutical chemicals: $3.7 billion in
2003– Drugs: $790 million in 2002– Even in herbal medicine, China is losing to Japan and
Korea– Herbal medicine export: 1995: $770 million but in
2002: $600 million
• Internationally approved new drugs:– China: Only two– India: Many
A Story of Two Firms
• Biggest firms
– India: Ranbaxy with $972 million (2003)
– China: Shanghai Pharma Group (SPG): $1.53 billion (1998)
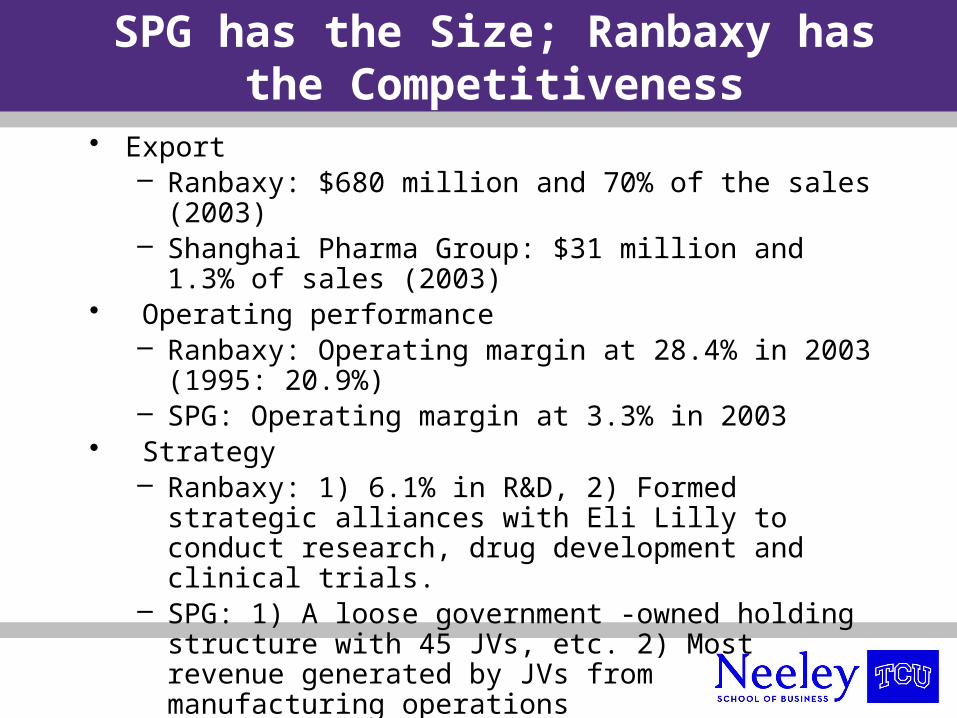
SPG has the Size; Ranbaxy has the
Competitiveness• Export
– Ranbaxy: $680 million and 70% of the sales (2003)– Shanghai Pharma Group: $31 million and 1.3% of sales
(2003)• Operating performance
– Ranbaxy: Operating margin at 28.4% in 2003 (1995: 20.9%)– SPG: Operating margin at 3.3% in 2003
• Strategy– Ranbaxy: 1) 6.1% in R&D, 2) Formed strategic alliances with
Eli Lilly to conduct research, drug development and clinical trials.
– SPG: 1) A loose government -owned holding structure with 45 JVs, etc. 2) Most revenue generated by JVs from manufacturing operations
Future for China Will Depend on
Entrepreneurship
• China officials realize that need to move up value chain
• Key to ability to move up value chain is entrepreneurship
• State– 5 year economic plan recognizes need for
moving up value chain & entrepreneurship– Encourages R&D
• Domestic firm R&D• Location of research centers by MNE

Scholarship on Entrepreneurship &
China
• Take a balanced non-political view– China will be success but its outcomes may
not be what is expected looking at mature economies
• Recognize the difference in entrepreneurship and small business – value creation is key
• Expand our understanding of entrepreneurship to mixed models of ownership
Scholarship Continued
• Theory still applies – China is setting– Not a theory of Chinese entrepreneurship
• Qualitative in-depth understanding is often needed before we do large scale investigations – don’t just duplicate Western study in China

Scholarship Continued
• Greatest success is in low cost manufacturing – not as sexy but dominate– OEM manufacturers and how they bring
skills back to China– Emergent economy to emergent economy

What May Research Look
Like?
• Bruton, G. D. & Ahlstrom, D. (2003). An institutional view of China’s venture capital industry: Explaining the differences between China and the West. Journal of Business Venturing. 18: 233-259.
Research• Qualitative research
– 36 interviews with venture capitalists– 3 funded firms– Follow up multiple industry experts &
government officials
• Transcripts of all interviews (translation to English when needed)

Topics Examined
• Four broad topical areas:– (1) selection process for firms to be funded,
– (2) structuring of relationships & monitoring of the funded firm,
– (3) value-added activities provided to the
funded firm, and
– (4) exit.
Findings – Selection
Clear nature of the investment framework employed in China differs from West.
• Screens employed to initially evaluate ventures – Fund ventures within reasonable physical
distance to accurately monitor those firms and the avoidance of firms without proven or checkable financials
– Due diligence focuses on entrepreneur’s background
Findings
Value Added & Monitoring• Once the deal funded fewer value-
added activities provided by the venture capitalist - Chinese culture promotes resistance to such activities
• Monitoring function by venture capitalists more direct monitoring of funded firms.
Findings - Exit
• Exit opportunities through IPO are still very limited.
• Purchase of firm by strategic buyer is more likely, though market for corporate control is in nascent stage.
Future
“Let China sleep, for when she wakes, she will shake the world.”
Napoleon Bonaparte