Embed Size (px)
Citation preview
gasnetworks.ie
assessing future demand and supply position
NetworkDevelopmentPlan 2016
Table of Contents network development plan 2016
1. Foreword 22. Executive Summary 43. Introduction 63.1 overview of the Gas networks ireland system 83.2 investment infrastructure 103.3 historic demand & supply 113.3.1 roi annual primary energy requirement 113.3.2 historic annual Gas demand 123.3.3 historic peak day Gas demand 133.3.4 ireland’s weather 133.3.5 wind powered Generation 143.3.6 electricity interconnectors 143.3.7 historic Gas supply 15
4. Gas Demand Forecasts 164.1 Gas demands 174.1.1 Gas demand forecasting 184.2 Gas demand scenarios 204.3 demand forecast assumptions 214.3.1 power Generation sector 214.3.2 industrial & commercial sector 234.3.3 residential sector 244.3.3.1 Energy Efficiency 254.3.4 compressed natural Gas for transport 254.4 the demand outlook 264.4.1 power Generation sector Gas demand 264.4.2 industrial & commercial sector Gas demand 274.4.3 residential sector Gas demand 284.4.4 total annual Gas demand 294.4.5 peak day Gas demand 304.4.6 demand sensitivities 324.4.6.1 e wic & Gas demand 32
4.4.7 moneypoint to Gas 32
5. Gas Supply 345.1 moffat entry point 375.2 celtic sea Gas storaGe 375.3 corrib Gas 385.4 shannon lnG 385.5 renewable Gas 395.6 other supply developments 39
6. Gas Growth Strategy 406.1 residential new connections Growth 426.2 industrial & commercial sector development 436.2.1 data centres 436.2.2 combined heat & power 446.2.3 other developments 45
6.3 compressed natural Gas in transport 466.4 renewable Gas 486.5 electricity sector 51
7. System Operation 527.1 challenGes 547.1.1 demand variation 55
8. Projects of Common Interest & Security of Gas Supply 568.1 projects of common interest (pci) 578.2 physical reverse flow at moffat 588.3 european reGulation 994/2010 588.4 emerGency preparedness 59
9. Commercial Market Arrangements 609.1 republic of ireland Gas market 619.2 european developments 629.2.1 capacity allocation mechanism 629.2.2 joint capacity booking platform 639.2.3 congestion management procedures 639.2.4 balancing 639.2.5 Tariffs 649.2.6 remit 659.2.7 transparency 65
10. Adequacy Of The Gas Network 6610.1 the roi transmission system 6710.2 south west scotland onshore system 6810.3 southern reGion 6910.4 beattock compressor station – flow fleXibility and minimum system limits 70
11. Capital Investment 7211.1 overview 7311.2 reGulatory capital allowance 7311.3 planned capital proGrammes 7511.3.1 pipelines 7511.3.2 pressure regulating station refurbishment 7511.3.3 distribution network rolling programmes 75 11.3.4 communications & instrumentation 7511.3.5 meters 7511.3.6 compressors 7611.4 future investment 7611.4.1 the Goatisland to curraleigh west reinforcement. 7611.4.2 midleton compressor station 7711.4.3 longer term projects – local area (regional) reinforcement 7811.5 smart meters 79
12. CER Commentary 80
Appendicesappendix 1: historic demand 82
appendix 2: demand forecasts 87
assumptions 87
forecast 88
Appendix 3: Energy Efficiency Assumptions 93
National Energy Efficiency Action Plan 2014 94
impact on residential Gas demand 95
impact on i/c Gas demand 95
appendix 4: transmission network modelling 96
entry point assumptions 97Glossary 101
List of Figuresfigure 3-1: overview of the Gas networks ireland transmission system 09
figure 3-2: roi tper analysis by fuel (2013 & 2014) 11
figure 3-3: historic annual Gas demand 12
figure 3-4: historic roi peak day Gas demand 13
figure 3-5: historic annual indigenous Gas production and Great britain (Gb) imports 15
figure 4-1: key demand forecasting assumptions 18
figure 4-2: Gas demand scenarios overview. 20
figure 4-3: forecast single electricity market (sem) thermal Generation mix 22
figure 4-4: eirgrid Generation capacity statement electricity demand forecasts for roi 22
figure 4-5: Gdp assumptions 23
figure 4-6: residential connection numbers 24
figure 4-7: power Generation sector Gas demand 26
figure 4-8: industrial & commercial sector Gas demand 29
figure 4-9: residential sector Gas demand 28
figure 4-10: total annual roi Gas demands 29
figure 4-11: median scenario annual roi demand by sector 29
figure 4-12: peak day Gas demand forecast 30
figure 4-13: 2015/16 peak day electricity demand and wind Generation 31
figure 4-14: possible routing of pipeline to moneypoint. 33
figure 5-1: bellanaboy Gas terminal 35
figure 5-2: annual Gas networks ireland system Gas supply forecast – median scenario 36
figure 5-3: 1-in-50 year peak day Gas supply forecast – median scenario 36
figure 6-1: chp share of total electricity production – source eurostat. 44
figure 6-2: agrivert anaerobic digestion facility, wallingford, uk 48
figure 7-1: power Generation fuel supply mix march 2016 55
figure 10-1: south west scotland onshore system 68
figure 11-1: pc3 capital allowance excluding non-pipe and work in progress 74
figure a1-1: historic daily demand of transmission connected sites 84
figure a1-2: historic daily demand of distribution connected sites 85
List Of Tablestable 4-1: 1-in-50 peak day forecasting assumptions 19
table 4-2: annual cnG demand forecasts (Gwh) 25
table 5-1: inch forecast maximum daily supply 37
table 5-2: corrib forecast maximum daily supply 38
table 5-3: renewable Gas supply forecast (Gwh) 39
table 6-1 indicative carbon emissions by fuel type 51
Table 9-1: Transmission Tariffs Calculation Methodology 64
table a1-1: historic Gas networks ireland annual Gas demands (actual) 83
table a1-2: historic Gas networks ireland peak day Gas demands (actual)1 83
table a1-3: historic roi annual Gas demands (actual) 83
table a1-4: historic roipeak day Gas demands (actual) 84
Table A1-5: Historic Annual Gas Supplies Through Moffat, Inch and Corrib 85
Table A1-6: Historic Peak Day Gas Supplies Through Moffat and Inch 85
table a1-7: historic coincident peak day and annual roidemands 86
table a1-8: historic non-coincident peak roi demand by sector 86
table a2-1: future Gdp assumptions 87
table a2-2: residential new connections 87
table a2-3: 1-in-50 peak day demand – low demand scenario (Gwh/d) 89
table a2-4: 1-in-50 peak day demand – median demand scenario (Gwh/d) 89
table a2-5: 1-in-50 peak day demand – high demand scenario (Gwh/d) 89
table a2-6: average year peak day demand – low demand scenario (Gwh/d) 90
table a2-7: average year peak day demand – median demand scenario (Gwh/d) 90
table a2-8: average year peak day demand – high demand scenario (Gwh/d) 90
table a2-9: annual demand – low demand scenario (twh/y) 91
table a2-10: annual demand – median demand scenario (twh/y) 91
table a2-11: annual demand – high demand scenario (twh/y) 91
table a2-12: maximum daily supply volumes 92
Table A3-1: NEEAP 3 Energy Efficiency Savings Targets 94
table a4-1: entry point assumptions 97 Data Freeze and Roundingin order to complete the detailed analysis and modelling required to produce this document, the demand and supply scenarios were defined in March 2016, based on the most up to date information at the time. in presenting the data obtained for publication in the network development plan, energy values have been rounded to one decimal place, and aggregated growth/contraction rates are expressed as whole numbers to aid clarity. in certain cases, rounding may lead to slight variance in sum totals.
DisclaimerGas networks ireland has followed accepted industry practice in the collection and analysis of data available. however, prior to taking business decisions, interested parties are advised to seek separate and independent opinion in relation to the matters covered by the present network development plan and should not rely solely upon data and information contained therein. information in this document does not purport to contain all the information that a prospective investor or participant in the republic of ireland’s gas market may need.
Copyright Noticeall rights reserved. this entire publication is subject to the laws of copyright. this publication may not be reproduced or transmitted in any form or by any means, electronic or manual, including photocopying without the prior written permission of Gas Networks Ireland.
01

welcome to the 2016 ten-year network development plan (ndp) published by Gas networks ireland.
this document sets out our assessment of the future demand and supply position for the natural gas industry in the republic of ireland (roi). the document also examines system operation and consequent capital investment requirements.
Section Oneforeword
Network Development Plan 2016
02
Gas has a key role to play in transitioning the irish economy to a low carbon future over the coming years. There are many social, economic and environmental benefits which gas can bring to consumers in ireland and the economy as a whole. as the most environmentally friendly fossil fuel, natural gas is clean, secure, flexible and adaptable in meeting ireland’s energy needs.
The Corrib gas field came on stream in 2015, further enhancing Ireland’s energy security position. the scheduled completion of the twinning project in scotland in 2017/18 will enhance ireland’s connectivity to the uk and european gas markets and will also provide network capacity to meet expected growth in gas demand.
in the transport sector, compressed natural Gas (cnG) will emerge as an alternative fuel, particularly in commercial transport, in line with national and european policy. cnG has a unique capacity to help ireland meet its environmental targets as they relate to transport and will lead to very significant reductions in Carbon and other greenhouse gas and particulate emissions.
the development of renewable gas on the irish grid will also contribute to enhanced energy security and diversity of supply, while supporting rural and regional development. renewable gas development will be a vital component in moving ireland to a fully sustainable energy future.
Gas networks ireland continues to value your input and we encourage you to provide feedback so that we can add value to the analysis we provide on the status and future of natural gas in the republic of ireland. we welcome feedback at [email protected]
we would like to acknowledge the contribution of all stakeholders during the process of preparing this document.
Liam O’Sullivan,Managing Director, Gas Networks Ireland.
03
the network development plan (ndp) provides a view of how the gas network will develop over a ten year period. it is based on current supply and demand for gas, as well as projections for growth in gas consumption and development of infrastructure. the document also examines system operation and consequent capital investment requirements.
in order to provide a comprehensive analysis Gas networks ireland has developed three gas demand scenarios for the period 2015/16 to 2024/25, namely low, median and high demand scenarios. these scenarios are designed to represent a broad range of likely outcomes and are informed by a range of external and internal factors. the sole purpose of these scenarios is to assess the capability of the gas network and determine network investment requirements.
in the median demand scenario annual roi gas demand is expected to grow by 28% between 2015/16 and 2024/25 with growth of 14% and 44% forecast in the low and high demand scenarios respectively over the same horizon.
the development of peak day demands across the various scenarios shows the same broad trends as the annual demand forecasts. however, there are a number of key differences, particularly with regard
to the power generation sector gas demand profile. Over the forecast horizon 1-in-50 peak day demand is predicted to grow by 22% and by 24% for the average year peak in the median demand scenario.
The Corrib gas field commenced production on the 31st of december 2015 and is expected to meet approximately 55% of annual Gas networks ireland system demands in 2016/17. However the Moffat entry point will remain key in terms of
energy security as corrib production declines in the medium term. the kinsale storage facility has commenced blowdown of southwest kinsale cushion gas in 2016, with production expected to cease in 2021.
in recent years there has been a reduction in gas being transported through ireland’s gas infrastructure, mainly due to reductions in gas fired power generation due to the impact of renewables. however Gas networks ireland is focused on developing a number of growth initiatives to maintain demand on the system as a whole. developing growth initiatives will help to maintain a certain level of system demand which is important for the competitiveness of gas, which will benefit all gas customers.
the gas network extends to over 640,000 irish homes and 25,000 businesses. however, there are a large number of properties located close to the gas network which are not connected to the network. this presents an opportunity to increase the number of people connected to the network. Gas networks ireland has committed more resources to the new connections and has already seen an increase in connections for 2015 compared with 2014.
Section TwoeXecutive summary
Network Development Plan 2016
04
ireland has rapidly emerged as a prime data hosting destination. Gas networks ireland is focused on developing a combined offering of natural gas, renewable gas and combined heat and power (chp), as the primary source of energy for the data centre sector. Gas can be used for onsite electricity generation leveraging the existing reliable natural gas network infrastructure, offering data centre operator’s substantial savings in terms of energy costs.
using compressed natural Gas (cnG) to power trucks and buses offers a real solution to reducing emissions from diesel-fuelled heavy vehicles. in order to encourage the uptake of CNG by commercial fleet operators Gas networks ireland intends to provide full national coverage of public cnG fast-fill compressor stations. Gas Networks ireland is proposing to develop a 70-station cnG fuelling network, co-located in existing forecourts, on major routes and/or close to urban centres.
renewable gas is an indigenous, clean, sustainable, and carbon neutral source of energy. renewable gas can be produced from many organic materials and upgraded to a standard which is identical to natural gas, that can then be injected into the gas network. The benefits of facilitating renewable gas on ireland’s gas grid include enhanced energy security and diversity of supply, while also creating direct employment and enhancing rural and regional economic development. however, state support is required to cover the price gap between wholesale natural gas and the cost of producing bio-methane. inclusion of bio-methane or renewable gas in the renewable heat incentive (rhi) is critical for the development of renewable gas to grid projects in ireland.
the moneypoint coal plant in co. clare is due to come to the end of its operating life, in its current configuration, in 2025. Gas networks ireland believes that a modern combined cycle gas turbine (ccGt) gas plant offers by far the most efficient and cost effective solution for the Moneypoint site in the long term. Gas networks ireland has carried out an analysis which indicates that there would be sufficient capacity on the ring-main transmission system to cater for a ccGt connection via a new spur transmission pipeline to moneypoint.
the operation of the gas system has changed considerably since the network was originally designed, particularly with corrib coming on line. while the new entry point has brought with it enhanced security of supply, it has also created a need for low and variable flows in South West Scotland at the Moffat Entry point, which impacts the running of Gas networks ireland’s compressor station and how flow rates are profiled over the course of a gas day.
Gas networks ireland has undertaken an analysis to identify the optimum solution to enhance its operations to meet the needs of the market, and to ensure the safe and secure operation of a flexible and reliable gas network. this points to the need for more flexible compressor/turbine technology to complement the existing fleet at Beattock Compressor station, which would accommodate a wider operating range, allow low volumes to flow in an economic and environmentally sustainable manner, and enhance the existing capacity at Moffat.
Gas networks ireland has recently completed a study to identify the optimum economic and technical solution to address
the potential capacity constraint on the southern region of the transmission network. the optimum solution for the short to medium term has emerged as the up-rating of the pipeline to the west and Gormanston to ballough pipelines to 85 barg. in addition, further reinforcement may be required in the longer term.
twinning of the south west scotland onshore system (pci 5.2), remains on schedule for completion in 2017/18 and will enhance security of supply to the island of ireland. Gni (uk) is in the process of submitting a funding application in the second connecting europe facility (cef) call for proposals issued in june 2016, for feasibility studies for physical reverse flow at Moffat. This project will look at physical reverse flow from Republic of Ireland to Great britain, and also to northern ireland via the scotland northern ireland pipeline, providing security of supply benefits on a regional basis, in addition to increased market integration and increased competition.
Gas networks ireland will continue to ensure that a resilient, robust and safe gas network is maintained to ensure security of supply to customers through appropriate and efficient investment. Gas networks ireland notes the result of the united kingdom european union membership referendum and is committed to working with industry partners to ensure that there will be no impact on the operation of the gas network, particularly in terms of security of supply.
05
Key Messages:
• annual roi gas demands for 2015/16 are anticipated to be 6.8% above 2014/15 demands following a 0.9% decrease the previous year
• During 2014/15 the Moffat Entry Point accounted for 94% of system throughput and 93% of roi demands.
• the supply dynamic is now changing with corrib coming on stream, operating initially at a reduced capacity, meeting 30% of system peak day demands on the 2015/16 peak day.
Network Development Plan 2016
06
Section Threeintroduction
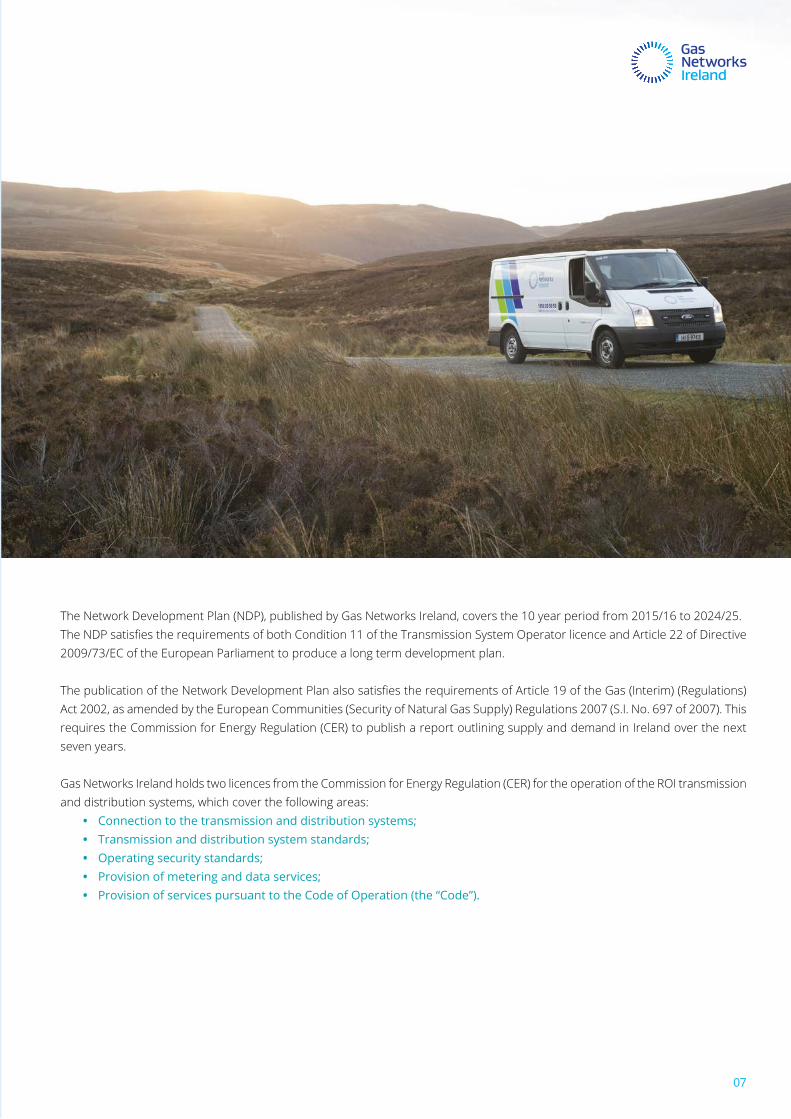
the network development plan (ndp), published by Gas networks ireland, covers the 10 year period from 2015/16 to 2024/25.The NDP satisfies the requirements of both Condition 11 of the Transmission System Operator licence and Article 22 of Directive 2009/73/ec of the european parliament to produce a long term development plan.
The publication of the Network Development Plan also satisfies the requirements of Article 19 of the Gas (Interim) (Regulations) act 2002, as amended by the european communities (security of natural Gas supply) regulations 2007 (s.i. no. 697 of 2007). this requires the commission for energy regulation (cer) to publish a report outlining supply and demand in ireland over the next seven years.
Gas networks ireland holds two licences from the commission for energy regulation (cer) for the operation of the roi transmission and distribution systems, which cover the following areas:
• Connection to the transmission and distribution systems;• Transmission and distribution system standards;• Operating security standards;• Provision of metering and data services;• Provision of services pursuant to the Code of Operation (the “Code”).
07
3.1 Overview of the Gas Networks Ireland System
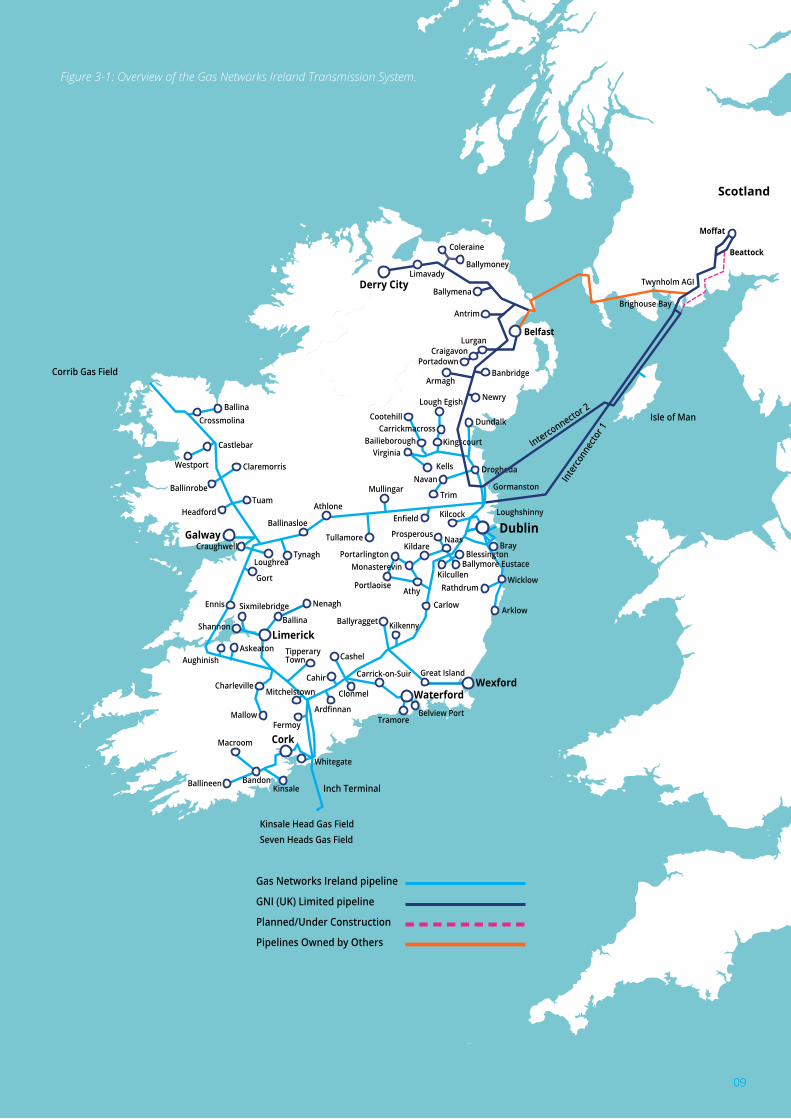
the Gas networks ireland transmission network1 includes onshore scotland, interconnectors and the onshore roi network. the interconnector (ic) sub-system comprises of two subsea interconnectors between roi and scotland; compressor stations at Beattock and Brighouse Bay, and 110 km of onshore pipeline between Brighouse Bay and Moffat in Scotland. The Interconnector sub-system connects to Great Britain’s (GB) National Transmission System (NTS) at Moffat in Scotland. It also supplies gas to the northern ireland (ni) market at twynholm and the isle of man (iom) market via the second subsea interconnector (ic2).
the Gas networks ireland network is 13,772 km in length, consisting of 2,433 km of high pressure steel transmission pipelines and 11,339 km lower pressure polyethylene distribution pipelines, as well as above Ground installations (aGis), district regulating installations (dris) and compressor stations at entry points in roi and scotland. aGis and dris are used to control and reduce pressures on the network.
The ROI onshore part of the system consists primarily of a ring-main system with spur lines serving various network configurations and a compressor station located in midleton co. cork.
The gas infrastructure is differentiated by the following pressure regimes:• high pressure transmission infrastructure which operates above 16 barg;• distribution infrastructure which operates below 16 barg.
the distribution infrastructure is typically operated at 4 barg and less than 100 mbarg for inner city networks.
The Gas Networks Ireland network is 13,772 km in length, consisting of 2,433 km of high pressure steel transmission pipelines and 11,339 km lower pressure polyethylene distribution pipelines.
Section Threeintroduction
1 the Gas networks ireland network includes both assets in roi and Gni (uk) limited owned assets in ni & south west scotland. this network development plan only assesses the roi and south west scotland infrastructure.
Network Development Plan 2016
08
Corrib Gas Field
Scotland
Isle of Man
Kinsale Head Gas FieldSeven Heads Gas Field
Castlebar
Westport Claremorris
Ballinrobe
Headford
LoughreaTynagh
Gort
Galway
Tuam
Ballinasloe
Athlone
Tullamore
Mullingar
Kilcock
Virginia
CarrickmacrossCootehill
Newry
Banbridge
Lurgan
Dundalk
Drogheda
Gormanston
Loughshinny
CrossmolinaBallina
Limerick
Cork
Nenagh
Craughwell
Trim
NavanKells
Bailieborough Kingscourt
Lough Egish
Armagh
PortadownCraigavon
Interconnector 2
Inte
rcon
necto
r 1
Antrim
Moffat
Beattock
Twynholm AGI
Brighouse BayBallymena
Limavady
Coleraine
Ballymoney
Enfield
Ennis
BallinaShannon
AskeatonAughinish
Sixmilebridge
Mitchelstown
Cahir
Fermoy
Charleville
Mallow
KinsaleBandonBallineen
Macroom
Whitegate
Inch Terminal
Belfast
Derry City
Tramore
Carrick-on-Suir
Kilkenny
Great Island
CarlowAthy
Kildare
KilcullenMonasterevin
NaasProsperous
Ballymore Eustace
Portlaoise
Ballyragget
Portarlington
Arklow
Wicklow
BrayBlessington
Rathdrum
Clonmel
Ardfinnan
Tipperary Town Cashel
Dublin
WaterfordWexford
Gas Networks Ireland pipeline
GNI (UK) Limited pipeline
Planned/Under Construction
Pipelines Owned by Others
Belview Port
Figure 3-1: Overview of the Gas Networks Ireland Transmission System.
09
3.2 Investment Infrastructure
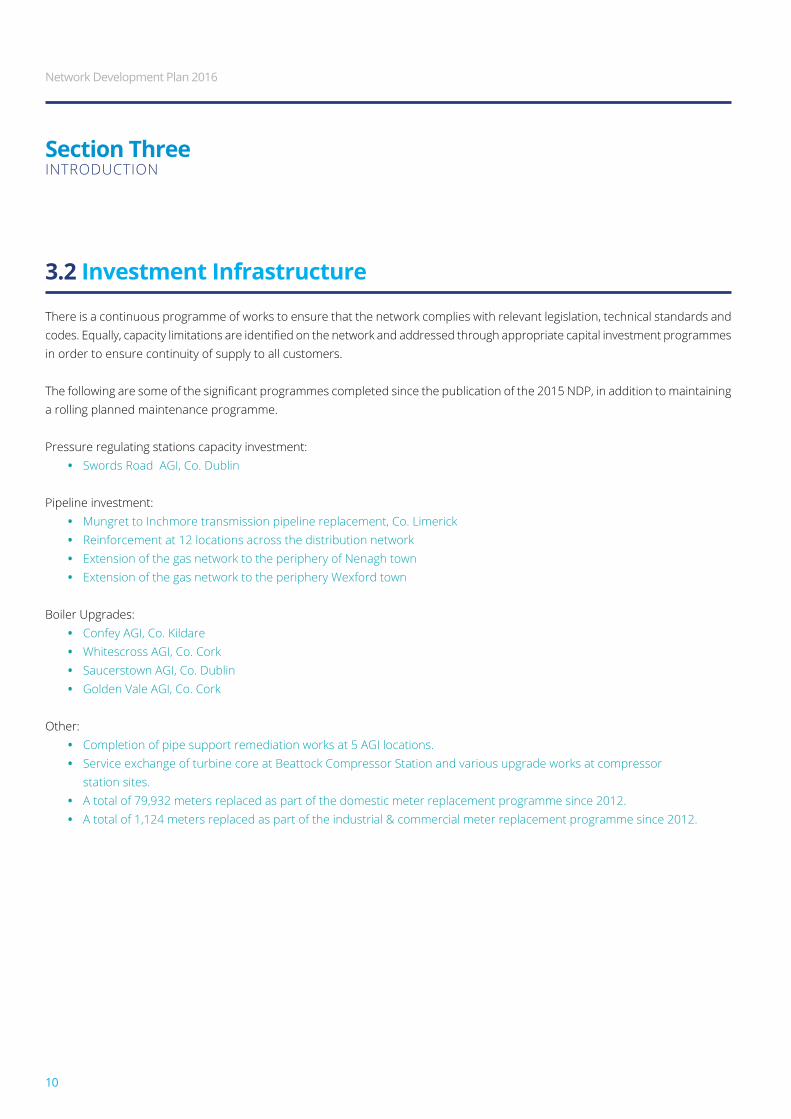
there is a continuous programme of works to ensure that the network complies with relevant legislation, technical standards and codes. Equally, capacity limitations are identified on the network and addressed through appropriate capital investment programmes in order to ensure continuity of supply to all customers.
The following are some of the significant programmes completed since the publication of the 2015 NDP, in addition to maintaining a rolling planned maintenance programme.
pressure regulating stations capacity investment:• swords road aGi, co. dublin
pipeline investment:• mungret to inchmore transmission pipeline replacement, co. limerick• reinforcement at 12 locations across the distribution network• extension of the gas network to the periphery of nenagh town• extension of the gas network to the periphery wexford town
boiler upgrades:• confey aGi, co. kildare• whitescross aGi, co. cork• saucerstown aGi, co. dublin• Golden vale aGi, co. cork
other:• completion of pipe support remediation works at 5 aGi locations.• service exchange of turbine core at beattock compressor station and various upgrade works at compressor station sites.• a total of 79,932 meters replaced as part of the domestic meter replacement programme since 2012.• a total of 1,124 meters replaced as part of the industrial & commercial meter replacement programme since 2012.
Section Threeintroduction
Network Development Plan 2016
10
3.3 Historic Demand & Supply
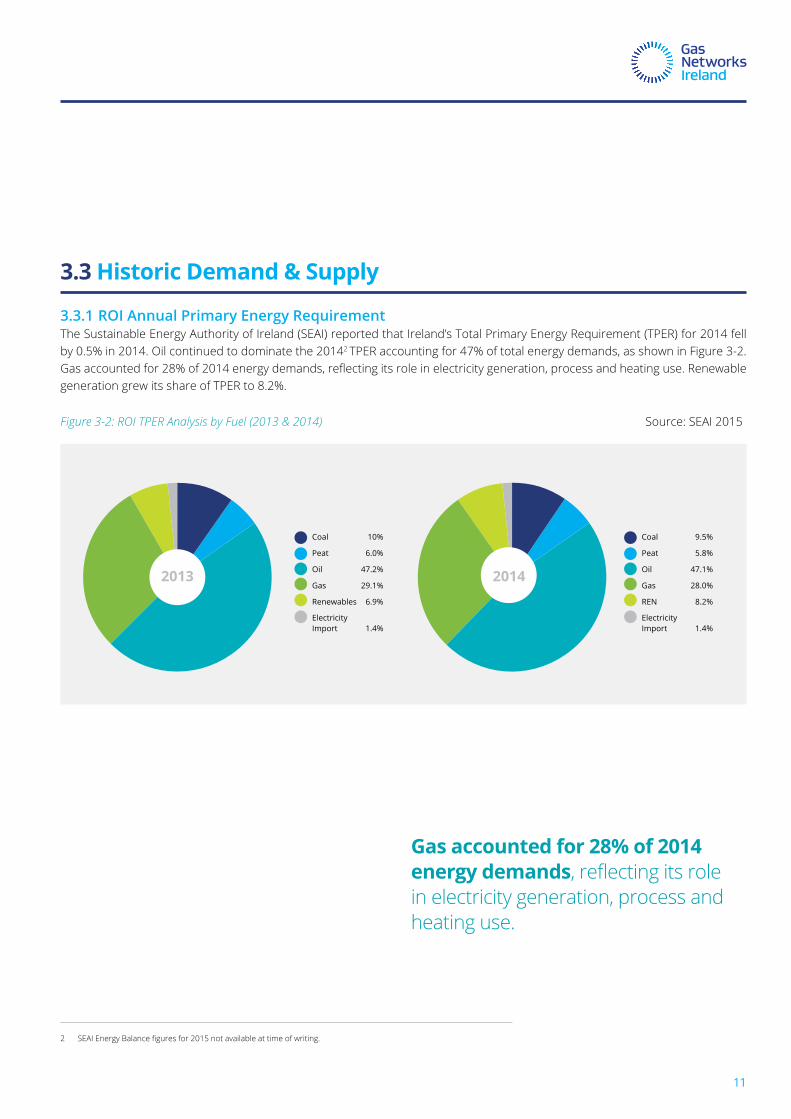
3.3.1 ROI Annual Primary Energy Requirementthe sustainable energy authority of ireland (seai) reported that ireland’s total primary energy requirement (tper) for 2014 fell by 0.5% in 2014. oil continued to dominate the 20142 tper accounting for 47% of total energy demands, as shown in figure 3-2. Gas accounted for 28% of 2014 energy demands, reflecting its role in electricity generation, process and heating use. Renewable generation grew its share of tper to 8.2%.
Figure 3-2: ROI TPER Analysis by Fuel (2013 & 2014) source: seai 2015
Coal 10%
Peat 6.0%
Oil 47.2%
Gas 29.1%
Renewables 6.9%
Electricity Import 1.4%
Coal 9.5%
Peat 5.8%
Oil 47.1%
Gas 28.0%
REN 8.2%
Electricity Import 1.4%
2013 2014
2 SEAI Energy Balance figures for 2015 not available at time of writing.
Gas accounted for 28% of 2014 energy demands, reflecting its role in electricity generation, process and heating use.
11
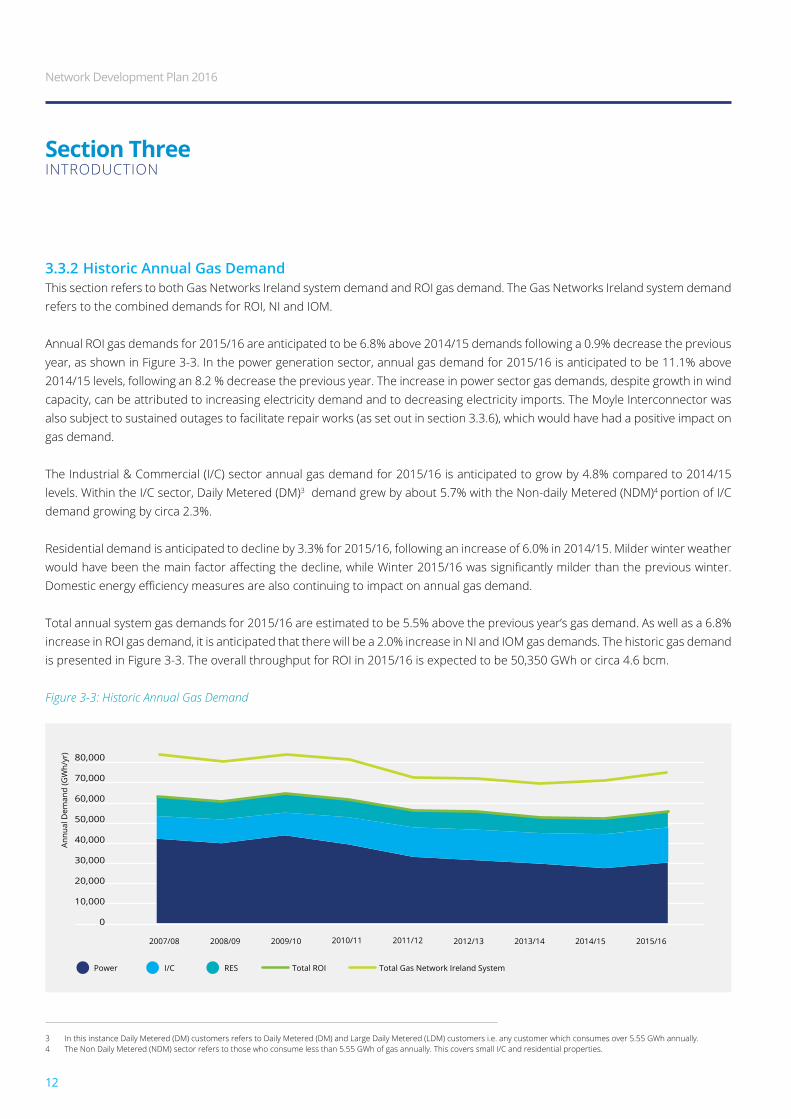
3.3.2 Historic Annual Gas Demandthis section refers to both Gas networks ireland system demand and roi gas demand. the Gas networks ireland system demand refers to the combined demands for roi, ni and iom.
annual roi gas demands for 2015/16 are anticipated to be 6.8% above 2014/15 demands following a 0.9% decrease the previous year, as shown in figure 3-3. in the power generation sector, annual gas demand for 2015/16 is anticipated to be 11.1% above 2014/15 levels, following an 8.2 % decrease the previous year. the increase in power sector gas demands, despite growth in wind capacity, can be attributed to increasing electricity demand and to decreasing electricity imports. the moyle interconnector was also subject to sustained outages to facilitate repair works (as set out in section 3.3.6), which would have had a positive impact on gas demand.
the industrial & commercial (i/c) sector annual gas demand for 2015/16 is anticipated to grow by 4.8% compared to 2014/15 levels. within the i/c sector, daily metered (dm)3 demand grew by about 5.7% with the non-daily metered (ndm)4 portion of i/c demand growing by circa 2.3%.
residential demand is anticipated to decline by 3.3% for 2015/16, following an increase of 6.0% in 2014/15. milder winter weather would have been the main factor affecting the decline, while Winter 2015/16 was significantly milder than the previous winter. Domestic energy efficiency measures are also continuing to impact on annual gas demand.
total annual system gas demands for 2015/16 are estimated to be 5.5% above the previous year’s gas demand. as well as a 6.8% increase in roi gas demand, it is anticipated that there will be a 2.0% increase in ni and iom gas demands. the historic gas demand is presented in figure 3-3. the overall throughput for roi in 2015/16 is expected to be 50,350 Gwh or circa 4.6 bcm.
Figure 3-3: Historic Annual Gas Demand
Section Threeintroduction
3 in this instance daily metered (dm) customers refers to daily metered (dm) and large daily metered (ldm) customers i.e. any customer which consumes over 5.55 Gwh annually. 4 the non daily metered (ndm) sector refers to those who consume less than 5.55 Gwh of gas annually. this covers small i/c and residential properties.
2007/08 2008/09 2009/10 2010/11 2011/12 2012/13 2013/14 2014/15 2015/16
Annu
al D
eman
d (G
Wh/
yr)
Power I/C RES Total ROI Total Gas Network Ireland System
0
10,000
20,000
30,000
40,000
50,000
60,000
70,000
80,000
Network Development Plan 2016
12
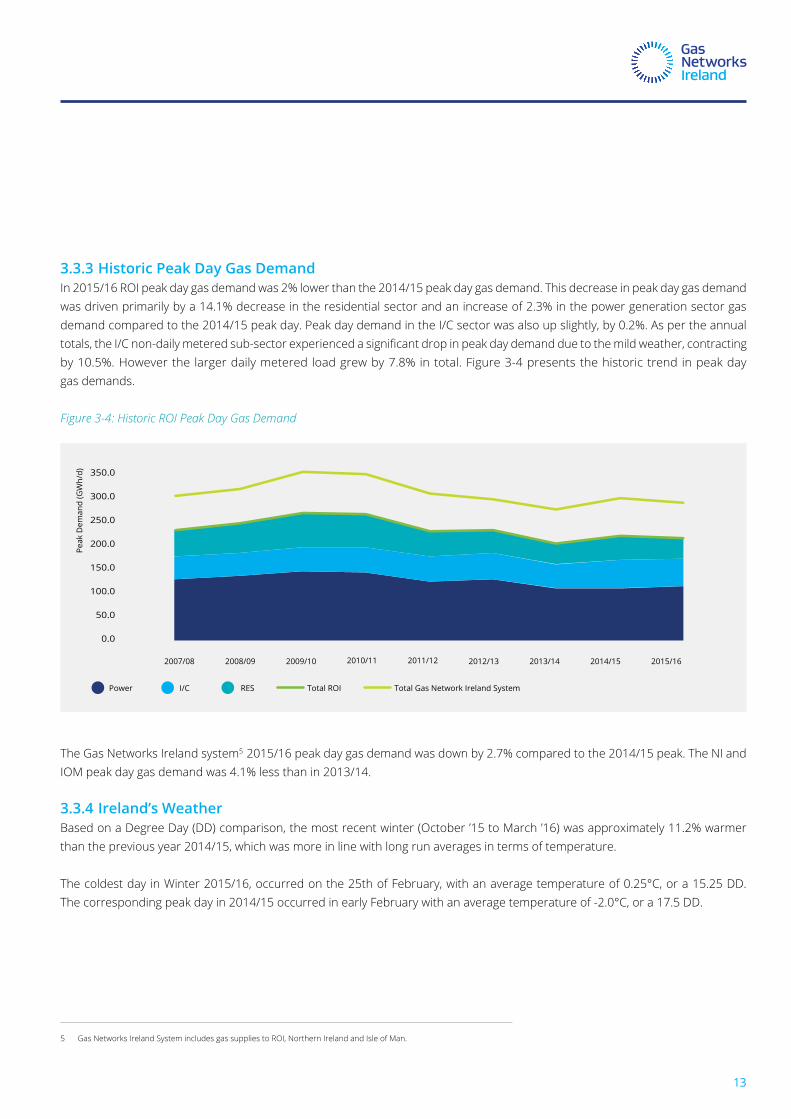
3.3.3 Historic Peak Day Gas Demandin 2015/16 roi peak day gas demand was 2% lower than the 2014/15 peak day gas demand. this decrease in peak day gas demand was driven primarily by a 14.1% decrease in the residential sector and an increase of 2.3% in the power generation sector gas demand compared to the 2014/15 peak day. peak day demand in the i/c sector was also up slightly, by 0.2%. as per the annual totals, the I/C non-daily metered sub-sector experienced a significant drop in peak day demand due to the mild weather, contracting by 10.5%. however the larger daily metered load grew by 7.8% in total. figure 3-4 presents the historic trend in peak day gas demands.
Figure 3-4: Historic ROI Peak Day Gas Demand
the Gas networks ireland system5 2015/16 peak day gas demand was down by 2.7% compared to the 2014/15 peak. the ni and iom peak day gas demand was 4.1% less than in 2013/14.
3.3.4 Ireland’s Weatherbased on a degree day (dd) comparison, the most recent winter (october ’15 to march ’16) was approximately 11.2% warmer than the previous year 2014/15, which was more in line with long run averages in terms of temperature.
the coldest day in winter 2015/16, occurred on the 25th of february, with an average temperature of 0.25°c, or a 15.25 dd. the corresponding peak day in 2014/15 occurred in early february with an average temperature of -2.0°c, or a 17.5 dd.
5 Gas networks ireland system includes gas supplies to roi, northern ireland and isle of man.
Power I/C RES Total ROI Total Gas Network Ireland System
0.0
50.0
100.0
150.0
200.0
250.0
300.0
350.0
Peak
Dem
and
(GW
h/d)
2007/08 2008/09 2009/10 2010/11 2011/12 2012/13 2013/14 2014/15 2015/16
13
3.3.5 Wind Powered Generationthe installed all-island wind generation capacity increased by 15.4% in 2015 from the previous year6. wind powered generation for winter 15/16 experienced 11% growth compared to winter 2014/15. at the peak day for wind generation in winter 2015/16, daily wind powered generation accounted for up to 61% of roi daily electricity demand (15th of november 2015) and as little as 0.6% of demand on the minimum day for wind generation (3rd of october 2015). on the 2015 peak day for gas demand (25th of february 2016) wind accounted for circa 5% of electricity system demand.
3.3.6 Electricity Interconnectorsthere are two electrical interconnectors serving the island of ireland – the east west interconnector (ewic) in roi and the moyle interconnector in northern ireland, with import capacities of 500 mw and 450 mw respectively. a fault occurred on the north cable of the moyle interconnector in june 2012, causing it to cease operation. however moyle continues to operate, albeit at a reduced transfer capacity of 250 mw. repair work is ongoing and there will be prolonged outages throughout 2016 as a result. it is expected that the interconnector will be back to full capacity by the end of 2016. this will possibly result in higher gas demand for 2015/16 to offset the loss of electricity import capacity.
up until recently, the prevailing market conditions on the single electricity market (sem)7 and its uk equivalent, betta (british Electricity Trading and Transmission Arrangements) have resulted in a predominantly GB-IE flow on the EWIC, i.e. import of electricity from Great britain. however this dynamic is now shifting with electricity imports from Gb down by 49% for ewic for winter 2015/16 compared to 2014/15. similarly electricity exports to Gb via the ewic interconnector were up by 193%.
It can be difficult to predict how this dynamic will unfold as it is effectively a function of the relative price of generating electricity in Ireland and in GB. The introduction of a carbon price floor in the UK8 and low carbon pricing on ets9, may result in higher power generation costs in Gb compared to ireland, leading to a reduction in imports (from Gb) and driving electricity exports. low fuel prices may also mean that the impact of the carbon price differential is more pronounced. Tightening capacity margins in the UK may also result in higher power generation costs in the uk in the long term. Gas networks ireland will continue to work with industry partners to understand interconnector dynamics, which will continue to have a major impact on the development of gas demand in the power generation sector.ireland transmission system
6 from eirgrid’s all-island Generation capacity statement 2016–2025. 7 the single electricity market (sem) is the wholesale electricity market operating in the republic of ireland and northern ireland. 8 A UK carbon price floor was introduced on 1 April 2013 to guarantee a minimum price for CO2
emissions.9 eu emissions trading scheme (ets) is an eu wide system for trading carbon allowances designed to incentivise investment in green technologies.
Section Threeintroduction
Network Development Plan 2016
14
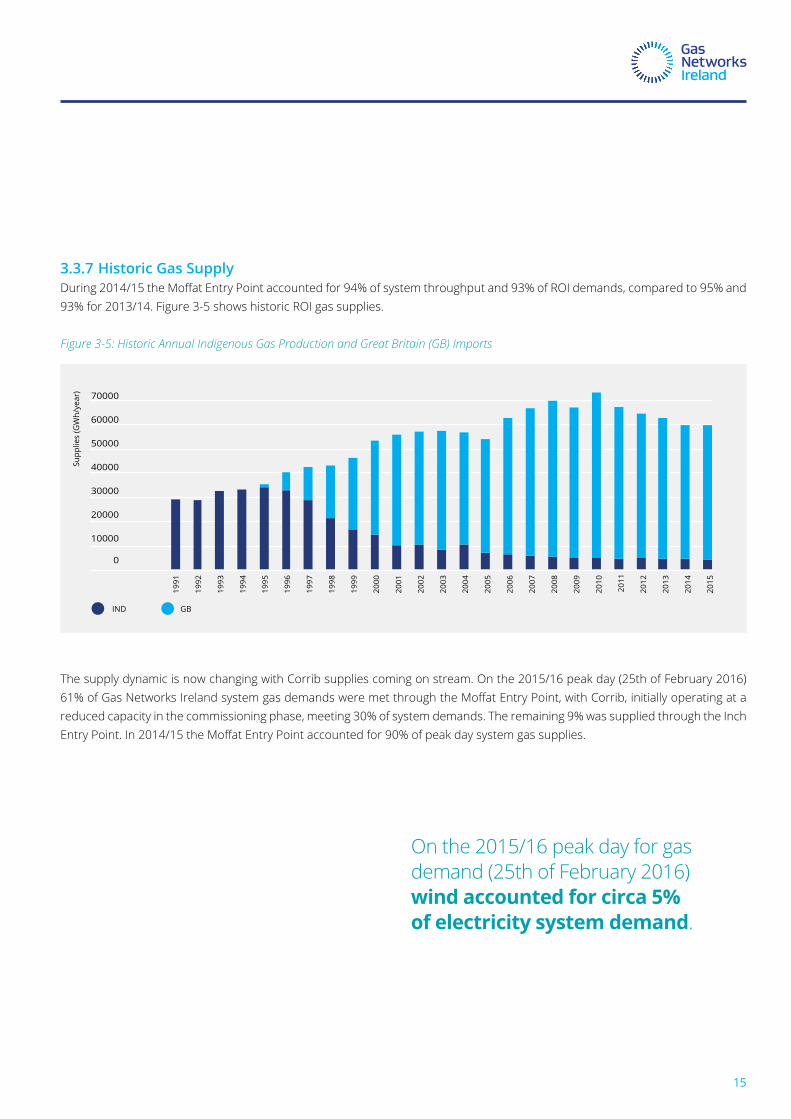
3.3.7 Historic Gas SupplyDuring 2014/15 the Moffat Entry Point accounted for 94% of system throughput and 93% of ROI demands, compared to 95% and 93% for 2013/14. figure 3-5 shows historic roi gas supplies.
Figure 3-5: Historic Annual Indigenous Gas Production and Great Britain (GB) Imports
the supply dynamic is now changing with corrib supplies coming on stream. on the 2015/16 peak day (25th of february 2016) 61% of Gas Networks Ireland system gas demands were met through the Moffat Entry Point, with Corrib, initially operating at a reduced capacity in the commissioning phase, meeting 30% of system demands. the remaining 9% was supplied through the inch Entry Point. In 2014/15 the Moffat Entry Point accounted for 90% of peak day system gas supplies.
0
10000
20000
30000
40000
50000
60000
70000
1991
1992
1993
1994
1995
1996
1997
1998
1999
2000
2001
2002
2003
2004
2005
2006
2007
2008
2009
2010
2011
2012
2013
2014
2015
Supp
lies
(GW
h/ye
ar)
IND GB
on the 2015/16 peak day for gas demand (25th of february 2016) wind accounted for circa 5% of electricity system demand.
15
Key Messages:
• Gas networks ireland has developed low, median and high demand scenarios which forecast gas demand across the power generation, i/c, residential and transport sectors.
• in the median demand scenario annual roi gas demand is expected to grow by 28% between 2015/16 and 2024/25.
• the 1-in-50 peak year, peak day forecast is expected to grow by 24% between 2015/16 and 2024/25.
Network Development Plan 2016
16
Section FourGas demands forecast
4.1 Gas Demands
this chapter presents an overview of the gas demand outlook for the period 2015/16 to 2024/25. the ndp forecasts future gas demands by examining the development of individual power, industrial & commercial and residential sector gas demand10.
the demand forecasts presented in this chapter refer to roi demand only, unless otherwise stated. Gas networks ireland system demand refers to the total demand transported through the Gas networks ireland system, i.e. the combined demands for roi, ni and iom. Gas networks ireland system demand forecasts are presented in appendix 2.
17
10 Gas networks ireland has developed a document outlining the methodology for forecasting gas demand. this document is available for download via the following link, http://www.gasnetworks.ie/networkdevelopmentplan
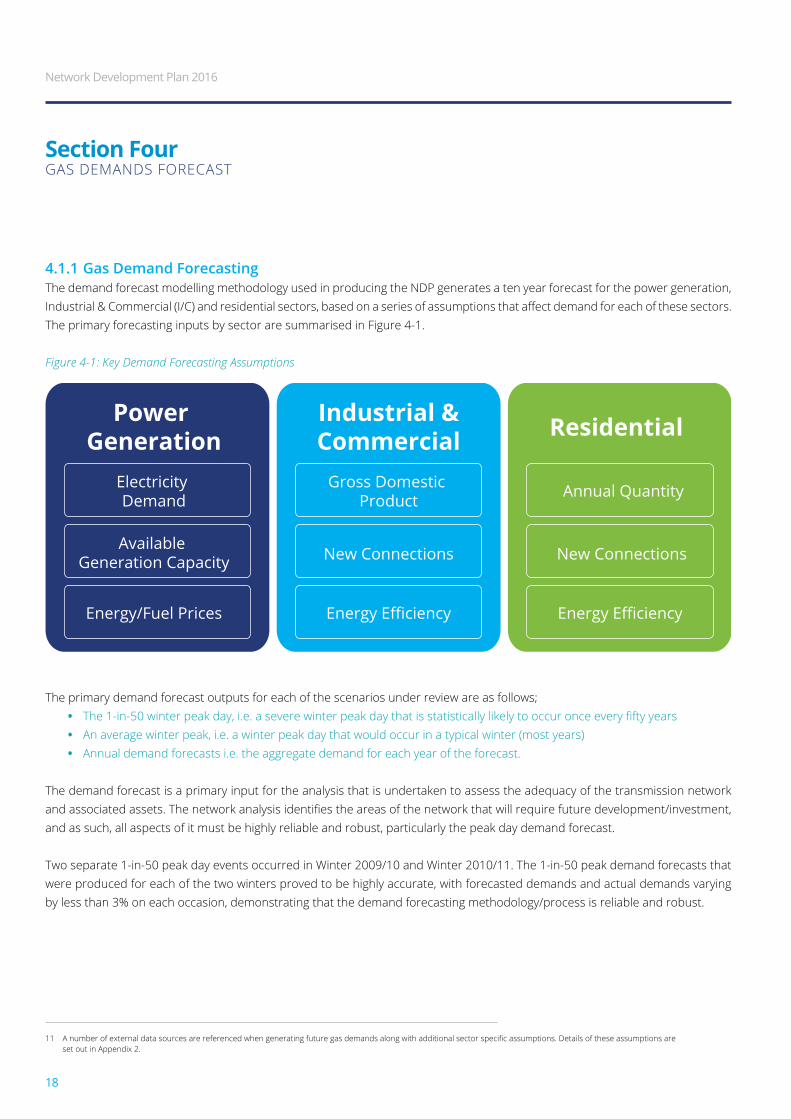
4.1.1 Gas Demand Forecastingthe demand forecast modelling methodology used in producing the ndp generates a ten year forecast for the power generation, Industrial & Commercial (I/C) and residential sectors, based on a series of assumptions that affect demand for each of these sectors. the primary forecasting inputs by sector are summarised in figure 4-1.
Figure 4-1: Key Demand Forecasting Assumptions
the primary demand forecast outputs for each of the scenarios under review are as follows;• The 1-in-50 winter peak day, i.e. a severe winter peak day that is statistically likely to occur once every fifty years• an average winter peak, i.e. a winter peak day that would occur in a typical winter (most years)• annual demand forecasts i.e. the aggregate demand for each year of the forecast.
the demand forecast is a primary input for the analysis that is undertaken to assess the adequacy of the transmission network and associated assets. The network analysis identifies the areas of the network that will require future development/investment, and as such, all aspects of it must be highly reliable and robust, particularly the peak day demand forecast.
two separate 1-in-50 peak day events occurred in winter 2009/10 and winter 2010/11. the 1-in-50 peak demand forecasts that were produced for each of the two winters proved to be highly accurate, with forecasted demands and actual demands varying by less than 3% on each occasion, demonstrating that the demand forecasting methodology/process is reliable and robust.
Section FourGas demands forecast
Power Generation
Electricity Demand
Available Generation Capacity
Energy/Fuel Prices
Industrial &Commercial
Gross Domestic Product
New Connections New Connections
Energy Efficiency Energy Efficiency
Residential
Annual Quantity
11 A number of external data sources are referenced when generating future gas demands along with additional sector specific assumptions. Details of these assumptions are set out in appendix 2.
Network Development Plan 2016
18
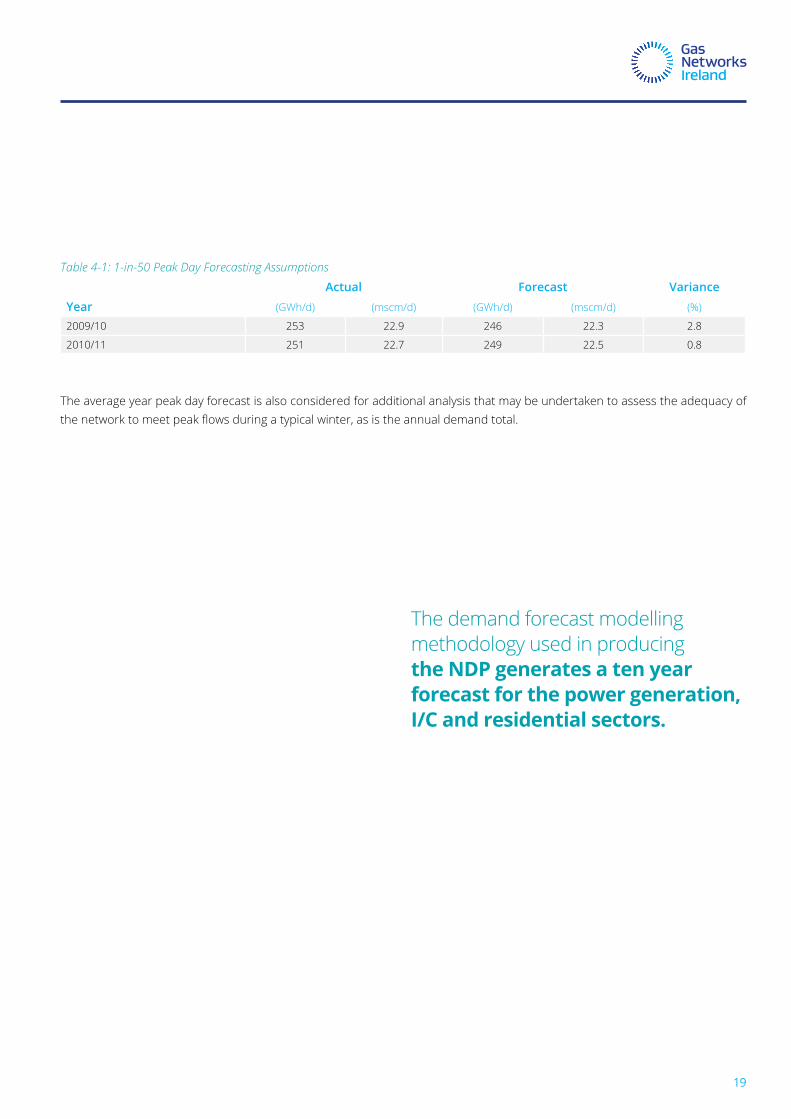
Table 4-1: 1-in-50 Peak Day Forecasting Assumptions
Actual Forecast VarianceYear (Gwh/d) (mscm/d) (Gwh/d) (mscm/d) (%)
2009/10 253 22.9 246 22.3 2.8
2010/11 251 22.7 249 22.5 0.8
the average year peak day forecast is also considered for additional analysis that may be undertaken to assess the adequacy of the network to meet peak flows during a typical winter, as is the annual demand total.
the demand forecast modelling methodology used in producing the NDP generates a ten year forecast for the power generation, I/C and residential sectors.
19
4.2 Gas Demand Scenarios
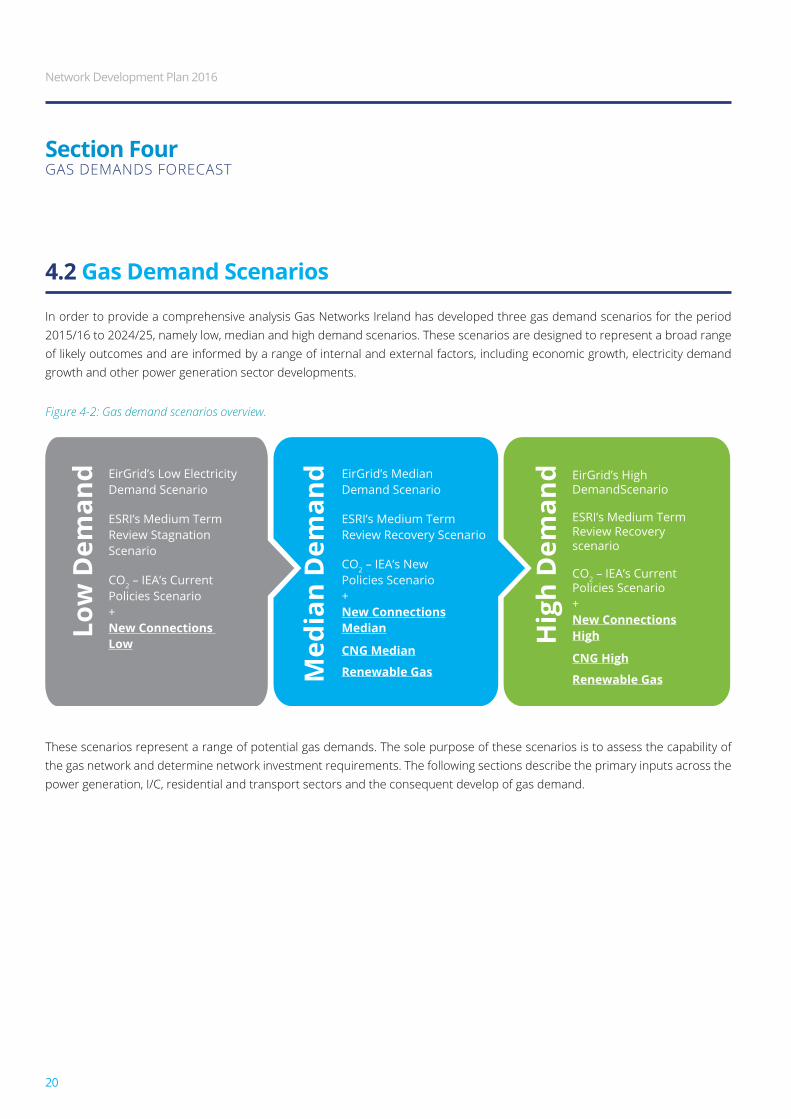
in order to provide a comprehensive analysis Gas networks ireland has developed three gas demand scenarios for the period 2015/16 to 2024/25, namely low, median and high demand scenarios. these scenarios are designed to represent a broad range of likely outcomes and are informed by a range of internal and external factors, including economic growth, electricity demand growth and other power generation sector developments.
Figure 4-2: Gas demand scenarios overview.
these scenarios represent a range of potential gas demands. the sole purpose of these scenarios is to assess the capability of the gas network and determine network investment requirements. the following sections describe the primary inputs across the power generation, i/c, residential and transport sectors and the consequent develop of gas demand.
Section FourGas demands forecast
Low
Dem
and
Med
ian
Dem
and
Hig
h D
eman
dEirGrid’s Low Electricity Demand Scenario
ESRI’s Medium Term Review Stagnation Scenario
CO2 – IEA’s Current Policies Scenario+ New Connections Low
EirGrid’s Median Demand Scenario
ESRI’s Medium Term Review Recovery Scenario
CO2 – IEA’s New Policies Scenario+New ConnectionsMedian
CNG Median
Renewable Gas
EirGrid’s High DemandScenario
ESRI’s Medium Term Review Recovery scenario
CO2 – IEA’s Current Policies Scenario+New ConnectionsHigh
CNG High
Renewable Gas
Network Development Plan 2016
20
4.3 Demand Forecast Assumptions4.3.1 Power Generation Sectorthe irish gas and electricity sectors are highly interdependent. Gas is a critical component of ireland’s electricity generation, currently producing around 45%12 of the country’s annual electricity requirement. Gas fired generators are the largest customer sector in the gas market, accounting for approximately 55% of the total roi demand in 2015/16.
the following summarises the main assumptions regarding the changes in the sem generation portfolio, as per the eirGrid / soni all-island Generation capacity statement 2016-2025:
• wind generation is anticipated to increase to 4522 mw and 1402 mw in roi and ni respectively, by 2024/25.• the kilroot coal power plant will be subject to industrial emissions directive (ied) restrictions from 2016, leading to restricted running hours from 2020 and closure in 2023.• the moyle interconnector in ni will be restored to full capacity by the end of 2016.• north-south interconnector will be completed by 2019.
the outlook to 2024/25 regarding the merit order in the sem, as per Gas networks ireland’s power Generation gas demand forecasting model, is as follows:
• renewables are assumed to be priority despatch and will meet 40% of generation by 2023.• Coal fired plants are anticipated to continue providing base-load generation over the forecast period.• Peat fired generation is anticipated to fall-off in-line with the expiration of the PSO levy payments which peat fired
stations currently receive.• the electricity interconnectors, ewic and moyle, are anticipated to be net importers of electricity, however recent trends
have shown a decline in imports and an increase in electricity exports to Gb. this trend is set to continue over the forecasts horizon.
• Gas fired plants are anticipated to meet the balance of electricity demand.
it should be noted that there is some uncertainty in power sector forecasts due to the impending implementation of isem. the integrated single electricity market (isem) refers to a new high level design (hld) for the electricity market in ireland and northern Ireland and is due for completion in 2017. The market will be re-designed to efficiently implement the European Target Model and ensure efficient cross border trade. Gas Networks Ireland will continue to engage with stakeholders in terms of establishing the impact of isem on gas demand.
12 according to seai, energy in ireland, key statistics 2015. http://www.seai.ie/publications/statistics_publications/energy_in_ireland/energy_in_ireland_key_statistics/energy-in-ireland-key-statistics-2015.pdf
21
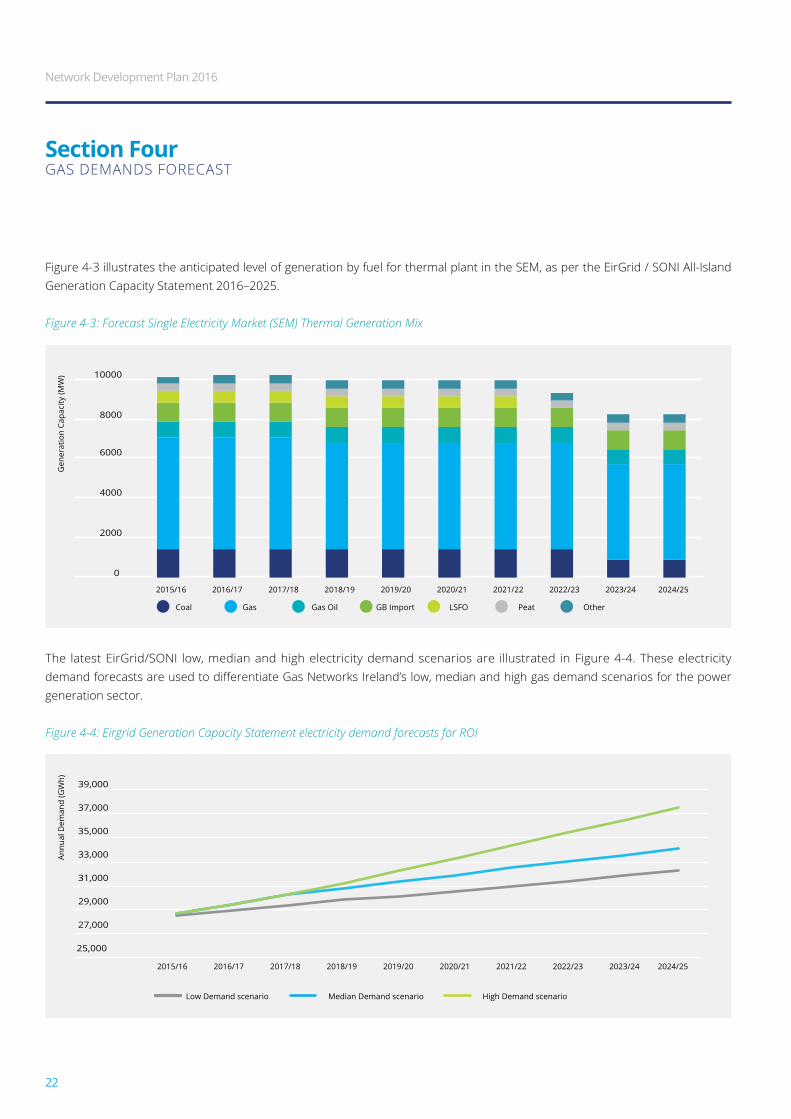
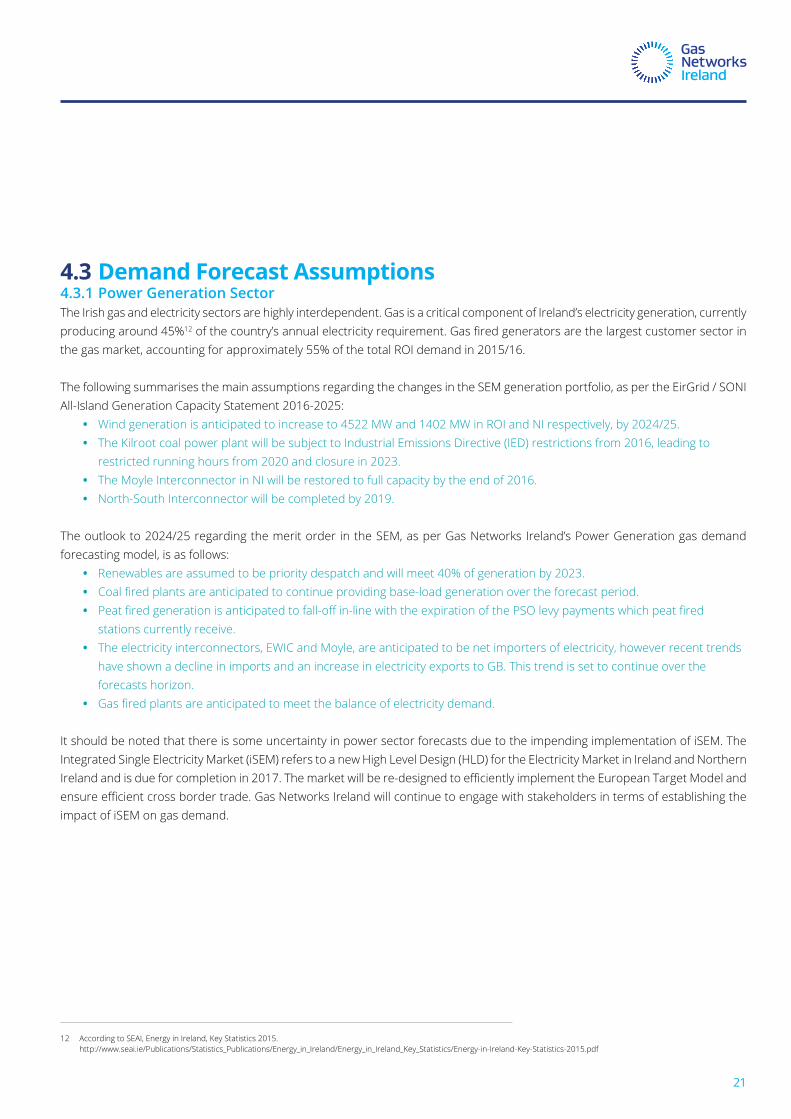
figure 4-3 illustrates the anticipated level of generation by fuel for thermal plant in the sem, as per the eirGrid / soni all-island Generation capacity statement 2016–2025.
Figure 4-3: Forecast Single Electricity Market (SEM) Thermal Generation Mix
the latest eirGrid/soni low, median and high electricity demand scenarios are illustrated in figure 4-4. these electricity demand forecasts are used to differentiate Gas Networks Ireland’s low, median and high gas demand scenarios for the power generation sector.
Figure 4-4: Eirgrid Generation Capacity Statement electricity demand forecasts for ROI
Section FourGas demands forecast
25,000
27,000
29,000
31,000
33,000
35,000
37,000
39,000
Annu
al D
eman
d (G
Wh)
2015/16 2016/17 2017/18 2018/19 2019/20 2020/21 2021/22 2022/23 2023/24 2024/25
Low Demand scenario Median Demand scenario High Demand scenario
0
2000
4000
6000
8000
10000
Gen
erat
ion
Capa
city
(MW
)
2015/16 2016/17 2017/18 2018/19 2019/20 2020/21 2021/22 2022/23 2023/24 2024/25
PeatLSFOGB ImportGas OilGas OtherCoal
Network Development Plan 2016
22
4.3.2 Industrial & Commercial Sectorindustrial & commercial (i/c) sector gas demand is assumed to continue to increase in line with anticipated new connection numbers and proportional to Gross domestic product (Gdp)13. figure 4-5 presents the Gdp growth rate assumptions over the forecast period.
the short term Gdp forecasts are a composite of a number of short term forecasts from the esri, central bank, oecd, imf and others. The short term forecast for all three scenarios is assumed to be the same for the first two years of the analysis, as there is a greater degree of certainty with these short term forecasts compared to medium to long term forecasts. in the medium term, Gdp projections are based on the esri’s 2013 medium term review (mtr) stagnation scenario for the low demand scenario. similarly the median and high demand scenarios approximate to the mtr’s recovery scenario.
while Gdp is the primary driver of growth in the i/c sector, an additional incremental allowance is made for new connections in this sector for the median and high demand scenarios in line with Gas networks ireland’s i/c new connections growth strategy.
Figure 4-5: GDP Assumptions
13 i/c sector growth rate is assumed to be 80% of Gdp based on observed historical trends.
0.0
1.0
2.0
1.5
3.0
4.5
5.0
6.0
GD
P G
row
th R
ate
(%)
Low scenario Median/High scenario
2015/16 2016/17 2017/18 2018/19 2019/20 2020/21 2021/22 2022/23 2023/24 2024/25
23
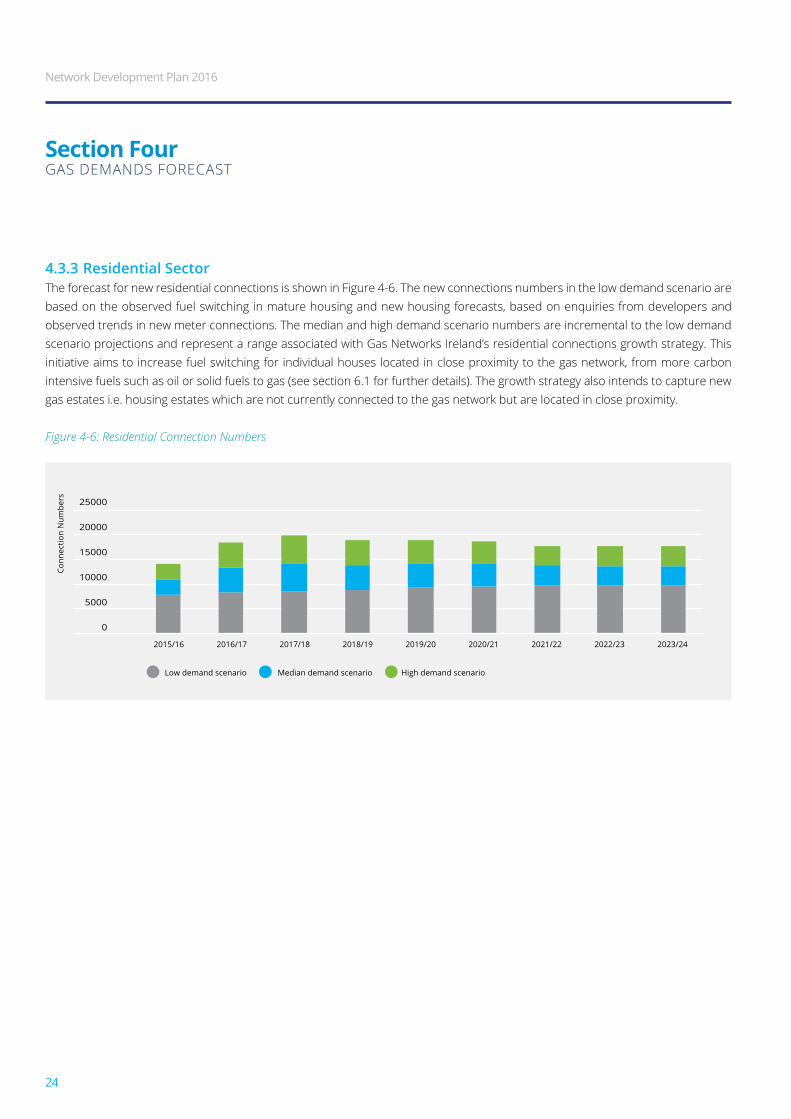
4.3.3 Residential Sectorthe forecast for new residential connections is shown in figure 4-6. the new connections numbers in the low demand scenario are based on the observed fuel switching in mature housing and new housing forecasts, based on enquiries from developers and observed trends in new meter connections. the median and high demand scenario numbers are incremental to the low demand scenario projections and represent a range associated with Gas networks ireland’s residential connections growth strategy. this initiative aims to increase fuel switching for individual houses located in close proximity to the gas network, from more carbon intensive fuels such as oil or solid fuels to gas (see section 6.1 for further details). the growth strategy also intends to capture new gas estates i.e. housing estates which are not currently connected to the gas network but are located in close proximity.
Figure 4-6: Residential Connection Numbers
Section FourGas demands forecast
0
5000
10000
15000
20000
25000
Conn
ectio
n N
umbe
rs
High demand scenarioMedian demand scenarioLow demand scenario
2015/16 2016/17 2017/18 2018/19 2019/20 2020/21 2021/22 2022/23 2023/24
Network Development Plan 2016
24
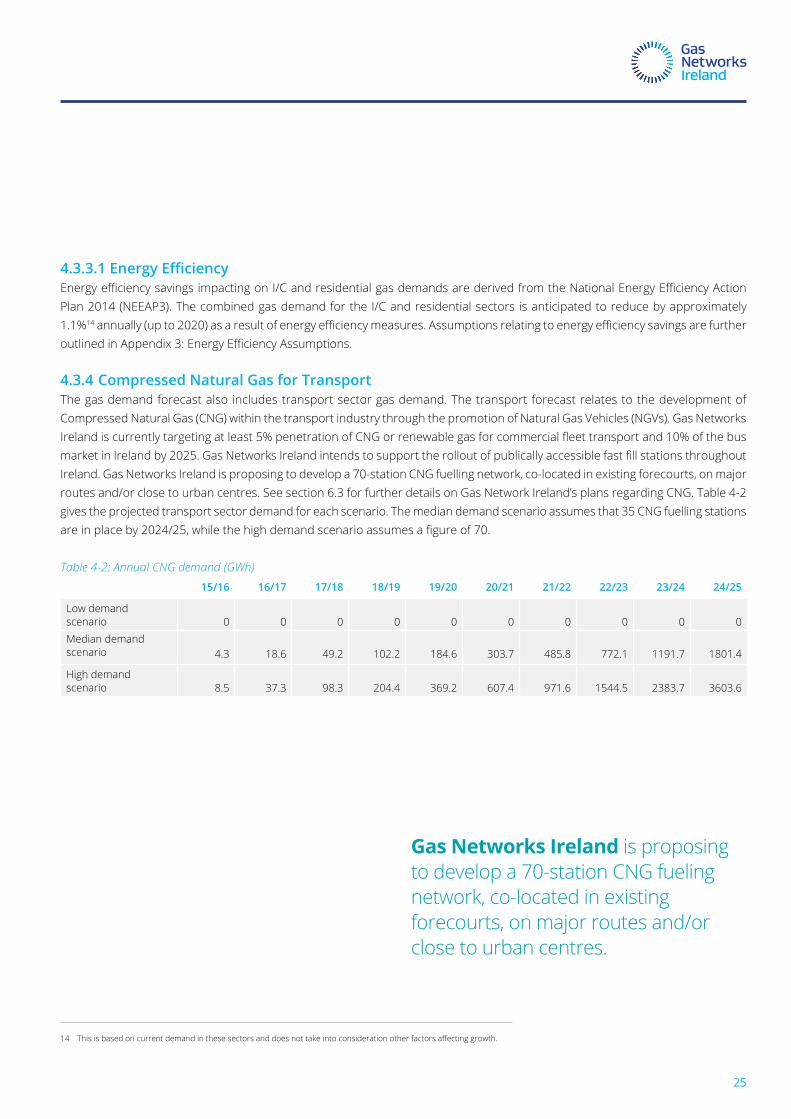
4.3.3.1 Energy EfficiencyEnergy efficiency savings impacting on I/C and residential gas demands are derived from the National Energy Efficiency Action plan 2014 (neeap3). the combined gas demand for the i/c and residential sectors is anticipated to reduce by approximately 1.1%14 annually (up to 2020) as a result of energy efficiency measures. Assumptions relating to energy efficiency savings are further outlined in Appendix 3: Energy Efficiency Assumptions. 4.3.4 Compressed Natural Gas for Transportthe gas demand forecast also includes transport sector gas demand. the transport forecast relates to the development of compressed natural Gas (cnG) within the transport industry through the promotion of natural Gas vehicles (nGvs). Gas networks Ireland is currently targeting at least 5% penetration of CNG or renewable gas for commercial fleet transport and 10% of the bus market in Ireland by 2025. Gas Networks Ireland intends to support the rollout of publically accessible fast fill stations throughout ireland. Gas networks ireland is proposing to develop a 70-station cnG fuelling network, co-located in existing forecourts, on major routes and/or close to urban centres. see section 6.3 for further details on Gas network ireland’s plans regarding cnG. table 4-2 gives the projected transport sector demand for each scenario. the median demand scenario assumes that 35 cnG fuelling stations are in place by 2024/25, while the high demand scenario assumes a figure of 70.
Table 4-2: Annual CNG demand (GWh) 15/16 16/17 17/18 18/19 19/20 20/21 21/22 22/23 23/24 24/25
low demand scenario 0 0 0 0 0 0 0 0 0 0median demand scenario 4.3 18.6 49.2 102.2 184.6 303.7 485.8 772.1 1191.7 1801.4
high demand scenario 8.5 37.3 98.3 204.4 369.2 607.4 971.6 1544.5 2383.7 3603.6
14 This is based on current demand in these sectors and does not take into consideration other factors affecting growth.
Gas Networks Ireland is proposing to develop a 70-station cnG fueling network, co-located in existing forecourts, on major routes and/or close to urban centres.
25
4.4 The Demand Outlook
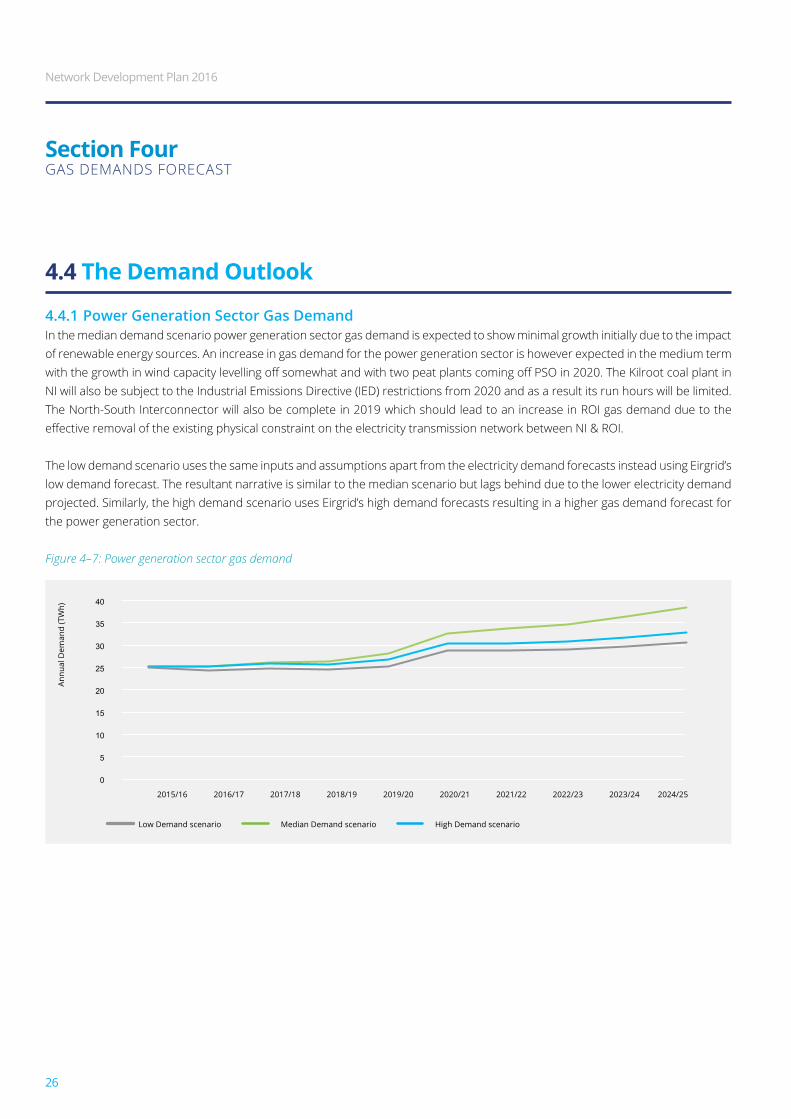
4.4.1 Power Generation Sector Gas Demandin the median demand scenario power generation sector gas demand is expected to show minimal growth initially due to the impact of renewable energy sources. an increase in gas demand for the power generation sector is however expected in the medium term with the growth in wind capacity levelling off somewhat and with two peat plants coming off PSO in 2020. The Kilroot coal plant in ni will also be subject to the industrial emissions directive (ied) restrictions from 2020 and as a result its run hours will be limited. the north-south interconnector will also be complete in 2019 which should lead to an increase in roi gas demand due to the effective removal of the existing physical constraint on the electricity transmission network between NI & ROI.
the low demand scenario uses the same inputs and assumptions apart from the electricity demand forecasts instead using eirgrid’s low demand forecast. the resultant narrative is similar to the median scenario but lags behind due to the lower electricity demand projected. similarly, the high demand scenario uses eirgrid’s high demand forecasts resulting in a higher gas demand forecast for the power generation sector.
Figure 4–7: Power generation sector gas demand
Section FourGas demands forecast
Annu
al D
eman
d (T
Wh)
2015/16 2016/17 2017/18 2018/19 2019/20 2020/21 2021/22 2022/23 2023/24 2024/25
Low Demand scenario Median Demand scenario High Demand scenario
0
5
10
15
20
25
30
35
40
Network Development Plan 2016
26
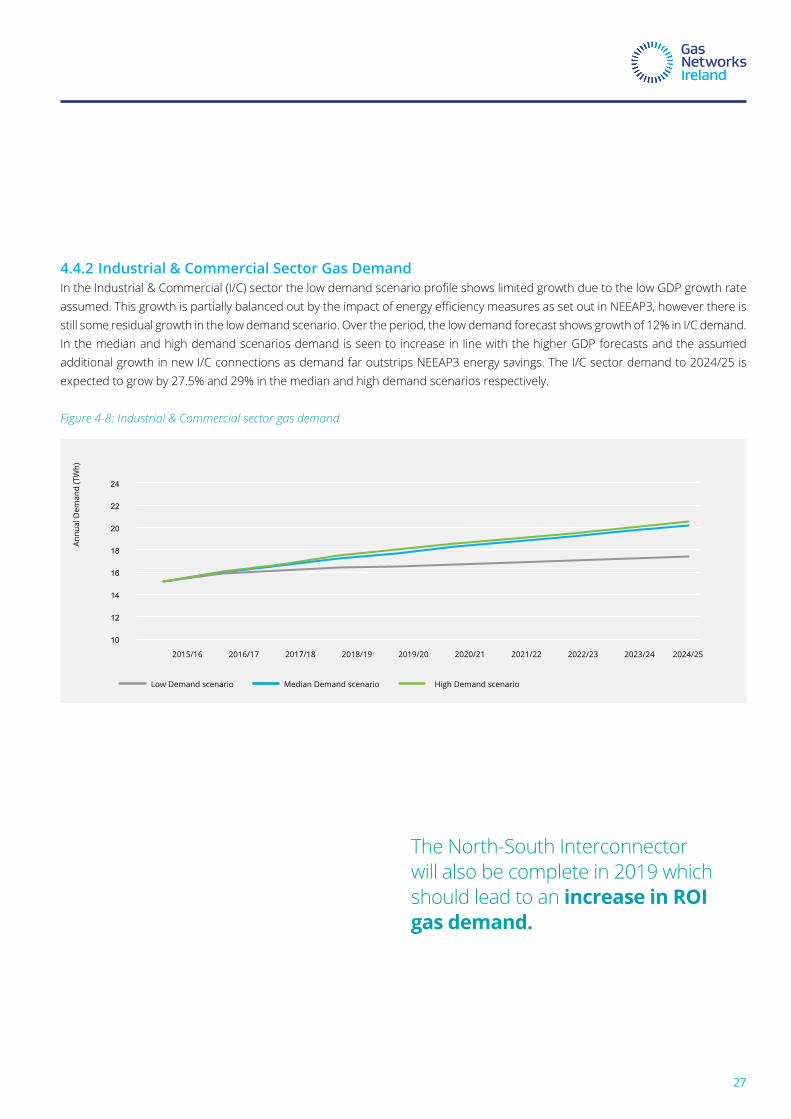
4.4.2 Industrial & Commercial Sector Gas DemandIn the Industrial & Commercial (I/C) sector the low demand scenario profile shows limited growth due to the low GDP growth rate assumed. This growth is partially balanced out by the impact of energy efficiency measures as set out in NEEAP3, however there is still some residual growth in the low demand scenario. over the period, the low demand forecast shows growth of 12% in i/c demand. in the median and high demand scenarios demand is seen to increase in line with the higher Gdp forecasts and the assumed additional growth in new i/c connections as demand far outstrips neeap3 energy savings. the i/c sector demand to 2024/25 is expected to grow by 27.5% and 29% in the median and high demand scenarios respectively.
Figure 4-8: Industrial & Commercial sector gas demand
Annu
al D
eman
d (T
Wh)
2015/16 2016/17 2017/18 2018/19 2019/20 2020/21 2021/22 2022/23 2023/24 2024/25
Median Demand scenario Low Demand scenario High Demand scenario
10
12
14
16
18
20
22
24
the north-south interconnector will also be complete in 2019 which should lead to an increase in ROI gas demand.
27
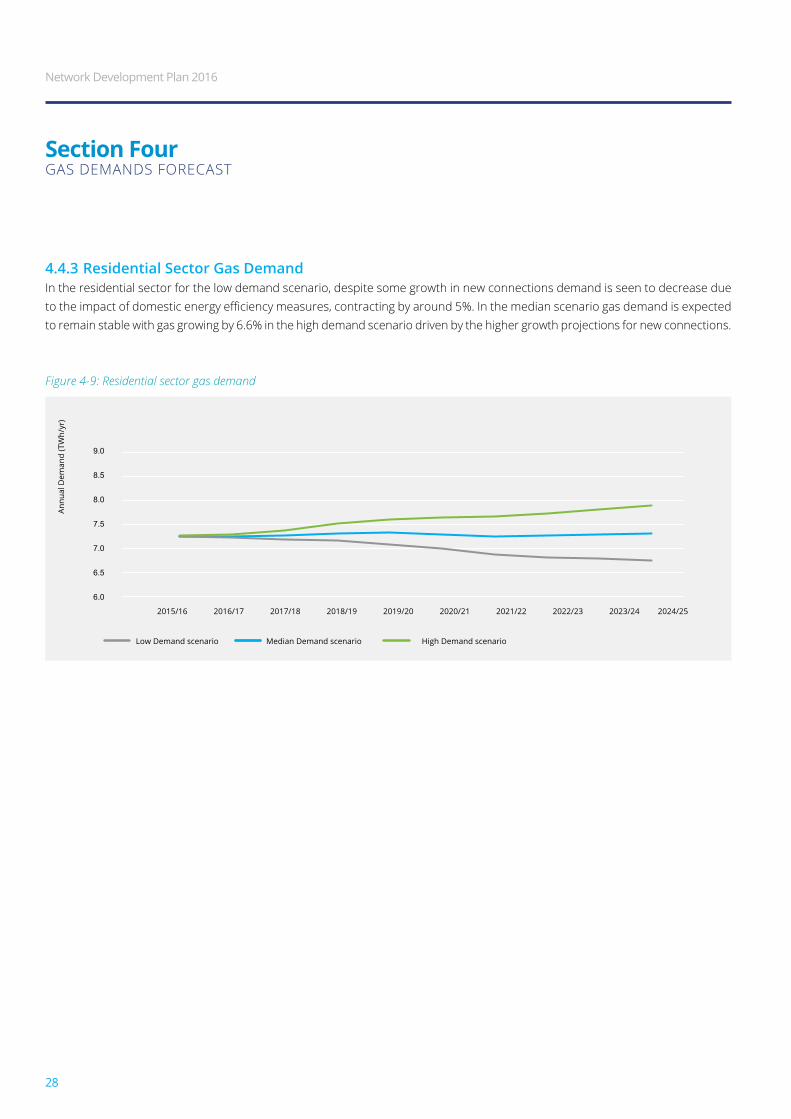
4.4.3 Residential Sector Gas Demandin the residential sector for the low demand scenario, despite some growth in new connections demand is seen to decrease due to the impact of domestic energy efficiency measures, contracting by around 5%. In the median scenario gas demand is expected to remain stable with gas growing by 6.6% in the high demand scenario driven by the higher growth projections for new connections.
Figure 4-9: Residential sector gas demand
Section FourGas demands forecast
Annu
al D
eman
d (T
Wh/
yr)
2015/16 2016/17 2017/18 2018/19 2019/20 2020/21 2021/22 2022/23 2023/24 2024/25
Median Demand scenario Low Demand scenario High Demand scenario
6.0
6.5
7.0
7.5
8.0
8.5
9.0
Network Development Plan 2016
28
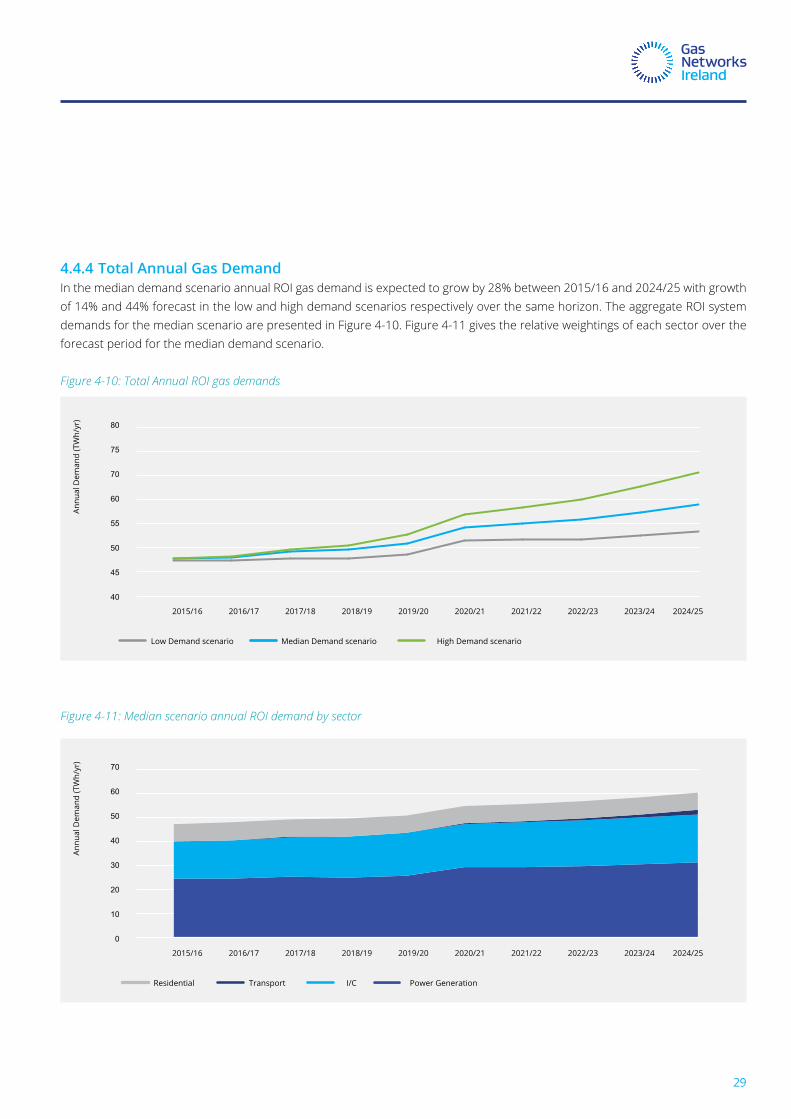
4.4.4 Total Annual Gas Demandin the median demand scenario annual roi gas demand is expected to grow by 28% between 2015/16 and 2024/25 with growth of 14% and 44% forecast in the low and high demand scenarios respectively over the same horizon. the aggregate roi system demands for the median scenario are presented in figure 4-10. figure 4-11 gives the relative weightings of each sector over the forecast period for the median demand scenario.
Figure 4-10: Total Annual ROI gas demands
Figure 4-11: Median scenario annual ROI demand by sector
Annu
al D
eman
d (T
Wh/
yr)
2015/16 2016/17 2017/18 2018/19 2019/20 2020/21 2021/22 2022/23 2023/24 2024/25
Residential Transport I/C Power Generation
0
10
20
30
40
50
60
70
Annu
al D
eman
d (T
Wh/
yr)
2015/16 2016/17 2017/18 2018/19 2019/20 2020/21 2021/22 2022/23 2023/24 2024/25
40
45
50
55
60
70
75
80
Median Demand scenario Low Demand scenario High Demand scenario
29
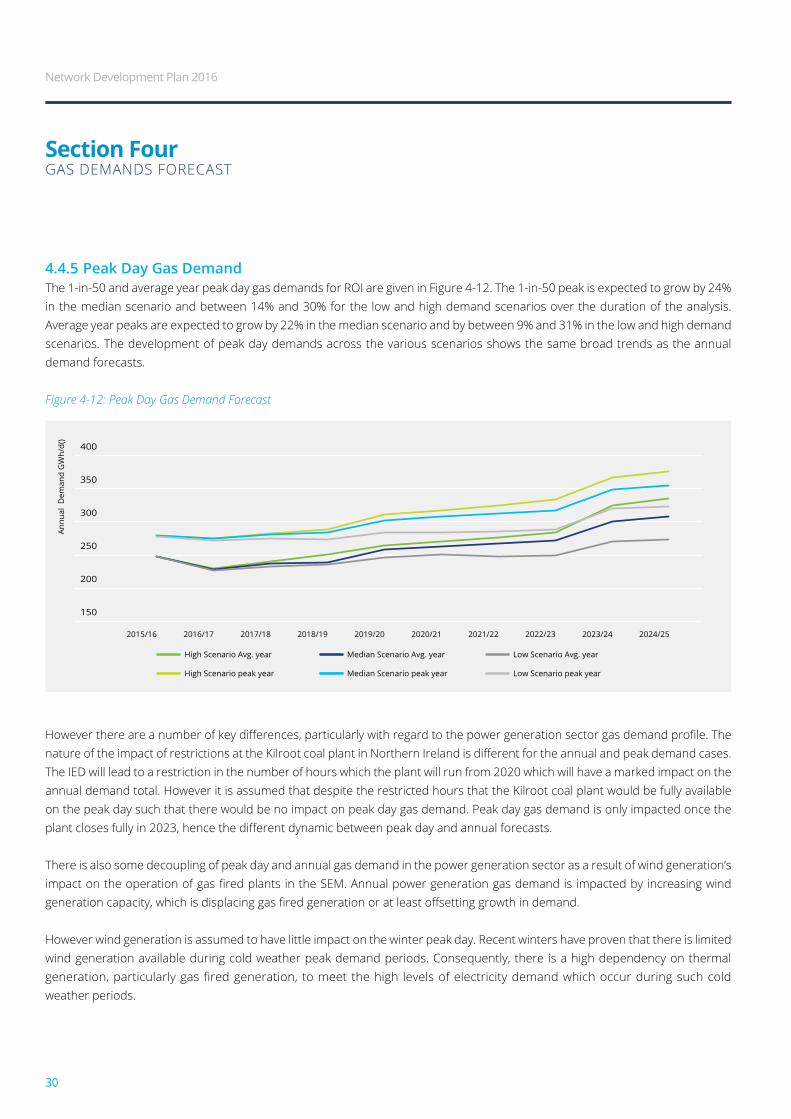
4.4.5 Peak Day Gas Demandthe 1-in-50 and average year peak day gas demands for roi are given in figure 4-12. the 1-in-50 peak is expected to grow by 24% in the median scenario and between 14% and 30% for the low and high demand scenarios over the duration of the analysis. average year peaks are expected to grow by 22% in the median scenario and by between 9% and 31% in the low and high demand scenarios. the development of peak day demands across the various scenarios shows the same broad trends as the annual demand forecasts.
Figure 4-12: Peak Day Gas Demand Forecast
However there are a number of key differences, particularly with regard to the power generation sector gas demand profile. The nature of the impact of restrictions at the Kilroot coal plant in Northern Ireland is different for the annual and peak demand cases. the ied will lead to a restriction in the number of hours which the plant will run from 2020 which will have a marked impact on the annual demand total. however it is assumed that despite the restricted hours that the kilroot coal plant would be fully available on the peak day such that there would be no impact on peak day gas demand. peak day gas demand is only impacted once the plant closes fully in 2023, hence the different dynamic between peak day and annual forecasts.
there is also some decoupling of peak day and annual gas demand in the power generation sector as a result of wind generation’s impact on the operation of gas fired plants in the SEM. Annual power generation gas demand is impacted by increasing wind generation capacity, which is displacing gas fired generation or at least offsetting growth in demand.
however wind generation is assumed to have little impact on the winter peak day. recent winters have proven that there is limited wind generation available during cold weather peak demand periods. consequently, there is a high dependency on thermal generation, particularly gas fired generation, to meet the high levels of electricity demand which occur during such cold weather periods.
Network Development Plan 2016
30
Section FourGas demands forecast
150
200
300
250
400
350
Annu
al D
eman
d G
Wh/
d()
2015/16 2016/17 2017/18 2018/19 2019/20 2020/21 2021/22 2022/23 2023/24 2024/25
High Scenario Avg. year Median Scenario Avg. year Low Scenario Avg. year
High Scenario peak year Median Scenario peak year Low Scenario peak year
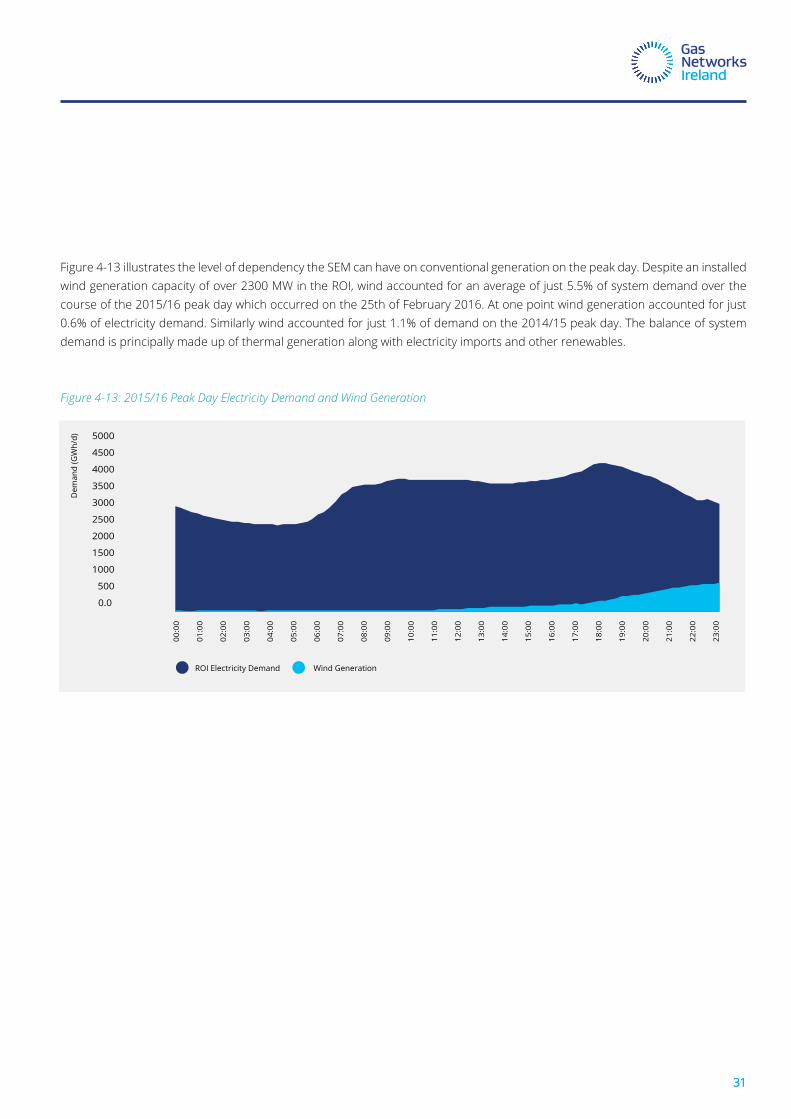
figure 4-13 illustrates the level of dependency the sem can have on conventional generation on the peak day. despite an installed wind generation capacity of over 2300 mw in the roi, wind accounted for an average of just 5.5% of system demand over the course of the 2015/16 peak day which occurred on the 25th of february 2016. at one point wind generation accounted for just 0.6% of electricity demand. similarly wind accounted for just 1.1% of demand on the 2014/15 peak day. the balance of system demand is principally made up of thermal generation along with electricity imports and other renewables.
Figure 4-13: 2015/16 Peak Day Electricity Demand and Wind Generation
31
00:0
0
01:0
0
02:0
0
03:0
0
04:0
0
05:0
0
06:0
0
07:0
0
08:0
0
09:0
0
10:0
0
11:0
0
12:0
0
13:0
0
14:0
0
15:0
0
16:0
0
17:0
0
18:0
0
19:0
0
21:0
0
22:0
0
23:0
0
20:0
0
Dem
and
(GW
h/d)
ROI Electricity Demand Wind Generation
0.0
2000
3000
4000
4500
3500
2500
1500
5000
1000
500
31
4.4.6 Demand Sensitivities4.4.6.1 ewic & Gas demandA sensitivity analysis is included in this year’s NDP to determine the impact that a variation in EWIC flows would have on 1-in-50 peak day gas demand, i.e. no electricity imports and electricity exports. the base case assumes that ewic will be importing at full capacity on a 1-in-50 peak day.
the analysis indicates that the 1-in-50 peak day gas demand would increase by up to 14 Gwh/d when there are no ewic electricity imports and by up to 24 Gwh/d when ewic is exporting. however with the completion of the twinning of the south west scotland Onshore System (SWSOS) in gas year 2017/18, there will be sufficient capacity to meet these additional demands. See section 10.2 for further details of the twinning project.
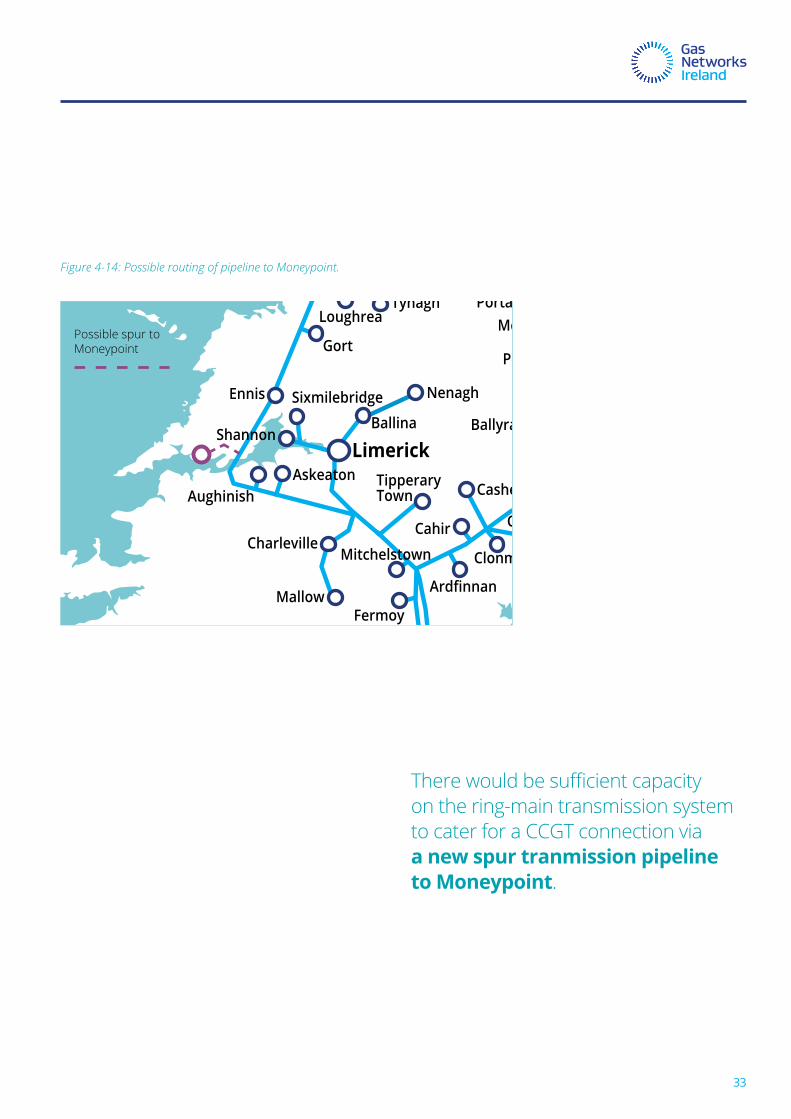
4.4.7 Moneypoint to Gasthe moneypoint coal plant in county clare is due to come to the end of its operating life in 2025. Gas networks ireland has carried out an analysis which considers the capability of the existing gas network to cater for a ccGt in place of the moneypoint coal plant at the same location. The analysis indicates that there would be sufficient capacity on the ring-main transmission system to cater for a ccGt connection via a new spur tranmission pipeline to moneypoint. this pipeline would be approximately 20 km in length, see figure 4-14 for the possible routing of this pipeline. also see section 6.5 for further information on the case for converting moneypoint to natural gas.
Network Development Plan 2016
32
Corrib Gas Field
Scotland
Isle of Man
Kinsale Head Gas FieldSeven Heads Gas Field
Castlebar
Westport Claremorris
Ballinrobe
Headford
LoughreaTynagh
Gort
Galway
Tuam
Ballinasloe
Athlone
Tullamore
Mullingar
Kilcock
Virginia
CarrickmacrossCootehill
Newry
Banbridge
Lurgan
Dundalk
Drogheda
Gormanston
Loughshinny
CrossmolinaBallina
Limerick
Cork
Nenagh
Craughwell
Trim
NavanKells
Bailieborough Kingscourt
Lough Egish
Armagh
PortadownCraigavon
Interconnector 2
Inte
rcon
necto
r 1
Antrim
Moffat
Beattock
Twynholm AGI
Brighouse BayBallymena
Limavady
Coleraine
Ballymoney
Enfield
Ennis
BallinaShannon
AskeatonAughinish
Sixmilebridge
Mitchelstown
Cahir
Fermoy
Charleville
Mallow
KinsaleBandonBallineen
Macroom
Whitegate
Inch Terminal
Belfast
Derry City
Tramore
Carrick-on-Suir
Kilkenny
Great Island
CarlowAthy
Kildare
KilcullenMonasterevin
NaasProsperous
Ballymore Eustace
Portlaoise
Ballyragget
Portarlington
Arklow
Wicklow
BrayBlessington
Rathdrum
Clonmel
Ardfinnan
Tipperary Town Cashel
Dublin
WaterfordWexford
Gas Networks Ireland pipeline
Gas UK Limited pipeline
Planned/Under Construction
Pipelines Owned by Others
Belview Port
Figure 4-14: Possible routing of pipeline to Moneypoint.
possible spur to moneypoint
There would be sufficient capacity on the ring-main transmission system to cater for a ccGt connection via a new spur tranmission pipeline to Moneypoint.
33
Key Messages:
• The Corrib gas field commenced production on the 31st of december 2015 and is expected to meet approximately 55% of annual Gas networks ireland system demands in 2016/17.
• However the Moffat entry point will remain key in terms of energy security as corrib production declines in the medium term.
• the kinsale storage facility has commenced blowdown of southwest kinsale cushion gas, with production expected to cease in 2021.
Section FiveGas supply
Network Development Plan 2016
34
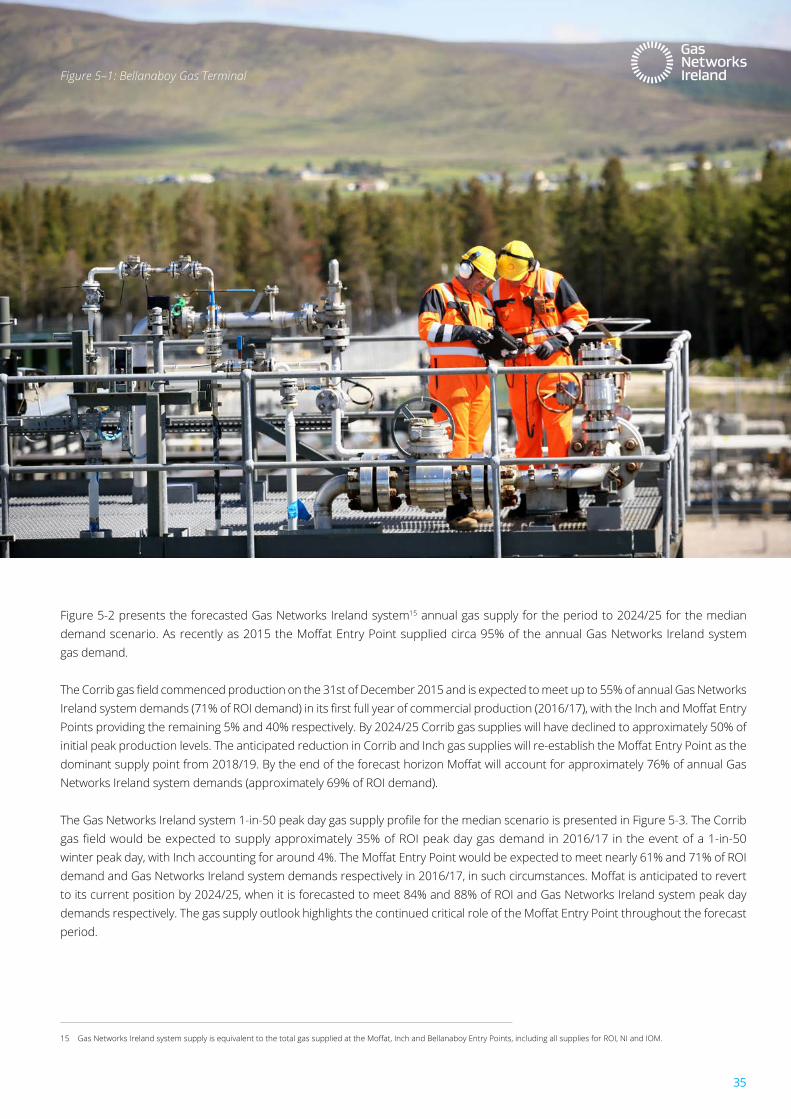
figure 5-2 presents the forecasted Gas networks ireland system15 annual gas supply for the period to 2024/25 for the median demand scenario. As recently as 2015 the Moffat Entry Point supplied circa 95% of the annual Gas Networks Ireland system gas demand.
The Corrib gas field commenced production on the 31st of December 2015 and is expected to meet up to 55% of annual Gas Networks Ireland system demands (71% of ROI demand) in its first full year of commercial production (2016/17), with the Inch and Moffat Entry points providing the remaining 5% and 40% respectively. by 2024/25 corrib gas supplies will have declined to approximately 50% of initial peak production levels. The anticipated reduction in Corrib and Inch gas supplies will re-establish the Moffat Entry Point as the dominant supply point from 2018/19. By the end of the forecast horizon Moffat will account for approximately 76% of annual Gas networks ireland system demands (approximately 69% of roi demand).
The Gas Networks Ireland system 1-in-50 peak day gas supply profile for the median scenario is presented in Figure 5-3. The Corrib gas field would be expected to supply approximately 35% of ROI peak day gas demand in 2016/17 in the event of a 1-in-50 winter peak day, with Inch accounting for around 4%. The Moffat Entry Point would be expected to meet nearly 61% and 71% of ROI demand and Gas Networks Ireland system demands respectively in 2016/17, in such circumstances. Moffat is anticipated to revert to its current position by 2024/25, when it is forecasted to meet 84% and 88% of roi and Gas networks ireland system peak day demands respectively. The gas supply outlook highlights the continued critical role of the Moffat Entry Point throughout the forecast period.
Figure 5–1: Bellanaboy Gas Terminal
15 Gas Networks Ireland system supply is equivalent to the total gas supplied at the Moffat, Inch and Bellanaboy Entry Points, including all supplies for ROI, NI and IOM.
35
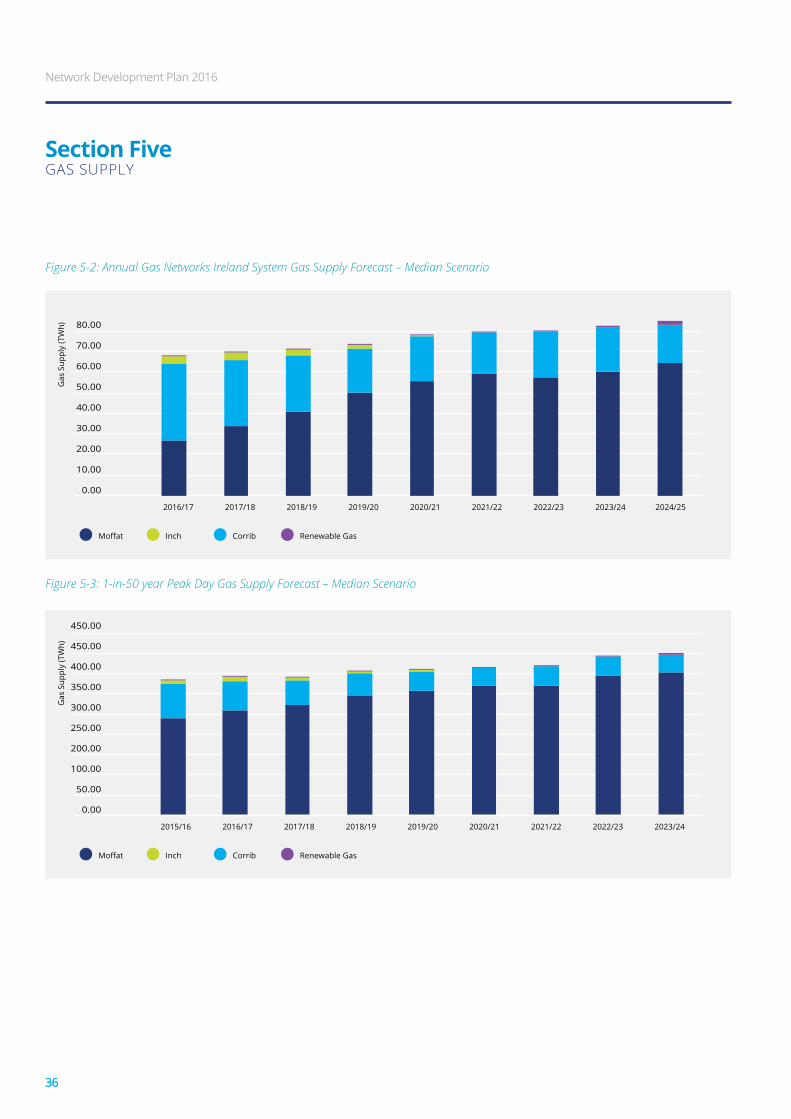
Figure 5-2: Annual Gas Networks Ireland System Gas Supply Forecast – Median Scenario
Figure 5-3: 1-in-50 year Peak Day Gas Supply Forecast – Median Scenario
36
0.00
10.00
20.00
30.00
40.00
50.00
60.00
70.00
80.00
Gas
Sup
ply
(TW
h)
Moffat Inch Corrib Renewable Gas
2024/252016/17 2017/18 2018/19 2019/20 2020/21 2021/22 2022/23 2023/24
0.00
50.00
100.00
200.00
250.00
300.00
350.00
400.00
450.00
450.00
Gas
Sup
ply
(TW
h)
2015/16 2016/17 2017/18 2018/19 2019/20 2020/21 2021/22 2022/23 2023/24
Moffat Inch Corrib Renewable Gas
Section FiveGas supply
Network Development Plan 2016
36
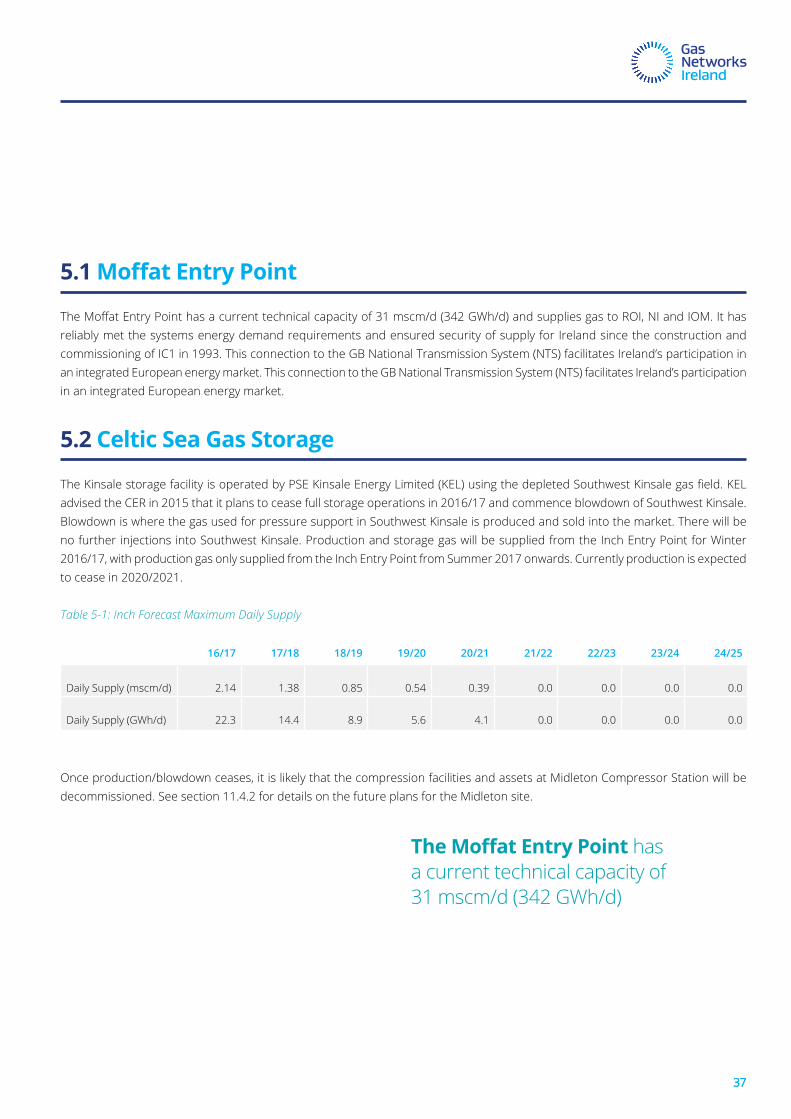
5.1MoffatEntryPoint
The Moffat Entry Point has a current technical capacity of 31 mscm/d (342 GWh/d) and supplies gas to ROI, NI and IOM. It has reliably met the systems energy demand requirements and ensured security of supply for ireland since the construction and commissioning of ic1 in 1993. this connection to the Gb national transmission system (nts) facilitates ireland’s participation in an integrated european energy market. this connection to the Gb national transmission system (nts) facilitates ireland’s participation in an integrated european energy market.
5.2 Celtic Sea Gas Storage
The Kinsale storage facility is operated by PSE Kinsale Energy Limited (KEL) using the depleted Southwest Kinsale gas field. KEL advised the cer in 2015 that it plans to cease full storage operations in 2016/17 and commence blowdown of southwest kinsale. blowdown is where the gas used for pressure support in southwest kinsale is produced and sold into the market. there will be no further injections into southwest kinsale. production and storage gas will be supplied from the inch entry point for winter 2016/17, with production gas only supplied from the inch entry point from summer 2017 onwards. currently production is expected to cease in 2020/2021.
Table 5-1: Inch Forecast Maximum Daily Supply
16/17 17/18 18/19 19/20 20/21 21/22 22/23 23/24 24/25
daily supply (mscm/d) 2.14 1.38 0.85 0.54 0.39 0.0 0.0 0.0 0.0
daily supply (Gwh/d) 22.3 14.4 8.9 5.6 4.1 0.0 0.0 0.0 0.0
once production/blowdown ceases, it is likely that the compression facilities and assets at midleton compressor station will be decommissioned. see section 11.4.2 for details on the future plans for the midleton site.
37
TheMoffatEntryPoint has a current technical capacity of 31 mscm/d (342 Gwh/d)
37
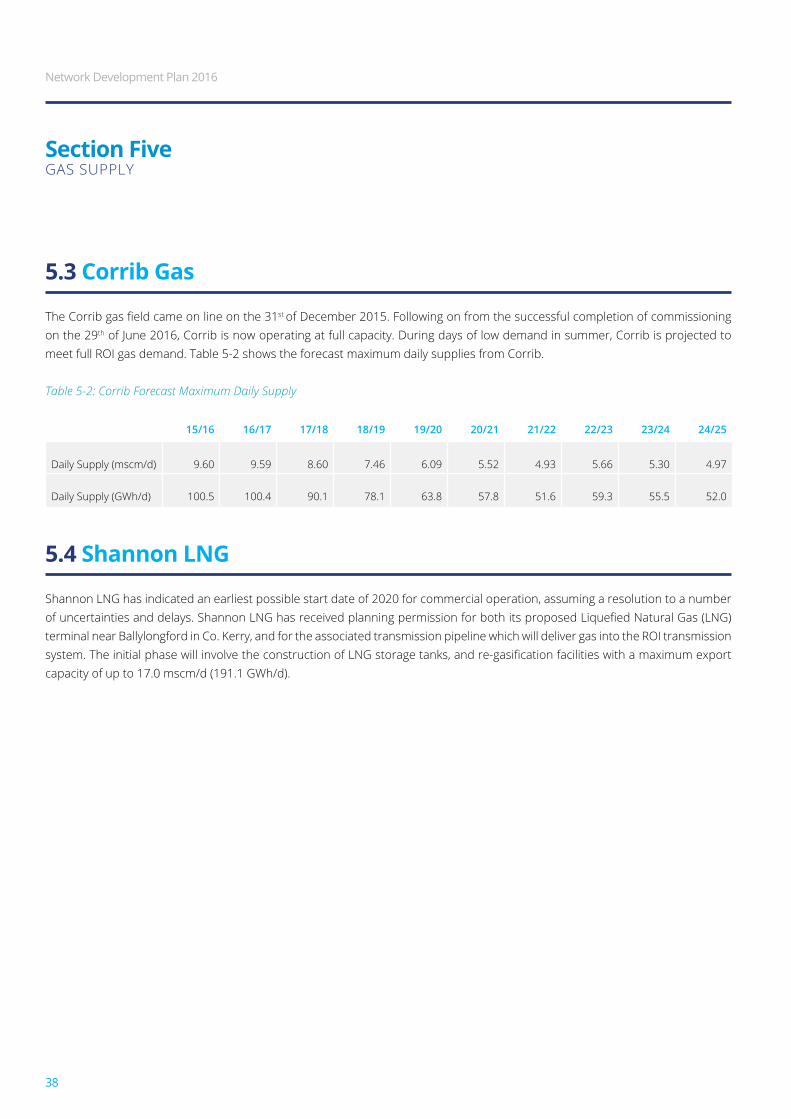
5.3 Corrib Gas
The Corrib gas field came on line on the 31st of december 2015. following on from the successful completion of commissioning on the 29th of june 2016, corrib is now operating at full capacity. during days of low demand in summer, corrib is projected to meet full roi gas demand. table 5-2 shows the forecast maximum daily supplies from corrib.
Table 5-2: Corrib Forecast Maximum Daily Supply
15/16 16/17 17/18 18/19 19/20 20/21 21/22 22/23 23/24 24/25
daily supply (mscm/d) 9.60 9.59 8.60 7.46 6.09 5.52 4.93 5.66 5.30 4.97
daily supply (Gwh/d) 100.5 100.4 90.1 78.1 63.8 57.8 51.6 59.3 55.5 52.0
5.4 Shannon LNG
shannon lnG has indicated an earliest possible start date of 2020 for commercial operation, assuming a resolution to a number of uncertainties and delays. Shannon LNG has received planning permission for both its proposed Liquefied Natural Gas (LNG) terminal near ballylongford in co. kerry, and for the associated transmission pipeline which will deliver gas into the roi transmission system. The initial phase will involve the construction of LNG storage tanks, and re-gasification facilities with a maximum export capacity of up to 17.0 mscm/d (191.1 Gwh/d).
Section FiveGas supply
Network Development Plan 2016
38
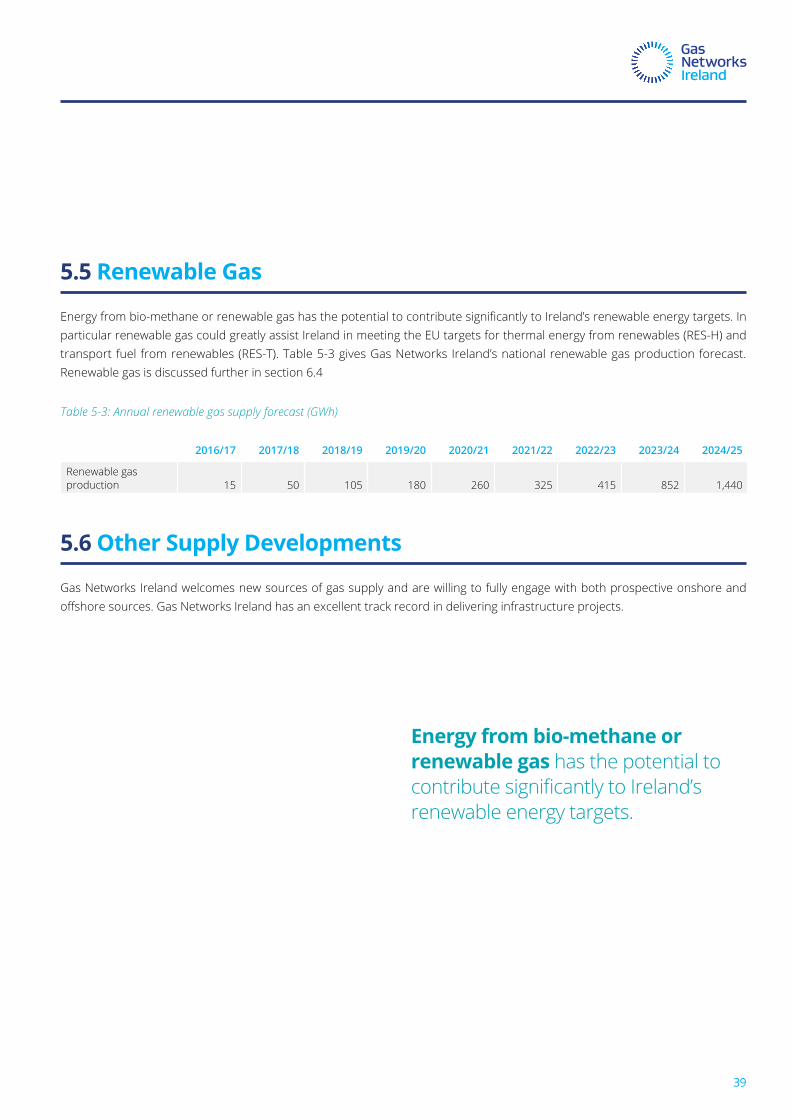
5.5 Renewable Gas
Energy from bio-methane or renewable gas has the potential to contribute significantly to Ireland’s renewable energy targets. In particular renewable gas could greatly assist ireland in meeting the eu targets for thermal energy from renewables (res-h) and transport fuel from renewables (res-t). table 5-3 gives Gas networks ireland’s national renewable gas production forecast. renewable gas is discussed further in section 6.4
Table 5-3: Annual renewable gas supply forecast (GWh)
2016/17 2017/18 2018/19 2019/20 2020/21 2021/22 2022/23 2023/24 2024/25
renewable gas production 15 50 105 180 260 325 415 852 1,440
5.6 Other Supply Developments
Gas networks ireland welcomes new sources of gas supply and are willing to fully engage with both prospective onshore and offshore sources. Gas Networks Ireland has an excellent track record in delivering infrastructure projects.
Energyfrombio-methaneorrenewable gas has the potential to contribute significantly to Ireland’s renewable energy targets.
39
Section SixGas Growth strateGy
Key Messages:
• developing growth initiatives will help to maintain a certain level of system demand which is important for the competitiveness of gas, which will benefit all gas customers.
• key initiatives such as cnG for transport and renewable gas will help ireland meet its environmental targets.
• Gas network growth can help alleviate fuel poverty and drive cost efficiencies for residential and i/c consumers.
Network Development Plan 2016
40
In the past, up to 60% of Ireland’s electricity was generated from natural gas. However, there has been a significant reduction in the amount of electricity being generated from natural gas over the past number of years due to the increased penetration of renewables and the role that gas fired generation has played in facilitating renewable electricity on the system. One impact of this has been a reduction in gas being transported through ireland’s gas infrastructure.
Gas networks ireland is focused on developing a number of growth initiatives to maintain demand on the system as a whole. As more people use the gas transportation system this will help put downward pressure on network tariffs. Developing growth initiatives will help to maintain a certain level of system demand which is important for the competitiveness of gas, which will benefit all gas customers.
Gas Networks Ireland is focused on developing a number of growth initiatives to maintain demand on the system as a whole.
41

6.1 Residential New Connections Growth
there are a large number of properties located close to the network which are not connected to the gas network and thus there is an opportunity to increase the number gas users. it is estimated that there are over 700,000 households in ireland using oil for central heating and 300,000 of those have a gas network nearby and could be readily connected to gas.16
Gas networks ireland has committed more resources to new connections and has already seen an increase in connections for 2015 compared to 2014. this trend is set to continue with an increased focus on this area of the business. a number of new towns have been connected (e.g. nenagh and wexford) and further towns are currently under assessment.
the Government released a new strategy to combat energy poverty, which was published by the department of communications, climate action and environment (dccae) 17 on the 8th of February 2016. This strategy builds on the previous affordable energy strategy and expands the reach of existing energy efficiency schemes. The Government is committed to developing and piloting new measures to find more effective ways to focus energy efficiency efforts on those most at risk of energy poverty. A new €20 million pilot scheme has been created and is central to the new strategy. The scheme will target deep energy efficiency interventions at people in energy poverty who are suffering from acute health conditions and living in poorly insulated homes. Gas has an important role to play in combating energy poverty, as a cleaner, more convenient and cost effective source of fuel for those who are located near the gas grid.
16 the future of oil and Gas in ireland’, policy advisory by the irish academy of engineering, february 2013 17 formerly the department of department of climate change, communications and natural resources (dcccnr)
Section SixGas Growth strateGy
Network Development Plan 2016
42
6.2 Industrial & Commercial Sector Development
Gas Networks Ireland has identified I/C demand growth as a key opportunity for delivering sustainable growth in the gas network. some of the key areas of focus are detailed in the following sections.
18 the ida (industrial development agency) is a semi state body whose main objective is to encourage investment into ireland by foreign-owned companies
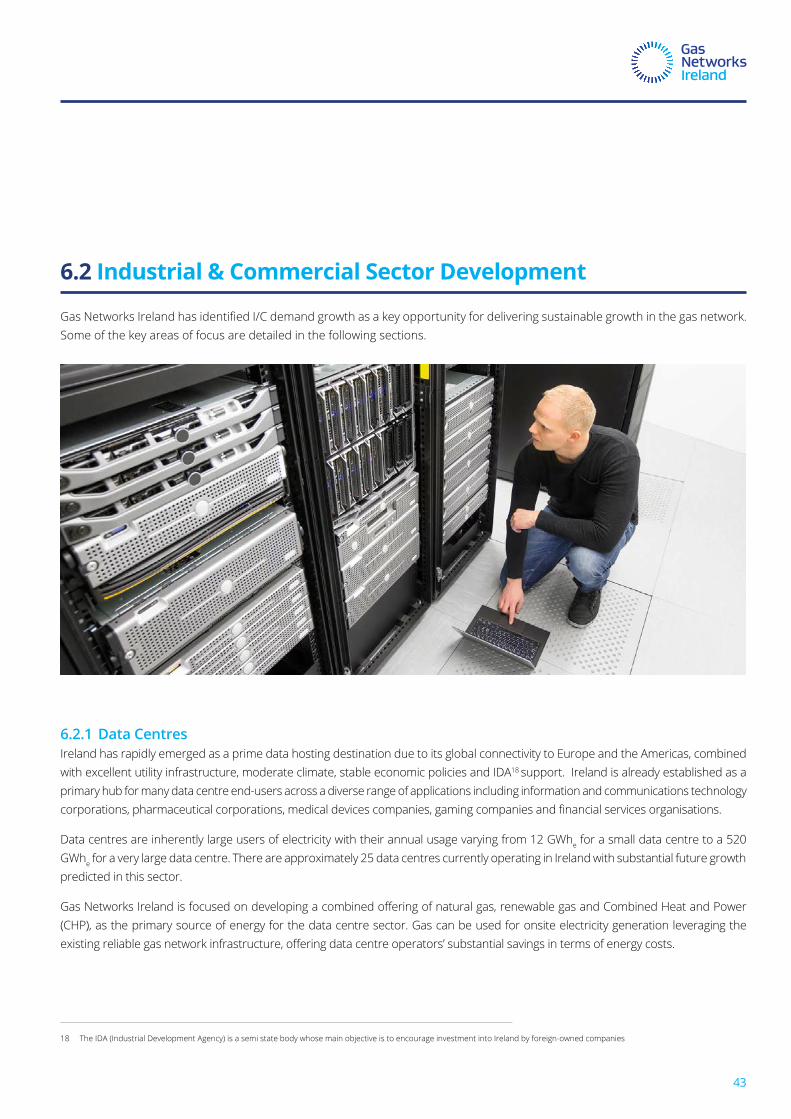
6.2.1 Data Centresireland has rapidly emerged as a prime data hosting destination due to its global connectivity to europe and the americas, combined with excellent utility infrastructure, moderate climate, stable economic policies and ida18 support. ireland is already established as a primary hub for many data centre end-users across a diverse range of applications including information and communications technology corporations, pharmaceutical corporations, medical devices companies, gaming companies and financial services organisations.
data centres are inherently large users of electricity with their annual usage varying from 12 Gwhe for a small data centre to a 520 Gwhe for a very large data centre. there are approximately 25 data centres currently operating in ireland with substantial future growth predicted in this sector.
Gas Networks Ireland is focused on developing a combined offering of natural gas, renewable gas and Combined Heat and Power (chp), as the primary source of energy for the data centre sector. Gas can be used for onsite electricity generation leveraging the existing reliable gas network infrastructure, offering data centre operators’ substantial savings in terms of energy costs.
43
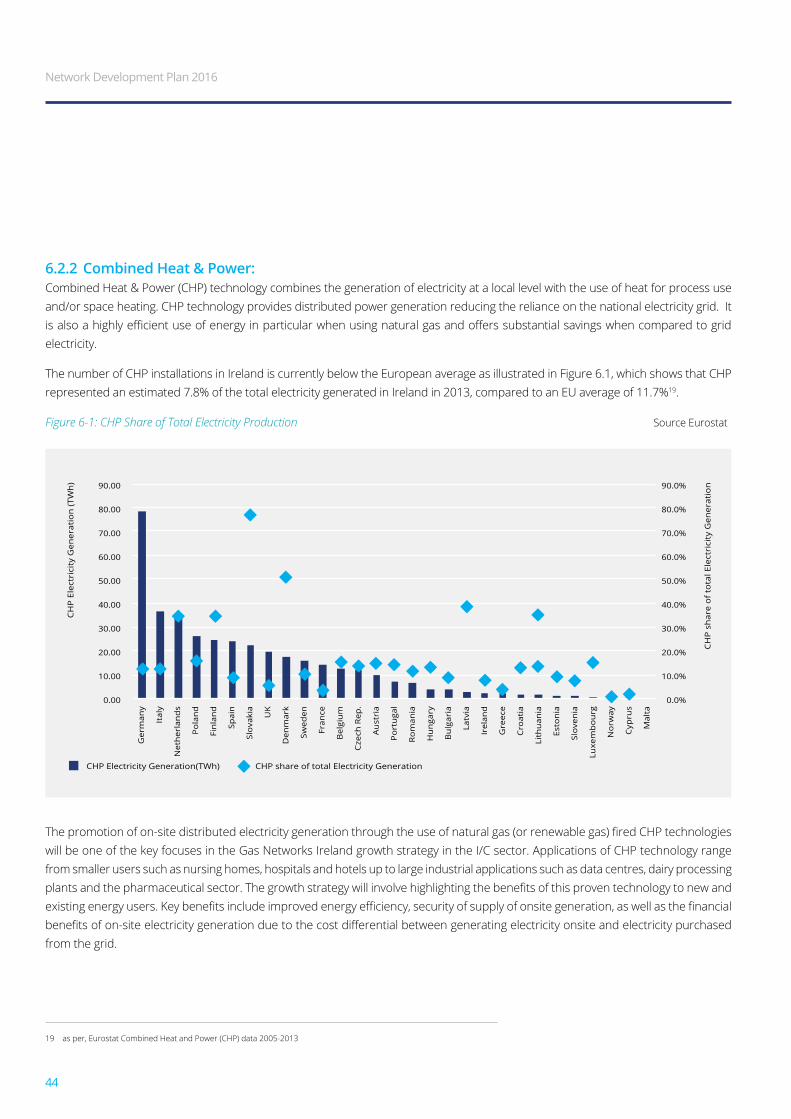
6.2.2 Combined Heat & Power:combined heat & power (chp) technology combines the generation of electricity at a local level with the use of heat for process use and/or space heating. chp technology provides distributed power generation reducing the reliance on the national electricity grid. it is also a highly efficient use of energy in particular when using natural gas and offers substantial savings when compared to grid electricity.
the number of chp installations in ireland is currently below the european average as illustrated in figure 6.1, which shows that chp represented an estimated 7.8% of the total electricity generated in ireland in 2013, compared to an eu average of 11.7%19.
Figure 6-1: CHP Share of Total Electricity Production source eurostat
The promotion of on-site distributed electricity generation through the use of natural gas (or renewable gas) fired CHP technologies will be one of the key focuses in the Gas networks ireland growth strategy in the i/c sector. applications of chp technology range from smaller users such as nursing homes, hospitals and hotels up to large industrial applications such as data centres, dairy processing plants and the pharmaceutical sector. The growth strategy will involve highlighting the benefits of this proven technology to new and existing energy users. Key benefits include improved energy efficiency, security of supply of onsite generation, as well as the financial benefits of on-site electricity generation due to the cost differential between generating electricity onsite and electricity purchased from the grid.
19 as per, eurostat combined heat and power (chp) data 2005-2013
CH
P E
lect
rici
ty G
ener
atio
n (T
Wh
)
CHP Electricity Generation(TWh)
CH
P s
har
e o
f to
tal E
lect
rici
ty G
ener
atio
n
CHP share of total Electricity Generation
0.00
10.00
20.00
30.00
40.00
50.00
60.00
70.00
80.00
90.00
0.0%
10.0%
20.0%
30.0%
40.0%
50.0%
60.0%
70.0%
80.0%
90.0%
Ger
man
y
Ital
y
Net
her
lan
ds
Po
lan
d
Fin
lan
d
Spai
n
Slo
vaki
a
UK
Den
mar
k
Swed
en
Fran
ce
Bel
giu
m
Cze
ch R
ep.
Au
stri
a
Po
rtu
gal
Ro
man
ia
Hu
nga
ry
Bu
lgar
ia
Latv
ia
Irel
and
Gre
ece
Cro
atia
Lith
uan
ia
Esto
nia
Slo
ven
ia
Luxe
mb
ou
rg
No
rway
Cyp
rus
Mal
ta
Network Development Plan 2016
44
20 the white paper - ireland’s transition to a low carbon energy future, was published by the department of climate change, communications and natural resources (dcccnr) in december 2015.
the Government’s recent white paper – ireland’s transition to a low carbon energy future20, acknowledges the significant role CHP technology has to play as a “method of improving the efficiency of energy use leading to emissions reduction” and commits to developing a policy framework to encourage the development of chp.
A new focus at government level in terms of increasing the penetration of CHP technology, coupled with SEAI efforts to promote and police energy efficiency measures in the large I/C sector will drive further growth in this area and help to reduce greenhouse gas emissions.
6.2.3 Other Developmentssince the elimination of the milk quota system on 1st april 2015 the dairy industry has seen substantial growth and this is predicted to continue. A recent Teagasc report entitled “The End of the Quota Era: A History of the Irish Dairy Sector and Its Future Prospects” has predicted that milk production will expand by 17% in the 2015 to 2017 period over the 2013 level. this report also noted that an additional 20% growth would be required to meet the dairy industries 2020 target. Gas networks ireland’s focus will be to ensure that it retains and grows its share of this business as well as promoting the most up-to-date technologies, including chp, to optimise energy efficiency and reduce the carbon footprint of these facilities. It will also advocate the use of renewable gas in the industry for a carbon neutral processing footprint, with renewable gas injected into the gas grid and off-taken at these processing facilities.
ireland continues to attract new foreign direct investment (fdi) developments in the pharmaceutical and bio-medical sector. Gas networks ireland is focused on developing further gas demand growth in this key sector of the economy, and ensuring that existing customers utilise the most up to date and sustainable technologies, including chp and renewable gas.
45
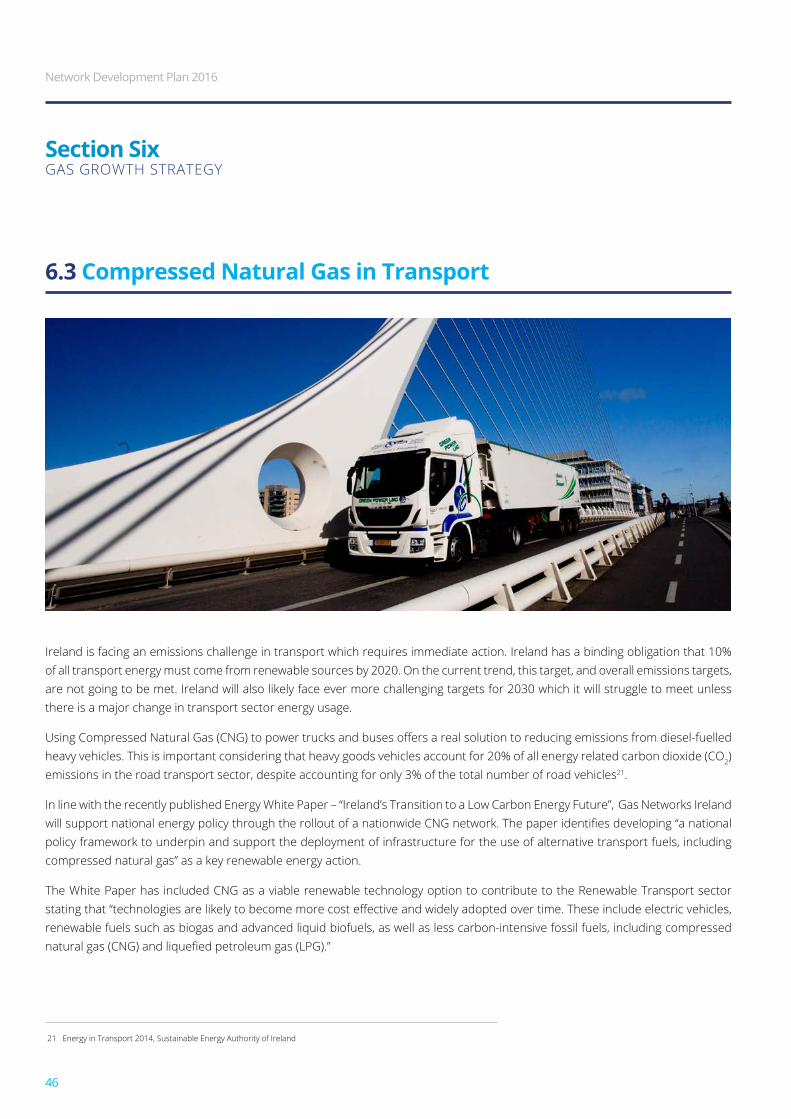
6.3 Compressed Natural Gas in Transport
ireland is facing an emissions challenge in transport which requires immediate action. ireland has a binding obligation that 10% of all transport energy must come from renewable sources by 2020. on the current trend, this target, and overall emissions targets, are not going to be met. ireland will also likely face ever more challenging targets for 2030 which it will struggle to meet unless there is a major change in transport sector energy usage.
Using Compressed Natural Gas (CNG) to power trucks and buses offers a real solution to reducing emissions from diesel-fuelled heavy vehicles. this is important considering that heavy goods vehicles account for 20% of all energy related carbon dioxide (co2) emissions in the road transport sector, despite accounting for only 3% of the total number of road vehicles21.
In line with the recently published Energy White Paper – “Ireland’s Transition to a Low Carbon Energy Future”, Gas networks ireland will support national energy policy through the rollout of a nationwide CNG network. The paper identifies developing “a national policy framework to underpin and support the deployment of infrastructure for the use of alternative transport fuels, including compressed natural gas” as a key renewable energy action.
the white paper has included cnG as a viable renewable technology option to contribute to the renewable transport sector stating that “technologies are likely to become more cost effective and widely adopted over time. These include electric vehicles, renewable fuels such as biogas and advanced liquid biofuels, as well as less carbon-intensive fossil fuels, including compressed natural gas (CNG) and liquefied petroleum gas (LPG).”
Section SixGas Growth strateGy
21 energy in transport 2014, sustainable energy authority of ireland
Network Development Plan 2016
46
22 Ref. http://www.ngvjournal.com/worldwide-ngv-statistics/”
another notable undertaking within the white paper is the establishment of a Green bus fund to promote sustainable public transport. This initiative intends “to support energy efficient and renewable transport, by establishing a “green bus fund to support the purchase of cleaner and greener public transport vehicles in the period to 2020”.
In order to facilitate these initiatives and encourage the uptake of CNG by commercial fleet operators Gas Networks Ireland intends to provide full national coverage of public CNG fast-fill compressor stations. Gas Networks Ireland is proposing to develop a 70-station cnG fuelling network, co-located in existing forecourts, on major routes and/or close to urban centres. this will help satisfy the requirements of the eu’s alternative fuels directive which aims to establish cnG refuelling facilities along key routes at every 150km by 2025. this comprehensive refuelling station network, will allow a transition to both natural gas and renewable gas as alternative fuels. the existing natural gas network can be utilised as a national vehicle refuelling network, giving the commercial transport sector access to a cleaner, cheaper fuel with a similar operational performance to diesel. for areas not connected to the natural gas network, cnG can be supplied in a similar way as diesel is supplied to service stations, by transporting it by truck.
as a commercial proposition cnG is much cheaper than diesel and operators of cnG vehicles can avail of substantial fuel costs savings. Furthermore the Government has committed to a fixed excise duty rate for natural gas and renewable gas until 2023, helping to ensure a low and stable price.
cnG is well established as a transport fuel, with over 22 million natural Gas vehicles worldwide22 and as such offers a low risk alternative fuel option for operators. CNG vehicle offers comparable range to diesel and petrol vehicles.
Gas networks ireland is currently targeting at least 5% penetration of cnG or renewable gas for commercial transport and 10% of the bus market in ireland by 2025. see section 4.3.4 for projected transport sector gas demand.
Case Study: Clean Ireland RecyclingGas networks ireland is supporting the rollout of a number of cnG refuelling facilities across ireland in the coming years. One such facility is the fast-fill CNG facility at Clean Ireland Recycling’s facility in Shannon, Co. clare. clean ireland specialise in skip hire and waste collection for domestic and commercial customers in Limerick, Clare and North Kerry. During 2016 Clean Ireland will install a fast-fill CNG unit at their facility in Shannon to serve the first of their dedicated CNG refuse collection vehicles. This unit will be capable of refuelling up to five vehicles an hour with a refuelling time of less than 10 minutes per vehicle. This facility will represent Ireland’s first sustainable transport refuse collection service.
47
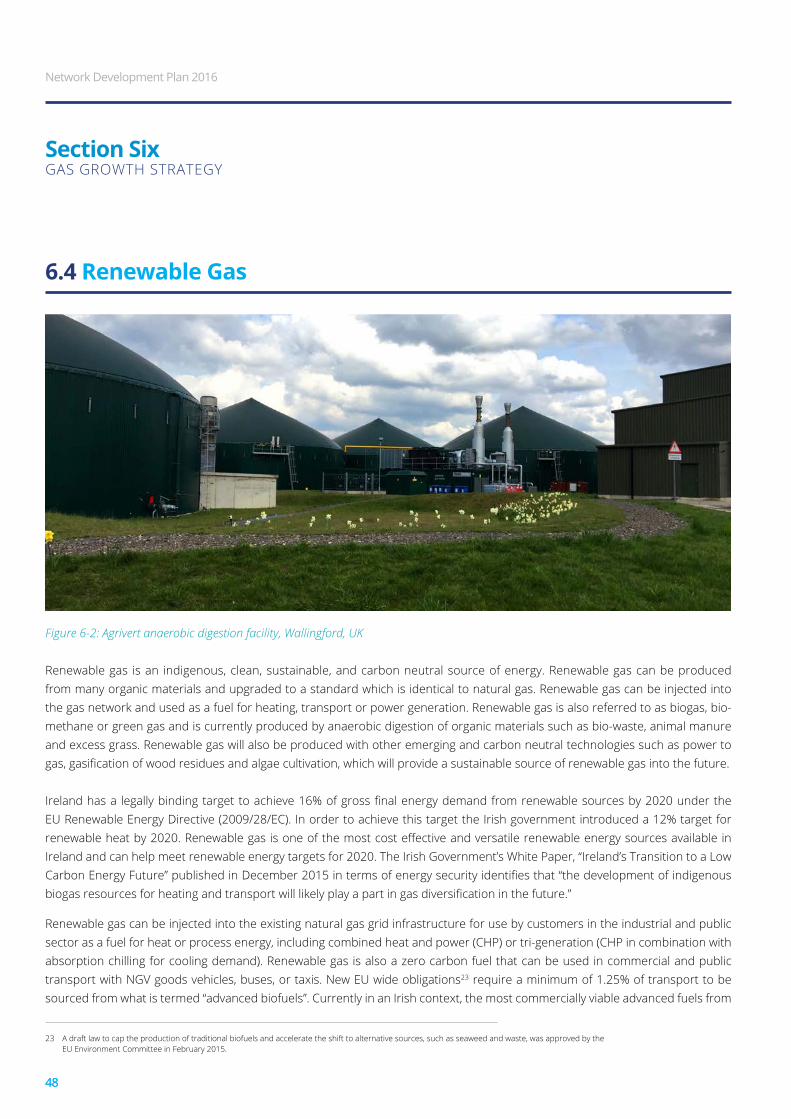
6.4 Renewable Gas
Figure 6-2: Agrivert anaerobic digestion facility, Wallingford, UK
renewable gas is an indigenous, clean, sustainable, and carbon neutral source of energy. renewable gas can be produced from many organic materials and upgraded to a standard which is identical to natural gas. renewable gas can be injected into the gas network and used as a fuel for heating, transport or power generation. renewable gas is also referred to as biogas, bio-methane or green gas and is currently produced by anaerobic digestion of organic materials such as bio-waste, animal manure and excess grass. renewable gas will also be produced with other emerging and carbon neutral technologies such as power to gas, gasification of wood residues and algae cultivation, which will provide a sustainable source of renewable gas into the future.
Ireland has a legally binding target to achieve 16% of gross final energy demand from renewable sources by 2020 under the eu renewable energy directive (2009/28/ec). in order to achieve this target the irish government introduced a 12% target for renewable heat by 2020. Renewable gas is one of the most cost effective and versatile renewable energy sources available in ireland and can help meet renewable energy targets for 2020. the irish Government’s white paper, “ireland’s transition to a low Carbon Energy Future” published in December 2015 in terms of energy security identifies that “the development of indigenous biogas resources for heating and transport will likely play a part in gas diversification in the future.”
renewable gas can be injected into the existing natural gas grid infrastructure for use by customers in the industrial and public sector as a fuel for heat or process energy, including combined heat and power (chp) or tri-generation (chp in combination with absorption chilling for cooling demand). renewable gas is also a zero carbon fuel that can be used in commercial and public transport with nGv goods vehicles, buses, or taxis. new eu wide obligations23 require a minimum of 1.25% of transport to be sourced from what is termed “advanced biofuels”. Currently in an Irish context, the most commercially viable advanced fuels from
48
23 a draft law to cap the production of traditional biofuels and accelerate the shift to alternative sources, such as seaweed and waste, was approved by the eu environment committee in february 2015.
Section SixGas Growth strateGy
Network Development Plan 2016
48
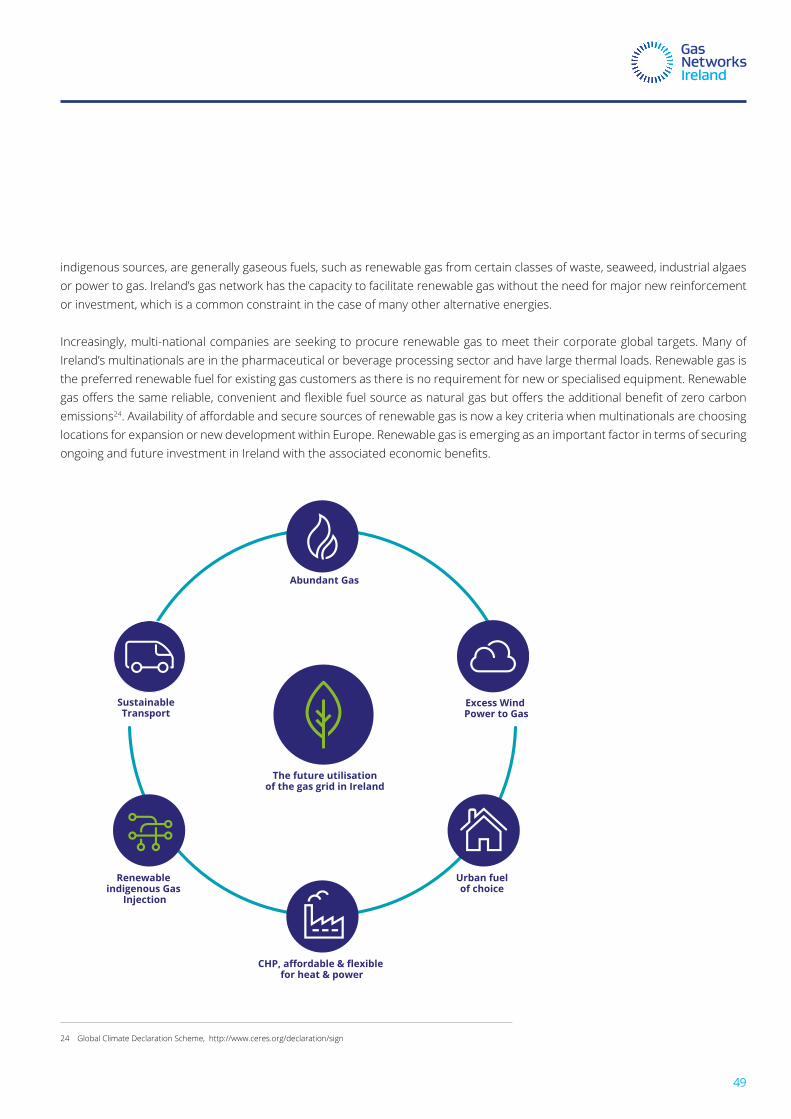
24 Global climate declaration scheme, http://www.ceres.org/declaration/sign
indigenous sources, are generally gaseous fuels, such as renewable gas from certain classes of waste, seaweed, industrial algaes or power to gas. ireland’s gas network has the capacity to facilitate renewable gas without the need for major new reinforcement or investment, which is a common constraint in the case of many other alternative energies.
increasingly, multi-national companies are seeking to procure renewable gas to meet their corporate global targets. many of ireland’s multinationals are in the pharmaceutical or beverage processing sector and have large thermal loads. renewable gas is the preferred renewable fuel for existing gas customers as there is no requirement for new or specialised equipment. renewable gas offers the same reliable, convenient and flexible fuel source as natural gas but offers the additional benefit of zero carbon emissions24. Availability of affordable and secure sources of renewable gas is now a key criteria when multinationals are choosing locations for expansion or new development within europe. renewable gas is emerging as an important factor in terms of securing ongoing and future investment in Ireland with the associated economic benefits.
The future utilisation of the gas grid in Ireland
Renewable indigenous Gas
Injection
Excess Wind Power to Gas
Urban fuelof choice
SustainableTransport
Abundant Gas
CHP, affordable & flexible for heat & power
49
renewable gas is already well developed and available at competitive rates in other european countries, leaving ireland at a competitive disadvantage within the eu. the uk has developed 65 renewable gas to grid projects as of april 2016 thanks to government policy support through the renewable heat incentive25. the department of communications, climate action and environment (dccae) is currently developing a renewable heat incentive (rhi) for ireland. it is expected the scheme will be in place by 2017. state support is required to cover the price gap between wholesale natural gas and the cost of producing bio-methane. inclusion of bio-methane in the rhi is critical for the development of renewable gas to grid projects in ireland.
The benefits of facilitating renewable gas on the Irish gas grid include enhanced energy security and diversity of supply, while also creating direct employment and enhancing rural and regional economic development. in the long term the development of an indigenous renewable gas industry will play a key role in decarbonising ireland’s energy requirements, through a balanced portfolio of renewable energy sources.
utilising mature technologies, with the right investment, renewable gas has the potential to satisfy over 20% of ireland’s gas demand by 2030. This figure is derived from existing, available organic waste & residues, animal manures, additional grass in excess of livestock requirements and additional sources such as power to gas and algae sources in ireland. renewable gas production processes are the most environmentally friendly and economical means of processing such wastes, compared to the current practises in Ireland of composting, landfill, exporting, land spreading and incineration. Capitalising on this opportunity would reduce the country’s reliance on imported fuels and provide ireland with a renewable indigenous fuel source. Gas networks ireland is proposing a target to achieve 20% renewable gas on the gas network by 2030.
With new emerging technologies such as Power to Gas with methanation, algae, and gasification it is clear that far more ambitious targets are possible for 2050. several eu gas network operators have already committed to a drive towards fully de-carbonised gas grids. Gas networks ireland is developing a roadmap for the development of renewable gas in ireland and is committed to collaborating with other european network operators in this area.
Section SixGas Growth strateGy
utilising mature technologies, with the right investment, renewable gas has the potential to satisfy over 20% of Ireland’s gas demand by 2030.
25 https://www.ofgem.gov.uk/environmental-programmes/non-domestic-renewable-heat-incentive-rhi
Network Development Plan 2016
50
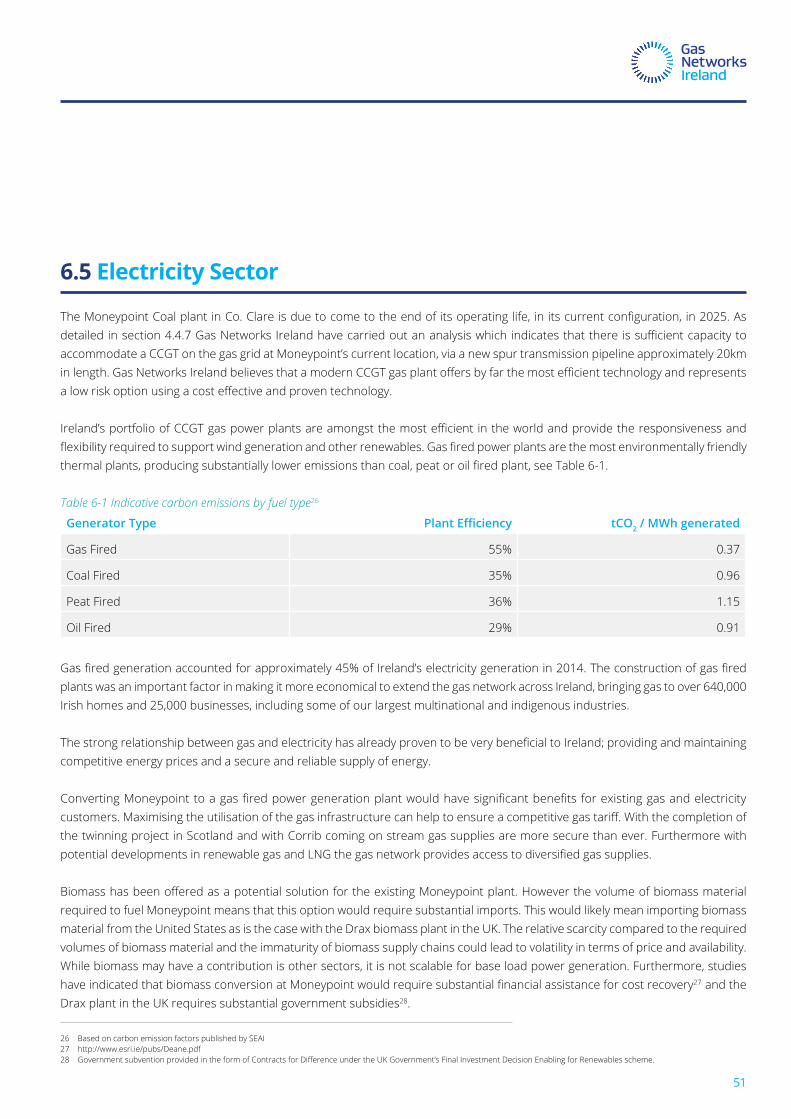
26 based on carbon emission factors published by seai 27 http://www.esri.ie/pubs/deane.pdf 28 Government subvention provided in the form of Contracts for Difference under the UK Government’s Final Investment Decision Enabling for Renewables scheme.
6.5 ElectricitySector
The Moneypoint Coal plant in Co. Clare is due to come to the end of its operating life, in its current configuration, in 2025. As detailed in section 4.4.7 Gas Networks Ireland have carried out an analysis which indicates that there is sufficient capacity to accommodate a ccGt on the gas grid at moneypoint’s current location, via a new spur transmission pipeline approximately 20km in length. Gas Networks Ireland believes that a modern CCGT gas plant offers by far the most efficient technology and represents a low risk option using a cost effective and proven technology.
Ireland’s portfolio of CCGT gas power plants are amongst the most efficient in the world and provide the responsiveness and flexibility required to support wind generation and other renewables. Gas fired power plants are the most environmentally friendly thermal plants, producing substantially lower emissions than coal, peat or oil fired plant, see Table 6-1.
Table 6-1 Indicative carbon emissions by fuel type26
Generator Type Plant Efficiency tCO2 / MWh generated
Gas fired 55% 0.37
coal fired 35% 0.96
peat fired 36% 1.15
oil fired 29% 0.91
Gas fired generation accounted for approximately 45% of Ireland’s electricity generation in 2014. The construction of gas fired plants was an important factor in making it more economical to extend the gas network across ireland, bringing gas to over 640,000 irish homes and 25,000 businesses, including some of our largest multinational and indigenous industries.
The strong relationship between gas and electricity has already proven to be very beneficial to Ireland; providing and maintaining competitive energy prices and a secure and reliable supply of energy.
Converting Moneypoint to a gas fired power generation plant would have significant benefits for existing gas and electricity customers. Maximising the utilisation of the gas infrastructure can help to ensure a competitive gas tariff. With the completion of the twinning project in scotland and with corrib coming on stream gas supplies are more secure than ever. furthermore with potential developments in renewable gas and LNG the gas network provides access to diversified gas supplies.
Biomass has been offered as a potential solution for the existing Moneypoint plant. However the volume of biomass material required to fuel moneypoint means that this option would require substantial imports. this would likely mean importing biomass material from the united states as is the case with the drax biomass plant in the uk. the relative scarcity compared to the required volumes of biomass material and the immaturity of biomass supply chains could lead to volatility in terms of price and availability. while biomass may have a contribution is other sectors, it is not scalable for base load power generation. furthermore, studies have indicated that biomass conversion at Moneypoint would require substantial financial assistance for cost recovery27 and the drax plant in the uk requires substantial government subsidies28.
51
Key Messages:
• with the bellanaboy entry point (corrib) coming on line it has created a need for low and variable flows in south west scotland, which impacts the running Gas networks ireland’s compressor stations.
• increasing renewable generation is having an increasing impact on flow profiles and system operation, particularly at the Moffat Entry Point.
• Gas networks ireland continues to reiterate the importance of accurate and timely re-nominations in order to operate the gas network in an effective and efficient manner.
52
Section Sevensystem operation
Network Development Plan 2016
52
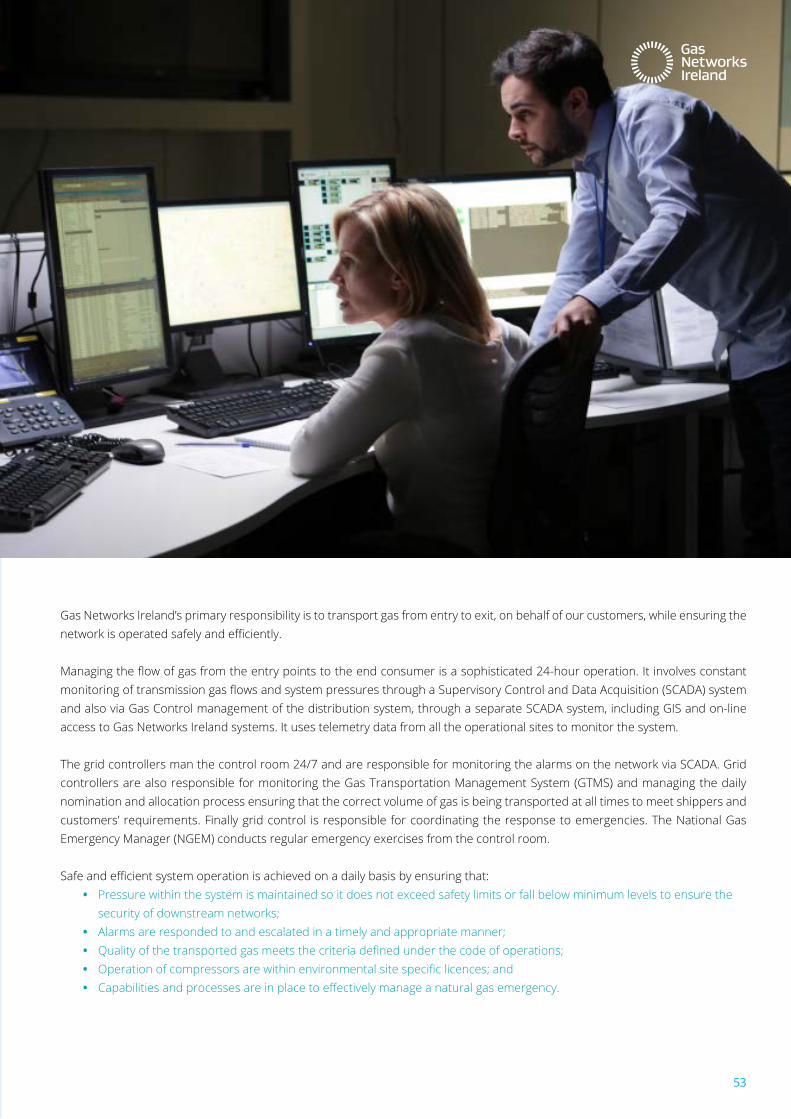
Gas networks ireland’s primary responsibility is to transport gas from entry to exit, on behalf of our customers, while ensuring the network is operated safely and efficiently.
Managing the flow of gas from the entry points to the end consumer is a sophisticated 24-hour operation. It involves constant monitoring of transmission gas flows and system pressures through a Supervisory Control and Data Acquisition (SCADA) system and also via Gas control management of the distribution system, through a separate scada system, including Gis and on-line access to Gas networks ireland systems. it uses telemetry data from all the operational sites to monitor the system.
the grid controllers man the control room 24/7 and are responsible for monitoring the alarms on the network via scada. Grid controllers are also responsible for monitoring the Gas transportation management system (Gtms) and managing the daily nomination and allocation process ensuring that the correct volume of gas is being transported at all times to meet shippers and customers’ requirements. finally grid control is responsible for coordinating the response to emergencies. the national Gas emergency manager (nGem) conducts regular emergency exercises from the control room.
Safe and efficient system operation is achieved on a daily basis by ensuring that:• pressure within the system is maintained so it does not exceed safety limits or fall below minimum levels to ensure the
security of downstream networks; • alarms are responded to and escalated in a timely and appropriate manner;• Quality of the transported gas meets the criteria defined under the code of operations;• Operation of compressors are within environmental site specific licences; and• Capabilities and processes are in place to effectively manage a natural gas emergency.
53
7.1 Challenges
the operation of the gas system has changed considerably since the network was originally designed, particularly with the bellanaboy entry point coming on line recently. while the new entry point has brought with it enhanced security of supply it has also created a need for low and variable flows in South West Scotland at the Moffat Entry point. This impacts the running of Gas Networks Ireland’s compressor stations and how flow rates are profiled over the course of a gas day.
In particular, there will be reduced flow through the Moffat Interconnector particularly during the summer months, where on occasion, Corrib will have sufficient capacity to meet 100% of ROI gas demand.The resultant reduction in interconnector flows will have a significant impact on the operation of the two compressor stations in Scotland, as these compressor stations were not designed to accommodate low flows. This creates a requirement for investment in more flexible compressor/turbine technology, which would accommodate a wider operating range, to complement the existing fleet. See section 10.4 for further details.
having a need to transport large quantities of gas from the west of the country to the east is a fundamental change in how the transporter operates the network with large end users experiencing a change in network prevailing pressures depending on location.
This change in the dynamic of network flows will have an impact in terms of Gas Networks Ireland’s maintenance and inspection activities, particularly with respect to on-line pipeline inspection. such activities may, on occasion, require Gas networks ireland to restrict supplies from certain entry points, so as to provide the required gas velocities over the pipeline segment being inspected.
Another significant change that will be evident to shippers and large end users will be the variability of Calorific Values (CV) entering the network – albeit the CV will remain within the limits of the specification as agreed under the Code29.
Some of these changes are a result of user requirements, resulting in very different gas flow patterns than those for which the network was originally designed. Non-uniform profiles may trigger a requirement for system investment and will continue to be monitored through network planning analysis.
Gas Networks Ireland is also seeing changes in shipper behaviour with significant quantities of gas being left on the network, which is creating a need for increased activity on the balancing sell contract. since the implementation of the eu network codes on the 1st of october 2015, shippers will also be aware that the last time for submission of re-nominations is now only 3 hours from the end of the gas day (previously this was 4 hrs 15 mins from the end of the gas day). Given that operationally Gas networks ireland has lost over an hours’ worth of time to respond to re-nominations, late upward re-nominations may be difficult to accommodate.Gas network ireland continues to reiterate the importance of accurate and timely re-nominations in order to operate the gas network in an effective and efficient manner.
Section Sevensystem operation
29 the code of operations stipulates that the cv must be within the range 36.9 – 42.3 mj/m3.
Network Development Plan 2016
54
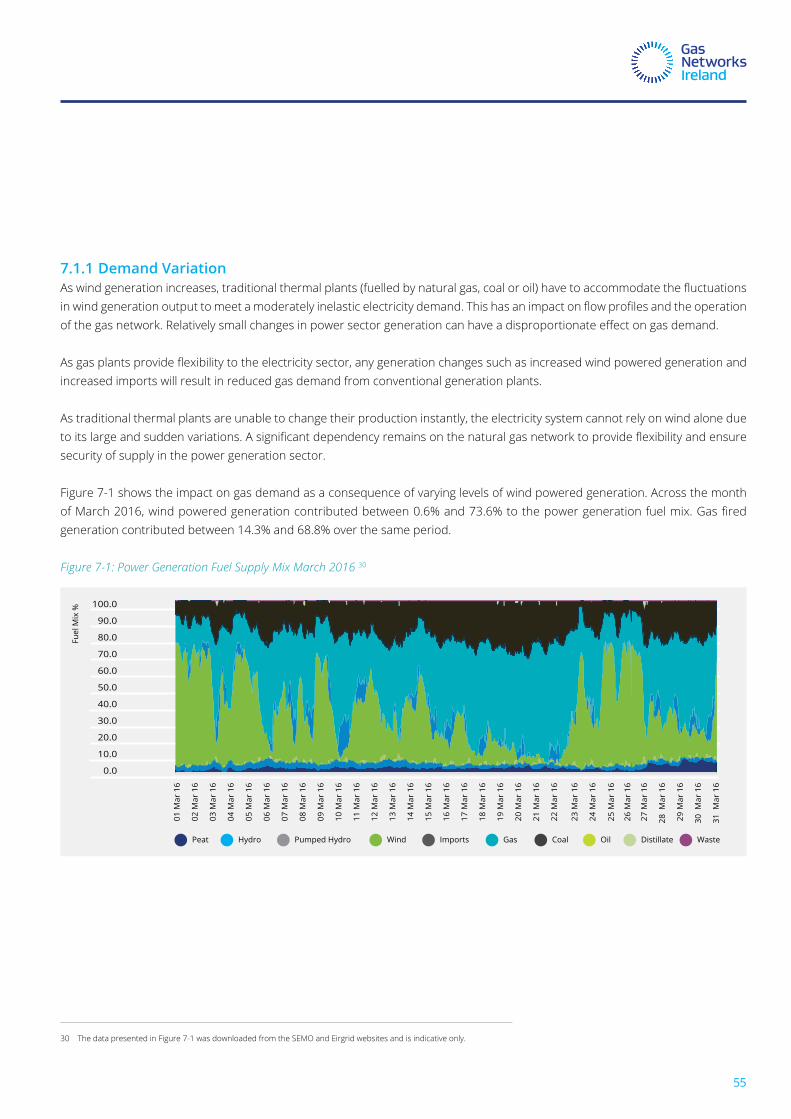
7.1.1 Demand VariationAs wind generation increases, traditional thermal plants (fuelled by natural gas, coal or oil) have to accommodate the fluctuations in wind generation output to meet a moderately inelastic electricity demand. This has an impact on flow profiles and the operation of the gas network. Relatively small changes in power sector generation can have a disproportionate effect on gas demand.
As gas plants provide flexibility to the electricity sector, any generation changes such as increased wind powered generation and increased imports will result in reduced gas demand from conventional generation plants.
as traditional thermal plants are unable to change their production instantly, the electricity system cannot rely on wind alone due to its large and sudden variations. A significant dependency remains on the natural gas network to provide flexibility and ensure security of supply in the power generation sector.
figure 7-1 shows the impact on gas demand as a consequence of varying levels of wind powered generation. across the month of March 2016, wind powered generation contributed between 0.6% and 73.6% to the power generation fuel mix. Gas fired generation contributed between 14.3% and 68.8% over the same period.
Figure 7-1: Power Generation Fuel Supply Mix March 2016 30
30 the data presented in figure 7-1 was downloaded from the semo and eirgrid websites and is indicative only.
0.0
30.0
40.0
50.0
20.0
10.0
01 M
ar 1
6
02 M
ar 1
6
03 M
ar 1
6
04 M
ar 1
6
05 M
ar 1
6
06 M
ar 1
6
07 M
ar 1
6
08 M
ar 1
6
09 M
ar 1
6
10 M
ar 1
6
11 M
ar 1
6
12 M
ar 1
6
13 M
ar 1
6
14 M
ar 1
6
15 M
ar 1
6
16 M
ar 1
6
17 M
ar 1
6
18 M
ar 1
6
19 M
ar 1
6
20 M
ar 1
6
21 M
ar 1
6
22 M
ar 1
6
23 M
ar 1
6
24 M
ar 1
6
25 M
ar 1
6
26 M
ar 1
6
27 M
ar 1
6
28 M
ar 1
6
29 M
ar 1
6
30 M
ar 1
6
31 M
ar 1
6
Fuel
Mix
%
60.0
80.0
70.0
100.0
90.0
Peat Hydro Pumped Hydro Wind Imports Gas Coal Oil Distillate Waste
55
56
SectionEightprojects of common interest & security of Gas supply
Key Messages:
• Gni (uk) is in the process of submitting a funding application in the second connecting europe facility (cef) call for proposals issued in june 2016, for feasibility studies for Physical Reverse Flow at Moffat.
• the twinning of the south west scotland onshore system (pci 5.2), remains on schedule for completion in 2017/18 and will enhance security of supply to the island of ireland.
Network Development Plan 2016
56
8.1 Projects of Common Interest (PCI)
to help create an integrated eu energy market, the european commission has drawn up a list of 195 key energy infrastructure projects known as projects of common interest (pcis). these are essential for completing the european internal energy market and for reaching the EU’s energy policy objectives of affordable, secure and sustainable energy.
To become a PCI, a project must have a significant impact on the energy markets and market integration of at least two EU countries, boost competition on energy markets and boost the eu’s energy security by diversifying sources, while also contributing to the EU’s climate and energy goals by integrating renewables. The first list of PCIs was published in 2013. The list is updated every two years to integrate newly required projects and remove obsolete ones. the next pci list update will take place in 2017.
the following Gas networks ireland project was approved as a pci project on the 18th november 2015;• PCI 5.1.1 Physical Reverse Flow at Moffat Interconnection Point (Ireland / United Kingdom).
one other roi project was approved by the eu in november 2015;• pci 5.3, shannon lnG terminal located between tarbet and ballylongford.
the previously approved project – twinning of the south west scotland onshore system (pci 5.2), remains on schedule for completion in 2017/18 and will enhance security of supply to the island of Ireland. It brings many other benefits and compliments another PCI, PCI 5.1.1 Physical Reverse Flow at Moffat interconnection point (Ireland/United Kingdom). Completion of the 50 km section of pipeline is a key prerequisite for physical reverse flow at Moffat31. in 2016, the steel line pipe was delivered from Germany to the pipe storage facility in scotland.
57
31 Currently flows at the Moffat interconnection point are uni-directional i.e. GB-IE. System modifications including the twinning would be required to accommodate bi-directional flows at Moffat.
8.2 PhysicalReverseFlowatMoffat
Following the submission of a cost benefit analysis to the European Commission in May 2015, Physical Reverse Flow at Moffat was included on the second european union list published in november 2015.
This project will look at physical reverse flow from Republic of Ireland to Great Britain, and also to Northern Ireland via the Scotland Northern Ireland Pipeline (SNIP), providing security of supply benefits on a regional basis, in addition to increased market integration and increased competition.
Gni (uk) submitted an application under the connecting europe facility (cef) for feasibility studies in october 2015. this application was not successful. however a second call for applications was issued in june 2016 and the deadline for submissions is the 8th of November 2016. At the time of writing GNI (UK) Limited is in the process of submitting a modified application for CEF funding in relation to these studies.
8.3 EuropeanRegulation994/2010
as ireland’s designated competent authority under eu regulation no. 994/2010, the cer is required to produce:• security of supply risk assessment• national Gas preventive action plan• national Gas supply emergency plan
the risk assessment considers the n-1 criteria, which refers to the capacity of the gas network to meet gas demand where the largest piece of infrastructure fails on a day of exceptionally high gas demand. In the event that a member state cannot fulfil the n-1 standard on a national basis, the regulation permits the adoption of a regional approach towards meeting the n-1.
if the regional approach is adopted, there is an obligation on the member states involved to produce on a regional basis a:
• joint risk assessment• joint preventive action plan
as ireland cannot meet the n-1 infrastructure standard on a national basis, the uk and ireland have adopted a regional approach towards fulfilling the N-1 Infrastructure standard. The 2016 Risk Assessments are due to be submitted to the European Commission in september 2016 and Gas networks ireland has provided technical support to the cer in terms of the development of the risk assessments. Gas networks ireland will continue to develop the network to ensure a safe, secure, robust and resilient gas network is maintained to ensure security of supply to end consumers.
Gas networks ireland notes the result of the united kingdom european union membership referendum and is committed to working with industry partners to ensure that there will be no impact on the operation of the gas network, particularly in terms of security of supply. the ireland / uk inter-governmental gas treaty signed in 1993, which governs the operation of the inter- connectors remains in place.
SectionEightsecurity of Gas supply
Network Development Plan 2016
58
8.4 EmergencyPreparedness
the cer has designated Gas networks ireland to undertake the role of the national Gas emergency manager (nGem) in accordance with si. 697 of 2007. the nGem has responsibility for declaring a natural gas emergency, as well as coordinating planning arrange-ments and any emergency response in accordance with the natural Gas emergency plan (nGep).
the aim of the nGep is to;• protect the safety of the general public;• protect property and key infrastructure; and• minimise disruption resulting from a gas supply emergency.
the nGem may activate the nGep if it establishes that it is not possible to maintain an acceptable balance between supply and demand, or there is insufficient gas leading to the possibility of a natural gas emergency developing. As part of the NGEP, the nGem will establish the Gas emergency response team (Gert), which will be responsible for implementing the directions of the nGem to execute the necessary operational response.
as part of the nGep, the nGem will establish the GasEmergenciesResponseTeam(GERT)
59
Key Messages:
• Gas networks ireland supports the development of new entrants to both the retail and wholesale markets.
• at eu level, following recent development of network codes through various entsoG workgroups the focus has moved to implementation at national level.
Section Ninecommercial market arranGements
Network Development Plan 2016
60
9.1 Republic of Ireland Gas Market
Gas networks ireland, in providing transportation services to shippers and suppliers operating in the wholesale and retail markets, also interacts with regulatory authorities and industry. Gas networks ireland supports the development of new entrants to both the retail and wholesale markets by facilitating and mentoring their entry into the gas market.
the following is a non-exhaustive list of Gas networks ireland’s responsibilities:• develop and maintain strategies for the irish natural gas wholesale and retail markets;• establish market rules; • support initiatives from various industry bodies;• support compliance with eu legislation as well as playing a driving role in the development of market arrangements to
meet with industry best practice;• implement legal and contractual arrangements required under irish and european law in relation to shippers
and suppliers;• coordinate industry meetings at both wholesale and retail levels on an all-island basis; and• manage the contracts of the companies licensed to ship gas through the transportation system.
Gas networks ireland plays a pivotal role in fostering relations with neighbouring transporters, regulators and government departments to further the aim of european gas market integration.
61

9.2EuropeanDevelopments
following the development of network codes through various entsoG32 facilitated workgroups the focus has moved to implementation at national level. A project team was established in order to deliver the modification to the Code of Operations and associated market rules that are required to deliver compliance.
the objective of the project was to deliver the necessary work packages to support the eu network code requirements as described in the following sections and is now nearing completion.
9.2.1 Capacity Allocation Mechanismthe objective of the capacity allocation mechanism (cam) is to enable further development of european cross-border competition and market integration. the cam regulation eu 984/2013 was implemented from 1st november 2015.
the cam code means that shippers are able to buy ‘bundled’ capacity products at interconnections points – entry and exit together via a single auction platform. Gas networks ireland is actively ensuring that irish interests at the interconnection points between ireland, Great britain and northern ireland are represented.
62
Section Ninecommercial market arranGements
32 the european network of transmission system operators for Gas (entsoG).
Network Development Plan 2016
62
9.2.2 Joint Capacity Booking Platform as part of the implementation of the european capacity allocation mechanism network code (cam nc) prisma33 was selected as its capacity booking platform for use at each of its interconnection points (ip). Gas networks ireland signed a service agreement with prisma in june 2014 and subsequently began work on developing the interfaces between the platform and Gas networks ireland’s existing Gas transmission management system (Gtms). monthly and daily/within day auctions have been held on prisma since 31st October 2015. The first auctions on PRISMA for annual capacity products at the Moffat Interconnection Point took place in March 2016 for gas year 2016/17. The first auction for quarterly products was due to take place in July 2016. 9.2.3 Congestion Management Procedurescongestion management procedures (cmp) seek to address situations whereby parties who hold capacity at a cross-border point do not fully utilise the capacity, thus making that capacity unavailable to a third party. cmp provides a means by which such unutilised capacity can be returned to the market in order to maximise the use of the system in an efficient manner. In accordance with the third package34, cmp mechanisms were introduced to the code of operations on 1st october 2013 and subsequently updated for october 2015. the major changes related to the handling of bundled products where exit capacity from one side of the Interconnection Point is combined with entry capacity at the other side to create a single ‘bundled’ product. The other significant change related to all capacity at the ips having to be marketed via auctions. these changes to the cmp mechanisms in the code of operations were implemented in october 2015. Gas networks ireland are actively engaging with the cer and gas shippers on the development of an appropriate balancing gas framework.
9.2.4 Balancingthe fundamental objective of the balancing network code (regulation eu 312/2014) is to introduce market mechanisms into the balancing regime. Primary responsibility for balancing gas flows on the system resides with network users, with the Transmission system operator (tso) having a residual role. the balancing network code formally became regulation eu 312/2014 in march 2014 and was due for implementation on the 1st of october 2015. some further work is necessary to fully implement all the requirements under this code by 2019 although it is hoped that this will be completed sooner. Gas networks ireland is actively engaging with the cer and gas shippers on the development of an appropriate balancing gas framework. in the meantime Gas networks ireland will apply appropriate interim measures.
63
33 prisma provides a single platform through which tsos and shippers may auction transmission gas capacity. 34 the eu’s third energy package is a legislative package for an internal gas and electricity market in the eu. its purpose is to further open up the gas and electricity markets in the eu.
63
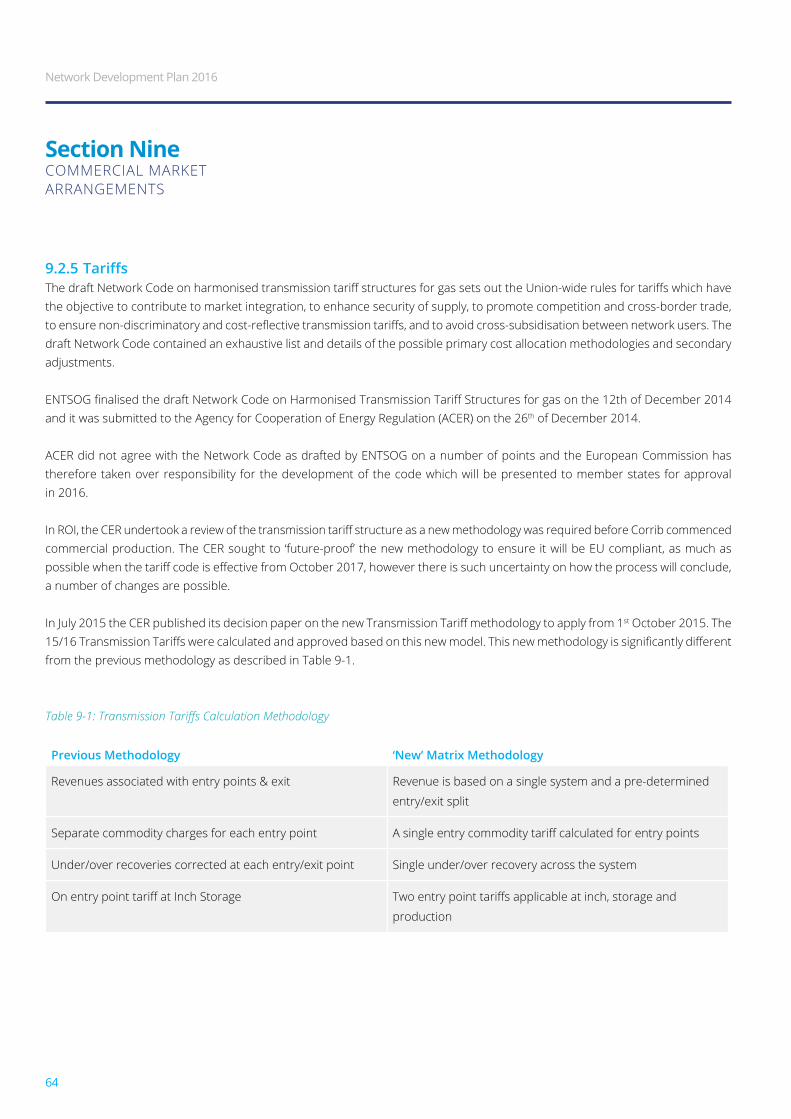
9.2.5 TariffsThe draft Network Code on harmonised transmission tariff structures for gas sets out the Union-wide rules for tariffs which have the objective to contribute to market integration, to enhance security of supply, to promote competition and cross-border trade, to ensure non-discriminatory and cost-reflective transmission tariffs, and to avoid cross-subsidisation between network users. The draft network code contained an exhaustive list and details of the possible primary cost allocation methodologies and secondary adjustments.
ENTSOG finalised the draft Network Code on Harmonised Transmission Tariff Structures for gas on the 12th of December 2014 and it was submitted to the agency for cooperation of energy regulation (acer) on the 26th of december 2014.
acer did not agree with the network code as drafted by entsoG on a number of points and the european commission has therefore taken over responsibility for the development of the code which will be presented to member states for approval in 2016.
In ROI, the CER undertook a review of the transmission tariff structure as a new methodology was required before Corrib commenced commercial production. the cer sought to ‘future-proof’ the new methodology to ensure it will be eu compliant, as much as possible when the tariff code is effective from October 2017, however there is such uncertainty on how the process will conclude, a number of changes are possible.
In July 2015 the CER published its decision paper on the new Transmission Tariff methodology to apply from 1st october 2015. the 15/16 Transmission Tariffs were calculated and approved based on this new model. This new methodology is significantly different from the previous methodology as described in table 9-1.
Table 9-1: Transmission Tariffs Calculation Methodology
Previous Methodology ‘New’ Matrix Methodology
revenues associated with entry points & exit revenue is based on a single system and a pre-determined
entry/exit split
separate commodity charges for each entry point A single entry commodity tariff calculated for entry points
under/over recoveries corrected at each entry/exit point single under/over recovery across the system
On entry point tariff at Inch Storage Two entry point tariffs applicable at inch, storage and
production
Section Ninecommercial market arranGements
Network Development Plan 2016
64
9.2.6 REMITregulation no 1227/2011 on wholesale energy market integrity and transparency (remit) prohibits insider trading and market manipulation in wholesale energy markets. remit imposes obligations on market participants to register with their national regulatory authority (nra)34 and provide information for the purpose of monitoring trading in wholesale energy markets. all market participants must publicly disclose inside information in an effective and timely manner and must inform the NRA of any wholesale energy market transaction which they suspect might breach the prohibitions on insider trading or market manipulation. 9.2.7 Transparencyunder the various network codes and the remit provisions, there exists many transparency requirements for tsos relating to the publication of data items, such as capacities, flows and tariffs. The new ENTSOG Transparency Platform went live on October 1st 2014. entsoG implemented a new data warehouse as part of its transparency platform on the 1st of october 2014. further updates to Gas networks ireland’s submission to the entsoG platform were required as a result of the implementation of the cam network codes on the 1st of november 2015.
35 national regulatory authority (nra) i.e. the cer in the case of roi and ureGni for ni.
65
Key Messages:
• flexibility is required to meet changing network conditions, particularly at the compressor stations in south west scotland.
• midleton compressor station is important to the roi system, and in particular the southern region; and the southern region of the transmission system is likely to require reinforcement in the medium to long term.
• The ROI transmission system has sufficient capacity to meet future gas flow requirements in the short to medium term.
Section Tenadequacy of the Gas network
Network Development Plan 2016
66
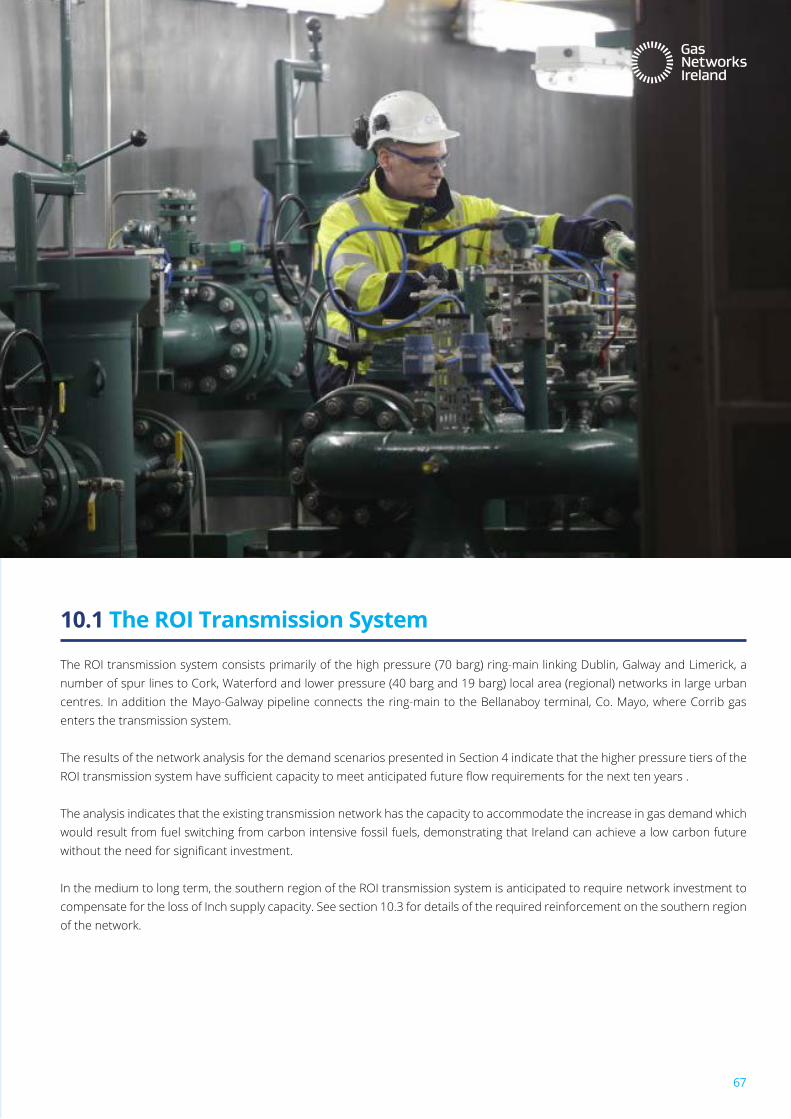
10.1 The ROI Transmission System
the roi transmission system consists primarily of the high pressure (70 barg) ring-main linking dublin, Galway and limerick, a number of spur lines to cork, waterford and lower pressure (40 barg and 19 barg) local area (regional) networks in large urban centres. in addition the mayo-Galway pipeline connects the ring-main to the bellanaboy terminal, co. mayo, where corrib gas enters the transmission system.
the results of the network analysis for the demand scenarios presented in section 4 indicate that the higher pressure tiers of the ROI transmission system have sufficient capacity to meet anticipated future flow requirements for the next ten years .
the analysis indicates that the existing transmission network has the capacity to accommodate the increase in gas demand which would result from fuel switching from carbon intensive fossil fuels, demonstrating that ireland can achieve a low carbon future without the need for significant investment.
in the medium to long term, the southern region of the roi transmission system is anticipated to require network investment to compensate for the loss of inch supply capacity. see section 10.3 for details of the required reinforcement on the southern region of the network.
67
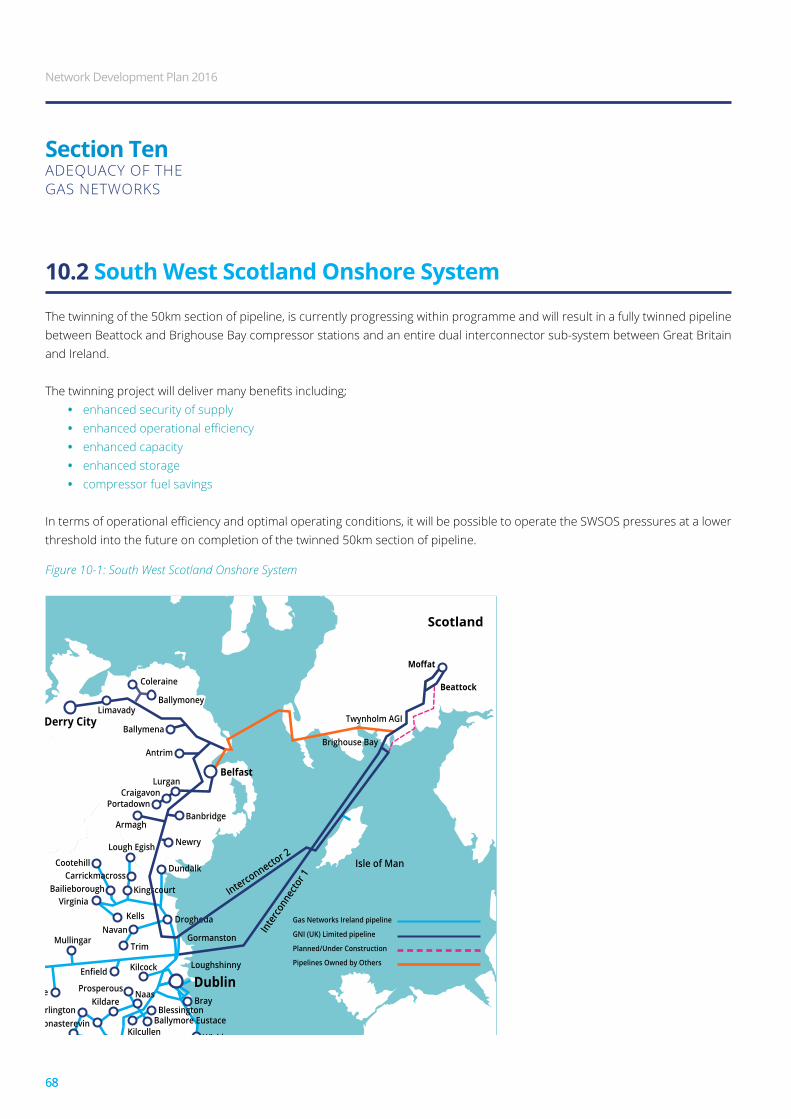
10.2 South West Scotland Onshore System
the twinning of the 50km section of pipeline, is currently progressing within programme and will result in a fully twinned pipeline between beattock and brighouse bay compressor stations and an entire dual interconnector sub-system between Great britain and ireland.
The twinning project will deliver many benefits including; • enhanced security of supply• enhanced operational efficiency • enhanced capacity• enhanced storage • compressor fuel savings
In terms of operational efficiency and optimal operating conditions, it will be possible to operate the SWSOS pressures at a lower threshold into the future on completion of the twinned 50km section of pipeline.
Figure 10-1: South West Scotland Onshore System
68
Corrib Gas Field
Scotland
Isle of Man
Kinsale Head Gas FieldSeven Heads Gas Field
Castlebar
Westport Claremorris
Ballinrobe
Headford
LoughreaTynagh
Gort
Galway
Tuam
Ballinasloe
Athlone
Tullamore
Mullingar
Kilcock
Virginia
CarrickmacrossCootehill
Newry
Banbridge
Lurgan
Dundalk
Drogheda
Gormanston
Loughshinny
CrossmolinaBallina
Limerick
Cork
Nenagh
Craughwell
Trim
NavanKells
Bailieborough Kingscourt
Lough Egish
Armagh
PortadownCraigavon
Interconnector 2
Inte
rcon
necto
r 1
Antrim
Moffat
Beattock
Twynholm AGI
Brighouse BayBallymena
Limavady
Coleraine
Ballymoney
Enfield
Ennis
BallinaShannon
AskeatonAughinish
Sixmilebridge
Mitchelstown
Cahir
Fermoy
Charleville
Mallow
KinsaleBandonBallineen
Macroom
Whitegate
Inch Terminal
Belfast
Derry City
Tramore
Carrick-on-Suir
Kilkenny
Great Island
CarlowAthy
Kildare
KilcullenMonasterevin
NaasProsperous
Ballymore Eustace
Portlaoise
Ballyragget
Portarlington
Arklow
Wicklow
BrayBlessington
Rathdrum
Clonmel
Ardfinnan
Tipperary Town Cashel
Dublin
WaterfordWexford
Belview Port
Gas Networks Ireland pipeline
GNI (UK) Limited pipeline
Planned/Under Construction
Pipelines Owned by Others
Section Ten adequacy of the Gas networks
Network Development Plan 2016
68
10.3 Southern Region
Gas networks ireland, as highlighted in previous publications, notes a potential capacity constraint in the southern region of the transmission network which coincides with the anticipated cessation of supplies from the inch entry point in 2021.36
the cessation of inch supplies will result in the southern region becoming the most peripheral area on the roi transmission network with its gas demand being met by flows via the 18” (450mm) Cork to Dublin pipeline and the 16” (400mm) pipeline between Goat island and curraleigh west.
This also presents a significant security of supply concern; a disruption to either of the two pipelines would result in a significant interruption to gas demand in the southern region. security of supply is paramount in this part of the network considering the following;
• It is home to approximately 2,000MW of gas fired plant37 which accounts for approximately 30% of ireland’s thermal generation fleet.
• It supplies a significant number of large multinational I/C customers and indigenous I/C customers, particularly the Irish agri-food industry, who contribute €24 billion annually to the Irish economy and employ 10% of the national workforce.38
• it has the largest concentration of residential and sme customers outside of dublin, who are deemed protected customers under eu regulation 994/2010, and to whom the tso has additional obligations with regard to maintaining gas supplies.39
Gas networks ireland has recently completed a study to identify the optimum economic and technical solution that will address the potential capacity constraint and mitigate the security of supply risk associated with the southern region of ireland’s transmission network. the optimum economic solution has emerged as the up-rating of the Pipeline to the West and Gormanston to Ballough pipelines to 85 barg. It has been identified that this reinforcement will be required in the short to medium term in order to mitigate against the potential network capacity constraint. in addition, further reinforcement may be required in the longer term.
69
36 this capacity constraint could manifest at an earlier date if inch supplies were to cease sooner than currently expected 37 this is based on cork area generation and Great island ccGt 38 source – teagasc 39 Reg 994/2010 – Article 8 – “The Competent Authority shall require the natural gas undertakings, that it identifies, to take measures to ensure gas supply to the protected customers of the Member State”.
69
10.4 Beattock Compressor Station – Flow Flexibility and Minimum System Limits
Gas Networks Ireland continues to note, as per previous development plans, the requirement for continually increasing flexibility in the operation of the gas network, particularly at the compressor stations in south west scotland. this requirement can be attributed to the changing dynamics in the irish gas market. Gas demand volatility continues to increase in line with increasing renewable generation in the SEM (as outlined in section 7.1.1) and gas flow profiles have been impacted by the commencement of Corrib production. The impact of these factors manifests at the Moffat Entry Point, where the balance of Irish supplies are nominated from.
Prior to Corrib, Moffat had a substantial base-load supply requirement all year round, meeting 95% of ROI demand and 100% of both NI and IOM demand. The compressor stations in Scotland were designed to accommodate such medium to high flow requirements.
Corrib supplies, from the Bellanaboy Entry Point, now meet the year round base-load Irish demand requirement, with Moffat providing the balance of ROI supplies while continuing to meet 100% of NI and IOM demand. This translates to a significant reduction in annual flows at Moffat. In 2016/17 Corrib is expected to meet approximately 55% of annual Gas Networks Ireland system demands (71% of ROI demand), with the Inch and Moffat Entry Points providing the remaining 5% and 40% respectively. On low demand days in the summer months it is likely that corrib will account for 100% of roi daily demand.
The reduction in flows is having a significant impact on the operation of the two compressor stations in Scotland, particularly Beattock. The compressor stations were not designed to accommodate low flows. Consequently, Gas Networks Ireland has implemented a batch flow40 regime at Beattock Compressor Station when Moffat low flow days occur. Such a regime is required due to the gas nominations at Moffat being less than the minimum technical flow limits of the compressor station. Under such a regime the station compresses gas for a limited number of hours during the gas day.
such a regime is viable for the short term, however this would not be sustainable in the medium term as it presents a number of key issues, primarily relating to the health of the turbine assets, energy efficiency and the Interconnector Agreement.
despite overall fuel gas consumption reducing at beattock and brighouse bay compressor stations, it is likely that the stations energy efficiency will diminish, particularly on low flow days, i.e. fuel gas consumed relative to station throughput/flow. This is due to the requirement to operate the stations outside their optimal design operating envelope in order to accommodate the lower nominated flows at Moffat. The stations were designed to continually flow/compress relatively high volumes of gas.
There is also a limit to the frequency of changes to the flow profile within-day (i.e. number of batching operations) that can be accommodated at the Moffat Interconnection Point, as per the Moffat Interconnection Agreement (between Gas Networks Ireland and national Grid uk).
Section Ten adequacy of the Gas networks
40 Batch flow refers to an operating regime at the compressor stations on low flow days, when the average hourly flow nomination is less than the minimum technical flow limit of the station. The total daily nomination on such days is batched for a number of hours in order to overcome the low flow constraint; consequently, there are a number of hours when the station is not running.
Network Development Plan 2016
70
Gas Networks Ireland considers that the only sustainable long-term solution to address the low flow situation at Moffat is an enhancement to the existing compression facilities, particularly at Beattock. While the current low flow situation at Moffat can be attributed to shippers nominating at corrib, which should only apply in the short to medium term, it’s anticipated that this issue will become enduring (despite the expected fall-off in Corrib production) due to lower or more variable gas demands resulting from increasing renewable generation and increasing energy efficiency, and as such will require an enduring and sustainable solution.
last year’s development plan referenced technical studies that Gas networks ireland has undertaken to identify the optimum solution to enhance its operations to meet the needs of the market, and to ensure the safe and secure operation of a flexible and reliable gas network.
These studies point to the need for more flexible compressor/turbine technology to complement the existing fleet at Beattock Compressor Station, which would accommodate a wider operating range, allow low volumes to flow in an economic and environmentally sustainable manner, and enhance the existing capacity at Moffat. An enhancement of Moffat capacity would be required for peak days/periods post 2025, particularly if the objectives relating to the phasing out of carbon intensive fuels, such as coal, which are outlined in Ireland’s energy policy, are to be achieved in the next ten to fifteen years.
The technical studies also confirmed the economic viability of such an investment, however this conclusion is subject to a number of forecast assumptions which will need further validation. Gas networks ireland intends to revisit this study when there is more certainty as to the factors that are likely to impact gas demand in the longer term, particularly those which influence gas demand in the power generation sector.
the implementation of such a solution would be subject to relatively extended timelines – allowing for the relevant consultations and approvals, procurement, design, installation and commissioning. it is likely that it could take approximately up to three years to implement post initial/preliminary approvals.
In order to mitigate the impact of Moffat low flows in the short to medium term, Gas Networks Ireland is also investigating the possibility of using flow control valves on days when the pressures available from the National Grid system are sufficiently high to transport the Moffat forward flow nominations and ensure the integrity of the downstream pipeline.
Such a measure would remove the need to batch flow at Beattock and would deliver greater energy efficiency, thus providing a number of benefits, i.e. reduced fuel gas at Beattock and reduced emissions. The completion of the twinning of the SWSOS is also a key component in facilitating such a solution.
It is important to note that such a measure would require relatively high pressures from the National Grid system at Moffat; pressures which would be higher than the current contractual pressure and anticipated normal off-take pressure (ANOP). On this basis, such a solution should be considered complimentary, as opposed to an alternative, to the longer term enhancement to the compressor facilities at beattock.
71
Key Messages:
• As part of the current price control, €387 million will be invested in the gas network.
• extension of the network to listowel, co. kerry, wexford town, co. wexford and nenagh town, co. tipperary.
• future investment may be required to improve network capability in response to changing flow requirements or increased system flexibility.
SectionElevencapital investment
Network Development Plan 2016
72
11.1 Overview
this section provides information on planned capital investment and indicates possible future investments proposals in order to comply with legislation and other requirements.
future investment proposals are subject to approval from the commission for energy regulation (cer). system operator requirements continue to evolve and both environmental and european legislative requirements will impact on future system operation.
11.2 Regulatory Capital Allowance
Gas Networks Ireland is currently in its third regulatory Price Control period (PC3). This is a five year period and runs from October 2012 to September 2017. The CER has given a capital allowance of €387m for investment in the distribution and transmission network as illustrated in figure 11-1 (excluding non-pipe and work in progress).
73
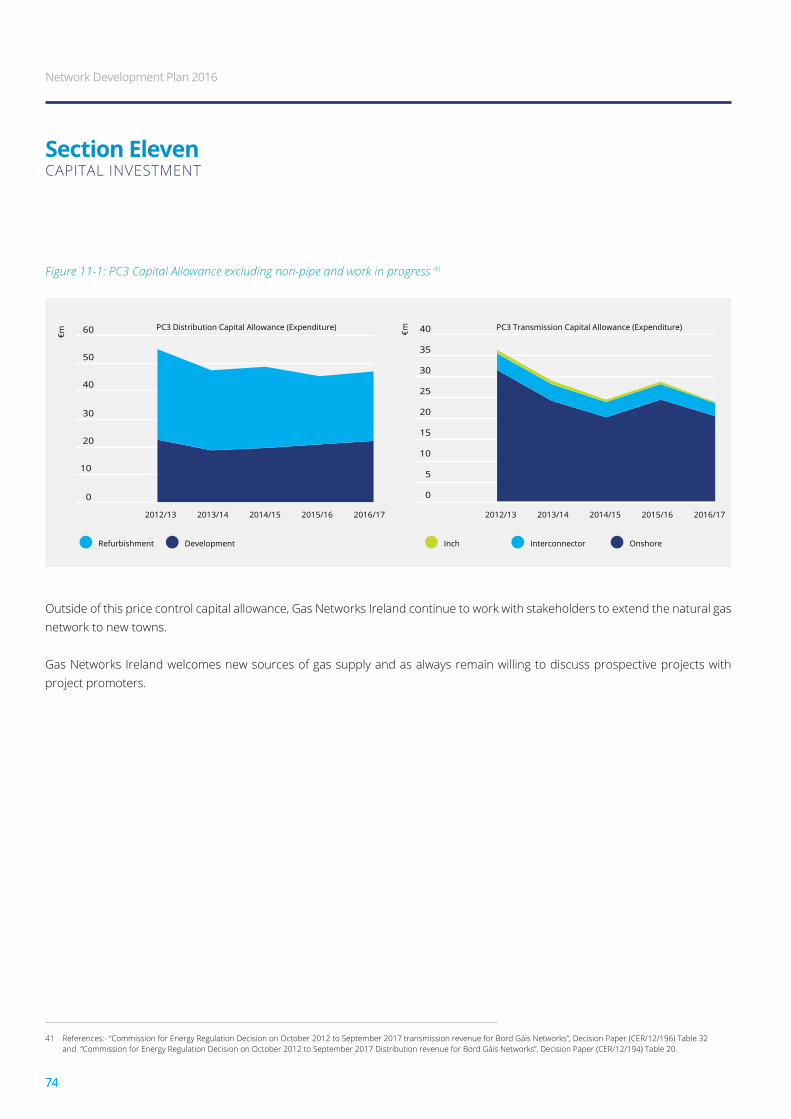
Figure 11-1: PC3 Capital Allowance excluding non-pipe and work in progress 41
outside of this price control capital allowance, Gas networks ireland continue to work with stakeholders to extend the natural gas network to new towns.
Gas networks ireland welcomes new sources of gas supply and as always remain willing to discuss prospective projects with project promoters.
74
SectionEleven capital investment
41 References:- “Commission for Energy Regulation Decision on October 2012 to September 2017 transmission revenue for Bord Gáis Networks”, Decision Paper (CER/12/196) Table 32 and “Commission for Energy Regulation Decision on October 2012 to September 2017 Distribution revenue for Bord Gáis Networks”, Decision Paper (CER/12/194) Table 20.
0 0
5
10
15
20
25
30
35
40
10
20
30
40
50
60
€m
€m
Refurbishment
PC3 Distribution Capital Allowance (Expenditure) PC3 Transmission Capital Allowance (Expenditure)
Development Inch Interconnector Onshore
2012/13 2013/14 2014/15 2015/16 2016/17 2012/13 2013/14 2014/15 2015/16 2016/17
Network Development Plan 2016
74
11.3 Planned Capital Programmes
A significant number of projects were completed within time and budget during 2015, see section 3.2 for details. The following sets out further projects to be completed over the next 24 month period.
11.3.1 Pipelinessome of the key pipeline programmes to be completed over the next 24 months include;
• extension of the gas network to listowel co. kerry, wexford town, co. wexford and completion of the gas network within nenagh town centre, co. tipperary.
• twinning of southwest scotland onshore system between cluden and brighouse bay (united kingdom).42
11.3.2 Pressure Regulating Station Refurbishmentthe following are some major transmission rolling programmes to be completed within the pc3 period;
• replacement of all non-condensing boilers on some regulating installations. • replacement of all waterbaths on the system.• refurbishment works at aGi sites to reduce noise levels and to ensure compliance with all relevant safety requirements.• remediation works on pipe support structures at aGi sites. • refurbishment of district regulation installations.
11.3.3 Distribution Network Rolling Programmes the following is a selection of distribution rolling programmes to be completed within the pc3 period;
• removal of distribution buried gun barrel service pipes.• relocation/rehabilitation of polyethylene services within the building line.• replacement of batteries in electronic gas meters.
11.3.4 Communications & Instrumentationthere are rolling programmes across pc3 to refurbish and upgrade aGi & dri site instrumentation which will facilitate enhanced scada integration on the gas network.
11.3.5 Meterswhile Gas networks ireland is working with all stakeholders in developing a smart metering solution, a decision on a rollout has not been made and the cer has not given a capital allowance at this stage. Gas networks ireland has a rolling age-based replacement programme for both domestic and i/c meters. this programme will continue until it is it is superseded by the mass roll-out of smart meters, which if confirmed would be expected to commence in 2019.
75
42 This project was awarded €33.7 million by the European Commission and is being delivered outside of the PC3 allowance.
75
11.3.6 CompressorsBoth Beattock and Brighouse Bay will reach significant milestones in their lifecycle within the next 10 years. Beattock, commissioned in 2000, will be 20 years old in 2020, and brighouse bay phases i and ii, commissioned in 1993 and 2003, will be 30 years old and 20 years old respectively in 2023.
Gas networks ireland has a strict inspection and maintenance program in place at the compressor stations to ensure, amongst other things43, that the lifecycle of the assets associated with the station’s various subsystems are maximised on an economic basis while ensuring associated risks are as low as is reasonably practicable (alarp).
However, certain assets will reach a point in their lifecycle, when maintenance is no longer appropriate, nor cost effective, to ensure their safe and reliable function, particularly when obsolescence is a factor, e.g. with respect to station control systems or turbine control systems. in such instances, investment is required, i.e. an upgrade to the asset(s) is the only option that will ensure the safe and continued reliable operation of the station.
it is anticipated that certain assets associated with the compressor stations will require upgrades in the short to medium term, in order to ensure the reliability of the stations operation.
It is also important to note, that despite the decrease in Moffat flows, the reliability of the infrastructure associated with the Moffat Entry Point, particularly the compressor stations, will be crucial to Ireland’s security of supply during the coming years. Moffat will still supply at least 40% of system demand during 2016/17 and could account for up to 71% of 1-in-50 peak day gas demands. deferring/postponing investment at the stations is likely to adversely impact the reliability of the stations, increase maintenance activities (and the associated operating costs) and lead to an even greater investment requirement in the longer term.
11.4 Future Investment
In planning the strategic development of the gas network, Gas Networks Ireland has identified strategic areas of the network which could potentially require future investment to ensure security of supply and/or to enhance system flexibility. These areas include compressors to optimise system flexibility in the future, areas of the ring main to incorporate pressure or flow control to manipulate the flow of gas to balance network pressures. Gas Networks Ireland will continue to review the optimum operating regime of the network to safe guard security of supply and ensure optimum network performance for end users.
11.4.1 The Goatisland to Curraleigh West Reinforcementas stated in section 10.3, in the short to medium term, it is envisaged that a section of the ring main will be uprated to 85 barg, with two bi-directional pressure and control installations along the ring main. this will mitigate the requirement in the short term to reinforce the section of pipeline from Goatisland in county limerick to curraleigh west in county tipperary, however in the long term the need remains to reinforce this section of pipeline.
43 inspection and maintenance is also essential to ensure the reliability and safe functioning of the stations assets
Network Development Plan 2016
76
11.4.2 Midleton Compressor StationThe operating regime at Midleton Compressor Station has undergone a significant change in 2015/16. Since re-commissioning in 2003 the station had typically operated as a compression facility during the six/seven month winter period – compressing gas delivered from celtic sea production and storage facilities via the inch entry point.
however from 2016 midleton compressor station will now be operating all year round. kinsale energy limited (kel), the celtic sea production and storage operator, has advised that it intends to cease operations in 2021 and commence blowdown of the existing storage wells from 2016. This would involve continually flowing gas onshore during the concluding years of operation.
the year round operation of midleton compressor station from 2016 until 2021 will present a considerable challenge, considering the age of the existing assets (currently 30 years old), as well as the anticipated low flows and the limited downtime available to carry out essential maintenance at the station. Gas networks ireland will continue to work closely with kel to coordinate the timing of essential maintenance at the station, in order to mitigate the risk of station outages during the forthcoming years.
Once Celtic Sea operations and Inch flows cease, it is likely that the compression facilities/assets at Midleton Compressor Station will be decommissioned, which will be a significant undertaking, and the first decommissioning of a major Gas Networks Ireland asset on the transmission network.
the decommissioning of compression facilities and the associated compression assets does not mean the end of midleton compressor station. the station has other essential functions that will continue to be required post 2021;
• midleton compressor station is the primary pipeline hub in southern ireland and a key location for carrying out operations associated with ensuring the integrity of the transmission pipelines in the region.
• it also functions as a pressure reduction facility, reducing the pressure of gas for delivery into the 37.5 barg inch to midleton pipeline (which supplies power generation and ndm/protected customers).
there is also an alternative scenario to decommissioning compression facilities, albeit it is not currently envisaged as likely. there could be a requirement to maintain compressor operations at midleton compressor station in the future; such a scenario may be likely if (commercially viable) gas discoveries were to materialise in the celtic sea in the coming years – Gas networks ireland is not currently aware of any such finds.
such a scenario would require major capital investment at midleton. maintaining the existing assets would not be a viable option due to the age and condition of the turbine and compressor assets, and associated subsystems. A significant station upgrade would be required. the need for such an upgrade would be further compounded by environmental legislation, which the existing turbine assets are unlikely to comply with by 2021.
77
11.4.3 Longer Term Projects – Local Area (Regional) Reinforcement a key part of Gas networks ireland’s strategic planning process is understanding what capital investment is required to mitigate against capacity limitations on the network. this would help ensure that end user supply can be delivered on the network and that supplies can be maintained to protected customers, i.e. ndm customers and essential services as set out in eu regulation 994/2010 concerning measures to safeguard the security of gas supply.
Gas networks ireland tests the network’s resilience through modelled analysis to a loss of pipeline capacity. choosing pipelines with the highest flow rate within a network is a reasonable approach to test the network robustness, it is a valuable exercise to consider the pipes of particular vulnerability in a network, whether that is the pipes with the highest flow, velocity or pressure drop per unit length or perhaps more urgently those most at risk physically e.g. bridge or major road crossings etc.
There may be several mitigation measures that could be put in place to offset the pipeline capacity limitations on the network:• Increase AGI or DRI outlet pressures to support the area affected by low pressures• increase looping within the system to increase system resilience • demand side measures, which examine the ability to sequentially isolate an area given an infrastructural failure in
order to maintain flows through the remaining infrastructure at maximum capacity, or to minimise the number of lost customers.
capital investment will be required to support the existing infrastructure in a number of regions to mitigate capacity constraints on the gas network. The regions identified are indicative and, under consideration regarding the need for system reinforcement and to increase system resilience, in response to changing supply, demand patterns, increased demand for system flexibility and security of supply.
the following geographical regions are considered:• cork• waterford• dublin• naas & newbridge • limerick
Gas Networks Ireland will continue to identify and make any necessary system modifications required to safeguard customers against system failure, such as loss of strategic pipeline(s), pressure regulating installation(s) to ensure system resilience. as the network continues to age it is anticipated that there will be a requirement for capital investment, refurbishment or upgrades, to satisfy integrity, performance and safety requirements of the gas infrastructure. capital investment may result due to customer enquiries for either increased load, new connections where no spare capacity exists, where the network is operating close to its current capability or to enhance the resilience of a network.
With continued growth in renewable energy, investment may be required as a result of different flow patterns and new injection points other than those for which the network was originally designed. Gas Networks Ireland is already experiencing different flow profiles as a result of the amount of wind powered generation on the network and as a result of Corrib coming online.
Gas networks ireland will continue to monitor and analyse the network. future projects may be required to improve network capability in response to these changing flow requirements or increased system flexibility.
Network Development Plan 2016
78
11.5 Smart Meters
the aim of the national smart metering programme (nsmp) is a national rollout of smart meters to all residential consumers and the vast majority of smes (small to medium enterprises). the programme is overseen by the cer, with key stakeholders such as Gas networks ireland, esb networks , energy suppliers and others.
we are now in phase 3 of the programme which will involve the following activities,• smart metering consumer policy will be further developed, building on the high level design decisions, through a series
of workshops, public consultations and information papers.• Gas networks ireland and esb networks44 will commence a range of procurement activities to procure the relevant
components of the smart metering solution for which they are responsible. this will include the smart gas and electricity meters and a shared communications infrastructure.
• the network companies will lead the detailed design of the market system changes required to support smart metering.• a consumer engagement work-stream has been developed to ensure that consumers are informed and empowered to
engage with the changes that will take place in electricity and gas markets, and the new services which they can avail of.
phase 4 will involve the building and testing of the smart metering systems and infrastructure. phase 5 will entail the rollout of the smart meters themselves with the majority of smart gas meters expected to be installed by the end of 2020.
The main benefit of Smart Metering is the provision of more detailed gas consumption information to the customer. This will enable customers to better manage their energy consumption and reduce their bill. a customer behaviour trial completed by Gas networks ireland showed a 3.6% consumption saving, on average, due to the greatly enhanced consumption data provided by smart metering.
44 esb networks is the electricity distribution system operator for the republic of ireland.
79
the cer’s mission is to regulate water, energy and energy safety in the public interest. we are committed to protecting the short and long run interest of the public by ensuring, inter alia, energy and gas are supplied safely, the lights stay on and the gas continues to flow. Our aim is to protect the interest of the energy customers, promote competition and maintain security of supply.
the cer welcomes the publication of Gas networks ireland’s ten year network Development Plan 2016 (NDP), as it offers Gas Networks Ireland’s view of how the gas network in ireland may develop. the ndp provides Gas networks ireland’s supply and demand forecasts, it also highlights what investments Gni considers the system may need over the next ten years. this process is separate to the approval of revenues for Gni; which is carried out under the price control process. under that process, separate submissions are made by Gni as to its revenue needs. the cer reviews these submissions to ensure that any revenues requested are necessary, appropriate and efficient.
the cer notes the dynamics of the gas system in ireland are changing. on the 31 December 2015 the Corrib gas field commenced production. Corrib is expected to supply up to 71% of Ireland’s system demand in its first full year of production. In the short to medium term Corrib will replace Moffat as the primary source of gas supply to Ireland. This will result in lower gas flows at the Moffat entry point. In addition, the announcement from kinsale energy limited that it is to commence blowdown of southwest kinsale cushion gas will change the operation of the midleton compressor station. the cer acknowledges the challenges these changes bring to the operation of the gas system and will continue to work with Gas networks ireland in monitoring developments on the irish gas system. in this context the cer would note the recent changes to the gas balancing rules, to further incentivise shippers to meet their balancing obligations.
In addition to the above, while recognising the benefits of new indigenous supplies bring to ireland (i.e. improving security of supply and reducing ireland’s dependency on energy imports), the CER notes the continued importance of the Moffat entry point to ireland’s energy needs and ireland’s energy security. the expected completion, in 2017/18, of twinning the gas pipeline in south west scotland onshore system (swsos),
Section Twelvecer commentary
Network Development Plan 2016
80

should further enhance ireland’s security of supply, and continued integration to the uk and european gas markets. while there is little reference to brexit in the ndp, the cer considers that at this stage it is appropriate to adopt a watching brief in this regard. in summary it is too early to tell what brexit might mean for the gas system.
the cer acknowledges the three demand scenario modelling approach adopted by Gas networks ireland. this modelling indicates that Ireland’s transmission system has sufficient capacity to meet future gas flow requirements in the short to medium term. In each of the three demand scenarios, demand is expected to increase over the next decade, with growth rates ranging from 14% in the low demand scenario to 44% in the high demand scenario. While it has been suggested that these growth figures appear high, the cer notes that these scenario assumptions are underpinned by reputable sources (eg ersi’s Gdp growth forecasts and iea’s policies scenarios) and are designed to represent a broad range of possible outcomes. the key point here is to note that these are possible scenarios representing possible outcomes rather than likely or possible outcomes.
the ndp also outlines Gas networks ireland aim to develop a number of growth initiatives which aim to promote sustainable development and increase usage of Ireland’s gas network in a cost effective manner. The CER will continue to work with Gas Networks Ireland, on the progression of such initiatives and ultimately ensure that any such initiatives bring benefits to the customer.
the cer is cognisant of the continuing critical role of gas in electricity generation; approximately 45% of electricity in ireland is produced by gas fired generation. As Ireland transitions itself to a low carbon economy, renewable electricity generation will require greater flexibility from the Irish gas network, as gas is increasingly used as a backup fuel for intermittent wind and electricity generation. This may have an impact on gas flows profiles and network operations. Furthermore, as Ireland transitions itself to a low carbon economy gas will play a critical role. therefore the cer supports initiatives undertaken by Gas networks ireland to ensure system integrity and minimum pressures are maintained.
finally, the cer would like to take this opportunity to thank Gas networks ireland for the production of the 2016 ndp, while acknowledging the work done maintaining ireland’s security of supply.
81
APPEnDix1 historic demandHistoric Daily Demand by Metering Typethe historic demand data in chapter 3.3 is presented by sector (i.e. residential, i/c and power generation), as this is more useful for forecasting purposes and is also considered to be a more familiar classification for the users of this document.
the actual demand data is collected by metering type;• large daily metered (ldm) sites with an annual demand of 57 Gwh or greater, and includes all the power stations and
the large i/c sites.• daily metered (dm) sites with an annual demand greater than 5.55 Gwh and less than 57 Gwh, and includes the
medium i/c, hospitals and large colleges etc.• non-daily metered (ndm) with an annual demand of 5.55 Gwh or less, and includes the small i/c and residential sectors.
the demands of the above categories are then re-combined into the following categories for reporting and forecasting purposes, using the monthly billed residential data to split the ndm sector into its residential and i/c components;
• power sector: the individual power stations are separated out from the ldm total.• the i/c sector: which is comprised of the demand from the remaining ldm sites, the dm sector and the ndm i/c sector
(calculated as the residual of the total ndm demand and the residential demand).• residential sector: which is calculated as a percentage of the ndm demand, using the ratio of the total billed monthly
ndm and residential demand.
the historical daily demand on the transmission and distribution systems is shown in figure a1-1 and a1-2. the transmission and distribution daily demands have been broken down into the following sub-categories;
• transmission demand has been subdivided into the power sector demand, with all of the remaining ldm and dm i/c demand combined into the tX dm i/c category; and
• distribution demand has been subdivided into the dX ndm demand, with all of the remaining ldm and dm i/c demand combined into the dX dm i/c category.
Network Development Plan 2016
82
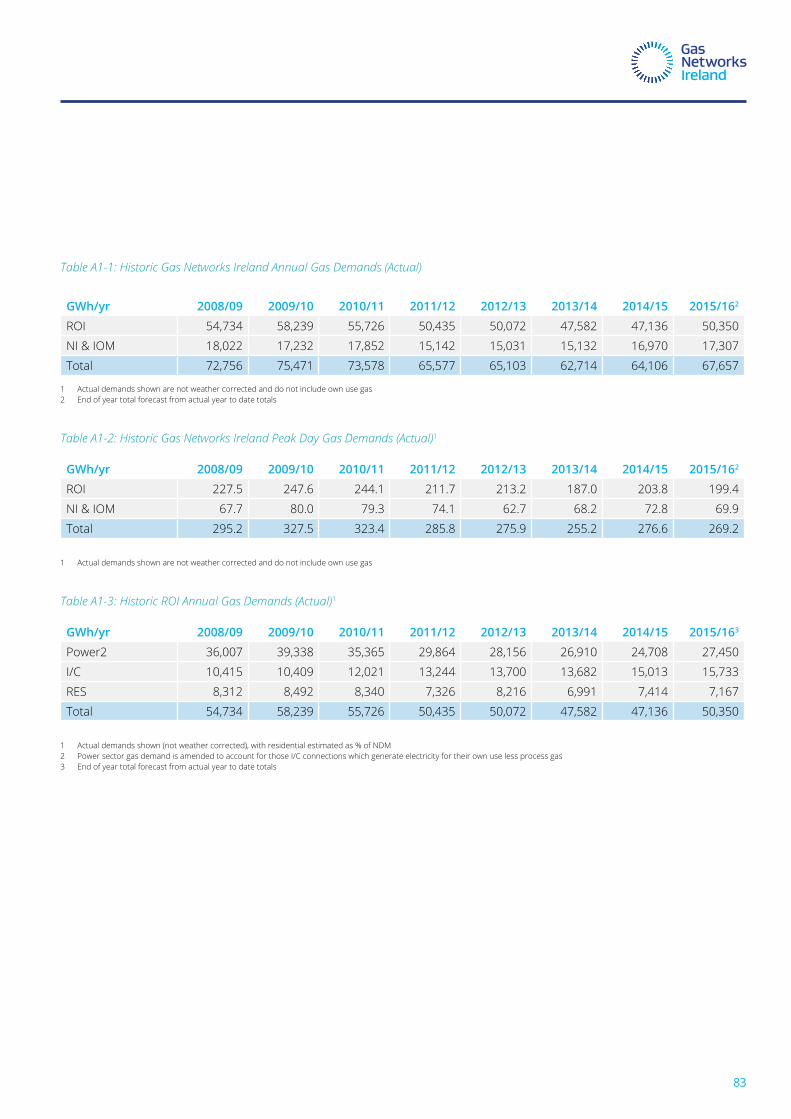
Table A1-1: Historic Gas Networks Ireland Annual Gas Demands (Actual)
GWh/yr 2008/09 2009/10 2010/11 2011/12 2012/13 2013/14 2014/15 2015/162
roi 54,734 58,239 55,726 50,435 50,072 47,582 47,136 50,350
ni & iom 18,022 17,232 17,852 15,142 15,031 15,132 16,970 17,307
total 72,756 75,471 73,578 65,577 65,103 62,714 64,106 67,657
1 actual demands shown are not weather corrected and do not include own use gas2 end of year total forecast from actual year to date totals
Table A1-2: Historic Gas Networks Ireland Peak Day Gas Demands (Actual)1
GWh/yr 2008/09 2009/10 2010/11 2011/12 2012/13 2013/14 2014/15 2015/162
roi 227.5 247.6 244.1 211.7 213.2 187.0 203.8 199.4
ni & iom 67.7 80.0 79.3 74.1 62.7 68.2 72.8 69.9
total 295.2 327.5 323.4 285.8 275.9 255.2 276.6 269.2
1 actual demands shown are not weather corrected and do not include own use gas
Table A1-3: Historic ROI Annual Gas Demands (Actual)1
GWh/yr 2008/09 2009/10 2010/11 2011/12 2012/13 2013/14 2014/15 2015/163
power2 36,007 39,338 35,365 29,864 28,156 26,910 24,708 27,450
i/c 10,415 10,409 12,021 13,244 13,700 13,682 15,013 15,733
res 8,312 8,492 8,340 7,326 8,216 6,991 7,414 7,167
total 54,734 58,239 55,726 50,435 50,072 47,582 47,136 50,350
1 actual demands shown (not weather corrected), with residential estimated as % of ndm2 power sector gas demand is amended to account for those i/c connections which generate electricity for their own use less process gas3 end of year total forecast from actual year to date totals
83
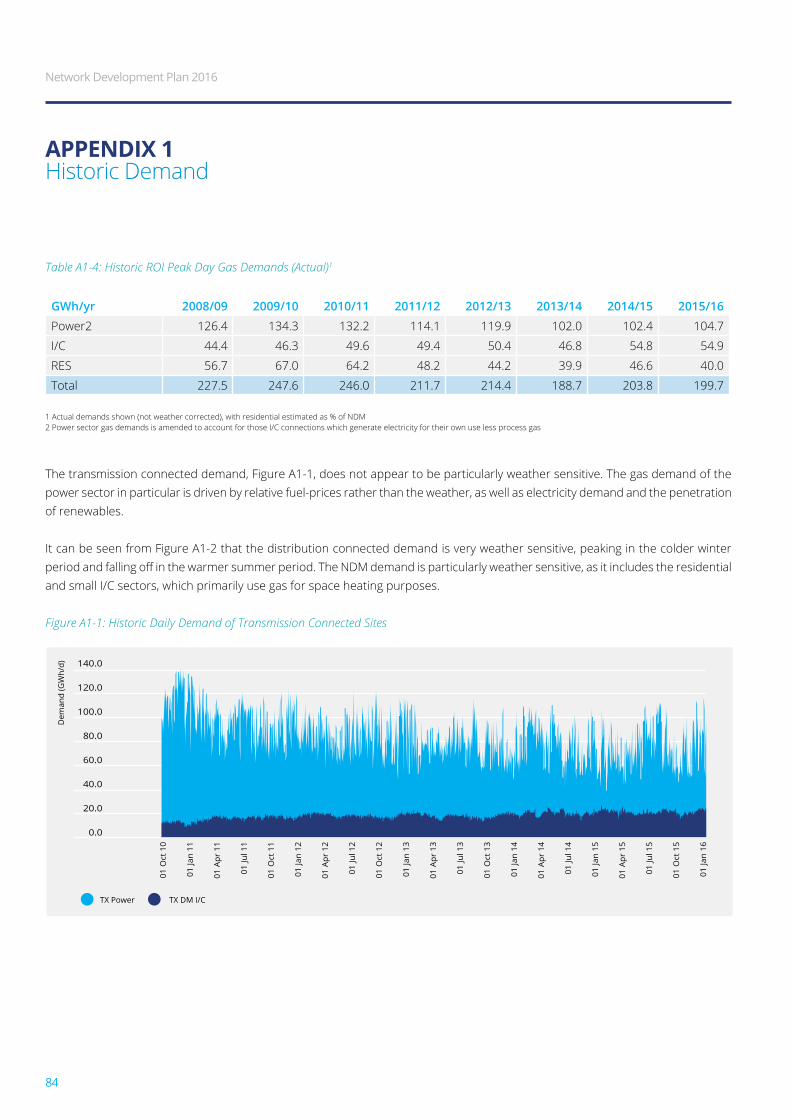
Table A1-4: Historic ROI Peak Day Gas Demands (Actual)1
GWh/yr 2008/09 2009/10 2010/11 2011/12 2012/13 2013/14 2014/15 2015/16power2 126.4 134.3 132.2 114.1 119.9 102.0 102.4 104.7
i/c 44.4 46.3 49.6 49.4 50.4 46.8 54.8 54.9
res 56.7 67.0 64.2 48.2 44.2 39.9 46.6 40.0
total 227.5 247.6 246.0 211.7 214.4 188.7 203.8 199.7
1 actual demands shown (not weather corrected), with residential estimated as % of ndm2 power sector gas demands is amended to account for those i/c connections which generate electricity for their own use less process gas
the transmission connected demand, figure a1-1, does not appear to be particularly weather sensitive. the gas demand of the power sector in particular is driven by relative fuel-prices rather than the weather, as well as electricity demand and the penetration of renewables.
it can be seen from figure a1-2 that the distribution connected demand is very weather sensitive, peaking in the colder winter period and falling off in the warmer summer period. The NDM demand is particularly weather sensitive, as it includes the residential and small i/c sectors, which primarily use gas for space heating purposes.
Figure A1-1: Historic Daily Demand of Transmission Connected Sites
APPEnDix1historic demand
0.0
60.0
80.0
100.0
120.0
140.0
40.0
20.0
01 O
ct 1
0
01 Ja
n 11
01 A
pr 1
1
01 Ju
l 11
01 O
ct 1
1
01 Ja
n 12
01 A
pr 1
2
01 Ju
l 12
01 O
ct 1
2
01 Ja
n 13
01 A
pr 1
3
01 Ju
l 13
01 O
ct 1
3
01 Ja
n 14
01 A
pr 1
4
01 Ju
l 14
01 Ja
n 15
01 A
pr 1
5
01 Ju
l 15
01 O
ct 1
5
01 Ja
n 16
Dem
and
(GW
h/d)
TX Power TX DM I/C
Network Development Plan 2016
84
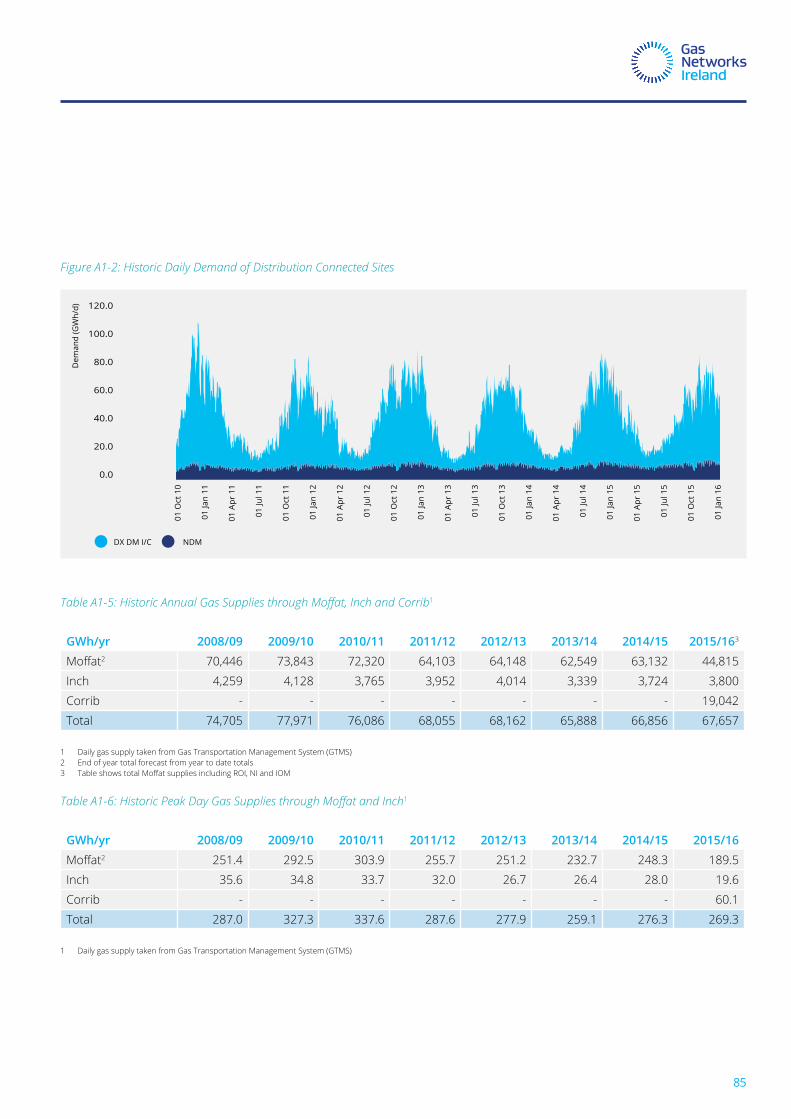
Figure A1-2: Historic Daily Demand of Distribution Connected Sites
Table A1-5: Historic Annual Gas Supplies through Moffat, Inch and Corrib1
GWh/yr 2008/09 2009/10 2010/11 2011/12 2012/13 2013/14 2014/15 2015/163
Moffat2 70,446 73,843 72,320 64,103 64,148 62,549 63,132 44,815
inch 4,259 4,128 3,765 3,952 4,014 3,339 3,724 3,800
corrib - - - - - - - 19,042
total 74,705 77,971 76,086 68,055 68,162 65,888 66,856 67,657
1 daily gas supply taken from Gas transportation management system (Gtms)2 end of year total forecast from year to date totals3 Table shows total Moffat supplies including ROI, NI and IOM
Table A1-6: Historic Peak Day Gas Supplies through Moffat and Inch1
GWh/yr 2008/09 2009/10 2010/11 2011/12 2012/13 2013/14 2014/15 2015/16Moffat2 251.4 292.5 303.9 255.7 251.2 232.7 248.3 189.5
inch 35.6 34.8 33.7 32.0 26.7 26.4 28.0 19.6
corrib - - - - - - - 60.1
total 287.0 327.3 337.6 287.6 277.9 259.1 276.3 269.3
1 daily gas supply taken from Gas transportation management system (Gtms)
01 O
ct 1
0
01 Ja
n 11
01 A
pr 1
1
01 Ju
l 11
01 O
ct 1
1
01 Ja
n 12
01 A
pr 1
2
01 Ju
l 12
01 O
ct 1
2
01 Ja
n 13
01 A
pr 1
3
01 Ju
l 13
01 O
ct 1
3
01 Ja
n 14
01 A
pr 1
4
01 Ju
l 14
01 Ja
n 15
01 A
pr 1
5
01 Ju
l 15
01 O
ct 1
5
01 Ja
n 16
Dem
and
(GW
h/d)
DX DM I/C NDM
0.0
60.0
80.0
100.0
120.0
40.0
20.0
85
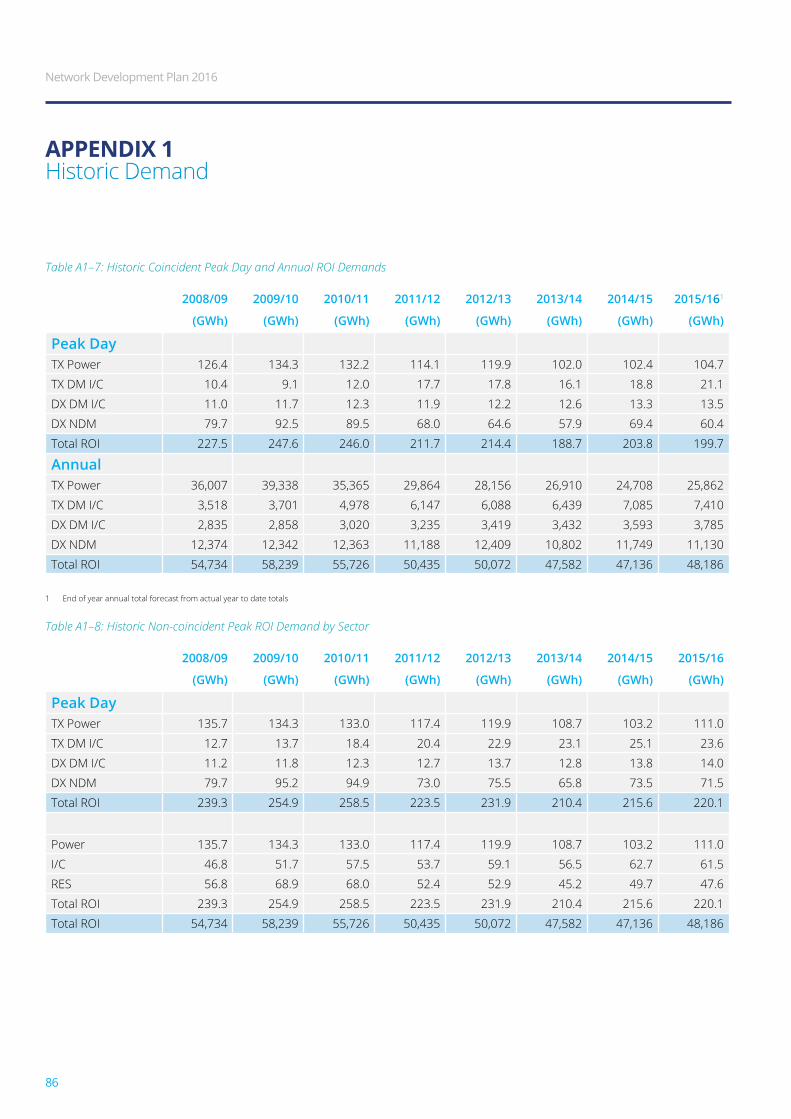
Table A1–7: Historic Coincident Peak Day and Annual ROI Demands
2008/09 2009/10 2010/11 2011/12 2012/13 2013/14 2014/15 2015/161
(GWh) (GWh) (GWh) (GWh) (GWh) (GWh) (GWh) (GWh)
Peak Day
tX power 126.4 134.3 132.2 114.1 119.9 102.0 102.4 104.7
tX dm i/c 10.4 9.1 12.0 17.7 17.8 16.1 18.8 21.1
dX dm i/c 11.0 11.7 12.3 11.9 12.2 12.6 13.3 13.5
dX ndm 79.7 92.5 89.5 68.0 64.6 57.9 69.4 60.4
total roi 227.5 247.6 246.0 211.7 214.4 188.7 203.8 199.7
Annual
tX power 36,007 39,338 35,365 29,864 28,156 26,910 24,708 25,862
tX dm i/c 3,518 3,701 4,978 6,147 6,088 6,439 7,085 7,410
dX dm i/c 2,835 2,858 3,020 3,235 3,419 3,432 3,593 3,785
dX ndm 12,374 12,342 12,363 11,188 12,409 10,802 11,749 11,130
total roi 54,734 58,239 55,726 50,435 50,072 47,582 47,136 48,186
1 end of year annual total forecast from actual year to date totals
Table A1–8: Historic Non-coincident Peak ROI Demand by Sector
2008/09 2009/10 2010/11 2011/12 2012/13 2013/14 2014/15 2015/16
(GWh) (GWh) (GWh) (GWh) (GWh) (GWh) (GWh) (GWh)
Peak Day
tX power 135.7 134.3 133.0 117.4 119.9 108.7 103.2 111.0
tX dm i/c 12.7 13.7 18.4 20.4 22.9 23.1 25.1 23.6
dX dm i/c 11.2 11.8 12.3 12.7 13.7 12.8 13.8 14.0
dX ndm 79.7 95.2 94.9 73.0 75.5 65.8 73.5 71.5
total roi 239.3 254.9 258.5 223.5 231.9 210.4 215.6 220.1
power 135.7 134.3 133.0 117.4 119.9 108.7 103.2 111.0
i/c 46.8 51.7 57.5 53.7 59.1 56.5 62.7 61.5
res 56.8 68.9 68.0 52.4 52.9 45.2 49.7 47.6
total roi 239.3 254.9 258.5 223.5 231.9 210.4 215.6 220.1
total roi 54,734 58,239 55,726 50,435 50,072 47,582 47,136 48,186
APPEnDix1historic demand
Network Development Plan 2016
86
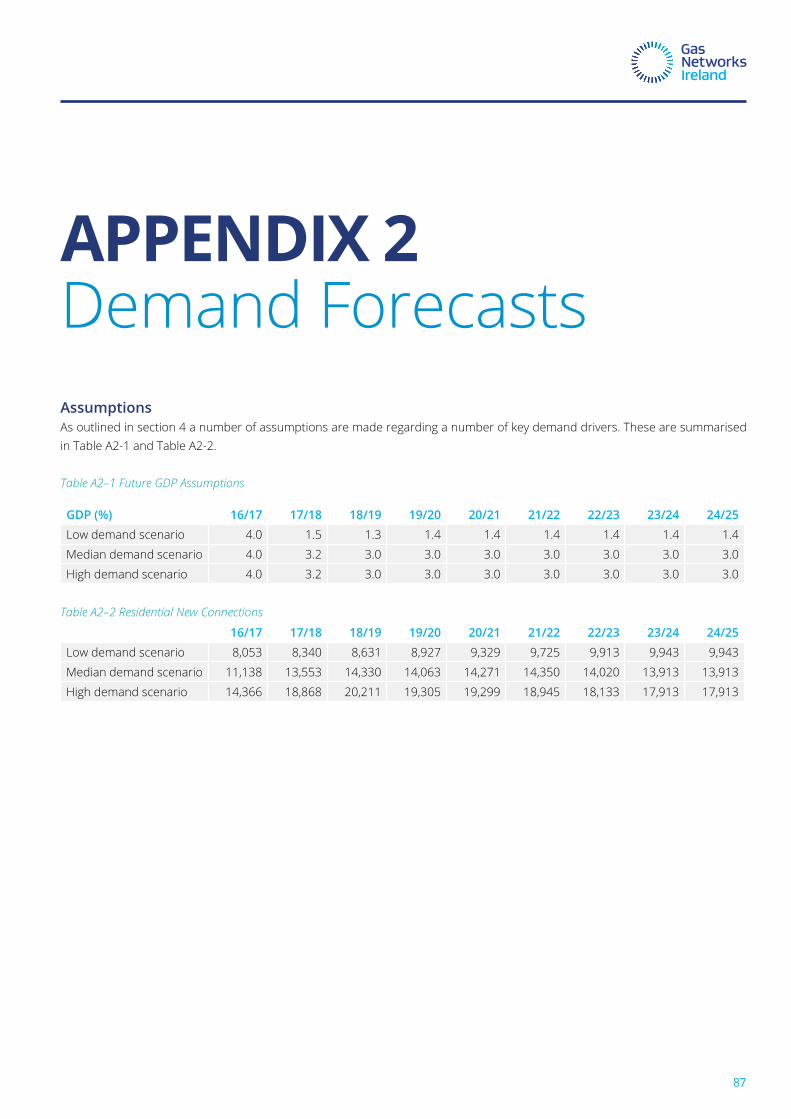
APPEnDix2demand forecastsAssumptionsas outlined in section 4 a number of assumptions are made regarding a number of key demand drivers. these are summarised in table a2-1 and table a2-2.
Table A2–1 Future GDP Assumptions
GDP (%) 16/17 17/18 18/19 19/20 20/21 21/22 22/23 23/24 24/25low demand scenario 4.0 1.5 1.3 1.4 1.4 1.4 1.4 1.4 1.4
median demand scenario 4.0 3.2 3.0 3.0 3.0 3.0 3.0 3.0 3.0
high demand scenario 4.0 3.2 3.0 3.0 3.0 3.0 3.0 3.0 3.0
Table A2–2 Residential New Connections
16/17 17/18 18/19 19/20 20/21 21/22 22/23 23/24 24/25low demand scenario 8,053 8,340 8,631 8,927 9,329 9,725 9,913 9,943 9,943
median demand scenario 11,138 13,553 14,330 14,063 14,271 14,350 14,020 13,913 13,913
high demand scenario 14,366 18,868 20,211 19,305 19,299 18,945 18,133 17,913 17,913
87
Forecastthe demand forecasts are summarised in tables a2-3 to a2-11. table a2-12 presents the various supply sources by entry point, both existing and proposed. the values represent the maximum supply volume each source could potentially provide.
The ROI demand is broken down by sector, while the total demand is given for NI and the IOM. It should be noted that the figures in the tables may not sum to total due to rounding.
the forecasts are based on the following weather scenarios:• tables a2-3, a2-4 & a2-5: peak-day gas demand under severe 1-in-50 weather conditions, i.e. weather so severe that it
only occurs once every 50 years;• tables a2-6, a2-7 & a2-8: peak-day gas demand under ‘average year’ weather conditions, i.e. the weather conditions that
typically occur each year; and• tables a2-9, a2-10 & a2-11: annual gas demand in average year weather conditions.
the ni peak-day demand used for both the 1-in-50 and average year weather forecast is based on information published by the northern ireland utility regulator (ureGni) in the northern ireland Gas capacity statement 2015/16 – 2024/25. the iom peak-day is based on information provided by the manx electricity authority (mea).
the electricity demand for the average year is as per eirGrid’s all-island Generation capacity statement 2016-2025. the 1-in-50 year electricity demand is calculated by projecting forward the actual peak of 5,090 mw, which occurred in 2010 and growing this figure forward in line with the electricity demand forecast growth rate.
the weather correction is only applied to the distribution connected load, i.e. primarily to the residential and small i/c sectors. there is no weather correction applied to the power sector gas demand forecast.
the forecast assumes that the peak-day gas demand of the power sector is coincident with that of the residential and i/c sectors, as this gives the worst case scenario for network planning purposes.
The power generation peak-day gas demand forecast assumes that all of the non-gas fired thermal power stations are available on the day, i.e. all of the peat, coal and oil-fired power stations. If there is a forced outage of one or more of the non-gas fired thermal power stations, then the peak-day gas demand of the sector may be higher than indicated in the above forecasts.
APPEnDix2demand forecasts
Network Development Plan 2016
88
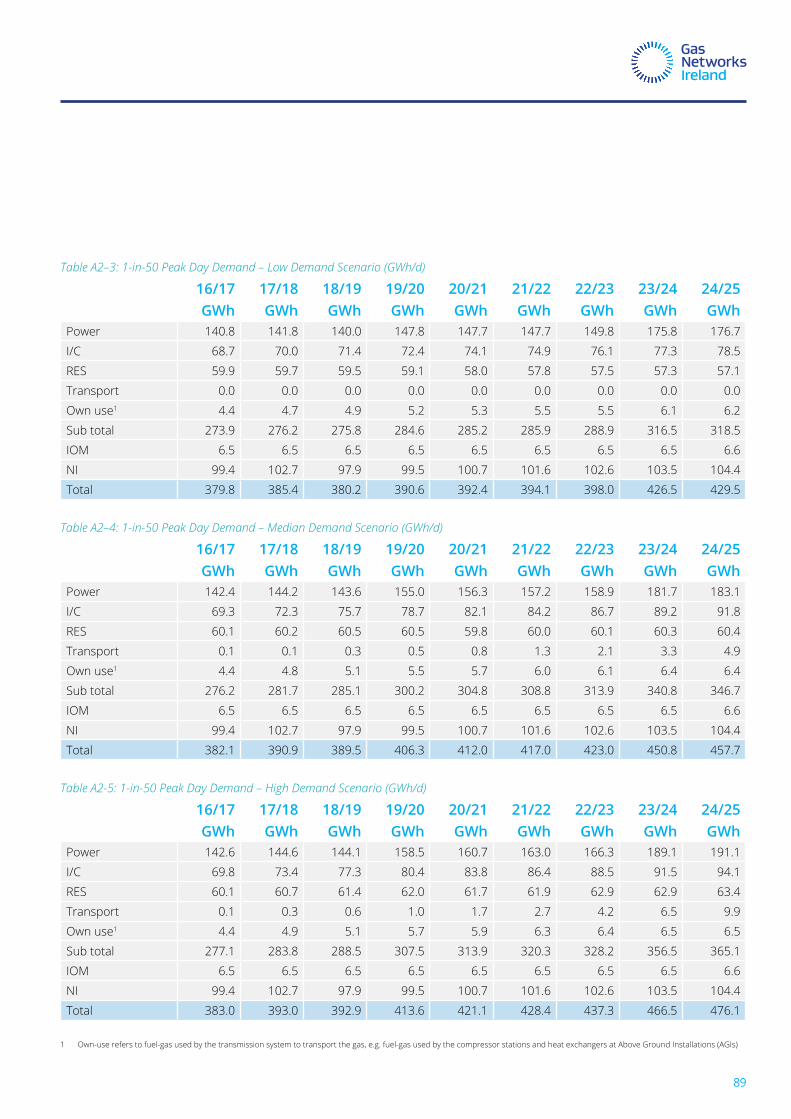
Table A2–3: 1-in-50 Peak Day Demand – Low Demand Scenario (GWh/d)
16/17 17/18 18/19 19/20 20/21 21/22 22/23 23/24 24/25GWh GWh GWh GWh GWh GWh GWh GWh GWh
power 140.8 141.8 140.0 147.8 147.7 147.7 149.8 175.8 176.7
i/c 68.7 70.0 71.4 72.4 74.1 74.9 76.1 77.3 78.5
res 59.9 59.7 59.5 59.1 58.0 57.8 57.5 57.3 57.1
transport 0.0 0.0 0.0 0.0 0.0 0.0 0.0 0.0 0.0
own use1 4.4 4.7 4.9 5.2 5.3 5.5 5.5 6.1 6.2
sub total 273.9 276.2 275.8 284.6 285.2 285.9 288.9 316.5 318.5
iom 6.5 6.5 6.5 6.5 6.5 6.5 6.5 6.5 6.6
ni 99.4 102.7 97.9 99.5 100.7 101.6 102.6 103.5 104.4
total 379.8 385.4 380.2 390.6 392.4 394.1 398.0 426.5 429.5
Table A2–4: 1-in-50 Peak Day Demand – Median Demand Scenario (GWh/d)
16/17 17/18 18/19 19/20 20/21 21/22 22/23 23/24 24/25GWh GWh GWh GWh GWh GWh GWh GWh GWh
power 142.4 144.2 143.6 155.0 156.3 157.2 158.9 181.7 183.1
i/c 69.3 72.3 75.7 78.7 82.1 84.2 86.7 89.2 91.8
res 60.1 60.2 60.5 60.5 59.8 60.0 60.1 60.3 60.4
transport 0.1 0.1 0.3 0.5 0.8 1.3 2.1 3.3 4.9
own use1 4.4 4.8 5.1 5.5 5.7 6.0 6.1 6.4 6.4
sub total 276.2 281.7 285.1 300.2 304.8 308.8 313.9 340.8 346.7
iom 6.5 6.5 6.5 6.5 6.5 6.5 6.5 6.5 6.6
ni 99.4 102.7 97.9 99.5 100.7 101.6 102.6 103.5 104.4
total 382.1 390.9 389.5 406.3 412.0 417.0 423.0 450.8 457.7
Table A2-5: 1-in-50 Peak Day Demand – High Demand Scenario (GWh/d)
16/17 17/18 18/19 19/20 20/21 21/22 22/23 23/24 24/25GWh GWh GWh GWh GWh GWh GWh GWh GWh
power 142.6 144.6 144.1 158.5 160.7 163.0 166.3 189.1 191.1
i/c 69.8 73.4 77.3 80.4 83.8 86.4 88.5 91.5 94.1
res 60.1 60.7 61.4 62.0 61.7 61.9 62.9 62.9 63.4
transport 0.1 0.3 0.6 1.0 1.7 2.7 4.2 6.5 9.9
own use1 4.4 4.9 5.1 5.7 5.9 6.3 6.4 6.5 6.5
sub total 277.1 283.8 288.5 307.5 313.9 320.3 328.2 356.5 365.1
iom 6.5 6.5 6.5 6.5 6.5 6.5 6.5 6.5 6.6
ni 99.4 102.7 97.9 99.5 100.7 101.6 102.6 103.5 104.4
total 383.0 393.0 392.9 413.6 421.1 428.4 437.3 466.5 476.1
1 own-use refers to fuel-gas used by the transmission system to transport the gas, e.g. fuel-gas used by the compressor stations and heat exchangers at above Ground installations (aGis)
89
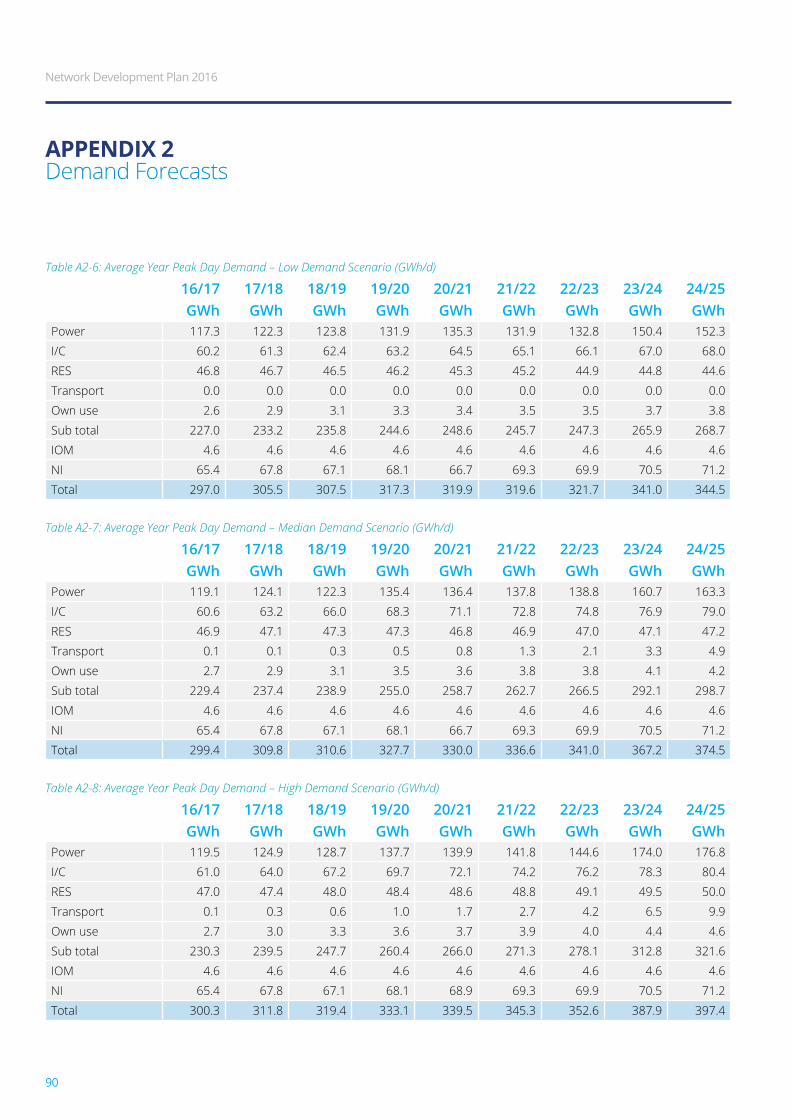
Table A2-6: Average Year Peak Day Demand – Low Demand Scenario (GWh/d)
16/17 17/18 18/19 19/20 20/21 21/22 22/23 23/24 24/25GWh GWh GWh GWh GWh GWh GWh GWh GWh
power 117.3 122.3 123.8 131.9 135.3 131.9 132.8 150.4 152.3
i/c 60.2 61.3 62.4 63.2 64.5 65.1 66.1 67.0 68.0
res 46.8 46.7 46.5 46.2 45.3 45.2 44.9 44.8 44.6
transport 0.0 0.0 0.0 0.0 0.0 0.0 0.0 0.0 0.0
own use 2.6 2.9 3.1 3.3 3.4 3.5 3.5 3.7 3.8
sub total 227.0 233.2 235.8 244.6 248.6 245.7 247.3 265.9 268.7
iom 4.6 4.6 4.6 4.6 4.6 4.6 4.6 4.6 4.6
ni 65.4 67.8 67.1 68.1 66.7 69.3 69.9 70.5 71.2
total 297.0 305.5 307.5 317.3 319.9 319.6 321.7 341.0 344.5
Table A2-7: Average Year Peak Day Demand – Median Demand Scenario (GWh/d)
16/17 17/18 18/19 19/20 20/21 21/22 22/23 23/24 24/25GWh GWh GWh GWh GWh GWh GWh GWh GWh
power 119.1 124.1 122.3 135.4 136.4 137.8 138.8 160.7 163.3
i/c 60.6 63.2 66.0 68.3 71.1 72.8 74.8 76.9 79.0
res 46.9 47.1 47.3 47.3 46.8 46.9 47.0 47.1 47.2
transport 0.1 0.1 0.3 0.5 0.8 1.3 2.1 3.3 4.9
own use 2.7 2.9 3.1 3.5 3.6 3.8 3.8 4.1 4.2
sub total 229.4 237.4 238.9 255.0 258.7 262.7 266.5 292.1 298.7
iom 4.6 4.6 4.6 4.6 4.6 4.6 4.6 4.6 4.6
ni 65.4 67.8 67.1 68.1 66.7 69.3 69.9 70.5 71.2
total 299.4 309.8 310.6 327.7 330.0 336.6 341.0 367.2 374.5
Table A2-8: Average Year Peak Day Demand – High Demand Scenario (GWh/d)
16/17 17/18 18/19 19/20 20/21 21/22 22/23 23/24 24/25GWh GWh GWh GWh GWh GWh GWh GWh GWh
power 119.5 124.9 128.7 137.7 139.9 141.8 144.6 174.0 176.8
i/c 61.0 64.0 67.2 69.7 72.1 74.2 76.2 78.3 80.4
res 47.0 47.4 48.0 48.4 48.6 48.8 49.1 49.5 50.0
transport 0.1 0.3 0.6 1.0 1.7 2.7 4.2 6.5 9.9
own use 2.7 3.0 3.3 3.6 3.7 3.9 4.0 4.4 4.6
sub total 230.3 239.5 247.7 260.4 266.0 271.3 278.1 312.8 321.6
iom 4.6 4.6 4.6 4.6 4.6 4.6 4.6 4.6 4.6
ni 65.4 67.8 67.1 68.1 68.9 69.3 69.9 70.5 71.2
total 300.3 311.8 319.4 333.1 339.5 345.3 352.6 387.9 397.4
APPEnDix2demand forecasts
Network Development Plan 2016
90
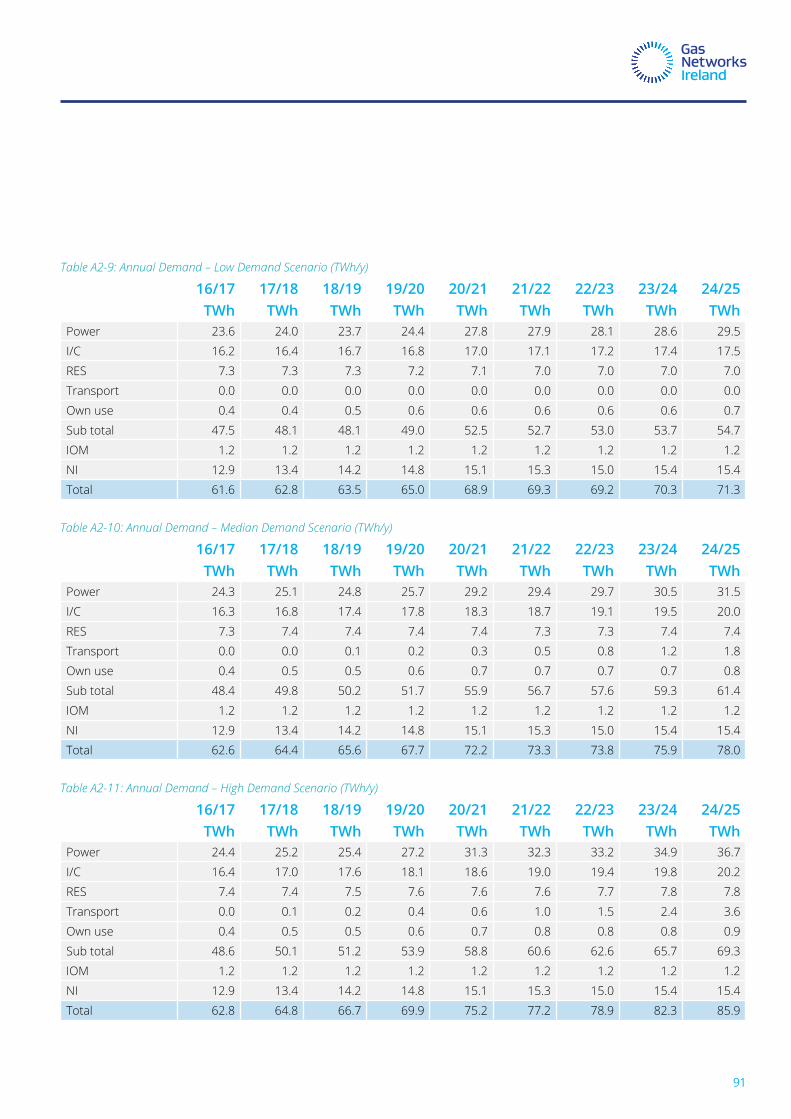
Table A2-9: Annual Demand – Low Demand Scenario (TWh/y)
16/17 17/18 18/19 19/20 20/21 21/22 22/23 23/24 24/25TWh TWh TWh TWh TWh TWh TWh TWh TWh
power 23.6 24.0 23.7 24.4 27.8 27.9 28.1 28.6 29.5
i/c 16.2 16.4 16.7 16.8 17.0 17.1 17.2 17.4 17.5
res 7.3 7.3 7.3 7.2 7.1 7.0 7.0 7.0 7.0
transport 0.0 0.0 0.0 0.0 0.0 0.0 0.0 0.0 0.0
own use 0.4 0.4 0.5 0.6 0.6 0.6 0.6 0.6 0.7
sub total 47.5 48.1 48.1 49.0 52.5 52.7 53.0 53.7 54.7
iom 1.2 1.2 1.2 1.2 1.2 1.2 1.2 1.2 1.2
ni 12.9 13.4 14.2 14.8 15.1 15.3 15.0 15.4 15.4
total 61.6 62.8 63.5 65.0 68.9 69.3 69.2 70.3 71.3
Table A2-10: Annual Demand – Median Demand Scenario (TWh/y)
16/17 17/18 18/19 19/20 20/21 21/22 22/23 23/24 24/25TWh TWh TWh TWh TWh TWh TWh TWh TWh
power 24.3 25.1 24.8 25.7 29.2 29.4 29.7 30.5 31.5
i/c 16.3 16.8 17.4 17.8 18.3 18.7 19.1 19.5 20.0
res 7.3 7.4 7.4 7.4 7.4 7.3 7.3 7.4 7.4
transport 0.0 0.0 0.1 0.2 0.3 0.5 0.8 1.2 1.8
own use 0.4 0.5 0.5 0.6 0.7 0.7 0.7 0.7 0.8
sub total 48.4 49.8 50.2 51.7 55.9 56.7 57.6 59.3 61.4
iom 1.2 1.2 1.2 1.2 1.2 1.2 1.2 1.2 1.2
ni 12.9 13.4 14.2 14.8 15.1 15.3 15.0 15.4 15.4
total 62.6 64.4 65.6 67.7 72.2 73.3 73.8 75.9 78.0
Table A2-11: Annual Demand – High Demand Scenario (TWh/y)
16/17 17/18 18/19 19/20 20/21 21/22 22/23 23/24 24/25TWh TWh TWh TWh TWh TWh TWh TWh TWh
power 24.4 25.2 25.4 27.2 31.3 32.3 33.2 34.9 36.7
i/c 16.4 17.0 17.6 18.1 18.6 19.0 19.4 19.8 20.2
res 7.4 7.4 7.5 7.6 7.6 7.6 7.7 7.8 7.8
transport 0.0 0.1 0.2 0.4 0.6 1.0 1.5 2.4 3.6
own use 0.4 0.5 0.5 0.6 0.7 0.8 0.8 0.8 0.9
sub total 48.6 50.1 51.2 53.9 58.8 60.6 62.6 65.7 69.3
iom 1.2 1.2 1.2 1.2 1.2 1.2 1.2 1.2 1.2
ni 12.9 13.4 14.2 14.8 15.1 15.3 15.0 15.4 15.4
total 62.8 64.8 66.7 69.9 75.2 77.2 78.9 82.3 85.9
91
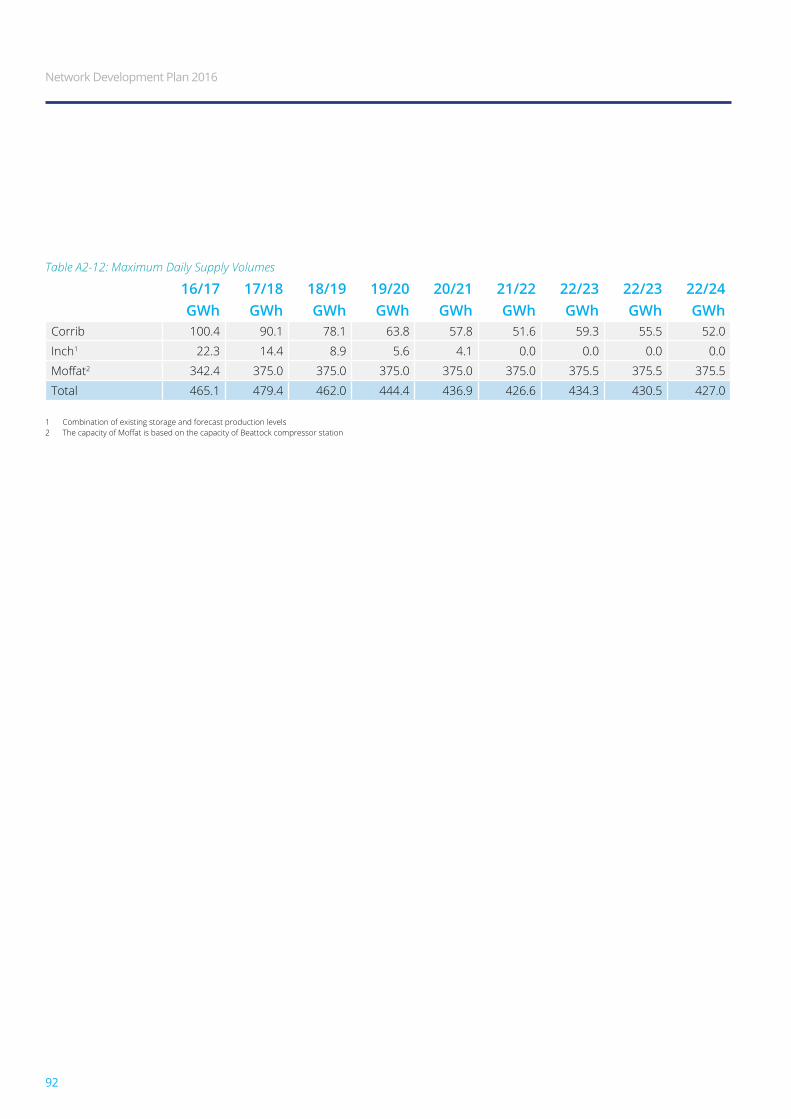
Table A2-12: Maximum Daily Supply Volumes
16/17 17/18 18/19 19/20 20/21 21/22 22/23 22/23 22/24GWh GWh GWh GWh GWh GWh GWh GWh GWh
corrib 100.4 90.1 78.1 63.8 57.8 51.6 59.3 55.5 52.0
inch1 22.3 14.4 8.9 5.6 4.1 0.0 0.0 0.0 0.0
Moffat2 342.4 375.0 375.0 375.0 375.0 375.0 375.5 375.5 375.5
total 465.1 479.4 462.0 444.4 436.9 426.6 434.3 430.5 427.0
1 combination of existing storage and forecast production levels2 The capacity of Moffat is based on the capacity of Beattock compressor station
Network Development Plan 2016
92
APPEnDix3Energy Efficiency assumptionsNational Energy Efficiency Action Plan 2014 The National Energy Efficiency Action Plan 2014 (NEEAP3) sets out the Government’s strategy for meeting the energy efficiency savings targets identified in the energy White Paper (2007) and the EU Energy Services Directive (ESD). These targets include:
• the Government target of a 20% reduction in roi energy demand across the whole economy by 2020, with a higher 33% target for the public sector; and
• the energy savings directive (esd) target of a 9% reduction in energy demand by 2016 in the non-european emission trading scheme (ets) sectors.
Table A3-1 outlines the NEEAP 3 energy efficiency targets over the period to 2020.
93
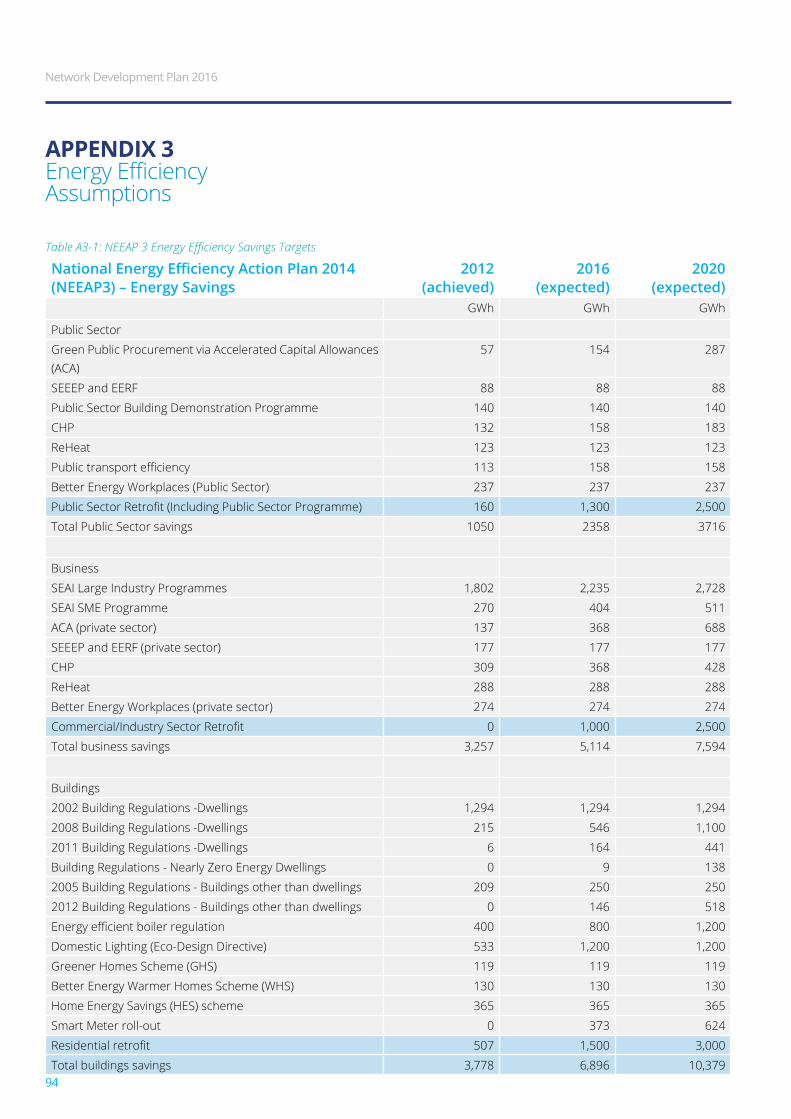
Table A3-1: NEEAP 3 Energy Efficiency Savings Targets
National Energy Efficiency Action Plan 2014 (NEEAP3) – Energy Savings
2012 (achieved)
2016 (expected)
2020 (expected)
Gwh Gwh Gwh
public sector
Green public procurement via accelerated capital allowances (aca)
57 154 287
seeep and eerf 88 88 88
public sector building demonstration programme 140 140 140
chp 132 158 183
reheat 123 123 123
Public transport efficiency 113 158 158
better energy workplaces (public sector) 237 237 237
Public Sector Retrofit (Including Public Sector Programme) 160 1,300 2,500
total public sector savings 1050 2358 3716
business
seai large industry programmes 1,802 2,235 2,728
seai sme programme 270 404 511
aca (private sector) 137 368 688
seeep and eerf (private sector) 177 177 177
chp 309 368 428
reheat 288 288 288
better energy workplaces (private sector) 274 274 274
Commercial/Industry Sector Retrofit 0 1,000 2,500
total business savings 3,257 5,114 7,594
buildings
2002 building regulations -dwellings 1,294 1,294 1,294
2008 building regulations -dwellings 215 546 1,100
2011 building regulations -dwellings 6 164 441
building regulations - nearly Zero energy dwellings 0 9 138
2005 building regulations - buildings other than dwellings 209 250 250
2012 building regulations - buildings other than dwellings 0 146 518
Energy efficient boiler regulation 400 800 1,200
domestic lighting (eco-design directive) 533 1,200 1,200
Greener homes scheme (Ghs) 119 119 119
better energy warmer homes scheme (whs) 130 130 130
home energy savings (hes) scheme 365 365 365
smart meter roll-out 0 373 624
Residential retrofit 507 1,500 3,000
total buildings savings 3,778 6,896 10,379
APPEnDix3Energy Efficiency assumptions
Network Development Plan 2016
94
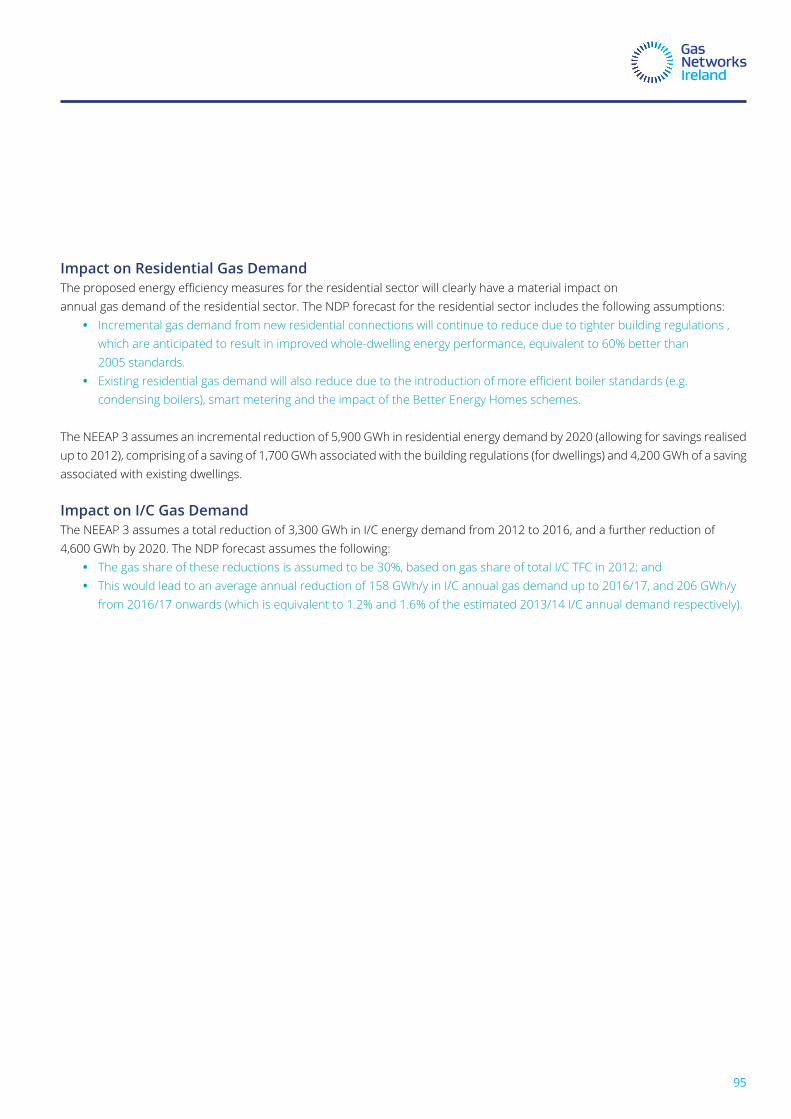
Impact on Residential Gas DemandThe proposed energy efficiency measures for the residential sector will clearly have a material impact on annual gas demand of the residential sector. the ndp forecast for the residential sector includes the following assumptions:
• incremental gas demand from new residential connections will continue to reduce due to tighter building regulations , which are anticipated to result in improved whole-dwelling energy performance, equivalent to 60% better than 2005 standards.
• Existing residential gas demand will also reduce due to the introduction of more efficient boiler standards (e.g. condensing boilers), smart metering and the impact of the better energy homes schemes.
the neeap 3 assumes an incremental reduction of 5,900 Gwh in residential energy demand by 2020 (allowing for savings realised up to 2012), comprising of a saving of 1,700 Gwh associated with the building regulations (for dwellings) and 4,200 Gwh of a saving associated with existing dwellings.
Impact on I/C Gas Demandthe neeap 3 assumes a total reduction of 3,300 Gwh in i/c energy demand from 2012 to 2016, and a further reduction of 4,600 Gwh by 2020. the ndp forecast assumes the following:
• the gas share of these reductions is assumed to be 30%, based on gas share of total i/c tfc in 2012; and• this would lead to an average annual reduction of 158 Gwh/y in i/c annual gas demand up to 2016/17, and 206 Gwh/y
from 2016/17 onwards (which is equivalent to 1.2% and 1.6% of the estimated 2013/14 i/c annual demand respectively).
95
APPEnDix4transmission network modellingthe purpose of the hydraulic network modelling is to test the adequacy of the existing all-island transmission network for a forecast demand under a number of supply scenarios, establishing where pressures are outside acceptable operational boundaries or where there is insufficient capacity to transport the necessary gas. This chapter summarises the results of the network analysis carried out for this ndp.
network analysis was carried out using hydraulic network modelling software, pipeline studio®. a single hydraulic model of the interconnector and roi transmission systems45 was constructed using Pipeline Studio®. This simulation software was configured to analyse the transient 24 hour demand cycle over a minimum period of three days to obtain consistent steady results.
In order to assess the system on days of different demand pattern, three demand day types were analysed for each supply scenario over a 10 year period to 2024/25,
• 1-in-50 year winter peak day• average year winter peak day• average year summer minimum
these demand days, which were generated from the gas demand forecast, have been chosen as they represent the maximum and minimum flow conditions on the transmission system.
The ability of the ROI transmission system to accommodate the forecast gas flow requirements was validated against the following criteria;
• Maintaining the specified minimum and maximum operating pressures at key points on the transmission systems;• operating the compressor stations within their performance envelopes; and• ensuring gas velocities do not exceed their design range of 10 – 12 m/s.
45 ni transmission system is not included in the modelling. ni is treated as a demand at twynholm, scotland.
Network Development Plan 2016
96
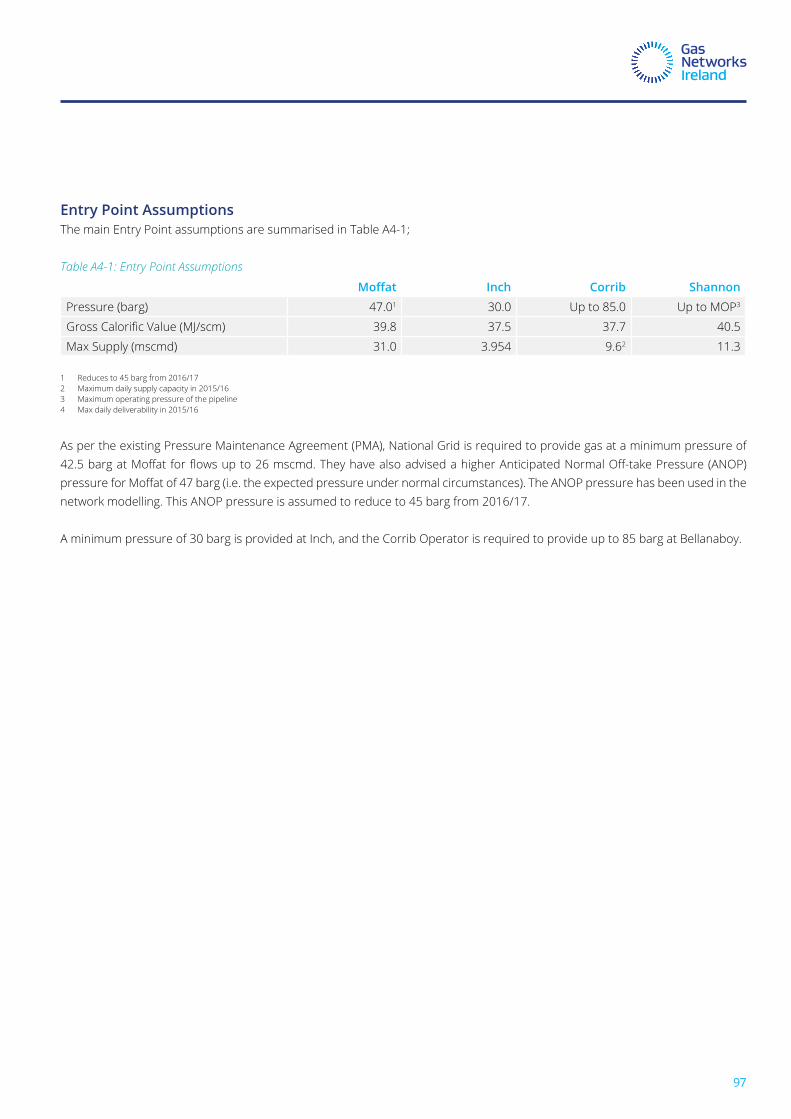
Entry Point Assumptionsthe main entry point assumptions are summarised in table a4-1;
Table A4-1: Entry Point Assumptions
Moffat Inch Corrib Shannonpressure (barg) 47.01 30.0 up to 85.0 up to mop3
Gross Calorific Value (MJ/scm) 39.8 37.5 37.7 40.5
max supply (mscmd) 31.0 3.954 9.62 11.3
1 reduces to 45 barg from 2016/172 maximum daily supply capacity in 2015/163 maximum operating pressure of the pipeline4 max daily deliverability in 2015/16
as per the existing pressure maintenance agreement (pma), national Grid is required to provide gas at a minimum pressure of 42.5 barg at Moffat for flows up to 26 mscmd. They have also advised a higher Anticipated Normal Off-take Pressure (ANOP) pressure for Moffat of 47 barg (i.e. the expected pressure under normal circumstances). The ANOP pressure has been used in the network modelling. this anop pressure is assumed to reduce to 45 barg from 2016/17.
a minimum pressure of 30 barg is provided at inch, and the corrib operator is required to provide up to 85 barg at bellanaboy.
97
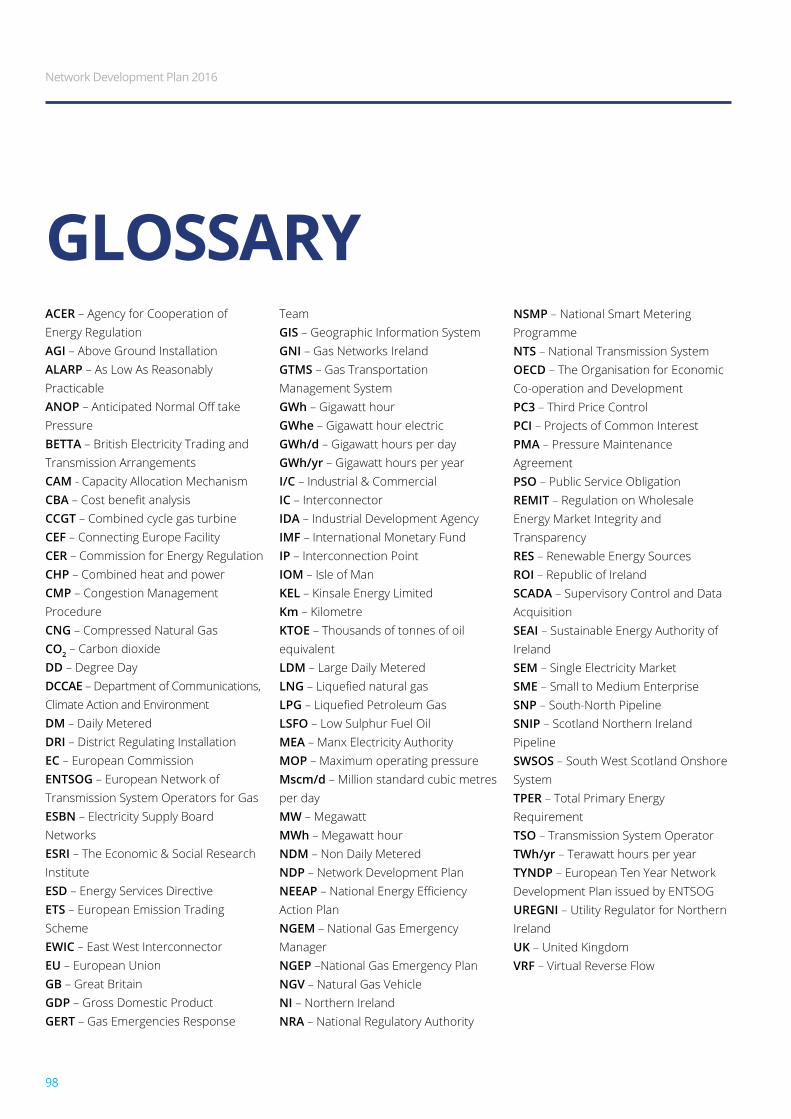
GLOSSARyACER – agency for cooperation of energy regulation AGI – above Ground installationALARP – as low as reasonably practicableANOP – Anticipated Normal Off take pressureBETTA – british electricity trading and transmission arrangementsCAM - capacity allocation mechanism CBA – Cost benefit analysisCCGT – combined cycle gas turbineCEF – connecting europe facilityCER – commission for energy regulationCHP – combined heat and powerCMP – congestion management procedureCNG – compressed natural GasCO2 – carbon dioxideDD – degree dayDCCAE – department of communications, climate action and environmentDM – daily meteredDRI – district regulating installationEC – european commissionENTSOG – european network of transmission system operators for GasESBN – electricity supply board networksESRI – the economic & social research instituteESD – energy services directiveETS – european emission trading schemeEWIC – east west interconnectorEU – european unionGB – Great britainGDP – Gross domestic productGERT – Gas emergencies response
team GIS – Geographic information system GNI – Gas networks ireland GTMS – Gas transportation management systemGWh – Gigawatt hourGWhe – Gigawatt hour electricGWh/d – Gigawatt hours per dayGWh/yr – Gigawatt hours per yearI/C – industrial & commercialIC – interconnectorIDA – industrial development agencyIMF – international monetary fundIP – interconnection pointIOM – isle of manKEL – kinsale energy limitedKm – kilometreKTOE – thousands of tonnes of oil equivalentLDM – large daily meteredLNG – Liquefied natural gasLPG – Liquefied Petroleum GasLSFO – low sulphur fuel oilMEA – manx electricity authorityMOP – maximum operating pressureMscm/d – million standard cubic metres per dayMW – megawattMWh – megawatt hourNDM – non daily meteredNDP – network development planNEEAP – National Energy Efficiency action planNGEM – national Gas emergency managerNGEP –national Gas emergency planNGV – natural Gas vehicleNI – northern irelandNRA – national regulatory authority
NSMP – national smart metering programmeNTS – national transmission systemOECD – the organisation for economic co-operation and developmentPC3 – third price controlPCI – projects of common interestPMA – pressure maintenance agreementPSO – public service obligationREMIT – regulation on wholesale energy market integrity and transparencyRES – renewable energy sourcesROI – republic of irelandSCADA – supervisory control and data acquisitionSEAI – sustainable energy authority of irelandSEM – single electricity marketSME – small to medium enterpriseSNP – south-north pipelineSNIP – scotland northern ireland pipelineSWSOS – south west scotland onshore systemTPER – total primary energy requirementTSO – transmission system operatorTWh/yr – terawatt hours per yearTYNDP – european ten year network development plan issued by entsoGUREGNI – utility regulator for northern irelandUK – united kingdomVRF – virtual reverse flow
Network Development Plan 2016
98