Embed Size (px)
Citation preview

Theresa L. Jackson
University System of Georgia
Office of Fiscal Affairs, Accounting & Reporting
404-962-32071
GASB Statement 72Fair Value Measurement & Application

2
GASB 72 Fair Value Measurement & Application
• Primarily clarifies/expands on GASB Statement 31 and Statement No. 53.
• Reviews/revises the definition of fair value.
• Clarifies the methods used to measure fair value.
• Determines the fair value guidance to investments/other items currently reported at fair value.
• Determines potential disclosures about fair value measurements and reporting.
• Statement effective for financial statements for reporting periods beginning after June 15, 2015.
• USG implemented GASB 72 in fiscal year June 30, 2016.

GASB 72 Fair Value Measurement & Application
Statement consists of three sections:
1. Measurement – Definitions, principals to apply.
2. Application – When measurements are required,
primarily focused on Investments.
3. Disclosure – Required note disclosures.
3

Fair Value – Old Definition
• The amount at which an investment could be exchanged in a current transaction between willing parties, other than in a forced or liquidation sale.
Fair Value – New Definition
• The price that would be received to sell an asset or paid to transfer a liability in an orderly transaction between market participants at the measurement date. The objective of a fair value measurement is to estimate the exit price of assets and liabilities.
4
GASB 72 Fair Value Measurement & Application
GASB 72 Fair Value Measurement & Application
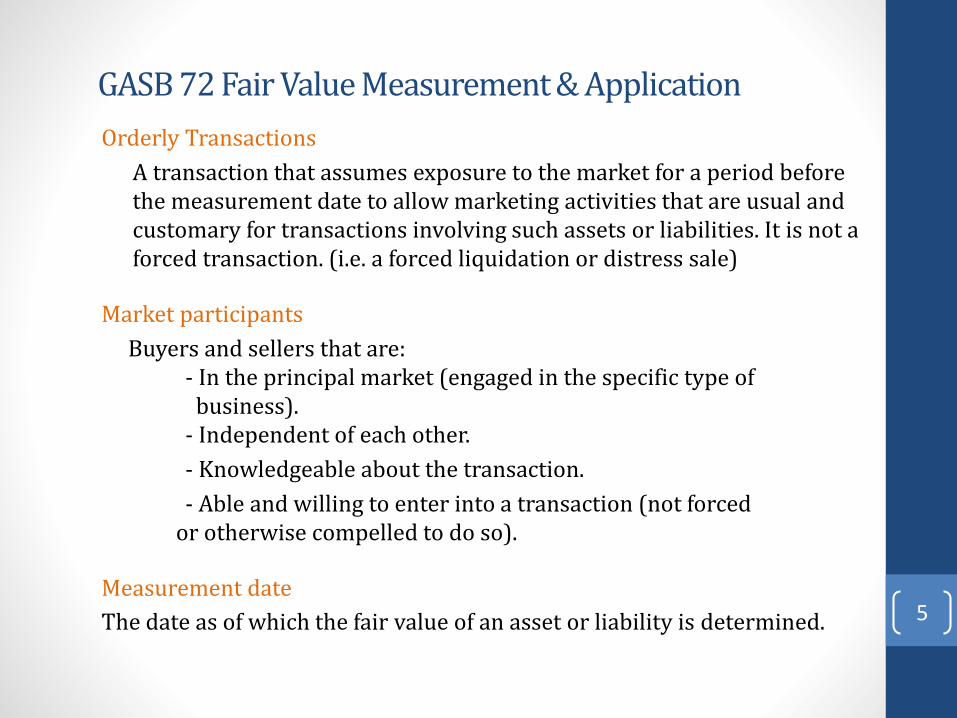
Orderly Transactions
A transaction that assumes exposure to the market for a period before the measurement date to allow marketing activities that are usual and customary for transactions involving such assets or liabilities. It is not a forced transaction. (i.e. a forced liquidation or distress sale)
Market participants
Buyers and sellers that are:- In the principal market (engaged in the specific type of
business).- Independent of each other.
- Knowledgeable about the transaction.
- Able and willing to enter into a transaction (not forced or otherwise compelled to do so).
Measurement date
The date as of which the fair value of an asset or liability is determined. 5

GASB 72 Fair Value Measurement & Application
Price (considered an exit price)
The price that would be received to sell an asset or paid to transfer a
liability. (What you would pay/accept to get rid of it?)
Acquisition value
The price that would be paid to acquire an asset with equivalent service potential in an orderly market transaction at the acquisition date, or the amount at which a liability could be liquidated with the counterparty at
the acquisition date.
Unit of AccountThe level at which an asset or a liability is aggregated or disaggregated formeasurement, recognition, or disclosure purposes. The items to be valued could be a:
Single asset or liability
A group of assets of liabilities; or
A group of related assets and liabilities 6

GASB 72 Fair Value Measurement & Application
Valuation Techniques
A specific method or combination of methods used to determine the fair value of an asset or liability. This method should be based onthe use of inputs.
(Which approach should be used to arrive at fair value?)
MarketUses prices and other relevant information generated by market transactions involving identical or similar assets/liabilities.Ex. Looking up value in NYSE (New York Stock Exchange)
Cost Uses amount currently required to replace the service capacity of an asset. Ex. Estimating how much would you have to pay to buy this asset.
IncomeConverts expected future amounts to a single current amount.Ex. Present value of future cash flows, option-pricing models, etc.
Note: If the valuation or fair value is changed, it is considered an change in accounting estimate which may result in having to restate. 7

Valuation techniques should:
• Maximize the use of observable inputs.
• Minimize the use of unobservable inputs.
• Select inputs that are consistent with the characteristics of the asset or liability that market participants would take into account in a transaction for the asset or liability.
8
GASB 72 Fair Value Measurement & Application

Observable inputs
Inputs that are developed using market data, such as publicly available information about actual events or transactions, and which reflect the assumptions that market participants would use
when pricing an asset or liability.
Unobservable inputs
Inputs for which market data are not available and that are developed using the best information available about the assumptions that market participants would use when pricing an asset or liability.
9
GASB 72 Fair Value Measurement & Application

GASB 72 Fair Value Measurement & Application
The same valuation techniques should be consistently appliedfrom period to period unless:
• New markets develop
• New information becomes available
• Information previously used is no longer valid
• Valuation technique has improved
• Market conditions have changed
If an asset or liability was not previously required to be recorded at fair value, this statement will not change the measurement basis of that particular asset or liability.
10
GASB 72 Fair Value Measurement & Application
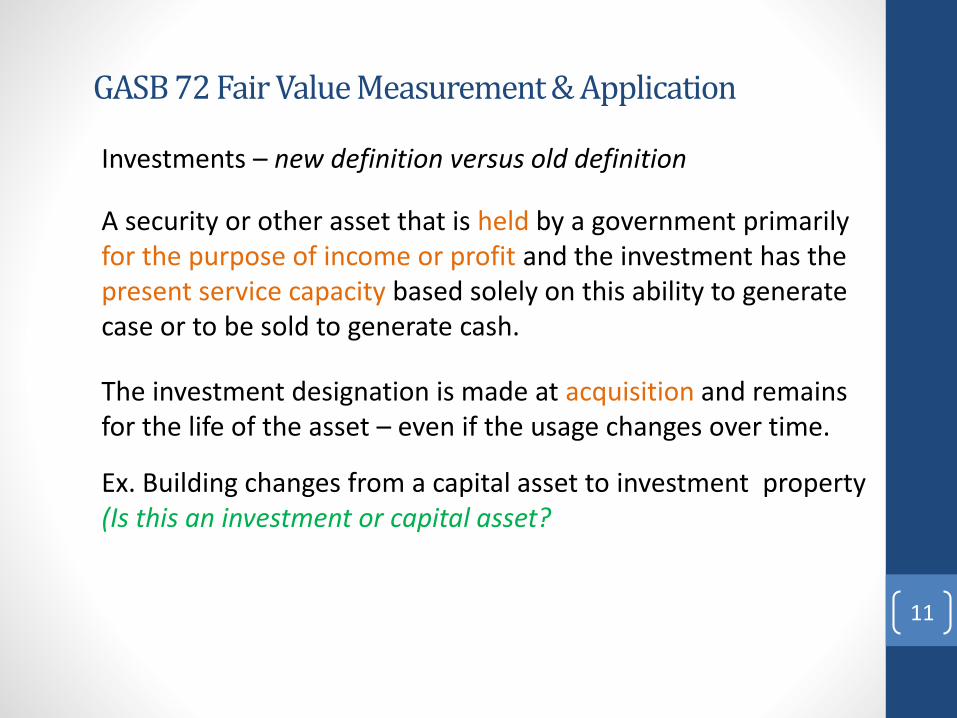
Investments – new definition versus old definition
A security or other asset that is held by a government primarily for the purpose of income or profit and the investment has the present service capacity based solely on this ability to generate case or to be sold to generate cash.
The investment designation is made at acquisition and remains for the life of the asset – even if the usage changes over time.
Ex. Building changes from a capital asset to investment property (Is this an investment or capital asset?
11
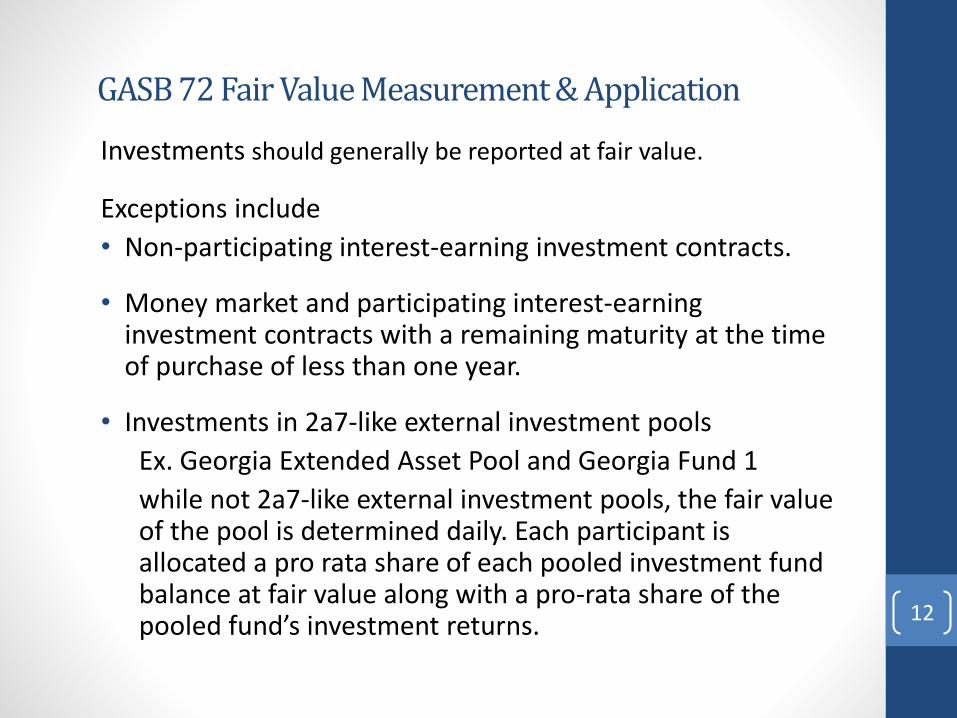
Investments should generally be reported at fair value.
Exceptions include
• Non-participating interest-earning investment contracts.
• Money market and participating interest-earning investment contracts with a remaining maturity at the time of purchase of less than one year.
• Investments in 2a7-like external investment pools
Ex. Georgia Extended Asset Pool and Georgia Fund 1
while not 2a7-like external investment pools, the fair value of the pool is determined daily. Each participant is allocated a pro rata share of each pooled investment fund balance at fair value along with a pro-rata share of the pooled fund’s investment returns. 12
GASB 72 Fair Value Measurement & Application

GASB 72 Fair Value Measurement & Application
Level 1 – Most ReliableQuoted prices are available in active markets for identical investments as of the measurement date.
Level 2 - ReliablePricing inputs are observable for the investments, either directly or indirectly, as of the measurement date, but are not the same as those used in Level 1; inputs include comparable market transactions, pricing of similar instruments, values reported by the administrator, and pricing expectations based on internal modeling. Fair value is determined through the use of models or other valuation methodologies.
Level 3 – Least ReliablePricing inputs are unobservable for the investment and include situations where there is little, if any, market activity for the investments.
13

GASB 72 Fair Value Measurement & Application
The hierarchy levels are meant to provide a measurement criteria to provide consistency in reporting among reporting groups. The Level 1, 2, and 3 inputs reflect:
• Relative risk/safety of an investment.
• The degree to which fair value is based on observable and unobservable inputs.
• The credit ratings of investments.
• Whether investments are held by third parties or by the government itself.
14

GASB 72 Fair Value Measurement & Application
• Starting Fiscal Year 2017, all institutions will be reporting Investments differently from the past. In addition to the new way investments will be measured and recorded, the Fair Value Hierarchy schedule which reports investments aggregated by Level 1, 2, and 3 is required to be reported along with a note disclosure.
• USG has standardized on using the SunTrust Fair Value Evaluation Matrix to report Investments with their corresponding Fair Value Levels.
• Although there may be differences in the Hierarchy Levels provided by other banking partners, Institutions will need to discuss with the Financial Accounting & Reporting before changing a fair value valuation for an investment.
15

GASB 72 Fair Value Measurement & Application
To accomplish this, the format for filling out the Note 2 Backup Investment schedule has changed from this:
16
See Separate file for instructions
Back up for note 2
Entity Code:
Entity Name: PEACHTREE STATE UNIVERSTY
GEORGIA
COMPREHENSIVE ANNUAL FINANCIAL REPORT
NOTE DISCLOSURE INFORMATION
INVESTMENT ANALYSIS AND DISCLOSURE OF RISKS
PART A: ANALYSIS OF FOOTNOTE INVESTMENTS INCLUDED ON THE GENERAL LEDGER
GENERAL LEDGER INFORMATION
A B C N F G
Financial
GL B - GL Account Name Institution CUSIP or other General
Acct. C - F inancial Institution/Broker/Dealer Name Broker/Dealer identifying number, Ledger
No.
D - Investment Type
Select from Drop Down List
BelowAcct./Portfolio No. if appicable Amount
General Obligation Bonds
US Treasuries
INVESTMENT POOLS:
BOR Short Term Fund
BOR Legal Fund
BOR Balanced Fund
BOR Total Return Fund
BOR Diversified Fund
OFFICE OF STATE TREASURER:
Georgia Fund 1
Georgia Extended Asset Pool
"TOTAL FOOTNOTE INVESTMENTS" to Part B 0.00
Concentration of Credit Risk Threshold (5%) 0.00
Investments subject to Concentration of Credit risk that exceed 5%:
Investment Name Amount
% of Total
Investment
$0.00 #DIV/0!
$0.00 #DIV/0!
$0.00 #DIV/0!
$0.00 #DIV/0!
D

To this…..Note 2 Backup A Investment Analysis will have to be filled out according to the Hierarchy Levels identified during the FY 16 USG Consolidation process.
17
GASB 72 Fair Value Measurement & Application
June 30, 2016 Gilbert Trust
Information for this schedule can be found on Note 2 Backup B-Inv. Recon tab within all individual Institution AFR excel workbooks .
Fund Financial Institution Type Investment GL Fair Value
Fair Value
Hierarchy
Higher Ed Albany State University BOR Pool - ELIMINATE BOR Pool - ELIMINATE 423,455.00 See Note 2
Higher Ed Georgia Institute of Technology GEAP Pool GEAP Pool 155,462.00 155,462.00 See Note 2
Higher Ed Georgia Institute of Technology LGIP Pool LGIP Pool 53,531,491.00 53,531,491.00 See Note 2
Higher Ed Georgia Institute of Technology Money Market Mutual Funds Cash/Money Market 314,186.55 314,186.55 Level 1
Higher Ed Georgia Institute of Technology Money Market Mutual Funds Cash/Money Market 3.44 3.44 Level 1
Higher Ed Georgia Institute of Technology Money Market Mutual Funds Cash/Money Market 151,934.99 151,934.99 Level 1
Higher Ed Georgia Institute of Technology Money Market Mutual Funds Cash/Money Market 441.31 441.31 Level 1
Higher Ed Georgia Institute of Technology Money Market Mutual Funds Gilbert Investment account (Money Market) NON CURRENT CASH99,488.82 99,488.82 Level 1
Higher Ed Georgia Institute of Technology Real Estate Held for Investment Purposes Real Estate 481,110.00 481,110.00 Level 3
Higher Ed Georgia Institute of Technology Real Estate Investment Trusts Prudential Global Real Estate Fund CL Z (REIT) 360,272.90 360,272.90 Level 1
Higher Ed Georgia Institute of Technology Real Estate Investment Trusts Vanguard REIT ETF (REIT) 367,980.50 367,980.50 Level 1
Higher Ed Georgia Institute of Technology Real Estate Investment Trusts Credit Suisse Commodity Return Strategy Fund (REIT) 44,936.04 44,936.04 Level 1
Higher Ed Georgia Institute of Technology Real Estate Investment Trusts SPDR DJ Wilshire International Real Estate ETF (REIT) 52,241.82 52,241.82 Level 1
Higher Ed Georgia Institute of Technology Real Estate Investment Trusts T Rowe Price Real Estate Fund #122 (REIT) 41,705.58 41,705.58 Level 1
Higher Ed Georgia Institute of Technology Real Estate Investment Trusts Vanguard REIT Viper (REIT) 86,364.58 86,364.58 Level 1
Higher Ed Georgia Institute of Technology US Agencies-Explicitly Guaranteed U.S. Treasury Note 119,994.14 119,994.14 Level 2
Higher Ed Georgia Institute of Technology US Agencies-Explicitly Guaranteed U.S. Treasury Note 211,147.59 211,147.59 Level 2
Higher Ed Kennesaw State Equity Securities-Domestic CHURCH & DWIGHT CO 6,173.00 6,173.00 Level 1
Higher Ed Kennesaw State Equity Securities-Domestic COSTCO WHOLESALE CO 5,496.00 5,496.00 Level 1
Higher Ed Kennesaw State Equity Securities-Domestic CSX CORP 3,782.00 3,782.00 Level 1
Higher Ed Kennesaw State Equity Securities-Domestic CVS HEALTH CORP 4,404.00 4,404.00 Level 1
Higher Ed Kennesaw State Equity Securities-Domestic NIKE INC 3,754.00 3,754.00 Level 1
Higher Ed Kennesaw State Equity Securities-Domestic ORACLE CORPORATION 4,093.00 4,093.00 Level 1
Higher Ed Kennesaw State Equity Securities-Domestic PAYPAL HOLDINGS INCO 1,826.00 1,826.00 Level 1
Higher Ed University System Office - Total Return Fund Equity Mutual Funds-Domestic VANGUARD INSTITUTIONAL INDEX FUND 5,294,509.01 5,294,509.01 Level 1
Higher Ed University System Office - Total Return Fund Equity Securities-Domestic ISHARES CORE S&P MID-CAP ETF 1,121,171.95 1,121,171.95 Level 1
Higher Ed University System Office - Total Return Fund Equity Securities-Domestic ISHARES RUSSELL 1000 VALUE ETF 1,019,912.40 1,019,912.40 Level 1
Higher Ed University System Office - Total Return Fund Equity Securities-Domestic ISHARES RUSSELL 1000 GROWTH ETF 1,177,724.60 1,177,724.60 Level 1
Higher Ed University System Office - Total Return Fund Money Market Mutual Funds FEDERATED MONEY MKT OBLIGS TR 488,043.15 488,043.15 Level 1
Higher Ed USO LGIP Pool LGIP Pool 68,262,134.00 68,262,134.00 See Note 2
Higher Ed Valdosta State University BOR Pool - ELIMINATE BOR Pool - ELIMINATE 7,467,467.00 See Note 2
Higher Ed Valdosta State University GEAP Pool GEAP Pool 6,739,927.00 6,739,927.00 See Note 2
Higher Ed Valdosta State University LGIP Pool LGIP Pool 10,031,696.00 10,031,696.00 See Note 2
1,446,253,473.99 1,446,253,473.99

USG Fair Value hierarchy – Note Disclosure will look like this…
• Level 1 Investments valued using prices quoted in active markets for those securities.
• Level 2Investments valued using a matrix pricing technique. Matrix pricing is used to value securities based on the securities relationship to benchmark quoted prices.
• Level 3Investments include real estate funds that invest primarily in US commercial real estate. The fair values of the investments in this category have been estimated using the net asset value of the USG’s ownership interest in partners’ capital. These investments are less liquid and, general, cannot be redeemed with the funds through normal redemption procedures. Distributions from this fund will be received as the underlying investments of the funds are liquated. 18
GASB 72 Fair Value Measurement & Application

Acquisition value (an entry price)
The price that would be paid to acquire an asset with equivalent service potential in an orderly market transaction at the acquisition date, or the amount at which a liability could be liquidated with the counterparty at the acquisition date.
Use the acquisition value for:
• Donated capital assets
• Donated works of art, historical treasures and similar assets
• Capital assets received through a service concession arrangements.
19
GASB 72 Fair Value Measurement & Application

Net Asset Value
A fund’s NAV is its assets less liabilities often reported as a per share amount for fair value measurement purposes.
• The Net Asset Value (NAV) per share for an investment may be used by a nongovernmental entity that does not have a readily determinable fair value.
• The NAV per share must be calculated as of the government’s measurement date. (i.e. 6/30)
• Investments that are valued at net asset value per share are not subject to the fair value hierarchy and the associated disclosures by level.
20
GASB 72 Fair Value Measurement & Application

Required Note Disclosures at year-end for fair value measurements must should include:
• Level of fair value hierarchy within which the fair value measurements are categorized in their entirety (Level 1, 2, or 3).
• Description of valuation techniques used in fair value measurement.
• Change in a valuation technique that has a significant impact on the result — also disclose the reason for making the change.
• Additionally, for nonrecurring fair value measurements (for example, impaired capital assets no longer used), must be disclosed. 21
GASB 72 Fair Value Measurement & Application

• GASB 72 primarily affects Investments.
• For FY 2017 year end reporting, Institutions will use the Suntrust Fair Value Hierarchy Levels as listed in your AFR Excel Template to complete Note 2 – Backup A Investments. Each institution will update their investment data only. The hierarchy levels listed should remain the same.
• In the event an institution feels that the fair value hierarchy level for an investment should be changed, it should be discussed with Accounting & Reporting before making the change.
• The required note disclosure will also be included in Note 2. 22
GASB 72 –Major Takeaways

GSFIC Reconciliation –ARefresher
Theresa L. Jackson
University System of Georgia
Office of Fiscal Affairs, Accounting & Reporting
404-962-320723

GSFIC Spend Report
GSFIC Spend Report consist of State Capital and Non-Capital monies spent/reimbursed by GSFIC. The purpose of this report is to ensure that institutions have recorded revenue/reimbursement activity related to GSFIC, MRR, ADA, and GRA that has occurred in the current year.
• The GSFIC Spend Report is a life-to-date report which is sent out three times a year in December, May, and June for reconciliation to your books.
• As part of the AFR Review process, the GSFIC Spend Report and the MRR & ADA Spend Reports are reconciled to the Supplemental Schedule for Capital and Non-Capital and Gifts –State and the Supplemental Schedule for State, Capital and Non-Capital Gifts to ADA and MRR Project Status Reports located at the bottom of the SRECNP (Statement of Revenue, Expenses, and Changes in Net Position) at year-end to ensure that the State Capital & Non-Capital Gifts from GSFIC have been recorded correctly for the year and tie out to GSFIC.
24

GSFIC Reconciliation Spend Report
25
Project # Name of Project Institution
Type of Project
(See below for
descriptions)
Date of
Completion
on GSFIC
Report
Fiscal
Year
Posted
Total Amount
Expended as of
6-30-16
Total Amount
Expended as of
05-31-16
Difference
between 06-30-
16 and 05-31-16
CIP Reports
J-172 Computer Infrastructure Columbus State University 3 2,000,000.00 2,000,000.00 0.00
J-214 Renovate Howard Hall-Columbus Columbus State University 3 3,900,000.00 3,900,000.00 0.00
J-243 Arnold Hall Columbus State University 3 1,902,913.91 180,900.00 1,722,013.91
J-271 Academic Core Columbus State University 1 0.00 0.00 0.00
LEGEND
Types of Projects
1
3
4 GRA or TIP Projects
"D" - Indicates that GSFIC has disbursed all funds for this project
NEW PROJECTS
FY2016 Completed Projects
GSFIC Projects with total expended amount as of 6-30-16(Report sorted in Institution Order, then alpha/numberically by Project Number)
Administered by GSFIC ( Displays on original GSFIC report w ith zero value)Administered by Campus. GSFIC does not issue completed project reports for projects managed by the campuses. Please check to be sure these projects have been posted to your books as CWIP or as
capital additions.
Project # Name of Project Institution
Type of Project
(See below for
descriptions)
Date of
Completion
on GSFIC
Report
Fiscal
Year
Posted
Total Amount
Expended as of
5-31-16
Total Amount
Expended as of
6-30-15
Difference between
6-30-2015 and 12-31-
2015 CIP Reports
J-172 Computer Infrastructure Columbus State University 3 2,000,000.00 2,000,000.00 0.00
J-214 Renovate Howard Hall-Columbus Columbus State University 3 3,900,000.00 2,831,870.30 1,068,129.70
J-243 Arnold Hall Columbus State University 3 180,900.00 55,526.25 125,373.75
J-271 Academic Core Columbus State University 1 0.00 0.00 0.00
LEGEND
$1,193,503.45
Types of Projects
1
3
4 GRA or TIP Projects
"D" - Indicates that GSFIC has disbursed all funds for this project
NEW PROJECTS
FY2016 Completed Projects
GSFIC Projects with total expended amount as of 5-31-16(Report sorted in Institution Order, then alpha/numberically by Project Number)
Administered by GSFIC ( Note -displays "Y" on original GSFIC report w ith zero value)Administered by Campus. GSFIC does not issue completed project reports for projects managed by the campuses. Please check to be sure these projects have been posted to your books as CWIP or as capital
additions.

MRR & ADA Projects Spend Report
26
University System of Georgia
MRR and ADA Projects with Total
Expended Amounts as of 06-30-
2016
Total MRR Expended
through 6-30-16
(FY2016)
J-171 J-191 J-205 J-207 J-229 J-261 J-265
Columbus State University 0.00 0.00 0.00 0.00 - 488,500.00 24,300.00 512,800.00
ACTIVITY
Difference

GSFIC Spend Reports
Project Status Report (Run Frequency - Real time)
Check Detail Report (Run Frequency - Static)
27

Statement of Revenue, Expenses, and Changes in Net Position
28
FY 16 Student Tuition and Fees is now shown net of allowance for doubtful accounts and scholarship allowances.
Statement of Revenues, Expenses, and Changes in Net Position
June 30, 2016
REVENUES
Total Operating Revenues 64,593,646
EXPENSES
Total Operating Expenses 115,067,823
Operating Income (loss) (50,474,177)
NONOPERATING REVENUES (EXPENSES)
Gifts 304,771
Net Nonoperating Revenues 50,875,426
Income (Loss) Before Other
Revenues, Expenses, Gains, or
Losses 401,249
Capital Grants and Gifts
State 3,899,597
Other 217,505
Total Other Revenues, Expenses,
Gains or Losses, and Special
Item 4,117,102
Increase (Decrease) in Net Position 4,518,351
NET POSITION
COLUMBUS STATE UNIVERSTY
Supplemental Schedule for Capital and Non-Capital Grants and Gifts - State
Capital:
GSFIC or GRA capital gift revenue recognized on reimbursement basis3,469,069.00
GSFIC or GRA capital gift revenue recognized
on non-reimbursement basis (funds did not
flow through the institution)
MRR and ADA Funds - Capital (assumed all reimbursement basis) 430,528.00
Total 3,899,597.00
Non-capital (reflected in Non-operating Gift revenue):GSFIC or GRA non-capital gift revenue recognized on reimb. basisGSFIC or GRA non-capital gift revenue recognized on non-reimbursement basis (funds did not flow through the institution)MRR and ADA Funds - non-capital (assumed all reimbursement basis) 213,500.00 Total 213,500.00
Note: State Capital Grants and Gifts are broken out by reimbursed and non-reimbursed amounts for Cash Flow purposes

Reconciliation of Supplemental Schedule for State Capital and Non-Capital Gifts to GSFIC Spend Report @ 6/30/XX
29
GSFIC Capital and Non-capital gifts reported in FY2016 AFR $3,469,069.00
Plus or minus Other: (please explain below):
Total $2,915,517.00
GSFIC Spend Report @ 6/30/2016 minus balances at 6/30/2015 $2,915,517.00 0.00
Add: Amounts recognized as revenue in FY2015, that were not included in the GSFIC
6/30/2015 spend report347,661.00
Difference (Should be -0-)
Less: Amounts recognized as revenue in FY2016, but not reflected yet in GSFIC 6/30/2016
spend report
(901,213.00)
ReconciliationGSFIC Spend Report @ 5/31/16 – $1,193,503.45 (July – May activity) GSFIC Spend Report @ 6/30/16 - $ 1,722,013.91 (June activity)Agrees to final GSFIC Spend Report @ 6/30/16 Total $2,915,516.46
Agrees to AR Accrual at 6/30 current year
AR Accrual Reversal at 6/30 prior year
Adjustments/journal entries

Reconciliation of Supplemental Schedule for State Capital and Non-Capital Gifts to ADA and MRR Status Report @ 6/30/XX
30
Reconciliation of Supplemental Schedule for State Capital and non-capital gifts
to ADA and MRR Project Status Reports (total of J-170, J-171, J-191, J-205, J207) @ 6/30/16:
MRR and ADA Capital and non-capital gifts reported in FY2016 AFR $644,028.00
Plus or minus Other: (please explain below):
Total $512,800.00
$512,800.00
Difference (Should be -0-) $0.00
(131,228.00)
ADA/MRR Project Status Reports (Total of J-171; J-191, J-205, J-207, J-229, J-261, J-265);
ADA3 at 6-30-16 minus balances at 6-30-15
Less: Amounts recognized as revenue in FY2016, but not reflected yet in MRR/ADA 6-30-16
Project Status Reports
Add: Amounts recognized as revenue in FY2015, that were not included in the MRR/ADA 6-
30-15 Project Status Report
ReconciliationGSFIC Spend Report @ 6/30/16 – $512,800.00 (July – June activity) Agrees to final GSFIC Spend Report @ 6/30/16 Total $512,800.00
Agrees to AR Accrual at 6/30 current year

3-Year Comparison GSFIC Spend Report
31
$3,469,069.00 $3,248,908.00 $976,256.00
Plus or minus Other: (please explain below): Plus or minus Other: (please explain below): Plus or minus Other: (please explain below):
0.00
Total $2,915,517.00 Total $3,018,952.00 Total $868,571.00
$2,915,517.00 $3,018,952.00 $868,571.00
Difference (Should be -0-) 0.00 Difference (Should be -0-) 0.00 0.00
$644,028.00 $1,371,523.00 $1,052,232.00
Plus or minus Other: (please explain below): Plus or minus Other: (please explain below): Plus or minus Other: (please explain below):
Total $512,800.00 Total $1,550,463.00 Total $902,962.00
$512,800.00 $1,550,463.00 $902,962.00
Difference (Should be -0-) $0.00 Difference (Should be -0-) $0.00 Difference (Should be -0-) $0.00
GSFIC Capital and non-
capital gifts reported in
FY2016 AFR
2016 2015 2014
ADA/MRR Project Status
Reports (Total of J-171; J-
191, J-205, J-207, J-229, J-
261, J-265); ADA3 at 6-30-
Reconciliation of Supplemental Schedule
for State Capital and non-capital gifts
GSFIC Spend Report @
6/30/2016 minus balances
at 6/30/2015
MRR and ADA Capital and
non-capital gifts reported
in FY2016 AFR
to ADA and MRR Project Status Reports
(total of J-170, J-171, J-191, J-205, J207) @
6/30/16:
Less: Amounts recognized
as revenue in FY2016, but
not reflected yet in
MRR/ADA 6-30-16 Project
Status Reports (131,228.00)
Add: Amounts recognized
as revenue in FY2015, that
were not included in the
MRR/ADA 6-30-15 Project
Status Report
ADA/MRR Project Status
Reports (Total of J-170; J-
171; J-191, J-205, J-207) 6-
30-14 minus balances at 6-
MRR and ADA Capital and
non-capital gifts reported
in FY2014 AFR
MRR and ADA Capital and
non-capital gifts reported
in FY2015 AFR
GSFIC Spend Report @
6/30/2014 minus
balances at 6/30/2013
Reconciliation of Supplemental Schedule
for State Capital and non-capital gifts to
GSFIC Spend report @ 6/30/2016:
Less: Amounts recognized
as revenue in FY2016, but
not reflected yet in GSFIC
6/30/2016 spend report
(901,213.00)
Add: Amounts recognized
as revenue in FY2015, that
were not included in the
GSFIC 6/30/2015 spend
report 347,661.00
GSFIC Capital and non-
capital gifts reported in
FY2015 AFR
GSFIC Capital and non-
capital gifts reported in
FY2014 AFR
Reconciliation of Supplemental Schedule
for State Capital and non-capital gifts
to ADA and MRR Project Status Reports
(total of J-170, J-171, J-191, J-205, J207) @
6/30/14:
Difference (Should be -0-
Less: Amounts
recognized as revenue in
FY2014, but not reflected
yet in MRR/ADA 6-30-14
Project Status Reports (178,940.00)
Add: Amounts
recognized as revenue in
FY2013, that were not
included in the MRR/ADA
6-30-13 Project Status
Report 29,670.00
Reconciliation of Supplemental Schedule
for State Capital and non-capital gifts to
GSFIC Spend report @ 6/30/2014:
Less: Amounts
recognized as revenue in
FY2014, but not reflected
yet in GSFIC 6/30/2014
spend report(117,705.00)
Add: Amounts
recognized as revenue in
FY2013, that were not
included in the GSFIC
6/30/2013 spend report 10,020.00
ADA/MRR Project Status
Reports (Total of J-170; J-
171; J-191, J-205, J-207) 6-
30-15 minus balances at 6-
to ADA and MRR Project Status Reports
(total of J-170, J-171, J-191, J-205, J207) @
6/30/15:
Reconciliation of Supplemental Schedule
for State Capital and non-capital gifts
GSFIC Spend Report @
6/30/2015 minus balances
at 6/30/2014
Less: Amounts
recognized as revenue in
FY2015, but not reflected
yet in MRR/ADA 6-30-15
Project Status Reports
Add: Amounts
recognized as revenue in
FY2014, that were not
included in the MRR/ADA
6-30-14 Project Status
Report 178,940.00
Reconciliation of Supplemental Schedule
for State Capital and non-capital gifts to
GSFIC Spend report @ 6/30/2015:
Less: Amounts
recognized as revenue in
FY2015, but not reflected
yet in GSFIC 6/30/2015
spend report(347,661.00)
Add: Amounts
recognized as revenue in
FY2014, that were not
included in the GSFIC
6/30/2014 spend report 117,705.00

3-Year Comparison MRR-ADA Spend Report
32
$644,028.00 $1,371,523.00 $1,052,232.00
Plus or minus Other: (please explain below): Plus or minus Other: (please explain below): Plus or minus Other: (please explain below):
Total $512,800.00 Total $1,550,463.00 Total $902,962.00
$512,800.00 $1,550,463.00 $902,962.00
Difference (Should be -0-) $0.00 Difference (Should be -0-) $0.00 Difference (Should be -0-) $0.00
2016 2015 2014
gifts to ADA and MRR Project Status Reports (total of J-
170, J-171, J-191, J-205, J-207) @ 6/30/14:
to ADA and MRR Project Status Reports (total of J-170, J-171,
J-191, J-205, J-207) @ 6/30/15:
(178,940.00)
Add: Amounts recognized as
revenue in FY2013, that were not
included in the MRR/ADA 6-30-13
Project Status Report 29,670.00
ADA/MRR Project Status Reports
(Total of J-170; J-171; J-191, J-205, J-
207) 6-30-14 minus balances at 6-
30-13
ADA/MRR Project Status Reports (Total of J-171; J-
191, J-205, J-207, J-229, J-261, J-265); ADA3 at 6-30-
16 minus balances at 6-30-16
Less: Amounts recognized as revenue in
FY2015, but not reflected yet in MRR/ADA
6-30-15 Project Status Reports
Add: Amounts recognized as revenue in
FY2014, that were not included in the
MRR/ADA 6-30-14 Project Status Report178,940.00
ADA/MRR Project Status Reports (Total of J-
170; J-171, J-191, J-205, J-207); ADA3 at 6-30-
15 minus balances at 6-30-14
Less: Amounts recognized as revenue in FY2016,
but not reflected yet in MRR/ADA 6-30-16 Project
Status Reports (131,228.00)
Add: Amounts recognized as revenue in FY2015,
that were not included in the MRR/ADA 6-30-15
Project Status Report
Less: Amounts recognized as
revenue in FY2014, but not reflected
yet in MRR/ADA 6-30-14 Project
Status Reports
MRR and ADA Capital and non-capital
gifts reported in FY2015 AFR
MRR and ADA Capital and non-capital gifts
reported in FY2016 AFR
MRR and ADA Capital and non-
capital gifts reported in FY2014 AFR
Reconciliation of Supplemental Schedule for State Capital
and non-capital gifts
to ADA and MRR Project Status Reports (total of J-170, J-171, J-191, J-
205, J-207) @ 6/30/16:
Reconciliation of Supplemental Schedule for State Capital and non-
capital gifts
Reconciliation of Supplemental Schedule for State
Capital and non-capital

Acronyms/Definitions• GSFIC - The Georgia State Financing and Investment Commission was created by a constitutional
amendment in 1972, and is responsible for the proper application of proceeds from general obligation debt and the issuance of all public debt by the State. No agency or authority can incur debt or employ other financial or investment advisory counsel, without Commission approval. The Commission consists of the following divisions:
Financing and Investment Division - performs all services related to the planning, scheduling, advertising, selling and delivery of general obligation bonds. The Financing and Investment Division performs services directed by the Commission and the issuer regarding guaranteed revenue debt bond issues, manages all other state debt, handles related financial advisory matters, and prepares the annual debt management plan. Additional responsibilities include the investment and accounting of all proceeds derived from the issuance of general obligation bonds or from other amounts appropriated by the Legislature to GSFIC for capital outlay purposes.
Construction Division - provides construction management services on capital outlay projects for the various State agencies and other State entities which includes the University System of Georgia.
• GRA - GRA is an independent nonprofit (501c3) organization that works in partnership with the University System of Georgia and Georgia’s Department of Economic Development. Its partner universities include The University of Georgia, Augusta University, Emory University, Clark Atlanta University, Georgia Institute of Technology, Georgia State University, Mercer University, and Morehouse School of Medicine. GRA helps seed and shape new companies launched out of university labs — to support the state’s economic development strategy and create the companies and jobs of Georgia’s future.
• MRR – Major Repairs and Rehabilitation – A capital renewal program for state-owned facilities of the USG. The program is designed to help the USG maintain its physical plants, facilities, and infrastructure. This program is administered by the USG Office of Real Estate and Facilities.
• ADA – American Disabilities Act – The state of Georgia receives funding under the Assistive Technology Act, the Board of Regents of the University System of Georgia has determined that all institutions under the Board of Regents fall within the scope of Section 33

GSFIC Spend Report Major -Takeaways
• Request the GSFIC Spend Reports (Project Status Report and the Check Detail Report) to aid your reconciliation process
• Reconcile GSFIC/MRR expenditures on a quarterly basis to stay ahead of any potential issues
• When filling out the Reconciliation of Supplemental Schedules at the bottom of the Statement of Revenue, Expenses, and Changes in Net Position (SRECNP), do not net the amounts recognized as revenue current year with the amounts recognized as revenue in the prior year.
34

Significant Commitments: Refresher
35
Theresa L. Jackson
University System of Georgia
Office of Fiscal Affairs, Accounting & Reporting
404-962-3207

Significant Commitments - Definition
36
Commitments are agreements that will be performed in the future.
• Commitments consist of existing arrangements to enter into future obligations of the college/university to external entities for future purchases at specified prices and sometimes at specified quantities.
• Significant commitments are obligations that have not been accrued.
• (New) Institutions should only disclose Significant Commitments >$100,000.

Significant Commitments - Issues
37
Issues in the area of commitments relate to recognition of expenditures in the proper period and disclosure of future payments.
• Accruals are not commitments. They are agreements to incur an obligation in the future.
• Commitments are not recorded on the balance sheet as a liability. However, they are disclosed in the footnotes to the financial statements

Significant Commitments- Examples
• Long-term contractual obligations with suppliers for future purchases.
• Contractual obligations associated with the construction or purchase of real property or equipment, etc.
• Unconditional non-cancelable purchase obligations.
• Contractual obligations to others that will become liabilities in the future when the terms of those contracts or agreements are met.
• Non-cancellable operating lease obligations.
Do not include contracts for GSFIC-managed projects.
38

1) Determine if a commitment exists.
2) Do not record commitment if accrued in current year at 6/30/20XX.
3) Record commitments on schedule Note 12 – Significant Commitments.
4) (New) threshold established to record significant commitments. List only commitments greater than $100,000.
39
Significant Commitments -Takeaways

Subsequent Events -Refresher
40
Theresa L. Jackson
University System of Georgia
Office of Fiscal Affairs, Accounting & Reporting
404-962-3207

Subsequent Events -Definition
According to generally accepted accounting principals – a subsequent event is defined as events that occur after the balance sheet date (after fiscal year-end) which is the reporting date but before the financial statements are issued.
Examples:• Georgia State University – Turner Field Acquisition
• University System Office – Certificates of Substantial Completion issued on Student Housing Resource Projects for five campuses.
41

Subsequent Events – Two types
1. Additional Information
Events or transactions that provide additional evidence about conditions that existed at the balance sheet date.
2. New Events
Events that provide evidence about conditions that did not exist at the balance sheet date but arose subsequent to that date.
42

Subsequent Events –Disclosure Requirements
• The entity shall disclose the date through which subsequent events have been evaluated. That date is either the date the financial statements were issued or the date the financial statements were available to be used.
• Additionally, certain unrecognized subsequent events must be disclosed if omitting them would cause the financial statements to be misleading.
• For these events, the nature of the event and an estimate of its financial effect, or a statement that an estimate cannot be made, must be disclosed.
43
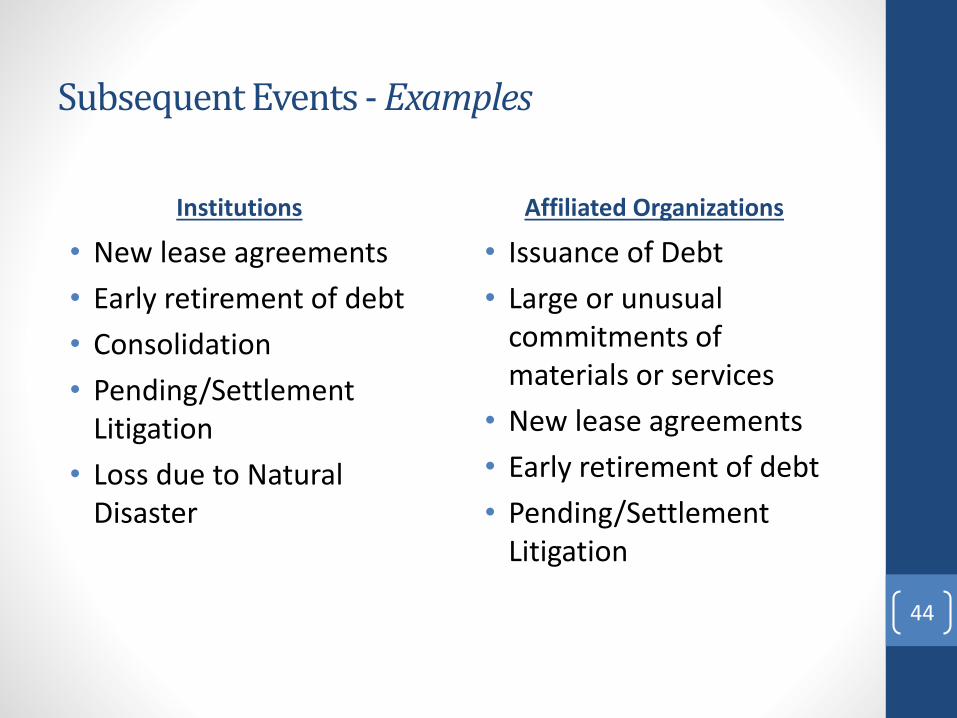
Subsequent Events - Examples
Institutions
• New lease agreements
• Early retirement of debt
• Consolidation
• Pending/Settlement Litigation
• Loss due to Natural Disaster
Affiliated Organizations
• Issuance of Debt
• Large or unusual commitments of materials or services
• New lease agreements
• Early retirement of debt
• Pending/Settlement Litigation
44

45
Theresa L. JacksonUniversity System of GeorgiaOffice of Fiscal Affairs, Accounting & [email protected]