Embed Size (px)
Citation preview

w w w . a u t o s t e e l . o r g
GAS METAL ARC WELDING OF ADVANCED HIGH STRENGTH STEEL
DEVELOPMENTS FOR OPTIMIZED WELD CONTROL AND IMPROVED WELD QUALITY
Adrian N. A. ElliottAdvanced Body Construction
Manufacturing & Processes DepartmentFord Research & Advanced Engineering

w w w . a u t o s t e e l . o r g
Benefit• AHSS (DP600) – Higher strength vs. mild steel/HSLA allows
reduced gauge of steel for frame weight saveConcern• AHSS sensitive to heat input – HAZ more significant –
mechanical property (in particular, fatigue) loss is greater
Customers:• Ford Product Development – F150 Successor
Partners:• The Lincoln-Electric Co. – Welding Equipment Supplier• Metro Technologies – Tooling & Process Development• AET Integration – Welding Optimization & Fatigue Analysis
Drivers for GMAW AHSS Collaborative Work

w w w . a u t o s t e e l . o r g
• Base Material Type and Thickness• Coating Type and Thickness• Joint Design• Fixturing and Joint Fit-Up• Power Source Type• Consumable Type• Welding Progression• Weld Length• Welding Parameters (Current, Voltage,
etc.)• Electrode Alignment• Torch Angle/Push-Drag Angle• Tip to Work Distance (CTWD)• Part Cleanliness• Equipment Maintenance
Design
Equipment Selection
Process Set-Up
Production Control
Area of concentration
Factors influencing GMAW Quality, Productivity & Cost

w w w . a u t o s t e e l . o r g
• Arc Welding affects Micro-Structure and Mechanical Properties– Effects vary with material chemistry, strain and bake temperatures
• Thermal Cycle results in a Heat Affected Zone (HAZ)– HAZ size depends on heat input and thermal transfer from joint– HAZ is more pronounced for higher strength grades– HAZ with hard/soft regions may act as metallurgical notch
Effect of GMAW on Weld Quality
w w w . a u t o s t e e l . o r g
• Carbon Steels up to and including HSLA– welded w/ high heat inputs
• AHSS more sensitive to heat input, compounded by potential for thinner gauges
– always resulted in weld wire being the strongest – with AHSS may not be
• Consider higher strength wires, but weld metal may be susceptible to brittle failure, or cored wires – new development
– impurities part of process• AHSS more sensitive to impurities
Considerations for AHSS Weld Quality

w w w . a u t o s t e e l . o r g
Factors:• Wire Feed Speed (WFS) @ 159-201 mm/s (375-475”/min)• Travel Speed (TS) @ 13.5-24.1 mm/s (32-57”/min)
– (Actual variable SQRT WFS/TS (2.89-3.45)• Voltage (varied with WFS)
– 23.8V @ 159; 24.5V @ 182; 25.0V @ 201 mm/s WFS• Contact Tip to Work Distance (CTWD) @ 12.5-19.0 mm
(0.50-0.75”)• Torch Angle (25-55º from vertical)• Push/Drag Angle (5-25º from vertical)• Wire Placement (0-2 wire diameters from joint)
Response:• Weld Profile from Laser Scan (Leg Size/Bead Convexity/Toe
Angle)• Weld Dimensions from Section (Toe Angle & Penetration)• Load to Failure (Tensile Lap-Shear)• Fatigue Life (Tensile Shear - 3 Loads, 3 Replicates, R=0.1)• Micro-Hardness Traverse/Micro-Structure
Coupon DOE #1 (Modified Cubic 3-Level 58 Runs) - DP600 3.4 mm to MS 3.8 mm

w w w . a u t o s t e e l . o r g
• 97% of the 174 samples broke at base metal (Ave load 36 kN ≡ MS UTS)• 3% remaining broke between weld metal and HAZ on MS side at lower load (Ave 33 kN)
- due to lack of fusion caused by extreme welding parameters.Samples were only runs welded with at least 4 of 5 factors below:– All 4 were the smallest weld size– All 4 welded at highest travel speeds (23-24 mm/s or 54-57 in/min)– All 4 welded w/ -2 wire placement (wire center 2 diameters from upper plate)– 3 of 4 welded w/ 25° from vertical torch angle (directs arc force/heat to bottom plate)– 3 of 4 welded w/ 5° push angle (directs more of arc force/heat into bottom plate)
• Combination of small weld with high travel speed results in lower heat input and less penetration. Locating arc out 2 wire diameters, a 25° torch angle and 5° push angle all direct less heat into upper plate.
Mild Steel base metal break
Mild Steel HAZ to weld break
Results of DOE #1 – Tensile Lap-Shear

w w w . a u t o s t e e l . o r g
Undercut: 0.59 mmToe Angle: 122.8 Degree
Run 14
Toe Angle: 120.4 Degree
Run 50
Toe Angle: 105.4 Degree
Run 19
Weld Size linked to heat input (controlled by WFS, TS and CTWD); Profile influenced by all factors
Toe-angle deemed critical for mechanical performance – assuming adequate penetration in both substrates
DOE #1 Results – Weld Size and Profile
Run Factor 1WFSmm/s ("/min)
Travel Speedmm/s ("/min)
Factor 2 SQRT(WF
S/TS)
Factor 3CTWDmm (")
Factor 4Torch Angle
º
Factor 5Push/Drag
Angleº
Factor 6Wire
Placementdiams.
VoltageV
Average Current
A
Heat InputJ/mm
14 159 (375) 19.1 (45.0) 2.89 19.1 (0.75) 55 5 -2 23.8 267 335.3450 201 (475) 16.9 (40.0) 3.45 14.2 (0.56) 55 25 0 25.0 342 505.6919 191 (450) 16.1 (38.0) 3.45 12.5 (0.50) 25 5 0 24.2 361 545.68

w w w . a u t o s t e e l . o r g
Microhardness Traverse of Samples with Three Different Heat Inputs
100
150
200
250
300
0 2 4 6 8 10 12 14 16 18 20 22 24
Distance (mm)
Mic
roha
rdne
ss (H
V500
g)
A-14 Lowest Heat Input A-50 Best High Cycle Fatigue A-19 Highest Heat Input
Heat input influences weld hardness, but not HAZ
No significant change in
DP600 hardness at
HAZ
- exists for all samples (range 165-188 HV)
DP600
Mild Steel
Weld
DOE #1 – Micro-Hardness
Run Factor 1WFSmm/s ("/min)
Travel Speedmm/s ("/min)
Factor 2 SQRT(WF
S/TS)
Factor 3CTWDmm (")
Factor 4Torch Angle
º
Factor 5Push/Drag
Angleº
Factor 6Wire
Placementdiams.
VoltageV
Average Current
A
Heat InputJ/mm
14 159 (375) 19.1 (45.0) 2.89 19.1 (0.75) 55 5 -2 23.8 267 335.3450 201 (475) 16.9 (40.0) 3.45 14.2 (0.56) 55 25 0 25.0 342 505.6919 191 (450) 16.1 (38.0) 3.45 12.5 (0.50) 25 5 0 24.2 361 545.68
w w w . a u t o s t e e l . o r g
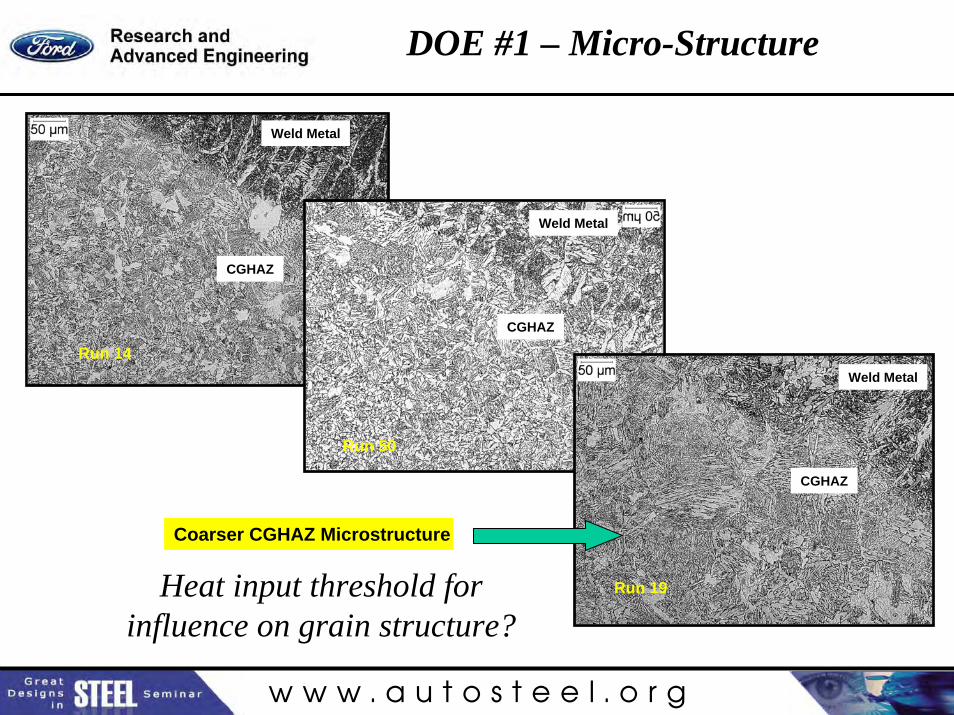
Run 14
Weld Metal
CGHAZ
Run 50
Weld Metal
CGHAZ
Run 19
Weld Metal
CGHAZ
Coarser CGHAZ Microstructure
Heat input threshold for influence on grain structure?
DOE #1 – Micro-Structure

w w w . a u t o s t e e l . o r g
Cycles to Failure
Str
ess
Ran
ge
(Mp
a)
100000010000010000
250
200
150
100
50
VariableRun 14 Lowest Heat InpurtRun 19 Highest Heat InputRun 50 Best High Cycle Fatigue
Fatigue Life of Samples with Three Different Heat Inputs
DOE #1 – Tensile Lap-Shear Fatigue relative to Heat Input
3 load levels: 8.9 kN (2000 lbf), 11.1 kN (2500 lbf) and 15.6 kN (3500 lbf) w/ R=0.1 & frequency=10 Hz• Run #19 – highest heat input - 8 of 9 samples broke at toe on DP600 side• Run #14 – lowest heat input - 7 of 9 samples broke at toe on DP600 side• Run #50 – high heat input – 5 of 9 broke at DP600 and showed highest fatigue life

w w w . a u t o s t e e l . o r g
Fatigue S-N Curve for all samples
N, Cycles to Failure
S, S
tress
Ran
ge (
MP
a )
100000010000010000
200
150
100
90
80
70
60
S 0.0444567R-Sq 80.3%R-Sq(adj) 80.2%
Regression95% CI95% PI
S-N Curvelogten(S) = 3.094 - 0.2163 logten(N)
Equal distribution of Type A (DP600) & B (mild steel) failures

w w w . a u t o s t e e l . o r g
DOE #1 – Effect of Weld Geometry and Heat Input on Fatigue Life
Run Factor 1WFSmm/s ("/min)
Travel Speedmm/s ("/min)
Factor 2 SQRT(WF
S/TS)
Factor 3CTWDmm (")
Factor 4Torch Angle
º
Factor 5Push/Drag
Angleº
Factor 6Wire
Placementdiams.
VoltageV
Average Current
A
Heat InputJ/mm
14 159 (375) 19.1 (45.0) 2.89 19.1 (0.75) 55 5 -2 23.8 267 335.3450 201 (475) 16.9 (40.0) 3.45 14.2 (0.56) 55 25 0 25.0 342 505.6919 191 (450) 16.1 (38.0) 3.45 12.5 (0.50) 25 5 0 24.2 361 545.6836 201 (475) 24.1 (57.0) 2.89 19.1 (0.75) 25 5 -2 25.7 318 339.69
Cycles to Failure
Stre
ss R
ange
(M
pa)
100000010000010000
250
200
150
100
50
VariableRun 14 Lowest Heat InpurtRun 19 Highest Heat InputRun 36 Improper Weld GeometryRun 50 Desired Weld Geometry
Fatigue Life of Samples with Different Weld Geometry and Heat Inputs
Toe Angle: 129.3 Degree
Run 36
Tensile broke between MS Weld
& HAZ

w w w . a u t o s t e e l . o r g
1. Correlation of Fatigue Life to Weld Dimensions– Input: Vertical Leg Size, Toe Angle, Max Top Plate Penetration, Max
Bottom Plate Penetration, Horizontal Leg Size, Upper Fusion-Line Angle– Output: Fatigue Life/Location at 8.9, 11.1, 15.6 kN (2000, 2500, 3500 lbf)
2. Correlation of Weld Dimensions to Welding Variables– Input: WFS, WFS/TS Ratio, CTWD, Torch Angle, Push Angle, Wire
Placement– Output: Vertical Leg Size, Horizontal Leg Size, Toe Angle, Max Bottom
Plate Penetration, Max Top Plate Penetration, Undercut, Upper Fusion-Line Angle, Min Hardness in DP600 HAZ region
3. Correlation of Fatigue Life to Welding Variables– Input: WFS, TS, CTWD, Torch Angle, Push Angle, Wire Placement– Output: Fatigue Life at 8.9, 11.1, 15.6 kN (2000, 2500, 3500 lbf)
DOE #1 – Models relating Effect of Weld Geometry and Variables on Fatigue

w w w . a u t o s t e e l . o r g
• Fatigue life – 8.9 kN (2000 lb) load (Response Surface Linear Model R-Sq = 0.65) increases w/– increasing vertical leg size– decreasing bottom plate (DP600) penetration– decreasing top plate (Mild Steel) penetration– decreasing upper fusion line angle
• Failure location at 8.9 kN (2000 lb) load more likely to be in mild steel base metal w/– decreasing vertical leg size– increasing horizontal leg size
• Fatigue life – 15.6 kN (3500 lb) load (Response Surface Linear Model R-Sq = 0.56) increases w/– increasing vertical leg size– increasing bottom toe angle– decreasing bottom plate (DP600) penetration
• Failure location at 15.6 kN (3500 lb) load more likely to be in mild steel base metal w/– decreasing vertical leg size– increasing bottom toe angle– increasing bottom plate (DP600) penetration– increasing horizontal leg size
DOE #1 – Model (#1) relating Effect of Weld Geometry on Fatigue Life

w w w . a u t o s t e e l . o r g
Sample ID: 50 A-3
Vertical Leg 3.89 mm; Horizontal Leg 5.87 mm; Toe Angle 129º; Bottom Plate Penetration 47%Top Plate Penetration 0.59 mm
High Cycle Fatigue: 221,112 cyclesFailure Location: DP600 Toe
DOE #1 – Model (#1) - Effect of Weld Geometry on Fatigue – Failure Mode
Primary crack initiates at weld toe on DP600 and propagates in DP600 (Type A)

w w w . a u t o s t e e l . o r g
Primary crack initiates at weld root and propagates in HAZ and/or weld metal on mild steel side (Type B)
Sample ID: 32B-6
Vertical Leg 3.86 mm; Horizontal Leg 6.10 mm; Toe Angle 137º; Bottom Plate Penetration 53%Top Plate Penetration 0.66 mm
High Cycle Fatigue: 198,503 cyclesFailure Location: Weld Root & Mild Steel HAZ
DOE #1 – Model (#1) Effect of Weld Geometry on Fatigue – Failure Mode
w w w . a u t o s t e e l . o r g
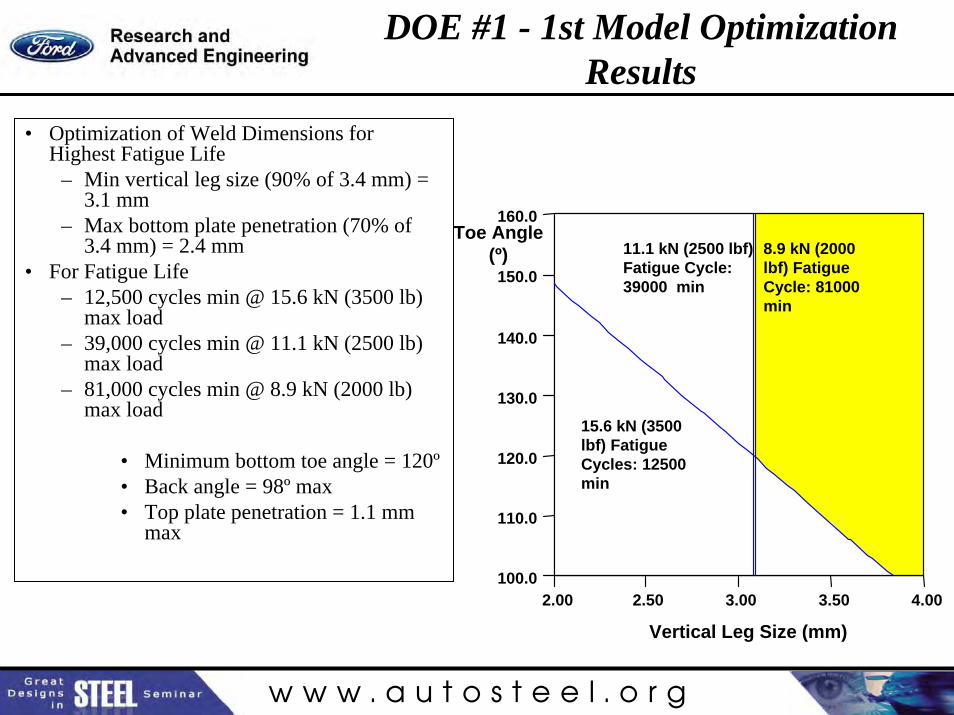
• Optimization of Weld Dimensions for Highest Fatigue Life
– Min vertical leg size (90% of 3.4 mm) = 3.1 mm
– Max bottom plate penetration (70% of 3.4 mm) = 2.4 mm
• For Fatigue Life – 12,500 cycles min @ 15.6 kN (3500 lb)
max load– 39,000 cycles min @ 11.1 kN (2500 lb)
max load– 81,000 cycles min @ 8.9 kN (2000 lb)
max load
• Minimum bottom toe angle = 120º• Back angle = 98º max• Top plate penetration = 1.1 mm
max
Vertical Leg Size (mm)
2.00 2.50 3.00 3.50 4.00100.0
110.0
120.0
130.0
140.0
150.0
160.0
15.6 kN (3500 lbf) Fatigue Cycles: 12500 min
11.1 kN (2500 lbf) Fatigue Cycle: 39000 min
8.9 kN (2000 lbf) Fatigue Cycle: 81000 min
Toe Angle(º)
DOE #1 - 1st Model Optimization Results

w w w . a u t o s t e e l . o r g
• Bottom Plate Penetration (linear model R-Sq = 0.78) decreases with– decreasing wire feed speed (WFS)– increasing contact tip to work distance (CTWD)– increasing torch angle– increasing push/drag angle– decreasing wire placement away from joint
Vertical leg size in mild steel (linear model R-Sq = 0.39) increases with• increasing WFS/TS ratio• decreasing wire placement away from jointHorizontal Leg (2 factor interaction R-Sq = 0.79 - lack of fit) increases with• decreasing WFS• increasing WFS/TS Ratio • increasing push angles• increasing wire placement away from jointBottom Toe Angle - DP600 (quadratic model R-Sq = 0.76) increases with• decreasing WFS• increasing WFS/TS ratio at larger torch angles• increasing CTWD
Model #2 Summary - Effect of Weld Variables on Weld Dimensions

w w w . a u t o s t e e l . o r g
Toe Angle increases with lower WFS and higher WFS/TS ratios
Toe AngleX = A: Wire Feed SpeedY = B: SQRT(WFS/TS)
Actual FactorsC: CTWD = 12.50D: Torch Angle = 40E: Push/Drag Angle = 15F: Wire Placement = -2
124.2
126.8
129.5
132.1
134.8
Toe
Ang
le
159.00
169.50
180.00
190.50
201.00 2.89
3.03
3.17
3.31
3.45
A: Wire Feed Speed B: SQRT(WFS/TS)
DOE #1 – Statistical Significance of Factors on Weld Geometry (Toe Angle) from Laser Scan
ANOVA for Response Surface Reduced Cubic ModelAnalysis of variance table [Partial sum of squares]
Sum of Mean F P ValueSource Squares DF Square Value Prob > FModel 6522.46 28.00 232.95 13.86 < 0.0001 significant
A 485.35 1 485.35 28.88 < 0.0001B 481.18 1 481.18 28.63 < 0.0001C 471.06 1 471.06 28.03 < 0.0001D 101.84 1 101.84 6.06 0.0202E 598.50 1 598.50 35.62 < 0.0001F 1012.71 1 1012.71 60.26 < 0.0001
Lack of Fit 416.63 23 18.11 1.68 0.2960 not significantPure Error 53.90 5 10.78
Std. Dev. 4.10 R-Squared 0.93Mean 127.37 Adj R-Square 0.87C.V. 3.22 Pred R-Squar 0.69
"Pred R-Squared" of 0.6883 is in reasonable agreement with "Adj R-Squared" of 0.8654.

w w w . a u t o s t e e l . o r g
• Fatigue life at 8.9 kN (2000 lb) load (RSM 2FI Model R-Sq = 0.73) increases w/– decreasing WFS– increasing WFS/TS ratio (decreasing travel speed)– increasing torch angle at high push angles– increasing push angle at higher WFS/TS ratios and/or torch angles– wire placement based on WFS/TS ratio
• Fatigue life at 15.6 kN (3500 lb) load (Response Surface 2FI Model R-Sq = 0.73) increases with– decreasing WFS– increasing WFS/TS ratio (decreasing TS -
more so at larger wire placements)– increasing CTWD– increasing torch angle– increasing push angle at high torch angles– wire placement based on WFS/TS ratio– increasing wire placement at large push angles
DESIGN-EXPERT Plot
8.9 kN (2000 lbf) Fatigue CyclesX = B: SQRT(WFS/TS) RatioY = F: Wire placement
Actual FactorsA: WFS = 180C: CTWD = 15.87D: Torch Angle = 40.00E: Push/Drag Angle = 15.00
8.9 kN (2000 lbf) Fatigue Cycles
B: SQRT(WFS/TS) Ratio
F: W
ire p
lacem
ent
2.89 3.03 3.17 3.31 3.45
-2.00
-1.50
-1.00
-0.50
0.00
105000
120000
135000 150000
165000
180000
DOE #1 – Model (#3) relating Effect of Weld Variables on Fatigue Life

w w w . a u t o s t e e l . o r g
Weld Leg (Upper) Size and Toe Angle both significant as
regards Fatigue Life
DOE #1 – Process Window (WFS/TS) w/ defined Weld Leg for max Fatigue Strength (8.9 kN)DESIGN-EXPERT Plot
Overlay PlotDesign Points
X = A: WFSY = B: SQR (WFS/TS)
Actual FactorsC: CTWD = 0.63D: Torch Angle = 40.00E: Push Angle = 15.00F: Wire Placement = -1.00
Overlay Plot
A: WFS (mm/s)
B: S
QR
(WFS
/TS)
158.75 169.31 179.88 190.44 201.00
2.89
3.03
3.17
3.31
3.45
Fatigue: 125000
Travel Speed: 16.9
Travel Speed: 21.2
Weld Leg 1: 3.4
22
375 425 “/min
TS: 16.9 mm/s (40 “/min)
TS: 21.2 mm/s (50 “/min)
475
“/15.9 mm

w w w . a u t o s t e e l . o r g
Actual FactorsC: CTWD = 0.63D: Torch Angle = 40E: Push/Drag Angle = 15
F: Wire Placement = -1
Overlay Plot
Wire Feed Speed
SQRT(WFS/TS)
375 400 425 450 475
2.89
3.03
3.17
3.31
3.45
Travel S 31.9744Max Bot 1.40969Vertical 3.91586Toe Angl 142.848X 375.18Y 3.43
Travel S 44.9434Max Bot 1.41165Vertical 3.29361Toe Angl 136.128X 375.51Y 2.89
Travel S 54.9922Max Bot 2.1518Vertical 3.09965Toe Angl 130.411X 474.33Y 2.94
Travel S 42.2076Max Bot 1.74398Vertical 3.49635Toe Angl 136.197X 425.07Y 3.18
Travel S 39.9412Max Bot 2.1518Vertical 3.68464Toe Angl 135.438X 474.33Y 3.45
Run 1 Run 2 Run 3 Run 4 Run 5WFS (ipm) 425 375 375 475 475Travel Speed (ipm) 42 32 45 40 55
Optimum
Run 4
Run 1
Run 2Conclusions• Fatigue Life of Lap welded joint between DP600 3.4 mm and
Mild Steel 3.8 mm increased by:– decreasing Wire Feed Speed– decreasing Travel Speed– Increasing CTWD– Increasing Torch Angle– Increasing Push Angle– Increasing Wire Placement away from joint (linked to other parameters)
Run 5
Run 3Further Work• Continued DOE’s using DP600 to thicker (4.7 mm) and thinner
(2.7 mm) mild steel, and DP600 to itself –– Based on process optimization from DOE #1
DOE #2: DP600 3.4 mm/M1A33 4.7 mm – DOE Design
DOE #1 Conclusions & Further Work

w w w . a u t o s t e e l . o r g
Thank You
GMAW of AHSS forQuality, Productivity & Cost


![Journal of American Science 0203arc welding, atomic hydrogen welding, shielded metal arc welding, plasma arc welding, electroslag welding, etc. Arc welding has been described [3] to](https://img.pdfslide.us/doc/110x75/5ec0a6e76045b75960496969/journal-of-american-science-arc-welding-atomic-hydrogen-welding-shielded-metal.jpg)