Embed Size (px)
Citation preview

Gas-liquid solid foam reactors : hydrodynamics and masstransferStemmet, C.P.
DOI:10.6100/IR635735
Published: 01/01/2008
Document VersionPublisher’s PDF, also known as Version of Record (includes final page, issue and volume numbers)
Please check the document version of this publication:
• A submitted manuscript is the author's version of the article upon submission and before peer-review. There can be important differencesbetween the submitted version and the official published version of record. People interested in the research are advised to contact theauthor for the final version of the publication, or visit the DOI to the publisher's website.• The final author version and the galley proof are versions of the publication after peer review.• The final published version features the final layout of the paper including the volume, issue and page numbers.
Link to publication
Citation for published version (APA):Stemmet, C. P. (2008). Gas-liquid solid foam reactors : hydrodynamics and mass transfer Eindhoven:Technische Universiteit Eindhoven DOI: 10.6100/IR635735
General rightsCopyright and moral rights for the publications made accessible in the public portal are retained by the authors and/or other copyright ownersand it is a condition of accessing publications that users recognise and abide by the legal requirements associated with these rights.
• Users may download and print one copy of any publication from the public portal for the purpose of private study or research. • You may not further distribute the material or use it for any profit-making activity or commercial gain • You may freely distribute the URL identifying the publication in the public portal ?
Take down policyIf you believe that this document breaches copyright please contact us providing details, and we will remove access to the work immediatelyand investigate your claim.
Download date: 25. May. 2018

Gas-liquid Solid Foam Reactors:Hydrodynamics and Mass Transfer
PROEFSCHRIFT
ter verkrijging van de graad van doctor aan deTechnische Universiteit Eindhoven, op gezag van deRector Magnificus, prof.dr.ir. C.J. van Duijn, voor een
commissie aangewezen door het College voorPromoties in het openbaar te verdedigen opdonderdag 4 september 2008 om 16.00 uur
door
Charl Philip Stemmet
geboren te Durban, Zuid-Afrika

Dit proefschrift is goedgekeurd door de promotor:
prof.dr.ir. J.C. Schouten
Copromotoren:dr.ir. B.F.M. Kusterendr.ir. J. van der Schaaf
The work described in this thesis was financed by the Dutch Technology Foundation(STW). Financial support from ABB Lummus Global Inc., DSM Research B.V., BASFNederland B.V. (formally Engelhard De Meern B.V.), and Shell Global SolutionsInternational B.V. is gratefully acknowledged.
A catalogue record is available from the Library Eindhoven University of Technology
Gas-liquid Solid Foam Reactors: Hydrodynamics and Mass Transfer / by C.P. StemmetProefschrift.– ISBN 978-90-386-1326-0
Trefwoorden: chemische reactoren, gepakt bed, gestructuteerde pakking, fysischetransport verschijnselen, stoftransport, meerfase stroming, hydrodynamica, vloeistoffractie
Subject headings: Chemical reactors; packed beds; structured packing / physicaltransport phenomena; mass transfer / multiphase flow / hydrodynamics; liquid holdup

dedicated to my mother, my family, and my friends


Summary
Gas-liquid Solid Foam Reactors:
Hydrodynamics and Mass Transfer
In the field of reactor engineering the chemical industry continually strives for more ef-
ficient reactors and in doing so considers the use of more advanced packing materials to
optimize and intensify packed bed reactors to desired process conditions. Reactor pack-
ings which act as a support for the catalyst are either randomly placed in the reactor such
as the conventional dumped packings (spherical particles, Raschig rings, Berl saddels,
etc.) or structured to fill up the complete reactor volume such as structured packings
(Katapak-S, monoliths, etc.). In the advancement of these reactor packings the goal is to-
wards reducing the volume fraction of the reactor filled with solid thereby reducing the
frictional pressure drop, while maintaining high packing surface area to volume ratio’s
(specific area) to accommodate high rates of mass transfer towards the catalytic surface.
L
G
Packed
Bed
L G
Packed
Bed
L G
Packed
Bed
(a) (b) (c)
Figure 1: Schematic representation of the direction of the gas (G) and liquid (L) in a packed bedwith the gas and liquid flowing either counter-currently, (a), or co-currently up, (b), or co-currentlydown, (c).
This thesis deals with the hydrodynamics and gas-liquid mass transfer when the pack-
ing is changed from the conventional packed bed or structured packings to solid foam

vi Summary
packings which is an new structured packing considered for multiphase flow. These solid
foams have the advantage of a high surface area (for catalyst deposition and generation of
gas-liquid mass transfer area) and of a high voidage, which decreases the frictional pres-
sure drop and hence enhances the reactor efficiency. These foams are characterized by a
uniform cell size, and may be viewed as the inverse of a packed bed.
In the counter-current flow configuration a low liquid holdup regime (trickle bed) and
two high liquid holdup regimes (bubble and pulse) have been studied (Chapter 2) for 5,
20 and 40 ppi solid foam packings. The liquid holdup has been studied experimentally
and been modeled using the relative permeability model (Saez and Carbonell, 1985). This
model was originally used to describe the liquid holdup for different gas and liquid ve-
locities in conventional packings but also describes the liquid holdup in all three regimes
for solid foam packings. The total pressure drop has been obtained experimentally and
found to be much lower than packed beds of spherical particles. The flooding points have
been determined for counter-current flow and found to be similar to Katapak-S packings.
An estimate has been made for the gas-liquid mass transfer coefficient using penetration
theory and values of kLaGL in the order of 6 s−1 have been found.
The co-current flow configuration has been studied for 10 and 40 ppi solid foam pack-
ings (Chapter 3) and experimentally a bubble regime and a pulse regime (at gas velocities
higher than 0.3 m s−1) was observed. A high degree of axial dispersion was found to affect
the gas-liquid mass transfer, but in solid foams packings the axial dispersion is quite low,
and plug flow can be assumed. The gas-liquid mass transfer coefficient was found exper-
imentally to increase with increasing liquid and gas velocities, up to a maximum value of
1.3 s−1. An estimate of the intrinsic liquid-side mass transfer coefficient, kL, showed it to be
increasing only with increasing liquid velocity. Increasing the gas velocity increasing the
available gas-liquid area for mass transfer (by the decrease in liquid holdup). The value
of kL was found to decrease with increasing ppi number (smaller pores) of the solid foam
packing but the value of kLaGL remains constant (higher aGL for smaller pores). The gas-
liquid mass transfer coefficient is compared to monoliths and packed bed micro-reactors
in terms of a parameter known as the frictional energy dissipation, EL (= PfuLε−1
L ) and all
are found to correlate according to: kLaGLεL = 0.0134(EL)0.44.
The co-current downflow of gas-liquid flow was studied (Chapter 4) and the trickle
regime investigated. The gas-liquid mass transfer coefficient increased with increasing
liquid velocity and decreased with increasing ppi number (smaller pores) of the solid foam
packing. The value of the gas-liquid mass transfer coefficient for 10 ppi solid foam was
described by a correlation similar to Sherwood and Holloway (1940) for packed beds and
Raschig rings. The value of kL was estimated to be a factor 10 smaller than in the upflow
regime.
The liquid properties (the liquid viscosity, µL, and the liquid surface tension, σL) have
a large influence on the resulting hydrodynamics and gas-liquid mass transfer and are
studied in the co-current flow configurations (upflow and downflow) for gas-liquid flow
(Chapter 5). The gas-liquid mass transfer coefficient is correlated in the co-current flow
configuration to the gas and liquid velocities and liquid properties according to:
Upflow: kLaGL εLDL−1 = 311u0.44
G (uLρLµL−1)
0.92(ScL)0.5 [SI units, mL m−3
P ], and

Summary vii
Downflow: kLaGL εLDL−1 = 3.7 (uLρLµL
−1)1.16
(ScL)0.5 [SI units, mL m−3
P ],
where increases in the liquid viscosity, µL, are accounted for by the dimensionless Schmidt
number, ScL. In the co-current upflow configuration the gas-liquid mass transfer coeffi-
cient is correlated to a parameter describing the energy dissipation (the frictional pressure
drop) with increases in the liquid viscosity accounted for by the Schmidt number:
Upflow: kLaGL εL(ScL/ScWater)0.69 = 2.05 × 10⁻⁴ (Pf)
0.8 [SI units, m3L m−3
P s−1]
The decrease in the liquid surface tension (from 72 N m−1 to 56 N m−1 ) increases the
gas-liquid mass transfer coefficient by a factor of 6 studied in the co-current downflow
configuration.
Aluminum foam packings (93 % voidage) were used to study the hydrodynamics and
gas-liquid mass transfer but are not as chemically inert as carbon foam packings (97%
voidage). A comparison was made in the co-current upflow configuration to test the in-
fluence of the type of material (and the voidage of solid foam packings), Chapter 6. This
showed that there was no influence of the type of the material (nor the voidage) on the in-
trinsic mass transfer coefficient, kL. A difference however was found in the liquid holdup
and frictional pressure drop for the two different solid foam materials, resulting in slightly
lower mass transfer coefficients for the carbon foam packings. This difference could not be
described by differences in the hydrophobicity of the materials as the three phase contact
angle of the materials, a measure of a liquid to form droplets or spread evenly over the
solid, was found to be similar. The 10 ppi solid foam packing can be used as catalyst sup-
port for catalyst support for glucose oxidation over a palladium catalyst. The conversions
in a reactor packed with solid foam packing and with conventional spherical particles
have been compared. The reactors are all kinetically limited due to the low surface area
for catalyst deposition considering a non-porous support. The addition of a washcoat
layer (in the order of 1 µm thickness) increases the surface area for catalyst deposition and
hence mass transfer limited reactors may be obtained. In the co-current downflow (trickle
flow) the solid foam packings can achieve similar reaction rates than in a conventional
packed bed. This conversion is achieved at a factor ten lower frictional pressure drop and
hence factor ten lower energy dissipation. In the co-current upflow configuration the solid
foam packings can achieve half the rate of reaction as in a conventional packed bed oper-
ated in upflow, however, at a factor ten lower frictional pressure drop. This indicates that
solid foam packed beds operate more energy efficient than the conventional packed bed
of spherical particles. This is due to the high voidage of the solid foam packings.


List of Symbols
Roman Symbols
A constant in the viscous term of the Ergun equation -
aGL interfacial gas-liquid area per unit volume of liquid m2L m−3
L
aP packing surface area per unit volume m2P m−3
P
B constant in the inertial term of the Ergun equation -
BoL Liquid Bodenstein number, uLZ/(Dax,LεL) -
CG concentration in the gas phase mol m−3
G
CL concentration in the liquid phase mol m−3
L
de strut length m
DL diffusivity in the liquid, typically 1 · 10−9 m2L s−1
dm strut diameter mm
De effective diffusivity m3L m−1
S s−1
Dax,G axial dispersion coefficient in the gas phase m2P s−1
Dax,L axial dispersion coefficient in the liquid phase m2P s−1
EL energy dissipation per unit volume of reactor W m −3
P
Eo∗ modified Eotvos number, ρLgd2eε/σ (1 − ε)2 -
Fα interfacial force kg m−1 s−1
fα relative permeability -
Fr Froude number, (εαvα)2/(deg) -
g acceleration due to gravity m2 s−1
Gaα Galileo number, ρ2αgd3
eε3/(µ2
α(1 − ε)3 -
GaG Galileo number of the gas, ρ2
Ggd3eε
3/(µ2
L(1 − ε)3) -
GaL Galileo number of the liquid, ρ2
Lgd3eε
3/(µ2
L(1 − ε)3) -

x List of Symbols
H Henry coefficient m3L Pa mol−1
h1,2 constants in Equation 2.7 and Equation 5.2
kL liquid-side mass transfer coefficient mL s−1
kir intrinsic reaction rate coefficient in Equation 6.3 m3
L s−1 mol−1
Cat
Lt loading of catalyst on the solid molCat kg−1
S
M molar mass kg mol−1
m1,2 constants in Equation 5.15 -
N number of pores per inch (ppi) of the solid foam packing inch−1
n constant in Equation 4.1 -
n1,2 constants in Equation 5.7 -
Pf frictional pressure drop per unit height of packing Pa m−1
P
R universal gas constant, 8.314 m3 Pa K−1 mol−1
r reaction rate mol m−3
P s−1
Reα Reynolds number, ραεαvαde/(µα (1 − ε)) -
ReG Reynolds number of the gas, ρGuGde/(µG (1 − ε)) -
ReL Reynolds number of the liquid, ρLuLde/(µL (1 − ε)) -
Sα saturation -
Scα Schmidt number, µα/(Dαρα) -
Shα Sherwood number, kαde/Dα -
ShL Sherwood number of the liquid, kLde/DL -
te exposure time s
uα superficial velocity m3α m−2
P s−1
uG superficial gas phase velocity m3
G m−2
P s−1
uL superficial liquid phase velocity m3L m−2
P s−1
vα intersticial velocity, vα = uα/εα mP s−1
WeL Weber number of the liquid, ρLu2
Lde/(σL (1 − ε)) -
Z total length of packing mP
Greek Symbols
β constant in Equation 5.15 -

List of Symbols xi
γ constant in Equation 5.8 -
δ layer thickness m
ε voidage of the solid foam material, ε = εL + εG = 1 − εS m3
void m−3
P
εα holdup of the liquid or gas phase m3α m−3
P
εG gas holdup m3
G m−3
P
εL liquid holdup m3L m−3
P
η effectiveness factor -
λ constant in Equation 5.7 -
µG gas viscosity Pa s
µL liquid viscosity Pa s
ρG gas density kg m−3
G
ρL liquid density kg m−3
L
σL liquid surface tension N m−1
τ tortuosity factor m2L m−2
S
τi shear stress at the gas-liquid interface N m−2
GL
φ Thiele modulus -
χ tortuosity of the strands -
Superscripts
0 at static conditions
α gas or liquid phase as given in Chapter 2
I inlet
O outlet
Subscripts
G gas phase
L liquid phase
P packing
S solid phase
W washcoat


Table of Contents
Summary v
List of Symbols ix
1 Introduction 1
1.1 Conventional packings . . . . . . . . . . . . . . . . . . . . . . . . . . . . . . . 1
1.1.1 Random packings . . . . . . . . . . . . . . . . . . . . . . . . . . . . . . 1
1.1.2 Structured packings . . . . . . . . . . . . . . . . . . . . . . . . . . . . 2
1.2 Solid foam packings . . . . . . . . . . . . . . . . . . . . . . . . . . . . . . . . 3
1.3 Geometric surface area . . . . . . . . . . . . . . . . . . . . . . . . . . . . . . . 4
1.4 Gas-liquid flow through packings . . . . . . . . . . . . . . . . . . . . . . . . . 5
1.5 Scope and outline of the thesis . . . . . . . . . . . . . . . . . . . . . . . . . . . 7
Appendix: Unit cell model . . . . . . . . . . . . . . . . . . . . . . . . . . . . . . . . 9
2 Hydrodynamics and modeling of mass transfer for counter-current flow 13
2.1 Introduction . . . . . . . . . . . . . . . . . . . . . . . . . . . . . . . . . . . . . 14
2.1.1 Mass transfer . . . . . . . . . . . . . . . . . . . . . . . . . . . . . . . . 14
2.1.2 Liquid holdup models . . . . . . . . . . . . . . . . . . . . . . . . . . . 16
2.2 Experimental . . . . . . . . . . . . . . . . . . . . . . . . . . . . . . . . . . . . 17
2.2.1 Static liquid holdup . . . . . . . . . . . . . . . . . . . . . . . . . . . . 19
2.2.2 Low liquid holdup - trickle flow . . . . . . . . . . . . . . . . . . . . . 20
2.2.3 High liquid holdup . . . . . . . . . . . . . . . . . . . . . . . . . . . . . 20
2.3 Results . . . . . . . . . . . . . . . . . . . . . . . . . . . . . . . . . . . . . . . . 20
2.3.1 Static liquid holdup . . . . . . . . . . . . . . . . . . . . . . . . . . . . 20
2.3.2 Liquid flow regimes . . . . . . . . . . . . . . . . . . . . . . . . . . . . 21
2.3.3 Liquid holdup . . . . . . . . . . . . . . . . . . . . . . . . . . . . . . . . 23
2.3.4 Liquid holdup modeling . . . . . . . . . . . . . . . . . . . . . . . . . . 24
2.3.5 Flooding . . . . . . . . . . . . . . . . . . . . . . . . . . . . . . . . . . . 26
2.3.6 Pressure drop . . . . . . . . . . . . . . . . . . . . . . . . . . . . . . . . 26
2.3.7 Mass transfer modeling results . . . . . . . . . . . . . . . . . . . . . . 27
2.4 Conclusions . . . . . . . . . . . . . . . . . . . . . . . . . . . . . . . . . . . . . 28
3 Hydrodynamics and mass transfer for co-current upflow 31
3.1 Introduction . . . . . . . . . . . . . . . . . . . . . . . . . . . . . . . . . . . . . 32
3.1.1 Overall volumetric mass transfer . . . . . . . . . . . . . . . . . . . . . 32
3.2 Experimental . . . . . . . . . . . . . . . . . . . . . . . . . . . . . . . . . . . . 33

xiv Table of Contents
3.2.1 Liquid holdup . . . . . . . . . . . . . . . . . . . . . . . . . . . . . . . . 34
3.2.2 Liquid axial dispersion coefficient . . . . . . . . . . . . . . . . . . . . 35
3.2.3 Mass transfer coefficient . . . . . . . . . . . . . . . . . . . . . . . . . . 35
3.2.4 Frictional pressure drop . . . . . . . . . . . . . . . . . . . . . . . . . . 36
3.3 Results and discussion . . . . . . . . . . . . . . . . . . . . . . . . . . . . . . . 36
3.3.1 Liquid holdup . . . . . . . . . . . . . . . . . . . . . . . . . . . . . . . . 36
3.3.2 Frictional pressure drop . . . . . . . . . . . . . . . . . . . . . . . . . . 37
3.3.3 Overall mass transfer coefficient . . . . . . . . . . . . . . . . . . . . . 37
Effect of liquid phase axial dispersion coefficient . . . . . . . . . . . . 37
Entrance and exit effects . . . . . . . . . . . . . . . . . . . . . . . . . . 38
Effect of liquid velocity . . . . . . . . . . . . . . . . . . . . . . . . . . 39
Effect of ppi number . . . . . . . . . . . . . . . . . . . . . . . . . . . . 40
3.3.4 Comparison with other packings . . . . . . . . . . . . . . . . . . . . . 41
3.4 Conclusions . . . . . . . . . . . . . . . . . . . . . . . . . . . . . . . . . . . . . 43
4 Hydrodynamics and mass transfer for co-current downflow 45
4.1 Introduction . . . . . . . . . . . . . . . . . . . . . . . . . . . . . . . . . . . . . 46
4.1.1 Gas-liquid mass transfer coefficient . . . . . . . . . . . . . . . . . . . 46
4.2 Experimental . . . . . . . . . . . . . . . . . . . . . . . . . . . . . . . . . . . . 47
4.3 Results and discussion . . . . . . . . . . . . . . . . . . . . . . . . . . . . . . . 49
4.3.1 Liquid holdup . . . . . . . . . . . . . . . . . . . . . . . . . . . . . . . . 49
4.3.2 Gas-liquid mass transfer coefficient . . . . . . . . . . . . . . . . . . . 50
4.3.3 Intrinsic liquid-side mass transfer coefficient . . . . . . . . . . . . . . 51
4.4 Conclusions . . . . . . . . . . . . . . . . . . . . . . . . . . . . . . . . . . . . . 52
5 Influence of liquid viscosity and surface tension on the hydrodynamics and masstransfer in co-current flow configurations 55
5.1 Introduction . . . . . . . . . . . . . . . . . . . . . . . . . . . . . . . . . . . . . 56
5.1.1 Frictional pressure drop . . . . . . . . . . . . . . . . . . . . . . . . . . 57
5.1.2 Gas-liquid mass transfer coefficient . . . . . . . . . . . . . . . . . . . 58
Sherwood correlation . . . . . . . . . . . . . . . . . . . . . . . . . . . 59
Energy dissipation . . . . . . . . . . . . . . . . . . . . . . . . . . . . . 59
Effect of liquid surface tension . . . . . . . . . . . . . . . . . . . . . . 61
5.2 Experimental . . . . . . . . . . . . . . . . . . . . . . . . . . . . . . . . . . . . 62
5.3 Results and discussion . . . . . . . . . . . . . . . . . . . . . . . . . . . . . . . 64
5.3.1 Co-current upflow - Effect of liquid viscosity . . . . . . . . . . . . . . 64
Liquid Holdup . . . . . . . . . . . . . . . . . . . . . . . . . . . . . . . 64
Pressure Drop . . . . . . . . . . . . . . . . . . . . . . . . . . . . . . . . 65
Gas-liquid mass transfer coefficient . . . . . . . . . . . . . . . . . . . 67
Energy dissipation . . . . . . . . . . . . . . . . . . . . . . . . . . . . . 68
5.3.2 Co-current downflow - Effect of liquid viscosity . . . . . . . . . . . . 70
Liquid Holdup . . . . . . . . . . . . . . . . . . . . . . . . . . . . . . . 70
Gas-liquid mass transfer coefficient . . . . . . . . . . . . . . . . . . . 70
5.3.3 Co-current downflow - Effect of liquid surface tension . . . . . . . . 72
Liquid holdup . . . . . . . . . . . . . . . . . . . . . . . . . . . . . . . . 72

Table of Contents xv
Gas-liquid mass transfer coefficient . . . . . . . . . . . . . . . . . . . 72
5.4 Conclusions . . . . . . . . . . . . . . . . . . . . . . . . . . . . . . . . . . . . . 74
6 Hydrodynamics and mass transfer for a gas-liquid-solid foam reactor 75
6.1 Introduction . . . . . . . . . . . . . . . . . . . . . . . . . . . . . . . . . . . . . 76
6.2 Overview of hydrodynamics . . . . . . . . . . . . . . . . . . . . . . . . . . . 76
6.2.1 Flow regimes . . . . . . . . . . . . . . . . . . . . . . . . . . . . . . . . 77
6.2.2 Liquid holdup . . . . . . . . . . . . . . . . . . . . . . . . . . . . . . . . 78
6.3 Intrinsic mass transfer coefficient . . . . . . . . . . . . . . . . . . . . . . . . . 79
6.4 Effect of material type . . . . . . . . . . . . . . . . . . . . . . . . . . . . . . . 80
6.5 Reactor comparison . . . . . . . . . . . . . . . . . . . . . . . . . . . . . . . . . 83
6.5.1 Overall reaction rate of multi-phase reactors . . . . . . . . . . . . . . 84
6.5.2 Mass transfer coefficients . . . . . . . . . . . . . . . . . . . . . . . . . 86
Spherical particles . . . . . . . . . . . . . . . . . . . . . . . . . . . . . 86
Solid foam packing . . . . . . . . . . . . . . . . . . . . . . . . . . . . . 87
6.5.3 Non-porous support . . . . . . . . . . . . . . . . . . . . . . . . . . . . 87
6.5.4 Washcoat . . . . . . . . . . . . . . . . . . . . . . . . . . . . . . . . . . . 89
6.6 Conclusions . . . . . . . . . . . . . . . . . . . . . . . . . . . . . . . . . . . . . 91
7 Perspectives 93
7.1 Conclusions . . . . . . . . . . . . . . . . . . . . . . . . . . . . . . . . . . . . . 93
7.2 Recommendations . . . . . . . . . . . . . . . . . . . . . . . . . . . . . . . . . 94
7.3 Outlook . . . . . . . . . . . . . . . . . . . . . . . . . . . . . . . . . . . . . . . . 97
Bibliography 97
List of Publications 105
Acknowledgements 107
About the author 109


Chapter 1
Introduction
The chemical industry continually strives for more cost efficient processes and in doing
so considers the use of more advanced materials to optimize and intensify processes to
desired process conditions. Reactor packings such as monoliths, cloths, foams, and other
structured packings are investigated and used for two- and three-phase flow operation
due to their improved hydrodynamic performance compared with more conventional
packings, e.g. spherical particles, Raschig rings, etc. The main advantages of these struc-
tured reactor packings are reduced pressure drop per packing height, improved hydrody-
namic properties, and a greater window of stable operating conditions. The relatively high
surface area ensures that adequate catalyst loadings may be applied. Improved gas-liquid
contacting is advantageous to avoid mass-transfer limitations under reaction conditions.
In counter-current operation, flooding, the point at which flow reversal of the liquid oc-
curs with increasing gas flow, is regarded as the limiting factor for using these packings in
real industrial processes.
1.1 Conventional packings
1.1.1 Random packings
In Figure 1.1 some of the commonly used packings are given for use as a catalyst support
in a reactor. These packings are randomly packed (dumped) in the column and not or-
dered as their structured counterparts. Liquid mal-distribution over these packings and
channeling (which may lead to hot-spot formation) are a common problem when these
types of packings are used. To increase the surface area of the packing material, aP , the
size of the packing material may be reduced, at the expense of an increased pressure drop.
However, recently packings have been introduced that have a low pressure drop (due to
the high voidage) and an increase in the specific surface area of the packing; examples of
these is the Q-pac given in Figure 1.1d (Lantec Products Inc., www.lantecp.com). This ran-
dom packing controls the pathways of the fluids in a three-dimensional structure to maxi-
mize the contact between the gas, the liquid and the solid. In the development of random
packings the trend has been towards increasing the voidage of the material, maintain-

2 Chapter 1
ing high surface areas, and towards control of the fluid movement in three-dimensional
pathways.
(a) Spherical particles (b) Raschig rings (c) Berl saddles (d) Q-pac
Figure 1.1: Schematic representation of commonly available randomly packed (dumped) reactorpackings.
1.1.2 Structured packings
(a) Monolith (b) Internallyfinned monolith
(c) Mellapak (Sulzer) (d)Katapak-S(Sulzer)
Figure 1.2: Schematic representation of commonly available structured reactor packings.
Structured packings have the advantage that they are made to fit the dimensions of
the column in which they are placed and thus avoid the mal-distribution of liquid and
formation of channeling or bypassing of the solids. Examples of these structured packing
materials are given in Figure 1.2. In monoliths and internally finned monoliths the liq-
uid and gas flows in channels created within the structured packings, while in Mellapak
the liquid and gas flow down corrugated sheets of gauze stacked to form open channels
between these sheets, and in Katapak some of the open channels are filled with spherical
particles. These packing materials however have commonly a two-dimensional structure
that redirect the liquid and gas flow to planar directions. In the development of these
packings the aim is for increasing the rather low geometrical surface area, while main-
taining a low pressure drop (high voidage) and adequate contact between the flowing
phases. However, as with conventional dumped packing, the geometric surface area of
these packings is difficult to increase without increasing the solids holdup. Solid foams

Solid foam packings 3
can be viewed as the Q-Pac equivalent to structured packings as it maintains a high ge-
ometric area with low solids holdup (and hence low pressure drop) due to its cell-like
structure.
1.2 Solid foam packings
Solid foam packings represent a generation of materials combining relatively high specific
surface area with low pressure drop per unit height. This is due largely to the open-celled
structure with relatively high voidages (up to 97%). Solid foams may be produced in a
variety of materials (metal, ceramics, carbon, SiC, polymers, etc.). The review article by
Banhart (2001) outlines the methods and procedures for producing these and many other
solid foams. The focus here, however, is only on the open-celled foams, more specifically
in the range of 5 to 40 ppi (pores per linear inch), see Figure 1.3.
(a) 5 ppi (b) 20 ppi (c) 40 ppi
Figure 1.3: Images of foam structure supplied by ERG Aerospace Corp., under the commercialname of Duocel. The white bar indicates a characteristic length scale of 5 mm.
Thus far the applications considered for these solid foam materials in the chemical
industry have been minimal. Only single phase studies have been reported on chemi-
cal reaction by Richardson et al. (2003), pressure drop by Fourie and Plessis (2002), and
axial dispersion by Montillet et al. (1993). Figure 1.11a gives the specific surface area as
a function of the voidage of the foam for the 5, 20, and 40 ppi foams from geometrical
considerations as described in the study of Fourie and Plessis (2002). Due to the high
voidage of the solid foam, the pressure drop per unit length over the packing material is
low as described in previous studies on these materials by Fourie and Plessis (2002), Smit
and Plessis (1999), and Richardson et al. (2000). Single phase axial dispersion coefficients
and laminar flow limits for solid foams were compared with conventional packings in the
studies of Montillet et al. (1993) and Seguin et al. (1998), respectively, and reduced axial
dispersion and increased laminar flow were observed.
Modeling of the viscous flow through solid foam packings has been performed in the
study by Smit and Plessis (1999). Boomsma and Poulikakos (2001), Lu et al. (1998), Bhat-
tacharya et al. (2002), and Phanikumar and Mahajan (2002) have investigated the heat

4 Chapter 1
(a) 10 ppi aluminium (b) 40 ppi aluminium (c) 45 ppi carbon
Figure 1.4: Images of solid foam packings supplied by ERG Aerospace Corp. The graduated mark-ings are in mm.
transfer properties of metal foams to be used as heat sinks or highly compact heat ex-
changers. Seijger et al. (2001) and Richardson et al. (2003) have investigated solid foams
as potential catalytic surfaces for gas phase reactions. Friedrich et al. (2004), Armalis and
Kubiliene (2000), and Deab and Saleh (2003) have considered the use of carbon solid foams
as the working electrode for an electrochemical cell, see Figure 1.4c. These studies all in-
dicate the potential for the use of these foams, also for the field of multiphase processing.
Improved gas-liquid mass transfer with solid foam packings has been outlined in the ex-
amples given in some patents concerning polyurethane foams (Ernest and Ravault, 1974;
Pretorius and Hahn, 1980).
1.3 Geometric surface area
In Figure 1.5 the geometric surface area of some common random and structured pack-
ings is presented. The geometric surface area of solid foam packings have been calculated
using the model of Fourie and Plessis (2002) using a tetrakaidecahedra to represent the
interconnected cell structure (further details given in the Appendix). Here the geomet-
ric surface area of solid foam packings can be seen to increase much higher than any of
the other packing materials with increasing ppi number of the solid foam packing. Also
the high voidage (thus low pressure drop) is maintained, ranging from 97% to 80%, de-
pending on the thickness of the struts making up the solid foam packings. The geometric
surface area of the solid foam packings also increases as the voidage is decreased (solids
holdup increasing) due to the struts making up the unit cells increasing in diameter. The
ppi number of the solid foam packings is an independent parameter to describe the aver-
age cell size and increases the geometric surface area as the cell size decreases (ppi number
increases).
The geometric surface area should however not be confused with the surface area for
the deposition of catalytically active components as this surface area (often measured with
BET physisorption and referred to as BET surface area) includes also contributions from

Gas-liquid flow through packings 5
Figure 1.5: Specific geometric surface area for solid foam packings of various ppi numbers and acomparison with common random and structured packings of different voidages, ε ( = 1 − εS).
internal pores or surface roughness. The BET surface area for solid foam packings may be
as much as 200 times larger (Richardson et al., 2000). Richardson et al. (2003) also indicate
that with established techniques a wash-coat may be added giving a specific surface area
as high as 40 m2 g−1. In common random and structured packings this specific BET area
may also be of the same order or even larger, but due to most of the area being internal
(up to 98% of BET surface area inside pores created within the solid material) the area
is not hydrodynamically accessible and diffusion limitations within the pores may still
affect the transfer of components to the active catalyst. This transfer of components from
the gas into the liquid and to the active catalyst located on the solid support is essential
for the operation of multiphase heterogenous reactions and a clear understanding of the
resistances that play a role in the mass transfer process is vital.
1.4 Gas-liquid flow through packings
Multiphase flow of gas and liquid through packing materials is commonplace and can
occur in three configurations, co-current upflow and downflow and counter-current flow.
These configurations have been presented schematically in Figure 1.6.
Each configuration has many advantages, but also disadvantages, when evaluating

6 Chapter 1
L
G
Packed
Bed
L G
Packed
Bed
L G
Packed
Bed
(a) (b) (c)
Figure 1.6: Schematic representation of the direction of the gas (G) and liquid (L) in a packed bedwith the gas and liquid flowing either counter-currently, (a), or co-currently up, (b), or co-currentlydown, (c).
the hydrodynamics, mass transfer and general operation of such reactors. Some of these
are listed below:
Counter-current flow
• Close to plug flow behavior of the reactor, allowing for high conversions and satu-
ration issues of the fluid phases is avoided;
• Uniform distribution of the gas and liquid can be achieved;
• Flooding may limit the reactor as higher gas and liquid flow rates cannot be achieved;
• The reactor may suffer from flow mal-distributions such as channeling, and bypass-
ing and incomplete wetting of the catalyst can occur at low liquid flow rates.
Co-current upflow
• Better distribution in an upflow reactor which gives better heat transfer and in many
cases better performance than in a co-current downflow configuration;
• Higher gas-liquid mass transfer coefficients are obtained in an upflow reactor when
compared to a downflow operated column under similar flow conditions;
• Large pressure drop in an upflow reactor compared to trickle bed reactors. This may
cause a large partial pressure gradient of components over the length of the reactor.
Co-current downflow
• The low liquid holdup provides lower liquid phase resistance to mass transfer of the
gaseous reactants to the catalyst surface;

Scope and outline of the thesis 7
• Lower pressure drop will allow essentially uniform partial pressure of the reactant
across the length of the reactor;
• Catalyst pores do not fill up completely with liquid, providing a higher effectiveness
factor when compared to a reactor operated in the upflow configuration;
• Since the catalyst is held in place by the fluid flow, undesired cementation of the soft
catalyst particles can occur.
• Liquid mal-distribution and dry zones are encountered in co-current downflow, and
avoided in the co-current upflow.
1.5 Scope and outline of the thesis
In single phase flow (e.g. liquid) through a solid support material the reactor performance
is governed by the (liquid-solid) mass transfer of reactants from the flowing phase to the
solid surface and into the pores of the support to reach the catalyst. Here the high velocity
difference between the flowing phase and the stationary support gives a high rate of mass
transfer and the reactor performance is controlled by the quantity and distribution of the
catalyst on the support and referred to as kinetically limited. In multiphase reactors with
a gas and a liquid flowing through a support material the transfer of gaseous components
through the gas-liquid interface is an additional resistance to the transfer of reactants to-
wards the catalyst. Here this mass transfer from the gas to the solid is commonly the
slowest giving a limitation to the overall performance of the reactor as the reaction is lim-
ited to the availability of both components (shown schematically in Figure 1.7).
Gas Liquid Solid
X(g) X(aq) + Y(aq) Products (aq)
Figure 1.7: Schematic representation of the transfer of a gaseous component, X, through the liquid,Y to the active catalyst supported on the solid.
In these types of reactors increasing the concentration of catalyst has no effect on the
overall rate of reaction of reactants (X and Y) into products and the reactor is said to be
mass transfer limited. The overall reactor performance is determined by the mass transfer

8 Chapter 1
over the gas-liquid interface which is characterized by a gas-liquid mass transfer coeffi-
cient, kLaGL. This coefficient is constituted of two parts, the intrinsic mass transfer coeffi-
cient, kL, and the area for mass transfer aGL. This area for mass transfer is related to the
geometric surface area of the packings, and since solid foam packings have an increased
geometric area, the expectation is that the area for mass transfer is also increased.
The main scope of the PhD project is to determine the rate of mass transfer of gaseous
components through the gas-liquid interface that is achieved when the gas and liquid are
flowing through a solid foam packing material. This coefficient can be used to relate the
rate of mass transfer to the rate of reaction. If the transfer of the gaseous components
is high enough, adding more catalyst results in higher reaction rates and the reactor is
said to be kinetically limited. The other important factors relating to the quantification of
the mass transfer and reaction are the hydrodynamic parameters such as liquid holdup
and the frictional pressure drop. These parameters are quantified for the gas and liquid
moving either counter-currently or co-currently (upflow and downflow) through the solid
foam packings at varying gas and liquid velocities. The ppi number of the solid foam
packings is also investigated to quantify the effects that particular length scales, such as
reactor dimensions (in the order of meters) to the size of the cells constituting the solid
foam packings (in the order of millimeters) have on the design of these types of multiphase
reactors.
In the next chapters the gas-liquid mass transfer performance is the main parameter
of interest for packed bed reactors fitted with solid foam packings previously described
(Section 1.2). The hydrodynamic parameters such as the frictional pressure drop, total
pressure drop, and the liquid holdup are studied experimentally in all three of the flow
configurations. In Chapter 2 the counter-current flow configuration is studied experimen-
tally and the relative permeability model, which describes the liquid holdup and pressure
drop, is presented. In Chapters 3 and 4 the co-current downflow and upflow configura-
tions are studied, respectively. In Chapter 5 the effect of changes in the liquid viscosity
and the liquid surface tension are investigated for the co-current flow configurations. In
Chapter 6 the liquid holdup model (relative permeability model, described in Chapter 2) is
used to give an overview of the results obtained and a reactor design based on chemically
inert carbon foam packings is made. This reactor performance is compared to a packed
bed of spherical particles.

Appendix 9
Appendix: Unit cell model
Figure 1.8: Unit cell in the shape of a tetrakaidecahedron, as described by Fourie and Plessis (2002).
In Figure 1.8 a diagram of the unit cell, described by Fourie and Plessis (2002) as-
suming that solid foam packings are made up of interconnecting tetrakaidecahedra (or
truncated octahedra), is given, and was used to describe single phase pressure drop mea-
surements for solid foam packings in the range 10 to 30 ppi. Earlier work by Plessis et al.
(1994) assuming a cubic cell model, where the strands are orthogonal to each other, could
not described the geometric specific surface area adequately. This geometric surface area,
however, is an important parameter in the evaluation of the hydrodynamics and thus the
later unit cell model of Fourie and Plessis (2002) using tetrakaidecahedron as the char-
acteristic shape is applied. The specific surface area of the solid foam packings can be
calculated from the voidage of the solid foam and the number of pores per linear inch
(usually characterized by the supplier). The following implicit set of equations needs to
be solved:
εS = 6.0 · 10−3 (dmN)2 + 1.1 · 10−3 (dmN)3 (1.1)
aP = 41.5dmN2 − 0.91d2
mN3 (1.2)
χ = 2 + 2 cos
[4π
3+
1
3arccos (1 − 2εS)
]
(1.3)
de =3 (3 − χ) (χ − 1)
aP
(1.4)
where εS , is the solids volume fraction, 1− ε, obtained from the bulk density, or given
by the supplier, dm is the average thickness of the strands making up the solid foam, N is

10 Chapter 1
the number of pores per linear inch, aP is the specific surface area, χ is the pore structure
tortuosity, and de is the effective length of the strands, see Figure 1.8.
(a) Unit cell (b) Thicker struts (c) Larger ppi number
Figure 1.9: Diagrams of (a) the unit cell of the solid foam, (b) the size of the struts of the unit cell areincreased (dm increases, εS increases), and (c) where the ppi number of the solid foam has increased(N and dm decreases, εS remains constant).
0 0.1 0.2 0.3 0.4 0.50
1
2
3
4
5
6
7
8
Solid volume fraction, εS [−]
Str
ut
length
, d
e, [m
m]
ppi number [−]
5
10
20
40
45
Figure 1.10: Strut length, de, for the solid foam packings as described by the unit cell model, Fourieand Plessis (2002), for different values of the solid holdup, εS and ppi number, N .
Figures 1.9a to 1.9c depict some of the general changes that occur in the unit cell di-
mensions when the strut thickness is increased and when the ppi number is increased.
This model is used to find the geometric surface area, the average strut length and the
average strut diameter for a range of ppi numbers (5 to 45 ppi) and solid holdups (0.01
to 0.5) and results are given in Figures 1.10 and 1.11. The length of a strut decreases with
increasing ppi number, but remains constant for varying solids volume fraction, as seen in
Figure 1.10. Figure 1.11a gives the specific geometric surface area as a function of the solid

Appendix 11
volume fraction in the range of 5 to 45 ppi (pores per linear inch) and increases as the ppi
number and the solids volume fraction increase. The diameter of a strut decreases with
increasing ppi number and increases as the solids holdup is increased. This is expected
and can be clearly seen by comparing the unit cells given in Figures 1.9a to 1.9c.
0 0.05 0.1 0.15 0.2 0.25 0.30
2000
4000
6000
8000
10000
Solid volume fraction, εS [m
S
3 m
P
−3]
Sp
ecif
ic s
urf
ace
area
, a P
[m
S2 m
P−3]
ppi number [−]
5
10
20
40
45
(a) Surface area, aP
0 0.1 0.2 0.3 0.4 0.50
0.5
1
1.5
2
Solid volume fraction, εS [−]
Str
ut
dia
mte
r d
m, [m
m]
ppi number [−]
5
10
20
40
(b) Strut diameter, dm
Figure 1.11: Characteristics for the solid foam as described by the unit cell model, Fourie and Plessis(2002), for different values of the solid holdup, εS and ppi number, N .


Chapter 2
Hydrodynamics and modeling of mass
transfer for counter-current flow
Parts of this chapter are excerpts from:
• C.P. Stemmet, J.N. Jongmans, J. van der Schaaf, B.F.M. Kuster, J.C. Schouten, Hydro-
dynamics of gas-liquid counter-current flow in solid foam packings, Chem. Eng. Sci.,
60, p 6422, (2005).
• C.P Stemmet, J. Van der Schaaf, B.F.M. Kuster, J.C. Schouten, Solid foam packings
for multiphase reactors: Modelling of liquid holdup and mass transfer, Chem. Eng.
Res. Des., 84 (A12), p 1134, (2006).
Abstract
Experimental and modeling results are presented of the liquid holdup and gas-liquid mass
transfer characteristics of solid foam packings. Experiments were done in a semi-2D trans-
parent bubble column with solid foam packings of aluminum in the range of 5 to 40 pores
per inch (ppi). The relative permeability model described by Saez and Carbonell (1985) is
used to describe the liquid holdup data. The regimes studied are two high liquid holdup
regimes and a low liquid holdup regime (trickle flow regime). Also the flooding points
for counter-current flow have been determined. The investigated system variables are
the superficial gas and liquid velocities, using counter-current flow with maximum gas
velocities and liquid velocities of 0.8 m s−1 and 0.02 m s−1, respectively. The relative per-
meability model is able to describe the liquid holdup in the low liquid holdup or trickle
flow regime as well as in the high liquid holdup regime, which resembles flow in a packed
bubble column. Gas-to-liquid mass transfer is modeled using the penetration theory. Mass
transfer coefficients up to 6 s−1 are predicted; these high values are largely due to the high
specific surface area of the solid foam packings.

14 Chapter 2
2.1 Introduction
In the design of chemical engineering processes, reaction and separation are regarded as
the most important steps. For reactions in multiphase systems, a more active catalyst does
not necessarily lead to an increased rate of conversion; the mass transport rate may be the
limiting factor that determines reactor efficiency. Reactor packings aim to increase the rate
of mass transfer by increasing the gas-liquid contact area and by increasing the turbulence
within the fluid phases. Additionally, in counter-current two-phase flow, mass transfer is
increased by maintaining high concentration gradients, the driving force for mass trans-
fer. For two-phase and three-phase flow, reactor packings such as monoliths, cloths, open-
cell foams, and other structured packings have been demonstrated to improve hydrody-
namic performance compared to the more conventional packings, e.g. spherical particles,
Raschig rings. With ever-increasing catalyst activity being developed and demanded by
the chemical industry, the mass transfer in conventional packings becomes the limiting
factor in the reactor. Structured packings can solve this problem; within the same reactor
volume a significantly higher rate of mass transfer can be achieved (Frank, 1996). Alterna-
tively, for an existing mass transfer limited process the same conversion can be achieved
in a much smaller reactor volume. Other advantages of structured reactor packings are
a reduced pressure drop per packing height, improved hydrodynamic properties, and a
larger window of stable operating conditions. In terms of mass transfer, structured pack-
ings may also be operated at higher contact efficiency, viz. the ratio of gas-liquid contact
area and the geometrical surface area of the packing.
The open-cell structures in the range of 5 to 40 ppi have a higher specific surface area
than conventional packings, e.g. 1
2-inch Raschig rings and 1
2-inch Intalox saddles 400 and
650 m2 m−3, respectively (Treybal, 1980). The solid foam packings also have comparable
or higher surface area than other structured packings e.g. internally finned monoliths, de
= 2.85 mm, and Katapak-S filled with 1.5 mm spheres, approximately 1000 and 800 m2
m−3, respectively (Lebens et al., 1999). Improved gas-liquid mass transfer with solid foam
packings has been reported for polyurethane and ceramic foam packings by Ernest and
Ravault (1974) and Pretorius and Hahn (1980). This higher mass transfer rate is ascribed
to an increase in the degree of turbulence in the liquid flow, which is induced by the many
junctions encountered by the down-flowing liquid.
This chapter investigates the liquid hold-up and the mass transfer rate of solid foam
packings. These parameters are most important for the design of multiphase reactors that
use these (catalytic) solid foam packings, and are evaluated for the two-phase, counter-
current air-water system.
2.1.1 Mass transfer
The mass transfer in packed columns is especially important in the design and construc-
tion of absorbers, strippers, and distillations columns. However, for fast reactions the mass

Introduction 15
transfer between the respective phases may be the limiting factor, and thus is also impor-
tant in the design of multiphase reactors. In literature, many correlations are available that
predict the rate of mass transfer for packed columns, for the gas-side mass transfer coeffi-
cient and the liquid-side mass transfer coefficient, which will be discussed consecutively.
The gas-side mass transfer coefficient for packed beds and structured packings is cor-
related in the following form:
ShG = C1RemGScn
G (2.1)
where C1 is a constant and depends on the type and properties of the packing, m and n
are parameters depending on the flow type and the packing. Sh, Re, and Sc are the di-
mensionless Sherwood, Reynolds and Schmidt numbers, respectively. Rocha et al. (1996)
found Equation 2.1 with C1 = 0.054, m = 0.8 and n = 0.333, for various structured pack-
ings (e.g. Flexpac 2, Gempak 2A Sulzer B, Mellapak, Intalox 2T). The broad applicability
of Equation 2.1, also for conventional packings (Treybal, 1980), suggests that it may also
be used to correlate the gas-side mass transfer coefficients in structured foam packings.
However, for most systems especially for poorly soluble gases the overall rate of mass
transfer is not limited by the transport through the gas film (Treybal, 1980) and thus the
focus in this work will be to predict the liquid-side mass transfer coefficient.
Rocha et al. (1996) described the liquid-side mass transfer coefficient for various struc-
tured packings with the well-known penetration model:
kL = 2
√
DL
πte(2.2)
where DL is the diffusivity in the liquid phase, and te is an assumed exposure time for the
pockets of liquid flowing down the solid foam material. Rocha et al. (1996) have assumed
that the exposure time is proportional to the ratio of a characteristic length of the packing
to the interstitial liquid velocity. A proportionality factor of 1.1 was found, which corrects
for parts of the packing that do not encourage rapid surface renewal. In the present study,
the length of the strands of the solid foam packing is taken as the characteristic length.
This length, de, is calculated from the ppi number, N , and the solid volume fraction, εS,
according to Equations 1.1 to 1.4.
The gas-liquid specific surface area, aP , is another important parameter in obtaining
the overall mass transfer coefficient. The gas-liquid surface area for gauze type packings
is correlated by Rocha et al. (1996) as a function of the Froude number:
aGL
aP
= 1 − 1.203Fr0.111L (2.3)
where aP is the specific surface area of the packing, and FrL is the liquid Froude number.
The correlation in Equation 2.3 predicts that the effective gas-liquid surface area decreases
as the liquid flow rate is increased. This decrease in area is not described by Rocha et al.

16 Chapter 2
(1996), but is possibly due to liquid films occupying more volume at higher liquid flow
rates and coalescence of these liquid films. If we assume that the solid material is wettable
and that no coalescence of liquid films occur, and thus liquid flows as a film over the
strands of the solid foam packing, an estimate of the gas-liquid interfacial area can be
obtained. The specific surface area for the solid foams in the study of Fourie and Plessis
(2002) was used. Here, for the trickle flow regime, the solid volume fraction is replaced
by the sum of the solid volume fraction of the foam (εS) and the liquid holdup, εL. The
specific gas-liquid interfacial area is then given by Equations 1.1 to 1.4 with εS replaced
by εL + εS . This shows that the gas-liquid interfacial area would increases as the liquid
velocity increases due to liquid holdup increasing.
2.1.2 Liquid holdup models
Liquid holdup and pressure drop in counter-current flow for packed columns can be de-
scribed and correlated by many models available in literature. An overview of the ap-
proaches thus far are outlined and reviewed by Carbonell (2000). The relative perme-
ability model, the slit model, and the fluid-fluid interactions model are used to predict
liquid holdup and pressure drop for a wide range of packings. All these models solve the
one dimensional average momentum balance assuming incompressible flow for the fluid
phases:
εαραvα
dvα
dz= −εα
dPα
dz+ εαραg − Fα, α = G, L (2.4)
where εα is the holdup of the fluid phase, ρα is the density, να is the interstitial velocity,
dPα/dz is the pressure gradient along the distance z, and Fα is the drag force on the fluid
phase per unit volume of the bed. The models differ in the calculation of the drag force.
Carbonell (2000) concludes that the relative permeability model is the most accurate in de-
scribing experimental holdup and pressure drop data for two-phase flow. This approach
is used here for modeling the liquid holdup.
The relative permeability model assumes that the drag force per unit volume for each
fluid is a function of the relative permeability, fα, of each phase:
Fα
εα
=1
fα(Sα)
(
AReα
Gaα
+ BRe2
α
Gaα
)
ραg, α = G, L (2.5)
The factors A and B in Equation 2.5 are, respectively, the viscous and inertial coeffi-
cients in the Ergun equation for single phase flow in a packed bed of the packings stud-
ied. The relative permeability, fα, is assumed to be a function of the saturation, Sα, of
each phase. The relative permeabilities for the gas and liquid are given in Equation 2.7,
according to Saez and Carbonell (1985). The values of h1 and h2 found by the authors for
the packings studied (spheres, Raschig rings, cylinders and Berl saddles) are 4.8 and 2.43,

Experimental 17
respectively. The voidage of the solid packings is represented by ε, (ε = 1 − εS):
Sα =εα
ε(2.6)
fG = Sh1
G , fL =
(SL − S0
L
1 − S0
L
)h2
(2.7)
S0
L is the saturation of liquid at the static holdup condition and is correlated by Saez and
Carbonell (1985) for the packings studied to a modified Eotvos number, Eo∗:
S0
L =ε0
L
ε= [ε (20 + 0.9Eo∗)]−1, Eo∗ =
ρLgd2eε
σL (1 − ε)2(2.8)
The relative permeability model as it is described in Saez and Carbonell (1985) for
co-current flow has been used by Dankworth and Sundaresan (1989) as a macroscopic
model for counter-current flow. The velocity and pressure gradients in Equation 2.4 are
zero under the assumption of having a uniform velocity throughout the column and the
holdup of the respective gas phase and liquid phase being uniformly distributed. Thus,
Equation 2.4 for the liquid phase is subtracted from that for the gas phase and reduces to:
FG
εG
− FL
εL
+ (ρG − ρL) g = 0 (2.9)
At different gas and liquid Reynolds numbers (varying superficial velocities), the liq-
uid holdup, εL, can be calculated by solving Equations 2.5 to 2.9 for each phase with
εG = ε − εL.
2.2 Experimental
The solid foams used in this study are commercially available under the brand name of
Duocel from ERG Aerospace Corp. (flat rectangular blocks of size 30 x 30 x 1 cm). Figure
1.3 shows the detail of the solid aluminium foam in the range of 5 to 40 ppi. All of these
foams have a voidage of 92 to 94%. The foams were placed to a height of 80 cm in a 2D per-
spex column with cross section 30 x 1 cm and height of two meters, shown schematically
in Figure 2.1. This flat geometry allows visual observation of the gas-liquid flow through
the solid foam packings. The pressure drop per unit height was measured using a Druck
DP610 pressure sensor with an accuracy of 1 Pa. Air-water is used as the gas-liquid two-
phase system in this study. The air and water are flowing counter-currently. The liquid
is distributed on top over the solid foam packing through five rectangular nozzles (8 x 12
x 50 mm) with sixteen 0.5 mm diameter holes to avoid liquid mal-distribution. A liquid
rotameter is used to measure the liquid flow rate. The gas flow is supplied through five
holes at the bottom of the column and controlled at the desired flow rate with mass flow

18 Chapter 2
controllers. A Dalsa CA-D6 high speed camera was used to capture images if the packing
was sufficiently transparent.
T2
T1
1
2
4
5
6
7
3 P3
8
9
80 cm
1 cm 30 cm
Gas
Supply
P1
P2
Figure 2.1: Counter-current flow setup: 1. Solid foam packed bed, 2. Liquid rotameter, 3. Gasmass flow controller, 4. Liquid holdup measurement tank placed on a balance, 5. Main liquidsupply tank, 6. Liquid pump, 7. Hose pump, 8. Liquid overflow (for high liquid holdup), 9. Liquiddrainage point (for low liquid holdup).
The flooding point can be described in a number of ways, but the clearest definition
is the point where at a certain gas flow, flow reversal of the liquid occurs and the liquid
is unable to flow through the packing and collects on the top of the bed. The pressure
drop per unit height increases rapidly due to this liquid accumulation. This point is the
operating limit for counter-current flow of gas and liquid through packings. The regime
usually described for counter-current flow at low liquid holdup is called the trickle flow
regime. However, also a high liquid holdup regime similar to gas-liquid flow in packed
beds was studied.
The liquid holdup for both the high and low liquid holdup regimes was measured ex-
ternally by the weighing method and using the liquid holdup measurement tank depicted
in Figure 2.1. This vessel was placed on a balance for accurate measurement of the liquid
volume. The main liquid circulating through the solid foam packing is supplied from a
Experimental 19
10 liter vessel, also depicted in Figure 2.1. A liquid loop from this tank to the 2D column
and back to this vessel, ensures that the main liquid supply tank remains completely filled
with liquid.
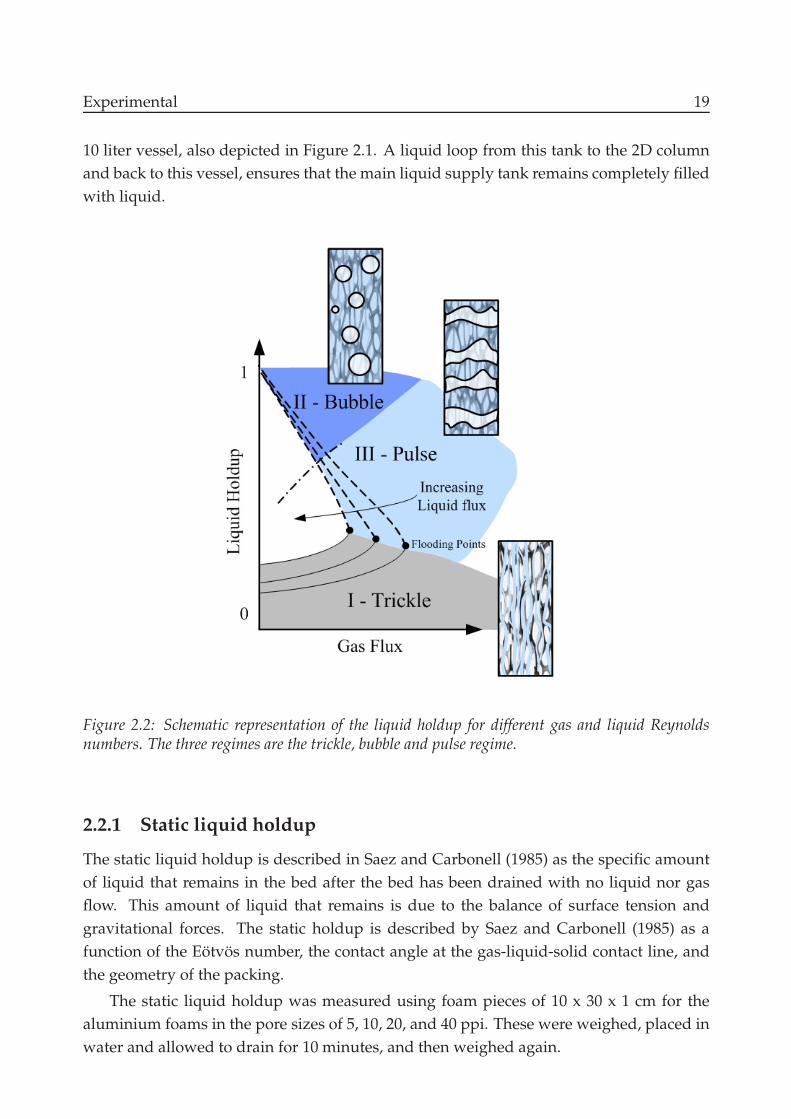
Figure 2.2: Schematic representation of the liquid holdup for different gas and liquid Reynoldsnumbers. The three regimes are the trickle, bubble and pulse regime.
2.2.1 Static liquid holdup
The static liquid holdup is described in Saez and Carbonell (1985) as the specific amount
of liquid that remains in the bed after the bed has been drained with no liquid nor gas
flow. This amount of liquid that remains is due to the balance of surface tension and
gravitational forces. The static holdup is described by Saez and Carbonell (1985) as a
function of the Eotvos number, the contact angle at the gas-liquid-solid contact line, and
the geometry of the packing.
The static liquid holdup was measured using foam pieces of 10 x 30 x 1 cm for the
aluminium foams in the pore sizes of 5, 10, 20, and 40 ppi. These were weighed, placed in
water and allowed to drain for 10 minutes, and then weighed again.

20 Chapter 2
2.2.2 Low liquid holdup - trickle flow
The trickle of liquid over a packing material is the operating regime for many types of
packings. Correlations to predict the pressure drop and operating limits for counter-
current gas-liquid flow for a variety of packings is given by Stichlmair et al. (1989).
This trickle flow regime is attained with the experimental setup given in Figure 2.1 by
starting with the void spaces in the foam filled with gas and with the liquid supply tank
completely filled. A constant liquid flow is circulated through the column and is collected
and returned to the supply tank. An additional liquid stream is circulated through the
column from the liquid holdup measurement tank and is returned via the liquid drainage
point at the bottom of the column. The liquid holdup in the trickle flow regime is de-
termined at this liquid flow rate and with zero gas flow. As the gas flow is increased, it
opposes the flow of the liquid in the column giving rise to a higher holdup of liquid, thus
the volume in the liquid holdup measurement vessel decreases. At the flooding point, the
liquid is unable to flow down the packing due to the high gas flow and collects at the top
of the column and gas is entrained with the liquid into the main liquid supply tank.
2.2.3 High liquid holdup
A high liquid holdup regime is also possible using the experimental setup as shown in Fig-
ure 2.2. This regime resembles a packed bubble column in co-current gas-liquid up-flow,
but operated under counter-current flow conditions. This regime is described as unsta-
ble in Dankworth and Sundaresan (1989) and is considered to arise only by a restrictive
support plate at the bottom of the column. This high liquid holdup regime has not been
studied in the literature before for other types of packings.
In the high liquid holdup case the main liquid supply tank, the packed column, and
the associated piping are completely filled with liquid, with no gas flow. A liquid flow
is set to flow counter-currently from the top to the bottom of the solid foam packing and
is returned to the main liquid supply tank. As the gas flow rate is steadily increased, the
liquid holdup in the column decreases, the additional liquid is expelled at the top and is
collected in the liquid holdup measurement vessel, giving a measure of the liquid holdup
within the column. A small liquid flow from this tank ensures stabilization of the liquid
volume collected at a particular gas and liquid flow through the column.
2.3 Results
2.3.1 Static liquid holdup
The measured static liquid holdup for the solid foam packings is given in Figure 2.3 as a
function of the Eotvos number. The static liquid holdup is higher in the structured foam
packings; Equation 2.8 underestimates this static liquid holdup. The liquid holdup is best
described by Equation 2.10, also shown in Figure 2.3.
Results 21
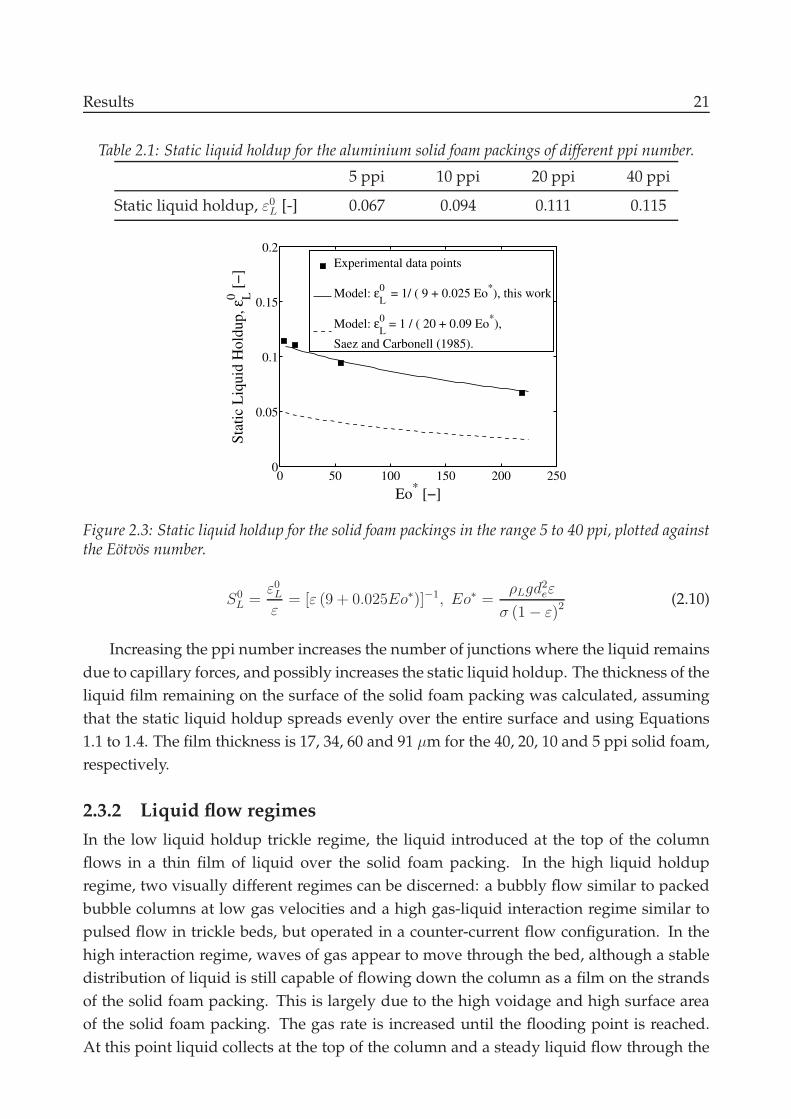
Table 2.1: Static liquid holdup for the aluminium solid foam packings of different ppi number.
5 ppi 10 ppi 20 ppi 40 ppi
Static liquid holdup, ε0L [-] 0.067 0.094 0.111 0.115
0 50 100 150 200 2500
0.05
0.1
0.15
0.2
Eo* [−]
Sta
tic
Liq
uid
Hold
up, ε
L0 [
−]
Experimental data points
Model: εL
0 = 1/ ( 9 + 0.025 Eo
*), this work
Model: εL
0 = 1 / ( 20 + 0.09 Eo
*),
Saez and Carbonell (1985).
Figure 2.3: Static liquid holdup for the solid foam packings in the range 5 to 40 ppi, plotted againstthe Eotvos number.
S0
L =ε0
L
ε= [ε (9 + 0.025Eo∗)]−1, Eo∗ =
ρLgd2eε
σ (1 − ε)2(2.10)
Increasing the ppi number increases the number of junctions where the liquid remains
due to capillary forces, and possibly increases the static liquid holdup. The thickness of the
liquid film remaining on the surface of the solid foam packing was calculated, assuming
that the static liquid holdup spreads evenly over the entire surface and using Equations
1.1 to 1.4. The film thickness is 17, 34, 60 and 91 µm for the 40, 20, 10 and 5 ppi solid foam,
respectively.
2.3.2 Liquid flow regimes
In the low liquid holdup trickle regime, the liquid introduced at the top of the column
flows in a thin film of liquid over the solid foam packing. In the high liquid holdup
regime, two visually different regimes can be discerned: a bubbly flow similar to packed
bubble columns at low gas velocities and a high gas-liquid interaction regime similar to
pulsed flow in trickle beds, but operated in a counter-current flow configuration. In the
high interaction regime, waves of gas appear to move through the bed, although a stable
distribution of liquid is still capable of flowing down the column as a film on the strands
of the solid foam packing. This is largely due to the high voidage and high surface area
of the solid foam packing. The gas rate is increased until the flooding point is reached.
At this point liquid collects at the top of the column and a steady liquid flow through the
22 Chapter 2
foam cannot be maintained. As in the low liquid holdup trickle flow case, gas is entrained
with the liquid flow to the main liquid supply tank.
(a) (b) (c)
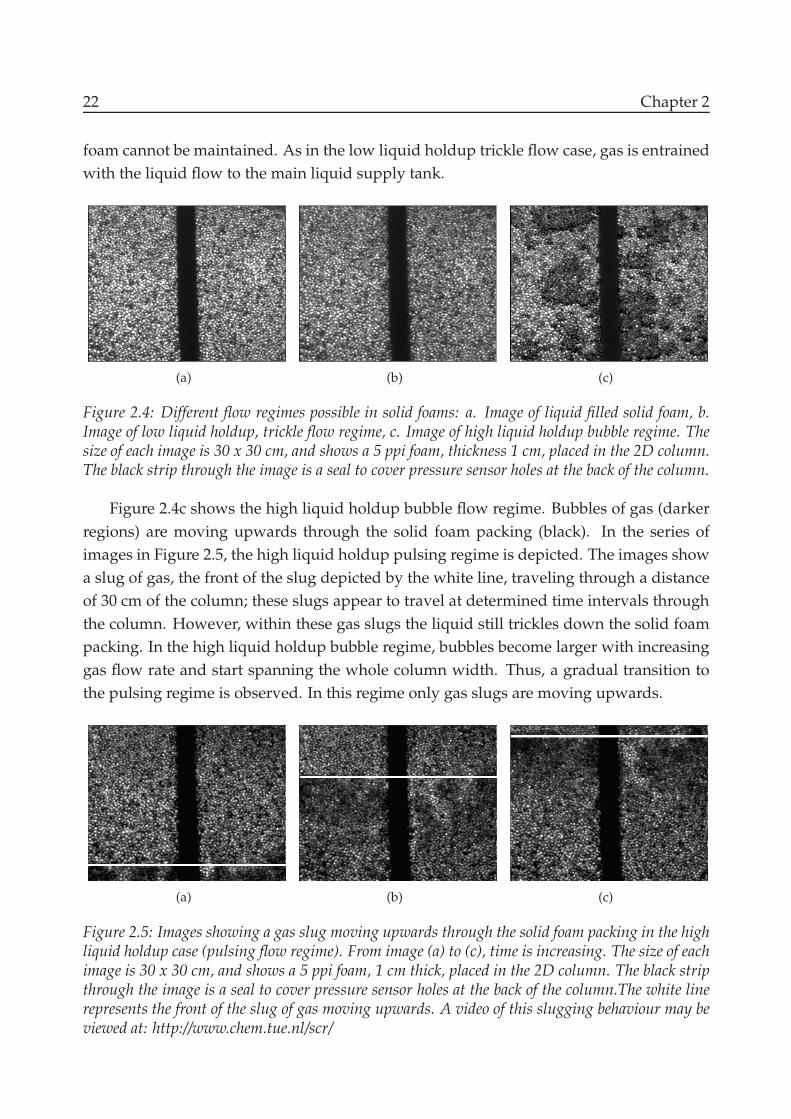
Figure 2.4: Different flow regimes possible in solid foams: a. Image of liquid filled solid foam, b.Image of low liquid holdup, trickle flow regime, c. Image of high liquid holdup bubble regime. Thesize of each image is 30 x 30 cm, and shows a 5 ppi foam, thickness 1 cm, placed in the 2D column.The black strip through the image is a seal to cover pressure sensor holes at the back of the column.
Figure 2.4c shows the high liquid holdup bubble flow regime. Bubbles of gas (darker
regions) are moving upwards through the solid foam packing (black). In the series of
images in Figure 2.5, the high liquid holdup pulsing regime is depicted. The images show
a slug of gas, the front of the slug depicted by the white line, traveling through a distance
of 30 cm of the column; these slugs appear to travel at determined time intervals through
the column. However, within these gas slugs the liquid still trickles down the solid foam
packing. In the high liquid holdup bubble regime, bubbles become larger with increasing
gas flow rate and start spanning the whole column width. Thus, a gradual transition to
the pulsing regime is observed. In this regime only gas slugs are moving upwards.
(a) (b) (c)
Figure 2.5: Images showing a gas slug moving upwards through the solid foam packing in the highliquid holdup case (pulsing flow regime). From image (a) to (c), time is increasing. The size of eachimage is 30 x 30 cm, and shows a 5 ppi foam, 1 cm thick, placed in the 2D column. The black stripthrough the image is a seal to cover pressure sensor holes at the back of the column.The white linerepresents the front of the slug of gas moving upwards. A video of this slugging behaviour may beviewed at: http://www.chem.tue.nl/scr/

Results 23
2.3.3 Liquid holdup
The measurement of the liquid holdup for counter-current flow of gas and liquid is given
in Figure 2.6 for the 5 and 40 ppi metal foams packings. As the gas flow rate is increased
in some instances, gas bubbles are entrained in the liquid flow back to the liquid supply
tank and it is not possible to obtain an accurate measurement of the liquid holdup. Exper-
imentally however, flooding, as described in Section 2.2, may occur only at a later stage.
In the trickle flow regime, the liquid holdup increases with increasing liquid and gas flow
rates. In the high liquid holdup regimes, the highest liquid holdup that can be obtained is
equal to the voidage of the solid foam material (approximately 93%). The liquid holdup
decreases with increasing gas and liquid flow rates. Here, the liquid is not confined to
move along the solid foam surface; the gas bubbles move through the open pore space of
the foam, thus resembling a (packed) bubble column. As the gas flow rate is increased,
the gas finally moves through the open foam space as a slug. Liquid drains through the
gas slug and appears to flow along the solid foam surface. Even at relatively high liquid
and gas fluxes, the solid foam packing allows counter-current flow of both gas and liquid
through the internal volume. This is largely due to the open structure of the foam mate-
rial. These trends can be seen for the foams of 5 to 40 ppi. It should be mentioned that for
this experimental setup the maximum gas flow rate possible within the column is 0.88 kg
m−2 s−1.
0 0.2 0.4 0.6 0.8 10
0.2
0.4
0.6
0.8
1
Gas Flux [kg m−2
s−1
]
Liq
uid
Hold
up [
−]
Liquid Flux [kg m−2
s−1
]
27.8 (5 ppi)
6.8 (5 ppi)
27.8 (40 ppi)
6.8 (40 ppi)
Figure 2.6: Liquid holdup at different liquid fluxes for 5 ppi (◦,⊳) and 40 ppi (•,◭) solid foampackings for the different flow regimes. Results for the low liquid holdup regime (εL < 0.4) and thehigh liquid holdup regimes (εL > 0.4) are given.
In Figure 2.6 the liquid holdup for the 5 and 40 ppi foams is given on the same axis.
In the trickle flow regime, the tendency is to a higher liquid holdup for the 40 ppi solid
foam compared to the 5 ppi foam. This is to be expected because the 40 ppi foam has
a higher specific surface area that gives a higher restriction to the liquid flow through

24 Chapter 2
the foam. Also the static liquid holdup for the 40 ppi foam is higher. The same trend is
observed in the high liquid holdup regime. The result is a combination of contributing
factors: the tortuous path of the flow of liquid and gas is increased as the ppi number
increases, the restriction of the gas and liquid flows is increased due to the increase of the
specific surface area, but also the drainage of the liquid downwards is eased by this larger
surface as well. All these factors affect the liquid holdup. It is clear, however, that as the
ppi number of the solid foam packing decreases, the solid foam packing may have larger
operating capabilities.
2.3.4 Liquid holdup modeling
The liquid holdup in the solid foam was predicted using the models as described previ-
ously. The model developed by Saez and Carbonell (1985) was fitted to the experimental
data, using A, B, h1, and h2 as fitting parameters. The experimental data and the fitted
model results for the solid foams are presented in Figure 2.7a to Figure 2.7c. The results
for the fitting parameters are given in Table 2.2.
Table 2.2: Parameters in the relative permeability model of Saez and Carbonell (1985) for solid foampackings; also given is the 95% confidence interval of the fitted parameters.
5 ppi 20 ppi 40 ppi Average Saez et al. (1985)
de [x 103 m] 3.0 0.75 0.38
A [x 105] 8.31 42.1 0.088 180 x 105
B 25.09±7.04 14.03±1.86 5.04±1.34 1.8
h1 5.17±0.37 3.88±0.16 4.25±0.26 4.43 4.8
h2 2.33±0.2 1.55±0.09 1.73±0.16 1.88 2.43
In the high liquid holdup situation the data is well represented by the model. How-
ever, the low liquid holdup is not predicted well, because here it is highly dependent on
the static liquid holdup, and the model is unable to describe the increase in holdup with
increasing gas velocity near the flooding point. The model is also based on the assump-
tion that the drag forces are functions of the respective single phase Ergun equations, and
thus the interaction between the respective phases is not taken into account. This is most
prominent for the 5 ppi solid foam packing. Here the foam struts are least densely packed,
which makes the interaction between gas and liquid most significant and the deviation be-
tween the experimental results and the liquid holdup model the largest. The values of A
and B are very different compared to other packings (A = 180 and B = 1.8, respectively).
The value of A, the viscous contribution to the pressure drop, does not have significant
influence on the liquid holdup modeling at the flow velocities studied and may be disre-
garded. The value of B in the single phase Ergun equation is modeled with the relative

Results 25
0 1000 2000 3000 4000 50000
0.2
0.4
0.6
0.8
1
ReG
[−]
Liq
uid
Hold
up, ε
L [
−]
Experimental points
ReL = 1185 [−]
ReL = 889 [−]
ReL = 593 [−]
ReL = 296 [−]
Model
(a) 5 ppi
0 200 400 600 800 10000
0.2
0.4
0.6
0.8
1
ReG
[−]
Liq
uid
Hold
up, ε
L [
−]
Experimental points
ReL = 296 [−]
ReL = 222 [−]
ReL = 148 [−]
ReL = 74 [−]
Model
(b) 20 ppi
0 100 200 300 400 5000
0.2
0.4
0.6
0.8
1
ReG
[−]
Liq
uid
Hold
up, ε
L [
−]
Experimental points
ReL = 148 [−]
ReL = 111 [−]
ReL = 74 [−]
ReL = 37 [−]
Model
(c) 40 ppi
0 0.2 0.4 0.6 0.8 10
0.2
0.4
0.6
0.8
1
−10%
+10%
Liquid Holdup, εL [−], experimental
Liq
uid
Hold
up, ε
L [
−],
cal
cula
ted
5 ppi
20 ppi
40 ppi
(d) Parity plot
Figure 2.7: Experimental data and modeling results of the liquid holdup versus Reynolds numberof the gas using the relative permeability model (Saez and Carbonell, 1985) for (a) 5 ppi, (b) 20ppi and (c) 40 ppi solid foam packings, respectively. A parity plot of all of the liquid holdup datacompared to the predictions of the relative permeability model is given in (d).
permeability model and is not constant for the foams, but decreases with increasing ppi
number.
In Richardson et al. (2000) the single phase pressure drop was studied and the value of
B also varied with ppi number. This value is usually quoted as being a constant (B = 1.8)
for all types of packings, but should be seen as an averaged value, e.g. ranging from 1.18
to 4.4 for the packings listed in Iliuta et al. (2003). However, for solid foam packings the
value of B is significantly higher. The values of h1 and h2 given in Table 2.2 are in the
same range but not comparable to the values found by Saez and Carbonell (1985). The
results of the model vs. the experimental data are summarized in the parity plot given
in Figure 2.7d. It is clear that in the low liquid holdup regime for all the packings the

26 Chapter 2
model describes the experimental liquid holdup data less accurately, possibly due to the
interaction between the relative phases not taken into account by the model.
2.3.5 Flooding
0 0.5 1 1.50
10
20
30
40
50
Gas Flux [kg m−2
s−1
]
Liq
uid
Flu
x [
kg
m−
2 s
−1]
Katapak−S
Monoliths 25 cpsi
Solid foam 40 ppi
Solid foam 20 ppi
Solid foam 5 ppi
(a) Low liquid holdup
0 0.5 1 1.50
10
20
30
40
50
Gas Flux [kg m−2
s−1
]
Liq
uid
Flu
x [
kg
m−
2 s
−1]
Katapak−S
IFM 25 cpsi
Solid foam 40 ppi
Solid foam 20 ppi
Solid foam 5 ppi
(b) High liquid holdup
Figure 2.8: Gas and liquid fluxes at the flooding point for Katapak-S (Ellenberger and Krishna(1999)), internally finned monoliths (Lebens et al. (1999)), and solid foam packings of 5, 20 and 40ppi as reached from the low liquid holdup and high liquid holdup regimes, respectively.
The results for the flooding point are given in Figure 2.8. These are combinations
of gas and liquid fluxes where the flooding condition as described in Section 2.2 is ob-
served. Flooding is encountered at lower gas and liquid flow rates as the ppi number is
increased. Here the flow path is more tortuous and the restriction to flow is increased. The
flooding point is considered as an unstable operating point and a number of factors may
induce a premature flooding condition within the column. Inadequate contact between
two adjacent solid foam sections may induce flooding and is viewed as the largest con-
tributing factor. The flooding data obtained for the solid foam packings is compared with
two structured packed systems: Sulzer Katapak-S (Ellenberger and Krishna, 1999) and
monoliths (Lebens et al., 1999) for an air-water system. The results indicate that flooding
for the solid foam closely resembles that found for the Katapak-S packing, with inter-
nally finned monoliths (IFM) having higher flow rates of gas and liquid before flooding is
reached. Comparison between the packings should be done cautiously, as the distribution
of the gas and liquid into the volume of the packing material is but one factor affecting the
flooding point. This distribution may differ between the different experimental setups.
2.3.6 Pressure drop
The pressure drop per unit height of packing is presented in Figure 2.9 for the 5 and 40 ppi
foams. In the low liquid holdup regime, the pressure drop increases as the liquid and gas

Results 27
0 0.2 0.4 0.6 0.8 10
200
400
600
800
1000
Gas Flux [kg m−2
s−1
]
PT
ota
l [P
a m
−1]
Liquid Flux [kg m−2
s−1
]
17.2 (40 ppi)
10.3 (40 ppi)
Dry (40 ppi)
17.2 (5 ppi)
10.3 (5 ppi)
Dry (5 ppi)
(a)
0 0.2 0.4 0.6 0.8 10
2000
4000
6000
8000
10000
Gas Flux [kg m−2
s−1
]
PT
ota
l [P
a m
−1]
Liquid Flux [kg m−2
s−1
]
17.2 (40 ppi) with error bars
10.3 (40 ppi)
17.2 (5 ppi)
10.3 (5 ppi)
(b)
Figure 2.9: Pressure drop per unit length of reactor in (a) low liquid holdup, and (b) high liquidholdup regimes. Dry pressure drop given in (a). In the slugging regime the pressure drop per unitlength has a large variation from the mean, as indicated by the error bars.
fluxes are increased. The 40 ppi foam exhibits consistently higher pressure drop than the 5
ppi foam as expected. For the 5 and 40 ppi foams, the dry packing displays similar trends
due to an increase in the number of restrictions in the path of the flow. The pressure drop
per unit height of solid foam packing is lower in comparison to packed beds of spherical
particles, which is due to the high voidage of the solid foam packing. In the high liquid
holdup regime, the same result is found. The pressure drop, however, is mainly due to
the liquid holdup in the bed. In the high liquid holdup slug regime, a high variation in
the pressure drop over the bed is observed, as indicated by the error bars. As the flooding
point is approached, the average pressure drop behaves erratically due to the presence of
gas and liquid filled slugs.
2.3.7 Mass transfer modeling results
The gas-liquid mass transfer coefficients were estimated by the penetration theory, pre-
sented in Section 2.1.1, for the 5, 20, and 40 ppi solid foams, and are given in Figure 2.10
for the trickle flow regime. Liquid-side mass transfer coefficients found for the solid foam
are quite high, largely due to the high geometric surface area for the solid foam packings,
which is estimated to generate high gas-liquid area. The 40 ppi foam has a specific surface
area, aP , of approximately 4500 m2m−3 for a solids volume fraction of 7%. Unlike other
packings, the gas-liquid surface area increases as the liquid holdup is increased. This in-
crease in surface area assumes that the liquid spreads evenly over the surface of the solid
foam packing, which may not always be the case. Droplet formation or coalescence of the
liquid films may occur, which would ultimately decrease the area for mass transfer.
In Figure 2.10 it can be seen that the value of kLaGL increases with liquid velocity

28 Chapter 2
0 200 400 600 800 1000 12000
1
2
3
4
5
6
ReL
kL a
GL [
m s
−1]
5 ppi
20 ppi
40 ppi
Figure 2.10: Liquid side mass transfer coefficient for 5 to 40 ppi solid foam packings, according toEquation 2.2, with DL = 10−9 m2 s−1 and ReG < 100.
(higher values of ReL). The interstitial velocity of the liquid is higher, giving lower expo-
sure times. This increases the value of kL and subsequently the value of kLaGL for higher
liquid flow rates. Additionally, it can be seen in Figure 2.10 that as the ppi number of the
solid foam increases, the value of kLaGL increases. This is mainly due to an increase of
the specific surface area of the dry packing, which increases with the ppi number. The
highest value of kLaGL estimated for the solid foams is approximately 6 s−1 for the 40 ppi
foam at the highest superficial liquid velocity. These are not experimentally obtained gas-
liquid mass transfer coefficients, but estimates using penetration theory for the trickle flow
regime. In the setup used the gas-liquid mass transfer coefficient could be determined ex-
perimentally, possibly by the method of oxygen desorption. However, this was not done
in the present study.
2.4 Conclusions
Solid foam packings can be used excellently for gas-liquid counter-current flow combin-
ing the properties of relatively high specific surface areas with high voidage. In counter-
current operating, three flow regimes are found:
• Low liquid holdup: trickle flow regime;
• High liquid holdup: bubble flow regime;
• High liquid holdup: pulsing regime.
In the low liquid holdup regime, the liquid holdup increases as the liquid and gas flow
rates are increased, and increases with an increase in the foam ppi number. In the two high
liquid holdup regimes, the liquid holdup decreases with increase in gas and liquid flow

Conclusions 29
rates, and increases with increasing foam ppi number. Each of the regimes mentioned
above are stable operating regimes for gas-liquid counter-current flow, and especially the
high liquid holdup regimes may be useful for highly exothermic processes.
The gas and liquid flow rates where flooding is observed are similar to those found in
Katapak-S packing and increase with decreasing ppi number. The pressure drop per unit
height of packing is low compared to other packing materials due to the open structure of
the foam material. In the pulsing regime, the pressure drop over the solid foam packing
fluctuates due to the formation of gas and liquid slugs.
The relative permeability model by Saez and Carbonell (1985) can be applied to de-
scribe the liquid holdup in structured solid foam packings. It describes the liquid holdup
for the high liquid holdup regimes, but underestimates the liquid holdup in the the low
liquid holdup regime (trickle flow), possibly a result of the interaction between the respec-
tive phases not taken into account. The static liquid holdup in the structured solid foam
packings at zero gas and liquid flows is described as a function of the Eotvos number,
Equation 2.10.
The mass transfer predicted for the solid foam packing material in the low liquid
holdup case increases with increasing ppi number of the solid foam and liquid Reynolds
number. The liquid-side mass transfer coefficients predicted for the foams using pene-
tration theory is quite high compared to other structured packings, the highest value of
kLaGL is approximately 6 s−1, for the available data set of liquid and gas flows and liquid
holdups. This high value of kLaGL is largely due to the high specific surface area of the
solid foam packing materials, aP which is assumed to be fully wetted.


Chapter 3
Hydrodynamics and mass transfer for
co-current upflow
This chapter has been published as:
C.P. Stemmet, M. Meeuwse, J. van der Schaaf, B.F.M. Kuster, J.C. Schouten, Gas-liquid
mass transfer and axial dispersion in solid foam packings, Chem. Eng. Sci., 62, p 5444,
(2007).
Abstract
The mass transfer coefficient and other hydrodynamic parameters are presented for a gas
and liquid (air-water) system moving in a co-current upflow configuration through solid
foam packings in the range of 10 to 40 pores per linear inch (ppi). Axial dispersion in the
liquid has been excluded by observing that the liquid was in plug flow in the range of
superficial liquid and gas velocities studied (0.02 < uL < 0.1 m s−1 and 0.1 < uG < 0.8 m
s−1). Also entrance and exit effects have been taken into account by evaluating the gas-
liquid mass transfer for two different lengths of solid foam packing. The average pore size
of the solid foam (ppi number) does not influence the overall volumetric mass transfer
coefficient. Increasing the gas and liquid velocities increases the gas-liquid mass transfer
and the maximum mass transfer coefficient was found to be approximately 1.3 s −1. The
results are correlated with the energy dissipation rate and compared with a packed bed of
spherical particles.

32 Chapter 3
3.1 Introduction
The chemical industry is continuously developing more active catalysts for multiphase
processes thereby shifting the limitation for the design of a gas-liquid reactor towards the
mass transfer of reactants or products between the gas and the liquid phases rather than
the subsequent mass transfer and reaction in the solid phase. Industrial applications of
multiphase reactors include Fischer-Tropsch synthesis, hydrogenations, oxidations, epox-
idations, and alkylations. The solid catalyst is either in the form of pellets or powders,
hence, either slurry or fixed bed operations are commonly employed. Structured reactor
packings such as monoliths, wire gauze packings, Sulzer Katapak-S, or cloths have the ad-
vantage that they show improved hydrodynamic properties when compared with more
conventional reactor packings, e.g. telleretts and spherical particles, in terms of pressure
drop, flow distribution, and gas-liquid contact. However, these packings have rarely been
employed due to the relatively low surface area to deposit catalysts.
Solid foam packings are available in a variety of materials (metal, carbon, ceramics)
and pore sizes. These foams combine both the properties of high surface area and low
solid holdup especially suited for low pressure drop applications.
This chapter aims at quantifying the mass transfer coefficient for gas-liquid flow through
these solid foam packings when operated in the co-current upflow condition. Hydrody-
namic parameters such as frictional pressure drop per unit height of packing and liquid
holdup are also quantified.
3.1.1 Overall volumetric mass transfer
The overall mass transfer coefficient for sparingly soluble gases is commonly controlled
by the liquid-side film resistance. Thus the overall mass transfer coefficient is equal to the
liquid-side mass transfer coefficient.
The gas-liquid mass transfer coefficient (kLaGL) is mainly determined by the interfacial
area (aGL), which for packings is usually a function of the specific geometric surface area
of the packing and of the liquid holdup. The liquid side mass transfer coefficient (kL) is
determined largely by the slip velocity between the gas and liquid phases. The value of
kLaGL is also affected by the physical properties of the gas-liquid system, the velocities of
the gas and the liquid, the lyophobicity of the solid and the solids holdup.
The axial dispersion coefficient in either the gas or liquid phase characterizes the
amount of mixing with a single parameter, Dax,G or Dax,L. The axial dispersion within a
column may be quantified by performing tracer experiments. A pulse of non-transferring
tracer is introduced at the phase inlet and the residence time distribution of this pulse is
obtained at the reactor outlet. The outlet concentrations are modeled with an axial disper-
sion model as given in Equations 3.1 and 3.2 with the value of kLaGL set to zero; and for
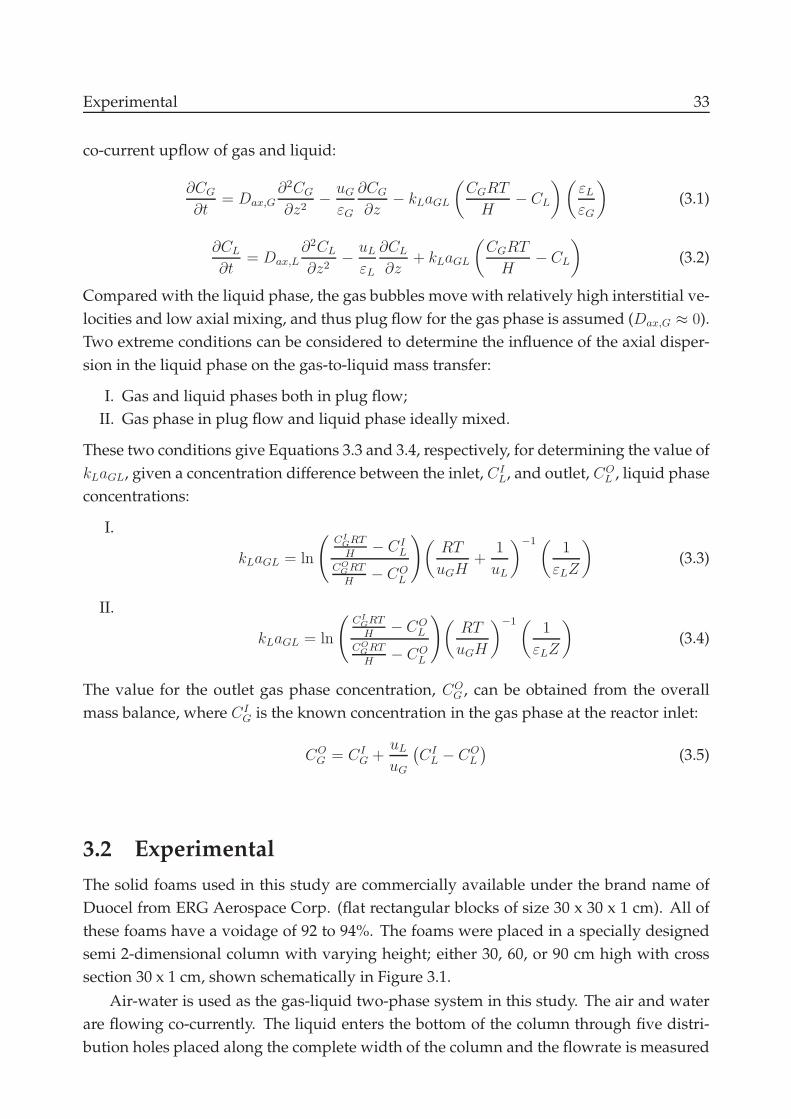
Experimental 33
co-current upflow of gas and liquid:
∂CG
∂t= Dax,G
∂2CG
∂z2− uG
εG
∂CG
∂z− kLaGL
(CGRT
H− CL
)(εL
εG
)
(3.1)
∂CL
∂t= Dax,L
∂2CL
∂z2− uL
εL
∂CL
∂z+ kLaGL
(CGRT
H− CL
)
(3.2)
Compared with the liquid phase, the gas bubbles move with relatively high interstitial ve-
locities and low axial mixing, and thus plug flow for the gas phase is assumed (Dax,G ≈ 0).
Two extreme conditions can be considered to determine the influence of the axial disper-
sion in the liquid phase on the gas-to-liquid mass transfer:
I. Gas and liquid phases both in plug flow;
II. Gas phase in plug flow and liquid phase ideally mixed.
These two conditions give Equations 3.3 and 3.4, respectively, for determining the value of
kLaGL, given a concentration difference between the inlet, CIL, and outlet, CO
L , liquid phase
concentrations:
I.
kLaGL = ln
(CI
GRT
H− CI
L
COGRT
H− CO
L
)(RT
uGH+
1
uL
)−1(1
εLZ
)
(3.3)
II.
kLaGL = ln
(CI
GRT
H− CO
L
COGRT
H− CO
L
)(RT
uGH
)−1(1
εLZ
)
(3.4)
The value for the outlet gas phase concentration, COG , can be obtained from the overall
mass balance, where CIG is the known concentration in the gas phase at the reactor inlet:
COG = CI
G +uL
uG
(CI
L − COL
)(3.5)
3.2 Experimental
The solid foams used in this study are commercially available under the brand name of
Duocel from ERG Aerospace Corp. (flat rectangular blocks of size 30 x 30 x 1 cm). All of
these foams have a voidage of 92 to 94%. The foams were placed in a specially designed
semi 2-dimensional column with varying height; either 30, 60, or 90 cm high with cross
section 30 x 1 cm, shown schematically in Figure 3.1.
Air-water is used as the gas-liquid two-phase system in this study. The air and water
are flowing co-currently. The liquid enters the bottom of the column through five distri-
bution holes placed along the complete width of the column and the flowrate is measured

34 Chapter 3
O2
1
2
4
7
5
8
9
1 cm
30 cm
Air N2
6
30-90 cm
O2
8
L
10
DP
3
Figure 3.1: Co-current upflow setup: 1. Solid foam packed bed, 2. Main liquid supply vessel, 3.Liquid mass flow controller, 4. Liquid control valve, 5. Gas flow control to each of five distributors,6. Air/Nitrogen flow controller, 7. Gas-liquid separator, 8. Dissolved oxygen sensors, 9. Liquidlevel measurement, 10. Differential pressure measurement.
and controlled by a coriolis mass flow meter (Rheonik) and Badger control valve. The gas
enters through five distributor blocks each with 20 holes of 0.5 mm in diameter and in-
dependently controlled by a Brooks thermal mass flow controller. The maximum gas and
liquid flows within the column are 1.4 and 0.1 m s−1, respectively. The liquid is recycled
via a gas-liquid separator back to the supply vessel feeding the pump. In the gas-liquid
separator the liquid level is measured to determine the liquid holdup in the column with
the solid foam. The liquid temperature is maintained at approximately 30◦ Celsius. To
ensure complete wetting of the packing, the column is completely filled with liquid and
thereafter the experiments are conducted at various gas and liquid velocities.
3.2.1 Liquid holdup
The liquid holdup is an important parameter especially for determining the values of
kLaGL and the frictional pressure drop, Pf . The typical flow regimes in an upflow co-
current column are the spray-, bubble- and pulse regimes. The values for the liquid

Experimental 35
holdup were determined in the experimental setup comparing the amount of liquid in
the gas-liquid separator for a 0.3 and a 0.6 m column. The difference in the measured liq-
uid volumes being the additional liquid holdup in the column at specific gas and liquid
flow rates.
3.2.2 Liquid axial dispersion coefficient
The liquid phase axial dispersion coefficient was determined by injecting a pulse of non-
transferring tracer (KCl) at the inlet of the column and by measuring the conductivity
of the liquid with conductivity sensors at the inlet and the outlet (Buerkert, K = 0.1, 0.5-
200 µS cm−1). Examples of the inlet and outlet normalized response curves are given in
Figures 3.2a and 3.2b. The liquid Bodenstein number (BoL) was determined from these
response curves using the linearized transfer function method described by Fahim and
Wakao (1982). The liquid Bodenstein number, BoL, affects the calculation of the gas-liquid
mass transfer coefficient, assuming the liquid as plug flow (Equation 3.3) or well mixed
(Equation 3.4), and thus needs to be determined. Values of the Bodenstein number, BoL,
greater than 10 indicate that plug flow may be assumed for the liquid at the lowest liquid
velocity (uL = 0.02 m s−1). It is expected that at higher liquid velocities the value of BoL
increases and thus plug flow in the liquid phase is assumed for all estimations of kLaGL.
0 50 100 150 200−0.5
0
0.5
1
1.5
2
2.5
3
3.5
4x 10
−3
Time [s]
No
rmal
ized
ou
tpu
t
Inlet
Outlet
(a) uG = 0.1 m s−1 (BoL = 19).
0 50 100 150 200−0.5
0
0.5
1
1.5
2
2.5
3
3.5
4x 10
−3
Time [s]
No
rmal
ized
ou
tpu
t
Inlet
Outlet
(b) uG = 1 m s−1 (BoL = 50).
Figure 3.2: Response of KCl tracer injected into the liquid phase flowing at 0.02 m s−1 through 10ppi solid foam packing.
3.2.3 Mass transfer coefficient
The method of oxygen desorption with nitrogen was used to measure the mass transfer
coefficients within the solid foam packings (CIG = 0). The dissolved oxygen concentrations
were measured at the liquid inlet and outlet using InPro 6800 oxygen sensors (Mettler

36 Chapter 3
Toledo). The liquid from the exit of the column was recycled to the inlet via the gas-liquid
separator, thus during an experiment the liquid phase oxygen concentration gradually
dropped. The value of kLaGL thus obtained is from the pseudo-steady state liquid phase
concentration difference between the inlet and outlet of the column.
3.2.4 Frictional pressure drop
The frictional pressure drop per unit height was measured using a differential pressure
sensor (Druck, LPX9831) connected to the column with the measurement positions spaced
7 cm apart (∆Z = 0.07 m). The measured value is corrected for the liquid holdup as
follows:
Pf =∆Pmeasured
∆Z− ρL
(εL
εL + εG
)
g (3.6)
3.3 Results and discussion
3.3.1 Liquid holdup
The liquid holdup results are shown in Figures 3.3a and 3.3b for different velocities and
ppi numbers respectively. Also indicated are the bubble and pulsing regimes observed.
The spray regime, which occurs at relatively high gas velocities, was not observed in the
current study.
0 0.2 0.4 0.6 0.8 10
0.2
0.4
0.6
0.8
1
Gas velocity, uG
[m s−1
]
Liq
uid
hold
up, ε
L [
mL3 m
P−3]
→ PulseBubble ←→
Liquid velocity
uL = 0.02 m s
−1
uL = 0.04 m s
−1
uL = 0.10 m s
−1
(a)
0 0.2 0.4 0.6 0.8 10
0.2
0.4
0.6
0.8
1
Gas velocity, uG
[m s−1
]
Liq
uid
hold
up, ε
L [
mL3 m
P−3]
→ PulseBubble ←→
10 ppi, uL = 0.02 m s
−1
10 ppi, uL = 0.04 m s
−1
40 ppi, uL = 0.02 m s
−1
40 ppi, uL = 0.04 m s
−1
(b)
Figure 3.3: Liquid holdup for (a) 10 ppi solid foam packing at different liquid velocities, and (b)comparing the liquid holdup for 10 and 40 ppi solid foam packings in the co-current upflow config-uration.
The liquid holdup increases with increasing liquid velocity and decreasing gas veloc-
ity, up to the maximum voidage of the solid foam packings (93%). The liquid is moving
upward with a certain velocity, and as the residence time of the gas phase in the column
decreases, the gas holdup decreases, effectively increasing the liquid holdup. The liquid

Results and discussion 37
holdup increases as the ppi number of the solid foam increases. As the ppi number in-
creases the average pore cell size decreases resulting in higher capillary pressures and
higher static liquid holdup.
3.3.2 Frictional pressure drop
The frictional pressure drop per unit height is calculated with Equation 3.6 and presented
in Figure 3.4. Increasing the liquid and gas velocities increases the frictional pressure drop.
Also, the pressure drop increases by increasing the ppi number. At the highest liquid ve-
locity investigated (uL = 0.1 m s−1) the 40 ppi solid foam packing has a significant increase
in frictional pressure drop over the 10 ppi solid foam packing, when the gas is introduced.
The high liquid velocity possibly causes the gas-liquid flow to homogenize giving higher
interaction with the solid struts. The 40 ppi solid foam packing has more struts restricting
the flow and the frictional pressure drop increases. At lower liquid velocities this interac-
tion is lower because the gas phase is moving through as bubbles or pulses and the liquid
as the continuous phase the interaction with the solid is less pronounced. The pressure
drop per unit height is relatively low due to the open structure of the solid foam packing
(voidage approximately 93%).
0 0.5 1 1.5 20
50
100
150
200
250
300
Gas velocity, uG
[m s−1
]
Fri
ctio
nal
pre
ssu
re d
rop
, P
f [1
02 P
a m
−1]
uL = 0.02 m s
−1, 10 ppi
uL = 0.04 m s
−1, 10 ppi
uL = 0.10 m s
−1, 10 ppi
uL = 0.02 m s
−1, 40 ppi
uL = 0.04 m s
−1, 40 ppi
uL = 0.10 m s
−1, 40 ppi
Figure 3.4: Frictional pressure drop, Pf , for 10 and 40 ppi solid foam packings at different liquidvelocities in the co-current upflow configuration.
3.3.3 Overall mass transfer coefficient
Effect of liquid phase axial dispersion coefficient
The liquid phase axial dispersion has a large effect on the calculation of the mass transfer
coefficient as can be seen in Figure 3.5 , using Equations 3.3 and 3.4. Results from the tracer

38 Chapter 3
studies indicated that the values of BoL were greater than 10 for the range of the liquid
and gas velocities studied (0.02 < uL < 0.1 m s−1 and 0.1 < uG < 0.8 m s−1).
0 0.2 0.4 0.6 0.8 10
0.5
1
1.5
2
2.5
3
3.5
4
Gas velocity, uG
[m s−1
]
kLa G
L [
s−1]
k
La
GL for plug flow (Bo
L → ∞)
Range of kLa
GL (10 < Bo
L < ∞)
kLa
GL for well mixed liquid
Figure 3.5: Mass transfer coefficient for 10 ppi foam for different liquid Bodenstein numbers (BoL),uL = 0.02 m s−1.
Figure 3.5 shows the values of kLaGL determined by solving the PDE’s given in Equa-
tions 3.1 and 3.2 in Matlab R© assuming Dankwerts’ closed boundary conditions with BoL =
10, and the gas phase in plug flow, Dax,G = 0. Figure 3.5 shows that the influence of this
value of BoL on kLaGL is quite small, which suggests that plug flow of the liquid phase,
i.e. Equation 3.3, is a fair assumption for all results; further results are evaluated using this
assumption.
Entrance and exit effects
The so-called entrance effect is caused by the gas and liquid distribution. The column
entrance is the region where the bubble size distribution and flow velocities have not
stabilized yet. Here a higher value of kLaGL is expected due to the small bubbles exiting
the distributor, moving at quite high velocities. The exit effect accounts for additional mass
transfer occurring between the gas and liquid phases from the column outlet to where the
exit oxygen concentration is measured. At given gas and liquid velocities the entrance
and exit effects are assumed to be constant. Luo and Ghiaasiaan (1997) have accounted
for these effects by evaluating kLaGL using Equation 3.7, where Z ′ and Z ′′ are two different
lengths of packing; in our case 0.3 and 0.6 m:
kLaGL =(kLaGL)Z′Z ′ − (kLaGL)Z′′Z ′′
Z ′ − Z ′′(3.7)
In Figure 3.6 the values of kLaGL are shown for lengths of 10 and 40 ppi solid foam pack-
ings of 0.6 m and 0.3 m. If the entrance and exit effects are not considered, the mass

Results and discussion 39
transfer coefficient is up to 20% higher, and increases to 150% at low liquid velocities. The
entrance and exit effects for the 10 ppi solid foam packing at the lower liquid velocity, see
Figure 3.6a (especially in the pulse regime), contribute significantly to the gas-liquid mass
transfer coefficients measured, resulting in low values of kLaGL. This is not observed in
the 40 ppi solid foam packing. Possibly the more densely packed struts of the 40 ppi solid
foam packing reduce the entrance effect. The mass transfer coefficients obtained for the
different lengths of packings can be reproduced to within 5%.
0 0.2 0.4 0.6 0.8 10
0.2
0.4
0.6
0.8
1
Gas velocity, uG
[m s−1
]
kLa G
L [
s−1]
(k
La
GL)Z = 30 cm
(kLa
GL)Z = 60 cm
kLa
GL by Equation 3.7
(a) uL = 0.02 m s−1, 10 ppi
0 0.2 0.4 0.6 0.8 10
0.2
0.4
0.6
0.8
1
Gas velocity, uG
[m s−1
]
kLa G
L [
s−1]
(k
La
GL)Z = 30 cm
(kLa
GL)Z = 60 cm
kLa
GL by Equation 3.7
(b) uL = 0.04 m s−1, 10 ppi
0 0.2 0.4 0.6 0.8 10
0.2
0.4
0.6
0.8
1
Gas velocity, uG
[m s−1
]
kLa G
L [
s−1]
(k
La
GL)Z = 30 cm
(kLa
GL)Z = 60 cm
kLa
GL by Equation 3.7
(c) uL = 0.02 m s−1, 40 ppi
0 0.2 0.4 0.6 0.8 10
0.2
0.4
0.6
0.8
1
Gas velocity, uG
[m s−1
]
kLa G
L [
s−1]
(k
La
GL)Z = 30 cm
(kLa
GL)Z = 60 cm
kLa
GL by Equation 3.7
(d) uL = 0.04 m s−1, 40 ppi
Figure 3.6: Mass transfer coefficient for 10 ppi solid foam packing, (a) and (b), and 40 ppi solidfoam packing, (c) and (d), for 0.6 m and 0.3 m packing height, and after accounting for the entranceand exit effects by Equation 3.7.
Effect of liquid velocity
Figure 3.7a gives the results of the mass transfer coefficient for different gas and liquid
velocities. The results indicate a smooth transition when going from the bubble to the

40 Chapter 3
pulse regime (at approximately 0.3 m s−1) and in general the higher the liquid velocity the
higher the overall mass transfer coefficient. Surface renewal theory describes gas-liquid
mass transfer according to the following proportionality:
kL ∝ 1√te
(3.8)
where te is an assumed exposure time. Mass transfer between the gas and liquid phases
is thought to occur mainly with liquid remaining on the solid foam packing structure
when a gas bubble passes. As the liquid velocity increases, the bubble moves through
the solid foam at a higher velocity and the contact time of the bubble with the liquid on
the packing decreases. Thus, according to surface renewal theory, the value of the mass
transfer coefficient increases with increasing liquid velocity, as observed.
0 0.2 0.4 0.6 0.8 10
0.2
0.4
0.6
0.8
1
1.2
1.4
Gas velocity, uG
[m s−1
]
kLa G
L [
s−1]
→ PulseBubble ←→
10 ppi, uL = 0.02 m s
−1
10 ppi, uL = 0.04 m s
−1
10 ppi, uL = 0.10 m s
−1
40 ppi, uL = 0.02 m s
−1
40 ppi, uL = 0.04 m s
−1
(a)
0 0.2 0.4 0.6 0.8 10
0.1
0.2
0.3
0.4
0.5
0.6
0.7
0.8
→ PulseBubble ←→
Gas velocity, uG
[m s−1
]
kLa G
L ⋅ ε
L [
m3 L m
−3
P s
−1]
10 ppi, uL = 0.02 m s
−1
10 ppi, uL = 0.04 m s
−1
10 ppi, uL = 0.10 m s
−1
40 ppi, uL = 0.02 m s
−1
40 ppi, uL = 0.04 m s
−1
(b)
Figure 3.7: Mass transfer coefficient (a) per unit of liquid volume and (b) per unit of reactor vol-ume for 10 and 40 ppi solid foam packings for different liquid velocities in the co-current upflowconfiguration.
Effect of ppi number
In Figure 3.7b the mass transfer coefficient per unit of reactor volume, kLaGL εL, is given.
The main contribution to the gas-liquid mass transfer coefficient is thought to occur be-
tween liquid films remaining on the solid foam packing as the gas passes by in the form of
bubbles or slugs. These liquid films are refreshed by the continuous liquid phase. At the
low liquid velocity (uL = 0.02 m s−1) the gas-liquid mass transfer for the 10 ppi solid foam
packing decreases for increasing gas velocity and is lower than measured for the 40 ppi
solid foam packing. Entrance and exit effects contributing to the mass transfer possibly
cause local depletion of the oxygen in the liquid film and low refreshment by mixing with
the continuous liquid phase. This is not observed for the 40 ppi solid foam packing. At the

Results and discussion 41
highest liquid velocity the measurement of kLaGL was not performed for the 40 ppi solid
foam packing because liquid holdup measurements could not be done, and thus a com-
parison between 10 and 40 ppi solid foam packings is only possible for the intermediate
liquid velocity. At the intermediate liquid velocity (uL = 0.04 m s−1), the liquid holdup is
similar at the same flow conditions for 10 and 40 ppi solid foam packings. A higher solid
geometric surface is available which does not generate a higher mass transfer coefficient
(1080 and 4300 m2 m−3 respectively, using the unit cell approach, Fourie and Plessis, 2002).
This can be due to a lower value of the liquid-side mass transfer coefficient, kL. If the as-
sumption is made that the area for the gas-liquid mass transfer is equal to the surface area
of the solid foam, aP , covered with a liquid film exposed to the gas, εG, i.e. aGL ≈ aP · εG,
an approximate value for kL may be obtained, given in Figure 3.8.
The value of kL remains constant over the entire range of gas velocities for most of the
solid foam packings and velocities, with only the 10 ppi solid foam for the lowest velocity
case giving lower values of kL. This decrease in the values of kL are not expected and
are possibly due to entrance and exit effects affecting these results. Also observed is that
as the ppi number of the solid foam increases, the value of kL decreases. The distance
between the struts making up the solid foam decreases as the ppi number increases, and
as the liquid flows through the foam it encounters more of these restrictions to the flow,
observed also by an increase in the pressure drop. These small restrictions to the flow
decrease the local velocity of the liquid flowing over the solid foam packing which results
in a lower turbulence and hence a lower kL. It may also be argued that the lower kL for the
higher ppi solid foam packing is a result of the strut thicknesses being smaller, incapable
of inducing large eddies in the liquid phases, leading to a reduced level of turbulence in
the flowing liquid.
3.3.4 Comparison with other packings
The solid foam packings give high rates of mass transfer, in the order of 0.1-1.3 s−1 for
the range of gas and liquid velocities studied. The mass transfer coefficient per unit of
reactor volume (kLaGL εL) is plotted against the level of energy dissipation for the solid
foam packings and other (spherical) packings in Figure 3.9. Losey et al. (2001) report
mass transfer coefficients for packed micro-reactors in the range of 5 to 15 s−1. However,
when the intersticial velocity (assuming εL ≈ 0.2) is used for the energy dissipation term,
the results may be compared with that of Specchia et al. (1974), where 6 mm spherical
particles were studied. The high voidage in the solid foam packings (93% compared to
40% for spherical particles) results in lower intersticial liquid velocities and hence the
associated mass transfer coefficients are lower. This can also be associated with a lower
rate of energy dissipation (lower pressure drop per unit height of packing) as seen in
the correlation. This correlation takes the liquid holdup into account when calculating the
energy dissipation term and is able to compare reactors packed with structures of different

42 Chapter 3
0 0.2 0.4 0.6 0.8 10
0.5
1
1.5
Gas velocity, uG
[m s−1
]
kL [
10
3 m
L s
−1]
10 ppi, u
L = 0.02 m s
−1
10 ppi, uL = 0.04 m s
−1
10 ppi, uL = 0.10 m s
−1
40 ppi, uL = 0.02 m s
−1
40 ppi, uL = 0.04 m s
−1
Figure 3.8: Intrinsic liquid-side mass transfer coefficient, kL, for 10 and 40 ppi solid foam packingsfor different liquid velocities in the co-current upflow configuration. At the lowest liquid velocity,uL = 0.02 m s−1 the decrease in kL for the 10 ppi solid foam packing is ascribed to local depletionof the liquid film remaining on the solid surface.
100
101
102
103
104
105
10−1
100
101
102
Energy dissipation, EL ( = P
f u
L ε
L
−1) [W m
P
−3]
kLa G
L ε
L [
m3 L m
−3
P s
−1]
u
L = 0.02 m s
−1, 10 ppi foam
uL = 0.04 m s
−1, 10 ppi foam
uL = 0.10 m s
−1, 10 ppi foam
uL = 0.02 m s
−1, 40 ppi foam
uL = 0.04 m s
−1, 40 ppi foam
uL = 0.02 m s
−1, 6 mm spheres
uL = 0.04 m s
−1, 6 mm spheres
400 µm packed micro−reactor, 75 µm spheres
kLa
GL ε
L = 0.0134 ⋅ E
L
0.44
Figure 3.9: Mass transfer coefficient for 10 and 40 ppi solid foam packings at different levels ofspecific energy dissipation, EL. A comparison is made with spherical particles (Specchia et al.(1974)) and packed micro-reactors (Losey et al. (2001)).

Conclusions 43
voidages. A similar equation was found by Hirose et al. (1974) for co-current downflow.
3.4 Conclusions
Volumetric mass transfer coefficients are presented for solid foam packings in the range of
10 to 40 ppi. The following conclusions can be drawn:
• The liquid axial dispersion is low, with BoL greater than 10 for the solid foam pack-
ings in the range of the liquid and gas velocities studied (0.02 < uL < 0.1 m s−1 and
0.1 < uG < 0.8 m s−1).
• Exit and entrance effects tend to increase kLaGL and can be accounted for by using
Equation 3.7 for two different lengths of packing. For 10 ppi solid foam packing at a
low liquid velocity uL = 0.02 m s−1 the measurement of the gas-liquid mass transfer
coefficient is low due to high contributions of entrance and exit effects.
• Volumetric mass transfer coefficients, kLaGL, are not a function of the ppi number
of the solid foam packing, but increase with increasing gas and liquid velocities.
Experimentally found values of the volumetric mass transfer coefficients are high
and in the range of 0.1 to 1.3 s−1.
• The mass transfer coefficient per unit of reactor volume, kLaGLεL, were correlated
against the rate of energy dissipation, and this equation, kLaGL εL = 0.014 E0.44L , is
also valid for packings with different voidages.


Chapter 4
Hydrodynamics and mass transfer for
co-current downflow
This chapter will be submitted for publication as:
C.P. Stemmet, F. Bartelds, J. van der Schaaf, B.F.M. Kuster, J.C. Schouten, Hydrodynamics
and mass transfer for gas-liquid co-current downflow through solid foam packings, Ind.
& Eng. Chem. Res., in preparation, (2008).
Abstract
The gas-liquid mass transfer coefficient and the liquid holdup are presented for a gas and
liquid (air-water) system moving in a co-current downflow configuration through solid
foam packings of 10 and 40 pores per linear inch (ppi). The superficial liquid and gas
velocities studied are 0.02 < uL < 0.05 m s−1 and 0.1 < uG < 0.8 m s−1, respectively.
In the trickle flow regime the gas-liquid mass transfer coefficient increases as the average
pore size of the solid foam packing increases. This is possibly due to the increase in the
average strut diameter which creates more turbulence in the liquid phase. The gas-liquid
mass transfer coefficient is not influenced by the gas velocity in the trickle flow regime,
whereas increasing the liquid velocity increases the gas-liquid mass transfer coefficient.
The intrinsic mass transfer coefficient, kL, was estimated to be an order of magnitude
smaller than in the co-current upflow configuration under similar gas and liquid flow
rates. Slug flow was observed at high gas flow rates and the gas-liquid mass transfer
coefficient is significantly higher than in the trickle flow regime.
The gas-liquid mass transfer coefficient per unit of reactor volume, kLaGLεL, for co-
current downflow through 10 ppi solid foam packings is correlated by the following equa-
tion:
kLaGL εLDL−1 = 3.7 (uLρLµL
−1)1.16
(ScL)0.5 [SI units, mL m−3
P ]

46 Chapter 4
4.1 Introduction
In the chemical industry large quantities of gas streams are processed and purified by the
stripping of gas components into suitable liquids using trickle beds, either by physical
or chemical absorption. These beds are commonly packed with catalytically active par-
ticles and act as the reactors for many processes such as hydro-desulphurization, hydro-
cracking, hydro-treating, or sorbitol production. These reaction processes occurring on
the solid surface are often limited by the rate of gas-liquid mass transfer and by the liquid
capacity before slug flow (pulse downflow) is observed. Structured reactor packings such
as monoliths, wire gauze packings, Sulzer Katapak-S, or cloths have the advantage that
they show improved hydrodynamic properties when compared with more conventional
reactor packings, e.g. telleretts and spherical particles, in terms of pressure drop, flow dis-
tribution, and gas-liquid contact. Also higher production rates can be achieved due to the
higher voidage of these structured packings. However, these packings have rarely been
employed for catalytic reactions due to the relatively low surface area to deposit catalysts.
Solid foam packings are another type of structured packing and combine high specific
surface area and low solid holdup and are especially suited for low pressure drop applica-
tions. This is due to the high voidage of the open-celled structure (up to 97%). These solid
foam packings are available in a variety of materials (metal, carbon, ceramics) and pore
sizes. In Figure 1.4 (page 4) images of the reticulated structure described by the pores per
linear inch (ppi) is given, both at the same voidage. As the cell-size increases (ppi number
decreasing) the struts making up the cell also increases in diameter.
This chapter aims at quantifying the gas-liquid mass transfer coefficient for gas-liquid
flow through these solid foam packings (10 ppi and 40 ppi) when operated in the co-
current downflow condition. The liquid holdup is also quantified over a range of gas and
liquid velocities.
4.1.1 Gas-liquid mass transfer coefficient
The gas-liquid mass transfer coefficient (kLaGL) is mainly determined by the gas-liquid
interfacial area (aGL). This area is usually a function of the specific geometric surface
area of the packing, in the order of 103 to 104 m2S m−3
P for solid foams, and of the liquid
holdup, εL. The liquid-side mass transfer coefficient (kL) is determined largely by the
liquid velocity in the co-current downflow condition. The values of kL and aGL are also
affected by the physical properties of the gas-liquid system, the velocities of the gas and
the liquid (uG and uL, respectively), the lyophobicity of the solid, and the solids holdup.
The flow through the solid foam in the co-current upflow configuration may be regarded
to be in plug flow, Section 3.3.3 (page 37), and it can also be assumed also for the co-current
downflow configuration as the axial dispersion in this configuration is considered to be
lower, Alper (1983).

Experimental 47
Sherwood and Holloway (1940) have presented their results for the gas-liquid mass
transfer coefficient for 0.5 to 1.5-inch Raschig rings, Berl saddles, and 3-inch spiral tiles
operating in the co-current downflow configuration in the following form:
kLaGL εL
DL
= λ
(uLρL
µL
)n
(ScL)0.5 (4.1)
where λ and n are constants that characterize the packing, DL is the diffusivity of the gas in
the liquid, and ScL is the Schmidt number of the liquid, µL/(ρLDL). Here for the packings
investigated, a constant value of n was found (in the range of 0.78 to 0.72) for all sizes of the
packings. Spherical particles (4.1 mm to 0.54 mm) were also investigated, Goto and Smith
(1975), and the value of n was found to be 0.40. In both studies the value of λ increases
with decreasing particle size. This dependency of λ on the size of the packing is possibly
due to the difficulty in defining the characteristic length for gas-liquid mass transfer. This
characteristic length gives an average contact time, te, for mass transfer between pockets
of gas and liquids to occur given by the penetration theory for mass transfer:
kL = 2
√
DL
πte(4.2)
The contact time is an averaged value describing the intrinsic gas liquid mass transfer
coefficient and is dependent on the liquid velocity as it flows over the surface. At the
gas-liquid surface a pocket of liquid stays and interacts with the gas for this contact time
and reducing this contact time increases the mass transfer. This is because the pocket of
liquid is refreshed by mixing with the bulk liquid. This micromixing can be increased
by turbulence within the bulk liquid and for single phase flowing through solid foam
packings has been found to increase, Ferrouillat et al. (2006), with decreasing ppi number
(larger pore diameters). This counterintuitive result is explained by considering the flow
as external flow around a tube and that larger struts making up the solid foam packings
generate higher levels of turbulence within the liquid. In the gas-liquid trickle flow the
liquid flows as a film over the surface of the solid foam packing, similar to the single
phase. Increased gas-liquid mass transfer due to higher micromixing for decreased ppi
lumber (larger pore diameters) is evaluated experimentally.
4.2 Experimental
The solid foam packings used in this study are made of aluminum and have a voidage of
93%. Solid foam packings of 10 and 40 ppi, commercially available from ERG Aerospace
Corp., have been used for this study. These foams were placed in a semi 2-dimensional
column with varying height; either 30, 60, or 90 cm high with a cross section of 30 cm by 1
cm, shown schematically in Figure 4.1. All measurements are obtained at a temperature of

48 Chapter 4
O2
1
2
4
7
5
8
9
1 cm
30 cm
Air N2
6
30-90 cm
O2
8
L
10
DP
3
Figure 4.1: Co-current downflow setup: 1. Solid foam packed bed, 2. Main liquid supply vessel, 3.Liquid mass flow controller, 4. Liquid control valve, 5. Gas flow control to each of five distributors,6. Air/Nitrogen flow controller, 7. Gas-liquid separator, 8. Dissolved oxygen sensors, 9. Liquidlevel measurement, 10. Differential pressure measurement.
30◦C. The volumetric mass transfer coefficient was measured using the method of oxygen
desorption (DL = 2.75 × 10⁻⁹ m2L s−1 for oxygen in water, at 30◦C) by measuring the
dissolved oxygen concentration at the liquid inlet and outlet (InPro 6800 oxygen sensors
Mettler Toledo). The following equations (assuming plug flow) are used to determine
the gas-liquid mass transfer coefficient as in the co-current upflow configuration (Section
3.1.1, page 32):
kLaGL = ln
(CI
GRT
H− CI
L
COGRT
H− CO
L
)(RT
uGH+
1
uL
)−1(1
εLZ
)
(4.3)
COG = CI
G +uL
uG
(CI
L − COL
)(4.4)
where CIG and CO
G are the inlet and outlet gas phase concentrations, respectively, CIL and
COL are the inlet and outlet liquid phase concentrations, respectively, R is the universal
gas constant, T is the temperature, H is the Henry coefficient, and Z is the height of the
packing. In the co-current upflow configuration (Section 3.3.3, page 3.3.3) it was shown

Results and discussion 49
that the entrance and exit effects affect the gas-liquid mass transfer coefficient and thus
also here the gas-liquid mass transfer coefficient for two different heights of packings (Z ′′
= 30 cm and Z ′ = 60 cm) were used to evaluate the contribution of the solid foam packing
by the following equation:
kLaGL =(kLaGL)Z′Z ′ − (kLaGL)Z′′Z ′′
Z ′ − Z ′′(4.5)
The liquid holdup was measured in the co-current downflow regime as for the co-
current upflow configuration, Section 3.2.1, page 34. Mainly the trickle flow regime was
observed, but slug flow was observed for superficial gas velocities higher than 0.7 m s−1.
4.3 Results and discussion
4.3.1 Liquid holdup
Figure 4.2 gives the results for the liquid holdup for the 10 and 40 ppi solid foam packings.
The liquid holdup is mainly dependent on the liquid velocity, uL, and gradually decreases
as the gas velocity is increased. The intersticial liquid velocity for the different superficial
liquid velocities remains virtually constant (uL/εL ≈ 0.1 mL s−1), but increases slightly
with increasing gas velocity. The relatively constant nature of the intersticial velocity is
mainly due to gravity being the main force acting on the liquid volume as it flows down
the solid foam packing. As the gas velocity is increased, the friction between the gas
and liquid increases and the liquid film has a slightly higher intersticial velocity and thus
slightly thinner liquid films result.
0 0.2 0.4 0.6 0.8 10
0.1
0.2
0.3
0.4
0.5
Gas velocity, uG
[m s−1
]
Liq
uid
ho
ldu
p, ε
L [
mL3 m
P−3]
u
L = 0.02 m s
−1, 10 ppi
uL = 0.04 m s
−1, 10 ppi
uL = 0.02 m s
−1, 40 ppi
uL = 0.04 m s
−1, 40 ppi
Figure 4.2: Liquid holdup, εL, for solid foam packings in the co-current downflow configuration.

50 Chapter 4
4.3.2 Gas-liquid mass transfer coefficient
0 0.2 0.4 0.6 0.8 10
0.02
0.04
0.06
0.08
0.1
0.12
Gas velocity, uG
[m s−1
]
kLa G
L ε
L [
m3 L m
P−3 s
−1]
uL = 0.02 m s
−1, 10 ppi
uL = 0.04 m s
−1, 10 ppi
uL = 0.02 m s
−1, 40 ppi
uL = 0.04 m s
−1, 40 ppi
(a) kLaGLεL
0 0.005 0.01 0.015 0.02 0.025 0.030
0.005
0.01
0.015
0.02
0.025
0.03
−20%
+20%
kLa
GL ε
L D
L
−1 Model [10
9 m
L m
P
−3]
kLa G
L ε
L D
L−1 E
xper
imen
tal
[10
9 m
L m
P−3]
10 ppi :kLaGL εL
DL= 3.7
(uLρL
µL
)1.16
Sc0.5L
uL = 0.02 m s
−1
uL = 0.03 m s
−1
uL = 0.04 m s
−1
uL = 0.05 m s
−1
(b) Parity plot
Figure 4.3: (a) Mass transfer coefficient per unit of reactor volume, kLaGLεL, for solid foam pack-ings in the co-current downflow configuration at different liquid viscosities, µL. The circle (©)indicates experiments where slug flow was observed. In (b) the parity plot of the correlation ofkLaGLεL with superficial liquid velocity as described in Equation 4.1 is given for the 10 ppi solidfoam packing.
Figure 4.3a shows the mass transfer coefficient in the co-current downflow configura-
tion. For the 10 ppi solid foam packing, the mass transfer coefficient decreases as the liquid
velocity decreases. The mass transfer is constant in the trickle flow regime with increas-
ing gas velocity, while it decreases with increasing ppi number (decreasing cell size). This
can be explained by the increase in the strut size of the solid foam packing decreasing ppi
number. These struts serve as flow obstructions for the liquid phase when the liquid film
flows down the solid foam packing. The larger the obstruction, the higher the degree of
turbulence (in the form of liquid circulation eddies or wakes), and hence an increase in the
refreshment of the liquid at the gas-liquid interface and enhanced gas-liquid mass transfer
result. In Figure 4.3b a parity plot of the mass transfer coefficient per unit of reactor vol-
ume, described by Equation 4.1, is given and is largely affected by the liquid velocity. The
values of the correlating parameters λ and n were found to be 3.68 ± 0.79 and 1.16 ± 0.30,
respectively, giving the following correlation for the 10 ppi solid foam packing:
kLaGL εL
DL
= 3.68
(uLρL
µL
)1.16
(ScL)0.5 (4.6)
The value of n is higher than the values found for spherical particles, Berl saddles and
Raschig rings (0.4, 0.72 and 0.78, respectively), but a general trend emerges that increasing
the voidage of the packing (0.44, 0.65-0.7 and 0.72-0.77, respectively), increases the value
of n. Thus the higher value of n for solid foams is expected (n = 1.16 for εS = 0.93).

Results and discussion 51
However, in contrast to other packings investigated (where the value of λ increases with
decreasing packing size), decreasing the cell size (10 ppi to 40 ppi) clearly gives lower
values of kLaGLεL, see Figure 4.3a, and hence a lower value of λ. In the case of spherical
particles, smaller particles generate higher levels of turbulence and, in the case of solid
foams, a smaller unit cell (smaller struts) delivers less gas-liquid mass transfer. This is
also reflected in the value of n being greater that one. In general a correlation such as for
liquid-solid mass transfer, as for single phase flow through solid foam packings, Pletcher
and Whyte (1991), should also be observed for gas-liquid mass transfer, i.e.:
(kLl
DL
)
∝(
uLρLl
µL
)n
Sc0.5L (4.7)
where the Sherwood number (kLl/DL) and the Reynolds number (uLρLl/µL) are corre-
lated for a characteristic length scale, l. For multiphase systems the value of l is difficult
to define (boundary layer analogies with heat transfer done for single phase studies are
not applicable). However, Equation 4.7 indicates that a lower value of kL is expected for
smaller value of l for values of n greater than one, which is what we find for solid foam
packings. This indicates that the value of l (and the associated Reynolds number) for 40
ppi is smaller than that of the 10 ppi solid foam packing. In the pulsing regime the mass
transfer coefficient increases due to the refreshment of the liquid on the solid surface with
passing liquid pulses and possibly as a result of a higher degree of wetting of the solid
surface.
4.3.3 Intrinsic liquid-side mass transfer coefficient
0 0.2 0.4 0.6 0.8 10
0.01
0.02
0.03
0.04
0.05
Gas velocity, uG
[m s−1
]
kL [
10
3 m
L s
−1]
10 ppi, uL = 0.02 m s
−1
10 ppi, uL = 0.04 m s
−1
40 ppi, uL = 0.02 m s
−1
40 ppi, uL = 0.04 m s
−1
Figure 4.4: Intrinsic liquid-side mass transfer coefficient, kL, for solid foam packings in the trickleflow regime for the co-current downflow configuration.
In Figure 4.4 the value for the intrinsic mass transfer coefficient is given for 10 and 40

52 Chapter 4
ppi solid foam packings in the downflow configuration. If we assume that the liquid flows
over the solid foam packing in the form of a thin film, an estimate of the film area, aGL, can
be made from Figure 1.11a (page 11) by replacing the solid holdup, εS, by (εS + εL). This
assumption may not always apply as pore filling or coalescence of liquid films (resulting
in channeling) would result in lower gas-liquid interfacial areas. However, using this as-
sumption, the results indicate that the value of kL is dependant on both the liquid velocity
and the ppi number of the solid foam packings, but independent of the gas velocity. In
the co-current downflow configuration, the liquid film is continuously exposed to the gas
phase and refreshment of the liquid film at the gas-liquid interface is mainly caused by dis-
turbances in the liquid film as the liquid flows down the struts making up the solid foam.
This results in the formation of liquid eddies when liquid flows past the struts making up
the solid foam packing. The results indicate that the intrinsic mass transfer coefficient for
the co-current downflow configuration is higher for the 10 ppi solid foam packing than
for 40 ppi, approximately a factor 4. This higher rate of mass transfer is a result of higher
local mixing within the film flowing over the 10 ppi solid foam packing due to the larger
strut thickness (0.55 mm compared to 0.07 mm for the 40 ppi solid foam packing, accord-
ing to the unit cell model, Fourie and Plessis (2002)). This resulting local mixing occurring
within the film is similar to the single phase study, Ferrouillat et al. (2006), where larger
struts were found to generate higher turbulence in the liquid and shorter micromixing
times. Therefore the strut thickness, and hence the ppi number of the solid foam packing,
has a large influence on the resulting value of kL.
The value of kL for the co-current downflow configuration is an order of magnitude
lower than that for the co-current upflow configuration, see Figure 3.8, page 42. In the
co-current upflow configuration the liquid film on the solid foam packing is continuously
being refreshed by the bulk liquid after the passing of a gas bubble, and hence the contact
time decreases giving an increase in the value of kL. This indicates a higher level of turbu-
lence and shorter micromixing times for solid foam packings operating in the co-current
upflow configuration when compared to the downflow configuration.
4.4 Conclusions
• The gas-liquid mass transfer coefficient per unit of reactor volume, kLaGLεL, for co-
current downflow through the 10 ppi solid foam packing is correlated by the follow-
ing equation:
kLaGL εL
DL
= 3.68
(uLρL
µL
)1.16
(ScL)0.5 [SI units, mL m−3
P ]
• The gas-liquid mass transfer for 40 ppi solid foam packings is lower than for 10 ppi
solid foam packings due to the lower characteristic length for mass transfer. This

Conclusions 53
characteristic length is difficult to define for gas-liquid mass transfer and is related
to the level of turbulence in the liquid phase.
• The intrinsic mass transfer coefficient, kL, for the 10 ppi solid foam packing is about
4 times higher than for the 40 ppi solid foam packing due to the higher turbulence
created in the liquid film as it flows over the surface. This higher turbulence is caused
by the larger strut size of the 10 ppi solid foam packing. In the co-current downflow
regime the intrinsic mass transfer coefficient is a factor 10 times smaller than in the
upflow configuration.


Chapter 5
Influence of liquid viscosity and surface
tension on the hydrodynamics and mass
transfer in co-current flow configurations
This chapter is accepted for publication as:
C.P. Stemmet, F. Bartelds, J. van der Schaaf, B.F.M. Kuster, J.C. Schouten, Gas-liquid mass
transfer coefficient for solid foam packings in co-current flow configurations: Influence of
liquid viscosity and surface tension, Chem. Eng. Res. Des., accepted (2008).
Abstract
The gas-liquid mass transfer coefficient and other hydrodynamic parameters such as liq-
uid holdup and frictional pressure drop are presented for gas and liquid moving in co-
current flow configurations (upflow and downflow) through solid foam packings of 10
and of 40 pores per linear inch (ppi). The effect of increasing the liquid viscosity on the
mass transfer coefficient in the co-current upflow configuration is quantified and corre-
lated to the frictional pressure drop, a measure of the frictional energy dissipation:
kLaGL εL(ScL/ScWater)0.69 = 2.05 × 10⁻⁴ P 0.8
f [SI units, m3L m−3
P s−1]
The gas-liquid mass transfer coefficient in the co-current downflow configuration is cor-
related to the liquid velocity and the Schmidt number using the correlation proposed by
Sherwood and Holloway (1940):
kLaGL εLDL−1 = 3.7 (uLρLµL
−1)1.16
(ScL)0.5 [SI units, mL m−3
P ]
The results for the gas-liquid mass transfer coefficient in the co-current upflow configu-
ration were correlated with a similar equation, where the influence of the gas velocity is
included, similar to the correlations for packed beds of spherical particles proposed in
Fukushima and Kusaka (1979):
kLaGL εLDL−1 = 311u0.44
G (uLρLµL−1)
0.92(ScL)0.5 [SI units, mL m−3
P ]
In this study the liquid Schmidt number dependency of the gas-liquid mass transfer coef-
ficient points to the penetration theory describing the rate of mass transfer for gas-liquid
flow through solid foam packings.
56 Chapter 5
5.1 Introduction
The chemical industry uses multiphase reactors operating under a variety of physical
conditions (e.g., total pressure, aqueous or organic liquids) for reactions which include
Fischer-Tropsch synthesis, hydrogenation, oxidation, epoxidation, alkylation, etc. Hydro-
dynamic parameters and gas-liquid mass transfer under process conditions are important
for the design and operation of these reactors. Scaling rules for the design of these indus-
trial reactors are common but have to be evaluated especially when a different structure
is used as the catalyst support. The solid catalyst is usually in the form of pellets or pow-
ders. Hence, either slurry or fixed bed operations are commonly employed. The fixed bed
operation of catalytic reactors has received a lot of attention over the last few decades and
different packing structures have been proposed as a catalyst support. In Dudukovic et al.
(2002) a review of the correlations thus far developed to describe the hydrodynamics and
mass transfer for co-current upflow (flooded bed reactor) and downflow (trickle bed re-
actor) has been given. Bensetiti et al. (1997) use artificial neural networks to correlate the
liquid holdup with dimensionless numbers for packings with a voidage in the range of
0.37 to 0.47 for co-current upflow. Iliuta et al. (1999) correlate the gas-liquid mass transfer
coefficient for co-current downflow to dimensionless numbers also using artificial neural
networks. These correlations do not allow physical interpretation and because these cor-
relations are developed for dumped packing structures (spherical particles, Raschig rings,
Berl saddles, etc.) with a high solids holdup (0.3 to 0.6), large errors are possibly incurred
if applied to structured packings with low solids holdup (0.05 to 0.2). Structured pack-
ings commonly have a high voidage and are made to fit the dimensions of the reactor
(Mellapak, Katapak-S, monoliths, etc.). The main advantage of structured packings are
reduced pressure drop, better flow distribution and better gas-liquid contact. Solid foam
packing is a new type of structured packing considered for multiphase applications and is
available in a variety of materials (metal, carbon, ceramics) and pore sizes usually charac-
terized by pores per linear inch (or ppi). These solid foam packings, shown in Figure 1.4,
combine both the properties of high surface area and low solid holdup and are especially
suited for low pressure drop applications. In Chapter 3 and Chapter 4 the gas-liquid mass
transfer coefficient for solid foam packings of 10 and 40 ppi has been determined in the
co-current upflow and downflow configuration, respectively. This study investigated the
air-water gas-liquid system at low liquid viscosity. Two flow regimes (bubble and pulse)
were investigated in co-current upflow and in the co-current downflow configuration ex-
periments were performed in the trickle flow regime. Extrapolation of these results to
liquids with a different liquid viscosity or liquid surface tension may lead to large errors.
The wettability of the packing material also has an effect on the gas-liquid mass transfer
performance (Onda et al., 1968).
This study quantifies hydrodynamic parameters (frictional pressure drop and liquid
holdup) and the gas-liquid mass transfer coefficient for co-current two-phase flow through

Introduction 57
these solid foam packings for conditions when the viscosity of the liquid has been in-
creased. These parameters are quantified in the co-current upflow as well as in the co-
current downflow condition. The gas-liquid mass transfer coefficient is correlated to the
liquid and gas velocities, and to the frictional pressure drop. In the co-current downflow
configuration (trickle flow), the gas-liquid mass transfer is investigated for the case when
the liquid surface tension has been decreased.
5.1.1 Frictional pressure drop
The frictional pressure contribution in the co-current upflow configuration is obtained
from the total pressure drop by the following equation (Molga and Westerterp (1997)):
(
−dP
dz
)
Total
=(
ρG
εG
ε+ ρL
εL
ε
)
g︸ ︷︷ ︸
Static pressure drop
+Pf (5.1)
where Pf is the frictional pressure drop. The frictional pressure drop is described accord-
ing to the relative permeability model (Section 2.1.2, page 16) by the following equation:
Pf =εG
ε
(ε
εG
)h1(
AReG
GaG
+ BRe2
G
GaG
)
ρGg +εL
ε
(ε − ε0
L
εL − ε0L
)h2(
AReL
GaL
+ BRe2
L
GaL
)
ρLg (5.2)
where the factors A and B in Equation 5.2 are the viscous and inertial coefficients in the
Ergun equation for single phase flow, respectively. The values of h1 and h2 found in Sec-
tion 2.3.4 (page 24) were 4.43 and 1.88 for the solid foams. Using the definitions of the
Reynolds and Galileo numbers for the gas and liquid phases, and collecting the viscous
and inertial terms, yields the following equation for the frictional pressure drop:
Pf =
(
A (1 − ε)2
ε4d2e
)(
εG
(ε
εG
)h1
(uGµG) + εL
(ε − ε0
L
εL − ε0L
)h2
(uLµL)
)
· · ·
· · ·+(
B(1 − ε)
ε4de
)(
εG
(ε
εG
)h1 (u2
GρG
)+ εL
(ε − ε0
L
εL − ε0L
)h2 (u2
LρL
)
)
(5.3)
In the equation above the characteristic length, de, used to describe the solid foam
packing is the length of a strut, determined using the unit cell model of Fourie and Plessis
(2002). Here it is assumed that the unit cell making up the solid foam packing is described
by a tetrakaidecahedron, given in Figure 1.8. In Section 2.3.4 (page 24) the analysis of
holdup data showed that viscous effects are small, leading only to the inertial term being
important for the frictional pressure drop. This second term on the right hand side of
Equation 5.3 is used to calculate the experimental frictional pressure drop data using this
model.

58 Chapter 5
5.1.2 Gas-liquid mass transfer coefficient
The gas-liquid mass transfer coefficient (kLaGL) is determined by the intrinsic mass trans-
fer coefficient, kL, and the gas-liquid interfacial area (aGL). This area is usually a function
of the specific geometric surface area of the packing (given in Figure 1.11a for the solid
foam packings using the model of Fourie and Plessis (2002)) and of the liquid holdup. The
values of kL and aGL are also affected by the physical properties of the gas-liquid system
that affect the diffusion coefficient of the gas component in the liquid, and the velocities
of the gas and the liquid affecting the gas and liquid holdup, and the solids holdup. In
general the gas-liquid mass transfer coefficient is described by the penetration model:
kL = 2
√DL
πte(5.4)
where te is an assumed exposure time. In Kasturi and Stepanek (1974) the analogy be-
tween momentum and mass transfer is used to describe the rate of momentum transfer at
the gas-liquid interface, given by the following equation:
τi = 2ρLuL
õL
ρLπte(5.5)
Equations 5.4 and 5.5 combine to give the following relationship between intrinsic mass
and momentum transfer:
kL =τi
uL
√
DL
ρLµL
(5.6)
According to Tomida et al. (1975) the shear stress at the gas-liquid interface, τi, is a
measure of the frictional pressure drop and hence also depends on the holdup and veloc-
ities of the gas and liquid phases, see Equation 5.2. The correlations thus far developed
for co-current flow can be divided into two categories where the gas-liquid mass transfer
is related either to the gas and liquid velocities and the liquid properties, see Sherwood
and Holloway (1940), or to the frictional pressure drop, commonly referred to as the en-
ergy dissipation rate. A summary for Raschig rings, Berl saddles, and spherical particles
can be found in Morsi (1989) and Midoux et al. (1984) for co-current downflow. The co-
current upflow regime in general has received less attention in literature. Specchia et al.
(1974) studied spherical particles, Berl saddles, and ceramic rings, and Molga and Westert-
erp (1997) studied glass spheres as the packing structures. In general the gas-liquid mass
transfer coefficient for co-current flow is correlated using the rate of energy dissipation
(Fukushima and Kusaka (1979) being the exception, where 1
2and 1-inch ceramic spheres
were studied).

Introduction 59
Sherwood correlation
Sherwood and Holloway (1940) have presented their results for the mass transfer coeffi-
cient in the following form:
Co-current downflow:
(kLaGL εL
DL
)
= α
(uLρL
µL
)n
(ScL)0.5 (5.7)
where α and n are constants that characterize the packing. This correlation was developed
for co-current downflow where the gas velocity has little influence on the mass transfer.
The exponent on the liquid Schmidt number as given in Sherwood and Holloway (1940) is
found experimentally to be approximately the value described by the penetration theory,
a value of 0.5. However, to check the assumption, the liquid Schmidt number is varied by
increasing the liquid viscosity.
The mass transfer coefficient for co-current upflow also increases with gas velocity, and
the following correlation is proposed (similar to the approach of Fukushima and Kusaka
(1979)):
Co-current upflow:
(kLaGL εL
DL
)
= γ
(uLρL
µL
)n1
(uG)n2 (ScL)0.5 (5.8)
Also here the exponent on the Schmidt number is assumed to be 0.5, but this will be
checked using liquids with different Schmidt numbers by increasing the liquid viscosity.
Energy dissipation
The energy dissipation in single phase systems is obtained from the following mechanical
energy balance:
1
ρ
(dP
dz
)
+ vdv
dz+ g +
dF
dz= 0 (5.9)
where v is the intersticial velocity, and F is the frictional energy loss per unit mass. For
gas-liquid flow this is extended for each phase and the equations describing the frictional
energy loss is recognized as including changes in internal energy, U , work done between
phases, w, and heat transferred between phases, q, and are given by the following equa-
tions:
dFG
dz=
dUG
dz+
1
WG
dw
dz+
1
WG
dq
dz(5.10)
dFL
dz=
dUL
dz− 1
WL
dw
dz− 1
WL
dq
dz(5.11)
where WL and WG are the weighting factors of the gas and liquid phase contributions to
the overall energy balance. These weighting factors are described in Isbin and Su (1961) as

60 Chapter 5
the mass of phase in the differential volume, dz, given by WG = ρGεGdz and WL = ρLεLdz,
respectively. This analysis results in the following overall energy balance:
ε
(dP
dz
)
+ ρGεGvG
dvG
dz+ ρLεLvL
dvL
dz+ g (ρGεG + ρLεL) + · · ·
· · · + εGρG
(dUG
dz
)
+ εLρL
(dUL
dz
)
︸ ︷︷ ︸
Frictional energy dissipation
= 0 (5.12)
For assumptions of uniform intersticial velocity throughout the column and using the
definition of the frictional pressure drop (Equation 5.1), the frictional energy dissipation,
EGL, is given by:
EGL = g(
ρG
εG
ε+ ρL
εL
ε
)
+
(dP
dz
)
= −Pf (5.13)
However, Vohr (1962) and Lamb and White (1962) combine Equations 5.9 to 5.11 by
weighting each equation by the mass flow rate (WG = uGρG and WL = uLρL, with veloci-
ties based on the void volume), resulting in the frictional energy dissipation described by
the following equation:
EGL = (ρGuG + ρLuL) g + uG
(dP
dz
)
+ uL
(dP
dz
)
(5.14)
The equation above has widely been used (see Midoux et al. (1984) and Charpen-
tier (1976) for co-current downflow, and Specchia et al. (1974) and Molga and Westerterp
(1997) for co-current upflow) as the rate of energy dissipation to correlate this to the gas-
liquid mass transfer coefficient. It is conveniently independent from the holdup of the gas
and liquid phases which are quantities difficult to measure, and can be evaluated from
two-phase pressure drop measurements. However, Equation 5.14 is only valid for a no-
slip condition (i.e. vG = vL or uG/εG = uL/εL), which is rarely the case for two-phase flow,
and thus in general can not be used, see Isbin and Su (1961).
Charpentier (1976) gives an overview of the correlations developed for co-current
downflow through spheres, Raschig rings, Berl saddles, pall rings and pellets, correlat-
ing the gas-liquid mass transfer coefficient, kLaGLεL, to the gas and liquid velocities or
a group of parameters described as the rate of energy dissipation. In these correlations,
however, the correlating group to describe the energy dissipation is not consistent and
usually a combination of the two-phase pressure drop and superficial velocity, PTotaluL,
and in many cases the gravity terms in Equation 5.14 are ignored. Hirose et al. (1974) use
PTotaluLε−1
L as the energy delivered to the liquid to correlate the mass transfer coefficient

Introduction 61
for co-current downflow by the following equation:
Co-current downflow:
kLaGL εL
ε= β
(uG
ε
)m1
(
PTotal
uL
εL
)m2
(5.15)
with β, m1 and m2 constants that characterize the packing. In co-current downflow the
liquid holdup is low giving PTotal ≈ Pf . However, in co-current upflow the liquid holdup
is high and the static pressure drop provides a large contribution to the total pressure
drop. In Section 3.3.4 a similar correlation is developed for the gas-liquid mass transfer
per unit of reactor volume, kLaGLεL, correlated to PfuLε−1
L , as described by the following
equation:
Co-current upflow:
kLaGL εL = 0.0134
(
Pf
uL
εL
)0.44
(5.16)
In the case of co-current upflow of the gas and the liquid, the dependency on the gas
velocity was found to be negligible with changes in the frictional pressure drop and the
liquid holdup accounting for changes in the mass transfer coefficient, m1 = 0. However,
in view of Equation 5.13, the group to correlate the gas-liquid mass transfer should be the
frictional pressure drop, Pf , as this is the energy dissipated per unit volume of reactor and
thus the following correlation is proposed to compare different packing materials:
Co-current upflow:
kLaGLεL = c1 (Pf )c2 (5.17)
Tomida et al. (1975) find that (µwater/µL)1.7 corrects the mass transfer coefficient depen-
dency on the energy dissipated in the liquid when the liquid viscosity has been increased.
However, in this study a Schmidt number proportionality, (ScL/Scwater), similar to Equa-
tion 5.7, is used to account for changes in the liquid viscosity.
Effect of liquid surface tension
The number of studies that deal with the influence of the liquid surface tension on the
gas-liquid mass transfer coefficient are relatively low in comparison to the effects of the
surface tension has on the overall mass transfer coefficient. In co-current flow the gas
moves through the column either in the form of bubbles or pulses (up-flow) or in the form
of the continuous phase, the liquid film flowing over the packing surface due to gravity
(trickle flow) and hence different mechanisms are expected to affect the gas-liquid mass
transfer when the liquid surface tension is decreased.
In an upflow bubble column the lower liquid surface tension enhances the formation

62 Chapter 5
of small bubbles and hence increases the surface area for mass transfer. In a trickle system
two factors, see Francis and Berg (1967), are to be considered:
• the liquid forms a stable film around the solid surface;
• a mechanism of film rupture which depends on the mass transfer of a low surface
tension component into the liquid phase from the gas (a mechanism typically found
in distillation).
The first factor is satisfied if the difference in the surface energies of the gas-solid and
liquid-solid interfaces exceeds that of the gas-liquid interface (surface tension of the liq-
uid), which for most packing materials (with high surface energies) is the case, especially
when dealing with organic liquids (typically low surface tension liquids). The second
mechanism relates to the mass transfer of low surface tension components which may
cause rupture of the film surface, observed by Zuiderweg and Harmens (1958), which re-
sults in higher rates of refreshment due to formation of rivulets or droplets and hence a
higher intrinsic mass transfer. For trickle beds, Onda et al. (1968) found an increase in the
wetted surface area and thus an increase in the gas-liquid mass transfer coefficient with
decreasing liquid surface tension. No influence on the value of the intrinsic mass transfer
coefficient, kL, is described. The influence of the liquid surface tension on the wetted area
is described by Onda et al. (1968) by the following equation:
aGL
aP
= 1 − exp(−1.45 (σc/σL)0.75 Re0.1
L Fr−0.05L We0.2
L
)(5.18)
where aP is the surface area of the packing, σc (33-75 mN m−1, Sinnot (1999)) is a parame-
ter relating to the surface energy of the packing material, σL is the liquid surface tension,
and ReL, FrL and WeL are the Reynolds, Froude and Weber numbers of the liquid, re-
spectively. The equation above gives a maximum value of the gas-liquid area equal to the
surface area of the packing, which for solid foam packings is not necessarily the case. The
gas-liquid area increases as the liquid holdup increases, see Figure 1.11a with εS replaced
by (εL + εS). This estimate of the gas-liquid area, aGL, is used to describe the difference in
the gas-liquid mass transfer coefficient when the liquid surface tension is reduced. As in
Onda et al. (1968) the assumption of no influence on the intrinsic mass transfer coefficient,
kL, is made.
5.2 Experimental
The solid foam packings used in this study are commercially available from ERG Aerospace
Corp and made of aluminum with a voidage of 93%. These foams were placed in a semi
2-dimensional column with varying height; either 30, 60, or 90 cm high with cross sec-
tion 30 cm by 1 cm, shown schematically in Figure 3.1 (page 34) for the co-current upflow

Experimental 63
configuration. The co-current downflow experiments were performed in the same setup
with the inlet and outlet positions exchanged (Figure 4.1, page 48). The gas-liquid mass
transfer coefficient was measured using the method of oxygen desorption by measuring
dissolved oxygen concentrations at the liquid inlet and outlet (InPro 6800 oxygen sensors
Mettler Toledo). The liquid holdup and the frictional pressure drop were measured in the
co-current upflow regimes as in Section 3.2, page 33, and a similar procedure was followed
to determine the liquid holdup for the co-current downflow regime (Section 4.2, page 47).
Mainly the trickle flow regime was observed, but pulse flow was observed for superficial
gas velocities higher than 0.7 m s−1. The static liquid holdup was measured using the
drainage method (Section 2.2, page 17) and results are summarized in Table 5.1.
Table 5.1: Static liquid holdup and static film area for the solid foam packings (aluminum) and forthe low and high viscosity liquids.
Static liquid Static film
µL σL holdup, ε0L areaa
ppi [mPa s] [10−3 N m−1] [m3L m−3
P ] [m2GL m−3
P ]
10 0.80 72.8 0.094 1502
10 2.0 72.0 0.074 1430
10 0.80 56.2 0.057 1364
40 0.80 72.8 0.115 6282
40 2.0 72.0 0.098 6061
40 0.80 56.2 0.098 6061
a Determined using the unit cell model of Fourie and Plessis (2002) with thesolid holdup, εS, as given in Figure 1.11a, replaced by (εS + ε0
L).
The physical properties of the liquid solutions were measured from samples taken
from the column. The liquid viscosity, µL, was increased by the addition of glycerol
(99.5% pure from Merck, Germany) and measured using a Ubbelohde viscometer (Schott
Gerate AVS310) at 30◦C; all solutions (water, 30v% glycerol and 5v% isopropanol) used
were Newtonian fluids. The liquid surface tension was determined using a bubble ten-
siometer (Sensadyne). The physical constants of the liquid determined are summarized in
Table 5.2.
Co-current upflow was used to evaluate the influence of increasing the liquid viscosity
and co-current downflow was used to evaluate the effect of changes in the liquid viscosity
and the liquid surface tension. In co-current upflow the experiments for changes in the
liquid surface tension resulted in depletion of the liquid for a 30 cm column because of the
high rate of gas-liquid mass transfer. Consequently the mass transfer coefficient could not
be calculated from a comparison between 30 cm and 60 cm of packing material.

64 Chapter 5
Table 5.2: Overview of the experiments performed for determining the gas-liquid mass transfercoefficient, kLaGL, the liquid holdup, εL, and the frictional pressure drop, Pf , in the range of gasvelocities (uG = 0.1 - 0.8 m s−1) for 10 and 40 ppi solid foam packings.
Air Air Air
Water 30v% Glycerol 5v% Propanol
σL [10−3 N m−1] 72.8 72.0 56.2
µL [mPa s] 0.80 2.0 0.83
DLa [10−9m2 s−1] 2.75 1.14 2.64
ρL [kg m−3] 996 1068 992
Hb [m3L Pa mol−1] 85628 82203 85628
a Determined using a correlation (Wilke and Chang, 1955).b H = kH
101.325, where kH = kθ
H · exp(−∆solnH
R
(1
T− 1
T θ
))with the constants kθ
H and−∆solnH
Rfrom http://webbook/nist/gov/chemistry.
5.3 Results and discussion
5.3.1 Co-current upflow - Effect of liquid viscosity
Liquid Holdup
In Figure 5.1 the liquid holdup is given for 10 and 40 ppi solid foam packings for the
experiments where the liquid viscosity has been increased from 0.8 to 2.0 mPa s−1. An
increase in the gas velocity increases the gas holdup and decreases the liquid holdup. At
a gas velocity of 0.3 m s−1 a transition from the bubble to the pulse regime is observed;
liquid and gas slugs alternately move through the solid foam packing. The velocity of
the gas bubbles increases with increasing liquid velocity. This results in an increase in the
liquid holdup. Due to the open structure of the solid foam packings the liquid holdup for
the 10 and 40 ppi solid foam packings are similar, increasing slightly as the ppi number of
the solid foam packing increases due to higher static liquid holdup for 40 ppi solid foam
packing, see Table 5.1. Increasing the liquid viscosity from 0.8 to 2 mPa s results in a slight
increase in the liquid holdup. This increase in liquid holdup is more pronounced in the
10 ppi solid foam packing. This is not a result of an increased static liquid holdup which
decreases with increasing liquid viscosity, see Table 5.1. This is possibly a result of the
higher wetting of the packing material, resulting in more effective drainage of the solid
foam packing.
In Section 2.3.4, page 24 the relative permeability model (Saez and Carbonell (1985))
is used to describe the liquid holdup, εL (= ε − εG), in the counter-current operation as an
implicit function of gas and liquid velocities and four parameters, A, B, h1, and h2, also
used to describe the frictional pressure in Equation 5.3. It was found that the effect of the
viscous term associated with A in the description of the drag forces of the gas and liquid
phases is negligible. Extending this to the co-current flow gives Equation 5.19 with uG and

Results and discussion 65
0 0.2 0.4 0.6 0.8 10.2
0.3
0.4
0.5
0.6
0.7
0.8
0.9
1
→ PulseBubble ←→
Gas velocity, uG
[m s−1
]
Liq
uid
hold
up, ε
L [
mL3 m
P−3]
(a) 10 ppi
0.02 m s -1
0.04 m s -1
u L
L = 0.8
mPa s -1
L = 2.0
mPa s -1
µ µ
0 0.2 0.4 0.6 0.8 10.2
0.3
0.4
0.5
0.6
0.7
0.8
0.9
1
→ PulseBubble ←→
Gas velocity, uG
[m s−1
]
Liq
uid
hold
up, ε
L [
mL3 m
P−3]
(b) 40 ppi
0.02 m s -1
0.04 m s -1
u L
L = 0.8
mPa s -1
L = 2.0
mPa s -1
µ µ
Figure 5.1: Liquid holdup, εL, for (a) 10 ppi and (b) 40 ppi solid foam packings in the co-currentupflow configuration at different liquid viscosities, µL.
uL giving the flow direction (upflow is in the positive direction).
(B(1 − ε)
ε3de
)((ε
εG
)h1 (u2
GρG
)(
uG
|uG|
)
−(
ε − ε0
L
εL − ε0L
)h2 (u2
LρL
)(
uL
|uL|
))
+ · · ·
· · ·+ ρGg − ρLg = 0 (5.19)
In Figure 5.2 the experimental liquid holdup for 40 ppi solid foam packing and for
the air-water system are compared to the predictions of this model. The liquid holdup is
slightly overestimated by the model. The effect of liquid viscosity on liquid holdup from
this model is minor (viscous term in the description of the drag force has minor influence)
and the increase in the liquid holdup associated with an increase in liquid viscosity is
likely due to an increase in the liquid density from 996 to 1068 kg m−3, see Equation 5.19.
Pressure Drop
The results for the frictional pressure drop per unit height of packing are shown in Figure
5.3. The frictional pressure drop increases with increasing liquid viscosity in both the 10
and 40 ppi solid foam packings. The increase in frictional pressure drop with higher liquid
viscosity is higher in the 40 ppi solid foam, especially at higher liquid velocities. This is
possibly due to the larger wetted surface area and the higher number of struts restricting
the flow path of the liquid and gas when compared to the 10 ppi solid foam packing. In
Section 2.3.4 (page 24) it was determined that the contributions to the frictional pressure

66 Chapter 5
0 0.2 0.4 0.6 0.8 10
0.2
0.4
0.6
0.8
1
uG
[m s−1
]
uL = 0.02 m s
−1
uL = 0.04 m s
−1
Figure 5.2: Experimental liquid holdup for the 40 ppi solid foam packing in co-current upflowcompared to the relative permeability model, Saez and Carbonell (1985), using the parameters (A,B, h1 and h2) found for countercurrent flow. The model predictions are given by the continuouslines for the case of uL = 0.02 m s−1 (· · · ) and uL = 0.04 m s−1 (− · −).
0 0.2 0.4 0.6 0.8 10
50
100
150
200
→ PulseBubble ←→
Gas velocity, uG
[m s−1
]
Fri
ctio
nal
pre
ssure
dro
p, P
f [10
2 P
a m
−1]
(a) 10 ppi
0.02 m s -1
0.04 m s -1
u L
L = 0.8
mPa s -1
L = 2.0
mPa s -1
µ µ
0 0.2 0.4 0.6 0.8 10
50
100
150
200
→ PulseBubble ←→
Gas velocity, uG
[m s−1
]
Fri
ctio
nal
pre
ssure
dro
p,P
f [10
2 P
a m
−1]
(b) 40 ppi
0.02 m s -1
0.04 m s -1
u L
L = 0.8
mPa s -1
L = 2.0
mPa s -1
µ µ
Figure 5.3: Frictional pressure drop, Pf , for (a) 10 ppi and (b) 40 ppi solid foam packings in theco-current upflow configuration at different liquid viscosities, µL.

Results and discussion 67
drop are largely from the inertial terms, (BRe2/Ga), thus:
Pf =
(B(1 − ε)
ε4de
)
F inertialf
︷ ︸︸ ︷(
εG
(ε
εG
)h1 (u2
GρG
)+ εL
(ε − ε0
L
εL − ε0
L
)h2 (u2
LρL
)
)
(5.20)
The results have been presented in Figure 5.4 according to Equation 5.20. The results
indicate that, as in Section 2.3.4, the frictional pressure drop is largely determined by the
inertial forces. The difference in the liquid density (1068 kg m−3 compared to 996 kg m−3)
is the cause of the increase in the frictional pressure drop measured. The values of B (16.0
for 10 ppi and 4.27 for 40 ppi solid foam packings) are in the range of expected values
determined in Section 2.3.4, page 24.
0 2 4 6 8 100
50
100
150
200
Ff
inertial
Fri
ctio
nal
pre
ssure
dro
p, P
f [10
2 P
a m
−1]
(a) 10 ppi, de = 1.5 mm , B ≈ 16.0
0.02 m s -1
0.04 m s -1
u L
L = 0.8
mPa s -1
L = 2.0
mPa s -1
µ µ
0 2 4 6 8 100
50
100
150
200
Ff
inertial
Fri
ctio
nal
pre
ssure
dro
p, P
f [10
2 P
a m
−1]
(b) 40 ppi, de = 0.38 mm , B ≈ 4.27
0.02 m s -1
0.04 m s -1
u L
L = 0.8
mPa s -1
L = 2.0
mPa s -1
µ µ
Figure 5.4: Experimental pressure drop, Pf , for aluminium foam packings in the co-current upflowconfiguration according to Equation 5.20. The slope of the line is the value of B(1 − ε)/(ε4de).
Gas-liquid mass transfer coefficient
Figure 5.5a gives the gas-liquid mass transfer coefficient for an increase in the liquid vis-
cosity with the change in the diffusion coefficient of oxygen taken into account. It is clear
in Figure 5.5a that the mass transfer coefficient per unit of reactor volume increases with
increasing gas and liquid velocity and decreases with increasing liquid viscosity, as de-
scribed by Equation 5.8. The results were correlated using this equation and the parity
plot is given in Figure 5.5b. The correlating parameter values of γ, n1 and n2 were found
to be 311 ± 35, 0.92 ± 0.10 and 0.44 ± 0.06, respectively.
(kLaGL εL
DL
)
= 311(uG)0.44
(uLρL
µL
)0.92
(ScL)0.5 (5.21)

68 Chapter 5
The 10 and 40 ppi solid foam packings have similar kLaGLεL and mass transfer coefficients
are both described by Equation 5.21. This similarity in the obtained mass transfer coeffi-
cients, even though the geometric surface area of the solid foam packing increases fourfold
(1080 m2 m−3 for 10 ppi and 4300 m2 m−3 for 40 ppi solid foam packing), is ascribed to
a decrease in the local velocity of the liquid with more tightly packed struts (smaller ppi
number of solid foam packings). The main contribution to the decrease in mass transfer is
the decrease in diffusion coefficient. The changes in the liquid viscosity and liquid diffu-
sion coefficient were best described by the liquid Schmidt number, (ScL)0.5. This indicates
that penetration theory describes the rate of mass transfer in co-current upflow.
0 5 10 15 200
0.05
0.1
0.15
0.2
uG
ScL
0.5 [m s
−1]
kLa G
L ε
L D
L−1 [
10
9 m
L m
−3
P]
(a) kLaGLεL
0.02 m s -1
10 ppi 40 ppi 10 ppi 40 ppi
0.04 m s -1
u L
L = 0.8
mPa s -1
L = 2.0
mPa s -1
µ µ
0 0.02 0.04 0.06 0.08 0.1 0.12 0.140
0.02
0.04
0.06
0.08
0.1
0.12
0.14
−20%
+20%
kLaGLεL
DL= 311 u
0.44G
(uLρL
µL
)0.92
Sc0.5L
kLa
GL ε
L D
L
−1 Model [10
9 m
L m
−3
P]
kLa G
L ε
L D
L−1 E
xper
imen
tal
[10
9 m
L m
−3
P]
(b) Parity plot
0.02 m s -1
10 ppi 40 ppi 10 ppi 40 ppi
0.04 m s -1
u L
L = 0.8
mPa s -1
L = 2.0
mPa s -1
µ µ
Figure 5.5: (a) Mass transfer coefficient per unit of reactor volume, kLaGL εL, for solid foam pack-ings in the co-current upflow configuration at different liquid viscosities, µL. (b) Parity plot wherekLaGLεL is modeled using the correlation proposed by Sherwood and Holloway (1940) as given inEquation 5.8.
Energy dissipation
Figure 5.6b shows the gas-liquid mass transfer coefficient per unit reactor volume plotted
against the frictional energy dissipation term (PfuLε−1
L ) as described by Equation 5.15. The
values found for the correlating parameters were the same as the air-water system (Section
3.3.4): β = 0.0134 ± 0.0073, m1 = 0, and m2 = 0.44 ± 0.077. In Figure 5.6b the frictional
pressure drop, Pf , is used to correlate the mass transfer coefficient according to Equation
5.13. The coefficients c1 and c2 are 2.05 x 10⁻⁴ and 0.8, respectively.
kLaGL εL
(ScL
ScWater
)0.69
= 2.05 × 10⁻⁴ (Pf)0.8 (5.22)

Results and discussion 69
This shows that both these parameters, PfuLε−1
L and Pf , may be used to correlate the
gas-liquid mass transfer coefficient and a term of the form (ScL/ScWater)0.5−0.7 corrects for
the lower gas-liquid mass transfer with an increase in the liquid viscosity. The frictional
pressure drop, Pf , which is shown to be related to the energy dissipated in the gas-liquid
system, correlates to the gas-liquid mass transfer, kLaGLεL, with a factor of 0.8. This fac-
tor indicates the energy efficiency achieved within the co-current gas-liquid system and
upholds the analogy between momentum and mass transfer. The parameter, PfuLε−1
L (or
other forms of this parameter, see Equation 5.14), described as the rate of energy dissi-
pation should no longer be used as it assumes a no-slip condition, which for gas-liquid
systems is rarely the case.
101
102
103
104
105
10−2
10−1
100
101
kLaGL εL
(ScL
ScW ater
)0.54
= 0.0134 · (Pf uL
εL)0.44
kLa G
L ε
L (
Sc L
/ S
c Wat
er)0
.54 [
m3 L m
−3
P s
−1]
Pf u
L ε
L
−1 [W m
P
−3]
0.02 m s -1
10 ppi 40 ppi 10 ppi 40 ppi
0.04 m s -1
u L
L = 0.8
mPa s -1
L = 2.0
mPa s -1
µ µ
(a) PfuLε−1
L
102
103
104
105
106
10−2
10−1
100
101
kLaGL εL
(ScL
ScWater
)0.69
= 0.000205 · (Pf )0.8
kLa G
L ε
L (
Sc L
/ S
c Wat
er)0
.69 [
m3 L m
−3
P s
−1]
Pf [J m
P
−4]
0.02 m s -1
10 ppi 40 ppi 10 ppi 40 ppi
0.04 m s -1
u L
L = 0.8
mPa s -1
L = 2.0
mPa s -1
µ µ
(b) Pf
Figure 5.6: Correlation of the mass transfer coefficient for 10 and 40 ppi solid foam packings. In(a) the correlating parameter PfuLε−1
L , as given in Equation 5.16 is used and in (b) the frictionalpressure drop, Pf , as given by Equation 5.13, is used. These are compared to packed micro-reactors(⋆), a packed bed of 6mm spherical particles (+), and monoliths (⊕).
In Figures 5.6a and 5.6b a comparison is made with a packed bed micro-reactor, a
packed bed of spherical particles (6 mm) operated in co-current upflow, and a monolith
(from Losey et al. (2001), Specchia et al. (1974), and Kreutzer et al. (2005), respectively). In
Kreutzer et al. (2005) and Losey et al. (2001) no solids holdup was given and an estimate
of 0.6 was made for packed beds and 0.15 for monoliths (1.5 mm diameter channels with
0.1 mm walls) was used. This comparison shows that the correlation as developed also
correlates the gas-liquid mass transfer coefficient for these other packing materials. This
indicates the general applicability of the correlations proposed as the energy dissipated is
related per unit volume of the packing material and not only the volume of the liquid.

70 Chapter 5
5.3.2 Co-current downflow - Effect of liquid viscosity
Liquid Holdup
Figure 5.7 gives the results for the liquid holdup for the 10 and 40 ppi solid foam packings.
The liquid holdup increases with increasing liquid velocity and decreases with increasing
gas velocity due to acceleration of the liquid film flowing down the solid foam packing.
The liquid holdup increases as the ppi number of the solid foam packing increases due
to the larger number of struts that restrict the flow of the liquid and because of higher
static liquid holdup, see Table 5.1. Increasing the liquid viscosity decreases the liquid
holdup compared at similar gas and liquid velocities. In the air-water system channeling
of the packing was observed in the solid foam packings at the higher air-water velocities.
Channeling is when the liquid film flowing down the packing coalesces to form a liquid
channel thereby decreasing the contact between the gas and liquid phases. The degree of
wetting of the packing was increased with an increase in the liquid viscosity (as observed
by Mangers and Ponter (1980)), which avoided channeling. Also the lower static liquid
holdup for an increase in the liquid viscosity and more interaction between the gas and
liquid gives rise to the lower liquid holdup measured.
0 0.2 0.4 0.6 0.8 10
0.1
0.2
0.3
0.4
0.5
Gas velocity, uG
[m s−1
]
Liq
uid
hold
up, ε
L [
mL3 m
P−3]
(a) 10 ppi
0.02 m s -1
0.04 m s -1
u L
L = 0.8
mPa s -1
L = 2.0
mPa s -1
µ µ
0 0.2 0.4 0.6 0.8 10
0.1
0.2
0.3
0.4
0.5
Gas velocity, uG
[m s−1
]
Liq
uid
hold
up, ε
L [
mL3 m
P−3]
(b) 40 ppi
0.02 m s -1
0.04 m s -1
u L
L = 0.8
mPa s -1
L = 2.0
mPa s -1
µ µ
Figure 5.7: Liquid holdup, εL, for (a) 10 ppi and (b) 40 ppi solid foam packings in the co-currentdownflow configuration at different liquid viscosities, µL.
Gas-liquid mass transfer coefficient
Figure 5.8 shows the results for the gas-liquid mass transfer coefficient per unit of reac-
tor volume in co-current downflow. The gas-liquid mass transfer coefficient for the 10
ppi solid foam packings increases as the liquid velocity increases and remains relatively
constant in the trickle flow regime with increasing gas velocity. In the pulsing regime
(uG larger than 0.7 m s −1) the mass transfer coefficient significantly increases due to the

Results and discussion 71
refreshment of the liquid on the solid foam surface with passing liquid pulses. Increas-
ing the liquid viscosity for the 10 ppi solid foam packing decreases the gas-liquid mass
transfer coefficient due to a decrease in the diffusivity of the gas species. Results for the
gas-liquid mass transfer coefficient for the 40 ppi solid foam packing are more difficult
to interpret as the gas-liquid mass transfer increases with increasing viscosity. A similar
effect was observed by Mangers and Ponter (1980) and is ascribed to the increase in the
wetting of the packing with an increase in the liquid viscosity using glycerol, possibly
with the added effect of less channeling. At the lower liquid viscosity the gas-liquid mass
transfer coefficient for 40 ppi solid foam packing is constant for increasing gas velocity
and lower than 10 ppi solid foam packing, possibly a result of a lower level of turbulence
caused in the liquid film by the smaller strut thickness, dm, of the solid foam, given in
Figure 1.8 (0.55 mm for 10 ppi compared to 0.07 mm for 40 ppi solid foam packing). In-
creasing the liquid viscosity increases the wetting of the packing and thus the geometric
area of the packing used for gas-liquid mass transfer and higher gas-liquid mass transfer
coefficients are observed.
0 0.2 0.4 0.6 0.8 10
0.05
0.1
0.15
Gas velocity, uG
[m s−1
]
kLa G
L ε
L [
m3 L m
P−3 s
−1]
(a) 10 ppi
0.02 m s -1
0.04 m s -1
u L
L = 0.8
mPa s -1
L = 2.0
mPa s -1
µ µ
0 0.2 0.4 0.6 0.8 10
0.05
0.1
0.15
Gas velocity, uG
[m s−1
]
kLa G
L ε
L [
m3 L m
P−3 s
−1]
(b) 40 ppi
0.02 m s -1
0.04 m s -1
u L
L = 0.8
mPa s -1
L = 2.0
mPa s -1
µ µ
Figure 5.8: Mass transfer coefficient per unit of reactor volume, kLaGLεL, for (a) 10 ppi and (b) 40ppi solid foam packings in the co-current downflow configuration at different liquid viscosities, µL.The circles (©) indicate experiments where slug flow was observed.
In Figure 5.9 the gas-liquid mass transfer coefficient per unit of reactor volume is cor-
related to the liquid velocity described by Equation 5.7 for the 10 ppi solid foam packing.
The values of the correlating parameters α and n were found to be 3.7 and 1.16, respec-
tively.
kLaGL εL
DL
= 3.7
(uLρL
µL
)1.16
(ScL)0.5 (5.23)

72 Chapter 5
0 0.005 0.01 0.015 0.02 0.025 0.03 0.0350
0.005
0.01
0.015
0.02
0.025
0.03
0.035
−20%
+20%
10 ppi :kLaGL εL
DL= 3.7
(uLρL
µL
)1.16
Sc0.5L
kLa
GL ε
L D
L
−1 Model [10
9 m
L m
P
−3]
kLa G
L ε
L D
L−1 E
xper
imen
tal
[10
9 m
L m
P−3]
0.05 m s -1
0.04 m s -1
0.02 m s -1
0.03 m s -1
u L
L = 0.8
mPa s -1
L = 2.0
mPa s -1
µµ
Figure 5.9: Parity plot of the correlation of kLaGLεL with superficial liquid velocity, as describedin Equation 5.7, is given for 10 ppi solid foam packings.
As in co-current upflow the value of (ScL)0.5 corrects the decrease in the mass transfer
coefficient due to the increase in the liquid viscosity and decrease in the diffusion coef-
ficient of the gas species in the liquid. This indicates that also in co-current downflow
penetration theory describes the rate of gas-liquid mass transfer.
5.3.3 Co-current downflow - Effect of liquid surface tension
Liquid holdup
The liquid holdup found experimentally for co-current downflow when decreasing the
liquid surface tension using isopropanol is given in Figure 5.10a for the trickle flow regime.
The liquid is spread more evenly over the packing by the lower surface tension and the
formation of tiny bubbles in the liquid film cause the liquid holdup for zero gas velocity
to be higher. Increasing the gas velocity decreases the liquid holdup, as observed for the
air-water system, Section 4.3.1 (page 49). This is expected because the forces between the
gas and liquid are not dependent on the surface tension of the liquid, see Equation 5.19.
Gas-liquid mass transfer coefficient
In Figure 5.10b the gas-liquid mass transfer coefficient is plotted against the gas veloc-
ity for different liquid velocities. It is independent of the gas velocity (as found for the
air-water and air-water-glycerol cases) and increases with increasing liquid velocity. The
influence of the decrease in the surface tension of the liquid is that the gas-liquid mass
transfer coefficient increases by a factor 6. This increase is assumed due to an increase
in the available gas-liquid interfacial area for mass transfer and not as a result of an in-
crease in the intrinsic mass transfer coefficient, kL (Onda et al., 1968). However, the liquid
holdup has remained relatively the same for the air-water and air-water-isopropanol sys-

Results and discussion 73
0 0.2 0.4 0.6 0.8 10
0.1
0.2
0.3
0.4
0.5
Gas velocity, uG
[m s−1
]
Liq
uid
hold
up, ε
L [
mL3 m
P−3]
(a) Liquid holdup, εL
0.04 m s -1
0.02 m s -1
u L
L = 72
mN m -1
L = 56
mN m -1
µµ
0 0.2 0.4 0.6 0.8 10
0.05
0.1
0.15
0.2
0.25
0.3
0.35
0.4
Gas velocity, uG
[m s−1
]
kLa G
L ε
L [
m3 L m
P−3 s
−1]
(b) kLaGLεL
0.04 m s -1
0.02 m s -1
u L
L = 72
mN m -1
L = 56
mN m -1
µµ
Figure 5.10: (a) Liquid holdup, εL, and (b) Mass transfer coefficient per unit of reactor volume,kLaGLεL, for 10 ppi solid foam packings in the co-current downflow configuration at differentliquid surface tensions, σL. The circles (©) indicate experiments where slug flow was observed,here only for the uL = 0.04 m s−1 case.
tems, see Figure 5.10a, the increase is unlikely to be due to an increase in the surface
area due to liquid holdup effects. Adding isopropanol to water in small concentrations (5
v/v%) decreases the liquid surface tension but also induces the formation of tiny bubbles
(observed visually) in the liquid flowing down the solid foam surface giving the liquid
film an opaque appearance. A similar observation of drastic reduction in bubble size was
made by Hu et al. (2006) for a stirred tank reactor. These tiny bubbles (estimated in the
range of 0.05 - 0.15 mm in diameter) increase the gas-liquid area for mass transfer. An
estimate of the contribution to the gas-liquid mass transfer area and the volume of these
tiny bubbles is made for the 10 ppi solid foam packings (uL = 0.04 m s−1). If it is assumed
for the air-water case that the area for mass transfer is the geometric surface area for a
solid foam packing with increased solids holdup, εS + εL ≈ 0.3, see Figure 1.11a, the gas-
liquid area is approximately 1900 m2GL m−3
P . The difference in the gas-liquid mass transfer
area between the air-water and air-water-propanol system is thus about 9000 m2
GL m−3
P .
This area can be achieved assuming an average bubble diameter of 0.1 mm (dbubble) at a
gas holdup half of the liquid holdup, a value of 0.15 m3
G m−3
P (aGLεL = 6εG/dbubble). This
estimate indicates that the liquid film flowing over the solid surface consist for about 30%
by volume of these tiny bubbles. The use of isopropanol to decrease the surface tension of
the liquid in the trickle flow regime does not give a clear indication of the effect of liquid
surface tension on the gas-liquid mass transfer. The effects observed are a combination of
the reduction of surface tension and the formation of tiny bubbles flowing with the liq-
uid film down the packing which enhances the gas-liquid mass transfer by creating larger
gas-liquid mass transfer area. In Larachi et al. (1998) trickle flow at elevated pressure was

74 Chapter 5
studied and a similar flow of small bubbles in a film of liquid flowing down the surface
of the packing was described to account for the increase in the gas-liquid mass transfer
through the increase in the gas-liquid mass transfer area.
5.4 Conclusions
The following conclusions can be made regarding the effects of increasing the liquid vis-
cosity and decreasing the liquid surface tension:
Co-current upflow
Increasing the liquid viscosity (from 0.8 to 2 mPa s) increases the liquid holdup slightly
in the co-current upflow regime. Frictional pressure drop is increased which is due to the
increase in the density of the liquid by the glycerol used to increase the liquid viscosity.
The increase in liquid viscosity adversely affects the gas-liquid mass transfer coefficient by
decreasing the liquid diffusion coefficient. The results for co-current upflow can be cor-
related by Equation 5.21, based on the correlation proposed by Sherwood and Holloway
(1940) developed for downflow, with an effect of the gas velocity on the mass transfer in-
cluded by u0.44G . The gas-liquid mass transfer coefficient was also correlated to the energy
dissipation, Equation 5.22, which is shown to be equal to the frictional pressure drop. The
factor (ScL/ScWater)0.69 describes the decrease in the gas-liquid mass transfer coefficient
by an increase in liquid viscosity and the associated decrease in the diffusion coefficient of
the gas species in the liquid.
Co-current downflow
The observed rates of gas-liquid mass transfer in co-current downflow are largely de-
termined by the liquid velocity. For the 10 ppi solid foam packing, the gas-liquid mass
transfer decreases when the liquid viscosity increases with the factor (ScL)0.5 correcting
for the increase in liquid viscosity, see Equation 5.23. However, for the 40 ppi solid foam
the mass transfer increases with an increase in the liquid viscosity. This is possibly due
to less channeling caused by higher wetting of the surface of the solid foam packing. De-
creasing the liquid surface tension affects the liquid holdup slightly but has a very large
influence on the gas-liquid mass transfer coefficient, increasing it by a factor of 6. Since
the value of kL is assumed independent of liquid surface tension, this increase is due to
an increase in the gas-liquid area for mass transfer. This increase may be ascribed to tiny
bubbles flowing with the liquid film down the solid foam packings.

Chapter 6
Hydrodynamics and mass transfer for a
gas-liquid-solid foam reactor
Abstract
Hydrodynamic parameters such as liquid holdup obtained for co-current gas-liquid flow
are discussed and further evaluated using the relative permeability model by Saez and
Carbonell (1985). This model describes the complete flow map for the counter-current and
co-current (upflow and downflow) configurations with the parameters found in Chapter
2. Also the flow regimes found experimentally are indicated on this map. In the co-current
downflow configuration the model describes the liquid holdup less accurately. This is due
to the model not taking the interaction between the gas and liquid phases into account.
The effect of the type of material (aluminum and carbon) and solid holdup (93% com-
pared to 97%, respectively) on the hydrodynamic parameters is small and it is found that
the intrinsic mass transfer coefficient is unaffected by the material and voidage of the solid
foam packings. This is possibly due to the materials exhibiting similar hydrophobicities.
As carbon is a suitable inert material in chemical reactions it is preferred as catalyst sup-
port.
A chemical reactor using solid foam packings as the catalyst support is compared with
a packed bed of spheres for the oxidation of glucose over palladium catalyst in upflow and
downflow configurations. The low surface area for depositing the catalyst results in the
reactors being kinetically limited. A reactor operating under mass transfer limitations is
obtained by applying washcoats in the order of 1 µm. In the co-current downflow config-
uration the same reactor performance is obtained for a reactor packed with spherical par-
ticles or solid foam packing. In the co-current upflow configuration the spherical particles
achieve twice the overall reaction rate than a reactor using solid foam packing, however,
at an order of magnitude higher pressure drop. This indicates that solid foam packings
operate at higher energy efficiencies and can achieve production rates comparable to con-
ventional reactors.

76 Chapter 6
6.1 Introduction
The chemical industry uses multiphase reactors operating under a variety of physical
conditions (e.g., total pressure, aqueous or organic liquids) for reactions which include
Fischer-Tropsch synthesis, hydrogenation, oxidation, epoxidation, hydroformulation, and
alkylation. Hydrodynamic parameters and gas-liquid mass transfer under process condi-
tions are important for the design and operation of these reactors. Scaling rules for the
design of these industrial reactors are common but have to be evaluated especially when
a different structure is used as catalyst support. The solid catalyst is usually in the form
of pellets or powders. Hence, either slurry or fixed bed operations are commonly em-
ployed. The particles’ hydrophobicity (also commonly referred to as the lyophobicity)
influences the gas-liquid mass transfer and subsequently affects the overall reactor per-
formance (Ruthiya et al., 2004). In Rangwala et al. (1990), a mixture of hydrophobic and
hydrophilic spherical particles was studied in the co-current downflow configuration for
an water-air system. Here the area for mass transfer was found to decrease with an in-
crease in the fraction of hydrophobic packing introduced, possibly a result of a decrease
in the wetted area of the packing which leads to decreased mass transfer.
This chapter gives an overview of the main hydrodynamic and gas-liquid mass trans-
fer parameters quantified in the preceding chapters. Additionally the effects the type of
packing material (aluminium or carbon) have on these parameters are quantified in the
co-current upflow configuration. The solid foam packings are compared to spherical par-
ticles, where the solid is used as the support for depositing palladium used as a catalyst for
the oxidation of glucose. A fair comparison is made between the different reactor config-
urations whether co-current upflow or downflow, and a reactor design is used to evaluate
the key differences in the two operating configurations.
6.2 Overview of hydrodynamics
The liquid holdup and the two-phase frictional pressure drop is described in the counter-
current flow configuration by the relative permeability model of Saez and Carbonell (1985),
given in Equation 2.4 to Equation 2.9 in Section 2.1.2 (page 16). This model may be ex-
tended to the co-current configurations with appropriate changes in the sign of the liquid
and the gas velocities. The counter-current configuration described in Section 2.1.2 takes
flow upward as the positive direction. In the following sections this model is used to
quantify the liquid holdup in all configurations (counter-current and co-current upflow
and downflow) using the parameters (A, B, h1 and h2) in Table 2.2 (page 24). The pa-
rameters for the 40 ppi solid foam packings are used to give an overview of these model
predictions. The model predictions are compared to the experimental results obtained in
Chapters 2, 3 and 4.

Overview of hydrodynamics 77
6.2.1 Flow regimes
The flow regimes observed in the counter-current flow are described qualitatively in Fig-
ure 2.2 on page 19. This regime map is extended to the co-current flow configurations, see
Figure 6.1.
−2 −1 0 1 20
0.2
0.4
0.6
0.8
1
1.2
Bubble
up
Bubble
down
Pulse
up
Pulse
down
Trickle
Gas upflowGas downflow
uL = −0.01 m s
−1u
L = −0.02 m s
−1
uL = −0.04 m s
−1
uL = −0.10 m s
−1
uL = 0.00 m s
−1
uL = +0.02 m s
−1
uL = +0.04 m s
−1
uL = +0.10 m s
−1
← ε
← εL
0
Liq
uid
Ho
ldu
p, ε
L [
m3 L m
−3
P]
uG
[m s−1
]
Co−current downflow
Counter−current flow (trickle)
Flooding points
Counter−current flow (bubble and pulse)
Co−current upflow
Figure 6.1: The complete regime map for the co-current and counter-current flow configurations,with the associated liquid holdup, the lines indicating different liquid velocities.
The flow regimes for the co-current flow configurations overlap with those of the
counter-current flow configuration producing a complete regime map for two-phase (air-
water) flow. In the co-current downflow configuration the liquid holdup increases as the
liquid velocity increases and decreases slightly with increasing gas velocity. The trickle
regime is predominant at low gas and liquid velocities and is characterized by a liquid
film flowing down the packing surface and a continuous gas phase flowing up or down.
At higher liquid flow rates, a downflow bubble regime can be observed. At high gas ve-
locity, a downflow pulsing regime is observed where gas and liquid pulses alternate in
moving down the packing structure. In the co-current upflow configuration the bubble
and pulse regimes are observed. At low gas velocities the gas travels through the contin-
uous liquid phase in the form of bubbles. As the gas velocity is increased these bubbles
grow bigger up to the width of the column, the start of the pulsing upflow regime. In the
co-current upflow configuration, the liquid holdup decreases with increasing gas velocity
and increases with increasing liquid velocity. In the counter-current flow configuration
the same results as found in Section 2.3.4 are observed, with both a high liquid holdup
regime (bubble and pulse flow) and a low liquid holdup regime (trickle flow) observed
for identical gas and liquid velocities. The difference in the regimes is attained through

78 Chapter 6
a different operation of the column, see Sections 2.2.2 and Section 2.2.3 on page 20 for
details. The flooding point separates these two regimes into distinct regions.
6.2.2 Liquid holdup
The relative permeability model described in Section 2.1.2 (page 16), may be reduced to
the following intrinsic equation for describing the liquid holdup, εL (= ε − εG).
(B(1 − ε)
ε3de
)((ε
εG
)h1 (u2
GρG
)(
uG
|uG|
)
−(
ε − ε0
L
εL − ε0L
)h2 (u2
LρL
)(
uL
|uL|
))
+ · · ·
· · ·+ ρGg − ρLg = 0 (6.1)
where B, h1, and h2 are parameters previously determined, see Section 2.3.4, page 24. The
relative permeability model is used to describe the liquid holdup for 40 ppi solid foam
packing at different gas and liquid velocities (upflow taken in the positive direction) and
compared to the liquid holdup obtained experimentally for two-phase flow in the counter-
current and co-current flow configuration, see Figure 6.2.
0 0.5 1 1.50
0.2
0.4
0.6
0.8
1
uG
[m s−1
]
Counter−current flow
uL = −0.028 m s
−1
uL = −0.021 m s
−1
uL = −0.014 m s
−1
uL = −0.007 m s
−1
−1.5 −1 −0.5 00
0.2
0.4
0.6
0.8
1
uG
[m s−1
]
Liq
uid
Ho
ldu
p, ε
L [
m3 L m
−3
P]
Co−current downflow
uL = −0.02 m s
−1
uL = −0.04 m s
−1
0 0.5 1 1.50
0.2
0.4
0.6
0.8
1
uG
[m s−1
]
Co−current upflow
uL = 0.02 m s
−1
uL = 0.04 m s
−1
Figure 6.2: Liquid holdup, εL, for 40 ppi aluminium foam packings in the co-current downflow, thecounter-current and the co-current upflow configurations.
In the counter-current and the co-current upflow configurations the model is able
to describe the observed liquid holdup for the high liquid holdup regimes. In the co-
current downflow configuration the model overestimates the liquid holdup. This model
does not describe phenomena such as the wetting of the packing or channeling. In the
counter-current low liquid holdup regime (trickle flow) the model underestimates the

Intrinsic mass transfer coefficient 79
liquid holdup. This deviation in the liquid holdup predicted is possibly a result of the
interaction between the gas and liquid phases not taken into account in the relative per-
meability model.
6.3 Intrinsic mass transfer coefficient
The intrinsic mass transfer coefficient, kL, is estimated for the co-current upflow and
downflow configuration from the values of the gas-liquid mass transfer coefficient, kLaGL,
and estimates of the surface area for mass transfer, aGL. The gas-liquid mass transfer co-
efficients for solid foam packings in the co-current upflow and downflow configurations
are given in Section 3.1.1 and Section 4.3.2, respectively.
The surface area for gas-liquid mass transfer per unit of reactor volume, aGLεL, can be
estimated in the co-current upflow configuration as the product of the geometric surface
area of the packing, assuming a static liquid film on the surface described by the static
liquid holdup, ε0L (see Table 5.2, page 64), and the bubble fraction, εb. The bubble fraction
is the fraction of the reactor that can be used for gas-liquid mass transfer and is estimated
in the co-current upflow configuration according to the following equation, see Figure 6.3:
εb =εG
1 − εS − ε0
L
(6.2)
Figure 6.3: Image of the experimental setup with the solid foam packing operating in the co-currentupflow bubbling regime, uL = 0.02 m s−1 and uG = 0.2 m s−1. The bubbles appear as the darkerareas and the liquid phase as the the lighter areas. A schematic drawing representing a bubble andthe liquid film on the surface of the solid foam is given at the right, with VG representing the volumeof the gas inside the bubble volume, Vb.

80 Chapter 6
In the co-current downflow configuration, the assumption is made that the liquid
flows over the packing material in the form of a thin film. An estimate of the film area,
aGLεL, can be made from Figure 1.11a by replacing the solid holdup, εS, by (εS + εL).
0 0.2 0.4 0.6 0.8 10
0.01
0.02
0.03
0.04
0.05
Gas velocity, uG
[m s−1
]
kL [
10
3 m
L s
−1]
10 ppi, uL = 0.02 m s
−1
10 ppi, uL = 0.04 m s
−1
40 ppi, uL = 0.02 m s
−1
40 ppi, uL = 0.04 m s
−1
(a) Co-current downflow
0 0.2 0.4 0.6 0.8 10
0.1
0.2
0.3
0.4
0.5
Gas velocity, uG
[m s−1
]
kL [
10
3 m
L s
−1]
10 ppi, uL = 0.04 m s
−1
40 ppi, uL = 0.02 m s
−1
40 ppi, uL = 0.04 m s
−1
(b) Co-current upflow
Figure 6.4: Intrinsic liquid side mass transfer coefficient, kL, for different metal foam packings forthe co-current upflow and downflow configurations.
In the co-current downflow and upflow configurations shown in Figure 6.4, the intrin-
sic mass transfer coefficient, kL, is not a function of the gas velocity and depends solely
on the properties of the solid foam packing and the liquid velocity. The intrinsic mass
transfer coefficient, kL, in the upflow configuration is an order of magnitude larger than in
the co-current downflow configuration. The value of kL for the 10 ppi solid foam packing
is larger than that for the 40 ppi solid foam packing. This increase is possibly due to the
larger struts generating more turbulence within the liquid film on the surface of the solid
foam packing which enhances gas-liquid mass transfer.
6.4 Effect of material type
In using a solid support for a catalyst, one of the main criteria is that the material is inert
and is not affected by the reaction conditions (pH, temperature, pressure, etc.) and that
suitable active catalysts can be deposited over the surface area of the support with high
dispersion. The aluminum foam packings thus far may be treated to form aluminum oxide
which is chemically resistant. However, a better alternative would be to use a carbon
support and to deposit active catalyst (usually Pt or Pd) with standard methods used also
for slurry and trickle bed catalysts. The carbon foams (shown in Figures 6.5c and 6.5d)
however have a smooth graphitic layer on the surface. The surface area of untreated 65
ppi carbon (3v%) foam was measured using krypton physisorption (evacuated to vacuum
for 24 hours at 300◦C, and measured at boiling liquid nitrogen using an ASAP 2020) and

Effect of material type 81
found to be 0.11 m2 g−1. This corresponds to a geometric surface area of 5260 m2S m−3
P per
unit volume of packing. The unit cell model of Fourie and Plessis (2002) predicts a value
of 4959 m2S m−3
P .
(a) 10 ppi aluminium (b) 40 ppi aluminium
(c) 10 ppi carbon (d) 45 ppi carbon
Figure 6.5: Images of solid foam packings supplied by ERG Aerospace Corp. The graduated mark-ings are in mm.
Table 6.1: Static liquid holdup for the aluminium and carbon foam packings.
Contact angle Solid Static liquid Static film
θ holdup (εS) holdup,ε0
L areaa
Material ppi [◦] [m3S m−3
P ] [m3L m−3
P ] [m2GL m−3
P ]
Aluminium 10 45 0.07 0.094 1502
Aluminium 40 - 0.07 0.115 6282
Carbon 10 37 0.03 0.070 1244
Carbon 45 - 0.03 0.191 7503
a Determined using the unit cell model of Fourie and Plessis (2002) with thesolid holdup, εS, as given in Figure 1.11a, replaced by (εS + ε0
L).
The hydrodynamics and mass transfer of the carbon foam packings, without any pre-
treatment and impregnation was experimentally determined in the co-current upflow con-
figuration using the methods and techniques as given in Chapter 3 for the air-water sys-
tem. These results were compared to the results thus far obtained for aluminum foam
packings (Chapter 3). The determination of the three phase contact angle (a measure of

82 Chapter 6
the hydrophobicity of the material) was performed using droplets on the surface of a flat
part of a strut. The curvature of the strut will have an influence on the measurement, and
only serves as a rough estimate of this parameter is obtained this way. The struts of the
solid foam packing are assumed to be non-porous for these measurements.
0 0.2 0.4 0.6 0.8 10.2
0.3
0.4
0.5
0.6
0.7
0.8
0.9
1
→ PulseBubble ←→
Gas velocity, uG
[m s−1
]
Liq
uid
hold
up, ε
L [
mL3 m
P−3]
0.02 m s -1
10 ppi 40 ppi 10 ppi 40 ppi
0.04 m s -1
u L
Aluminum Carbon
(a) Liquid holdup
0 0.2 0.4 0.6 0.8 10
20
40
60
80
100
→ PulseBubble ←→
Gas velocity, uG
[m s−1
]
Pre
ssure
dro
p, P
f [10
2 P
a m
−1]
0.02 m s -1
0.04 m s -1
u L
Aluminum Carbon
(b) Frictional pressure drop, Pf
Figure 6.6: (a) Liquid holdup and (b) frictional pressure drop mass transfer coefficient per unit ofreactor volume, for 10 ppi aluminium and carbon foam packings in the co-current upflow configu-ration.
In Figure 6.6a the liquid holdup results for the carbon and aluminum solid foam pack-
ings are given for the co-current upflow configuration for two-phase gas-liquid flow for
the air-water system. The results show that the liquid holdup for the 45 ppi carbon foam
is significantly higher than for the 10 ppi foams and 40 ppi aluminium foam at the same
gas and liquid velocities. The static liquid holdup, as given in Table 6.1, is higher in the 45
ppi case and may explain these results. Here the unit cells are possibly filled with liquid
droplets and drainage from the solid foam packing is more difficult. At liquid and gas
flows conditions through the solid foam packings, possibly unit cells are filled with liquid
droplets giving rise to higher liquid holdup.
The frictional pressure drop per unit length of packing is given in Figure 6.6b for 10
ppi solid foam packings (aluminum and carbon). The frictional pressure drop of the car-
bon foam packing is lower than that of the aluminum foam packing in the pulse regime.
Equation 5.20 describes the frictional pressure drop in terms of the voidage of the pack-
ing, the static liquid holdup, and the gas and liquid velocities and decreases as the voidage
increases. These packings have similar pore sizes but carbon foam packing has a higher
voidage and hence a lower frictional pressure drop.
The results for the gas-liquid mass transfer coefficient per unit of reactor volume,
kLaGLεL, shown in Figure 6.7a, indicate that the influence of the material type is negligible.
The intrinsic mass transfer coefficient, kL, is given in Figure 6.7b using Equation 6.2 and

Reactor comparison 83
0 0.2 0.4 0.6 0.8 10
0.1
0.2
0.3
0.4
0.5
→ PulseBubble ←→
Gas velocity, uG
[m s−1
]
kLa G
L ε
L [
m3 L m
−3
P s
−1] 0.02 m s -1
10 ppi 40 ppi 10 ppi 40 ppi
0.04 m s -1
u L
Aluminum Carbon
(a) Mass transfer coefficient, kLaGLεL
0 0.2 0.4 0.6 0.8 10
0.1
0.2
0.3
0.4
0.5
→ PulseBubble ←→
Gas velocity, uG
[m s−1
]
kL [
10
3 m
L s
−1]
10 ppi 45 ppi 10 ppi 40 ppi
0.04 m s -1
u L
Aluminium Carbon
(b) Intrinsic mass transfer coefficient, kL
Figure 6.7: (a) mass transfer coefficient per unit of reactor volume and (b) , for aluminium andcarbon foam packings in the co-current upflow configuration.
the values of the static liquid holdup given in Table 6.1. The results show that although the
solid surface area and the voidage of the packings change (97% for carbon as opposed to
93% for aluminum), the value of kL remains the same for similar ppi number solid foam
packings. This indicates that the type of the packing material influences the gas-liquid
mass transfer coefficient by influencing the gas-liquid contact area. No influence on the
resulting intrinsic mass transfer coefficient is observed. However, the measurements per-
formed on aluminium foam packings may be used to determine the performance of the
more chemically inert carbon foam packings. The measurement of the hydrophobicity
of the two materials remains somewhat inconclusive but for the two materials investi-
gated the influence is found to be negligible in terms of the gas-liquid mass transfer for
aluminium and carbon foam packings.
6.5 Reactor comparison
In the design of a commercial reactor, the most important factors determining the eventual
reactor design are the intrinsic rate constant of the active catalyst, the production rate, and
the heat of reaction. In selecting a reactor packing to support the active catalyst for a gas-
liquid reaction, an additional aspect of the mass transfer of reactants from the gas phase
and liquid phase to the catalytically active sites needs to be considered. These reactor
packings are available in a large number of geometric shapes (see Figure 1.5, page 5) in an
attempt to increase the mass transfer to the catalytically active sites and provide enough
area for deposition of large quantities of active catalyst.
In this section a comparison is made between a packed bed of spherical particles of
nominal diameter 5.6 mm and a 10 ppi solid foam packing (see Figure 6.8) for the oxidation

84 Chapter 6
of glucose over a palladium catalyst. These packings have approximately the same specific
surface area, and spherical particles of 5.6 mm at high gas and liquid velocities have been
studied extensively in the co-current upflow and downflow configurations (see Lakota
and Levec (1990); Specchia et al. (1978, 1974); Hirose et al. (1974)). The differences in
terms of the liquid holdup, the frictional pressure drop, the mass transfer of reactants, and
ultimately the overall reaction rate for this comparison is made for two-phase co-current
flow (upflow and downflow). This comparison is based on equal gas and liquid flow rates
through the two different packings which have similar geometric surface areas.
(a) Spherical particle, aP = 642 m2
S m−3
P (b) Solid foam packing, aP = 763 m2
S m−3
P
Figure 6.8: In (a) a schematic representation of a spherical particle is shown and in (b) an image ofthe solid foam packing is given, with the graduated markings in mm.
6.5.1 Overall reaction rate of multi-phase reactors
In Figure 6.9 the phenomenological model of a multiphase heterogeneously catalyzed re-
actor, where a gas and liquid component is reacting on a supported catalyst, is given
schematically. Here the gas component has to undergo absorption in the liquid, trans-
fer through the liquid to the catalyzed surface, and adsorption on the active catalyst for
reaction to occur.
The overall reaction rate describing this phenomena for a (pseudo) first order reaction
is given by the following, (taken from Levenspiel (1999)) :
−r =
1
kGaGLεLH︸ ︷︷ ︸
Gas
+1
kLaGLεL︸ ︷︷ ︸
Liquid
+1
kSaLSεL︸ ︷︷ ︸
Liquid−Solid
+1
η (kir) LtρSεS
−1
pG
H(6.3)

Reactor comparison 85
Gas Liquid Solid
X(g) X(aq) + Y(aq) Products (aq)
Figure 6.9: Schematic representation of the transfer of a gaseous component, X, through the liquid,Y to the active catalyst supported on the solid.
where −r is the overall reaction rate, and the first three terms represent the resistance to
mass transfer of the gas reactant with partial pressure, pG, either in the gas, the liquid film
at the gas-liquid interface, or the liquid film surrounding the solid support of the cata-
lyst, respectively. The intrinsic reaction rate coefficient is given by kir, and Lt represents
the amount of catalyst per unit weight support. The concentration profile of the gas com-
ponents as it travels from the gas phase to the solid surface is depicted schematically in
Figure 6.10.
Solid Liquid
G/L interface
Gas
C i p
G p i = C i H
C L
C S
k G
k L
k S
C S
L/S interface
Figure 6.10: Sketch showing the resistances to mass transfer in a gas-liquid system with reactionon the surface of the catalyst.
In describing the transfer of the gaseous component, most often either the resistances
to mass transfer (gas-liquid and liquid-solid) or the kinetics of the reaction occurring at
the catalytic surface is dominating and subsequently limits the reactor performance. The
following criteria are used to describe whether a reactor is mass transfer limited or kineti-
cally limited:
Mass transfer limited :
1
η (kir) LtρSεS
≤ 1
10
(1
kGaGLεLH+
1
kLaGLεL
+1
kSaLSεL
)
(6.4)

86 Chapter 6
Kinetically limited :
1
η (kir) LtρSεS
≥ 10
(1
kGaGLεLH+
1
kLaGLεL
+1
kSaLSεL
)
(6.5)
In general, heterogeneously catalyzed multiphase reactors are mass transfer limited, where
the kinetic term contributes less than 10% to the overall performance of the reactor, given
in Equation 6.4. The contributions of the mass transfer and kinetics may be evaluated once
the mass transfer resistances are known.
6.5.2 Mass transfer coefficients
In determining the mass transfer coefficients for spherical particles and solid foam pack-
ings a few assumptions had to be made. The diffusion coefficient in the gas is typically of
the order of 1 × 10⁻⁵ m2 s−1 and in the liquid phase 1 × 10⁻⁹ m2 s−1. Since the intrinsic
mass transfer coefficients, kL and kG, are related to the diffusion coefficient kG ∝ D0.5−1
G ,
it can be assumed that the mass transfer resistance in the liquid phase at the gas-liquid
interface and the liquid-solid interface is much higher than that in the gas phase, and thus
gas-phase resistance to mass transfer, kGaGL, is neglected. The correlations and assump-
tions for determining the liquid-side mass transfer coefficient and the liquid-solid mass
transfer for oxygen in the air-water system are described in the following sections.
Spherical particles
Spherical particles were studied by Hirose et al. (1974) and Specchia et al. (1974) in terms of
the gas-liquid mass transfer coefficient in co-current downflow and upflow, respectively.
Values of kLaGLεL are given in Table 6.2 at the gas and liquid velocities used in the de-
sign (uL = 0.04 m s−1 and uG = 0.4 m s−1). The liquid-solid mass transfer coefficient is
studied by Lakota and Levec (1990) and Specchia et al. (1978) for co-current downflow
and upflow, respectively. In co-current upflow, the liquid-solid mass transfer coefficient
for single phase flow is described by:
(
ksingle phaseS de
DL
)
=
(
0.99 + 2.14
(uLdeρL
µL
))0.5(µL
ρLDL
)0.33
(6.6)
The gas bubbles or pulses increase the intersticial velocity of the liquid flowing over the
packing and thus increase the liquid-solid mass transfer coefficient. Specchia et al. (1978)
describe this increase by the following expression:
ln
(
kS
ksingle phaseS
)
= 0.480 ln
(ReL
ReG
102
)
− 0.030
[
ln
(ReL
ReG
102
)]2
− 0.30 (6.7)
which for the comparison in Table 6.2 gives a value of kS/ksingle phaseS ≈ 4.

Reactor comparison 87
Solid foam packing
The gas-liquid mass transfer coefficient for 10 ppi solid foam packing is described in Chap-
ter 3 for co-current upflow and Chapter 4 for co-current downflow. Tentorio and Casolo-
Ginelli (1978) studied solid foam packings as the electrode in an electrochemical cell and
report the liquid-solid mass transfer coefficient for single phase flow. They describe the
liquid solid mass transfer coefficient for 10 ppi solid foam packing by the following equa-
tion:kS
DL
= 1.03 × 10⁻⁴
(µL
ρLDL
)0.33(uLρL
µL
)0.53
(6.8)
The liquid-solid mass transfer coefficient for the solid foams operating in co-current up-
flow is calculated using Equation 6.8 for single phase flow and assuming that a similar
enhancement is achieved for gas-liquid flow, kS/ksingle phaseS ≈ 4.
In Table 6.2 the gas-liquid and liquid-solid mass transfer coefficients for the trickle bed
reactor, the flooded bed reactor, and the solid foam packing (co-current downflow and
upflow) are given. The values of kLaGLεL and kSaLSεL for the solid foam packing are in the
same order of magnitude while for the reactors using spherical particles (trickle bed and
flooded bed reactors) the liquid-solid mass transfer coefficient is much lower than the gas-
liquid mass transfer coefficient. This indicates that reactors packed with spherical particles
are operated with significant mass transfer limitations in the liquid film surrounding the
solid surface.
6.5.3 Non-porous support
In designing a catalyst, the catalyst can either be deposited on the outer surface of particles
or inside porous structures within the particles. The kinetic limitation for a non-porous
support (spherical particles and solid foam packing) where the catalyst is only deposited
on the outer layer, and thus hydrodynamically accessible (η = 1), is given here. The
contribution of kinetic limitations to the overall reaction rate is calculated assuming non-
porous particles and catalyst deposition only to occur on the outer surface of the catalyst
support.
The intrinsic reaction rate coefficient for glucose oxidation, kir, is 125 m3
L mol−1
Cat s−1 at
50◦C, Ruthiya (2005). The catalyst loading, Lt, which may be deposited on the outer sur-
face of the solids considered (spherical particles and solid foam packings), is determined
using the following equation:
Lt =
(aS,non−porous
aCat
)
(6.9)
where aS,non−porous is the specific surface area of the solid support (here the specific geomet-
ric surface area), and aCat is the specific surface area of support per unit mol of catalyst,
using the characterization of a reference catalyst (5 wt% Pd/C catalyst, see Wenmakers
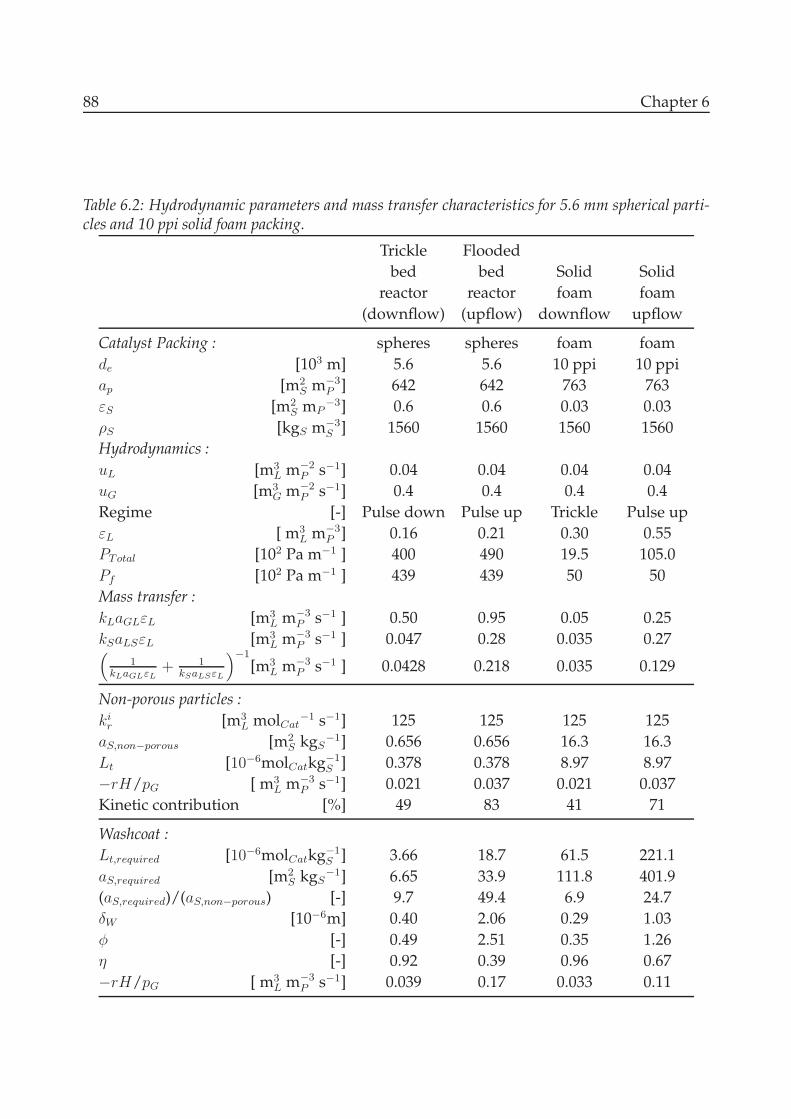
88 Chapter 6
Table 6.2: Hydrodynamic parameters and mass transfer characteristics for 5.6 mm spherical parti-cles and 10 ppi solid foam packing.
Trickle Flooded
bed bed Solid Solid
reactor reactor foam foam
(downflow) (upflow) downflow upflow
Catalyst Packing : spheres spheres foam foam
de [103 m] 5.6 5.6 10 ppi 10 ppi
ap [m2S m−3
P ] 642 642 763 763
εS [m2
S mP−3] 0.6 0.6 0.03 0.03
ρS [kgS m−3
S ] 1560 1560 1560 1560
Hydrodynamics :
uL [m3L m−2
P s−1] 0.04 0.04 0.04 0.04
uG [m3G m−2
P s−1] 0.4 0.4 0.4 0.4
Regime [-] Pulse down Pulse up Trickle Pulse up
εL [ m3L m−3
P ] 0.16 0.21 0.30 0.55
PTotal [102 Pa m−1 ] 400 490 19.5 105.0
Pf [102 Pa m−1 ] 439 439 50 50
Mass transfer :
kLaGLεL [m3L m−3
P s−1 ] 0.50 0.95 0.05 0.25
kSaLSεL [m3L m−3
P s−1 ] 0.047 0.28 0.035 0.27(
1
kLaGLεL+ 1
kSaLSεL
)−1
[m3L m−3
P s−1 ] 0.0428 0.218 0.035 0.129
Non-porous particles :
kir [m3
L molCat−1 s−1] 125 125 125 125
aS,non−porous [m2S kgS
−1] 0.656 0.656 16.3 16.3
Lt [10−6molCatkg−1
S ] 0.378 0.378 8.97 8.97
−rH/pG [ m3L m−3
P s−1] 0.021 0.037 0.021 0.037
Kinetic contribution [%] 49 83 41 71
Washcoat :
Lt,required [10−6molCatkg−1
S ] 3.66 18.7 61.5 221.1
aS,required [m2
S kgS−1] 6.65 33.9 111.8 401.9
(aS,required)/(aS,non−porous) [-] 9.7 49.4 6.9 24.7
δW [10−6m] 0.40 2.06 0.29 1.03
φ [-] 0.49 2.51 0.35 1.26
η [-] 0.92 0.39 0.96 0.67
−rH/pG [ m3L m−3
P s−1] 0.039 0.17 0.033 0.11

Reactor comparison 89
et al. (2008)). The value of aCat is given by the following:
aCat =
(SBET
SSchem
)
MCatSmchem = 1.818 × 10⁶ [m2
Smol−1
Cat] (6.10)
where SBET is the specific area per unit mass of the reference support (850 m2
ref,S g−1
ref,S),
SSChem is the metallic surface area per unit mass of reference support (4.3 m2
Cat g−1
ref,S), MCat
is the molar mass of the catalyst metal (palladium = 106.42 gCat mol−1
Cat), and SmChem is the
metallic surface area per unit mass of catalyst metal (86.4 m2Cat g−1
Cat), given by Wenmakers
et al. (2008).
In Table 6.2 the overall reaction rate coefficient, −rH/pG (= koverall), is given for the
spherical particles and the solid foam packing. Due to the low surface area of the non-
porous solid used as a support for the catalyst, the reaction rates for all four the reactors
(spherical particles or solid foam packings either operating in co-current upflow or down-
flow), is similar. Here it is clear that kinetic limitations are restricting the reactor as in all
cases the kinetic contribution to the overall reactor performance is greater than 10%. The
kinetic limitation may be decreased by increasing the catalyst loading of the solid support,
which usually entails creating pores within the solid support which increases the surface
area for catalyst deposition. In an experiment with graphitic carbon foam of 65 ppi the
surface area could be increased by a factor of approximately 2000 (to 200 m2
S g−1
S ) by oxi-
dation in boiling HNO3, for one hour. However, the resulting solid foam packing is brittle
and the application of a washcoat is rather considered for increasing the surface area for
catalyst deposition. The minimum thickness of such a layer is calculated assuming mass
transfer limitation to dominate.
6.5.4 Washcoat
The outer surface of the solids considered (spherical particles or solid foam packing) is
too low for deposition of enough catalyst to obtain a mass transfer limited reactor. Higher
amounts of catalyst may be deposited on a washcoat layer which serves to increase the
surface area for catalyst deposition. The thickness of this washcoat layer is determined
once the required catalyst loading, Lt,required, for a mass transfer limited reactor has been
calculated according to Equation 6.4. The required loading gives the surface area required
for catalyst deposition, obtained from the following equation:
aS,required = (Lt,required · aCat) (6.11)
The required increase in the surface area of the solid needed for catalyst deposition,
aS,required, for each of the packing materials is given in Table 6.2. The ratio of the mini-
mum surface area required for deposition of the catalyst to the non-porous surface area
of the packing material is in the range of 10 to 50. The minimum layer thickness may be

90 Chapter 6
calculated for typical washcoats:
δW =
(aS,required
aW ρW
)1
aS,non−porous
(6.12)
where aW is the specific surface area of the washcoat (typically 20 m2 g−1
W ) and ρW the bulk
density of the washocat (1200 kgW m−3
W ). The layer thickness is obtained assuming the
washcoat is spread evenly over the non-porous surface of the support material.
In Table 6.2 the layer thickness for the spherical particles and the solid foam pack-
ing is given. The supports (spherical particles and solid foam packings) operating in co-
current upflow and downflow require a washcoat layer thickness in the order of 1 µm. The
layer thickness required for the co-current upflow configurations is the highest due to the
fact that in this flow configuration predominantly higher gas-liquid and liquid-solid mass
transfer coefficients are encountered. The layer thicknesses of the washcoats to be applied
to the solid surfaces is low compared to the washcoat layer thicknesses commonly found
in industrial reactors, where larger loadings of catalyst are applied to account for catalyst
deactivation or leaching. In Giani et al. (2006) a washcoat of Al2O3 is applied to metal
foams and thicknesses of 28 µm were obtained. Wenmakers et al. (2008) applied carbon
nanofiber coatings on carbon foams and thicknesses up to 25 µm were formed. Diffusion
limitations, however, within the pores of the washcoat may cause concentration gradients
within the solid, reducing the efficiency of the catalyst. The effectiveness factor for a flat
plate geometry can easily be calculated (the choice of geometry not affecting the value of
η significantly, Levenspiel (1999)) by :
η =tanh (φ)
φ(6.13)
where φ is the Thiele modulus indicating if the reaction is diffusion limited or not. If the
value of φ is less than 0.4, no diffusion limitation is encountered within the washcoat. The
reaction is pore diffusion limited for φ greater than 4. The value of φ for a (pseudo) first
order reaction is given by:
φ =δW
2
√
kirLt
δW aS,non−porousDe
(6.14)
where δW is the thickness of the washcoat layer, and De is the effective diffusivity, given
by:
De =DLεW
τW
(6.15)
where DL is the molecular diffusivity, εW is the porosity of the washcoat and τ is the tortu-
osity factor, which is defined as the square of the tortuosity. The tortuosity of the washcoat
is a parameter which is difficult to measure, and in general the effective diffusivity, De, is
taken as an order of magnitude lower than the molecular diffusivity, for calculation of φ.

Conclusions 91
In Table 6.2 the Thiele modulus for the layer thicknesses required for increasing the
surface area of the solid supports (spherical particles and solid foam packing) is given.
The Thiele modulus for the solid foam packing operating in the co-current downflow con-
figuration is lower than 0.4 indicating that no diffusion limitation is encountered within
the washcoat. In the reactors with spherical particles and the solid foam packing operating
in the co-current upflow configuration, the Thiele modulus is between 0.4 and 4 indicating
that intermediate pore diffusion limitation is encountered. This, however, does not limit
the overall reaction rate as enough catalyst is deposited on the washcoat to ensure that
the reactors are operated with external mass transfer limitations (gas-liquid and liquid-
solid). The effectiveness factors are the lowest in the co-current upflow configuration for
the spherical particles and the solid foam packing, due to the larger thickness of the wash-
coat layer to be applied. Increasing the thickness of the washcoat layer would result in the
deposition of more catalyst, increasing Lt, but also introduce further diffusion limitations,
which affects the effectiveness factor, η.
The comparison between the two different solid supports (spherical particles and solid
foam packing) using a washcoat gives a general description of the overall reactor. In Table
6.2 the overall reaction rate coefficient, −rH/pG (= koverall), is given for such reactors. The
overall reaction rate for a co-current downflow reactor using spherical particles and solid
foam packing, is similar. This indicates that using a solid foam packing operating at a
reduced pressure gives comparable overall reactor performance. In co-current upflow
the flooded bed reactor using spherical particles as the catalyst support gives twice the
overall reaction rate as the same reactor operating with solid foam packing. However, the
solid foam packing operates at significantly lower pressure drop and hence lower energy
dissipation. In general solid foams operate more energy efficiently than their packed bed
counterparts.
6.6 Conclusions
The liquid holdup for gas-liquid flow through solid foam packings can be described in the
counter-current and co-current (upflow and downflow) configurations by the relative per-
meability model (Saez and Carbonell (1985)). In the co-current downflow configuration
(trickle flow), the model describes the general trends observed, but due to the interaction
between the gas and liquid phases not taken into account, the model over-predicts the
liquid holdup found experimentally.
The voidage of the solid foam material, whether 97% (carbon) or 93% (aluminium),
has little influence on the overall mass transfer coefficient, kLaGL εL and the intrinsic mass
transfer coefficient, kL. Carbon foams have higher voidages but less specific geometric
surface area and have a higher static liquid holdup for 40 ppi foam, when compared to
aluminum foam. Frictional pressure drops for carbon foam are slightly lower than for
aluminum foam. However, carbon foam packing serves as a better support material for

92 Chapter 6
catalysts, especially for fine-chemistry applications, due to its chemical inertness.
A comparison of solid foam packings with a packed bed of spherical particles for co-
current gas-liquid flow shows that for a reactor packed with spherical particles or with the
solid foam packing, both would suffer kinetic limitation for the reaction of glucose oxida-
tion. This is due to the low surface area of the packing materials for catalyst deposition.
This surface area may be increased using a washcoat for the two different packings with
layer thicknesses in the order of 1 µm. Overall reaction rate for solid foam packing with
co-current downflow is similar to that of trickle bed reactors, however at a much lower
frictional pressure drop. In the co-current upflow configuration the flooded bed reactor
packed with spherical particles has twice the overall reaction rate than the same reactor
using solid foam packing. However, the lower overall rate of reaction is achieved at an
order of magnitude lower frictional pressure drop and hence much higher energy effi-
ciency. This indicates that solid foam packings operate at higher energy efficiencies and
can achieve production rates comparable to conventional reactors.

Chapter 7
Perspectives
7.1 Conclusions
The research work presented in this thesis deals with the hydrodynamics and gas-liquid
mass transfer when the packing structure is changed from the conventional packed bed
or structured packings to solid foam packings. These solid foams have the advantage of a
high surface area (for catalyst deposition and generation of gas-liquid mass transfer area)
and high voidage, which decreases the frictional pressure drop and hence enhances the
reactor efficiency.
The solid foam packings have been studied in the counter-current and co-current (up-
flow and downflow) configurations and five different regimes have been found depending
on the gas and liquid superficial velocities. These regimes are summarized in Figure 6.1,
page 77. This map shows the five different regimes observed for co-current and counter-
current flow, trickle flow, bubble upflow, pulse flow upwards, bubble downflow and pulse
downflow. The trickle, bubble upflow and pulse upflow have been studied in more de-
tail. In the counter-current operating condition all these three flow regimes have been
observed. In the co-current upflow configuration the bubble and pulse flow regimes are
studied and in the co-current downflow configuration the trickle flow regime is studied.
For all these configurations the relative permeability model (Saez and Carbonell, 1985)
was used to describe the liquid holdup for different gas and liquid velocities. The values
for the parameters A, B, h1 and h2 for the relative permeability model have been obtained
either by liquid holdup or frictional pressure drop measurements for the different solid
foam packings studied (5, 10, 20, and 40 ppi).
The gas-liquid mass transfer coefficient per unit volume of reactor in the co-current
configurations have been found experimentally and the following correlations (similar to
Sherwood and Holloway (1940)) can be used to describe the results:
Co-current upflow:
kLaGL εLDL−1 = 311u0.44
G (uLρLµL−1)
0.92(ScL)0.5 [SI units, mL m−3
P ]
Co-current downflow (10 ppi):
kLaGL εLDL−1 = 3.7 (uLρLµL
−1)1.16
(ScL)0.5 [SI units, mL m−3
P ]

94 Perspectives
In the co-current downflow configuration the gas-liquid mass transfer coefficient was
found to be dependent on the superficial liquid velocity and in the co-current upflow con-
figuration dependent on both the gas and liquid superficial velocities. The intrinsic mass
transfer coefficient, kL was found in both configurations to be independent of the gas ve-
locity and a strong function of the liquid velocity. In the co-current upflow configuration
values were a factor ten higher than for the co-current downflow configuration. The value
of the Schmidt number of the liquid to the exponent 0.5 was able to describe the decrease
in the gas-liquid mass transfer with increasing liquid viscosity (and decrease in the dif-
fusion coefficient, DL). The gas-liquid mass transfer may also be correlated to the energy
dissipated per unit volume of reactor (found equal to the frictional pressure drop) and
was correlated in the co-current upflow configuration as follows:
Co-current upflow:
kLaGL εL(ScL/ScWater)0.69 = 2.05 × 10⁻⁴ P 0.8
f [SI units, m3L m−3
P s−1]
Chemically inert carbon foam packings can be used as catalyst support for catalyst and
results from the aluminum foam packings obtained in this study are valid also for such
solid foam packings. A reactor packed with solid foam packings or spherical particles has
been compared in terms of the overall reaction rate. Due to the low surface area for cat-
alyst deposition the the overall rate of reaction is kinetically limited for the oxidation of
glucose over a palladium catalyst. A washcoat applied to the surface of the support, with
a thickness in the order of 1 µm, increases the surface area for catalyst deposition and reac-
tors operating under mass transfer limitation can be obtained. In the co-current downflow
(trickle flow), the solid foam packings can achieve the same reaction rate than a conven-
tional packed bed. This reaction rate is achieved at a factor ten lower frictional pressure
drop and hence factor ten lower energy dissipation. In the co-current downflow config-
uration the solid foam operate at a factor ten lower frictional pressure drop, and achieve
half the reaction rate of a packed bed of spherical particles operating. This indicates that
solid foam packings operate more energy efficiently than the conventional packed bed of
spherical particles. This is due to the high voidage of the solid foam packings.
7.2 Recommendations
In the work presented in this thesis a relatively small comparison between solid foam
packings and other packing materials is made in terms of the liquid holdup, the pressure
drop and the gas-liquid mass transfer coefficient. The information presented however
should provide a clear understanding of the flow conditions (gas and liquid velocities),
the liquid holdup (a parameter reported as difficult to measure accurately), and the fric-
tional pressure drop of multiphase flow through solid foam packings. In studies regarding
reactor packing to be used for multiphase flow this is not always the case and the follow-
ing recommendations are made:
The hydrodynamic parameters, such as liquid holdup and pressure drop, and the solid

Recommendations 95
surface (its structure and the solid holdup) for the solid packing material under investiga-
tion give a reactor its characteristics in terms of mass transfer (gas-to-liquid, liquid-to-solid
and under non-wetting conditions also gas-to-solid) and heat transfer capabilities. If the
liquid holdup has not been measured for different gas and liquid velocities then a clear
physical understanding of the gas-liquid flow is lacking and the use of such a support
structure is difficult. Comparing these to other reactors using different packings also be-
comes problematic. The superficial velocity is based on the available area for flow, and
using an example for liquid flow through a monolith the two methods are described, see
Figure 7.1.
Open area
of channels
Total area
for fluid flow
Voidage =
Fluid Flow
Figure 7.1: Schematic drawing of a monolith reactor indicating both the open area of channels andthe total area for fluid flow. The ratio of these is known as the voidage.
The liquid superficial velocity is defined as a volumetric flow (m3L s−1) per unit of
”reactor area”. This area can be defined as the open area (thus ignoring the effects of
solids and effective increase in the frictional pressure, and underestimation of the actual
size of the reactor) or the total area for fluid flow, including the walls of the monolithic
structures (which may amount to approximately 20% of the reactor volume, depending
on the wall thickness of the channels). This seemingly subtle difference may be used
to explain increases in the frictional pressure drop and makes comparison with different
reactor packings (e.g. packed beds of spherical particles) possible. Thus to account for
the effect of the solids in the reactor, the superficial velocities should be defined per total
unit area of the reactor; and the voidage, and the phase holdups should be defined per
unit volume of the reactor, e.g. solids holdup is the volume of solids per unit volume
of the total reactor. The liquid holdup and gas holdup are defined similarly. The use of
relative liquid holdup (the volume of liquid per unit open volume) should not be used as
confusion over the actual size of the reactor and the pressure drop over the reactor may
arise. This distinct difference in the superficial velocity and holdup of the phases is not
always clearly indicated in the available literature. Increase in the pressure drop due to

96 Perspectives
the presence of the solid which acts as a constriction in the total flow path and phenomena
such as increased mass transfer due to an increase in the intersticial velocities may easily
be explained. It is thus recommended to base all further studies on reactor packings on
the total area for fluid flow and the total volume of all the phases constituting the reactor.
A further study on the work presented in this thesis may focus the attention on the
gas-liquid mass transfer coefficients in the counter-current flow configuration. An esti-
mate using the penetration theory was made which resulted in values of kLaGL of up to
6 s−1. In the context of the results for co-current flow these estimations are high and a
value similar to co-current upflow, with kLaGL up to 1.3 s−1, should be realistic for the
high holdup counter-current configurations and values similar to the co-current down-
flow configuration where the values of kLaGL have a maximum of 0.18 s−1 should hold
for the low liquid holdup counter-current configuration (trickle flow). This is yet to be
experimentally verified. Also the effects of the reactor wall on the resulting liquid holdup
and mass transfer should be determined. This may be done by increasing the width of the
packing material and measuring all hydrodynamic and mass transfer parameters. If the
difference between the two packing thicknesses is insignificant the wall effects are small.
If this is not the case, further investigation of the effect of the reactor wall should be made
to obtain the true contribution of the solid foam packings to the liquid holdup and the
gas-liquid mass transfer coefficient. The effect of entrance and exit effects in the case of
10 ppi solid foam packings in the co-current upflow configuration (Section 3.1.1, page 40)
should be further investigated. These entrance and exit effects possibly cause local de-
pletion which gives a low mass transfer coefficient contributed by the solid foam packing
of oxygen from the liquid film remaining on the solid foam as pulses pass by. This effect
may be studied using a suitable reactive system such as formate oxidation over a plat-
inum catalyst fixed on the solid foam packing which is used as the catalyst support. In
this instance the gas-liquid mass transfer, usually the limiting factor in gas-liquid-solid
reactions, can be measured following the reaction by changes in the pH of the liquid, and
a depletion of the oxygen in the liquid film would not result in a lower gas-liquid mass
transfer coefficient being measured. The gas-liquid mass transfer coefficient for the exper-
iments with lowered liquid surface tension (Section 5.3.3 page 72) in the co-current upflow
configuration lead to a de-saturation of the liquid within the 30 cm of packing length. This
de-saturation of the liquid film was not observed for co-current downflow experiments as
kLaGL is lower. As a comparison between 30 cm and 60 cm of packing is not possible in
this case, the gas-liquid mass transfer coefficient was not measured. Suitable probes using
spectroscopic analysis of the liquid flowing within the column may be used to measure
the concentration of dissolved oxygen and hence the gas-liquid mass transfer coefficient.
These probes are not sensitive to bubbles passing as the probe containing a fluorescing
Rh film is continually wetted, and measurement may be done in-situ (probes being quite
small, 1 mm diameter) to compare two different packing lengths smaller than 30 cm.

Outlook 97
7.3 Outlook
In this section some ideas are presented for further research based on the work presented
in the thesis.
The solid foam packing is a promising material also for the chemical industry due to
its high surface area for catalyst deposition at high voidage (reduces pressure drop). This
gives many opportunities to exploit this material for chemical reactions such at hydro-
genations, oxidations, epoxidations, alkylations etc. where a change in the partial pressure
of the reactants may lead to a reduced conversion or selectivity. However, in this study
only a basis for the development of these reactors have been laid, and further research to
the deposition of catalyst is required to further the advancement towards a chemical reac-
tive system using solid foam packings. The realization of the gas-liquid solid foam reactor
can be achieved by studying the deposition mechanisms of the catalyst components on
the solid support surface (such as carbon) and the effect of pre-treatments of the surface,
such as oxidation in nitric acid. This would lead to a catalyst system that exploits both the
hydrodynamic and mass transfer advantages of solid foam packings and the open struc-
ture would provide a catalyst which is hydrodynamically accessible and hence efficiently
used, giving higher selectivity towards the desired components. The deposition of chemi-
cally selective layers such as zeolites on the solid surface and subsequent deposition of the
active catalyst may even improve these selectivities. This brings about the possibilities of
designing a catalyst at every length scale (reactor to pore size) to exploit a specific reaction,
or reaction mechanism.
In this thesis the gas-liquid mass transfer coefficient was found to correlate to the en-
ergy dissipated per unit volume of reactor (frictional pressure drop) and was found to
also apply to conventional packing materials (spherical particles of 6 mm) with voidages
of 40% or packed micro-reactors. The generality of this equation should be evaluated as
it gives a maximum to the resulting mass transfer for a certain amount of energy input,
indicating some maximum energy efficiency. A higher energy input may result in more
energy dissipation through the formation of liquid circulations which do not necessar-
ily contribute to the overall mass transfer. This energy efficiency may also extend to the
heat transfer (an important parameter for highly exothermic reactions) through heat-mass
analogies commonly found in single phase studies between a solid and a fluid. This un-
derstanding of three phase systems would provide substantial increase in commertial ap-
plication of available reactor designs found in the field of chemical reaction engineering.


Bibliography
Alper, E. (1983). Mass transfer with chemical reaction in multiphase systems, Volume II: Three-phase systems. Martinus Nijhoff Publishers, The Hague.
Armalis, S. and Kubiliene, E. (2000). Stripping potentiometry signal enhancement usingmercury film-coated reticulated vitreous carbon working electrode. Analytica ChimicaActa, 423(2):287–291.
Banhart, J. (2001). Manufacture, characterization and application of cellular metals andmetal foams. Progress in Materials Science, 46(6):559–632.
Bensetiti, Z., Larachi, F., Grandjean, B. P. A., and Wild, G. (1997). Liquid saturation incocurrent upflow fixed-bed reactors: a state-of-the-art correlation. Chemical EngineeringScience, 52:4239–4247.
Bhattacharya, A., Calmidi, V. V., and Mahajan, R. L. (2002). Thermophysical propertiesof high porosity metal foams. International Journal of Heat and Mass Transfer, 45(5):1017–1031.
Boomsma, K. and Poulikakos, D. (2001). On the effective thermal conductivity of a three-dimensionally structured fluid-saturated metal foam. International Journal of Heat andMass Transfer, 44(4):827–836.
Carbonell, R. G. (2000). Multiphase flow models in packed beds. Oil and Gas Science andTechnology, 55(4):417–425.
Charpentier, J. (1976). Recent progress in two-phase gas-liquid mass transfer in packedbeds. The Chemical Engineering Journal, 11:161–181.
Dankworth, D. C. and Sundaresan, S. (1989). A macroscopic model for countercurrentgas-liquid flow in packed columns. AIChE Journal, 35(8):1282–1292.
Deab, M. S. E. and Saleh, M. M. (2003). Electrocatalytic production of hydrogen on reticu-lated vitreous carbon. International Journal of Hydrogen Energy, 28(11):1199–1206.
Dudukovic, M. P., Larachi, F., and Mills, P. L. (2002). Multiphase catalytic reactors: aperspective on current knowledge and future trends. Catalysis reviews. Science and engi-neering, 44(1):123–246.
Ellenberger, J. and Krishna, R. (1999). Counter-current operation of structured catalyticpacked distillation columns: pressure drop, hold-up and mixing. Chemical EngineeringScience, 54:1339.
Ernest, F. and Ravault, G. (1974). Gas/liquid contact apparatus. Patent GB 1484461.
Fahim, M. A. and Wakao, N. (1982). Parameter estimation from tracer reponse measeur-ments. The Chemical Engineering Journal, 25:1–8.

100 Bibliography
Ferrouillat, S., Tochon, P., and Peerhossaini, H. (2006). Micromixing enhancement by tur-bulence: Application to multifunctional heat exchangers. Chemical Engineering and Pro-cessing, 45:633–640.
Fourie, J. G. and Plessis, J. P. D. (2002). Pressure drop modeling in cellular metallic foams.Chemical Engineering Science, 57(14):2781–2789.
Francis, R. C. and Berg, J. C. (1967). The effect of surfactants on a packed distillationcolumn. Chemical Engineering Science, 22:685–692.
Frank, M. J. W. (1996). Mass and heat transfer phenomena in G-L(-S) reactors relevant for reactivedistillation. Ph.D. Dissertation, Universiteit Twente, the Netherlands. Thesis/dissertation,Universiteit Twente.
Friedrich, J. M., de Leon, C. P., Reade, G. W., and Walsh, F. C. (2004). Reticulated vitreouscarbon as an electrode material. Journal of Electroanalytical Chemistry, 561(1-2):203–217.
Fukushima, S. and Kusaka, K. (1979). Gas-liquid mass transfer and hydrodynamic flowregion in packed columns with cocurrent upward flow. Journal of Chemical Engineeringof Japan, 12(4):296–301.
Giani, L., Cristiani, C., Groppi, G., and Tronconi, E. (2006). Washcoating method for pd/γ-al2o3 deposition on metallic foams. Applied Catalysis B: Environmental, 62:121–131.
Goto, S. and Smith, J. (1975). Trickle-bed reactor performance, part i. holdup and masstransfer effects. AIChE Journal, 21(4):706–713.
Hirose, T., M.Toda, and Sato, Y. (1974). Liquid-phasemass transfer in packed bed reactorwith cocurrent gas-liquid downflow. Journal of Chemical Engineering of Japan, 7(3):187–192.
Hu, B., Nienow, A. W., Stitt, E. H., and Pacek, A. W. (2006). Bubble sizes in agitatedsolvent/reactant mixtures used in heterogeneous catalytic hydrogenation of 2-butyne-1,4-diol. Chemical Engineering Science, 61:6765–6774.
Iliuta, I., Grandjean, B. P. A., Piche, S., and Larachi, F. (2003). Two-fluid model for counter-current dumped packing-containing columns. Chemical Engineering Science, 58(7):1373–1380.
Iliuta, I., Larachi, F., Grandjean, B. P. A., and Wild, G. (1999). Gas-liquid interfacial masstransfer in trickle-bed reactors: state-of-the-art correlations. Chemical Engineering Science,54:5633–5645.
Isbin, H. S. and Su, Y. S. (1961). Use of the mechanical energy balance for two-phase flow.AIChE Journal, 7(1):174.
Kasturi, G. and Stepanek, J. B. (1974). Two-phase flow – iv. gas and liquid side masstransfer coefficients. Chemical Engineering Science, 29(9):1849–1856.
Kreutzer, M. T., Kapteijn, F., Moulijn, J. A., Ebrahimi, S., Kleerebezem, R., and van Loos-drecht, M. C. M. (2005). Monoliths as biocatalytic reactors: Smart gas-liquid contactingfor process intensification. Industrial and Engineering Chemistry Research, 44(25):9646–9652.
Lakota, A. and Levec, J. (1990). Solid-liquid mass transfer in packed beds with co-currentdonward two-phase flow. AIChE Journal, 36(9):1444–1448.

Bibliography 101
Lamb, D. E. and White, J. L. (1962). Use of momentum and energy equations in two-phaseflow. AIChE Journal, 8(2):281–283.
Larachi, F., Cassnello, M., and Laurent, A. (1998). Gas-liquid interfacial mass transferin trickle-bed reactors and elevated pressures. Industrial and Engineering Chemistry Re-search, 37:718–733.
Lebens, P., Stork, M., Kapteijn, F., and Moulijn, J. A. (1999). Hydrodynamics and masstransfer issues in a countercurrent gas-liquid internally fined monolith reactor. ChemicalEngineering Science, 54:2381–2689.
Levenspiel, O. (1999). Chemical Reaction Engineering, Third Edition. John Wiley and Sons,Inc., New York.
Losey, M. W., Schmidt, M. A., and Jensen, K. F. (2001). Microfabricated multiphase packed-bed reactors: Characterization of mass transfer and reactions. Industrial & EngineeringChemistry Research, 40:2555–2562.
Lu, T. J., Stone, H. A., and Ashby, M. F. (1998). Heat transfer in open-cell metal foams. ActaMaterialia, 46(10):3619–3635.
Luo, D. and Ghiaasiaan, S. M. (1997). Liquid-side interphase mass transfer in cocur-rent vertical two-phase channel flows. International Journal of Heat and Mass Transfer,40(3):641–655.
Mangers, R. J. and Ponter, A. B. (1980). Effect of viscosity on liquid film resistance tomass transfer in packed column. Industrial and Engineering Chemistry Process Design andDevelopment, 19:530–537.
Midoux, N., Morsi, B., Purwasasmita, M., Laurent, A., and Charpentier, J. (1984). Interfa-cial area and liquid side mass transfer coefficient in trickle bed reactors operating withorganic liquids. Chemical Engineering Science, 39(5):781–794.
Molga, E. J. and Westerterp, K. R. (1997). Experimental study of a cocurrent upflow packedbed bubble column reactor: pressure drop, holdup and interfacial area. Chemical Engi-neering and Processing, 36(6):489–495.
Montillet, A., Comiti, J., and Legrand, J. (1993). Axial dispersion in liquid flow throughpacked reticulated metallic foams and fixed beds of different structures. Chemical Engi-neering Journal, 52(2):63–71.
Morsi, B. (1989). Mass transfer coefficients in a trickle-bed reactor with high and lowviscosity organic solutions. The Chemical Engineering Journal, 41:41–48.
Onda, K., Takeuchi, H., and Okumoto, Y. (1968). Mass transfer coefficients between gasand liquid phases in packed columns. Journal of Chemical Eningeering of Japan, 1(1):56–62.
Phanikumar, M. S. and Mahajan, R. L. (2002). Non-darcy natural convection in high poros-ity metal foams. International Journal of Heat and Mass Transfer, 45(18):3781–3793.
Plessis, P. D., Montillet, A., Comiti, J., and Legrand, J. (1994). Pressure drop prediction forflow through high porosity metallic foams. Chemical Engineering Science, 49(21):3545–3553.
Pletcher, D. and Whyte, I. (1991). Reticulated vitreous carbon cathodes for metal ion re-moval from process streams, parti: Mass transport studies. Jornal of Applied Electrochem-

102 Bibliography
istry, 21:659–666.
Pretorius, V. and Hahn, H. H. (1980). Apparatus for distribution separation processes.Patent US 4208284.
Rangwala, H. A., Otto, F. D., Wanke, S. E., and Chuang, K. T. (1990). Mass transfer ina trickle-bed column packed with a mixture of hydrophobic and hydrophilic spheres.Canadian Journal of Chemical Eingineering, 68:237–241.
Richardson, J. T., Peng, Y., and Remue, D. (2000). Properties of ceramic foam catalystsupports: pressure drop. Applied Catalysis, A: General, 204(1):19–32.
Richardson, J. T., Remue, D., and Hung, J. K. (2003). Properties of ceramic foam catalystsupports: mass and heat transfer. Applied Catalysis, A: General, 250(2):319–329.
Rocha, J. A., Bravo, J. L., and Fair, J. R. (1996). Distillation columns containing structuredpackings: A comprehensive model for their performance. 2. mass transfer model. In-dustrial & Engineering Chemistry Research, 35:1660–1667.
Ruthiya, K. C. (2005). Mass transfer and hydrodynamics in catalytic slurry reactors. PhD thesis,Eindhoven University of Technology.
Ruthiya, K. C., van der Schaaf, J., Kuster, B. F. M., and Schouten, J. C. (2004). Mod-elling the effect of particle to bubble adhesion on mass transport and reaction rate in astirred slurry reactor: Influence of catalyst support. Chemical Engineering Science, 59(22-23):5551–5558.
Saez, A. E. and Carbonell, R. G. (1985). Hydrodynamic parameters for gas-liquid cocurrentflow in packed beds. AIChE Journal, 31(1):52–62.
Seguin, D., Montillet, A., Comiti, J., and Huet, F. (1998). Experimental characterizationof flow regimes in various porous media - ii: transition to turbulent regime. ChemicalEngineering Science, 53(22):3897–3909.
Seijger, G. B. F., Oudshoorn, O. L., Boekhorst, A., van Bekkum, H., van den Bleek, C. M.,and Calis, H. P. A. (2001). Selective catalytic reduction of nox over zeolite-coated struc-tured catalyst packings. Chemical Engineering Science, 56(3):849–857.
Sherwood, T. and Holloway, F. (1940). Performance of packed towers - liquid film data forseveral packings. Transactions of the American Institute of Chemical Engineers, 36:39–70.
Sinnot, R. K. (1999). Coulsen and Richardson’s Chemical Engineering, Volume 6, ChemicalEngineering Design. Butterworth-Heinemann, Oxford.
Smit, G. J. F. and Plessis, J. P. D. (1999). Modeling of non-newtonian purely viscous flowthrough isotropic high porosity synthetic foams. Chemical Engineering Science, 54(5):645–654.
Specchia, V., Baldi, G., and Gianetto, A. (1978). Solid-liquid mass transfer in co-curret two-phase flow throught packed beds. Industrial and Engineering Chemistry Process Design andDevelopment, 17(3):362–367.
Specchia, V., Sicardi, S., and Gianetto, A. (1974). Absorption in packed towers with con-current upward flow. AIChE Journal, 20(4):646–653.
Stichlmair, J., Bravo, J. L., and Fair, J. R. (1989). General model for prediction of pressuredrop and capacity of countercurrent gas/liquid packed columns. Gas Separation and

Bibliography 103
Purification, 3(1):19–28.
Tentorio, A. and Casolo-Ginelli, U. (1978). Characterization of reticulate three-dimentionalelectrodes. Journal of Applied Electrochemistry, 8:195–205.
Tomida, T., Yoshida, M., and Okazaki, T. (1975). Liquid-side volumetric mass transfercoefficient in upward two-phase flow of air-mixtures. Journal of Chemical Engineering ofJapan, 9(6):464–468.
Treybal, R. E. (1980). Mass-transfer operations. McGraw-Hill, New York, third edition edi-tion.
Vohr, J. (1962). The energy equation for two-phase flow. AIChE Journal, 8(2):280–281.
Wenmakers, P. W. A. M., van der Schaaf, J., Kuster, B. F. M., and Shouten, J. C. (2008).”hairy foam”: carbon nanofibers grown of solid carbon foam. a fully accessible, highsurface area, graphitic catalyst support. Journal of Materials Chemistry, to be printed, doi10.1039/b718673h.
Wilke, C. R. and Chang, P. (1955). Correlation of diffusion coefficients in dilute solutions.AIChE Journal, 1:264–270.
Zuiderweg, F. J. and Harmens, A. (1958). The influence of surface phenomena on theperformance of distillation columns. Chemical Engineering Science, 9:89–108.


List of Publications
Patent application
• C.P. Stemmet, B.F.M. Kuster, J. van der Schaaf, J.C. Schouten, Multiphase reactions
using solid foams, WO2006065127-A1 (2004).
Journal publications
• C.P. Stemmet, J.N. Jongmans, J. van der Schaaf, B.F.M. Kuster, J.C. Schouten, Hydro-
dynamics of gas-liquid counter-current flow in solid foam packings, Chem. Eng. Sci.,
60, p 6422, (2005).
• C.P Stemmet, J. Van der Schaaf, B.F.M. Kuster, J.C. Schouten, Solid foam packings
for multiphase reactors: Modelling of liquid holdup and mass transfer, Chem. Eng.
Res. Des., 84 (A12), p 1134, (2006).
• C.P. Stemmet, M. Meeuwse, J. van der Schaaf, B.F.M. Kuster, J.C. Schouten, Gas-
liquid mass transfer and axial dispersion in solid foam packings, Chem. Eng. Sci., 62,
p 5444, (2007).
• C.P. Stemmet, F. Bartelds, J. van der Schaaf, B.F.M. Kuster, J.C. Schouten, Influence
of the liquid viscosity and surface tension on the hydrodynamics and mass transfer
in co-current gas-liquid flow through solid foam packings, Chem. Eng. Res. Des.,
accepted, (2008).
• C.P. Stemmet, F. Bartelds, J. van der Schaaf, B.F.M. Kuster, J.C. Schouten, Hydrody-
namics and mass transfer for gas-liquid co-current downflow through solid foam
packings, in preparation, (2008).
Refereed conference proceedings
• C.P. Stemmet, J.N. Jongmans, J. van der Schaaf, B.F.M. Kuster, J.C. Schouten, Hy-
drodynamics of gas-liquid counter-current flow in solid foam packings, Proc. 7th
International Conference on Gas-Liquid and Gas-Liquid-Solid Reactor Engineering (GLS7),
August 21-25, 2005; Editors: -, Strasbourg, France, CD Rom paper 5.1, (2005).

106
• C.P. Stemmet, J. van der Schaaf, B.F.M. Kuster, J.C. Schouten, Axial dispersion and
mass transfer for solid foam packings, Proc. International Symposia on Chemical Re-
action Engineering, (ISCRE-19), September 3-6, 2006; Editors: -, Potsdam, Germany,
Poster number: 157 p 498 (2006).
Non-refereed conference proceedings
• J.C. Schouten, C.P. Stemmet, P.W.A.M. Wenmakers, R. Tschentscher, T.A. Nijhuis,
J. van der Schaaf, B.F.M. Kuster, Novel structured reactor packings - The potential
of solid foam materials for multiphase applications, Proc. Int. Symp. on Catalysis
Engineering; Delft, Netherlands, 23-24, (2007).
Oral presentations
• C.P. Stemmet, J. van der Schaaf, B.F.M. Kuster, J.C. Schouten, Structured foam pack-
ings for multiphase reactors: mass transfer characteristics for counter-current gas-
liquid flow, Proc. 7th World Congress of Chemical Engineering (WCCE 2005), July 10-14,
2005; Editors: -, Glasgow, United Kingdom, 84774/1-84774/30 (2005).
• C.P. Stemmet, J. van der Schaaf, B.F.M. Kuster, J.C. Schouten, Multiphase solid foam
reactors, 6th Netherlands’ Process Technology Symposium (NPS6), Veldhoven, October,
2006.

Acknowledgements
The last four years have been truly memorable with colleagues, friends, and family giving
their support every step of the way and I would like to acknowledge them in this section.
The first person I would like to thank is Prof.dr.ir. J.C. Schouten. Jaap, during the last
four years you have given me the support and inspiration needed in completing this novel
project. At difficult times you were always there with a guiding hand. Your guidance in
completing this project has inspired me and I wish to sincerely thank you for the time
you have spent, albeit your tight schedule. The critical remarks and eye for detail on
articles and other material to be submitted (as with this thesis) have always been greatly
appreciated. I have learnt so much from you and know that I will use these skills further
in my career. I am indebted to Dr.ir. John van der Schaaf and Dr.ir. Ben Kuster for their
insight into what needs to be done, investigated, and further investigated, and for the
fruitful discussions we have had. John, thank you for your lively discussions and critical
comments on the procedures for the experimental work and the interpretations of the
results. Ben, thank you for the discussions and comments during the progress meetings
and feedback when looking at results, and for proposing this novel study. I hope I have
fulfilled some of your expectations.
I would like to thank STW (Dutch Technology Foundation) for their financial support
and the industrial partners DSM, BASF (formally Engelhard B.V.), ABB, and Shell for their
co-operation in the project, and Recemat and Ecoceramics for their input during our half-
yearly meetings.
My appreciation goes out to the people who help build (and adjust) the setup so
that the data contained in this thesis could be measured. Roland Haghuis (Zeton), Karel
Janssen (Janssen Engineering) and Anton Bombeeck (TU/e) have input a great deal of
time and effort into the design and construction of the experimental setup and I would
like to acknowledge them. In doing such a novel project the experimental setup needs
some adjustments and I would like to thank Frank Grootveld, Madan Binderaban, and
Chris Luyk for their efforts and technical help to get the setup up and running after these
adjustments have been made.
I am greatly indebted to my colleagues during my time at the TU/e and appreciate
your support and kind words when obstacles seemed too great. I would like to say a
special thank you to Denise for all her effort in arranging all the administrative matters.

108
We sometimes forget how much effort it takes to keep such a large group going, and I
would like to say thanks for all the nice excursions and New Years parties organized. I
have always appreciated the company of my office mates, Keshav, Vinit, Patrick, Roman.
Thanks you for keeping the office lively and for the great discussions.
The quality of this thesis is a reflection of the people I have had the opportunity to
coach during my time here at SCR. I would like to thank all my students, Jurgen, Monique,
Alida, Otto, Leidy, Marco, and Frank for all the experimental work you have performed
in the lab, and the time and effort you have made in understanding the concepts. Your
efforts have not gone unnoticed and I greatly appreciate your help in the completion in
this project.
In deciding to do a PhD in a foreign country some obstacles pose themselves and I
have been blessed in having many dear friends to help in overcoming these obstacles and
lending me their support during some difficult times. I would like to thank my extended
family and friends here in Europe for their support. The difficulty in maintaining a friend-
ship is forgotten when we meet and it seems like just yesterday we spoke. I will not try
to mention all of you but would like to let you know that you are all dear to me and have
made me feel at home here in Europe. I would like to say a special thank you to the family
Christophersen for the times spent at their home during Christmas. The warmth of your
family made me forget the cold winters. To the family Hohmann-Van Kempen I would
like to say a special thank you for including me into your family.
I would like to thank my mother, my siblings, nieces, and nephew for their support
during this time. Mom, Juan, Iloma, Lolene, Deidre, Amy, Tayla, and Matthew whom I
have yet to meet, you have not veered far from my thoughts or heart during the entire
time I have spent here in the Netherlands.
Many thanks to you all,
Charl, 2008

About the author
Charl Philip Stemmet was born on April 19, 1978, in Durban, South Africa. In December
1999 he graduated in Chemical Engineering (Cum Laude) from the School of Chemical
Engineering at the University of Natal in Durban (currently known as the University of
Kwa-Zulu Natal). His dissertation was to design a plant for the ”Production of Maleic
Anhydride from n-Butane using a VPO catalyst”. In March 2001 he joined the Process
Development School at the University of Twente, The Netherlands. In March 2003 he
completed his Masters in Technological Design (PDEng, formerly known as MTD) and
acquired his Ingenieur (Ir.) title from the University of Twente, The Netherlands. His
masters’ dissertation was titled ”Sasol slurry phase reactor with the use of a novel fractal
distributor” and was prepared under the supervision of Prof.dr.ir. M.-O. Coppens (TU
Delft). In April 2003 he started his PhD project in the area of multiphase reactors at the
Eindhoven University of Technology, TU/e, The Netherlands, under the supervision of
Prof. dr. ir. J.C. Schouten. The PhD research covered ”Gas-liquid solid foam reactors:
Hydrodynamics and Mass transfer” and was carried out with the financial support from
the Dutch Technology Foundation, STW, and several industrial partners. Currently, the
author is working as a Postgraduate Researcher at the same group at the TU/e on an STW
project entitled ”In-situ spectroscopy engineering”.