Embed Size (px)
Citation preview

Daniel Dumitrescu, Cathérine Seck, Pia Moinzadeh, Nicolas Hunzelmann, Stephan Rosenkranz
Klinik III für Innere Medizin, Klinik für Dermatologie und Venerologie
Herzzentrum der Universität zu Köln, Universitätsklinikum Köln
Gas exchange measurements during exercise
show early pulmonary arterial hypertension
in scleroderma patients
Annual Congress of the
European Society of Cardiology
Munich, August 26 2012

Conflict of Interest - Disclosure
Within the past 12 months, I or my spouse/partner have had a financial
interest/arrangement or affiliation with the organization(s) listed below.
Affiliation/Financial Relationship Company
1. Honoraria for lectures Actelion, GSK, Lilly, Pfizer
2. Honoraria for advisory board activities
3. Participation in clinical trials Actelion, Bayer, GSK, Novartis
4. Research support Actelion, Pfizer,

3-Year Survival in Patients with Systemic Sclerosis:
The French ItinérAIR-Sclérodermie Study
Hachulla-E et al, Rheumatology 2009; 48: 304-308
546 pts. with systemic sclerosis (w/o pulmonary fibrosis or left heart disease) Overall 3-year Survival: 91.1%
94.4%
56.3%

Relationship between Pulmonary Microcirculation
Loss and Pulmonary Artery Pressure at Rest
Lau et al., Eur Heart J 2011; published on-line May 26
mean PAP
Froim: Kroidl et al. Kursbuch Spiroergometrie. 2006
normal normal
pulmonary
vascular
disease
pulmonary
vascular
disease
Mismatch between
perfusion and ventilation:
Poor perfusion, good ventilation
PaCO2 > PETCO2
Rationale for measurement of PETCO2 during exercise
PaCO2 = arterial pCO2
PETCO2 = end-tidal PCO2
Normal value slightly < 40 mmHg
Normal value around 40 mmHg
Pulmonary ventilation-/perfusion mismatch, reflected by ventilatory efficiency:
VE/VCO2(left) and PETCO2 (right)

Likelihood of PAH, estimated by ventilatory equivalents and
end-tidal CO2 at the anaerobic threshold
Yasunobu Y, Oudiz RJ, Sun XG, Hansen JE, Wasserman K. End-tidal PCO2 abnormality and exercise limitation in patients
with primary pulmonary hypertension. Chest. 2005 May;127(5):1637-1646.
N=60
9 healthy controls
52 PAH patients

Study design
•Consecutive referrals from scleroderma clinic
•SSc and dyspnea (known or new onset)
•No PH diagnosed or known from medical history
n = 45
Non-invasive diagnostic work-up:
•Echocardiography
•Lung function testing
•6 minute walking distance
•NTproBNP
•Cardiopulmonary exercise testing
RIGHT HEART CATHETERIZATION
Group 1: No PAH
PAPmean < 25 mmHg
n=23
Group 2: Mild PAP elevation
PAPmean 25-35 mmHg
n=9
Group 3: High PAP elevation
PAPmean > 35 mmHg
n=13

Calculation of gas exchange parameters
Measurement Calculation algorithm
Peak VO2 (ml/min) Highest average during a complete 30-s
period, to the nearest 10 mL/min
Peak Heart rate (1/min) Highest average during the same
complete 30-s period
Peak O2 pulse (ml/beat) Peak VO2 ÷ peak heart rate,
to the nearest 0,1 ml/beat
AT (ml/min) Primarily V-slope method, but may also
use end-tidal and ventilatory equivalent
data, to the nearest 10 mL/min
PETCO2@AT (mmHg) Average for the 60-s period at and
immediately after the AT
VE/VCO2@AT (mmHg) Average for the 60-s period at and
immediately after the AT
Hansen et al. Reproducibility of Cardiopulmonary Exercise Measurements in patients with pulmonary arterial
hypertension. CHEST 2004;126: 816-824

Patient Characteristics
Total Group 1 Group 2 Group 3
n 45 23 9 13
M/F 9/36 6/17 2/7 1/12
Age (years) 59 ± 13 55 ± 13 62 ± 10 65 ± 12
BMI 24.8 ± 3.7 24.7 ± 3.8 25.4 ± 3.9 24.6 ± 3.7
FVC (% predicted) 84.1 ± 20.5 83.6 ± 4.9 81.8 ± 17.2 86.4 ± 18.4
DLCO (% predicted) 55.2 ± 16.3 61.4 ± 15.1 52.3 ± 14.5 40.5 ± 17.1
PAPmean (mmHg) 28.7 ± 13.4 18.6 ± 5.0 27.8 ± 2.6 45.8 ± 8.6
PCWP (mmHg) 10.7 ± 3.5 10.3 ± 4.0 11.4 ± 2.8 10.9 ± 3.2
CO (L/Min) 4.9 ± 1.3 5.4 ± 1.1 4.8 ± 1.3 4.0 ± 1.0
PVR (Wood units) 4.4 ± 4.0 1.6 ± 0.7 3.6 ± 0.8 9.4 ± 3.4

Diagnostic accuracy of PETCO2 vs tricuspid pressure gradient
true negative false negative
false positive true positive
false positive true positive
true negative false negative

true negative false negative
false positive true positive
false positive true positive
true negative false negative
Diagnostic accuracy of PETCO2 vs tricuspid pressure gradient

true negative false negative
false positive true positive
false positive true positive
true negative false negative
AT 31 mmHg
AT 26 mmHg
AT 27 mmHg
Diagnostic accuracy of PETCO2 vs tricuspid pressure gradient

Relevance of non-invasive diagnostic procedures
Mean ±SD Significance (ANOVA): p < 0,05
Groups (1,2,3) 1 vs 2 1 vs 3 2 vs 3
Tricuspid pressure gradient on echocardiography (mmHg)
1: 26,7±7,9
2: 35,8±14,8
3: 57,9±23,5
no yes no
Peak oxygen consumption (ml/min/kg)
1: 15,8±3,1
2: 12,6±2,1
3: 10,3±2,9
yes yes no
Anaerobic threshold (AT) (ml/min/kg)
1: 11,3±2,2
2: 9,9±2,1
3: 7,8±1,4
no yes no
VE/VCO2 at the AT (no unit)
1: 31,4±3,6
2: 41,3±1,9
3: 45,2±9,3
yes yes no
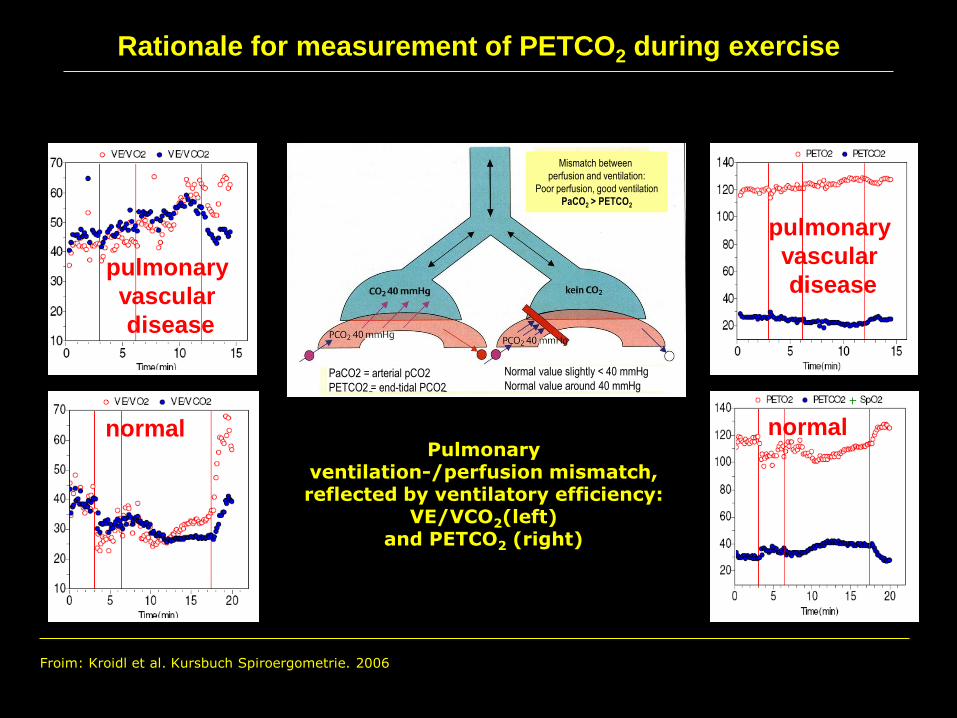
PETCO2 at the AT (mmHg)
1: 36,1±4,0
2: 26,5±0,9
3: 25,7±5,4
yes yes no
PETCO2 difference between start of exercise and AT (mmHg)
1: 3,9±2,3
2: 0,4±3,5
3: -2,5±1,4
yes yes yes

Patient Characteristics
Total Group 1 Group 2 Group 3
n 45 23 9 13
M/F 9/36 6/17 2/7 1/12
Age (years) 59 ± 13 55 ± 13 62 ± 10 65 ± 12
BMI 24.8 ± 3.7 24.7 ± 3.8 25.4 ± 3.9 24.6 ± 3.7
FVC (% predicted) 84.1 ± 20.5 83.6 ± 4.9 81.8 ± 17.2 86.4 ± 18.4
DLCO (% predicted) 55.2 ± 16.3 61.4 ± 15.1 52.3 ± 14.5 40.5 ± 17.1
PAPmean (mmHg) 28.7 ± 13.4 18.6 ± 5.0 27.8 ± 2.6 45.8 ± 8.6
PCWP (mmHg) 10.7 ± 3.5 10.3 ± 4.0 11.4 ± 2.8 10.9 ± 3.2
CO (L/Min) 4.9 ± 1.3 5.4 ± 1.1 4.8 ± 1.3 4.0 ± 1.0
PVR (Wood units) 4.4 ± 4.0 1.6 ± 0.7 3.6 ± 0.8 9.4 ± 3.4

Correlation of DLCO with invasive hemodynamic measurements

Clinical importance of PETCO2 measurement -
Inclusion of postcapillary PH (PCWP > 15 mmHg)
Clinical importance of PETCO2 measurement
Inclusion of borderline PAH (PAPmean 21-24 mmHg)

Conclusions
- CPET is able to detect PAH in scleroderma patients.
- PETCO2 is an important parameter to detect PAH in early and late stages.
- PETCO2 is better able to detect early PAH than the estimated PAP by echo.
- The PETCO2 difference adds relevant information to the AT value.
- CPET might be considered for routine screening in scleroderma patients.

THANK YOU FOR YOUR ATTENTION!