Embed Size (px)
Citation preview

Place your chosen image here. The four corners must just cover the arrow tips. For covers, the three pictures should be the same size and in a straight line.
Gas Day 2nd February 2015
Operational PerformanceNTS Optimisation
47

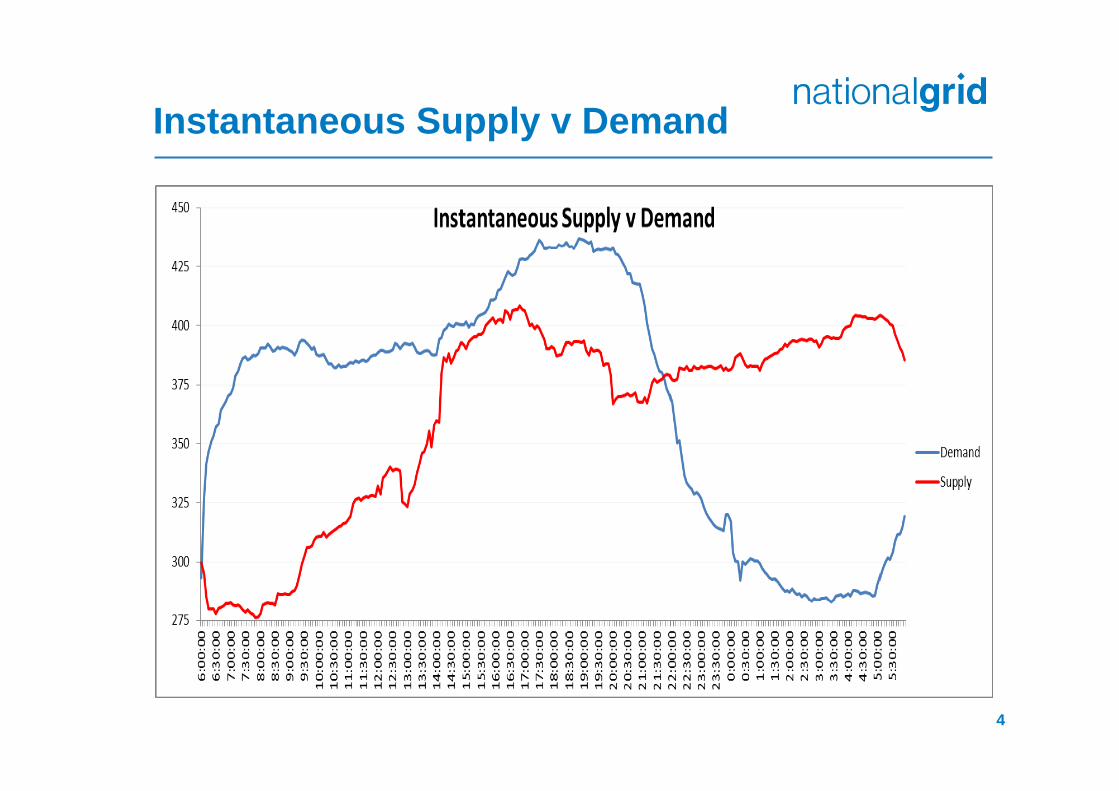
Overview Gas Day started with Linepack of 352.1mcm. Target was increased to 354.0mcm. Initially
44.2mcm light of target. Demand was 359.3mcm
A UKCS Supply Loss resulted in a 11.7mcm reduction and left balance 56.6mcm below target at 8:00am
Renominations seen during the morning from MRS, IUK, Norway and LNG left system balanced by 14:30.
Gas Quality issues at a UKCS sub terminal resulted in a 100% TFA. This resulted in an overall reduction of 5.5mcm loss on the day.
LNG reduced by 5.0mcm at 18:00hrs and balance had returned to a deficit of 15mcm.
Balance was 5.3mcm light at midnight when decision taken to trade. Bought 3.6mcm.
An hour later and the balance had deteriorated to 5.8mcm light so a further 2.1mcm was purchased. Only response is a 1.1mcm increase from MRS.
System closed at 350.6mcm. A loss of 1.5mcm on the day.
2

Gas Day: 2nd February TimelineTFA ‐ UKCS
Opening Linepack 352.1 11.0mcm loss
Target 354.0 System Closes at 350.6
44.2mcm Light of Target Dragon + 16.8mcm UKCS recovery A loss of 1.5mcm
Additiona l 6.5mcm
MRS + 8.0mcm
Balance 15mcm l i ght.
Supply Loss ‐ UKCS MRS +9.9mcm MRS +1.1mcm
11.7mcm reduction Norway +9.8mcm Interconnector Import + 6.8mcm
Balance ‐56.6mcm LNG +2.8mcm System Balanced
MRS +5.5mcm
NG Balancing Action
3
Instantaneous Supply v Demand
4

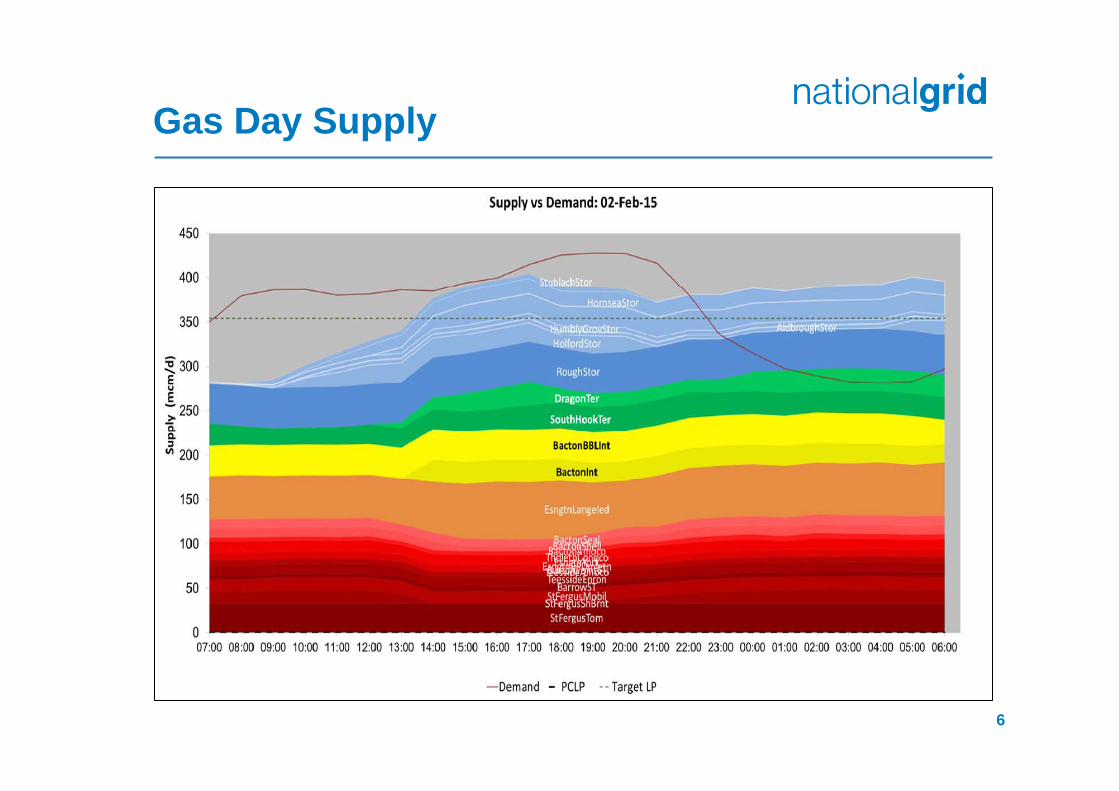
Gas Day Chart
5
Gas Day Supply
6
Gas Day Chart
7

Place your chosen image here. The four corners must just cover the arrow tips. For covers, the three pictures should be the same size and in a straight line.
Gas Day 11th February 2015
Operational PerformanceNTS Optimisation
47

Overview The system opened at 351mcm which was taken as target, with PCLP just 2.4mcm light.
32.6mcm swing was predicted at the start of the day.
A supply loss from Norway reduced inputs by 4.6mcm. With a UKCS sub terminal also reducing by a similar amount, PCLP was 12mcm light.
Balancing actions were carried out at 16:00 and 17:00 in an attempt to address the imbalance and therefore reduce the forecast stock depletion. 3.0mcm was procured.
Interconnector and LNG increased and we saw some MRS withdrawal. However, only one of the renominations increased supplies before 21:00. At 19:00 stock depletion was at 34mcm and falling and another buy action taken (0.6mcm)
By 22:00, stock had fallen to 312.4mcm with the associated within day swing of 38.6mcm. With stock well distributed extremity pressures remained comfortable and all 22:00 pressures were met.
Target linepack was increased to 353.0mcm. This was on the back of: the recent trend of large swings; an associated increased vulnerability to supply losses; a minimal risk from over delivery with the system able to absorb any additional stock comfortably. With the system 5mcm light, a further 0.67mcm was bought, lifting SMPB to 55.0p. Responses were seen from Interconnectors, LNG and MRS
By 02:00 PCLP was 2.2mcm heavy of the revised target and the NTS restocking peaking at around 6mcm per hour. All DN 06:00 pressures were achieved and the day closed at 352.3mcm.
9

Gas Day: 11th February Timeline
NB: Linepack losses were generally as a result of within day profiling. The supply reductions, whilst not insignificant, were not the primary reason for the record within day loss subsequently seen on the Network.
Opening Linepack 351.0 Supply Loss ‐ Norway Target Increased to 353.0
Balance 2.4mcm l ight 4.6mcm reduction Linepack swing 38.6mcm System Closes at 352.3
Balance 12mcm l ight. A ga in of 1.3mcm
UKCS ‐ 4.6mcm Linepack Loss ‐21mcm MRS +2.5mcm
Interconnector +2.7mcm
MRS +1.4mcm
NG Balancing Action
10
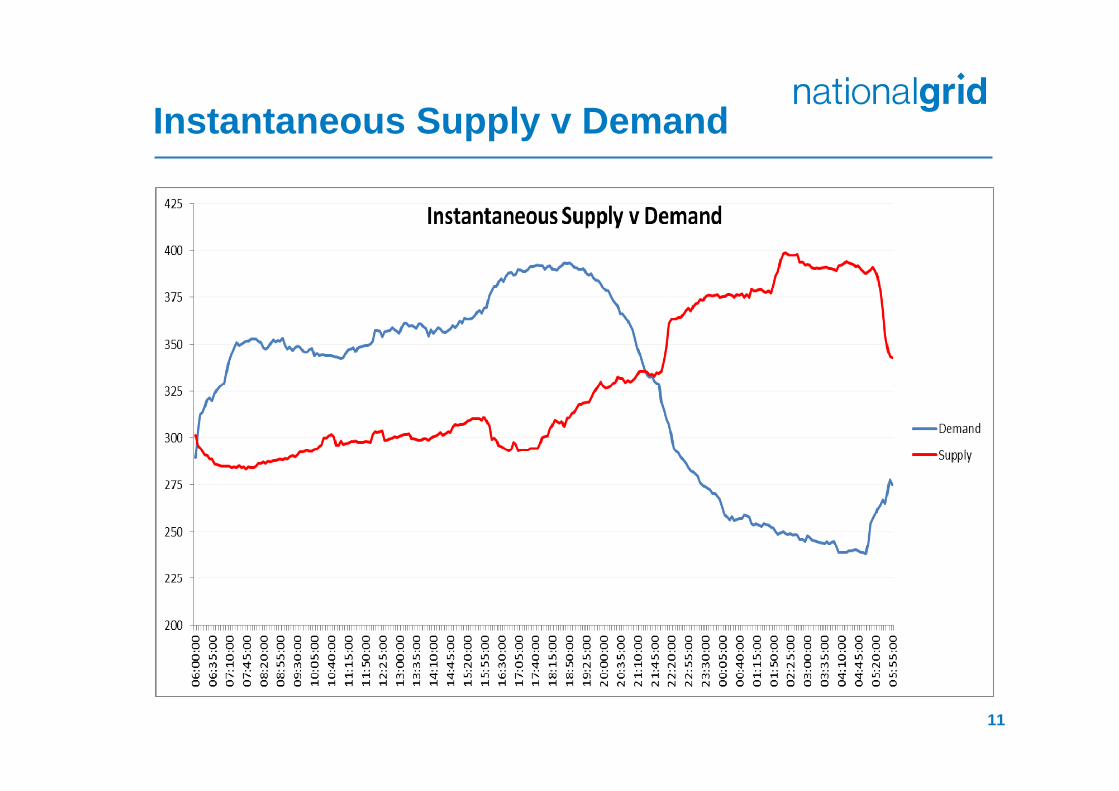
Instantaneous Supply v Demand
11
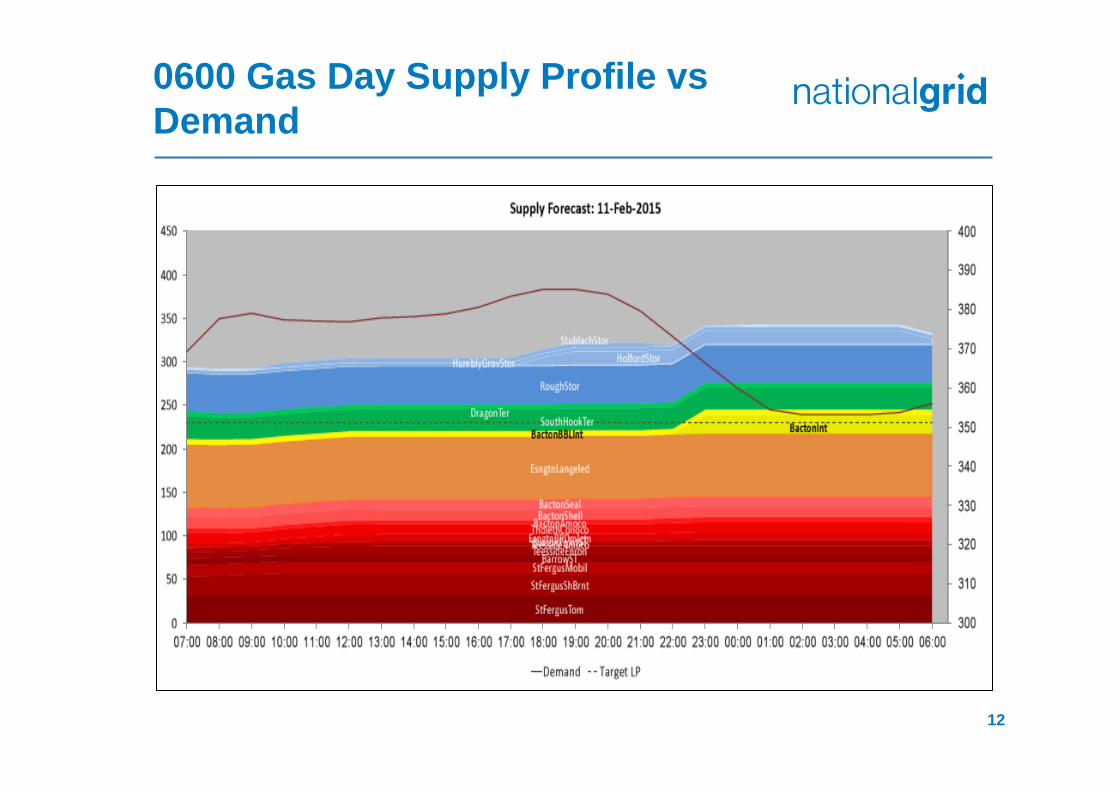
0600 Gas Day Supply Profile vs Demand
12

Gas Day Chart
13


![DOCUMENT RESUME TM 022 556 AUTHOR Merrell, … · WS. 350.6 M568p 1994] RJ503.7.P73M47. ... Scoring the PKBS 10 Interpreting PKBS Scores 22 ... two separate major scales: Social Skills](https://img.pdfslide.us/doc/110x75/5ad4ee207f8b9a0d2d8cfe93/document-resume-tm-022-556-author-merrell-3506-m568p-1994-rj5037p73m47.jpg)