Embed Size (px)
Citation preview
ELSEVIER Journal of Chromatography B, 655 (1994) 21-26
JOURNAL OF CHROMATOGRAPHY B: BIOMEDICAL APPLICATIONS
Gas chromatographic and high-performance liquid chromatographic methods for the determination of
genaconazole in biological fluids
H. Kim *, A. Lapiguera, C. Lin Department of Drug Metabolism and Pharmacokinetics, Schering Plough Research Institute, Kenilworth, NJ 07033, USA
(First received August 12th, 1993; revised manuscript received December 28th, 1993)
Abstract
Gas chromatographic (GC) and high-performance liquid chromatographic (HPLC) methods were developed for the determination of genaconazole in biological fluids. Both methods involved organic solvent extraction followed by solid-phase extraction on a C18 column. GC analysis utilized a megabore column (DB-17) with 63Ni electron-capture detection, whereas HPLC analysis utilized separation on a reversed-phase column with a methanol-phosphate buffer mixture as the mobile phase and quantitation by UV absorbance at 208 nm. Both methods yielded good linearity, accuracy and precision. The limit of quantitation (LOQ) was 0.025/zg per ml of serum for GC and 0.2/xg per ml of serum or 0.5 /~g per ml of urine for HPLC analysis. Both GC and HPLC methods were used for the determination of serum concentration-time curves of genaconazole in man following oral administration of a 50-mg dose.
1. Introduction Initially a simple high-performance liquid chromatographic (HPLC) method was de-
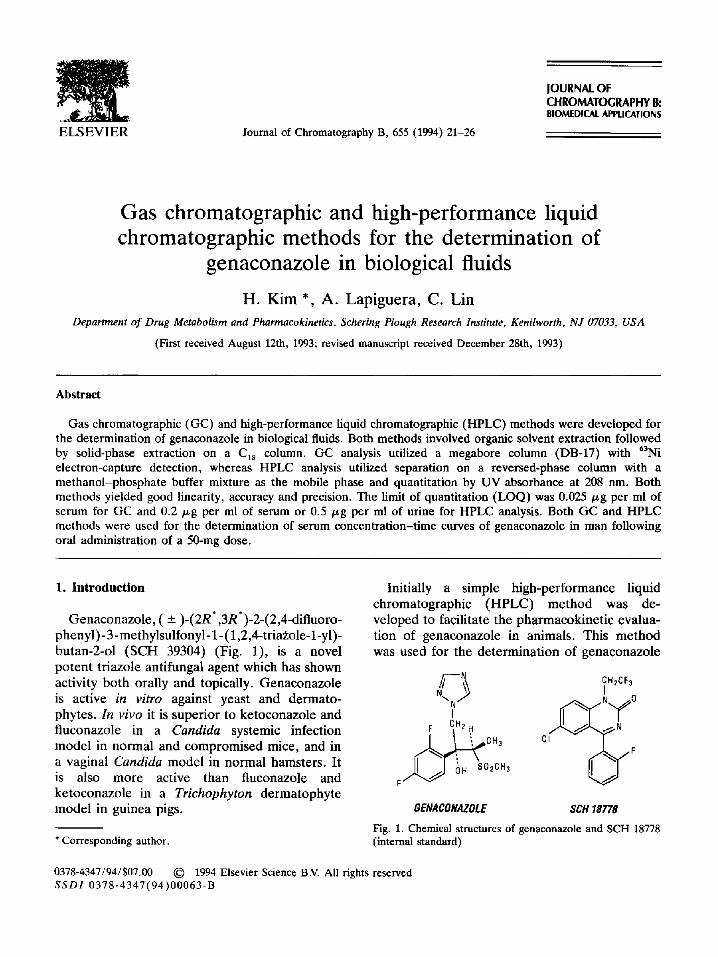
Genaconazole, ( -- )-(2R',3R*)-2-(2,4-difluoro- veloped to facilitate the pharmacokinetic evalua- phenyl)-3-methylsulfonyl-l-(1,2,4-tr ia~ole-l-yl)- tion of genaconazole in animals. This method butan-2-ol (SCH 39304) (Fig. 1), is a novel was used for the determination of genaconazole potent triazole antifungal agent which has shown activity both orally and topically. Genaconazole ./ff---~\ CH2CF3
I is active in vitro against yeast and dermato- ~ ~ \ N / A / N \ ~ 0 phytes. In vivo it is superior to ketoconazole and I [I "T ]" fluconazole in a Candida systemic infection I ~ i . F ~H2H i / ~ , [ ~ a model in normal and compromised mice, and in /~....,~__~CH3 C ,~ ..F a vaginal Candida model in normal hamsters. It ~ r i ---r ~ \ 0 H S02CH3 is also more active than fluconazole and F ketoconazole in a Trichophyton dermatophyte model in guinea pigs. GENACONAZOLE SCH 18778
* Corresponding author. Fig. 1. Chemical structures of genaconazole and SCH 18778 (internal standard)
0378-4347/94/$07.00 © 1994 Elsevier Science B.V. All rights reserved SSD1 0378-4347(94)00063-B
22 H. Kim et al. / J. Chromatogr. B 655 (1994) 21-26
in animal plasma and urine after an oral dose of 20 mg/kg. However, the limit of quantitation (LOQ) of 0.2/xg/ml for the HPLC method may not be adequate for the determination of serum concentrations in man following an oral dose of 50 mg or less. Therefore, a more sensitive gas chromatographic-electron capture detection (GC-ECD) method using a megabore column was developed for the determination of genaconazole in human serum to facilitate phar- macokinetic studies in man. This report de- scribes both the HPLC and GC-ECD proce- dures for the analysis of serum concentrations of genaconazole.
2. Experimental
2.1. Compounds
Glass-distilled ethyl acetate, ether and metha- nol were obtained from Mallinckrodt (Paris, KY, USA). Authentic standards of genaconazole and 6-chloro - 1,2-dihydro -4( O-fluorophenyl ) - 1 - ( 2,2,2- trifluoroethyl)-quinazoline-2-one, SCH 18778 (internal standard) (Fig. 1) were obtained from Sumitomo (Osaka, Japan) and Schering-Plough (Kenilworth, NJ, USA), respectively.
2.2. Sample preparation
To either 0.5 ml of serum or 0.1 ml of urine, 1.0 ml of water was added. These samples were then extracted with 6 ml of ethylacetate (for GC) or ether (for HPLC) by vortex-mixing for one minute. After centrifugation at 1400 g for 10 min, 5 ml of the organic layer were transferred to a clean tube and evaporated to dryness under nitrogen. The residue was then dissolved in 1.5 ml of water and applied to a disposable C18 extraction cartridge (J.T. Baker Chemical, Phil- lisburg, N J, USA) which had been prewashed successively with 2 ml of methanol and 2 ml of water under 15-20 kPa vacuum (Speed Mate-30, Applied Separations, Allentown, PA, USA). The extraction column was then eluted with 2 ml of water followed by 1 ml of 10% methanol in water and 1.5 ml of methanol. The methanol
fraction was collected and evaporated to dryness under nitrogen. For GC analysis, the residue was dissolved in 200 /zl of ethyl acetate containing 0.05 /zg of the internal standard, and a 1-/zl aliquot of the mixture was injected on column. For HPLC analysis, the residue was dissolved in 0.5 ml of the mobile phase (60 parts of 0.03 M phosphate buffer pH 5.5, 26 parts of methanol and 8 parts of acetonitrile) and a 50-/~1 aliquot of this solution was injected.
2.3. GC analysis
The GC chromatographic unit (Varian Model 3700) was equipped with a 63Ni electron-capture detector and a DB-17 fused-silica megabore column (J and W Scientific, Rancho Cordova, CA, USA), 30 cm x 0.53 mm I.D. with a film thickness of 0.1 /xm. The carrier and make-up gases were nitrogen with flow-rates of 5 and 25 ml/min, respectively. The temperatures of the injector, column and detector were 210°C, 245°C and 290°C, respectively. The electrometer at- tenuation was set at 16-64 and range at 12.
2.4. HPLC analysis
The HPLC system consisted of a Waters Model 6000A pump and a Model 480 absorbance detector set at a wavelength of 208 nm (Waters Associates, Millford, MA, USA). Separation was accomplished on a Waters /xBondapak C18 column (10 /zm, 30 x 0.46 cm I.D.). The ab- sorbance detector output was monitored with a 10-mV recorder and the detector sensitivity was set at 0.01 AUFS. The mobile phase [60 parts of 0.03 M phosphate buffer (pH 5.5), 26 parts of methanol and 8 parts of acetonitrile) was de- livered at 1.0 ml/min. All separations were carried out at ambient temperature.
2.5. Calculations
Peak-height ratio (for GC) or peak height (for HPLC), retention times and concentration were calculated by an HP-3357 Laboratory Automa- tion System (Hewlett-Packard, Palo Alto, CA, USA). Calculation of the concentrations of
H. Kim et al. / J. Chromatogr. B 655 (1994) 21-26 23
genaconazole was based on either the peak- height ratio of genaconazole to that of the internal standard or the peak height of genaconazole. The slopes, intercepts and corre- lation coefficients were determined by least square linear regression analysis using a weighing factor of 1/y.
3. Results
3.1. Se rum
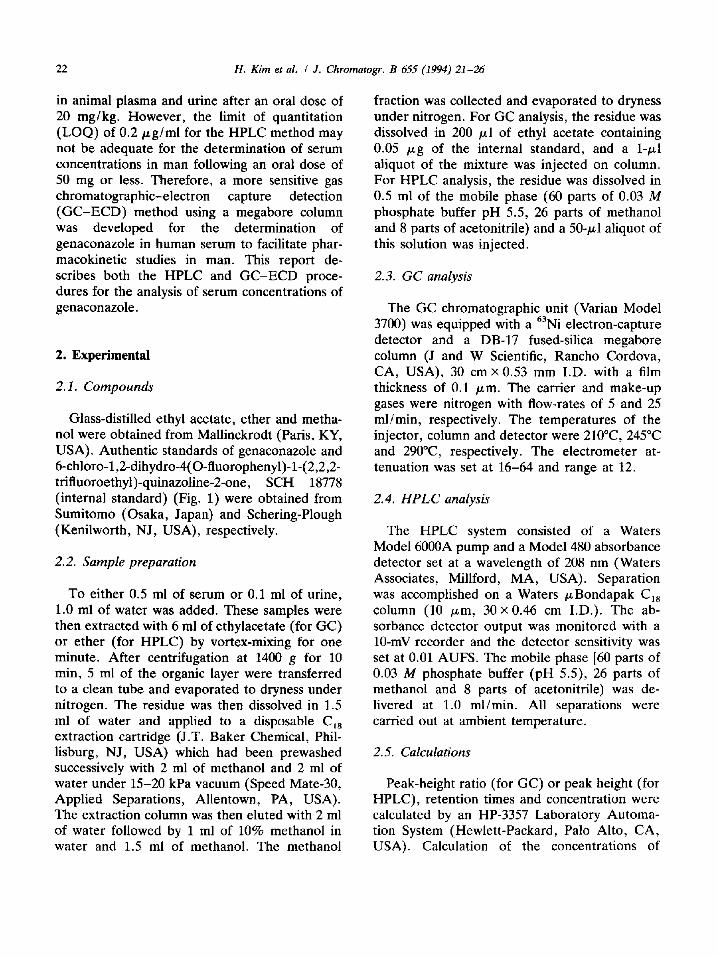
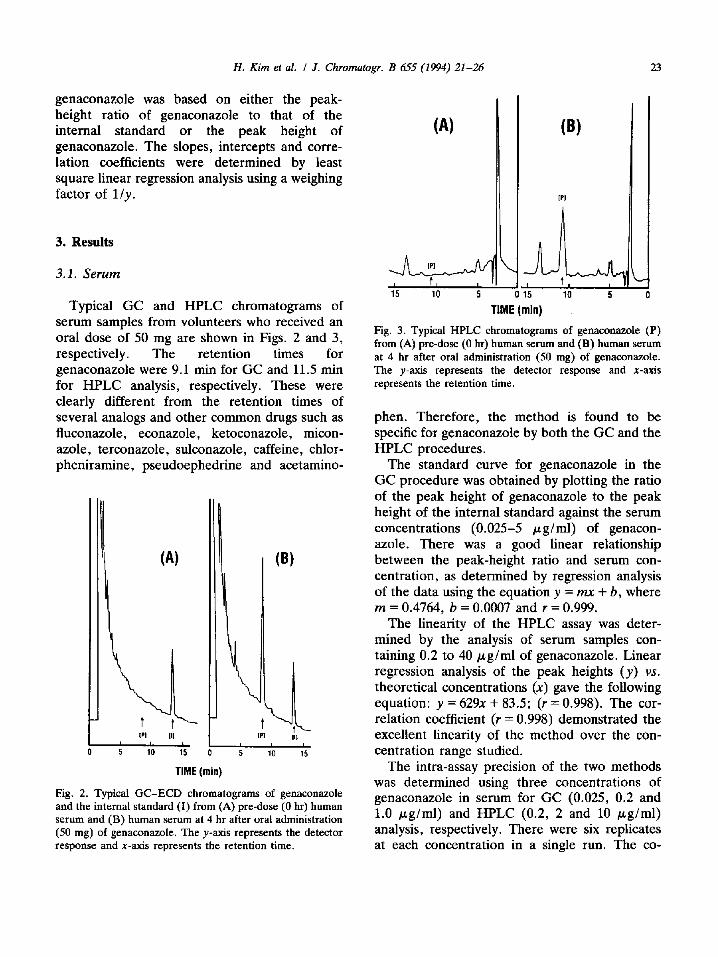
Typical GC and HPLC chromatograms of serum samples from volunteers who received an oral dose of 50 mg are shown in Figs. 2 and 3, respectively. The retention times for genaconazole were 9.1 min for GC and 11.5 min for HPLC analysis, respectively. These were clearly different from the retention times of several analogs and other common drugs such as fluconazole, econazole, ketoconazole, micon- azole, terconazole, sulconazole, caffeine, chlor- pheniramine, pseudoephedrine and acetamino-
IPI Ill I 5 leo ll5
(B)
[P] II1
TIME (min)
Fig. 2. Typical GC-ECD chromatograms of genaconazole and the internal standard (I) from (A) pre-dose (0 hr) human serum and (B) human serum at 4 hr after oral administration (50 rag) of genaconazole. The y-axis represents the detector response and x-axis represents the retention time.
(A)
I t '1 I
(B)
[PI
15 10 5 0 15 10 5 0
TIME (min) Fig. 3. Typical HPLC chromatograms of genaconazole (P) from (A) pre-dose (0 hr) human serum and (B) human serum at 4 hr after oral administration (50 mg) of genaconazole. The y-axis represents the detector response and x-axis represents the retention time.
phen. Therefore, the method is found to be specific for genaconazole by both the GC and the HPLC procedures.
The standard curve for genaconazole in the GC procedure was obtained by plotting the ratio of the peak height of genaconazole to the peak height of the internal standard against the serum concentrations (0.025-5 /zg/ml) of genacon- azole. There was a good linear relationship between the peak-height ratio and serum con- centration, as determined by regression analysis of the data using the equation y = m x + b, where m = 0.4764, b = 0.0007 and r = 0.999.
The linearity of the HPLC assay was deter- mined by the analysis of serum samples con- taining 0.2 to 40/xg/ml of genaconazole. Linear regression analysis of the peak heights (y) vs. theoretical concentrations (x) gave the following equation: y = 629x + 83.5; (r = 0.998). The cor- relation coefficient (r = 0.998) demonstrated the excellent linearity of the method over the con- centration range studied.
The intra-assay precision of the two methods was determined using three concentrations of genaconazole in serum for GC (0.025, 0.2 and 1.0 /zg/ml) and HPLC (0.2, 2 and 10 /zg/ml) analysis, respectively. There were six replicates at each concentration in a single run. The co-
24 H. Kim et al. / J. Chromatogr. B 655 (1994) 2 1 - 2 6
Table 1 Intra-assay precision of the GC and HPLC methods in human serum
Method Concentration Mean concentration (%) added found (n = 6) (/zg/ml) (/~g/ml)
GC
HPLC
0.025 0.0258 8.9 0.2 0.205 4.1 1.0 0.993 3.2
0.2 0.211 4.5 2.0 2.2 4.9
10.0 9.4 3.7
efficients of variation ranged from 3.2 to 8.9% for both procedures indicating that the two methods were accurate and reproducible (Table 1). The inter-assay precision of the two methods was established by repeated determinations ( n = 5 ) on five consecutive days (Table 2). The coefficient of variation for inter-assay pre- cision was 2.1% at 0.5 /.~g/ml for GC and 1.8% at 10 /zg/ml for HPLC analysis, respec- tively.
The limit of quantitation (LOQ) of the meth- od was 0.025 /zg/ml (C.V. = 8.9%) for GC and 0.2 /zg/ml (C.V. =4 .5%) for HPLC analysis, respectively.
3.2. Urine
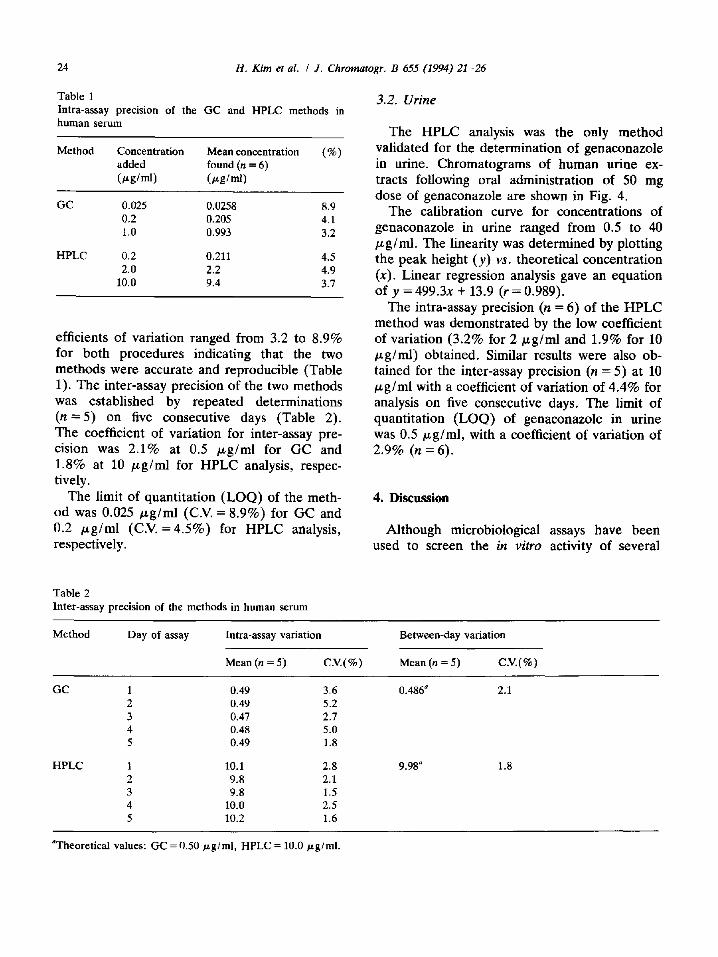
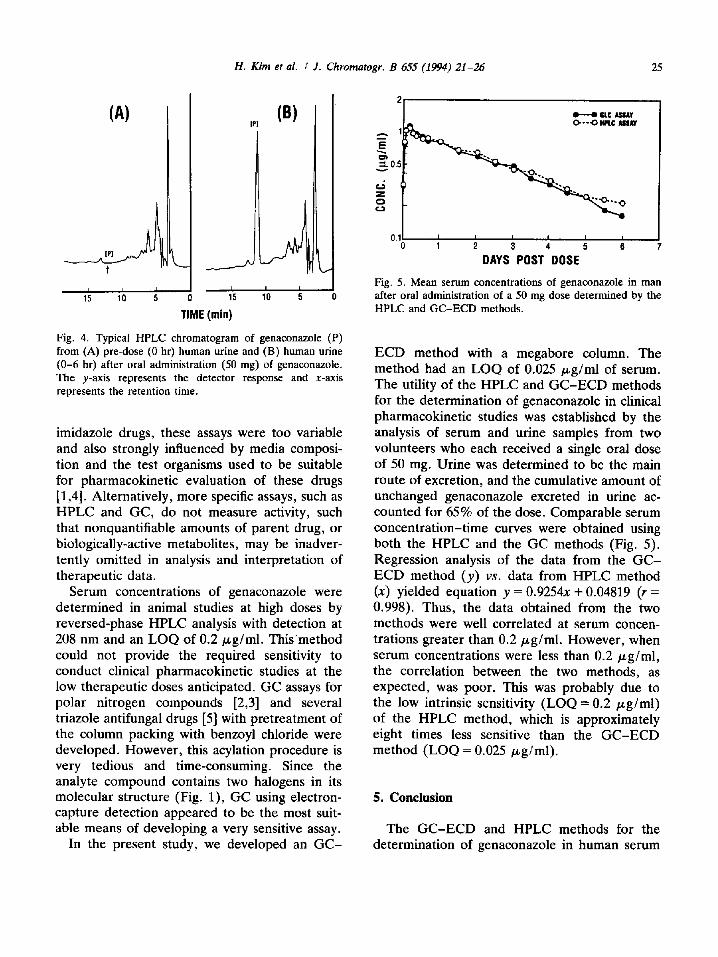
The HPLC analysis was the only method validated for the determination of genaconazole in urine. Chromatograms of human urine ex- tracts following oral administration of 50 mg dose of genaconazole are shown in Fig. 4.
The calibration curve for concentrations of genaconazole in urine ranged from 0.5 to 40 /zg/ml. The linearity was determined by plotting the peak height (y) vs. theoretical concentration (x). Linear regression analysis gave an equation of y = 499.3x + 13.9 (r = 0.989).
The intra-assay precision (n = 6) of the HPLC method was demonstrated by the low coefficient of variation (3.2% for 2/~g/ml and 1.9% for 10 ~g/ml) obtained. Similar results were also ob- tained for the inter-assay precision (n = 5) at 10 /zg/ml with a coefficient of variation of 4.4% for analysis on five consecutive days. The limit of quantitation (LOQ) of genaconazole in urine was 0.5/zg/ml, with a coefficient of variation of 2.9% (n = 6).
4. Discussion
Although microbiological assays have been used to screen the in vitro activity of several
Table 2 Inter-assay precision of the methods in human serum
Method Day of assay Intra-assay variation
Mean (n = 5) C.V.(%)
Between-day variation
Mean (n = 5) C.V.(%)
GC
HPLC
1 0.49 3.6 2 0.49 5.2 3 0.47 2.7 4 0.48 5.0 5 0.49 1.8
1 10.1 2.8 2 9.8 2.1 3 9.8 1.5 4 10.0 2.5 5 10.2 1.6
0.486 a 2.1
9.98" 1.8
aTheoretical values: GC = 0.50/zg/mi, HPLC = I0.0/~g/ml.
H. Kim et al. / J. Chromatogr. B 655 (1994) 21-26 25
(A)
't
I
IPI
I 0 15
TIME (mini
(B)
110 ,~
0.!
z O
0 .1
~ g ~gL4Y
I I I I 1 2 3 7
DAYS POST DOSE
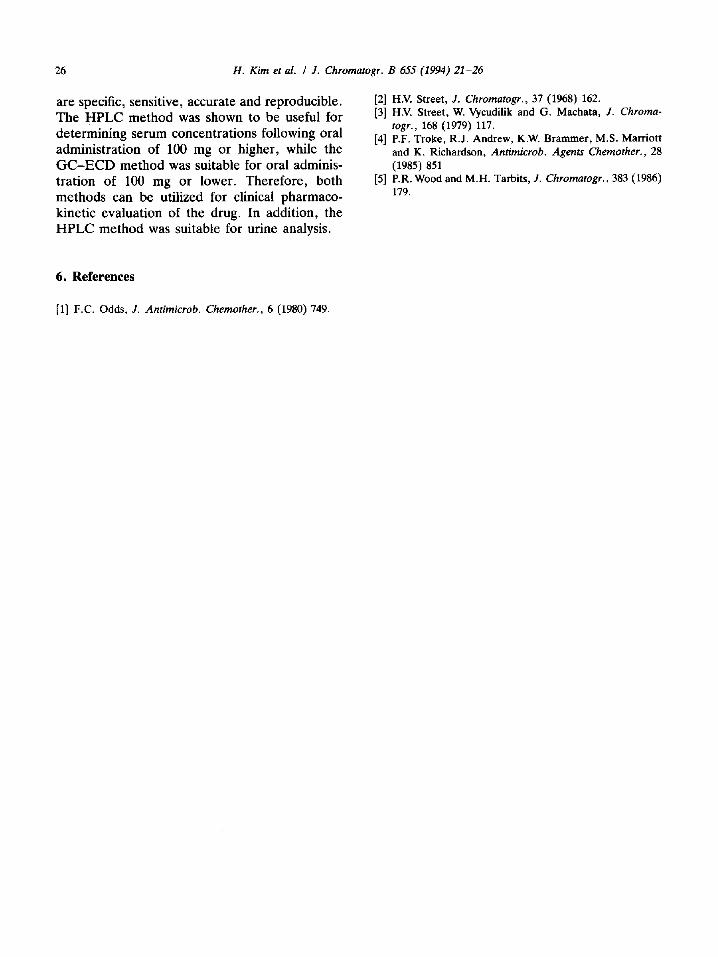
Fig. 5. Mean serum concentrations of genaconazole in man after oral administration of a 50 mg dose determined by the HPLC and GC-ECD methods.
Fig. 4. Typical HPLC chromatogram of genaconazole (P) from (A) pre-dose (0 hr) human urine and (B) human urine (0-6 hr) after oral administration (50 mg) of genaconazole. The y-axis represents the detector response and x-axis represents the retention time.
imidazole drugs, these assays were too variable and also strongly influenced by media composi- tion and the test organisms used to be suitable for pharmacokinetic evaluation of these drugs [1,4]. Alternatively, more specific assays, such as H P L C and GC, do not measure activity, such that nonquantifiable amounts of parent drug, or biologically-active metabolites, may be inadver- tently omitted in analysis and interpretation of therapeutic data.
Serum concentrations of genaconazole were determined in animal studies at high doses by reversed-phase HPLC analysis with detection at 208 nm and an LOQ of 0 .2 /zg /ml . This 'method could not provide the required sensitivity to conduct clinical pharmacokinetic studies at the low therapeutic doses anticipated. GC assays for polar nitrogen compounds [2,3] and several triazole antifungal drugs [5] with pretreatment of the column packing with benzoyl chloride were developed. However , this acylation procedure is very tedious and time-consuming. Since the analyte compound contains two halogens in its molecular structure (Fig. 1), GC using electron- capture detection appeared to be the most suit- able means of developing a very sensitive assay.
In the present study, we developed an G C -
ECD method with a megabore column. The method had an LO Q of 0.025 /zg/ml of serum. The utility of the H P LC and G C - E C D methods for the determination of genaconazole in clinical pharmacokinetic studies was established by the analysis of serum and urine samples from two volunteers who each received a single oral dose of 50 mg. Urine was determined to be the main route of excretion, and the cumulative amount of unchanged genaconazole excreted in urine ac- counted for 65% of the dose. Comparable serum concentra t ion- t ime curves were obtained using both the HPLC and the GC methods (Fig. 5). Regression analysis of the data from the G C - ECD method (y) vs. data from HPLC method (x) yielded equation y = 0.9254x + 0.04819 (r = 0.998). Thus, the data obtained from the two methods were well correlated at serum concen- trations greater than 0.2/~g/ml. However, when serum concentrations were less than 0 .2 /xg /ml , the correlation between the two methods, as expected, was poor. This was probably due to the low intrinsic sensitivity (LOQ = 0.2 p.g/ml) of the HPLC method, which is approximately eight times less sensitive than the G C - E C D method (LO Q = 0 .025/zg/ml) .
5. Conclusion
The G C - E C D and HPLC methods for the determination of genaconazole in human serum
26 H. Kim et al. / J. Chromatogr. B 655 (1994) 21-26
are specific, sensitive, accurate and reproducible. The H P L C method was shown to be useful for determining serum concentrations following oral administrat ion of 100 mg or higher, while the G C - E C D method was suitable for oral adminis- tration of 100 mg or lower. Therefore , both methods can be utilized for clinical pharmaco- kinetic evaluation of the drug. In addition, the H P L C method was suitable for urine analysis.
[2] H.V. Street, J. Chromatogr., 37 (1968) 162. [3] H.V. Street, W. Vycudilik and G. Machata, J. Chroma-
togr., 168 (1979) 117. [4] P.F. Troke, R.J. Andrew, K.W. Brammer, M.S. Marriott
and K. Richardson, Antimicrob. Agents Chemother., 28 (1985) 851
[5] ER. Wood and M.H. Tarbits, J. Chromatogr., 383 (1986) 179.
6. References
[1] F.C. Odds, J. Antimicrob. Chemother., 6 (1980) 749.