Embed Size (px)
Citation preview

GAS BARRIER AND SEPARATION BEHAVIOR OF
LAYER-BY-LAYER ASSEMBLIES
A Dissertation
by
PING TZENG
Submitted to the Office of Graduate and Professional Studies of Texas A&M University
in partial fulfillment of the requirements for the degree of
DOCTOR OF PHILOSOPHY
Chair of Committee, Jaime C. Grunlan Committee Members, David Bergbreiter Jodie Lutkenhaus Victor Ugaz Head of Department, M. Nazmul Karim
May 2015
Major Subject: Chemical Engineering
Copyright 2015 Ping Tzeng

ii
ABSTRACT
Thin films with the ability to control gas permeability are crucial to packaging
and purification applications. The addition of impermeable nanoparticles into neat
polymers improves barrier/separation properties by creating a tortuous pathway, but
particle aggregation occurring at high filler loading can reduce transparency of these
composites as well as barrier/separation improvement. Layer-by-layer (LbL) assembly
allows full control of morphology at the nanoscale, so barrier/separation properties can
be precisely controlled and the films remain flexible and transparent.
A three component recipe, consisting of polyvinylamine, poly(acrylic acid) and
montmorillonite clay was deposited as repeating PVAm/PAA/PVAm/MMT quadlayers
(QL) via LbL assembly. By adjusting solution pH and varying the placement of
polycation layers, polymer interdiffusion and clay concentration were controlled, as well
as oxygen barrier.
Another QL assembly, with a PEI/PAA/PEI/MMT repeating sequence, was
deposited using LbL to create light gas barrier films. Transmission electron microscope
images revealed a highly-oriented nanobrick wall structure. A 5 QL coating on 51 µm
polystyrene (PS) is shown to lower both hydrogen and helium permeability three orders
of magnitude relative to bare PS, demonstrating better performance than ethylene vinyl-
alcohol (EVOH) copolymer film and even metallized plastic.
Graphene oxide sheets, along with chitosan and PAA were used in a
CH/PAA/CH/GO QL assembly. pH deviation between CH and PAA ionizes the counter

iii
ion, creating a more interdiffused polymer matrix and resulting in higher GO loading.
Thermal reduction of GO, provides improvement in barrier performance under humid
conditions and better H2/CO2 separation behavior.
Finally, a PEI/PAA multilayer membrane exceeding that of the current state-of-
the-art gas separation membranes was performed. This ionically crosslinked assembly
exhibits H2/N2 and H2/CO2 selectivities beyond Robeson’s upper-bound limit, which are
superior to the properties of most organic, inorganic or mixed-matrix membranes
reported in the open literature, making it a significant advance in polymeric membranes
for gas separation.
In conclusion, barrier and separation behavior were improved via either a
polymer-polymer or polymer-nanoplatelet assembly. Several treatments, including
interdiffusion or thermal reduction proved to enhance film performance. Future works
focus on applying LbL techniques in Bragg reflectors and CO2/N2 separation.

iv
DEDICATION
I dedicate this dissertation to my dearest parents and grandparents. Thank you for
keeping me happy and motivated throughout my entire life.

v
ACKNOWLEDGEMENTS
I would like to thank my committee chair, Dr. Jaime Grunlan, who gives me
such a great opportunity to work on gas barrier and separation projects, which furnished
my research life with continuous excitement and challenges these past few years. Thanks
also go to my committee members, Dr. David Bergbreiter, Dr. Jodie Lutkenhaus, and Dr.
Victor Ugaz, for their guidance throughout the course of this research.
Thanks also go to my colleagues in the Polymer Nanocomposite laboratory.
Former graduate students Morgan Priolo, You-Hao Yang, Amanda Cain and the rest of
the current PNC group members for giving me great help and support in both work and
life. Most importantly, I would like to acknowledge four of my talented undergraduate
students (Cale Maupin, Travis Wilson, Garret Mai and Ian Devlaming). Without their
contributions I could not finish my degree in such an efficient and successful manner. I
am also grateful for the opportunity to collaborate with Dr. Benjamin Wilhite’s group,
including Dr. Daejin Kim, Elva L. Lugo, Xiaohong Cui and Stuart Powell.
Finally, I want to give my greatest appreciation to my family and friends who
support me with endless love and encouragement, especially my roommate Chao-Cheng
Shiau who I spent most of my time with. I would also like to thank my friends Yan-Ru
Lin and Min-Chi Hsieh, for supporting me through my ups and downs, may dear Emily
grow up as a kind and honest soul like you two. Without all the people mentioned above,
I would not be able to finish this journey in pursuit of the Ph.D. degree.

vi
NOMENCLATURE
AFM Atomic Force Microscopy
AlyOz Aluminum Oxide
ARS Angle Resolved Spectrophotometry
ASTM American Society for Testing and Materials
BAHF Fluoroisopropylidene Dianiline
BL Bilayer
BTDA Benzophenonetetracarboxylic Dianhydride
CH Chitosan
CMS Carbon Molecular Sieves
CNCs Cellulose Nanocrystals
DOI Degree of Ionization
EVOH Ethylene vinyl alcohol
FDA Fluoroisopropylidene Diphthalic Anhydride
FTIR Fourier Transform Infrared Spectroscopy
GO Graphene Oxide
LB Langmuir-Blodgett
LbL Layer-by-Layer
MMM Mixed Matrix Membrane
MMT Montmorillonite
MOFs Metal Organic Framworks

vii
MRT Magnetic Resonance Imaging
OPP Oriented Polypropylene
OTR Oxygen Transmission Rate
PAA Poly(acrylic acid)
PAH Poly(allylamine hydrochloride)
PAm Polyacrylamide
PBI Polybenzimidazole
PC/pNA Polycarbonate/p-nitroaniline
PDA Phenylenediamine
PDDA Poly(dimethyldiallylammonium chloride)
PDMS Polydimethylsiloxane
PE Polyethylene
PECVD Plasma-Enhanced Chemical Vapor Deposition
PEG Polyethyleneglycol
PEI Branched Polyethylenimine
PEN Polyethylene Naphthenate
PEO Poly(ethylene oxide)
PET Poly(ethylene terephthalate)
PI Polyimide
PIM Polymer of Intrinsic Microporosity
PLA Poly(lactic acid)
PMAA Poly(methacrylic acid)

viii
PMP Poly(4-methyl-1-pentene)
PP Polypropylene
PS Polystyrene
PSS Poly(styrene sulfate)
PTMSP Poly(1-trimethylsilyl-1-propyne)
PVAm Polyvinylamine
PVC Polyvinylchloride
PVD Physical Vapor Deposition
PVDC Polyvinylidene Chloride
QCM Quartz Crystal Microbalance
QL Quadlayer
RI Refractive Index
Room Temperature RT
SEM Scanning Electron Microscopy
SiOX Silicon Oxide
SiO2 Colloidal Silica
SPM Scanning Probe Microscopy
TEM Transmission Electron Microscopy
Tg Glass Transition Temperature
VMT Vermiculite
WPO World Packaging Organization
WVTR Water Vapor Transmission Rate

ix
TABLE OF CONTENTS
Page
ABSTRACT ...................................................................................................................... ii
DEDICATION ..................................................................................................................iv
ACKNOWLEDGEMENTS ............................................................................................... v
NOMENCLATURE ..........................................................................................................vi
TABLE OF CONTENTS ..................................................................................................ix
LIST OF FIGURES ......................................................................................................... xii
LIST OF TABLES ..........................................................................................................xvi
CHAPTER I INTRODUCTION ........................................................................................ 1
1.1 Background ............................................................................................................... 1 1.2 Objectives and Dissertation Outline ......................................................................... 4
CHAPTER II LITERATURE REVIEW ............................................................................ 8
2.1 Gas Diffusion Theory ............................................................................................... 8
2.1.1 Gas Transport through Polymer ......................................................................... 9 2.1.2 Transport in Nanocomposites .......................................................................... 13 2.1.3 Limitations of Gas Separation Using Polymer Membranes............................. 18
2.2 Gas Barrier/Separation Films ................................................................................. 20 2.2.1 Polymers .......................................................................................................... 21 2.2.2 Inorganic Films ................................................................................................ 22 2.2.3 Mixed Matrix Membranes ............................................................................... 24
2.3 Layer-by-Layer Assembly ...................................................................................... 26 2.3.1 Gas Barrier Behavior of Multilayer Thin Films .............................................. 27 2.3.2 Gas Separation Behavior of Multilayer Thin Films ......................................... 29
CHAPTER III INFLUENCE OF POLYMER INTERDIFFUSION AND CLAY CONCENTRATION ON GAS BARRIER OF POLYELECTROLYTE/CLAY NANOBRICK WALL QUADLAYER ASSEMBLIES ................................................ 32
3.1 Introduction ............................................................................................................ 32 3.2 Experimental ........................................................................................................... 33
3.2.1. Materials ......................................................................................................... 33

x
3.2.2. Substrates ........................................................................................................ 34 3.2.3. Layer-by-Layer Deposition ............................................................................. 35 3.2.4.Thin Film Characterization .............................................................................. 36
3.3 Results and Discussion ........................................................................................... 37 3.3.1. Multilayer Film Growth .................................................................................. 37 3.3.2. Nanobrick Wall Thin Film Structure .............................................................. 42 3.3.3. Oxygen Barrier of Quadlayer Assemblies ...................................................... 46
3.4 Conclusions ............................................................................................................ 52 CHAPTER IV SUPER HYDROGEN AND HELIUM BARRIER WITH POLYELECTROLYTE NANOBRICK WALL THIN FILM ......................................... 53
4.1 Introduction ............................................................................................................ 53 4.2 Experimental ........................................................................................................... 57
4.2.1. Materials ......................................................................................................... 57 4.2.2. Layer-by-Layer Deposition ............................................................................. 57 4.2.3. Thin Film Characterization ............................................................................. 58 4.2.4. Gas Permeation System .................................................................................. 58
4.3 Results and Discussion ........................................................................................... 60 4.3.1. Multilayer Film Growth .................................................................................. 60 4.3.2. Nanobrick Wall Thin Film Structure .............................................................. 61 4.3.3. Gas Barrier of Quadlayer Assemblies ............................................................. 62
4.4 Conclusions ............................................................................................................ 63 CHAPTER V IMPROVED GAS BARRIER/SEPARATION OF GRAPHENE OXIDE-BASED MULTILAYER THIN FILMS ............................................................. 65
5.1 Introduction ............................................................................................................ 65 5.2 Experimental ........................................................................................................... 67
5.2.1. Materials ......................................................................................................... 67 5.2.2. Substrates ........................................................................................................ 67 5.2.3. Layer-by-Layer Deposition ............................................................................. 68 5.2.4. Thin Film Characterization ............................................................................. 69
5.3 Results and Discussion ........................................................................................... 70 5.3.1. Film Growth .................................................................................................... 70 5.3.2. Film Morphology ............................................................................................ 74 5.3.3. Gas Barrier and Separation ............................................................................. 78
5.4 Conclusions ............................................................................................................ 82 CHAPTER VI HIGHLY SIZE-SELECTIVE IONICALLY CROSSLINKED MULTILAYER POLYMER FILMS FOR LIGHT GAS SEPARATION ...................... 84
6.1 Introduction ............................................................................................................ 84 6.2 Experimental ........................................................................................................... 86
xi
6.2.1. Materials ......................................................................................................... 86 6.2.2. Substrates ........................................................................................................ 87 6.2.3. Layer-by-Layer Deposition ............................................................................. 88 6.2.4. Thin Film Characterization ............................................................................. 88
6.3 Results and Discussion ........................................................................................... 90 6.3.1. Multilayer Film Growth and Structure ........................................................... 90 6.3.2. Gas Separation Behavior ................................................................................. 92 6.3.3. Mechanical Strength of Multilayer Film ......................................................... 97
6.4 Conclusions ............................................................................................................ 99 CHAPTER VII CONCLUSIONS AND FUTURE WORK ........................................... 100
7.1 Multilayer Gas Barrier/Separation Assemblies .................................................... 100
7.1.1 Influence of Interdiffusion and Clay Concentration on Gas Barrier .............. 100 7.1.2 Super Hydrogen and Helium Barrier with Polyelectolyte Nanobrick Wall Thin Film ................................................................................................................ 101 7.1.3 Improved Gas Barrier/Separation of Graphene Oxide Based Multilayer Thin Films ............................................................................................................... 102 7.1.4 Highly Size-Selective Multilayer Polymer Films for Light Gas Separation . 102
7.2 Future Research Plans .......................................................................................... 103 7.2.1 Solution-Selective Multilayer Polymer Films for CO2/N2 Separation .......... 103 7.2.2 Multilayer Structural Color Films .................................................................. 105
REFERENCES ............................................................................................................... 110

xii
LIST OF FIGURES
Page
Figure 1.1. Schematic of the layer-by-layer deposition process. ....................................... 3
Figure 2.1. Mechanisms for permeation of gases through porous and dense separation membranes..................................................................................... 9
Figure 2.2. Schematic presentation of gas permeation steps across polymer
membranes according to the solution-diffusion mechanism. ....................... 11 Figure 2.3. Montmorillonite clay chemistry and structure. .............................................. 14
Figure 2.4. Schematics of the three different clay-filled composite morphologies. ........ 15
Figure 2.5. Schematic of gas transport through a polymer-platelet composite via a tortuous path. ................................................................................................ 17
Figure 2.6. Geometries of regular and random arrays for platelet-filled polymer
composites. ................................................................................................... 18 Figure 2.7. Upper-bound line of CO2 permeability and CO2/CH4 permselectivity. ........ 19
Figure 2.8. Permeance as a function of temperature for H2 and CO2 permeating through PBI membranes. .............................................................................. 22
Figure 2.9. TEM images of Polylactide/ Montmorillonite (MMT) nanocomposite
film. ............................................................................................................... 25
Figure 2.10. (a) Schematic of layer-by-layer assembly. (b) cross-sectional illustration of the nanobrickwall stricture. ................................................. 27
Figure 2.11. Thickness of PEI/MMT as a function of bilayers deposited while
varying pH of PEI. (b) Thickness as a function of clay layers deposited with varying numbers of poly(allyl amine) (PAAm)/poly(acrylic acid) (PAA) bilayers [γ] between clay depositions. .............................................. 29
Figure 2.12. Thermal imidization of PAH/poly(amic acid) assembly on a porous
alumina support............................................................................................. 31 Figure 2.13. Robeson plot for a MCM-22/silica membrane (membrane A3B3),
placed in context with other membranes for H2/N2 separation. .................. 31

xiii
Figure 3.1. (a) Schematic of the quadlayer assembly process. (b) Polyelectrolytes
and clay used in the quadlayer assemblies and a cross-sectional illustration of the resultant nanobrick wall thin film. MMT structure: (▲)Al3+, Mg2+, Fe3+/2+; (○) O2-; (☉) OH-; (●)Si4+. ................................... 36
Figure 3.2. Film thickness as a function of quadlayers deposited with three recipes:
(PEI10/PAA4/ PEI10/MMT)x, (PVAm10/PAA4/PVAm10/MMT)x and (PEI10/PAA4/PVAm10/MMT)1- (PVAm10/PAA4/PVAm10/MMT)x-1. .......... 39
Figure 3.3. Mass as a function of quadlayers deposited with three recipes:
(PEI10/PAA4/PEI10/MMT)x (half-filled dots), (PVAm10/PAA4/PVAm10/MMT)x (filled dots) and (PEI10/PAA4/PVAm10/MMT)1- (PVAm10/PAA4/PVAm10/MMT)x-1 (hollowed dots). Rectangular and circular dots indicate the accumulated mass measured from the beginning to the specific polymer or clay layer, respectively. .............................................................. 39
Figure 3.4. FTIR spectra of 5QL (a) PEI10/PAA4/PEI10/MMT and (b)
PVAm10/PAA4/PVAm10/MMT at different polycation pH, and a combination of (c) both assemblies at polycation pH 10. ............................. 42
Figure 3.5. TEM cross sectional images of (a) (PVAm10/PAA4/PVAm10/MMT)5
and (b) (PEI10/PAA4/PEI10/MMT)5, deposited on PET substrate. AFM height images of (c) (PVAm10/PAA4/PVAm10/MMT)5 and (d) (PEI10/PAA4/PEI10/MMT)5 films. ................................................................. 44
Figure 3.6. (a) Visible light transmission as a function of wavelength for PVAm-
based QL on fused quartz slides. (b) Image of (PVAm10/PAA4/PVAm10/MMT)x thin films deposited on 179μm PET. ..... 45
Figure 3.7. (a) Oxygen transmission rate and oxygen permeability as a function of
PVAm-based quadlayers deposited on 179μm PET. (b) Oxygen transmission rate as a function of quadlayer recipe and number deposited on 179μm PET. ............................................................................. 47
Figure 4.1. (a) Schematic of the quadlayer assembly process. (b) Materials used
and cross-sectional illustration of the thin film structure. (c) Film growth as a function of quadlayers deposited. (d) Mass as a function of quadlayers deposited. ............................................................................... 56
Figure 4.2. TEM cross-sectional images of (a) 5 and (b) (c) 10 PEI/PAA/PEI/MMT
QL. (b) is the portion of the film closest to the PS substrate, while (c) is furthest away. The white scale bar in each figure represents 50 nm……….61

xiv
Figure 4.3. Permeability of (a) hydrogen and (b) helium as a function of quadlayers deposited on a 51 μm polystyrene substrate. .............................. 63
Figure 5.1. Illustration of (a) LbL process (b) materials used and (c) nanobrick wall
structure built from chitosan/poly(acrylic acid)/chitosan/graphene oxide quadlayers. .................................................................................................... 69
Figure 5.2. Thickness of CH/PAA/CH/GO as a function of quadlayers deposited
with varying (a) pH of CH and (b) pH of PAA. (c) Film growth of CH5.5/PAA3/CH5.5/GO compared with TEM cross-section of 5QL film. (d) Electron signal profile scanned through the white dotted section in (c). Valley points indicate position of GO layers. ........................................ 71
Figure 5.3. Mass as a function of quadlayers deposited: (a) CH3.5/PAA3/CH3.5/GO
(b) CH4.5/PAA3/CH4.5/GO (c) CH5.5/PAA3/CH5.5/GO (d) CH5.5/PAA4/CH5.5/GO and (e) CH5.5/PAA5/CH5.5/GO. Concentration of GO (5 QL) is listed as well. .................................................................... 72
Figure 5.4. SEM surface images of one quadlayer of (a) CH3.5/PAA3/CH3.5/GO
(b) CH4.5/PAA3/CH4.5/GO (c) CH5.5/PAA3/CH5.5/GO (d) CH5.5/PAA4/CH5.5/GO and (e) CH5.5/PAA5/CH5.5/GO. ................................ 75
Figure 5.5. FTIR spectra of (a) (CH3.5/PAA3)100 (b) (CH4.5/PAA3)100 (c)
(CH5.5/PAA3)100 (d) (CH5.5/PAA4)100 and (e) (CH5.5/PAA5)100..................... 77 Figure 5.6. C1s XPS spectra of (a) graphene oxide and (b) thermally reduced
graphene oxide. ............................................................................................. 80 Figure 5.7. (a) Oxygen transmission rate of (CH5.5/PAA3/CH5.5/GO)5 on PET,
under 0% and 100% RH. (b) Hydrogen and (c) carbon dioxide transmission rate of (CH5.5/PAA3/CH5.5/GO)5 on PET under 0% RH.......... 80
Figure 5.8. H2/CO2 selectivity of 5QL CH5.5/PAA3/CH5.5/GO in relation to the best
polymer and mixed matrix membranes (MMM), including carbon molecular sieves (CMS). Robeson’s upper bound for H2/CO2 separation is included to compare performance of membranes. ................... 82
Figure 6.1. Schematic of PEI/PAA layer-by-layer gas separation membrane
supported on an alumina-coated porous stainless steel tube......................... 90 Figure 6.2. Schematic of the tube-and-shell assembly set-up for gas permeation. .......... 90 Figure 6.3. The film growth curve of the PEI/PAA films. ............................................... 91

xv
Figure 6.4. Picture of (a) a PEI/PAA-alumina-PSS tube, optical microscopic surface images (x50) of (b) a untreated PSS tube, (c) an alumina layer, (d) a PEI/PAA film, and (e) a SEM cross-section image (x1,000) of a PEI/PAA-alumina-PSS tube. ........................................................................ 92
Figure 6.5. (a) Gas permeation through the alumina-coated PSS tube (blank square:
bare PSS tube without alumina coating) and (b) H2 flux through PEI/PAA membranes of 10, 20, and 30 bilayers. ......................................... 94
Figure 6.6. Robeson’s upper bound plots ((a) H2/N2, (b) H2/CO2) of 10, 20, and 30
bilayer PEI/PAA polymer films and various other polymer and inorganic (or mixed matrix) membranes (the full term for each abbreviation listed here is presented in the Nomenclature). ........................ 96
Figure 6.7. (a) Average elastic modulus and (b) hardness of 10 bilayer PEI/PAA
films under different environmental conditions (error bars represent standard deviation), and (c) FTIR spectra of 10 bilayer PEI/PAA film. ...... 98
Figure 7.1. (a) PEO2/PMAA2 and PEO3/PMAA3 thickness as a function of number
of BL deposited. (b) CO2/N2 separation performance of LbL (hollowed) and LbL-coated PS (filled) on Robeson plot. ........................... 105
Figure 7.2. (a) Schematic of Bragg stack LbL assembly process. Thickness and
refractive index of (b) PEI/VMT and (c) SiO2/CNCs as a function of bilayers deposited. Error bars are standard deviations from the mean. ...... 107
Figure 7.3. (a) TEM cross-section image of the elytra of a Chrysochroa rajah
beetle. (b) SEM cross-section image of the (AB)24A film. TEM cross -section images of the (c) entire (AB)6A film and (d) a single A layer. Scale bars in all images represent 100 nm. ................................................. 108
Figure 7.4. Reflection intensity of (a) (AB)6A film and (b) cuticle of Crysochroa
rajah as function of wavelength and incident angle. ................................... 109

xvi
LIST OF TABLES
Page
Table 2.1 Oxygen transmission rates of bare and SiOx-coated polymer substrates. ....... 24
Table 3.1. Oxygen transmission rate, film thickness, and clay concentration of quadlayer thin film deposited on 179 µm PET. ............................................. 48
Table 3.2. Oxygen permeability data of PVAm quadlayers and aspect ratio
prediction. ....................................................................................................... 51 Table 4.1. Permeability, film thickness, and clay concentration of quadlayer
assemblies deposited on 51 μm polystyrene. ................................................. 63 Table 5.1. Oxygen transmission rate and permeability of five quadlayer assemblies
on 179 µm PET film. ...................................................................................... 78
1
CHAPTER I
INTRODUCTION
1.1 Background
Polymer membranes are used in various technological areas such as water
filtration,[1-3] fuel cells,[4-6] antireflection coatings,[7-9] optoelectronic devices,[10-12] tissue
repair,[13-15] food packaging[16-18] and gas separation.[19-21] One of the most important
properties of these membranes is the ability to control gas permeation rate, with the
driving force being pressure or concentration. While conventional gas separation
techniques (e.g., cryogenic distillation or an adsorption process) involve tremendous
energy consumption, membrane gas separation does not require a phase change, making
it more energy efficient.[22, 23] Membranes also allow gas separation to be performed in
remote locations due to the absence of moving parts.[22] This growing technological area
is competitive because of its simplicity, low energy cost, portability, reliability and space
efficiency, which is why the market for membranes is expected to quintuple from 2000
to 2020.[23]
While separation membrane is able to permeate gases selectively, barrier films
are designed to block a specific penetrant. Packaging materials made with various
barriers play a significant role in modern society. Food, beverages, cosmetics,
pharmaceuticals and electronics all require good gas and moisture protection.[16, 24]
According to the World Packaging Organization (WPO), global packaging sales

2
increased from 372.4 to 563.9 billion dollars from 1999 to 2009.[25] Plastic packaging
materials such as polyethylene (PE), polypropylene (PP), polyvinylchloride (PVC) and
polyethylene terephthalate (PET) are extensively used for making containers, lids,
pouches, and films due to their barrier properties, mechanical flexibility and price.[26, 27]
Of all the membrane materials (polymer, inorganic and mixed matrix), mixed
matrix composite membranes combine material types to fine-tune the properties, along
with controlling the morphology of the membrane.[22, 28, 29] Despite the commonly used
thin film preparation techniques such as plasma enhanced chemical vapor deposition
(PECVD)[30, 31] or solvent casting,[32, 33] layer-by-layer assembly (LbL) continues to grow
in popularity (since the 1990s)[34] due to its simplicity and versatility. By alternately
exposing a substrate to oppositely-charged polyelectrolyte solutions, electrostatic
attractions between the charged ingredients result in the buildup of anion/cation bilayers
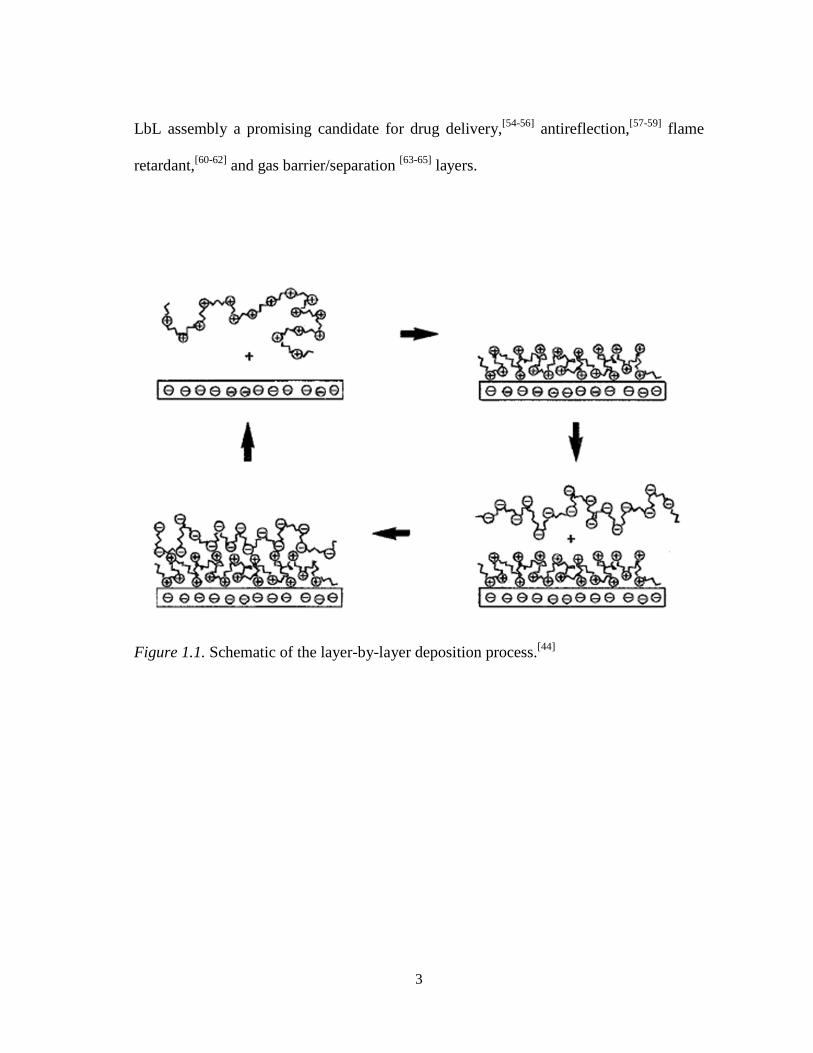
(BL), as shown in Figure 1.1. Film thickness and other properties can be easily
controlled by increasing the number of deposition cycles, and although rinsing and
drying steps are often used between deposition steps, they are optional. To produce
functional polymeric thin films with unique structures and properties, one can achieve
these goals through adjusting concentration,[35, 36] pH/ionic strength,[37-39] temperature,[38,
40] molecular weight[41, 42] and deposition time[35, 43, 44] of the aqueous deposition mixtures.
In addition to electrostatic attraction,[45] hydrogen bonding[46] and covalent bonding[47]
can also be used in a layer-by-layer fashion. The LbL technique has also been
demonstrated for integrating multiple polymers,[44, 48] incorporating nanoparticles,[49, 50]
inorganic clays,[51, 52] and biological molecules.[45, 53] All the advantages mentioned make
3
LbL assembly a promising candidate for drug delivery,[54-56] antireflection,[57-59] flame
retardant,[60-62] and gas barrier/separation [63-65] layers.
Figure 1.1. Schematic of the layer-by-layer deposition process.[44]

4
1.2 Objectives and Dissertation Outline
The objective of this dissertation is to understand how layer-by-layer systems
(all-polymer and polymer-nanoplatelet) perform as either gas barrier or gas separation
films. By creating more interactions in the thin film and increasing the distance of the
molecular diffusion path, diffusivity of gas through the multilayer assemblies is
effectively suppressed (while solubility remains unchanged), which reduces gas
permeability. Thin film structure can also be fine-tuned to allow smaller gases to
permeate through, creating a gas separation film. In this dissertation, the capability of
improving gas barrier and separation properties via LbL coatings, with varying recipes
and processing parameters, is demonstrated. These all-polymer and polymer-
nanoplatelet assemblies create a highly impermeable/selective nanocoating that can be
used for packaging (e.g., food and electronics) and gas purification.
Chapter II is a concise review of gas transport mechanisms, barrier/separation
technologies and layer-by-layer assembly. The first part elaborates gas transport in
polymer and nanocomposites, followed by the theoretical models used to describe these
transport phenomena. The second part of the chapter covers gas barrier and separation
films that have been studied, including polymer, inorganic and mixed matrix membranes.
The last part illustrates the basics of LbL assembly, with special emphasis on gas barrier
and separation behavior.
Chapter III describes the ability of LbL processing to tailor gas barrier of
polymer-clay thin films. A three component recipe, consisting of polyvinylamine
(PVAm), poly(acrylic acid) (PAA) and montmorillonite (MMT) clay was deposited as

5
repeating PVAm/PAA/PVAm/MMT quadlayers (QL). This QL assembly demonstrates
the influence of polymer interdiffusion and clay concentration on oxygen barrier
behavior. With the aid of ellipsometry and quartz crystal microbalance (QCM), it was
confirmed (by varying the placement of PVAm and polyethylenimine (PEI) layers) that
these QL assemblies can be switched from linear to exponential growth with greater clay
deposition in each layer. Atomic force (AFM) and transmission electron microscope
(TEM) images also revealed a high level of clay orientation. Oxygen transmission rate
(OTR) testing was performed on coated poly(ethylene terephthalate) (PET) to analyze
barrier behavior as a function of polymer interdiffusion and clay concentration.
Chapter IV is an extension of Chapter III and previous work done to investigate
the light gas barrier of PEI/PAA/PEI/MMT QL thin film.[66] Cross-sectional TEM
images were used to examine the nanobrick wall structure while increasing the number
of QLs deposited. TEM images and QCM confirmed the decrease of clay concentration
as the assembly grew thicker. Hydrogen and helium transmission rate testing was
performed on coated polystyrene (PS) to evaluate the influence of the number of QL
deposited on barrier properties.
Chapter V describes a chitosan (CH)/PAA/chitosan (CH)/graphene oxide (GO)
QL system. The influence of CH and PAA solution pH on growth, structure, polymer
interactions and barrier was investigated. Ellipsometry and QCM were used to measure
the growth and mass deposition as a function of QL deposited and polyelectrolyte pH,
and to calculate composition of GO in these assemblies. Scanning electron microscopy
(SEM) and cross-section TEM were used to examine film structure and coverage of GO

6
on top of polymer layer. Fourier transform infrared (FTIR) spectra confirmed the level
of CH/PAA interaction for each assembly. OTR of the coated PET assemblies were
measured under dry and humid condition with unmodified GO and thermally-reduced
GO. Hydrogen and carbon dioxide transmission rates were also measured to quantify the
separation behavior.
Chapter VI describes the exceptionally high hydrogen permselectivity and
remarkable elastic modulus in an ionically crosslinked, LbL-assembled PEI/PAA
membrane. These membranes perform beyond Robeson’s upper-bound limit, despite
being made of seemingly homogenous polymer. Nanoindentation was used to investigate
mechanical behavior of these films. Cross-sectional SEM images were taken to confirm
the uniformity over the substrate. Gas permeation testing allowed for comparison of
PEI/PAA with other polymer and mixed matrix membranes.
Chapter VII is conclusions for this work and future research directions. This
dissertation investigated the influence of polymer interdiffusion, nanoplatelet
concentration and types of nanoplatelet on gas barrier and separation behavior.
Tremendous properties were demonstrated, but these multilayer assemblies are currently
unable to separate gas pairs with similar molecular sizes. In order to improve selectivity,
materials such as polyethylene oxide (PEO) are introduced into the assembly to increase
solubility of specific gas (i.e., carbon dioxide). By varying the deposition solution pH,
mechanical properties and PEO composition can be controlled, which alters permeability
of different gas pairs and selectivity. The second work describes the use of LbL
assembly to reproduce uniform and crack-free Bragg reflecting surfaces. The refractive

7
index (RI) of each layer was designed by combining two materials in each layer.
Thickness of each layer was then controlled by altering the number of BL in each layer.
The high RI layer consisted of cationic PEI and anionic vermiculate clay (VMT),
forming a dense layer. The low RI layer contained cationic colloidal silica (SiO2) and
anionic cellulose nanocrystals (CNCs). Due to the entirely different shape of SiO2 and
CNCs, a porous layer with low RI is created. Cross-sectional TEM images show well-
defined high and low RI layers, which were found to have iridescent properties after six
deposition cycles (containing hundreds of individual layers).

8
CHAPTER II
LITERATURE REVIEW
2.1 Gas Diffusion Theory
In order to design a gas barrier or gas separation film, one needs to understand
gas transport phenomena through a polymer membrane. The first gas permeation
analysis is attributed to Mitchell.[67, 68] He observed that natural rubber balloons filled
with hydrogen gas deflated over time and reasoned this was due to diffusion of gas
through the balloon wall. In 1866, Graham measured the permeation rate of all known
gases on every polymer membrane available.[69] His work led to Graham’s law of
diffusion:
𝑟 𝛼 1 √𝑀⁄ (2.1)
where gas permeation rate r is inversely proportional to the root of molecular weight M
of penetrant.
Two types of membranes are used to describe gas permeation: porous or dense.
Figure 2.1 illustrates how gases permeate through these membranes. For porous
membranes, the gas diffusion mechanism varies according to pore size.[70] If the pores
are relatively large (0.1 – 10 µm), gases permeate through the membrane by convective
flow and no separation occurs.[70] If the pore size is smaller than the mean free path of
the gas molecules (< 0.1 µm), then permeation is dominated by Knudsen diffusion.[70, 71]
In this case, penetrants follow the Graham’s law. When the membrane pore size is below

9
10 nm, gases are separated by molecular sieving.[70] Gas transportation through this type
of membrane is a combination of gas phase diffusion and surface diffusion.[72] Despite
the research interest in these porous membranes, high cost and complicated processing
limit their use, so most commercial gas separation membranes are the dense type. Layer-
by-layer assembly belongs to the dense category, and is the focus of this dissertation, so
porous membranes will not be further reviewed here.
Figure 2.1. Mechanisms for permeation of gases through porous and dense separation
membranes.[70]
2.1.1 Gas Transport through Polymer
Gas transport in nonporous dense polymer membranes is described by the
solution-diffusion model. This model can be divided into five steps as depicted in Figure

10
2.2, which includes diffusion through the boundary layer at the upstream side, relative
sorption of gases by the polymer membrane, diffusion of the gases inside the polymer
membrane, desorption of gases at the permeate side, and diffusion out of the boundary
layer of the downstream side.[73]
In 1866, Graham postulated basic expression representing the solution-diffusion
mechanism through a polymer membrane:[69]
P D S= × (2.2)
where the gas permeability (P) (cm3 cm cm-2 s-1 Pa-1) is the product of diffusivity (D)
(cm2 s-1) and solubility (S) (cm3(273.15K; 1.013 × 10⁵ Pa) cm-3 Pa-1). Diffusivity is a
kinetic factor that represents the ability of molecules to move through the polymer.[73]
Larger penetrants generally have lower diffusivity, which is also sensitive to polymer
chain flexibility and free volume in the polymer. Diffusivity can be defined by free
volume theory:[74]
𝐷 = 𝐴 𝑒𝑒𝑒(−𝐵𝐹
) (2.3)
where A and B are constants of the specific gas-polymer system and F represents the
fractional free volume:
𝐹 = 𝑉𝑡𝑡𝑡𝑡𝑡−𝑉𝑡𝑜𝑜𝑜𝑜𝑜𝑜𝑜𝑉𝑡𝑡𝑡𝑡𝑡
(2.4)
where Vtotal is the sum of the theoretical volume of polymer (Voccupied) and the free
volume in the system. Solubility, on the other hand, is a thermodynamic factor related to
gas condensability (characterized by gas critical temperature, boiling point, enthalpy of
vaporization, etc.) and gas-polymer interactions.[73] Solubility is related to local

11
concentration (C) of the gas at a given temperature and is expressed as a function of
pressure (p):
𝑆 = 𝐶 𝑒⁄ (2.5)
Larger penetrants are usually more condensable, resulting in higher local concentration
and solubility. Definition of selectivity (αA/B) is the gas permeability ratio of A to B. It
can be influenced by the differences in diffusivity or the differences in solubility:
𝛼𝐴/𝐵 = 𝑃𝐴𝑃𝐵
= �𝐷𝐴𝐷𝐵� �𝑆𝐴
𝑆𝐵� (2.6)
The competition between diffusivity and solubility is determined by whether the
polymer chains are at equilibrium, which will be explained in the next section.
Figure 2.2. Schematic presentation of gas permeation steps across polymer membranes
according to the solution-diffusion mechanism.[73]

12
2.1.1.1 Transport through a Rubbery Polymer
When gas molecules permeate through a polymer membrane, the interactions
between the penetrant and polymer change the physical state of the polymer. Both
diffusivity and solubility depend greatly on whether the polymer membrane is above or
below its glass transition temperature (Tg).[75] If the polymer is at equilibrium at room
temperature (RT) (Tg < RT), segments of polymer chains have sufficient thermal energy
to allow limited rotation. This motion changes its mechanical properties, and the
polymer is defined as rubber. Gas transport behavior in rubber can be sufficiently
explained using the solution-diffusion model, as long as it doesn’t contain crystalline
phase that acts as a barrier to the gas molecules.[26, 73] For rubbery polymers, the
solubility term is usually dominant over diffusivity, so gas permeability increases with
increasing penetrant size (without considering additional penetrant-polymer
interactions).[76-78]
2.1.1.2 Transport through a Glassy Polymer
Gas diffusion in a glassy polymer (Tg > RT) is more complicated because the
sorption sites are unique. For a glassy polymer, changes in gas permeability as a function
of pressure is often explained by a dual-mode model, which was first proposed by
Barrer[79] and later modified by Petropoulos and Koros.[80, 81] The basic assumptions of
this model are: dissolution of gas in the polymer matrix by Henry’s law and adsorption
of gas molecules in holes (or cavities) on the surface (or inside) the polymer matrix by
Langmuir’s law. The pressure dependence of solubility can be described as:

13
𝑆 = 𝑘𝐷 + 𝐶′𝐻𝑏1+𝑏𝑏
(2.7)
where kD is Henry’s law constant, C’H is the Langmuir capacity constant, and b is the
Langmuir affinity constant. C’H indicates the level of unrelaxed free volume in the
glassy polymer. This term is used to determine the nonequilibrium nature of glassy
polymers. The affinity constant describes the specific nature of a given penetrant to sorb
into the excess unrelaxed volume in the nonequilibrium glassy polymer matrix. It was
found that the balance between the diffusivity term and the solubility term in Equation
2.6 is different for glassy and rubbery polymer.[78] The diffusivity term is usually
dominant for a glassy polymer, so gas permeability decreases with increasing penetrant
size. The nonequilibiurm state of glassy polymers can also be affected by process
parameters such as temperature, pressure and penetrant-polymer interactions.[73]
2.1.2 Transport in Nanocomposites
Nanocomposites are two phase systems that consist of a polymer matrix and
dispersed particles of nanometer scale. Adding inorganic nanoparticles into a polymer
matrix has been shown to successfully increase elastic modulus. The coupling between
large surface area nanoparticles and a polymer matrix facilitates stress transfer to the
reinforcing phase, so tensile strength and toughness are also increased.[82-85] These
impermeable nanoparticles can also increase flame retardancy of the polymer matrix,[86-
88] while also forming a tortuous pathway to reduce gas permeability.[89-91] The most
common nanoparticles belong to the family of 2:1 phyllosilicates (i.e., clays). Their
crystal structure, shown in Figure 2.3, consists of an aluminum or magnesium hydroxide
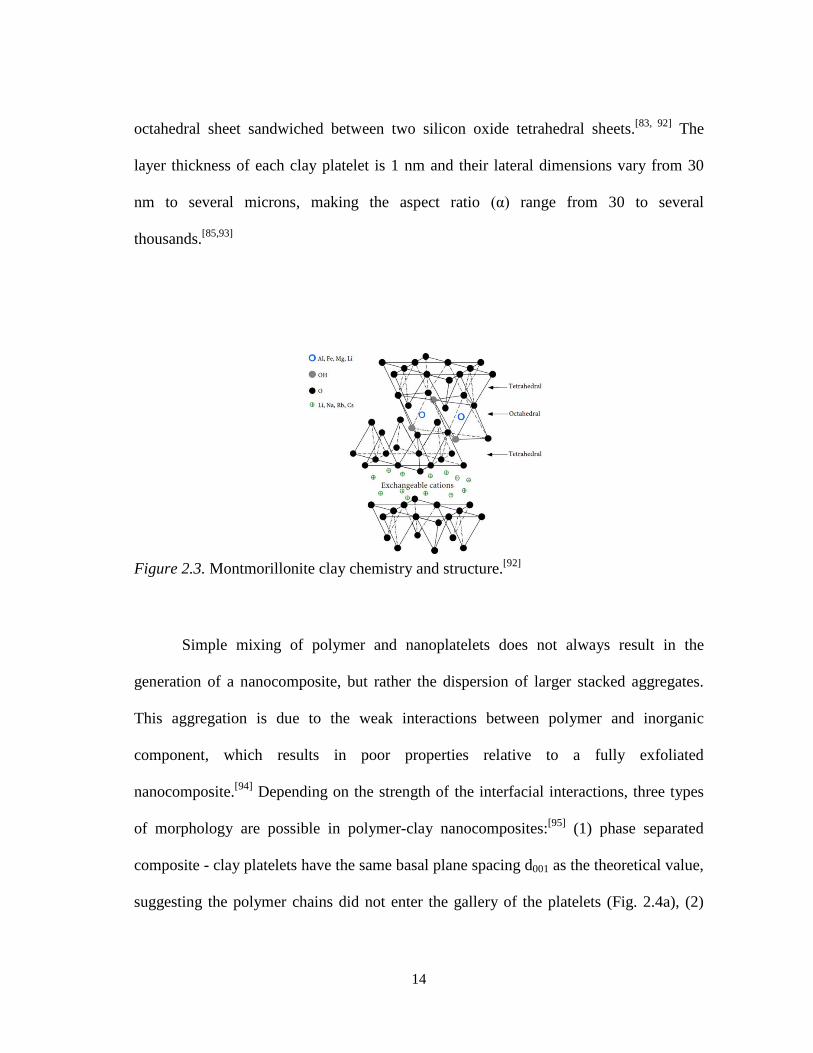
14
octahedral sheet sandwiched between two silicon oxide tetrahedral sheets.[83, 92] The
layer thickness of each clay platelet is 1 nm and their lateral dimensions vary from 30
nm to several microns, making the aspect ratio (α) range from 30 to several
thousands.[85,93]
Figure 2.3. Montmorillonite clay chemistry and structure.[92]
Simple mixing of polymer and nanoplatelets does not always result in the
generation of a nanocomposite, but rather the dispersion of larger stacked aggregates.
This aggregation is due to the weak interactions between polymer and inorganic
component, which results in poor properties relative to a fully exfoliated
nanocomposite.[94] Depending on the strength of the interfacial interactions, three types
of morphology are possible in polymer-clay nanocomposites:[95] (1) phase separated
composite - clay platelets have the same basal plane spacing d001 as the theoretical value,
suggesting the polymer chains did not enter the gallery of the platelets (Fig. 2.4a), (2)

15
intercalated composite - d001 is increased by the entering polymer, but the clay platelets
remain stacked in parallel with each other (Fig. 2.4b), and (3) exfoliated composite - d001
is greater than 10 nm, clay sheets are pushed apart irregularly by polymer or organic
species (Fig. 2.4c). There are different factors controlling the extent of clay exfoliation,
including concentration,[94] interfacial interactions[96] and temperature.[97]
Figure 2.4. Schematics of the three different clay-filled composite morphologies.[95]
Gas diffusion through nanocomposites can be viewed as a solution-diffusion
process. In the absence of adsorption by the filler, or effects of the filler on the
surrounding polymer,[98] solubility of the composite can be described as:
𝑆 = 𝑆0(1 − 𝜙) (2.8)
where S0 is the solubility of the pure polymer matrix and 𝜙 is the volume fraction of
filler in the matrix. In this case, solubility does not depend on morphology of the

16
polymer and the filler.[98] Diffusion is more complicated because fillers act as
impermeable barriers and force penetrant to follow an elongated (tortuous) pathway to
diffuse through the composite.
𝐷 = 𝐷0𝑓 (2.9)
f is the tortuosity factor where D0 is the diffusivity of the neat polymer. Tortuosity factor
depends on the volume fraction of the filler, aspect ratio of the filler (α), and its
orientation in the polymer matrix. Combining Equation 2.8 and 2.9 gives
𝑃 = 𝐷𝑆 = 𝑆0𝐷0𝑓(1 − 𝜙) = 𝑃0𝑓(1 − 𝜙) (2.10)
or 𝑓 = 𝑃
𝑃0(1−𝜙) (2.11)
where P0 is the gas permeability of neat polymer. A simple permeation model for a
regular arrangement of platelets has been proposed by Nielsen and is presented in Figure
2.5.[99] The platelets are evenly dispersed and considered to be rectangular with finite
width (L) and thickness (W). Their orientation is perpendicular to the diffusion direction.
Nielson also proposed that tortuosity (𝜏), the reciprocal of tortuosity factor, is a function
of α (= 𝐿2𝑊
) and 𝜙:
𝜏 = 1 + 𝛼𝜙 = 1 + 𝐿2𝑊
𝜙 = 1𝑓 (2.12)
Combining Equation 2.11 and 2.12, the gas permeability of nanocomposites becomes:

17
0 0
1 11
P PP αφ αφφ
= ≈+ +−
(2.13)
Nielsen’s model describes a composite with low filler volume fraction (𝜙 ≪ 1) which
makes the filler in the composite a “dilute suspension”. The denominator of Equation
2.13 can be simplified as shown above.
Figure 2.5. Schematic of gas transport through a polymer-platelet composite via a
tortuous path.[99]
A more advanced tortuous path theory was later proposed by Cussler.[100] The
difference between the Nielsen and Cussler models is the former failed to describe
higher concentration regimes in the composite. Cussler’s model states the relationship
between the gas permeability of a filled polymer matrix and neat polymer as:
( )0
2 21 / 1PP
µα φ φ=
+ − (2.14)

18
where µ is a geometric factor representing the shape of the filler. It describes gas
diffusion phenomena when the filler concentration in the composite is “semi-dilute”
(𝜙 ≪ 1 and 𝛼𝜙 < 1).[90, 101] The distribution of platelets in a polymer composite can also
affect gas permeability. When the platelets are in a regularly spaced array, µ = 1. When
the platelets are in a randomly distributed array, µ = 4/9. These possible geometries of
platelets in the composite are shown in Figure 2.6.
Figure 2.6. Geometries of regular and random arrays for platelet-filled polymer
composites.
2.1.3 Limitations of Gas Separation Using Polymer Membranes
The best gas separation membrane should have high gas permeability and high
selectivity. In reality, there are strong trade-offs between gas permeability and selectivity
that are not easily broken.[102-105] It is believed that this trade-off behavior for specific
gas pairs is unique and related to the nature of the gas molecules. Robeson proposed a
selectivity-permeability relationship for polymer membranes and various gas pairs in

19
1991 and revised it in 2008.[20, 21] The transport parameters, selectivity (αA/B) and gas
permeability (PA), were plotted to generate an upper-bound line, Figure 2.7. In general,
rubbery polymers have higher flux, while glassy polymers exhibit better selectivity. The
following empirical equation was proposed to explain the upper-bound lines for given
gas pairs:
𝑙𝑙𝑙𝛼𝐴/𝐵 = 𝑙𝑙𝑙𝛽𝐴/𝐵 − 𝜆𝐴/𝐵𝑙𝑙𝑙𝑃𝐴 (2.15)
where 𝜆𝐴/𝐵 is the slope of the upper-bound, which depends only on the size of the gas
pair and 𝑙𝑙𝑙𝛽𝐴/𝐵 being the intercept at 𝑙𝑙𝑙𝑃𝐴 = 0 (depends on gas condensabilities).
Development of better membrane materials is an ongoing research topic, making further
revision of the upper-bound necessary in the future.
Figure 2.7. Upper-bound line of CO2 permeability and CO2/CH4 permselectivity.[20]

20
2.2 Gas Barrier/Separation Films
Transparent and flexible thin films with high barrier properties are important for
packaging. Lack of metallic components is also vital for microwavability and
recyclability,[106] which explains the strong interest in using nanoplatelets as
impermeable fillers.[107-110] In contrast, gas separation films require high flux and
selectivity.[16, 70, 73] Flux can be increased by increasing surface area of the separation
module, while selectivity is controlled by film structure and gas-polymer interactions.[23,
70, 111-113] These properties are necessary for packaging, electronic displays and gas
purification/separation.[19, 22, 114-116] The gas barrier and separation technologies reviewed
in this section have been developed to satisfy these applications. Polymer films, whether
as a blend or bulk material, are the most studied and commonly used for
barrier/separation application (see Section 2.2.1).[16, 117-119] A new approach for
barrier/separation films is by depositing a thin barrier layer on top of the polymer
substrate, which offers advantages such as light weight, low cost and design freedom.[116,
120] Inorganic films, which contain impermeable inorganic nanoparticles and polymer
matrix have been studied for their low gas. The inorganic materials can be deposited on
flexible substrate to reduce gas permeability (Section 2.2.2.1),[17, 121] used as a separation
film itself (Section 2.2.2.1)[122, 123] or coated as a metal oxide layer (Section 2.2.2.2).[124-
126] Finally, mixed matrix membranes combine the benefits of the previous systems
(Section 2.2.3), enabling properties to be tailored by choosing the materials necessary
and controlling the morphology of the membrane.[22, 28, 29, 127, 128]

21
2.2.1 Polymers
High barrier polymers, such as ethylene vinyl alcohol (EVOH), polyvinylidene
chloride (PVDC) and polyethylene naphthenate (PEN), act as fillers when laminated
with polymers like polyethylene (PE),[129] polypropylene (PP)[117, 130] and poly(ethylene
terephthalate) (PET).[131] The gas barrier can be improved 2 to 10 times relative to the
neat commodity polymer.[16] This improvement is not significant relative to other
techniques, but inexpensive processing has made it one of the most prevalent forms of
commercial packaging material.[27]
As for bulk polymer membranes, they made their debut in commercial gas
separation in 1980. Starting with the hydrogen-separating Prism® (polysulfone), other
membranes such as Cynara (cellulose acetate) and Separex (cellulose acetate) were
introduced to remove carbon dioxide from methane in natural gas.[118, 132, 133] More
recently, work by Dow, Ube and DuPont has expanded the market and made membrane
separation more competitive than conventional gas separation techniques.[70] Other
materials, such as silicon-based and high-temperature polymers have also been studied.
Due to their chain flexibility, large free volume and low glass transition temperature (Tg
of polydimethylsiloxane (PDMS) is -123oC), silicon-based polymers have high gas and
vapor permeability.[134, 135] Their excellent thermal and chemical resistance is suitable for
separation of high value organic vapors from industrial waste streams. For instance, a
PDMS-blended membrane operating at 35 oC and 1 atm exhibited an oxygen
permeability 250 times higher than polyimide membranes, while O2/N2 selectivity
remained similar. High-temperature polymer membranes, such as polybenzimidazole

22
(PBI) or polyimides (PI), with Tg over 400 oC and decomposition temperature near 600
oC, have also received more attention.[136-139] High Tg polymer increase the operating
temperature up to 300 oC, which increases flux while maintaining high selectivity
(H2/CO2 = 20) relative to rubbery polymers, as shown in Figure 2.8.[73]
2.2.2 Inorganic Films
Two types of inorganic films will be introduced, the metalized films and metal
oxide films.
Figure 2.8. Permeance as a function of temperature for H2 and CO2 permeating through
PBI membranes.[136]
2.2.2.1 Inorganic Films: Metalized Plastics and Metal Films
Traditional flexible barriers consist of polymer film with a thin layer of
aluminum, ranging from ten nanometers to few micrometers.[17, 121, 140] Although
metalized film provides barrier properties (oxygen transmission rate [OTR] = 1.4×10⁻¹⁴

23
cm3 cm-2 s-1 Pa-1) unrivaled by any other flexible packaging, the smaller thickness is
susceptible to the formation of pinholes and other stress induced fractures.[17]
Additionally, metalized film cannot be recycled, is opaque and cannot be microwaved. It
is for these reasons that eliminating the metal layer has become an important aspect of
package design. Metal is also used in gas separation, mostly in high-temperature
membrane reactors for the preparation of pure hydrogen.[141] For instance, hydrogen
permeable palladium and its alloy membranes are extremely selective, with hydrogen
permeability often 10-100 times higher than polymer membranes.[122, 123] These metal
membranes must be operated at a high temperature (>300 oC) to obtain useful gas
permeability and to prevent cracking by absorbed hydrogen, which limits their industrial
applications.[142]
2.2.2.2 Inorganic Films: Metal Oxide Films and Ceramic/Zeolite Films
Thin glass-like metal oxide films can be produced by physical vapor deposition
(PVD), or plasma-enhanced chemical vapor deposition (PECVD), to dramatically reduce
gas permeability of polymer substrates, as shown in Table 2.1.[143-146] The development
of these technologies started in the 1980s for PVD and 1900s for PECVD. Silicon oxide
(SiOx) and aluminum oxide (AlyOz) are the most commonly deposited materials, both of
which are transparent, water-resistant, microwavable and exhibit barriers comparable to
metalized films. Oxide layers are a foil (i.e., metal) replacement for food and
pharmaceutical packaging.[124-126] Major problem with oxide layers are limited flexibility,
poor crack resistance and the relatively high production costs.[147, 148] During the past few
years, ceramic- and zeolite-based films have been used for commercial separations.[149,

24
150] These films consist of a selective ceramic or zeolite layer on a microporous support.
Extraordinarily high selectivity (H2/N2 = 275) has been reported for these films.[150]
Their ceramic nature allows operation at high temperature, which means high gas
permeability during separation. Despite their promise, the cost of these films ($3000/m2),
is currently too high to be commercialized for most applications.[23, 70]
Table 2.1 Oxygen transmission rates of bare and SiOx-coated polymer substrates.
Substrate Coating OTR
(cm3 m-2 day-1 atm-1) Ref. Technique Thickness
Polyethylene (PE) bare 12µm 8525 [143]
PECVD 40nm 300 [143] Oriented Polypropylene
(OPP) bare 25µm 2500 [143]
PVD 70nm 218 [144]
PECVD 90nm 9 [145] Poly(ethylene terephthalate)
(PET) bare 12µm 120 [143]
PVD 70nm 2.18 [146]
PECVD 40nm 1 [143]
2.2.3 Mixed Matrix Membranes
The introduction of nanoparticles into a continuous polymer matrix has improved
mechanical and thermal stability of conventional polymer membranes as well as their
gas barrier/separation performance. Nanoparticles mixed within polymer matrix can be
classified into two categories: porous particles, such as zeolites,[151, 152] and nonporous

25
platelets, such as graphene-based materials and clay.[82, 128, 153, 154] The addition of
nanoparticles can improve gas barrier and/or selectivity by increasing the diffusion
pathway for gases, as shown in Figure 2.9.[127] Clay-filled polyurethane,[155] epoxy,[156]
polyolefin,[157] polyamide[89] and biodegradable polymers[158] have all exhibited 50% to
90% improvement in barrier. As noted earlier, the simple mixing of polymer and
nanoparticles does not always result in a nanocomposite. In the case of clay, this is due
to the Na+ and K+ ions that are more compatible with hydrophilic polymers.[85]
Nanoparticles also tend to aggregate when a threshold concentration is achieved (≤ 10wt
%),[91] restricting the possibility for further barrier and separation improvement. Layer-
by-layer assembly was proposed to solve this problem. The strong electrostatic
interactions that accompany this deposition technique can efficiently decouple single
clay platelets, allowing for the creation of dense composites with high concentration and
exfoliation of nanoplatelets.[159]
Figure 2.9. TEM images of Polylactide/ Montmorillonite (MMT) nanocomposite
film.[160]

26
2.3 Layer-by-Layer Assembly
In order to induce higher functionality and performance, one needs to control
molecular orientation of composites on nanoscale, as their properties strongly depend on
the local environment.[34, 161-164] Langmuir-Blodgett (LB) deposition accomplishes this
by consecutively depositing single molecular layers.[165-167] Unfortunately, the LB
technique requires expensive equipment and is limited with respect to substrate size.[34, 48]
It is also difficult to obtain high quality multilayer films due to the high steric demand of
covalent or coordination chemistry, making it desirable to have an alternate method for
fabricating nanostructured films. The electrostatic attraction between cationic and
anionic molecules is a straightforward driving force to build up multilayer thin films. Iler
was the first to propose the concept in 1966,[168-170] but it was more than twenty years
later that Decher and coworkers popularized layer-by-layer (LbL) assembly.[34] In this
case, multilayer films are built up by alternately dipping substrates into oppositely
charged polyelectrolyte solutions, as shown in Figure 2.10.[34, 171, 172] Over the past two
decades, the LbL assembly technique has received significant attention due to its precise
tailorability of thin film structure through adjustment of concentration,[35, 36] pH/ionic
strength,[37-39] temperature,[38, 40] molecular weight[41, 42] and deposition time[35, 43, 44] of
the aqueous deposition mixtures. Although electrostatic attraction is the most common
bonding type for LbL, hydrogen bonding[46, 173, 174] and covalent bonding[175-177] can also
be used to grow multilayer thin films. LbL films are now being used for a variety of
applications, including antireflection,[57-59] regular/stretchable gas barrier,[174, 178] flame
resistant[60-62] and drug delivery.[54-56] Another advantage of this multilayer assembly

27
technique is the large nanoparticle concentration that can be achieved relative to bulk
composites,[65, 66, 179] which provides high performance with a much thinner coating. The
free volume of the polymer matrix or distance between each deposited nanoplatelet layer
can be tailored to control the diffusivity of different permeating gases. This will be
described in more detail in Sections 2.3.1 and 2.3.2.
Figure 2.10. (a) Schematic of layer-by-layer assembly. (b) cross-sectional illustration of
the nanobrickwall stricture.[110]
2.3.1 Gas Barrier Behavior of Multilayer Thin Films
Anionic clay, such as montmorillonite (MMT), has been paired with cationic
polyelectrolytes such as polyethylenimine (PEI),[110] polyacrylamide (PAm)[159] and
chitosan (CH)[180] to create bilayer assemblies. These sub-micron assemblies reduced the
thick polymer substrate oxygen transmission rates (OTR) by 2 to 3 orders of magnitude.

28
Texas A&M’s Polymer NanoComposites Lab[178] discovered that clay spacing, which is
the distance between each deposited clay layers, can be controlled by varying the pH of
polyelectrolyte solutions or the number of polymer layers deposited between clay layers,
as shown in Figure 2.11.[110, 181] It was found that greater clay spacing improved gas
barrier. Replacing MMT with vermiculite (VMT) clay or graphene oxide (GO) in these
multilayers also decreased oxygen permeability (up to five times lower than MMT) due
to higher platelet aspect ratio (4X larger than MMT), as predicted by Cussler’s model.[65,
182] Since most LbL films are assembled from aqueous solutions, it is not surprising that
exposure to moisture increases free volume of the film and increases gas permeability.
Yang and Stevens suppressed moisture sensitivity by thermally reducing GO in a
PEI/GO bilayer assembly,[65, 183] maintaining barrier under humid conditions. Schaaf and
coworkers introduced Nafion into a clay-based assembly.[154] The addition of this
hydrophobic fluorinated polymer preserved the OTR (97% reduction relative to
uncoated poly(lactic acid) (PLA)) under humid condition, and reduced water vapor
transmission rate (WVTR) by 78%.
Polymer-only multilayers have also been shown to exhibit high barrier
(comparable to polymer-clay assemblies). Yang showed that altering the pH of PEI and
PAA increased film thickness and polymer interdiffusion to create a “scramble salt”
structure with higher density (1.13 g cm-3) than a simple polymer mixture.[63] This
increased density was due to decreased fractional free volume, which explains why 8 BL
of PEI/PAA (305 nm thick) exhibits the lowest oxygen permeability (3.2×10⁻²¹ cm3 cm
cm-2 s-1 Pa-1) ever reported for a neat polymer thin film. The present dissertation explores

29
barrier properties of different gases, with a focus on decreasing free volume of the
polymer layer and increasing the level of filler deposited (Chapter III[184] and IV). The
influence of GO and polymer pH, on moisture sensitivity and barrier behavior, is also
evaluated (Chapter V).
Figure 2.11. Thickness of PEI/MMT as a function of bilayers deposited while varying
pH of PEI. (b) Thickness as a function of clay layers deposited with varying numbers of
poly(allyl amine) (PAAm)/poly(acrylic acid) (PAA) bilayers [γ] between clay
depositions.[181]
2.3.2 Gas Separation Behavior of Multilayer Thin Films
Gas separation membranes are currently used to separate hydrogen from gas
mixtures (H2/CH4, H2/CO, H2/hydrocarbons),[22, 185, 186] recover CO2 from CH4, N2, CO
or other hydrocarbons, and remove H2S and CO2 from biogas.[19, 187, 188] Even more than
for barrier, gas separation requires a defect-free film, because small gas molecules will
permeate through the smallest defect present.[189] Layer-by-layer is already known for its

30
ability to generate defect-free assemblies. Stroeve and coworkers discovered that 100 BL
of PAAm/poly(styrene sulfonate) (PSS) exhibited high CO2/N2 selectivity (~24) at 50
oC,[190] although this film exhibited low flux. McCarthy and coworkers reported an
increased selectivity for H2/N2 and H2/O2 when applying 20 to 200 BL of poly
(allylamine hydrochloride) (PAH)/PSS, but this film also has low gas permeability due
to the formation of a dense and rigid structure.[191] Another group induced imidization
after depositing PAH/poly(amic acid), as shown in Figure 2.12. The newly formed
polyimide membrane exhibited comparable O2/N2 (6.9) and CO2/N2 (68) selectivity as
conventional PI membranes.[192] Nanoparticles have also been used in LbL assemblies
for gas separation. GO platelets were assembled with polyelectrolyte or zeolitic
imidazolate framework (ZIF), showing a H2/CO2 selectivity of 383[65] and H2/N2
selectivity of 90.[193] Tsapatsis and coworkers reported a zeolite/silica assembly that
separated H2 from N2.[194] This completely inorganic assembly was under the Robeson
upper-bound Figure 2.13, but its strong heat resistance allowed for a wide range of
operating temperature (from room temperature to 200 oC). The present dissertation
focuses on two types of gas separation membranes: CH/PAA/CH/GO mixed matrix
assemblies (Chapter V) and PEI/PAA all-polymer assemblies (Chapter VI).[195]

31
Figure 2.12. Thermal imidization of PAH/poly(amic acid) assembly on a porous alumina
support.[192]
Figure 2.13. Robeson plot for a MCM-22/silica membrane (membrane A3B3), placed in
context with other membranes for H2/N2 separation.[194]

32
CHAPTER III*
INFLUENCE OF POLYMER INTERDIFFUSION AND CLAY CONCENTRATION
ON GAS BARRIER OF POLYELECTROLYTE/CLAY NANOBRICK WALL
QUADLAYER ASSEMBLIES
3.1 Introduction
Super gas barrier exhibited by some layer-by-layer assemblies has led to
significant study.[65, 180, 196-198] Two approaches have been used to produce low oxygen
permeability. The first is to create an extremely tortuous path by layering nanoplatelets,
such as clay and graphene oxide.[65, 197] The impermeable gas platelets create a tightly
packed nanobrick wall structure that significantly extends the diffusion pathway of a gas
molecule. The best system to-date is a quadlayer (QL) system prepared by repeatedly
depositing polyethylenimine (PEI), poly(acrylic acid) (PAA), PEI, and montmorrilonite
(MMT) clay.[197] In this case, a 4QL film, with a thickness of 50nm, achieved an oxygen
transmission rate of 0.005 cm3 m-2 day-1 atm-1. A second approach exploits extensive
polyelectrolyte interdiffusion to obtain an exceptionally dense film.[198] The greatest
oxygen barrier has been achieved with an “exponentially growing” polyelectrolyte
combination.
*Reprinted with permission from “Journal of Membrane Science” by Tzeng, P.; Maupin, C. R.; Grunlan, J. C., ”Influence of Polymer Interaction and Clay Concentration on Gas Barrier of Polyelectrolyte/Clay Nanobrick Wall Quadlayer Assemblies” J. Membr. Sci. 2014, 452, 46-53, Copyright [2015] by Elsevier.
33
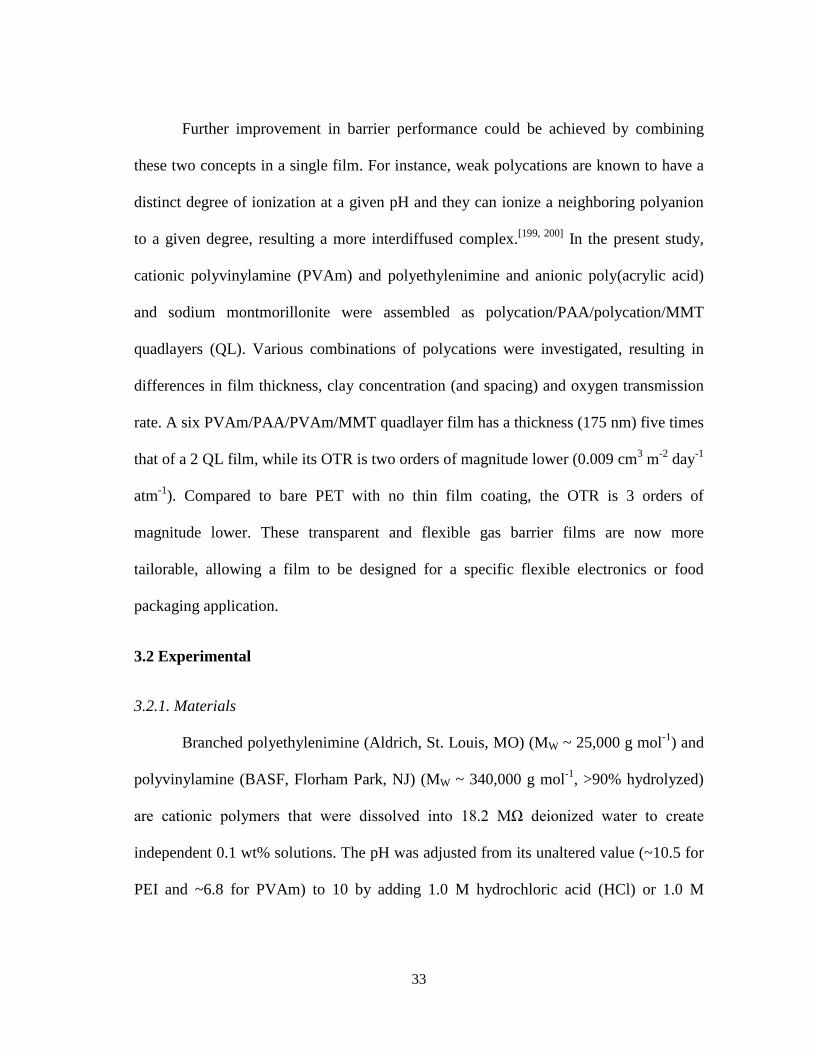
Further improvement in barrier performance could be achieved by combining
these two concepts in a single film. For instance, weak polycations are known to have a
distinct degree of ionization at a given pH and they can ionize a neighboring polyanion
to a given degree, resulting a more interdiffused complex.[199, 200] In the present study,
cationic polyvinylamine (PVAm) and polyethylenimine and anionic poly(acrylic acid)
and sodium montmorillonite were assembled as polycation/PAA/polycation/MMT
quadlayers (QL). Various combinations of polycations were investigated, resulting in
differences in film thickness, clay concentration (and spacing) and oxygen transmission
rate. A six PVAm/PAA/PVAm/MMT quadlayer film has a thickness (175 nm) five times
that of a 2 QL film, while its OTR is two orders of magnitude lower (0.009 cm3 m-2 day-1
atm-1). Compared to bare PET with no thin film coating, the OTR is 3 orders of
magnitude lower. These transparent and flexible gas barrier films are now more
tailorable, allowing a film to be designed for a specific flexible electronics or food
packaging application.
3.2 Experimental
3.2.1. Materials
Branched polyethylenimine (Aldrich, St. Louis, MO) (MW ~ 25,000 g mol-1) and
polyvinylamine (BASF, Florham Park, NJ) (MW ~ 340,000 g mol-1, >90% hydrolyzed)
are cationic polymers that were dissolved into 18.2 MΩ deionized water to create
independent 0.1 wt% solutions. The pH was adjusted from its unaltered value (~10.5 for
PEI and ~6.8 for PVAm) to 10 by adding 1.0 M hydrochloric acid (HCl) or 1.0 M

34
sodium hydroxide (NaOH). Titration of PVAm revealed a pKa in the range of 7.3 - 8.5.
pH measurements for titrating 0.1M PVAm solutions were performed using an IQ 240
pH meter (0.01 pH unit sensitivity). 10N NaOH and HCl were used to change PVAm
from its natural pH (~7.2) into its covalent and ionic forms (see Supporting Information).
Poly(acrylic acid) (Aldrich) (MW ~ 100,000 g mol-1) is an anionic polymer that was
prepared as a 0.2 wt% solution with 18.2 MΩ deionized water. The pH of PAA was
adjusted from its unaltered value (~3.1) by adding 1.0 M NaOH. Anionic natural sodium
montmorillonite (MMT) (trade name Cloisite Na+) (Southern Clay Products, Inc.,
Gonzales, TX) clay was prepared as a 1 wt% aqueous suspension. This suspension of
high aspect ratio nanoplatelets (l/d is 80 to 300)[201] was used at its natural pH (~9.7).
3.2.2. Substrates
Single-side-polished (100) silicon wafers (University Wafer, South Boston, MA)
were used as deposition substrates for ellipsometry and atomic force microscopy (AFM).
Fused quartz slides (Structure Probe, Inc. West Chester, PA) were used for visible light
transmission measurement via UV-vis spectroscopy. Both silicon wafers and quartz
slides were piranha treated with a 3:1 ratio of 30% hydrogen peroxide to 99% sulfuric
acid and stored in deionized water before use. Caution: Piranha solution reacts violently
with organic material and needs to be handled properly. Prior to use, the silicon wafers
were rinsed with acetone and deionized water. Poly(ethylene terephthalate) (PET) film,
with a thickness of 179 µm (trade name ST505, Dupont–Teijin), was purchased from
Tekra (New Berlin, WI). This film was rinsed with deionized water and methanol before
use. Clean PET was then corona-treated with a BD-20C Corona Treater (Electro-

35
Technic Products Inc., Chicago, IL). Corona treatment improves adhesion of the first
polyelectrolyte layer by oxidizing the film surface.[202] Polished Ti/Au crystals, with a
resonance frequency of 5 MHz, were purchased from Maxtek, Inc (Cypress, CA) and
used as deposition substrates for quartz crystal microbalance (QCM) characterization.
3.2.3. Layer-by-Layer Deposition
The layer-by-layer process is shown schematically in Figure 3.1. A given
substrate was first dipped into the polycation solution (PEI and/or PVAm) for 5 minutes,
followed by rinsing with deionized water for 30 seconds and drying with a stream of
filtered air. After the first positively-charged layer was adsorbed, the substrate was
dipped into PAA solution for another 5 minutes, followed by another rinsing and drying
cycle. The substrate was then dipped into polycation and MMT solutions to form one
“quadlayer”. Starting from the second deposition cycle, the remaining numbers of layers
were created using one minute dip times. This process was carried out using home-built
robotic systems.[203, 204] The pH of PEI, PVAm or PAA is shown as a subscript next to
their initials in the figures and text. For example, one quadlayer of
PVAm(pH=10)/PAA(pH=4)/PVAm(pH=10)/MMT(unaltered pH of 9.7) is abbreviated
as (PVAm10/PAA4/PVAm10/MMT)1.
36
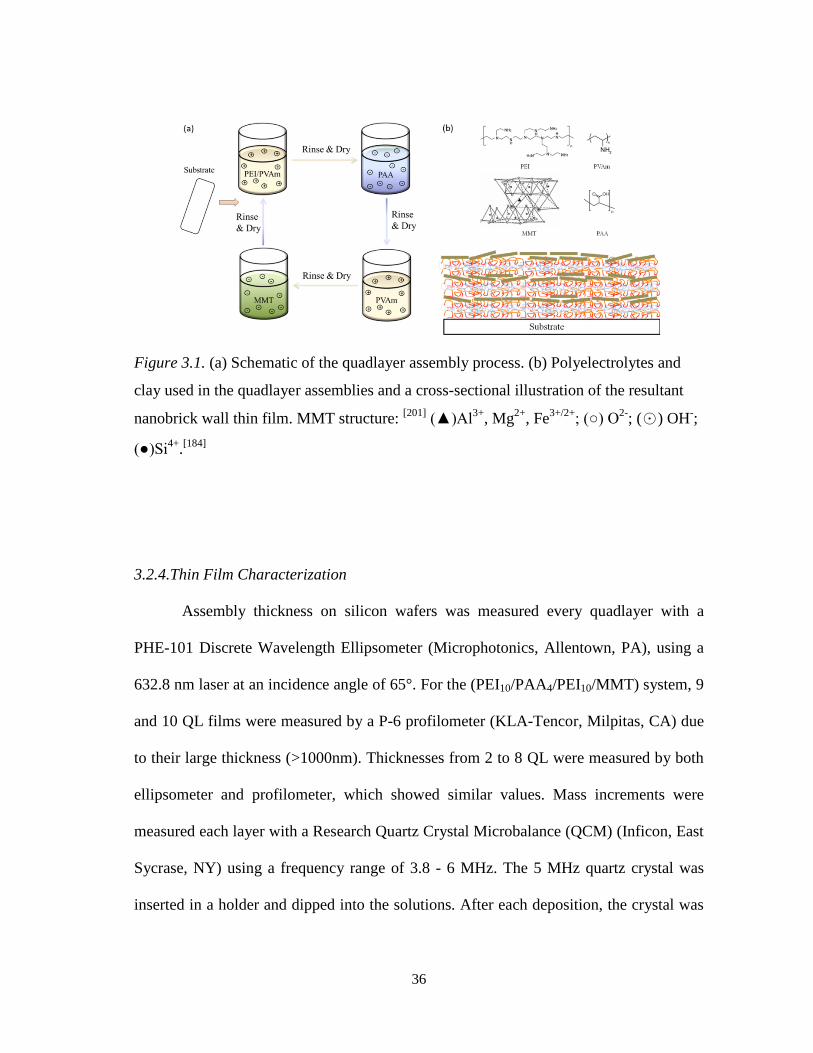
Figure 3.1. (a) Schematic of the quadlayer assembly process. (b) Polyelectrolytes and
clay used in the quadlayer assemblies and a cross-sectional illustration of the resultant
nanobrick wall thin film. MMT structure: [201] (▲)Al3+, Mg2+, Fe3+/2+; (○) O2-; (☉) OH-;
(●)Si4+.[184]
3.2.4.Thin Film Characterization
Assembly thickness on silicon wafers was measured every quadlayer with a
PHE-101 Discrete Wavelength Ellipsometer (Microphotonics, Allentown, PA), using a
632.8 nm laser at an incidence angle of 65°. For the (PEI10/PAA4/PEI10/MMT) system, 9
and 10 QL films were measured by a P-6 profilometer (KLA-Tencor, Milpitas, CA) due
to their large thickness (>1000nm). Thicknesses from 2 to 8 QL were measured by both
ellipsometer and profilometer, which showed similar values. Mass increments were
measured each layer with a Research Quartz Crystal Microbalance (QCM) (Inficon, East
Sycrase, NY) using a frequency range of 3.8 - 6 MHz. The 5 MHz quartz crystal was
inserted in a holder and dipped into the solutions. After each deposition, the crystal was

37
rinsed and dried and then left on the microbalance to stabilize for 5 minutes. Visible
light transmission was obtained with a USB2000UV-vis spectrometer (Ocean Optics,
Dunedin, FL). FTIR spectra of LbL films were measured with a Bruker Optics ALPHA-
P 10098-4 spectrometer in ATR mode. PAA peaks in its covalent (COOH) and ionic
form (COO-) are of interest in this study to compare the ionic interaction between
polycation and polyanion, or so called ‘degree of ionization’. The COO- and COOH
peaks of PAA were first assumed to have similar extinction coefficients,[205] which
allowed the fraction of ionized PAA carboxylic groups to be obtained by deriving
Abs1560/(Abs1560+Abs1710).[206] Cross-sections of the quadlayer assemblies were imaged
with a JEOL 1200 EX TEM (Mitaka, Tokyo, Japan), operated at 110 kV. Samples were
prepared for imaging by embedding a piece of coated PET in epoxy prior to sectioning it
with a diamond knife. Surface structure of the coated silicon wafers were imaged with a
Multimode Scanning Probe Microscope (SPM) (Veeco Digital Instruments, Santa
Barbara, CA) in tapping mode. OTR testing was performed by MOCON (Minneapolis,
MN) in accordance with ASTM D-3985,[207] using an Oxtran 2/21 ML instrument at
23°C and 0% RH.
3.3 Results and Discussion
3.3.1. Multilayer Film Growth
Film growth of three different polyamine quadlayer recipes was measured by
ellipsometry and profilometry, as shown in Figure 3.2. Notice that instead of being three
times as thick, (PVAm10/PAA4/PVAm10/MMT)6 is five times thicker than

38
(PVAm10/PAA4/PVAm10/MMT)2 due to “island growth”.[208] The growth of the first few
layers is influenced by the substrate, resulting in the thickness per layer being thinner
than the “bulk” film. PVAm-based quadlayers exhibit a linear growth trend, while PEI-
based quadlayers exhibit exponential growth due to PEI/PAA interdiffusion.[51, 63, 197]
Before deposition, both PEI10 and PAA4 solutions are in a low charge form in which
polymer chains are more globular. As deposition proceeded, these pH-sensitive
polyelectrolytes became more highly charged due to the alternating pH (i.e., PEI
encountering a lower pH when PAA was deposited and PAA encountering a higher pH
environment). In order to compensate the newly formed charge inside the bulk film,
more PEI and PAA were adsorbed into the growing multilayer, resulting in exponential
growth.[51] The large film thickness observed here may seem counterintuitive for a
highly-charged polymer backbone, but it should be noted that charge density and
effective pKa can differ from their solution state values within the multilayer
assembly.[209, 210] Degree of ionization is directly linked to pKa. The pKa of PVAm
ranges from 7.3-8.5, PEI has pKa values of 6.5-8.5,[211-213] and PAA has pKa values of
5.5-6.5.[214, 215] Based on the fact that PEI has a slightly lower pKa than PVAm, along
with results obtained from FTIR, PEI appears to be more responsive to changes in pH.
This suggests that when encountering an acidic PAA environment, PEI can be easily
ionized and have stronger ionic interaction with PAA than PVAm.[216] Figure 3.3 shows
mass deposited for these same assemblies. All systems exhibit the same growth trends
observed with ellipsometry (Figure 3.2). This data also provides the clay concentrations
for each film, which are summarized in Table 1.

39
Figure 3.2. Film thickness as a function of quadlayers deposited with three recipes:
(PEI10/PAA4/ PEI10/MMT)x, (PVAm10/PAA4/PVAm10/MMT)x and
(PEI10/PAA4/PVAm10/MMT)1- (PVAm10/PAA4/PVAm10/MMT)x-1.[184]
Figure 3.3. Mass as a function of quadlayers deposited with three recipes:
(PEI10/PAA4/PEI10/MMT)x (half-filled dots), (PVAm10/PAA4/PVAm10/MMT)x (filled
dots) and (PEI10/PAA4/PVAm10/MMT)1- (PVAm10/PAA4/PVAm10/MMT)x-1 (hollowed
dots). Rectangular and circular dots indicate the accumulated mass measured from the
beginning to the specific polymer or clay layer, respectively. [184]

40
Unlike PEI-based assemblies, PVAmx grows linearly. There are a few reasons
why PEI displays greater interdiffusion than PVAm in these assemblies. PVAm has a
higher Tg than PEI and therefore greater chain stiffness at room temperature, which
inhibits diffusion in the polymer assembly.[217, 218] It has been shown that chain size
(molar mass) or structure (branched polymer) can directly influence chain diffusion.[219]
Others have shown that by increasing film surface roughness, more surface area is
available to adsorb additional material that produces exponential growth.[219, 220] Even
though the thickness of a PEI quadlayer is smaller than PVAm for the first few cycles, it
surpasses PVAm after 5 QL. With this better understanding of the assembly mechanism,
a relation between the number of PEI layers and thickness was observed.
(PEI10/PAA4/PVAm10/MMT)1-(PVAm10/PAA4/PVAm10/MMT)x, though containing PEI
in the assembly, grew linearly and was thinner than PVAm-based quadlayer, as shown in
Figure 3.2. Two reasons might explain this phenomenon: (1) PEI/PAA actually grows
thinner than PVAm/PAA at early stages and (2) clay layers are preventing interdiffusion.
FTIR analysis helps to explain why PEI and PVAm assemblies have such
different properties. Infrared spectroscopy was used to compare the electrostatic
interaction between polycations and polyanions. Figure 3.4 shows the FTIR spectra of
(PVAm10/PAA4/PVAm10/MMT)5 and (PEI10/PAA4/PEI10/MMT)5 assemblies. For both
systems, two peaks (1715 and 1560 cm-1 for PEI and 1671 and 1560 cm-1 for PVAm)
and one shoulder (1630 cm-1 for PEI and 1715 cm-1 for PVAm) can be observed. It
should be noted that the characteristic band of MMT occurs at 995 cm-1, so all peaks
between 1400 cm-1 and 1800 cm-1 can be attributed to the polyelectrolytes. Two different

41
peaks represent the neutral (1715 cm-1) and ionic (1560 cm-1) form of PAA,
respectively.[221, 222] The peak at 1630 cm-1 corresponds to –NH3+ bending. For
(PVAm10/PAA4/PVAm10/MMT)5 film, the peak at 1671 cm-1 represents carbonyl groups,
originating from the unhydrolyzed amide groups in PVAm.[223, 224] For the
(PEI10/PAA4/PEI10/MMT)5 film, the neutral PAA peak (1715 cm-1) decreases as the pH
of PEI increases, which means the portion of ionized PAA (i.e., degree of ionization)
increases.[223] The PVAm10/PAA4/PVAm10/MMT QL shows a similar trend, with the
basic PVAm ionizing PAA. Figure 3.4(c) shows the FTIR spectra of both PEI and
PVAm-based 5 QL film with the polycation at pH 10. It is observed that PAA in PEI-
based quadlayers is almost fully ionized, because no peak or shoulder appears at 1715
cm-1. PVAm-based quadlayers, on the other hand, have a neutral PAA shoulder, which
suggests a lower degree of ionization. The difference in degree of ionization of PEI and
PVAm-based assemblies demonstrates a weaker PVAm/PAA interaction than PEI/PAA.
The lower degree of ionization in the PVAm-based QL suggests that there is less ionic
crosslinking inside the assembly, resulting in a lower density film, which explains the
larger thickness of PVAm-based assemblies at a low number of quadlayers.

42
Figure 3.4. FTIR spectra of 5QL (a) PEI10/PAA4/PEI10/MMT and (b)
PVAm10/PAA4/PVAm10/MMT at different polycation pH, and a combination of (c) both
assemblies at polycation pH 10.[184]
3.3.2. Nanobrick Wall Thin Film Structure
TEM cross-sectional images of (PVAm10/PAA4/PVAm10/MMT)5 and
(PEI10/PAA4/PEI10/MMT)5 are shown in Figure 3.5(a) and (b). The thickness observed
in these images verifies the result obtained from ellipsometry (Figure 3.2) and looks
strikingly similar to the schematic nanobrick wall structure (Figure 3.1) and a TEM cross

43
section from an earlier study.[197] The film in Figure 3.5(a) is a little thicker and has
some waviness due to stress relief during sectioning and the section being cut at a slight
angle. In this PVAm-based quadlayer, five clay layers can be clearly observed as dark
lines, which match the number deposited. For the PEI-based quadlayer (Figure 3.5(b)),
an ordered nanobrick wall structure is still observed, although it is difficult to identify
each clay layer. This TEM micrograph demonstrates that clay platelets deposit in a
highly oriented fashion, resulting in the excellent oxygen barrier behavior described in
the next section. AFM height images of (PVAm10/PAA4/PVAm10/MMT)5 and
(PEI10/PAA4/PEI10/MMT)5 are shown in Figure 3.5(c) and (d). The cobblestone-like
structure in both assemblies reveals that the platelets are tightly packed, which agrees
with previous studies of polymer-clay assemblies.[36, 110, 159, 197] It is this combination of
tight packing and near perfect orientation of clay platelets that produces low gas
permeability when these films are deposited onto thick plastic films (e.g., PET)
commonly used for packaging.
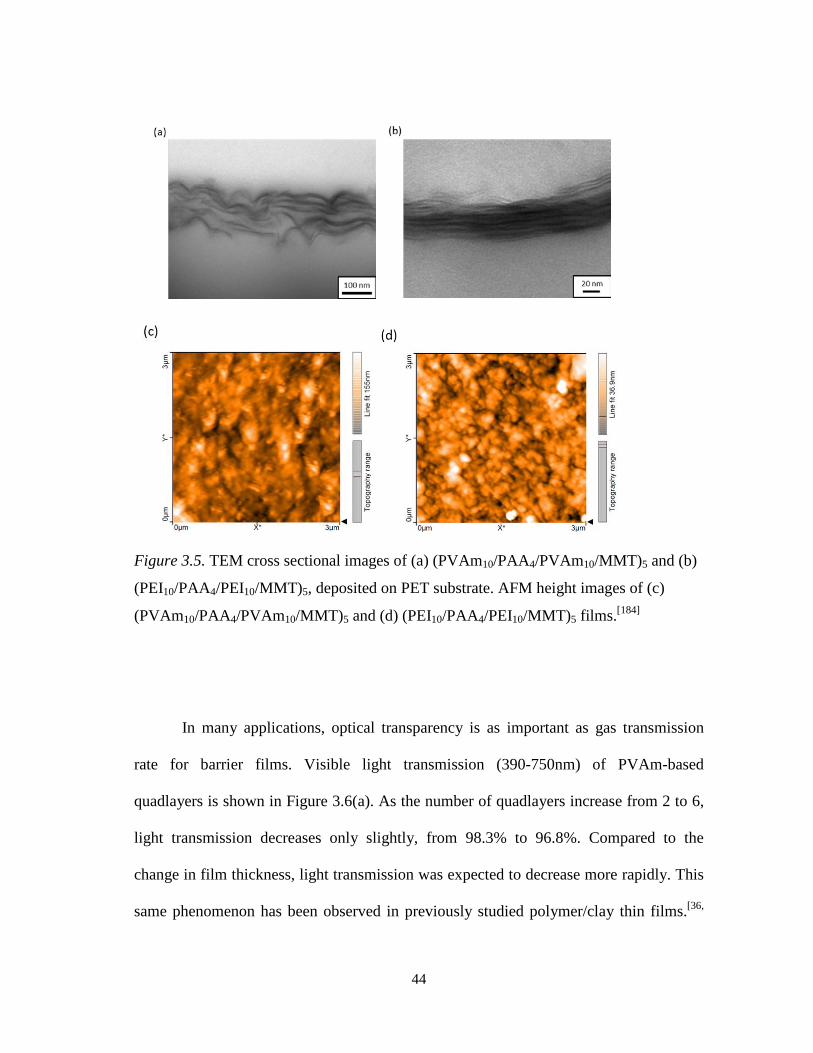
44
Figure 3.5. TEM cross sectional images of (a) (PVAm10/PAA4/PVAm10/MMT)5 and (b)
(PEI10/PAA4/PEI10/MMT)5, deposited on PET substrate. AFM height images of (c)
(PVAm10/PAA4/PVAm10/MMT)5 and (d) (PEI10/PAA4/PEI10/MMT)5 films.[184]
In many applications, optical transparency is as important as gas transmission
rate for barrier films. Visible light transmission (390-750nm) of PVAm-based
quadlayers is shown in Figure 3.6(a). As the number of quadlayers increase from 2 to 6,
light transmission decreases only slightly, from 98.3% to 96.8%. Compared to the
change in film thickness, light transmission was expected to decrease more rapidly. This
same phenomenon has been observed in previously studied polymer/clay thin films.[36,

45
110, 159] Such high transparency after 6 QL is likely due to the fact that clay platelets are
near perfectly aligned and well separated from each other through the film thickness, as
shown in Figure 3.5. Images of PVAm-based quadlayers on PET film, shown in Figure
3.6(b), reveal how transparent and defect free these nanobrick walls are over a
significant area (100 cm2). The LbL technique allows for high clay loading (>24wt %)
without the same clay aggregation issues associated with conventional polymer/clay
composite films.[225, 226]
Figure 3.6. (a) Visible light transmission as a function of wavelength for PVAm-based
QL on fused quartz slides. (b) Image of (PVAm10/PAA4/PVAm10/MMT)x thin films
deposited on 179μm PET.[184]

46
3.3.3. Oxygen Barrier of Quadlayer Assemblies
The nanobrick wall structure of these quadlayer assemblies creates an extremely
tortuous pathway that significantly extends a permeating molecule’s diffusion time.[159,
225, 226] Because the clay platelets are densely packed, they reroute the diffusion length
perpendicular to the thickness direction of the film, which lowers the gas transmission
rate.[227] Figure 3.7(a) shows the oxygen transmission rate (OTR) of PVAm-based
quadlayers coated on 179μm PET film. Though the OTR of a
(PVAm10/PAA4/PVAm10/MMT)2 coated PET film is similar to bare PET film (~8.6 cm3
m-2 day-1 atm-1), 3QL of this recipe is able to lower the OTR by two orders of magnitude,
while only increasing PET thickness ~0.04%. As the number of QL increases to six,
OTR decreases to 0.009 cm3 m-2 day-1 atm-1). Compared to other thin, clay-based barrier
films, this 6QL nanocoating is two orders of magnitude lower in both OTR and
thickness.[196, 228, 229] Additionally, this (PVAm10/PAA4/PVAm10/MMT)6 assembly has a
comparable thickness to SiOx nanocoatings, but one order of magnitude lower OTR.[230-
232] It is three orders of magnitude below the OTR of 25 μm thick EVOH film.[233] When
compared on the basis of permeability, which normalizes thickness, these quadlayers
have even better barrier. Figure 3.7(a) shows that permeability decreases as a function of
QL deposited on PET. Each new polymer and clay layer not only increases film
thickness, but also the residence time of permeating molecules due to a more tortuous
pathway. With an oxygen permeability of 3.7×10⁻²¹ (cm3(STP) cm cm-2 Pa-1 s-1)) for
(PVAm10/PAA4/PVAm10/MMT)6, this transparent, 175 nm thick coating has a
permeability comparable to metalized plastic film.[234, 235]

47
Figure 3.7. (a) Oxygen transmission rate and oxygen permeability as a function of
PVAm-based quadlayers deposited on 179μm PET. (b) Oxygen transmission rate as a
function of quadlayer recipe and number deposited on 179μm PET.[184]

48
Table 3.1. Oxygen transmission rate, film thickness, and clay concentration of quadlayer thin films deposited on 179 μm
PET.[184]
OTR
(cm3 m-2 day-1 atm-1) Film thickness (nm)
Clay
(wt%)
Oxygen Permeability
(10-16cm3(STP) cm cm-2 Pa-1 s-1)
Coatinga Total
179 μm PET
17.50
(PVAm10/PAA4/PVAm10/MMT)2 6.122 33.7 35.0 0.0169 12.52
(PVAm10/PAA4/PVAm10/MMT)3 0.164 64.4 27.5 0.00025 0.34
(PVAm10/PAA4/PVAm10/MMT)4 0.071 101.2 25.6 0.00017 0.15
(PVAm10/PAA4/PVAm10/MMT)5 0.014 145.4 24.6 0.000046 0.03
(PVAm10/PAA4/PVAm10/MMT)6 0.009 175.2 24.1 0.000037 0.02
(PEI10/PAA4/PVAm10/MMT)1-
(PVAm10/PAA4/PVAm10/MMT)2 0.037 51.3 40.4 0.000044 0.08
(PEI10/PAA4/PVAm10/MMT)1-
(PVAm10/PAA4/PVAm10/MMT)3 0.026 72.6 34.0 0.000043 0.06
(PEI10/PAA4/PEI10/MMT)3 2.267 28.3 48.6 0.002 4.64
(PEI10/PAA4/ PEI10/MMT)4 <0.005b 50.9 36.7 ≤0.000005 b ≤0.001 b
aThe quadlayer thin film permeability was decoupled from the total permeability using a previously described method.[229] bThe
low-end OTR detection limit for an Oxtran 2/21L module is 0.005 cm3 m-2 day-1 atm-1.

49
The OTR values of (PEI10/PAA4/PEI10/MMT)x,
(PVAm10/PAA4/PVAm10/MMT)x and (PEI10/PAA4/PVAm10/MMT)1-
(PVAm10/PAA4/PVAm10/MMT)x-1 at 3 and 4 QL are compared in Figure 3.7(b) and
Table 3.1. (PEI10/PAA4/PEI10/MMT)x is undetectable at 4QL while
(PVAm10/PAA4/PVAm10/MMT)x exhibits barrier performance that may be good enough
for food packaging, LEDs and photovoltaic encapsulation at just 3QL.[236] As for
(PEI10/PAA4/PVAm10/MMT)1-(PVAm10/PAA4/PVAm10/MMT)x-1 at 3 and 4 QL, OTR is
reduced by a factor of 4 (3QL) and 2 (4QL) compared to the PVAm-only assembly.
There are two contributing factors to the OTR difference in these systems. First, for a
constant number of QL, replacing PVAm with PEI causes more interdiffusion to occur at
the interface with PAA, which creates a denser film. This assertion is supported by the
FTIR results described earlier (Figure 3.4). Another factor is greater clay concentration
in the (PEI10/PAA4/PVAm10/MMT)1-(PVAm10/PAA4/PVAm10/MMT)x-1 assemblies, as
shown in Table 3.1. Assuming similar clay oreintation in all quadlayer systems,
evidenced by AFM and TEM images in Figure 3.5, it is reasonable to correlate lower
OTR with greater clay concentration.[36, 197] Cussler’s model[227] is used to qualitatively
explain the mechanism of our aligned, flake-filled membrane:
𝑃0𝑃
= 1 + 𝜇𝛼2( 𝜑2
1−𝜑) (3.1)
where P0, the polymer permeability, over P, the composite permeability, is a function of
the filler aspect ratio (𝛼), geometric factor (𝜇) and volume fraction in the composite (𝜑).
Additionally, the model is most consistent with the assumption that the filler loading is
‘semidilute’:[101]

50
𝜑 ≪ 1 (3.2)
𝛼𝜑 > 1 (3.3)
The predicted filler aspect ratios of (PVAm10/PAA4/PVAm10/MMT)4 ,
(PEI10/PAA4/PVAm10/MMT)1-(PVAm10/PAA4/PVAm10/MMT)3 and
(PEI10/PAA4/PVAm10/MMT)4 are 398, 542 and 752 (Table 3.2), respectively, which are
much larger than the experimentally measured aspect ratio (~ 166).[93] The primary issue
is that our films likely do not adequately meet the “semi-dilute” assumption of Cussler’s
model. Our filler volume fraction is only one order of magnitude smaller than 1, and 𝛼𝜑
is almost two orders of magnitude larger than 1, suggesting we are more filler-saturated
than the model assumes. It is also possible that overlap between adjacent clay platelets
creates a much larger effective aspect ratio. Nevertheless, the model does a good job of
qualitatively describing the behavior we observe.

51
Table 3.2. Oxygen permeability data of PVAm quadlayers and aspect ratio prediction.
Film thickness
(nm)
Volume Fraction of filler
Oxygen Permeability
(10-16cm3(STP) cm cm-2 Pa-1 s-1)
Cussler's aspect ratio predictiona
(PVAm10/PAA4)6 96.2
0.17
(PEI10/PAA4)6 369c 0.057c
(PVAm10/PAA4/PVAm10/MMT)4 101.2 0.12 0.00017 398
(PEI10/PAA4/PVAm10/MMT)1-
(PVAm10/PAA4/PVAm10/MMT)3 72.6 0.16 0.000043 542
(PEI10/PAA4/PVAm10/MMT)4 50.9 0.18 ≤0.000005b 752 aClay aspect ratio predicted from Cussler’s model. bThe low-end OTR detection limit
for an Oxtran 2/21L module is 0.005 cm3 m-2 day-1atm-1. c(PEI10/PAA4)6 results obtained
from our previous work.[184]
In the 4QL assemblies, barrier improves as more PVAm layers are replaced with
PEI, which results in a higher clay concentration. For the 3QL systems, the same trend is
observed in (PVAm10/PAA4/PVAm10/MMT)3 and (PEI10/PAA4/PVAm10/MMT)1-
(PVAm10/PAA4/PVAm10/MMT)2, however (PEI10/PAA4/PEI10/MMT)3 has the highest
OTR despite having the highest clay concentration. This exception is likely related to
clay spacing.[110] The PEI-based 3QL film is almost 50% thinner than other two systems,
resulting in a much smaller clay spacing of 4.6 nm. (PVAm10/PAA4/PVAm10/MMT)3
and (PEI10/PAA4/PVAm10/MMT)1 - (PVAm10/PAA4/PVAm10/MMT)2 have clay spacing
of 23.5 nm and 14.4 nm, respectively. Low OTR in LbL films seems to require a critical
combination of minimum clay concentration, spacing and layers.[159, 181, 197]

52
3.4 Conclusions
Quadlayer assemblies, deposited using the layer-by-layer technique, were used to
study how polyelectrolyte interdiffusion and clay concentration influence the gas barrier
behavior of these thin films. Positively-charged PEI and PVAm were combined with
negatively-charged PAA and MMT to generate ‘nanobrick walls’. Highly oriented clay
platelets, revealed with TEM and AFM, are the reason for the exceptional oxygen barrier
exhibited by these films. As the number of polymer-clay quadlayers increase, the OTR
of PVAm-based QL deposited on PET decreases. Rigid PVAm molecules cause
quadlayer growth to be linear rather than exponential, which occurs with more flexible
PEI. This results in thinner layers for PVAm and weaker interaction with PAA relative
to PEI. This weak interaction also seems to carry over to MMT, which results in lower
clay concentration for PVAm-based assemblies. This study confirms the importance of
polymer interdiffusion and clay concentration in reducing oxygen permeability in these
nanobrick wall structures. PVAm and PEI were combined to tailor OTR by controlling
these factors. It was found that simply switching the first PVAm layer to PEI
simultaneously lowers the OTR and film thickness. It is now possible to simultaneously
control OTR and thickness of a multilayer thin film barrier coating. This water-based
nanocoating technology offers tremendous opportunity in food packaging, gas separation
and protection of electronic devices.

53
CHAPTER IV*
SUPER HYDROGEN AND HELIUM BARRIER WITH POLYELECTROLYTE
NANOBRICK WALL THIN FILM
4.1 Introduction
Gas barrier layers have found broad application for a variety of packaging
applications for the food/pharmaceutical,[237] flexible electronics[238] and fuel cell[239]
industries. These films often require a combination of low permeability, optical
transparency, mechanical strength and flexibility.[240] Current barriers include metallized
films,[241] SiOx coatings[242] and polymer composites.[243] While these materials offer
excellent barrier properties, they often suffer from poor substrate adhesion, undesirable
optical quality and limited flexibility.[244] In contrast, LbL assemblies prepared with clay
nanoplatelets have proven capable of overcoming all of these limitations.[180, 245-247]
These nanobrick wall thin films have demonstrated undetectable oxygen transmission
rate (OTR<0.005 cm3 m-2 day-1 atm-1) that rivals metallized films.[110] Additionally, this
technology can be applied by spraying[248] or using a continuous immersion process.[249]
Hydrogen (H2) is a key feedstock for the manufacture of petrochemicals,
ammonia and methanol,[250] with H2 corrosion and/or embrittlement of process
equipment remaining a significant safety concern.[251] Conformal H2 barrier coatings
*Reprinted with permission from “Macromolecular Rapid Communication” by Tzeng, P.; Lugo, E. L.; Mai, G. D.; Wilhite, B. A.; Grunlan, J. C. “Super Hydrogen and Helium Barrier with Polyelectrolyte Nanobrick Wall Thin Film” Macromol. Rapid Comm. 2015, 36, 96-101, Copyright [2015] by John Wiley and Sons.

54
would allow an extension of process equipment lifetime while reducing the risk of
equipment failure owing to prolonged H2 exposure. The wide flammability window and
low ignition temperature for H2 combine with an extremely high solid-state mobility, in
both metallic and polymeric materials, to necessitate the use of thick-walled metallic
containers for safe transport and storage of industrial scale H2.[247] Recent growth in H2-
driven fuel cell technologies, offering high efficiencies and zero point-of-use emissions
for portable, household and vehicular power generation necessitates breakthroughs in
size and weight reduction for H2 storage and transmission equipment,[252-254] which may
be achieved through development of polymer nanocomposite barrier coatings.
Helium (He) is widely used in the manufacturing sector for leak detection[255, 256]
and as an inert gas blanket for high-temperature welding[257] and reactive chemical
storage.[258] It is also used in the medical sector as a cryogenic for magnetic resonance
imaging (MRI) tools.[259, 260] Additionally, He and H2 provide an excellent source of lift
for lighter-than-air vehicles (for meteorological and aviation use).[261] Despite being the
second-most abundant element in the universe, terrestrial supplies of helium continue to
dwindle as released gas is sufficiently buoyant to escape the atmosphere.[262] This non-
renewable nature of terrestrial He requires further advances in He-barrier film
technologies to ensure the continued sustainability of manufacturing and medical
industries. A high barrier thin film could allow He and H2 to be stored, at least
temporarily, in relatively lightweight polymeric containers.
Commercial He gas barriers currently employ aluminized polyurethane or
polyolefin/polyester that are capable of providing low He permeability (10-300 cm3 mm

55
m-2 day-1 atm-1),[263, 264] but are produced using complex process conditions, have poor
optical properties and potential health hazards. Metallization of polymeric films requires
ultra-high vacuum and high temperature conditions, resulting in a complex and energy-
intensive process. Aluminum nanocoatings are typically opaque and often have adhesion
problems, which further limits their applicability.[116] These films also pose
environmental and health concerns, as aluminum can contaminate the environment
through both water or airborne transmission.[116] Current materials employed to fabricate
H2 gas barriers include ethylene vinyl-alcohol (EVOH) copolymer and
polyester/nanoflake composites, with reported permeabilities of 0.1-3.1 cm3 mm m-2 day-
1 atm-1.[247, 265, 266] Unfortunately, EVOH copolymers are plasticized in the presence of
moisture, irreversibly altering morphology and creating increased free volume and
permeability.[267] Polymer/nanoflake film properties remain difficult to control owing to
both nanoflake dispersion and exfoliation during processing.
In the present work, a polymer/clay composite thin film, fabricated via layer-by-
layer assembly, is investigated as a H2 and He gas barrier. The simplicity of the LbL
assembly technique, as compared to current films employed for He and H2 barrier, make
it an attractive alternative. The present quadlayer (QL) system was prepared by
repeatedly depositing polyethylenimine (PEI), poly(acrylic acid) (PAA), PEI, and
montmorillonite (MMT) clay (Figure 4.1a and 1b). This system was previously
investigated for its super oxygen barrier,[66] but barrier to light gases (i.e., hydrogen and
helium) was very unexpected. Highly aligned and impermeable clay platelets create an
extremely tortuous pathway, consisting primarily of diffusion perpendicular to the film

56
surface, extending permeate retention times and reducing even light gas transmission
rate.[227, 268]
Figure 4.1. (a) Schematic of the quadlayer assembly process. (b) Materials used and
cross-sectional illustration of the thin film structure. (c) Film growth as a function of
quadlayers deposited. (d) Mass as a function of quadlayers deposited.[269]

57
4.2 Experimental
4.2.1. Materials
Branched polyethylenimine (Aldrich, St. Louis, MO) (MW ~ 25,000 g mol-1) is a
cationic polymer that was dissolved into 18.2 MΩ deionized water to create 0.1 wt%
solutions. The pH was adjusted from its unaltered value (~10.5) to 10 by adding 1.0 M
hydrochloric acid (HCl). Poly(acrylic acid) (Aldrich) (MW ~ 100,000 g mol-1) is an
anionic polymer that was prepared as a 0.2 wt% solution with deionized water. The pH
of PAA was adjusted from its unaltered value (~3.1) to 4 by adding 1.0 M sodium
hydroxide (NaOH). Anionic natural sodium montmorillonite (MMT) (trade name
Cloisite Na+) (Southern Clay Products, Inc., Gonzales, TX) clay was prepared as a 1
wt% aqueous suspension. This suspension of high aspect ratio nanoplatelets (l d-1 is 80
to 300)[201] was used at its natural pH (~9.7). The aqueous solutions were used to grow
barrier film on a 51 µm (trade name Trycite 8001) polystyrene substrate (Dow, Midland,
MI).
4.2.2. Layer-by-Layer Deposition
The PS substrate was rinsed with deionized water and methanol before use, then
plasma-treated with a ATT0 Plasma Cleaner (Thierry Corp., Royal Oak, MI). Plasma
treatment improves adhesion of the first polyelectrolyte layer by oxidizing the film
surface.[202] The substrate was first dipped into the PEI solution for 5 minutes, followed
by rinsing with deionized water for 30 seconds and drying with a stream of filtered air.
After the first positively-charged layer was adsorbed, the substrate was dipped into PAA

58
solution for another 5 minutes, followed by another rinsing and drying cycle. The
substrate was then dipped into PEI and MMT solutions to form one “quadlayer”.
Starting from the second deposition cycle, the remaining layers were deposited using one
minute dip times. This process was carried out using home-built robotic systems.[203, 204]
The pH of PEI and PAA is shown as a subscript next to the initials in the figures and text.
For example, one quadlayer of PEI(pH=10)/PAA(pH=4)/PEI(pH=10)/MMT(unaltered
pH of 9.7) is abbreviated as (PEI10/PAA4/PEI10/MMT)1.
4.2.3. Thin Film Characterization
Assembly thickness on silicon wafers was measured every quadlayer with a
PHE-101 Discrete Wavelength Ellipsometer (Microphotonics, Allentown, PA) in
absorbance mode, using a 632.8 nm laser at an incidence angle of 65°. Mass increments
were measured each layer with a Research Quartz Crystal Microbalance (QCM) (Inficon,
East Sycrase, NY) using a frequency range of 3.8 - 6 MHz. The 5 MHz quartz crystal
was inserted in a holder and dipped into the solutions. After each deposition, the crystal
was rinsed and dried and then left on the microbalance to stabilize for 5 minutes. Cross-
sections of the quadlayer assemblies were imaged with a Tecnai F20 TEM (FEI,
Hillsboro, OR), operated at 200 kV. Samples were prepared for imaging by embedding a
piece of coated PET in epoxy prior to sectioning it with a diamond knife.
4.2.4. Gas Permeation System
Gas permeability coefficients of H2 and He were measured using a constant-
volume, variable-pressure method. Permeate flux was measured through a membrane by

59
monitoring the pressure increase, in a closed vessel, using a pressure transducer. The
film was mounted in a permeation cell and the upstream and downstream volumes were
evacuated to de-gas the film. The valve connecting the permeation cell to the vacuum
pump was then closed and a measurement of the vacuum leak rate in the downstream
side was taken. Once the leak rate was determined, feed gas was introduced into the
upstream side of the membrane and the pressure rise as a function of time in the
downstream side was recorded. Gas permeabilities PA (cm3 (STP) cm cm-2 s-1 cmHg-1)
were calculated using the steady state pressure increase in a fixed downstream volume
as:[270]
𝑃𝐴 = 𝑉𝑜𝑙𝑏2𝐴𝑅𝑔𝑇
��𝑑𝑏1𝑑𝑑�𝑠𝑠− �𝑑𝑏1
𝑑𝑑�𝑙𝑙𝑙𝑙
� (4.1)
where Vd is the downstream volume in cm3, l is the film thickness in cm, p2 is the
upstream absolute pressure in cmHg, A is the film area available for gas transport in cm2,
Rg is the gas constant, T is the absolute temperature in Kelvin and (dp1/dt)ss and
(dp1/dt)leak are the steady state rates of pressure increase in the downstream volume at a
specific upstream pressure and under vacuum. The vacuum leak rate (dp1/dt)leak was less
than 5% of steady state pressure increase rate (dp1/dt)ss.
The permeation cell is a 47 mm HP Filter Holder (Millipore, Billerica, MA, USA)
with an area of 9.6 cm2. The downstream pressure was always kept below 10 Torr in
order to maintain an effectively constant pressure difference across the membrane. The
pressure rise in the downstream volume was monitored using a Baratron 626B 100 Torr
capacitance manometer (MKS, Andover, MA, USA). The calibrated downstream
volume was 306 cm3. A relief valve was used to prevent the downstream pressure from

60
increasing above one atmosphere. This was necessary to prevent accidental over-
pressurization of the transducer in the event of membrane rupture. The upstream
pressure was varied between 4 – 6 atm and was measured using a PX409-250 pressure
transducer (Omega Engineering, Stamford, CT USA). Measurements were carried out at
room temperature using UHP grade gases. Swagelok VCR connections and VCO needle
valve were used for downstream connections to minimize leaks. In order to achieve
proper measurements, the leak maximum rate was kept below 10% steady state pressure
increase rate (dp1/dt)ss for the gas being tested.
4.3 Results and Discussion
4.3.1. Multilayer Film Growth
Unlike most LbL systems, which grow linearly, the exponential growth shown in
Figure 4.1c is attributed to interdiffusion of the weak polyelectrolytes in this quadlayer
assembly.[51, 63, 66, 184] The thin growth observed in the first few QL is strongly affected
by the substrate, suggesting the deposited materials may not have full coverage during
this ‘island growth’ period.[184, 271] After the initial growth, interdiffusion of PEI and
PAA takes over because both are in their low charge state at pH 10 and pH 4,
respectively. Clay concentration decreases as the number of QL increases, as shown in
Table 4.1 and Figure 4.1d, attributed to the additional PEI and PAA deposited through
interdiffusion.

61
4.3.2. Nanobrick Wall Thin Film Structure
Figure 4.2 shows TEM cross-sectional images of PEI/PAA/PEI/MMT assemblies,
showing how clay concentration decreases at higher numbers of quadlayers. The dark
lines in Figure 4.2a represent individual platelets, revealing that they are oriented
parallel to the substrate and well exfoliated. Although clay is deposited five times in this
5 QL film, more than five clay layers are observed. Both exfoliated platelets and
intercalated stacks can been seen, similar to the results found in other studies.[51, 66] The
10 QL film shows similar structure to the 5 QL film in the initial quadlayers (Figure
4.2b), but later exhibits increasing clay spacing (Figure 4.2c). The spacing reaches ~150
nm in the final quadlayers, suggesting a decreased clay concentration. Based on these
images, it appears that the interdiffusion of PEI and PAA is able to expand the clay
stacks and diffuse through the layers of platelets. These TEM images confirm that a
nanobrick wall structure is generated by this LbL deposition (Fig. 4.2).
Figure 4.2. TEM cross-sectional images of (a) 5 and (b) (c) 10 PEI/PAA/PEI/MMT QL.
(b) is the portion of the film closest to the PS substrate, while (c) is furthest away. The
white scale bar in each figure represents 50 nm.[269]

62
Figure 4.2. Continued.
4.3.3. Gas Barrier of Quadlayer Assemblies
Figure 4.3 shows H2 and He permeability of quadlayer assemblies on a 51 μm
polystyrene film. The overall He and H2 permeability is observed to decrease by three
orders of magnitude relative to the bare substrate, while the overall film thickness
increases by only 0.2% (Table 4.1). Increasing the number of QL from 5 to 10 does not
improve the barrier properties. This lack of improvement may be attributed to the
dramatically expanded clay spacing and associated concentration reduction (as
confirmed by analysis of growth profiles and film morphology in Figures 4.1c and 4.2,
respectively), which diminishes the tortuous path afforded by the nanobrick wall
structure. The 5 QL nanocomposite, with a thickness of 122 nm, exhibits a H2
permeability one order of magnitude lower than laminated EVOH film,[265] and a He
permeability three orders of magnitude lower than metallized polyolefin/polyester.[263]

63
Figure 4.3. Permeability of (a) hydrogen and (b) helium as a function of quadlayers
deposited on a 51 μm polystyrene substrate.[269]
Table 4.1. Permeability, film thickness, and clay concentration of quadlayer assemblies
deposited on 51 μm polystyrene.
Film Thickness
(nm)
Clay loading (wt%)
Transmission Rate Permeability (cm3 m-2 day-1 atm-1) (cm3 mm m-2 day-1 atm-1)
H2 He H2 He PS
31000 27000 1600 1400
3QL 48.6 54.9 170 320 8.7 16 5QL 122 34.7 69 71 3.5 3.6 10QL 1564.8 26.8 71 78 3.7 4.1
4.4 Conclusions
In summary, the present study represents the first demonstration of a layer-
by-layer deposited film with low hydrogen and helium permeability. The
impermeable clay platelets, together with highly interdiffused PEI and PAA
mortar, formed a nanobrick wall structure that imparts significant light gas barrier.

64
Permeability of both hydrogen and helium decreased as the number of quadlayers
increased, showing one to three orders of magnitude improvement compared to
commercial barriers. The uniqueness of this polymer/clay barrier thin film is due
to the high clay loading and strong ionic interactions between polyelectrolytes.
The excellent performance of this thin film, combined the simplicity of layer-by-
layer deposition, makes this light gas barrier coating an exciting opportunity for
several packaging and protective applications.
65
CHAPTER V
IMPROVED GAS BARRIER/SEPARATION OF GRAPHENE OXIDE-BASED
MULTILAYER THIN FILMS
5.1 Introduction
Improving gas barrier in packaging films is an ongoing endeavor. For the past
two decades, technologies such as SiOx, composite films and metallized plastic films
have been successfully used to protect various items (food, electronics, etc.) from
oxygen and moisture.[16, 95, 127, 230, 243, 272-276] In many cases, these barrier solutions require
complex processing conditions,[277, 278] exhibit poor optical and/or mechanical
behavior,[279, 280] and/or suffer from pinholes.[232, 277, 280] Additionally, metal applied by
vapor deposition can also pollute the environment and negatively impact human
health.[279] More recently, super gas barrier thin films have been deposited from water
using layer-by-layer (LbL) assembly.[64, 180, 197] These environmentally-friendly
nanocoatings overcome many of the limitations described for more traditional gas
barriers.
High gas barrier is most often realized by using clay as one of the ingredients. [89-
91] The electrostatic interaction between polyelectrolyte and clay forces the platelets to
deposit in a highly oriented fashion, creating a long tortuous pathway that reduces gas
permeability,[159] but the presence of hydrophilic polymers causes plasticization in the
presence of moisture, resulting in an increase in gas permeability.[281] More hydrophobic
platelets, such as graphene, have been examined to reduce this moisture sensitivity.[282,

66
283] Two dimensional graphene (sp2 carbon atom) possesses excellent electrical,[284, 285]
mechanical[286, 287] and thermal properties,[288] making it an interesting platelet for LbL
assembly. Considering the difficulty to exfoliate graphene, due to its strong van der
Waals interactions, graphene oxide (GO) is a more appealing starting material.[289, 290]
The hydroxyl and carboxyl groups on the GO surface enable aqueous deposition through
electrostatic or hydrogen bonding (see structure in Figure 5.1 (b)).[291] In most cases, GO
is paired with a cationic material to create a “bilayer” (BL) assembly.[183, 247] These
multilayer assemblies exhibit low gas permeability, but contain a high GO concentration
(~90 wt%),[65] which is costly and produces strongly colored films.
In the present study, chitosan (CH) and poly(acrylic acid) (PAA) were used to
fabricate a “quadlayer” (QL) assembly with graphene oxide. Discrete, equally spaced
layers of polymer and GO were observed in a TEM cross-section of the film, indicating
linear growth. The single polymer layer between GO is now replaced by an interdiffused
polymer matrix. The pH deviation between CH and PAA not only influences degree of
ionization of PAA, but creates a denser polymer layer. A 5 CH/PAA/CH/GO QL film (<
50 nm) exhibits an oxygen permeability of 3.9 ×10⁻²⁰ cm3 cm cm-2 Pa-1 s-1 under dry
conditions. This barrier can be maintained in a high humidity environment after
thermally reducing graphene oxide. It was discovered that this reduced GO assembly
could also separate gas molecules with different sizes. With a H2/CO2 selectivity of 215,
this thin film membrane outperforms most known separation membranes. The
advantages of this quadlayer assembly, including its low GO concentration (< 50 wt%)

67
and excellent barrier/separation behavior, make it a promising system for packaging
(food, pharmaceuticals and electronics) and gas separation.
5.2 Experimental
5.2.1. Materials
Cationic chitosan (Mw 60,000 g mol-1, degree of deacetylation 95%) (G.T.C. Bio
Corp., Qingdao, China) was dissolved into 18.2 MΩ deionized water to create a 0.1 wt%
solution. pH was adjusted to 3.5, 4.5 and 5.5 using a previously described method.[292]
Anionic poly(acrylic acid) (Mw 100,000 g mol-1) (Sigma-Aldrich, Milwaukee, WI) was
used to make a 0.2 wt% solution that pH was adjusted to 3, 4 and 5. All pH values were
adjusted by adding 1.0 M hydrochloric acid (HCl) or 1.0 M sodium hydroxide (NaOH).
Graphene oxide (aspect ratio 300-800) (CheapTubes, Brattleboro, VT) was exfoliated in
deionized water via sonication (10W) for 10 minutes with a MISONIX XL-2000 tip
sonicator (Qsonica, Melville, NY). A 0.1 wt% graphene oxide suspension was used as an
anionic component at its natural pH (~3.2).
5.2.2. Substrates
Single-side-polished (100) silicon wafers (University Wafer, South Boston, MA)
were used as substrates for ellipsometry and scanning electron microscopy (SEM).
Ti/Au quartz crystals, with a resonance frequency of 5 MHz, were purchased from
Maxtek Inc. (Cypress, CA) and used as deposition substrates for quartz crystal
microbalance (QCM) characterization. Silicon wafers were cleaned with a 3:1 ratio of
30% hydrogen peroxide to 99% sulfuric acid and stored in deionized water. These

68
substrates were then rinsed with acetone and deionized water before use. Caution:
Piranha solution reacts violently with organic material therefore needs to be handled
properly. 179 µm thick poly(ethylene terephthalate) (PET) film (trade name ST505,
Dupont–Teijin) was purchased from Tekra (New Berlin, WI). PET was rinsed with
deionized water and methanol, then corona-treated with a BD-20C Corona Treater
(Electro-Technic Products Inc., Chicago, IL) to impart a strong negative surface charge.
5.2.3. Layer-by-Layer Deposition
Figure 5.1 illustrates the layer-by-layer assembly procedure. A layer of CH was
first deposited by dipping the substrate into the solution for 5 minutes, followed by
rinsing with deionized water for 30 seconds and drying with a stream of filtered air. The
substrate was then dipped into PAA solution for another 5 minutes, followed by another
rinsing and drying cycle. The quadlayer was completed with one more layer of CH and
GO. Starting from the second deposition cycle, the remaining layers were deposited
using one minute exposures to each solution. This process was carried out with home-
built robotic systems.[204, 293] pH of CH and PAA are shown as a subscript next to their
initials in the figures and text. For example, one quadlayer of
CH(pH=5.5)/PAA(pH=3)/CH(pH=5.5)/GO (unaltered pH of 3.2) is abbreviated as
(CH5.5/PAA3/CH5.5/GO)1. Quadlayer assemblies were heated at 175 ºC for 90 minutes to
convert GO into reduced-GO (rGO).

69
Figure 5.1. Illustration of (a) LbL process (b) materials used and (c) nanobrick wall
structure built from chitosan/poly(acrylic acid)/chitosan/graphene oxide quadlayers.
5.2.4. Thin Film Characterization
Film thickness was measured every quadlayer with a PHE-101 Discrete
Wavelength Ellipsometer (Microphotonics, Allentown, PA), using a 632.8 nm laser at an
incidence angle of 65º. FTIR spectra of LbL films were measured with a Bruker Optics
ALPHA-P 10098-4 spectrometer in ATR mode. Origin software was used to
deconvolute PAA peaks in its protonated (COOH) and ionic (COO-) forms to derive
degree of ionization (DOI), as described in our previous study.[294] To avoid the
absorbance peaks of the silicon oxide substrate and carboxylic acid of GO, 100 bilayers
(BL) of CH/PAA (~1.5 µm) were used for FTIR analysis. Cross-sections of the
quadlayer assemblies were prepared by embedding the film in Epofix resin (EMS,
Hatfield, PA) overnight, followed by cutting with an Ultra 45º diamond knife (Diatome,

70
Hatfield, PA). Sections were imaged with a Tecnai G2 F20 TEM (FEI, Hillsboro, OR),
operated at 200 kV. Surface structure of the coated silicon wafers were imaged with a
JSM-7500F JEOL field-emission scanning electron microscope (FESEM, Tokyo, Japan).
OTR testing was performed by MOCON (Minneapolis, MN) in accordance with ASTM
D-3985,[207] using an Mocon Oxtran 2/21 ML instrument at 23 ºC and 0% (or 100%) RH.
Permeation of H2 and CO2 were tested via Mocon Multi-Tran 400 and Permatran C4/41
instruments at 23 ºC and 0% RH (according to ISO 15105 and ASTM F2476-05).[295, 296]
Carbon bonding was characterized with a PHI Quantera XPS (ULVAC-PHI, Chanhassen,
MN).
5.3 Results and Discussion
5.3.1. Film Growth
Figure 5.2 shows the thickness of chitosan/poly(acrylic acid)/chitosan/graphene
oxide quadlayers under varying pH combinations. The linear growth observed in these
assemblies is verified by the cross-sectional TEM image (Figure 5.2(c)). The contrast
between polymer and GO is low due to the low electron density in both, so resolution is
sacrificed in order to distinguish the two. The five dark lines in this TEM image
represent GO layers deposited, clearly showing this film to have a highly oriented
structure. Not only does the thickness of the (CH5.5/PAA3/CH5.5/GO)5 film measured by
TEM (~44 nm) agree with ellipsometry, GO spacing derived from the electron signal
profile (GO located at 6, 13, 21, 27 and 33 nm in Figure 5.2(d)) also confirms linear
growth. Figure 5.3 showed mass deposited for these quadlayer recipes, with a linear

71
trend similar to the ellipsometry results. Concentration of GO in these 5QL films were
listed as well, all of them showing a GO concentration ~48% except for
CH5.5/PAA5/CH5.5/GO. The low GO concentration of CH5.5/PAA5/CH5.5/GO was seen in
the SEM images and will be presented in the following section.
Figure 5.2. Thickness of CH/PAA/CH/GO as a function of quadlayers deposited with
varying (a) pH of CH and (b) pH of PAA. (c) Film growth of CH5.5/PAA3/CH5.5/GO
compared with TEM cross-section of 5QL film. (d) Electron signal profile scanned
through the white dotted section in (c). Valley points indicate position of GO layers.

72
(a) (b)
(c) (d)
(e)
Figure 5.3. Mass as a function of quadlayers deposited: (a) CH3.5/PAA3/CH3.5/GO (b)
CH4.5/PAA3/CH4.5/GO (c) CH5.5/PAA3/CH5.5/GO (d) CH5.5/PAA4/CH5.5/GO and (e)
CH5.5/PAA5/CH5.5/GO. Concentration of GO (5 QL) is listed as well.

73
The variation of thickness per QL increment with pH, from 4.8 to 11.0 nm per
QL, is caused by changes in conformation of the polyelectrolytes. For the
CH5.5/PAA5/CH5.5/GO and CH3.5/PAA3/CH3.5/GO assemblies, CH and PAA have similar
pH, suggesting that one of the polyelectrolyte is in a lower charged state (CH at pH 5.5
or PAA at pH3) with a globular conformation to achieve thicker growth in the former.
The counter polyelectrolyte (PAA at pH 5 or CH at pH 3.5), being highly ionized, has a
linear chain conformation due to the electrostatic self-repulsion.[198] With only a small
change in environmental pH, the counter polyelectrolyte remains highly ionized, so the
deposited polymer layer is thin. On the other hand, CH5.5/PAA3/CH5.5/GO starts the
deposition in a pH 5.5 solution. This partially charged chitosan is deposited onto the
substrate with a globular conformation.[198] During PAA deposition, amine groups of CH
not involved in bonding to the substrate (or preceding layer) are likely to be ionized
because of the acidic environment, creating additional positive charges. In this case,
poly(acrylic acid) with only a few ionized carboxylic acid groups is also adsorbed in a
globular chain conformation. This same process occurred again for the second CH
deposition. Deposition of globular, lowly charged chains is the reason for the thickness
increment to increase 100% relative to assemblies prepared with similar CH and PAA
pH. The transition of polyelectrolytes from solution to multilayer film not only changes
pKa (pKa of CH increased and pKa of PAA decreased), but the degree of ionization
increases as well,[206] which will be discussed later. The additional charges generated
during each deposition step also serves to attract more polyelectrolytes into the assembly,
forming an interpenetrating network known as a “scramble salt” structure.[297] Formation

74
of scramble salt will influence barrier properties as well and will be elaborated in the
following paragraphs.
5.3.2. Film Morphology
SEM images of 1 QL assembly surfaces are shown in Figure 5.4. The wrinkles
confirm the presence of GO and these images suggest GO deposition is uniform over the
surface. By fixing the pH of CH at 5.5, the level of wrinkling diminishes as the pH of
PAA increases. In CH5.5/PAA5/CH5.5/GO, there are few observable wrinkles, suggesting
less GO coverage. When the pH of PAA is held constant at 3, increasing CH pH from
3.5 to 5.5 does not change the coverage of GO very much. The same trends are also
found in the gas barrier of these films (i.e., greater GO coverage correlates to reduced
oxygen permeability).

75
Figure 5.4. SEM surface images of one quadlayer of (a) CH3.5/PAA3/CH3.5/GO (b)
CH4.5/PAA3/CH4.5/GO (c) CH5.5/PAA3/CH5.5/GO (d) CH5.5/PAA4/CH5.5/GO and (e)
CH5.5/PAA5/CH5.5/GO.

76
As mentioned earlier, the interaction between chitosan and poly(acrylic acid)
generates a scramble salt structure through interdiffusion and ionization.[199, 200] FTIR
spectra of CH/PAA assemblies, shown in Figure 5.5, were used to compare the degree of
interdiffusion. Degree of ionization of PAA was derived by dividing peak area of its
ionic form (COO-) by the total area of ionic and protonated form (COOH), which are
1550 and 1715 cm-1, respectively. The peak at 1650 cm-1 in these spectra represents
primary amine (NH2) bending of chitosan.[298, 299] For CH3.5/PAA3 and CH5.5/PAA5, DOI
is less than 40% because CH and PAA are at similar pH. In this case, the highly charged
polyelectrolyte (CH at 3.5 or PAA at pH 5) is unable to ionize the counter ion. As the
difference in pH increases to 1.5, as it does for CH4.5/PAA3 and CH5.5/PAA4, there is
greater ability for the two polymers to interdiffuse and lock in the structure by inducing
an increased ionization. When the pH difference is 2.5, as it is for CH5.5/PAA3, the
initially low-charged polyelectrolytes highly interdiffuse and then highly ionize one
another. This creates a dense polymer layer and also facilitates deposition of GO, both of
which impart gas barrier.

77
Figure 5.5. FTIR spectra of (a) (CH3.5/PAA3)100 (b) (CH4.5/PAA3)100 (c) (CH5.5/PAA3)100
(d) (CH5.5/PAA4)100 and (e) (CH5.5/PAA5)100.

78
5.3.3. Gas Barrier and Separation
Oxygen transmission rates (OTR) for quadlayer films assembled with varying pH
are summarized in Table 5.1. All of the 5QL nanocoatings improved the oxygen barrier
of the PET substrate (OTR = 8.4 cm3 m-2 day-1atm-1). Oxygen transmission rate
decreases as the pH difference between CH and PAA increases in these assemblies, with
(CH5.5/PAA3/CH5.5/GO)5 exhibiting the lowest OTR (~0.34 cm3 m-2 day-1atm-1). This 48
nm coating reduced OTR by a factor of more than 20 because both low-charged
polyelectrolytes ionized one another during extensive interdiffusion, forming a highly
dense layer with uniform coverage by GO platelets. By tailoring assembly structure with
deposition pH, oxygen permeability as low as 3.9 ×10⁻²⁰ cm3 cm cm-2 Pa-1 s-1 is achieved.
This value matches SiOx and is two orders of magnitude lower than 25µm ethylene-vinyl
alcohol film, another commonly used oxygen barrier.[230, 231, 233]
Table 5.1. Oxygen transmission rate and permeability of five quadlayer assemblies on
179 µm PET film.
Assembly OTR (Total) (cm3 m-2 day-1 atm-1)
P (Film) (10-19 cm3 cm-1 cm-2 Pa-1 s-1)
Film thickness
(nm) (CH3.5/PAA3/CH3.5/GO)5 1.23 1.0 30.9 (CH4.5/PAA3/CH4.5/GO)5 1.18 1.3 41.2 (CH5.5/PAA3/CH5.5/GO)5 0.34 0.39 47.5 (CH5.5/PAA4/CH5.5/GO)5 1.33 1.3 35.2 (CH5.5/PAA5/CH5.5/GO)5 4.03 4.3 24.5
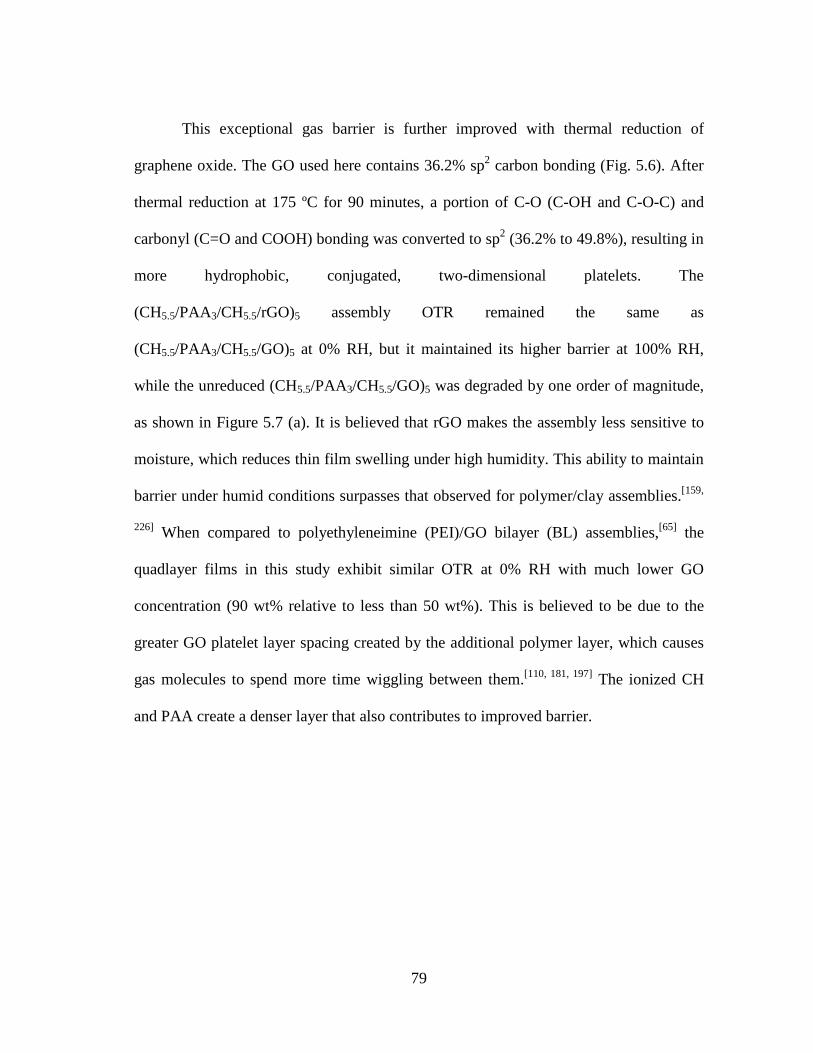
79
This exceptional gas barrier is further improved with thermal reduction of
graphene oxide. The GO used here contains 36.2% sp2 carbon bonding (Fig. 5.6). After
thermal reduction at 175 ºC for 90 minutes, a portion of C-O (C-OH and C-O-C) and
carbonyl (C=O and COOH) bonding was converted to sp2 (36.2% to 49.8%), resulting in
more hydrophobic, conjugated, two-dimensional platelets. The
(CH5.5/PAA3/CH5.5/rGO)5 assembly OTR remained the same as
(CH5.5/PAA3/CH5.5/GO)5 at 0% RH, but it maintained its higher barrier at 100% RH,
while the unreduced (CH5.5/PAA3/CH5.5/GO)5 was degraded by one order of magnitude,
as shown in Figure 5.7 (a). It is believed that rGO makes the assembly less sensitive to
moisture, which reduces thin film swelling under high humidity. This ability to maintain
barrier under humid conditions surpasses that observed for polymer/clay assemblies.[159,
226] When compared to polyethyleneimine (PEI)/GO bilayer (BL) assemblies,[65] the
quadlayer films in this study exhibit similar OTR at 0% RH with much lower GO
concentration (90 wt% relative to less than 50 wt%). This is believed to be due to the
greater GO platelet layer spacing created by the additional polymer layer, which causes
gas molecules to spend more time wiggling between them.[110, 181, 197] The ionized CH
and PAA create a denser layer that also contributes to improved barrier.

80
Figure 5.6. C1s XPS spectra of (a) graphene oxide and (b) thermally reduced graphene
oxide.
Figure 5.7. (a) Oxygen transmission rate of (CH5.5/PAA3/CH5.5/GO)5 on PET, under 0%
and 100% RH. (b) Hydrogen and (c) carbon dioxide transmission rate of
(CH5.5/PAA3/CH5.5/GO)5 on PET under 0% RH.

81
These same quadlayer assemblies can separate gases based on molecular size.
Figure 5.7 shows hydrogen (H2TR) and carbon dioxide (CO2TR) transmission rates
measured at 23 ºC and 0% RH. While H2TR was reduced ~40% for GO and rGO films,
CO2TR was reduced from 25% to 97%, compared to the bare PET substrate, after
thermal reduction. The more two-dimensional nature of rGO decreased the gaps between
adjacent platelets and was enough to slow CO2 transport. Figure 5.8 shows the
separation of 5QL CH5.5/PAA3/CH5.5/GO assemblies before and after thermal reduction.
Quadlayer separation performance is placed in context with the Robeson’s upper-bound
limit[20, 21] and many of the best mixed matrix membranes (MMM), zeolitic imidazolate
frameworks (ZIFs) and metal organic frameworks (MOFs).[195] The quadlayer H2/CO2
selectivity (α) increases from 5 to 215 after reducing GO, which outperforms the new
Robeson’s upper-bound limit (trade-off between gas permeability and selectivity, which
is determined by sizes and condensabilities of gas pair).[21] This high H2/CO2 selectivity
suggests that the pore structure in this assembly (a combination of CH/PAA matrix free
volume and voids between GO platelets) creates a size-selective film that is able to
separate gas molecules smaller than H2 (2.89 Å) and larger than CO2 (3.30 Å).[300]
Excellent separation and low energy consumption should make these quadlayer films
useful for applications requiring hydrogen recovery,[301] ammonia purge gas recovery[302]
and carbon dioxide removal.[303]
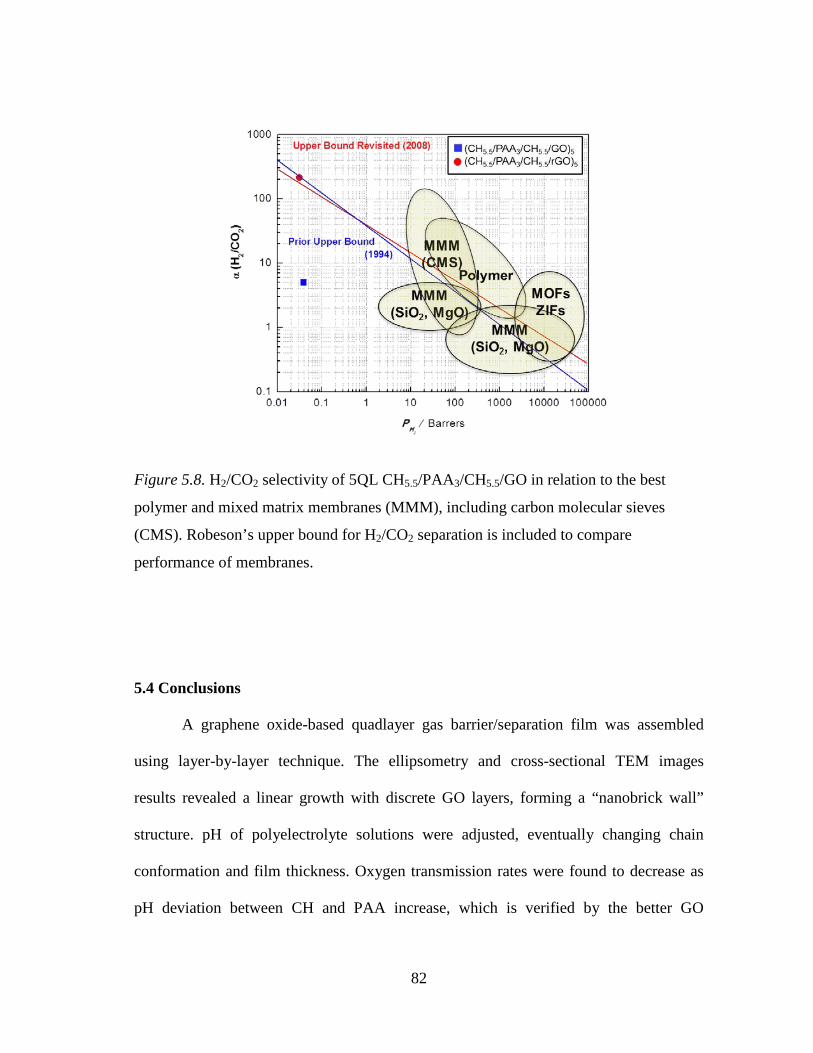
82
Figure 5.8. H2/CO2 selectivity of 5QL CH5.5/PAA3/CH5.5/GO in relation to the best
polymer and mixed matrix membranes (MMM), including carbon molecular sieves
(CMS). Robeson’s upper bound for H2/CO2 separation is included to compare
performance of membranes.
5.4 Conclusions
A graphene oxide-based quadlayer gas barrier/separation film was assembled
using layer-by-layer technique. The ellipsometry and cross-sectional TEM images
results revealed a linear growth with discrete GO layers, forming a “nanobrick wall”
structure. pH of polyelectrolyte solutions were adjusted, eventually changing chain
conformation and film thickness. Oxygen transmission rates were found to decrease as
pH deviation between CH and PAA increase, which is verified by the better GO

83
coverage shown in SEM images. CH5.5/PAA3/CH5.5/GO exhibited the best barrier
performance because CH was highly ionized by the counter ion, therefore was able to
attract more GO into the bulk film. By thermally reducing GO, OTR of the assemblies
became less sensitive to moisture. Reduction of GO also increased H2/CO2 selectivity,
the transformation of GO to a more two-dimensional structure is likely to fill up gaps
between adjacent platelets, resulting CO2 less permeable through the film. We believe
this state-of-the-art composite film, based on its simplicity to fabricate and excellent
barrier/separation properties bring out applications in packaging and gas separation.

84
CHAPTER VI*
HIGHLY SIZE-SELECTIVE IONICALLY CROSSLINKED MULTILAYER
POLYMER FILMS FOR LIGHT GAS SEPARATION
6.1 Introduction
The production of inexpensive, high purity hydrogen remains a critical challenge
for improving the sustainability of fossil fuels and for realizing renewable and clean
energy sources capable of displacing fossil fuels. Dramatic increases in the demand for
purified hydrogen for sulfur- and nitrogen-removal from “sour” crude oils is predicted in
the coming decades,[304] as traditional sources of “sweet” or low-sulfur crude oils
dwindle. Bio-refineries for producing “green” fuels from renewable sources are expected
to further increase global demand for purified hydrogen.[305] Hydrogen itself promises a
universal fuel derivable from any hydrocarbon resource, which may be converted to
electrical energy using fuel cells at energy efficiencies surpassing those of combustion-
based power systems with zero greenhouse gas emissions.[306] Industrial pressure-swing
adsorption and cryogenic distillation processes for hydrogen purification are complex,
energy-intensive and costly, and are incapable of satisfying purity requirements of many
fuel cells.[307] In contrast, gas purification membranes offer a low-maintenance, energy-
*Reprinted with permission from “Advanced Materials” by Kim, D.; Tzeng, P.; Barnett, K. J.; Yang, Y. H.; Wilhite, B. A.; Grunlan, J. C. “Highly Size-Selective Ionically Crosslinked Multilayer Polymer Films for Light Gas Separation” Adv. Mater. 2013, 26, 746-751, Copyright [2015] by John Wiley and Sons.

85
efficient alternative to these processes and these membranes are capable of achieving
hydrogen purities necessary for emerging energy technologies.[22]
Polymeric gas separation membranes combining low production costs with
robust mechanical properties have found broad industrial application for O2 and N2
enrichment of air, upgrading of natural gas and hydrogen recovery from ammonia.[22]
Dense polymeric membranes separate gas mixtures based upon disparities in individual
species permeabilities, dictated by species solubility and mobility within the polymer
material.[20, 21, 308] Size-selective polymer membranes rely upon differences in species
mobility, which is directly related to molecular size.[308] In the absence of structure (i.e.
in amorphous glassy or rubbery films), increasing the free volume of the polymer
improves the permeability at the cost of reducing the permselectivity.[21, 308] In contrast,
structured thin films assembled from molecular sieves,[309] zeolites,[310] metal-organic-
frameworks (MOFs),[311] covalent-organic frameworks[312] and carbon nanotubes[313]
combine nano-scale pores with high free volume in a uniform, nominally defect-free
structure to avoid the trade-off between permeability and permselectivity.
Several strategies have been reported for incorporating structural aspects in
polymeric systems in order to overcome the “upper bound” in separation performance,
while retaining the traditional advantages of polymeric membranes. Mixed matrix
membranes (MMMs) combine structural aspects of molecular sieves, zeolites or MOFs
with homogeneous polymers.[151, 152] Polymers of intrinsic microporosity exploit
structure and rigidity of individual macromolecules to inhibit chain packing during film
synthesis, in turn realizing amorphous films with uniform pore structures.[314, 315]

86
Thermal re-arrangement of polymer segments in cast films allows introduction of
tunable pore structures, combining high free volume with a “bottleneck” pore structure
for maintaining high permselectivity.[316] Conversely, block copolymers formed from
two or more incompatible polymers provide templates for producing highly ordered
nanopore structures via etching of a sacrificial constituent from the as-cast film.[317]
In the present study, a branched polyethylenimine (PEI) / poly (acrylic acid)
(PAA) system is assembled via LbL deposition and used for investigating light gas (H2,
CO, CO2, O2, N2) separations using a flow-through membrane apparatus. Unlike other
LbL systems that display linear growth due to a “ladderlike” deposition structure,
PEI/PAA assembly appears to have a “scrambled salt” structure,[297] displaying
exponential growth. The highly ionized PEI and PAA result in a highly interpenetrating
network in both directions (from bulk film to solution, and vice versa). High modulus
obtained by nanoindentation suggests high density as another evidence of the
interpenetrated structure. This highly “ionically crosslinked” film is believed to be
denser than traditional polymer films, making it an excellent candidate for gas barrier
applications.
6.2 Experimental
6.2.1. Materials
Branched polyethylenimine (Aldrich, St. Louis, MO) (MW ~ 25,000 g mol-1)
was dissolved into deionized water (18.2 MΩ) for making 0.1 wt% solution. The pH was
adjusted from its unaltered value (~10.5) to 10 by adding hydrochloric acid (HCl) (1.0
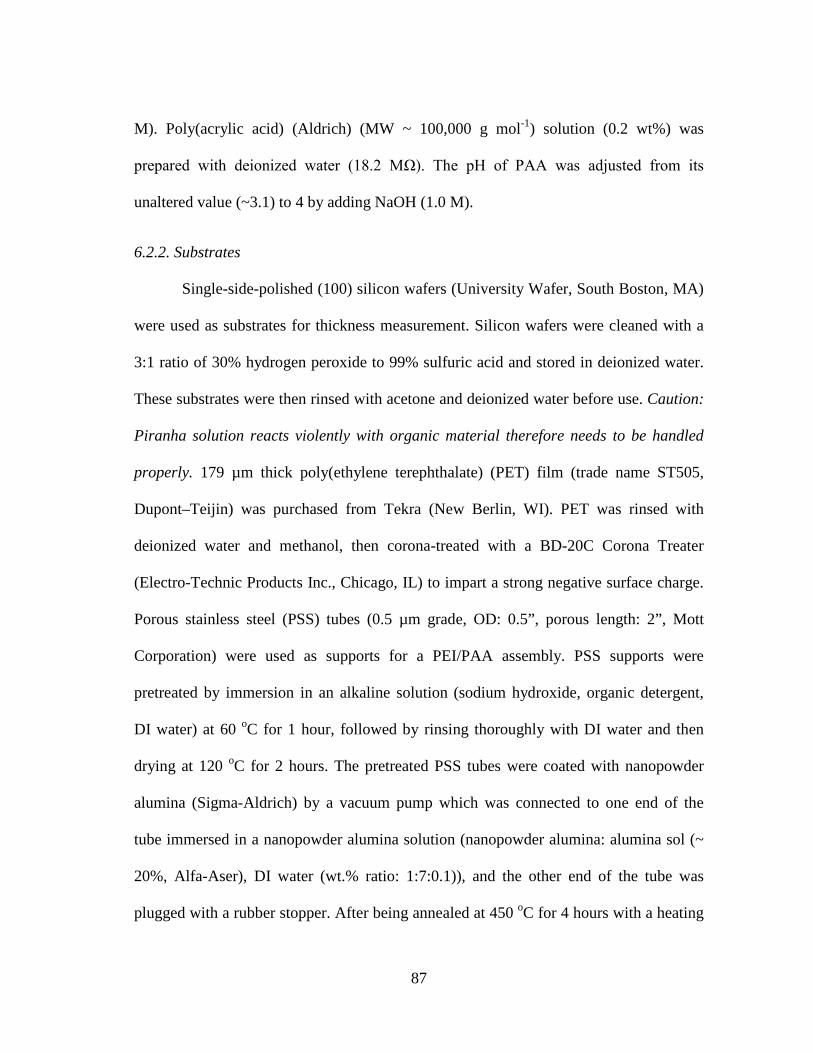
87
M). Poly(acrylic acid) (Aldrich) (MW ~ 100,000 g mol-1) solution (0.2 wt%) was
prepared with deionized water (18.2 MΩ). The pH of PAA was adjusted from its
unaltered value (~3.1) to 4 by adding NaOH (1.0 M).
6.2.2. Substrates
Single-side-polished (100) silicon wafers (University Wafer, South Boston, MA)
were used as substrates for thickness measurement. Silicon wafers were cleaned with a
3:1 ratio of 30% hydrogen peroxide to 99% sulfuric acid and stored in deionized water.
These substrates were then rinsed with acetone and deionized water before use. Caution:
Piranha solution reacts violently with organic material therefore needs to be handled
properly. 179 µm thick poly(ethylene terephthalate) (PET) film (trade name ST505,
Dupont–Teijin) was purchased from Tekra (New Berlin, WI). PET was rinsed with
deionized water and methanol, then corona-treated with a BD-20C Corona Treater
(Electro-Technic Products Inc., Chicago, IL) to impart a strong negative surface charge.
Porous stainless steel (PSS) tubes (0.5 µm grade, OD: 0.5”, porous length: 2”, Mott
Corporation) were used as supports for a PEI/PAA assembly. PSS supports were
pretreated by immersion in an alkaline solution (sodium hydroxide, organic detergent,
DI water) at 60 oC for 1 hour, followed by rinsing thoroughly with DI water and then
drying at 120 oC for 2 hours. The pretreated PSS tubes were coated with nanopowder
alumina (Sigma-Aldrich) by a vacuum pump which was connected to one end of the
tube immersed in a nanopowder alumina solution (nanopowder alumina: alumina sol (~
20%, Alfa-Aser), DI water (wt.% ratio: 1:7:0.1)), and the other end of the tube was
plugged with a rubber stopper. After being annealed at 450 oC for 4 hours with a heating

88
and cooling rate of 3 oC/min, the PSS tubes were airbrushed with alumina gel (dissolved
alumina in nitric acid (Mallinckrodt Baker), followed by pH titration to near-neutral
using ammonium hydroxide (Mallinckrodt Baker)) and annealed at the same condition
described above.
6.2.3. Layer-by-Layer Deposition
The alumina-coated PSS tube was first dipped into the polycation solution (PEI)
for 5 minutes, followed by rinsing with deionized water for 30 seconds and drying with a
stream of filtered air, as shown in Figure 6.1. After the first positively-charged layer was
adsorbed, the substrate was dipped into PAA solution for another 5 minutes, followed by
another rinsing and drying cycle. One deposition cycle was defined as one ‘bilayer’.
Starting from the second deposition cycle, the remaining numbers of layers were created
using one minute dip times. This process was carried out using home-built robotic
systems.[203, 204]
6.2.4. Thin Film Characterization
Thickness of the films was measured by a P-6 profilometer (KLA-Tencor,
Milpitas, CA). Gas permeation testing were carried out in two different ways. PEI/PAA
multilayer films were first deposited on alumina-coated PSS tube and placed in a tube-
and-shell assembly (Figure 6.2) in which the bore of the PSS tube (sweep) was supplied
with helium and the annulus (feed) of the system with feed gases (H2, CO, CO2, O2, N2).
Both sweep and feed gases were humidified with DI water to 3% RH prior to entering
the membrane system. Permeate gas composition was continuously monitored via mass

89
spectrometry (RGA 100, Stanford Research Systems). All gas permeation measurements
were performed at room temperature (~20 oC) with permeate and retentate volumes
maintained at atmospheric pressure. The permeance of gas species (i) is calculated
from Equation (1),
(6.1)
where Fi is gas (i) permeation rate (mol m-2 sec-1), t is membrane thickness (m), Pi is
permeability (mol m-1 sec-1 Pa-1), and , are partial pressure (Pa) of gas i in the
feed and sweep sides, respectively. Gas selectivity (αi/j) is given by the ratio of
permeability (Pi /Pj) of two gas species (i,j). PEI/PAA assemblies were deposited on PET
and tested by MOCON (Minneapolis, MN) as well. Gas permeation tests were
performed in accordance with ASTM D-3985,[207] using Oxtran 2/21 ML for oxygen,
Permatran-C 4/41 ML for carbon dioxide and Multi-Tran 400 ML for hydrogen, helium
and methane at 23°C and 0% RH. A Hysitron TI 950 TriboIndenterTM was used to
measure mechanical properties of 10 bilayer PEI/PAA film by a method explained
previously.[110] The modulus and the hardness of the sample were measured in two
different environments; 38 oC with 50% relative humidity (RH) and 25 oC with 22% RH.
FTIR spectra of LbL films were measured with a Bruker Optics ALPHA-P 10098-4
spectrometer in ATR mode. PAA peaks in its covalent (COOH) and ionic form (COO-)
are of interest in our study to compare the ionic interaction between polycation and
polyanion, or so called ‘degree of ionization’.
)/( tPi
)( ,, sifii
i pptPF −=
fip , sip ,

90
Figure 6.1. Schematic of PEI/PAA layer-by-layer gas separation membrane supported
on an alumina-coated porous stainless steel tube.[195]
Figure 6.2. Schematic of the tube-and-shell assembly set-up for gas permeation.[195]
6.3 Results and Discussion
6.3.1. Multilayer Film Growth and Structure
Figure 6.3 presents the growth of the film thickness as the number of bilayers of
PEI/PAA increases. The film thickness grows exponentially, indicating the ‘scrambled
salt’ structure of the film by a highly interpenetrating network.

91
Figure 6.3. The film growth curve of the PEI/PAA films.[195]
Figure 6.4a shows a picture of a complete membrane assembly comprising a 30
bilayer PEI/PAA supported on an alumina coated-PSS substrate. Figure 6.4b presents an
optical microscopic image (x50) of the porous surface of the untreated PSS substrate.
The optical microscope images of the alumina coated-PSS tube and the PEI/PAA film
coated over the alumina-PSS tube are shown in Figure 6.4c and d, respectively. As can
be seen in Figure 6.4c, the bright white alumina layer formed by a vacuum assisted-
coating technique fills the large cavities and voids present on the surface of the untreated
PSS substrate. Comparing optical microscope images of the PEI/PAA film surface
(Figure 6.4d) with that of the alumina-coated PSS tube (Figure 6.4c), it indicates that the
conformal PEI/PAA coating is free of macroscopic defects. Figure 6.4e shows a cross-
sectional SEM image of a 30 bilayer PEI/PAA film deposited over the alumina coated-

92
PSS tube, confirming the deposition of a ~7 µm polymer membrane over the alumina-
coated PSS substrate.
Figure 6.4. Picture of (a) a PEI/PAA-alumina-PSS tube, optical microscopic surface
images (x50) of (b) a untreated PSS tube, (c) an alumina layer, (d) a PEI/PAA film, and
(e) a SEM cross-section image (x1,000) of a PEI/PAA-alumina-PSS tube.[195]
6.3.2. Gas Separation Behavior
Figure 6.5a shows gas flux of H2, N2, O2, CO, and CO2 through the alumina-
coated PSS tube as a function of partial pressure difference between the feed and sweep
sides. Here, H2 permeance (a slope of the hydrogen flux) is 2.1 x 10⁻⁷ (mol m-2 sec-1 Pa-1)
and permeance of the other gases (N2, O2, CO, CO2) is about 1.1 x 10⁻⁷ (mol m-2 sec-1 Pa-
1). After depositing PEI/PAA films over the alumina-coated PSS tube, H2 permeance
through the PEI/PAA films decreased by about two or three order of magnitude
compared to that of the alumina coated-PSS tube (Figure 6.5b), with a tendency of

93
reduction in H2 flux as the number of bilayers increase. In contrast, permeate partial
pressures of all other gases studied remained below the lower detection limit of the mass
spectrometer [corresponding to a minimum detectable permeability of CO2 of 8.5x10⁻¹⁸
(mol m-1 sec-1 Pa-1)], indicating high H2 permselectivity of the supported polymer
membrane. The same permeation behavior of the PEI/PAA films was observed using a
coulometric detector system (Multi-Tran 400, Permatran C4/41, Oxtran 2/21 ML). Again,
the obtained permeation rates of O2, CH4 and CO2 through the 10 bilayer PEI/PAA film
were below the detection limit, while He and H2 gases exhibited appreciable
permeability. Given the kinetic diameters of the gases studied [He(2.6) < H2(2.89) <
CO2(3.3) < O2(3.46) < N2(3.46) < CO(3.76) < CH4(3.8)],[300] data confirms that the
PEI/PAA LbL films have size-selective pore structure with a limiting diameter between
2.89 Å and 3.3 Å. The lower detection limits for CO2 and N2 were employed to estimate
minimum detectable H2-CO2 and H2-N2 permselectivities of 190:1 and 2350:1,
respectively. While the extremely low CO2 and N2 permeabilities prevented a precise
measurement of the intrinsic H2-N2 and H2-CO2 permselectivities, this minimum
detectable permselectivity provides the most conservative basis for comparing the
presently reported LbL film against the state-of-the-art in light gas separation polymeric
materials.

94
Figure 6.5. (a) Gas permeation through the alumina-coated PSS tube (blank square: bare
PSS tube without alumina coating) and (b) H2 flux through PEI/PAA membranes of 10,
20, and 30 bilayers.[195]

95
Figure 6.6a and b present two lines representing the upper bound limits reported
in 1991and 2008 by Robeson[20, 21] for (a) H2/N2 and (b) H2/CO2. Robeson’s upper bound
plots were established based on data obtained from various homogeneous polymer films,
excluding surface modified, mixed matrix, and carbon molecular sieving membranes.
Data points in Figure 6.6 summarize the performance of a broad range of structured
membrane materials reported in the literature. It can be seen that several heterogeneous
MMMs exceed the upper bound proposed by Robeson, while previously reported LbL
films do not. In contrast, the LbL-assembled PEI/PAA films studied in this work exceed
the upper boundary by a margin equal to or greater than any existing polymeric gas
separation membrane, given the minimum possible H2:N2 and H2:CO2 permselectivities
obtained from the lower detection limit analysis. When compared on the basis of
selectivity (α) alone, not even structured porous inorganics can match these relatively
simple, polymer-only membranes. Moreover, while existing polymeric membranes have
overcome this “upper bound” by introducing heterogeneity and significant structural
modification, our previous analysis of the LbL-assembled PEI/PAA film[198] indicates a
compact, homogeneous polymer structure. Thus, this report represents the first
successful use of a layer-by-layer polymer system to overcome Robeson’s “upper bound.”

96
Figure 6.6. Robeson’s upper bound plots ((a) H2/N2, (b) H2/CO2) of 10, 20, and 30
bilayer PEI/PAA polymer films and various other polymer and inorganic (or mixed
matrix) membranes (the full term for each abbreviation listed here is presented in the
Nomenclature).[195]

97
6.3.3. Mechanical Strength of Multilayer Film
The compactness of this polymer film can be inferred from its mechanical
behavior. Figure 6.7 shows the average elastic modulus and hardness of 10 bilayer
PEI/PAA films. This 1µm film has an elastic modulus of 23.4 ± 5.7 GPa and hardness of
0.7 ± 0.3 GPa at 22 %RH, higher than most known all-polymer[318, 319] and even
ultrastrong and stiff uncrosslinked polymer/clay LbL assemblies.[52] One reason for this
relatively high result can be explained by FTIR (Figure 6.7c). PAA has unique peaks for
its neutral (-COOH at 1710 cm-1) and ionized forms (-COO- at 1560 cm-1) that were
investigated to compare the ionic interaction between polycation and polyanion, which
can be further quantified as “degree of ionization”. In order to derive this value, charged
carboxylate and neutral carboxylic acid peaks were first assumed to have similar
extinction coefficients,[205] and then the fraction of ionized PAA carboxylic groups was
calculated as Abs1560/(Abs1560+Abs1710).[206] Based on the spectrum here, the portion of
COO- is much higher than COOH, indicating PAA is highly ionized by PEI. Before the
film assembly, both PEI (pH10) and PAA (pH4) aqueous solutions are in neutral form in
which the polymer chains are more globular. As deposition proceeds, these pH sensitive
polyelectrolytes become highly charged due to the alternating pH (i.e., PEI encountering
a lower pH when PAA was deposited and PAA encountering a higher pH environment),
resulting in a highly ionic crosslinked and interdiffused assembly. This extensive
ionically linked structure might also explain why the assembly maintains a high elastic
modulus at 50% RH. Rather than plasticizing, water likely occupies free volume that
further densifies the film.[320]
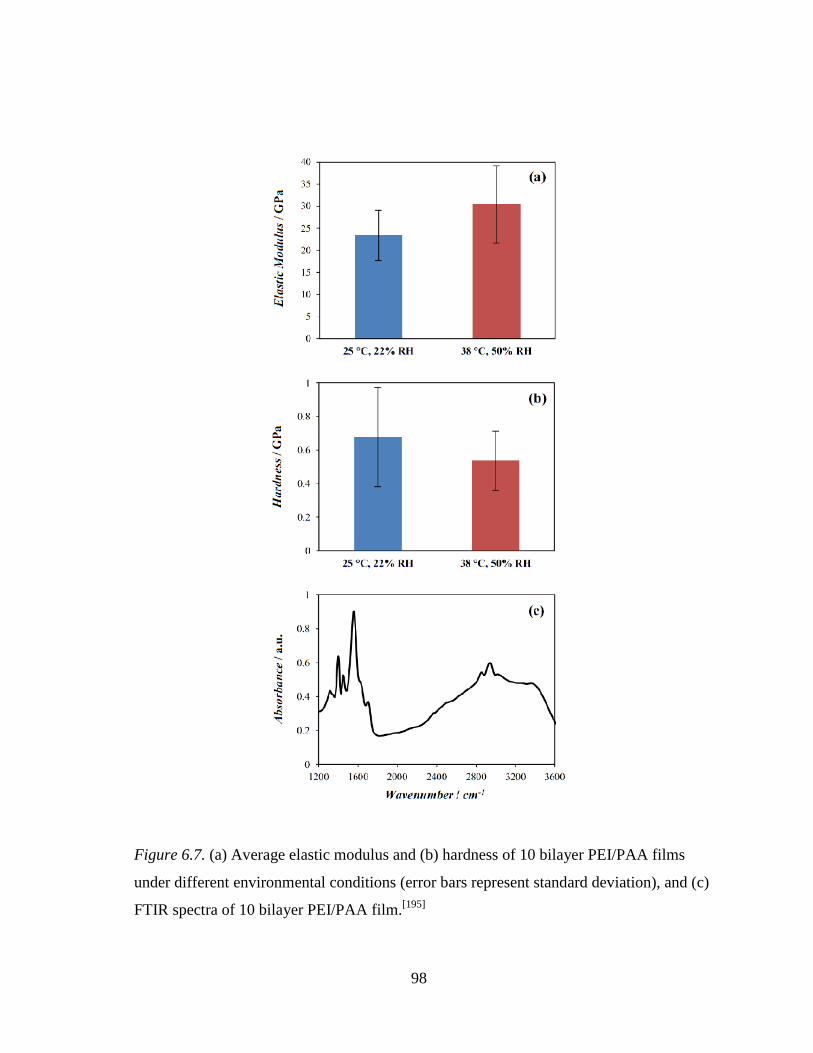
98
Figure 6.7. (a) Average elastic modulus and (b) hardness of 10 bilayer PEI/PAA films
under different environmental conditions (error bars represent standard deviation), and (c)
FTIR spectra of 10 bilayer PEI/PAA film.[195]

99
6.4 Conclusions
This study demonstrates exceptionally high hydrogen permselectivity and
remarkable elastic modulus in an ionically crosslinked, layer-by-layer assembled
PEI/PAA membrane, which performs beyond Robeson’s upper-bound limit, despite
being made of only homogenous polymer. This unique thin film overcomes the
drawbacks of common polymeric membranes (i.e., low selectivity and poor mechanical
properties), making it a significant advance in polymeric membranes for gas separation.

100
CHAPTER VII
CONCLUSIONS AND FUTURE WORK
7.1 Multilayer Gas Barrier/Separation Assemblies
The goal of this dissertation work was to improve barrier and separation behavior
of permeable polymeric substrates by depositing a thin film assembly. Polymer-polymer
and polymer-nanoplatelet layer-by-layer assemblies either reduced gas transmission rate
by three orders of magnitude (relative to an uncoated polymer substrate) or exhibited
separation performance above the Robeson’s upper-bound, with coating thickness
ranging from 50 ~ 1500 nm. Furthermore, post-thermal treatment can enhance
hydrophobicity of graphene oxide assemblies, thereby improving oxygen barrier at high
humidity. This work lays the foundation for the use of LbL assembly as an effective
technology for making flexible, transparent gas barrier/separation layers that are
important for a variety of packaging and purification applications.
7.1.1 Influence of Polymer Interdiffusion and Clay Concentration on Gas Barrier
Quadlayer assemblies, deposited using the layer-by-layer technique, were used to
study how polymer interdiffusion and clay concentration influence the gas barrier
behavior. PEI and PVAm were combined with PAA and MMT to generate ‘nanobrick
walls’. Highly oriented clay platelets, revealed by TEM and AFM, is the reason for the
exceptional oxygen barrier exhibited by these films. A 6 QL PVAm-based assembly
exhibited an OTR at the detection limit of commercial instrumentation. Rigid PVAm

101
molecules cause quadlayer growth to be linear rather than exponential. This results in
thinner layers for PVAm and weaker interaction with PAA relative to PEI. The weak
interaction also seems to carry over to MMT, which results in lower clay concentration
for PVAm-based assemblies. This study confirms the importance of polymer
interdiffusion and clay concentration in reducing oxygen permeability in these nanobrick
wall structures. PVAm and PEI were combined to tailor OTR by controlling these
factors. It is now possible to simultaneously control OTR and thickness of a multilayer
thin film barrier.
7.1.2 Super Hydrogen and Helium Barrier with Polyelectolyte Nanobrick Wall Thin
Film
Quadlayers of PEI/PAA/PEI/MMT were deposited on polystyrene to
produce transparent gas barrier assemblies. The impermeable clay platelets,
together with highly interdiffused PEI and PAA mortar, formed a nanobrick wall
structure that imparts tremendous light gas barrier. Permeability of both hydrogen
and helium decreased as the number of quadlayers increased, showing one to three
orders of magnitude improvement compared to EVOH and metallized plastics.
Increasing the number of QL from 5 to 10 does not improve the barrier properties.
This lack of improvement may be due to the dramatically expanded clay spacing
and associated concentration reduction. The excellent performance of this
assembly, combined with the simplicity of LbL deposition, makes this light gas
barrier coating an exciting opportunity for several packaging and storage
applications.

102
7.1.3 Improved Gas Barrier/Separation of Graphene Oxide Based Multilayer Thin Films
Graphene oxide sheets, along with chitosan (CH) and PAA were used in a
CH/PAA/CH/GO QL assembly. Charge density (pH) of polyelectrolytes was varied,
resulting in different chain conformation and film thickness. Oxygen transmission rate
was found to decrease as pH difference between CH and PAA increase, which is
connected to the increasing GO deposition (confirmed by SEM). CH5.5/PAA3/CH5.5/GO
exhibited the best barrier performance because CH has been highly ionized by the
counter ion, so it was able to attract more GO into the bulk film. Additionally, GO was
thermally reduced, which increased hydrophobicity of the film, making OTR less
sensitive to moisture. H2/CO2 selectivity also increased from 5 to 215 after reduction of
GO, showing a performance above the Robeson’s upper-bound limit. We believe this
composite film, based on its ease of fabrication and excellent barrier/separation behavior,
provides plenty of opportunity in packaging and gas separation.
7.1.4 Highly Size-Selective Multilayer Polymer Films for Light Gas Separation
Layer-by-layer multilayer films fabricated with two weak polyelectrolytes, PEI
and PAA, exhibited high elastic modulus and hydrogen selectivity. Titrated by the
oppositely charged polyelectrolyte (PEI at pH 10 and PAA at pH 4), PEI and PAA
become more ionized and require charge overcompensation, resulting in a highly
interdiffused network in both directions (from bulk film to solution, and vice versa).
High modulus obtained by nanoindentation suggests high density as another evidence of
the interdiffused structure. This highly ionically crosslinked film is believed to be denser
than traditional polymer films, exhibiting H2/N2 and H2/CO2 selectivities more than 2350
103
and 190, respectively (above Robeson’s upper-bound limit). This unique thin film
overcomes the low selectivity of common polymeric membranes and performs even
better than inorganic or mixed-matrix membranes, making it a significant advance in
polymeric membranes for gas separation.
7.2 Future Research Plans
Chapters V and VI demonstrate these LbL assemblies exhibit size-selective
behavior. Despite their high permeation selectivity, these films are diffusivity dominant,
which means they are unable to separate gas molecules with similar sizes (e.g., CO2 and
N2). New approaches for making solution-selective films are needed for commercial
applications. Additionally, the ability of LbL to precisely control assembly conditions
(e.g., film thickness and refractive index [RI]) is suitable to create films with enhanced
optical effects (e.g., reflecting light of specific wavelengths). Two areas of future
research are described here as ways to accomplish these challenges.
7.2.1 Solution-Selective Multilayer Polymer Films for CO2/N2 Separation
Poly(ethylene oxide) (PEO) is of considerable interest for separating gases with
similar molecular sizes. creating solution-selective membranes. The ether oxygen in
PEO has a strong affinity toward CO2 (quadrupolar interactions), resulting in relatively
high solubility and permeability.[321-323] In addition, the process conditions and thermal
history play significant roles in the PEO crystallization.[324] Generally, high molecular
weight PEO, with high crystallinity, has lower gas permeability and better mechanical
104
properties, whereas low molecular weight PEO, with low crystallinity, has better gas
transport properties.[325] Low molecular weight PEO exists in the liquid form and cannot
be directly used in gas separation membranes, making the design of PEO-containing
membranes with low crystallinity a challenge. Three approaches have been developed to
overcome these issues:
(1) design of phase-separated block copolymers with short ethylene oxide segments,
(2) use of low molecular weight PEO or polyethyleneglycol (PEG) as an additive, and
(3) synthesis of highly branched PEO that can be crosslinked. While most approaches
require
complex synthesis, LbL provides another route to create a film where both crystallinity
and mechanical properties can tailored. In one example, PEO acts as a hydrogen
acceptor while poly(methacrylic acid) (PMAA) is used as hydrogen donor to create
hydrogen-bonded films. Film thickness varies as pH of PEO and PMAA changes, which
is due to the change of chain conformation (Figure 7.1a). A 51 µm PS film coated with
10 BL of PEO2/PMAA2 showed high CO2/N2 selectivity (120) and performed close to
Robeson’s upper-bound (Figure 7.1b). Further study on the relation between elastic
modulus and permeability is needed.

105
Figure 7.1. (a) PEO2/PMAA2 and PEO3/PMAA3 thickness as a function of number of
BL deposited. (b) CO2/N2 separation performance of LbL (hollowed) and LbL-coated PS
(filled) on Robeson plot.
7.2.2 Multilayer Structural Color Films
Structurally colored beetles (e.g., Crysochroa rajah) possess a periodicity in the
upper layer of their cuticles that gives rise to a photonic band gap producing brilliant
iridescence.[326] Iridescent color is derived from multilayer photonic structures and in
their simplest form consists of layers with alternating high and low refractive indices.
Constructive interference of reflected light, or Bragg reflection,[327] is achieved by this
system when the thickness of each periodic layer is on the order of λ/4 and the viewing
angle is close to 90°. Layer-by-layer deposition is suitable to reproduce this periodicity
and create iridescent thin films because film structure is tailorable by adjusting solution
concentration, charge density (pH), and deposition time, which produces uniform films
with precise thickness. The refractive index (RI) of each layer was designed by

106
combining two materials in each layer, as shown in Figure 7.2a. Thickness of each layer
was then controlled by altering the number of BL in each layer (Figure 7.2b and c). The
high RI layer (layer A) consisted 13 bilayers of PEI/VMT. The low RI layer (layer B)
contained 40 bilayers of cationic colloidal silica (SiO2) and anionic cellulose
nanocrystals (CNCs). Due to the entirely different shape of SiO2 and CNCs, a porous
layer is created. Cross-sectional film structure of the stacks was characterized using
SEM and TEM and compared to C. rajah beetle. Figure 7.3a is a TEM image showing
the periodicity in the cross-section of C. rajah beetle elytra. The periodicity is derived
from the alternating light and dark layers aligned parallel to the elytra surface. Likewise,
cross-sectional TEM images of the assembled films presented alternating light and dark
layers as seen in Figure 7.3c and d indicating that RI mismatched had been achieved in
layer thicknesses on the order of visible light. Upon closer inspection (Figure 7.3d) a
laminar arrangement of VMT (the darker lines) and PEI was seen. Figure 7.3b is a cross-
sectional SEM image of (AB)24A which provides information about the B layer structure
that the TEM images could not and confirms the dense laminar structure of the A layers.
The colloidal silica and the CNCs have formed an isotropic porous structure. Preliminary
results, measured by angle resolved spectrophotometry (ARS), are shown in Figure 7.4.
This multilayer assembly exhibited iridescent behavior, which means the peak reflection
blue shifts as incident angle increases (Figure 7.4a). Similar results were discovered in
the cuticles of beetles (Figure 7.4b), suggesting the color in the LbL assembly is the
result of periodic high/low RI layers. Further study will focus on varying reflecting

107
wavelength by adjusting layer thickness and RI for applications in sensing, optical filters
and replacement of pigment based coatings.
Figure 7.2. (a) Schematic of Bragg stack LbL assembly process. Thickness and
refractive index of (b) PEI/VMT and (c) SiO2/CNCs as a function of bilayers deposited.
Error bars are standard deviations from the mean.

108
Figure 7.3. (a) TEM cross-section image of the elytra of a Chrysochroa rajah beetle. (b)
SEM cross-section image of the (AB)24A film. TEM cross-section images of the (c)
entire (AB)6A film and (d) a single A layer. Scale bars in all images represent 100 nm.

109
Figure 7.4. Reflection intensity of (a) (AB)6A film and (b) cuticle of Crysochroa rajah
as function of wavelength and incident angle.

110
REFERENCES
[1] L. E. S. Brink, S. J. G. Elbers, T. Robbertsen, P. Both, Journal of Membrane Science
1993, 76, 281.
[2] H. C. Yang, K. J. Liao, H. Huang, Q. Y. Wu, L. S. Wan, Z. K. Xu, Journal of
Materials Chemistry A 2014, 2, 10225.
[3] H. Valle, J. Sanchez, B. L. Rivas, Journal of Applied Polymer Science 2015, 132,
41272.
[4] S. J. Lee, A. Chang-Chien, S. W. Cha, R. O'Hayre, Y. I. Park, Y. Saito, F. B. Prinz,
Journal of Power Sources 2002, 112, 410.
[5] J. M. Xu, L. Ma, H. L. Han, H. Z. Ni, Z. Wang, H. X. Zhang, Electrochimica Acta
2014, 146, 688.
[6] T. Yuan, L. J. Pu, Q. H. Huang, H. F. Zhang, X. M. Li, H. Yang, Electrochimica
Acta 2014, 117, 393.
[7] J. Cho, J. K. Hong, K. Char, F. Caruso, Journal of the American Chemical Society
2006, 128, 9935.
[8] W. Joo, H. J. Kim, J. K. Kim, Langmuir 2010, 26, 5110.
[9] F. Trespidi, G. Timo, F. Galeotti, M. Pasini, Microelectronic Engineering 2014, 126,
13.
[10] G. W. Heffner, D. S. Pearson, Macromolecules 1991, 24, 6295.
[11] J. J. Jasieniak, J. Seifter, J. Jo, T. Mates, A. J. Heeger, Advanced Functional
Materials 2012, 22, 2594.

111
[12] K. Kranthiraja, K. Gunasekar, W. Cho, M. Song, Y. G. Park, J. Y. Lee, Y. Shin, I.
N. Kang, A. Kim, H. Kim, B. Kim, S. H. Jin, Macromolecules 2014, 47, 7060.
[13] P. C. Bessa, M. Casal, R. L. Reis, Journal of Tissue Engineering and Regenerative
Medicine 2008, 2, 81.
[14] J. A. M. Steele, S. D. McCullen, A. Callanan, H. Autefage, M. A. Accardi, D. Dini,
M. M. Stevens, Acta Biomaterialia 2014, 10, 2065.
[15] Y. Hu, X. Y. Gu, Y. Yang, J. Huang, M. Hu, W. K. Chen, Z. Tong, C. Y. Wang,
Acs Applied Materials & Interfaces 2014, 6, 17166.
[16] J. Lange, Y. Wyser, Packaging Technology and Science 2003, 16, 149.
[17] K. K. Mokwena, J. M. Tang, Critical Reviews in Food Science and Nutrition 2012,
52, 640.
[18] I. Tawakkal, M. J. Cran, J. Miltz, S. W. Bigger, Journal of Food Science 2014, 79,
R1477.
[19] M. R. Anderson, B. R. Mattes, H. Reiss, R. B. Kaner, Synthetic Metals 1991, 41,
1151.
[20] L. M. Robeson, Journal of Membrane Science 1991, 62, 165.
[21] L. M. Robeson, J. Membr. Sci. 2008, 320, 390.
[22] P. Bernardo, E. Drioli, G. Golemme, Industrial & Engineering Chemistry Research
2009, 48, 4638.
[23] R. W. Baker, Industrial & Engineering Chemistry Research 2002, 41, 1393.
[24] S. Yoo, C. Holloman, D. Tomasko, K. Koelling, M. A. Pascall, Packaging
Technology and Science 2014, 27, 169.

112
[25] "Market Statistics and Future Trends in Global Packaging", World Packaging
Organisation / PIRA International Ltda, 2008, p. 2012/.
[26] O. G. Piringer, A. L. Baner, "Plastic packaging materials for food : barrier
function, mass transport, quality assurance, and legislation", Wiley-VCH, Weinheim;
New York, 2000, p. 605.
[27] G. Strupinsky, A. L. Brody, Polymers, Laminations & Coatings Conference, Books
1 and 2 1998, 119.
[28] D. J. Safarik, R. B. Eldridge, Industrial & Engineering Chemistry Research 1998,
37, 2571.
[29] L. A. Cisternas, C. M. Vasquez, R. E. Swaney, Aiche Journal 2006, 52, 1754.
[30] A. Bieder, A. Gruniger, P. R. von Rohr, Surface & Coatings Technology 2005, 200,
928.
[31] S. Duttagupta, F. J. Ma, B. Hoex, A. G. Aberle, Solar Energy Materials and Solar
Cells 2014, 120, 204.
[32] R. Sothornvit, S. I. Hong, D. J. An, J. W. Rhim, Lwt-Food Science and Technology
2010, 43, 279.
[33] H. Tetsuka, T. Ebina, H. Nanjo, F. Mizukami, Journal of Materials Chemistry 2007,
17, 3545.
[34] G. Decher, Science 1997, 277, 1232.
[35] M. Ferreira, M. Rubner, Macromolecules 1995, 28, 7107.
[36] M. A. Priolo, K. M. Holder, D. Gamboa, J. C. Grunlan, Langmuir 2011, 27, 12106.
[37] S. S. Shiratori, M. F. Rubner, Macromolecules 2000, 33, 4213.

113
[38] H. L. Tan, M. J. McMurdo, G. Pan, P. G. Van Patten, Langmuir 2003, 19, 9311.
[39] J. Irigoyen, L. Han, I. Llarena, Z. W. Mao, C. Y. Gao, S. E. Moya, Macromolecular
Rapid Communications 2012, 33, 1964.
[40] K. Buscher, K. Graf, H. Ahrens, C. A. Helm, Langmuir 2002, 18, 3585.
[41] Z. Sui, D. Salloum, J. B. Schlenoff, Langmuir 2003, 19, 2491.
[42] Y. Shimazaki, R. Nakamura, S. Ito, M. Yamamoto, Langmuir 2001, 17, 953.
[43] D. A. Hagen, B. Foster, B. Stevens, J. C. Grunlan, ACS Macro Letters 2014, 10,
663.
[44] P. Bertrand, A. Jonas, A. Laschewsky, R. Legras, Macromolecular Rapid
Communications 2000, 21, 319.
[45] Y. Lvov, K. Ariga, I. Ichinose, T. Kunitake, Journal of the American Chemical
Society 1995, 117, 6117.
[46] W. B. Stockton, M. F. Rubner, Macromolecules 1997, 30, 2717.
[47] P. Kohli, G. J. Blanchard, Langmuir 2000, 16, 4655.
[48] K. Ariga, J. P. Hill, Q. Ji, Physical Chemistry Chemical Physics 2007, 9, 2319.
[49] R. A. Caruso, A. Susha, F. Caruso, Chemistry of Materials 2001, 13, 400.
[50] P. Kurt, D. Banerjee, R. E. Cohen, M. F. Rubner, Journal of Materials Chemistry
2009, 19, 8920.
[51] P. Podsiadlo, M. Michel, J. Lee, E. Verploegen, N. W. S. Kam, V. Ball, Y. Qi, A. J.
Hart, P. T. Hammond, N. A. Kotov, Nano Letters 2008, 8, 1762.

114
[52] P. Podsiadlo, A. K. Kaushik, E. M. Arruda, A. M. Waas, B. S. Shim, J. D. Xu, H.
Nandivada, B. G. Pumplin, J. Lahann, A. Ramamoorthy, N. A. Kotov, Science 2007, 318,
80.
[53] Y. Zou, L. X. Xie, S. Carroll, M. Muniz, H. Gibson, W. Z. Wei, H. P. Liu, G. Z.
Mao, Biomacromolecules 2014, 15, 3965.
[54] M. Alba, P. Formentin, J. Ferre-Borrull, J. Pallares, L. F. Marsal, Nanoscale
Research Letters 2014, 9, 210.
[55] E. C. Dreaden, S. W. Morton, K. E. Shopsowitz, J. H. Choi, Z. J. Deng, N. J. Cho, P.
T. Hammond, Acs Nano 2014, 8, 8374.
[56] X. F. Su, B. S. Kim, S. R. Kim, P. T. Hammond, D. J. Irvine, Acs Nano 2009, 3,
3719.
[57] P. Podsiadlo, L. Sui, Y. Elkasabi, P. Burgardt, J. Lee, A. Miryala, W.
Kusumaatmaja, M. R. Carman, M. Shtein, J. Kieffer, J. Lahann, N. A. Kotov, Langmuir
2007, 23, 7901.
[58] K. Manabe, S. Nishizawa, K. H. Kyung, S. Shiratori, Acs Applied Materials &
Interfaces 2014, 6, 13985.
[59] Z. Wu, D. Lee, M. Rubner, R. Cohen, Small 2007, 3, 1467.
[60] Y. C. Li, S. Mannen, A. B. Morgan, S. Chang, Y. H. Yang, B. Condon, J. C.
Grunlan, Advanced Materials 2011, 23, 3926.
[61] D. Patra, P. Vangal, A. A. Cain, C. Cho, O. Regev, J. C. Grunlan, Acs Applied
Materials & Interfaces 2014, 6, 16903.

115
[62] Y. S. Kim, Y. C. Li, W. M. Pitts, M. Werrel, R. D. Davis, Acs Applied Materials &
Interfaces 2014, 6, 2146.
[63] Y.-H. Yang, M. Haile, Y. T. Park, F. A. Malek, J. C. Grunlan, Macromolecules
2011, 44, 1450.
[64] T. Guin, M. Krecker, D. A. Hagen, J. C. Grunlan, Langmuir 2014, 30, 7057.
[65] Y. H. Yang, L. Bolling, M. A. Priolo, J. C. Grunlan, Advanced Materials 2013, 25,
503.
[66] M. A. Priolo, D. Gamboa, K. M. Holder, J. C. Grunlan, Nano letters 2010, 10, 4970.
[67] J. K. Mitchell, Am. J. Med. 1830, 13, 36.
[68] J. K. Mitchell, Am. J. Med. Sci. 1833, 25, 100.
[69] T. Graham, Philos. Mag. 1866, 32, 401.
[70] R. W. Baker, Membrane Technology and Applications, 2004, 10, 325.
[71] M. Knudsen, "The kinetic theory of gases; some modern aspects", Methuen & co.
ltd., London,, 1934, p. 7.
[72] A. Yamasaki, H. Inoue, J Membrane Sci 1991, 59, 233.
[73] N. N. Li, A. G. Fane, W. S. W. Ho, T. Matsuura, "Advanced Membrane Technology
and Applications", Wiley-VCH, Weinheim; New York, 2011, p. 65.
[74] H. Fujita, A. Kishimoto, K. Matsumoto, T Faraday Soc 1960, 56, 424.
[75] W. J. Koros, Polymer Chemistry Inc., "Barrier polymers and structures", American
Chemical Society, Washington, DC, 1990, p. 10.
[76] F. Gruen, Experimenta 1947, 3, 490.
[77] G. J. van Amerongen, J. Appl. Phys. 1946, 17, 972.

116
[78] R. D. Behling, Ohlrogge, K., Peinemann, K. V., Kyburz, E., "The separation of
hydrocarbons from waste vapor streams", AICHE, New York, 1989.
[79] R. M. Barrer, J. A. Barrie, J. Slater, J Polym Sci 1958, 27, 177.
[80] J. H. Petropoulos, Journal of Polymer Science Part A-2: Polymer Physics 1970, 8,
1797.
[81] W. J. Koros, D. R. Paul, A. A. Rocha, Journal of Polymer Science Part B-Polymer
Physics 1976, 14, 687.
[82] S. S. Ray, M. Okamoto, Progress in Polymer Science 2003, 28, 1539.
[83] E. P. Giannelis, Advanced Materials 1996, 8, 29.
[84] L. A. Almeida, M. D. V. Marques, K. Dahmouche, Journal of Nanoscience and
Nanotechnology 2015, 15, 2514.
[85] G. Choudalakis, A. D. Gotsis, European Polymer Journal 2009, 45, 967.
[86] T. Kashiwagi, R. H. Harris, X. Zhang, R. M. Briber, B. H. Cipriano, S. R. Raghavan,
W. H. Awad, J. R. Shields, Polymer 2004, 45, 881.
[87] M. Sain, S. H. Park, F. Suhara, S. Law, Polymer Degradation and Stability 2004, 83,
363.
[88] B. Wang, K. Q. Zhou, S. H. Jiang, Y. Q. Shi, B. B. Wang, Z. Gui, Y. Hu, Materials
Research Bulletin 2014, 56, 107.
[89] E. Picard, A. Vermogen, J. F. Gerard, E. Espuche, Journal of Membrane Science
2007, 292, 133.
[90] G. H. Fredrickson, J. Bicerano, Journal of Chemical Physics 1999, 110, 2181.

117
[91] S. Nazarenko, P. Meneghetti, P. Julmon, B. G. Olson, S. Qutubuddin, Journal of
Polymer Science Part B-Polymer Physics 2007, 45, 1733.
[92] E. P. Giannelis, R. Krishnamoorti, E. Manias, Adv Polym Sci 1999, 138, 107.
[93] H. J. Ploehn, C. Y. Liu, Industrial & Engineering Chemistry Research 2006, 45,
7025.
[94] P. Dubois, M. Alexandre, Materials Science & Engineering R-Reports 2000, 28, 1.
[95] V. Mittal, Materials 2009, 2, 992.
[96] T. Lan, P. D. Kaviratna, T. J. Pinnavaia, Chem Mater 1995, 7, 2144.
[97] M. Biswas, S. S. Ray, New Polymerization Techniques and Synthetic
Methodologies 2001, 155, 167.
[98] S. Takahashi, H. A. Goldberg, C. A. Feeney, D. P. Karim, M. Farrell, K. O'Leary, D.
R. Paul, Polymer 2006, 47, 3083.
[99] L. E. Nielsen, J. Macromol. Sci. (Chem). 1967, A1, 929.
[100] E. L. Cussler, S. E. Hughes, W. J. Ward, R. Aris, Journal of Membrane Science
1988, 38, 161.
[101] J. P. DeRocher, B. T. Gettelfinger, J. S. Wang, E. E. Nuxoll, E. L. Cussler, Journal
of Membrane Science 2005, 254, 21.
[102] Y. Maeda, D. R. Paul, Journal of Membrane Science 1987, 30, 1.
[103] T. A. Barbari, W. J. Koros, D. R. Paul, Journal of Membrane Science 1989, 42, 69.
[104] S. A. Stern, Y. Mi, H. Yamamoto, A. K. Stclair, Journal of Polymer Science Part
B-Polymer Physics 1989, 27, 1887.

118
[105] T. H. Kim, W. J. Koros, G. R. Husk, K. C. Obrien, Journal of Membrane Science
1988, 37, 45.
[106] T. Krug, Ludwig, R., Steiniger, G., "New developments in transparent barrier
coatings", Society of Vacuum Coaters - 36th Annual Technical Conference Proceedings,
1993302.
[107] R. K. Bharadwaj, Macromolecules 2001, 34, 9189.
[108] S. S. Ray, K. Yamada, M. Okamoto, A. Ogami, K. Ueda, Chemistry of Materials
2003, 15, 1456.
[109] C. F. Yang, E. L. Cussler, Journal of Membrane Science 2004, 231, 1.
[110] M. A. Priolo, D. Gamboa, J. C. Grunlan, Acs Applied Materials & Interfaces 2010,
2, 312.
[111] W. J. Koros, G. K. Fleming, Journal of Membrane Science 1993, 83, 1.
[112] L. R. Xu, C. Zhang, M. Rungta, W. L. Qiu, J. Q. Liu, W. J. Koros, Journal of
Membrane Science 2014, 459, 223.
[113] H. Lin, B. D. Freeman, Journal of Membrane Science 2004, 239, 105.
[114] M. Yan, T. W. Kim, A. G. Erlat, M. Pellow, D. F. Foust, H. Liu, M. Schaepkens,
C. M. Heller, P. A. McConnelee, T. P. Feist, A. R. Duggal, Proceedings of the Ieee 2005,
93, 1468.
[115] J. R. Wagner, "Multilayer Flexible Packaging: Technology and Applications for
the Food, Personal Care, and Over-the-Counter Pharmaceutical Industries", Elsevier
Science, Boston, 2009.
[116] Y. Leterrier, Progress in Materials Science 2003, 48, 1.

119
[117] C. Caner, R. J. Hernandez, B. R. Harte, Packaging Technology and Science 2004,
17, 23.
[118] J. M. S. Henis, M. K. Tripodi, Separation Science and Technology 1980, 15, 1059.
[119] D. L. Maclean, W. A. Bollinger, D. E. King, R. S. Narayan, Abstracts of Papers of
the American Chemical Society 1981, 182, 118.
[120] V. Mittal, "Barrier properties of polymer clay nanocomposite", Nova Science,
New York, 2009, p. 271.
[121] S. M. Jickells, J. Poulin, K. A. Mountfort, M. Fernandez-Ocana, Food Additives
and Contaminants 2005, 22, 768.
[122] M. Bientinesi, L. Petarca, Chemical and Process Engineering, 2011, 10, 763.
[123] A. Iulianelli, A. Basile, Catalysis Science & Technology 2011, 1, 366.
[124] M. Walther, M. Heming, M. Spallek, Surf Coat Tech 1996, 80, 200.
[125] C. F. Struller, P. J. Kelly, N. J. Copeland, V. Tobin, H. E. Assender, C. W.
Holliday, S. J. Read, Thin Solid Films 2014, 553, 153.
[126] A. Morlier, S. Cros, J. P. Garandet, N. Alberola, Thin Solid Films 2014, 550, 85.
[127] S. I. Hong, J. H. Lee, H. J. Bae, S. Y. Koo, H. S. Lee, J. H. Choi, D. H. Kim, S. H.
Park, H. J. Park, Journal of Applied Polymer Science 2011, 119, 2742.
[128] N. Yan, G. Buonocore, M. Lavorgna, S. Kaciulis, S. K. Balijepalli, Y. H. Zhan, H.
S. Xia, L. Ambrosio, Composites Science and Technology 2014, 102, 74.
[129] J. T. Yeh, S. S. Huang, W. H. Yao, I. J. Wang, C. C. Chen, J Appl Polym Sci 2004,
92, 2528.
[130] J. B. Faisant, A. Ait-Kadi, M. Bousmina, L. Deschenes, Polymer 1998, 39, 533.

120
[131] L. Da Silva, R. E. S. Bretas, Polym Eng Sci 2000, 40, 1414.
[132] B. S. Minhas, T. Matsuura, S. Sourirajan, Acs Symposium Series 1985, 281, 451.
[133] B. S. Minhas, T. Matsuura, S. Sourirajan, Industrial & Engineering Chemistry
Research 1987, 26, 2344.
[134] K. Mizoguchi, K. Terada, Y. Naito, Y. Kamiya, S. Tsuchida, S. Yano, Colloid
Polym. Sci. 1997, 275, 86.
[135] S. H. Chen, M. H. Lee, J. Y. Lai, European Polymer Journal 1996, 32, 1403.
[136] D. R. Pesiri, B. Jorgensen, R. C. Dye, Journal of Membrane Science 2003, 218, 11.
[137] D. E. Sanders, Z. P. Smith, R. L. Guo, L. M. Robeson, J. E. McGrath, D. R. Paul,
B. D. Freeman, Polymer 2013, 54, 4729.
[138] C. A. Scholes, C. P. Ribeiro, S. E. Kentish, B. D. Freeman, Separation and
Purification Technology 2014, 124, 134.
[139] C. A. Scholes, C. P. Ribeiro, S. E. Kentish, B. D. Freeman, Journal of Membrane
Science 2014, 450, 72.
[140] E. Finson, J. Felts, Tappi Journal 1995, 78, 161.
[141] G. Alefeld, J. Völkl, "Hydrogen in Metals: Basic properties", Springer-Verlag,
New York, 1978.
[142] J. Philpott, Platinum Metals Rev 1985, 29, 12.
[143] J. T. Felts, A. D. Grubb, Journal of Vacuum Science & Technology a-Vacuum
Surfaces and Films 1992, 10, 1675.

121
[144] C. Misiano, Simonetti, E., Cerolini, P., Staffetti, F., "Silicon oxide barrier
improvement on plastic substrate", Society of Vacuum Coaters - 34rd Annual Technical
Conference Proceedings, 2009, 1991105.
[145] L. Agres, Y. Segui, R. Delsol, P. Raynaud, Journal of Applied Polymer Science
1996, 61, 2015.
[146] T. Krug, "Transparent barriers for food packaging", Society of Vacuum Coaters -
33rd Annual Technical Conference Proceedings, 2008, 1990163.
[147] H. Chatham, Surface & Coatings Technology 1996, 78, 1.
[148] A. S. D. Sobrinho, G. Czeremuszkin, M. Latreche, G. Dennler, M. R. Wertheimer,
Surface & Coatings Technology 1999, 116, 1204.
[149] J. Caro, M. Noack, P. Kolsch, R. Schafer, Microporous and Mesoporous Materials
2000, 38, 3.
[150] C. J. Brinker, C. Y. Tsai, Y. Lu, "Inorganic dual-layer microporous supported
membranes", US Patent 6536604 B1, 2003.
[151] T. S. Chung, L. Y. Jiang, Y. Li, S. Kulprathipanja, Progress in Polymer Science
2007, 32, 483.
[152] T. H. Bae, J. S. Lee, W. L. Qiu, W. J. Koros, C. W. Jones, S. Nair, Angewandte
Chemie-International Edition 2010, 49, 9863.
[153] J. N. Gavgani, H. Adelnia, M. M. Gudarzi, Journal of Materials Science 2014, 49,
243.
[154] F. Carosio, S. Colonna, A. Fina, G. Rydzek, J. Hemmerle, L. Jierry, P. Schaaf, F.
Boulmedais, Chemistry of Materials 2014, 26, 5459.

122
[155] M. A. Osman, V. Mittal, M. Morbidelli, U. W. Suter, Macromolecules 2003, 36,
9851.
[156] J. K. Kim, C. G. Hu, R. S. C. Woo, M. L. Sham, Compos Sci Technol 2005, 65,
805.
[157] M. A. Osman, V. Mittal, U. W. Suter, Macromol Chem Physic 2007, 208, 68.
[158] S. S. Ray, K. Yamada, M. Okamoto, K. Ueda, Nano Lett 2002, 2, 1093.
[159] W. S. Jang, I. Rawson, J. C. Grunlan, Thin Solid Films 2008, 516, 4819.
[160] Z. Bartczak, A. Rozanski, J. Richert, European Polymer Journal 2014, 61, 274.
[161] B. Zeeb, C. Thongkaew, J. Weiss, Journal of Applied Polymer Science 2014, 131,
11.
[162] L. L. del Mercato, M. M. Ferraro, F. Baldassarre, S. Mancarella, V. Greco, R.
Rinaldi, S. Leporatti, Advances in Colloid and Interface Science 2014, 207, 139.
[163] M. N. Antipina, M. V. Kiryukhin, A. G. Skirtach, G. B. Sukhorukov, International
Materials Reviews 2014, 59, 224.
[164] J. Borges, L. C. Rodrigues, R. L. Reis, J. F. Mano, Advanced Functional Materials
2014, 24, 5624.
[165] F. Embs, D. Funhoff, A. Laschewsky, U. Licht, H. Ohst, W. Prass, H. Ringsdorf,
G. Wegner, R. Wehrmann, Advanced Materials 1991, 3, 25.
[166] H. Fuchs, H. Ohst, W. Prass, Advanced Materials 1991, 3, 10.
[167] L. Q. Li, M. H. Kopf, S. V. Gurevich, R. Friedrich, L. F. Chi, Small 2012, 8, 488.
[168] R. K. Iler, Journal of Colloid and Interface Science 1966, 21, 569.
[169] R. K. Iler, Journal of Colloid and Interface Science 1971, 37, 364.

123
[170] R. K. Iler, Journal of Colloid and Interface Science 1973, 43, 399.
[171] G. Decher, J. D. Hong, Makromolekulare Chemie-Macromolecular Symposia
1991, 46, 321.
[172] G. Decher, J. D. Hong, J. Schmitt, Thin Solid Films 1992, 210, 831.
[173] S. A. Sukhishvili, S. Granick, J Am Chem Soc 2000, 122, 9550.
[174] F. M. Xiang, S. M. Ward, T. M. Givens, J. C. Grunlan, Acs Macro Letters 2014, 3,
1055.
[175] J. H. Dai, D. M. Sullivan, M. L. Bruening, Industrial & Engineering Chemistry
Research 2000, 39, 3528.
[176] S. Moya, L. Dahne, A. Voigt, S. Leporatti, E. Donath, H. Mohwald, Colloids and
Surfaces a-Physicochemical and Engineering Aspects 2001, 183, 27.
[177] D. E. Bergbreiter, K. S. Liao, Soft Matter 2009, 5, 23.
[178] K. M. Holder, B. R. Spears, M. E. Huff, M. A. Priolo, E. Harth, J. C. Grunlan,
Macromolecular Rapid Communications 2014, 35, 960.
[179] P. T. Hammond, Aiche Journal 2011, 57, 2928.
[180] A. J. Svagan, A. Akesson, M. Cardenas, S. Bulut, J. C. Knudsen, J. Risbo, D.
Plackett, Biomacromolecules 2012, 13, 397.
[181] M. A. Priolo, K. M. Holder, S. M. Greenlee, B. E. Stevens, J. C. Grunlan,
Chemistry of Materials 2013, 25, 1649.
[182] M. A. Priolo, K. M. Holder, S. M. Greenlee, J. C. Grunlan, Acs Applied Materials
& Interfaces 2012, 4, 5529.

124
[183] B. Stevens, E. Dessiatova, D. A. Hagen, A. D. Todd, C. W. Bielawski, J. C.
Grunlan, Acs Applied Materials & Interfaces 2014, 6, 9942.
[184] P. Tzeng, C. R. Maupin, J. C. Grunlan, Journal of Membrane Science 2014, 452,
46.
[185] K. Tao, C. L. Kong, L. Chen, Chemical Engineering Journal 2013, 220, 1.
[186] J. S. McHattie, W. J. Koros, D. R. Paul, Polymer 1991, 32, 840.
[187] S. Basu, A. L. Khan, A. Cano-Odena, C. Q. Liu, I. F. J. Vankelecom, Chemical
Society Reviews 2010, 39, 750.
[188] J. H. Zhou, X. Zhu, J. Hu, H. L. Liu, Y. Hu, J. W. Jiang, Physical Chemistry
Chemical Physics 2014, 16, 6075.
[189] N. Joseph, P. Ahmadiannamini, R. Hoogenboom, I. F. J. Vankelecom, Polymer
Chemistry 2014, 5, 1817.
[190] P. Stroeve, V. Vasquez, M. A. N. Coelho, J. F. Rabolt, Thin Solid Films 1996, 284,
708.
[191] J. M. Levasalmi, T. J. McCarthy, Macromolecules 1997, 30, 1752.
[192] D. M. Sullivan, M. L. Bruening, Chemistry of Materials 2003, 15, 281.
[193] A. S. Huang, Q. Liu, N. Y. Wang, Y. Q. Zhu, J. Caro, Journal of the American
Chemical Society 2014, 136, 14686.
[194] J. Choi, M. Tsapatsis, Journal of the American Chemical Society 2010, 132, 448.
[195] D. Kim, P. Tzeng, K. J. Barnett, Y. H. Yang, B. A. Wilhite, J. C. Grunlan,
Advanced Materials 2014, 26, 746.
[196] T. Ebina, F. Mizukami, Advanced Materials 2007, 19, 2450.

125
[197] M. A. Priolo, D. Gamboa, K. M. Holder, J. C. Grunlan, Nano Letters 2010, 10,
4970.
[198] Y. H. Yang, M. Haile, Y. T. Park, F. A. Malek, J. C. Grunlan, Macromolecules
2011, 44, 1450.
[199] S. L. Clark, P. T. Hammond, Langmuir 2000, 16, 10206.
[200] N. S. Zacharia, M. Modestino, P. T. Hammond, Macromolecules 2007, 40, 9523.
[201] H. J. Ploehn, C. Liu, Industrial & Engineering Chemistry Research 2006, 45,
7025.
[202] E. M. Liston, L. Martinu, M. R. Wertheimer, Journal of Adhesion Science and
Technology 1993, 7, 1091.
[203] W. S. Jang, J. C. Grunlan, Review of Scientific Instruments 2005, 76.
[204] D. Gamboa, M. A. Priolo, A. Ham, J. C. Grunlan, Review of Scientific Instruments
2010, 1, 81.
[205] A. F. Xie, S. Granick, Macromolecules 2002, 35, 1805.
[206] J. Choi, M. F. Rubner, Macromolecules 2005, 38, 116.
[207] ASTM Standard D3985, Standard Test Method for Oxygen Gas Transmission
Rate Through Plastic Film and Sheeting Using a Coulometric Sensor. ASTM
International, West Conshohocken, PA, 2005, DOI: 10.1520/D3985.
[208] G. Ladam, P. Schaad, P. Schaaf, G. Decher, J. C. Voegel, F. Cuisinier, Langmuir
2000, 16, 1249.
[209] C. Porcel, P. Lavalle, G. Decher, B. Senger, J. C. Voegel, P. Schaaf, Langmuir
2007, 23, 1898.

126
[210] E. Kharlampieva, S. A. Sukhishvili, Langmuir 2003, 19, 1235.
[211] C. J. Bloysvantreslong, Recueil Des Travaux Chimiques Des Pays-Bas-Journal of
the Royal Netherlands Chemical Society 1978, 97, 13.
[212] E. J. Shepherd, J. A. Kitchener, Journal of the Chemical Society 1956, 2448.
[213] S. Choosakoonkriang, B. A. Lobo, G. S. Koe, J. G. Koe, C. R. Middaugh, Journal
of Pharmaceutical Sciences 2003, 92, 1710.
[214] O. E. Philippova, D. Hourdet, R. Audebert, A. R. Khokhlov, Macromolecules
1997, 30, 8278.
[215] A. I. Petrov, A. A. Antipov, G. B. Sukhorukov, Macromolecules 2003, 36, 10079.
[216] J. L. Lutkenhaus, K. McEnnis, P. T. Hammond, Macromolecules 2008, 41, 6047.
[217] X. Y. Lu, B. Z. Jiang, Polymer 1991, 32, 471.
[218] J. H. Lee, T. G. Park, H. S. Park, D. S. Lee, Y. K. Lee, S. C. Yoon, J. D. Nam,
Biomaterials 2003, 24, 2773.
[219] L. Kolarik, D. N. Furlong, H. Joy, C. Struijk, R. Rowe, Langmuir 1999, 15, 8265.
[220] B. Schoeler, E. Poptoschev, F. Caruso, Macromolecules 2003, 36, 5258.
[221] J. Y. Lee, P. C. Painter, M. M. Coleman, Macromolecules 1988, 21, 954.
[222] X. Y. Lu, R. A. Weiss, Macromolecules 1995, 28, 3022.
[223] D. K. Kim, S. W. Han, C. H. Kim, J. D. Hong, K. Kim, Thin Solid Films 1999,
350, 153.
[224] R. M. Silverstein, G. C. Bassler, Journal of Chemical Education 1962, 39, 546.
[225] A. Walther, I. Bjurhager, J. M. Malho, J. Pere, J. Ruokolainen, L. A. Berglund, O.
Ikkala, Nano Letters 2010, 10, 2742.

127
[226] J. C. Grunlan, A. Grigorian, C. B. Hamilton, A. R. Mehrabi, Journal of Applied
Polymer Science 2004, 93, 1102.
[227] E. Cussler, S. E. Hughes, W. J. Ward III, R. Aris, Journal of Membrane Science
1988, 38, 161.
[228] K. S. Triantafyllidis, P. C. LeBaron, I. Park, T. J. Pinnavaia, Chemistry of
Materials 2006, 18, 4393.
[229] A. Laachachi, V. Ball, K. Apaydin, V. Toniazzo, D. Ruch, Langmuir 2011, 27,
13879.
[230] A. P. Roberts, B. M. Henry, A. P. Sutton, C. R. M. Grovenor, G. A. D. Briggs, T.
Miyamoto, A. Kano, Y. Tsukahara, M. Yanaka, Journal of Membrane Science 2002, 208,
75.
[231] N. Inagaki, S. Tasaka, H. Hiramatsu, Journal of Applied Polymer Science 1999, 71,
2091.
[232] M. Yanaka, B. M. Henry, A. P. Roberts, C. R. M. Grovenor, G. A. D. Briggs, A. P.
Sutton, T. Miyamoto, Y. Tsukahara, N. Takeda, R. J. Chater, Thin Solid Films 2001, 397,
176.
[233] J. E. Mark, "Polymer Data Handbook", Oxford University Press, Oxford, 2009.
[234] I. Baxter, "Advanced Resistance Deposition Technology for Productive Roll
Coating", Society of Vacuum Coaters - 36th Annual Technical Conference Proceedings,
2011, 1993197.
[235] H. Jung, C. H. Jang, I. S. Yeo, T.-H. Song, International Journal of Heat and
Mass Transfer 2013, 56, 436.

128
[236] C. Charton, N. Schiller, M. Fahland, A. Hollander, A. Wedel, K. Noller, Thin
Solid Films 2006, 502, 99.
[237] C. A. Phillips, International Journal of Food Science & Technology 1996, 31, 463.
[238] S. Bhattacharya, R. Tummala, Microelectronics Journal 2001, 32, 11.
[239] D. Paul, L. Robeson, Polymer 2008, 49, 3187.
[240] T. Ebina, F. Mizukami, Advanced Materials 2007, 19, 2450.
[241] E. Jamieson, A. Windle, Journal of Materials Science 1983, 18, 64.
[242] A. Roberts, B. Henry, A. Sutton, C. Grovenor, G. Briggs, T. Miyamoto, M. Kano,
Y. Tsukahara, M. Yanaka, Journal of Membrane Science 2002, 208, 75.
[243] K. Kalaitzidou, H. Fukushima, L. T. Drzal, Carbon 2007, 45, 1446.
[244] G. P. Carwford, "Flexible Flat Panel Displays", John Wiley & Sons, Ltd.,
Hoboken, NY, 2005.
[245] D. A. Hagen, C. Box, S. Greenlee, F. Xiang, O. Regev, J. C. Grunlan, Rsc
Advances 2014, 4, 18354.
[246] F. M. Xiang, P. Tzeng, J. S. Sawyer, O. Regev, J. C. Grunlan, Acs Applied
Materials & Interfaces 2014, 6, 6040.
[247] R. Rajasekar, N. H. Kim, D. Jung, T. Kuila, J. K. Lim, M. J. Park, J. H. Lee,
Composites Science and Technology 2013, 89, 167.
[248] K. C. Krogman, J. L. Lowery, N. S. Zacharia, G. C. Rutledge, P. T. Hammond,
Nature Materials 2009, 8, 512.
[249] A. J. Mateos, A. A. Cain, J. C. Grunlan, Industrial & Engineering Chemistry
Research 2014, 53, 6409.

129
[250] J. B. Johnson, A. Pinto, "Ammonia synthesis process", US Patent 4695442,
Imperial Chemical Industries Ltd., 1987.
[251] J. Woodtli, R. Kieselbach, Engineering Failure Analysis 2000, 7, 427.
[252] R. B. Gupta, "Hydrogen Fuel", CRC Press, Boca Raton, Florida, 2008, p. 451.
[253] L. Schlapbach, A. Zuttel, Nature 2001, 414, 353.
[254] P. P. Edwards, V. L. Kuznetsov, W. I. F. David, N. P. Brandon, Energy Policy
2008, 36, 4356.
[255] W. G. Bley, Vacuum 1993, 44, 627.
[256] H. D. Burger, "Method of leak testing a test container with a tracer gas", US Patent
4984450 A, Alcatel Cit, 1991.
[257] P. Jönsson, T. Eagar, J. Szekely, Metallurgical and Materials Transactions B 1995,
26, 383.
[258] J. E. Huheey, E. A. Keiter, R. L. Keiter, O. E. Medhi, Pearson Education India
2006, 10, 364.
[259] A. Cho, Science 2009, 326, 778.
[260] D. A. Shea, D. Morgan, "The helium-3 shortage: Supply, demand, and options for
Congress", Congressional Research Service, Library of Congress, 2010.
[261] M. Linner, ChemMatters 1985, 4.
[262] S. Zhang, "United States extends life of helium reserve", Nature News, 2013, 10,
647.
[263] K. McDaniels, R. Downs, H. Meldner, C. Beach, C. Adams, Cubic Tech Corp
2009, 1, 97.

130
[264] L. W. McKeen, "Permeability properties of plastics and elastomers", William
Andrew, Norwich, NY, 2011, p. 67.
[265] EVAL, "Hydrogen Fuel Cell Systems", Kuraray Co., 20071.
[266] S. Sinha Ray, M. Okamoto, Progress in polymer science 2003, 28, 1539.
[267] C. Tsai Boh, A. Wachtel James, "Barrier Properties of Ethylene-Vinyl Alcohol
Copolymer in Retorted Plastic Food Containers", in Barrier Polymers and Structures,
American Chemical Society, Washington, D.C., 1990, p. 192.
[268] W.-S. Jang, I. Rawson, J. C. Grunlan, Thin Solid Films 2008, 516, 4819.
[269] P. Tzeng, E. L. Lugo, G. D. Mai, B. A. Wilhite, J. C. Grunlan, Macromolecular
Rapid Communications 2015, 36, 96.
[270] H. Czichos, T. Saito, L. Smith, L. R. Smith, "Springer Handbook of Materials
Measurement Methods", Springer, Berlin, Heidelberg, 2006, p. 106.
[271] G. Ladam, P. Schaad, J. C. Voegel, P. Schaaf, G. Decher, F. Cuisinier, Langmuir
1999, 16, 1249.
[272] E. H. H. Jamieson, A. H. Windle, Journal of Materials Science 1983, 18, 64.
[273] A. Arora, G. W. Padua, Journal of Food Science 2010, 75, R43.
[274] H. Wang, L. Z. Yang, Q. Chen, Plasma Science & Technology 2014, 16.
[275] Z. Liu, Z. H. Sun, X. X. Ma, C. L. Yang, Packaging Technology and Science 2013,
26, 70.
[276] K. Mueller, C. Schoenweitz, H. C. Langowski, Packaging Technology and Science
2012, 25, 137.
131
[277] M. Kamp, J. Bartsch, S. Nold, M. Retzlaff, M. Horteis, S. W. Glunz, Proceedings
of the Siliconpv Conference 2011, 8, 558.
[278] J. D. Affinito, M. E. Gross, C. A. Coronado, G. L. Graff, E. N. Greenwell, P. M.
Martin, Thin Solid Films 1996, 290, 63.
[279] Y. Leterrier, Progress in Materials Science 2003, 48, 1.
[280] K. K. Mokwena, J. Tang, Critical Reviews in Food Science and Nutrition 2012,
52, 640.
[281] B. C. Tsai, J. A. Wachtel, "Barrier Properties of Ethylene Vinyl Alcohol
Copolymer in Retorted Plastic Food Containers", Amer Chemical Soc, Washington,
D.C., 1990, p. 192.
[282] S. G. Prolongo, R. Moriche, A. Jimenez-Suarez, M. Sanchez, A. Urena, European
Polymer Journal 2014, 61, 206.
[283] D. Kim, H. Kwon, J. Seo, Polymer Composites 2014, 35, 644.
[284] K. S. Novoselov, A. K. Geim, S. V. Morozov, D. Jiang, M. I. Katsnelson, I. V.
Grigorieva, S. V. Dubonos, A. A. Firsov, Nature 2005, 438, 197.
[285] S. Stankovich, D. A. Dikin, G. H. B. Dommett, K. M. Kohlhaas, E. J. Zimney, E.
A. Stach, R. D. Piner, S. T. Nguyen, R. S. Ruoff, Nature 2006, 442, 282.
[286] C. Lee, X. D. Wei, J. W. Kysar, J. Hone, Science 2008, 321, 385.
[287] X. Zhao, Q. H. Zhang, D. J. Chen, P. Lu, Macromolecules 2010, 43, 2357.
[288] A. A. Balandin, S. Ghosh, W. Z. Bao, I. Calizo, D. Teweldebrhan, F. Miao, C. N.
Lau, Nano Letters 2008, 8, 902.

132
[289] D. Li, M. B. Muller, S. Gilje, R. B. Kaner, G. G. Wallace, Nature Nanotechnology
2008, 3, 101.
[290] M. J. McAllister, J. L. Li, D. H. Adamson, H. C. Schniepp, A. A. Abdala, J. Liu,
M. Herrera-Alonso, D. L. Milius, R. Car, R. K. Prud'homme, I. A. Aksay, Chemistry of
Materials 2007, 19, 4396.
[291] M. B. Avinash, K. S. Subrahmanyam, Y. Sundarayya, T. Govindaraju, Nanoscale
2010, 2, 1762.
[292] G. Laufer, C. Kirkland, A. B. Morgan, J. C. Grunlan, ACS Macro Letters 2013, 2,
361.
[293] W. S. Jang, J. C. Grunlan, Review of Scientific Instruments 2005, 76, 4.
[294] P. Tzeng, C. R. Maupin, J. C. Grunlan, Journal of Membrane Science 2014, 452,
46.
[295] ISO Standard 15105-2, Plastics - Film and sheeting - Determination of gas-
transmission rate - Part 2: Equal-pressure method. International Organization for
Standardization, Geneva, Switzerland, 2003.
[296] ASTM Standard F2476-05, Test Method for the Determination of Carbon Dioxide
Gas Transmission Rate (CO2TR) Through Barrier Materials Using An Infrared Detector.
ASTM International, West Conshohocken, PA, 2005, DOI: 10.1520/F2476-05.
[297] A. S. Michaels, Industrial & Engineering Chemistry 1965, 57, 32.
[298] L. Kai, "Proceedings of the 2009 International Conference on Chemical,
Biological and Environmental Engineering, CBEE 2009, Singapore, 9-11 October 2009",
World Scientific, 2009.
133
[299] R. A. Lusiana, D. Siswanta, Mudasir, T. Hayashita, International Journal of
Chemical Engineering and Applications 2013, 4, 229.
[300] R. W. Baker, E. L. Cussler, W. Eykamp, W. J. Koros, R. L. Riley, R. H. Strathman,
"Membrane separation systems", Noyes Data Corporation; Park Ridge, NJ, 1991; pp 76.
[301] A. K. Pabby, S. S. H. Rizvi, A. M. S. Requena, "Handbook of Membrane
Separations", CRC Press; Boca Raton, FL, 2009; pp 62.
[302] S. K. Gupta, S. N. Sinha, A. K. Agarwal, Indian Journal of Chemical Technology
1994, 1, 135.
[303] R. Xing, W. S. W. Ho, Journal of Membrane Science 2011, 367, 91.
[304] N. Hallale, F. Liu, Advances in Environmental Research 2001, 6, 81.
[305] D. C. Elliott, Energy & Fuels 2007, 21, 1792.
[306] E. Jochem, E. Schirrmeister, "Potential economic impact of fuel cell technologies",
in Handbook of Fuel Cells, John Wiley & Sons; Hoboken, NJ, 2010; pp105.
[307] N. W. Ockwig, T. M. Nenoff, Chemical Reviews 2010, 110, 2573.
[308] B. D. Freeman, Macromolecules 1999, 32, 375.
[309] S. M. Saufi, A. F. Ismail, Carbon 2004, 42, 241.
[310] M. A. Snyder, M. Tsapatsis, Angewandte Chemie-International Edition 2007, 46,
7560.
[311] M. Shah, M. C. McCarthy, S. Sachdeva, A. K. Lee, H. K. Jeong, Industrial &
Engineering Chemistry Research 2012, 51, 2179.
[312] H. M. El-Kaderi, J. R. Hunt, J. L. Mendoza-Cortes, A. P. Cote, R. E. Taylor, M.
O'Keeffe, O. M. Yaghi, Science 2007, 316, 268.

134
[313] B. J. Hinds, N. Chopra, T. Rantell, R. Andrews, V. Gavalas, L. G. Bachas, Science
2004, 303, 62.
[314] N. B. McKeown, P. M. Budd, Macromolecules 2010, 43, 5163.
[315] M. Carta, R. Malpass-Evans, M. Croad, Y. Rogan, J. C. Jansen, P. Bernardo, F.
Bazzarelli, N. B. McKeown, Science 2013, 339, 303.
[316] H. B. Park, C. H. Jung, Y. M. Lee, A. J. Hill, S. J. Pas, S. T. Mudie, E. Van
Wagner, B. D. Freeman, D. J. Cookson, Science 2007, 318, 254.
[317] D. A. Olson, L. Chen, M. A. Hillmyer, Chemistry of Materials 2008, 20, 869.
[318] A. J. Nolte, R. E. Cohen, M. F. Rubner, Macromolecules 2006, 39, 4841.
[319] A. J. Nolte, N. D. Treat, R. E. Cohen, M. F. Rubner, Macromolecules 2008, 41,
5793.
[320] T. Yamamoto, T. Kanda, Y. Nishihara, T. Ooshima, Y. Saito, Journal of Polymer
Science Part B-Polymer Physics 2009, 47, 1181.
[321] V. A. Kusuma, B. D. Freeman, M. A. Borns, D. S. Kalika, Journal of Membrane
Science 2009, 327, 195.
[322] H. Q. Lin, E. Van Wagner, B. D. Freeman, L. G. Toy, R. P. Gupta, Science 2006,
311, 639.
[323] R. D. Raharjo, H. Lin, D. E. Sanders, B. D. Freeman, S. Kalakkunnath, D. S.
Kalika, Journal of Membrane Science 2006, 283, 253.
[324] S. L. Liu, L. Shao, M. L. Chua, C. H. Lau, H. Wang, S. Quan, Progress in
Polymer Science 2013, 38, 1089.

135
[325] L. Li, J. T. Liu, Z. J. Ren, S. K. Yan, Chinese Journal of Polymer Science 2014, 32,
1199.
[326] P. Vukusic, J. R. Sambles, Nature 2003, 424, 852.
[327] A. J. Nolte, M. F. Rubner, R. E. Cohen, Langmuir 2004, 20, 3304.
[328] R. A. McAloney, M. Sinyor, V. Dudnik, M. C. Goh, Langmuir 2001, 17, 6655.