Embed Size (px)
Citation preview

Gary W. PhillipsVice President and Chief ScientistAmerican Institutes for Research
April 19, 2023

States are busy developing new content standards and new criterion-referenced tests that measure success on those content standards.
This activity is related to the federal No Child Left Behind (NCLB) legislation that require states to report annually on whether they are making adequate yearly progress (AYP) toward meeting state standards.
However, when standard setting panelists set performance standards, they generally have little knowledge of how their state performance standards compare with other states.
They also typically have no knowledge of how their state standards compare to national standards such as those used on the National Assessment of Educational Progress (NAEP).

They also have no understanding of how their state performance standards compare with international standards, such as those used in TIMSS, PIRLS, and PISA.
Consequently, the states do not know if their
performance standards are internationally competitive and are often surprised to find that they are setting low standards (compared to the highest achieving countries in the world) when they thought they were setting a high standard.
My presentation will discuss why states should use international benchmarking as an integral part of their standard setting process.

Before I talk about the importance of international benchmarks let me give you a brief tutorial on the three most commonly discussed international assessments that can be used for international benchmarking.

TIMSS-Trends in International Mathematics and Science
PIRLS-Progress in International Reading PISA-Programme for International Student
Assessment

TIMSS 4-year cycle, Grades 4 & 8, Math & Science◦ 1995 Math, Science◦ 1999 Math, Science◦ 2003 Math, Science◦ 2007 Math, Science◦ 2011 Math, Science
PIRLS 5-year cycle, Grade 4, Reading◦ 2001 Reading◦ 2006 Reading◦ 2011 Reading
PISA 3-year cycle, Age 15, Reading, Math, Science◦ 2000 Reading (Math, Science)◦ 2003 Math (Reading, Science)◦ 2006 Science (Reading, Math)◦ 2009 Reading (Math, Science)◦ 2012 Math (Reading, Science)◦ 2015 Science (Reading, Math)

Mathematics◦ Number◦ Algebra◦ Geometry◦ Measurement◦ Data
Science◦ Life Science◦ Chemistry◦ Physics◦ Earth Science◦ Environmental Science
Reading Comprehension◦ Literary Experience◦ Acquiring and Using Information

Reading◦ Interpreting Texts◦ Reflection and Evaluation◦ Retrieving Information
Mathematics◦ Quantity◦ Space and Shape◦ Change and Relationships◦ Uncertainty
Science◦ Identifying Scientific Issues◦ Explaining Phenomena Scientifically◦ Using Scientific Evidence
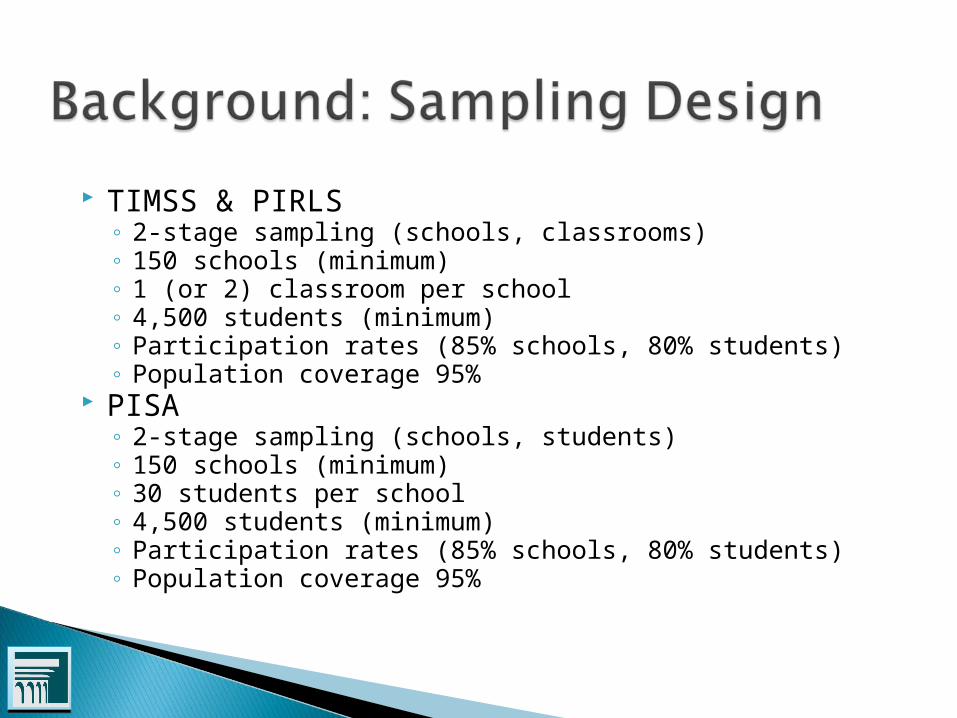
TIMSS & PIRLS◦ 2-stage sampling (schools, classrooms)◦ 150 schools (minimum)◦ 1 (or 2) classroom per school◦ 4,500 students (minimum)◦ Participation rates (85% schools, 80% students)◦ Population coverage 95%
PISA◦ 2-stage sampling (schools, students)◦ 150 schools (minimum)◦ 30 students per school◦ 4,500 students (minimum)◦ Participation rates (85% schools, 80% students)◦ Population coverage 95%

TIMSS◦ 28 blocks (14 Math, 14 Science)◦ 300 items (G4), 400 items (G8)◦ 6 blocks per booklet◦ Each student takes both subjects◦ 70 minutes (G4), 90 minutes (G8) per student testing time
PIRLS◦ 10 passages (5 literary, 5 informational), 120 items ◦ 2 passages per student◦ 80 minutes per student testing time
PISA◦ 13 clusters (7 Science, 2 Reading, 4 Math)◦ 108 (Science), 31 items (Reading), 48 items (Math)◦ 4 clusters per booklet◦ Each student takes all three subjects◦ 120 minutes per student testing time

650 A+Advanced 625 A
600 A-575 B+
High 550 B525 B-500 C+
Intermediate 475 C450 C-425 D+
Low 400 D375 D-
Benchmark on TIMSS and PIRLS
Cut-score on TIMSS and
PIRLS
Phillips (2009)
Benchmark Grade
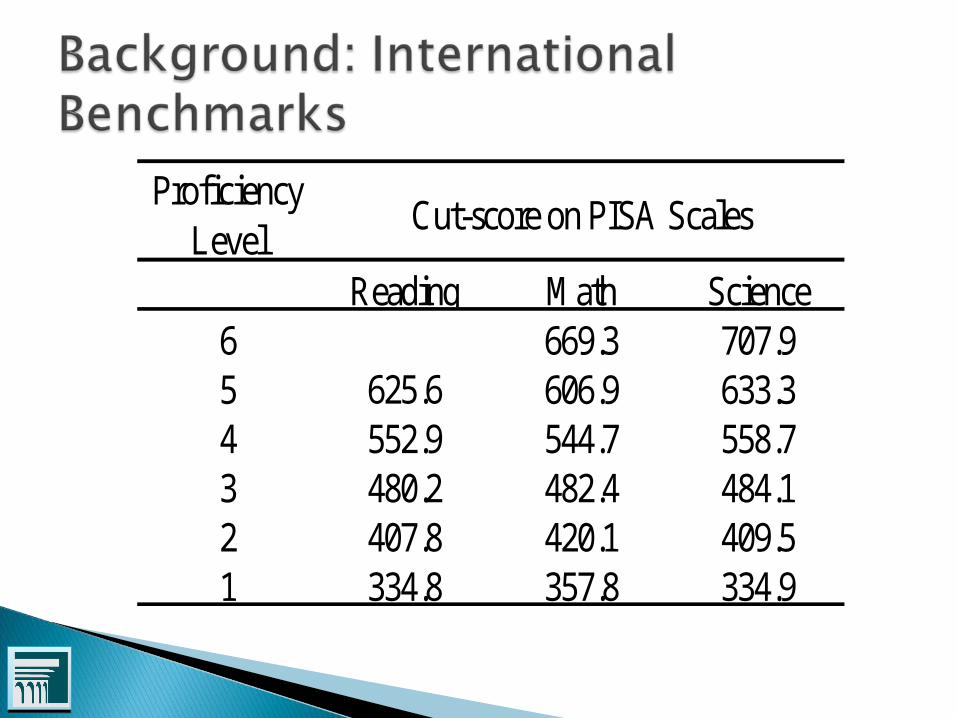
Reading Math Science6 669.3 707.95 625.6 606.9 633.34 552.9 544.7 558.73 480.2 482.4 484.12 407.8 420.1 409.51 334.8 357.8 334.9
Cut-score on PISA ScalesProficiency
Level

Each state develops its own academic content standards
Each state develops its own performance standards
Each state develops its own test
Each state reports adequate yearly progress to the federal government based on
◦ different content standards,
◦ different performance standards,
◦ different tests.
14Gary W. Phillips
American Institutes for Research

Data from the 50 states are not comparable.
◦ No inference about national progress is possible.
◦ We cannot tell if progress in one state is better than progress in another state.
From a scientific point of view the system lacks transparency.
◦ Transparency in measurement is the first and most fundamental requirement for progress in science.
◦ Common metrics are needed for transparency.
◦ The ability to derive comparable measures from different measuring devices is the very definition of transparency.
15Gary W. Phillips
American Institutes for Research

We compare each state achievement standard to a high common international standard.
This gives us a comparable measure against which state standards from different tests can be compared.
16Gary W. Phillips
American Institutes for Research

17Gary W. Phillips
American Institutes for Research
650 A+Advanced 625 A
600 A-575 B+
High 550 B525 B-500 C+
Intermediate 475 C450 C-
425 D+Low 400 D
375 D-Below Low BD
Benchmark on TIMSS & PIRLS
Cut-score on TIMSS &
PIRLS
Phillips (2009) Benchmark
Grade

18Gary W. Phillips
American Institutes for Research
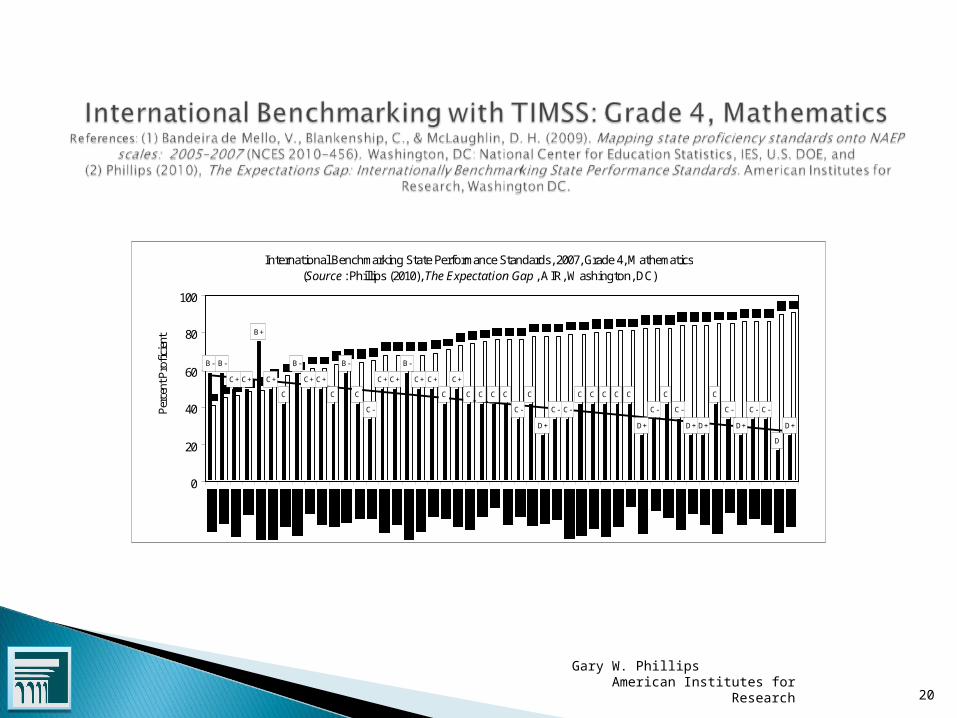
International Benchmarking State Performance Standards, 2007, Grade 4, Mathematics(Source : Phillips (2010), The Expectation Gap , AIR, Washington, DC)
0
20
40
60
80
100
Per
cent
Pro
fici
ent

19Gary W. Phillips
American Institutes for Research
International Benchmarking State Performance Standards, 2007, Grade 4, Mathematics(Source : Phillips (2010), The Expectation Gap , AIR, Washington, DC)
B- B-
D+
D
C-C-
D+
C-
C
D+D+
C-
C
C-
D+
CCCCC
C-C-
D+
C
C-
CCCC
C+
C
C+C+
B-
C+C+
C-
C
B-
C
C+C+
B-
C
C+
B+
C+C+
0
20
40
60
80
100
Per
cent
Pro
fici
ent
20Gary W. Phillips
American Institutes for Research
International Benchmarking State Performance Standards, 2007, Grade 4, Mathematics(Source : Phillips (2010), The Expectation Gap , AIR, Washington, DC)
B- B-
D+
D
C-C-
D+
C-
C
D+D+
C-
C
C-
D+
CCCCC
C-C-
D+
C
C-
CCCC
C+
C
C+C+
B-
C+C+
C-
C
B-
C
C+C+
B-
C
C+
B+
C+C+
0
20
40
60
80
100
Per
cent
Pro
fici
ent

21Gary W. Phillips
American Institutes for Research
Internationally Benchmarking State Performance Standards, 2007, Grade 8, Mathematics(Source : Phillips (2010), The Expectation Gap , AIR, Washington, DC)
0
20
40
60
80
100
Per
cent
Pro
fici
ent

22Gary W. Phillips
American Institutes for Research
Internationally Benchmarking State Performance Standards, 2007, Grade 8, Mathematics(Source : Phillips (2010), The Expectation Gap , AIR, Washington, DC)
B
B-
D
D+D+D+D+
C-C-C-C-
CCC
C-C-
C
D+
C-
C
C-
C
C-
C+
D+
CC
C+
CCC
C+C+C+C+C+
C
C-
C
C+C+C+C+
C
B
C+C+C+
0
20
40
60
80
100
Per
cent
Pro
fici
ent

23Gary W. Phillips
American Institutes for Research
Internationally Benchmarking State Performance Standards, 2007, Grade 8, Mathematics(Source : Phillips (2010), The Expectation Gap , AIR, Washington, DC)
B
B-
D
D+D+D+D+
C-C-C-C-
CCC
C-C-
C
D+
C-
C
C-
C
C-
C+
D+
CC
C+
CCC
C+C+C+C+C+
C
C-
C
C+C+C+C+
C
B
C+C+C+
0
20
40
60
80
100
Per
cent
Pro
fici
ent
24Gary W. Phillips
American Institutes for Research
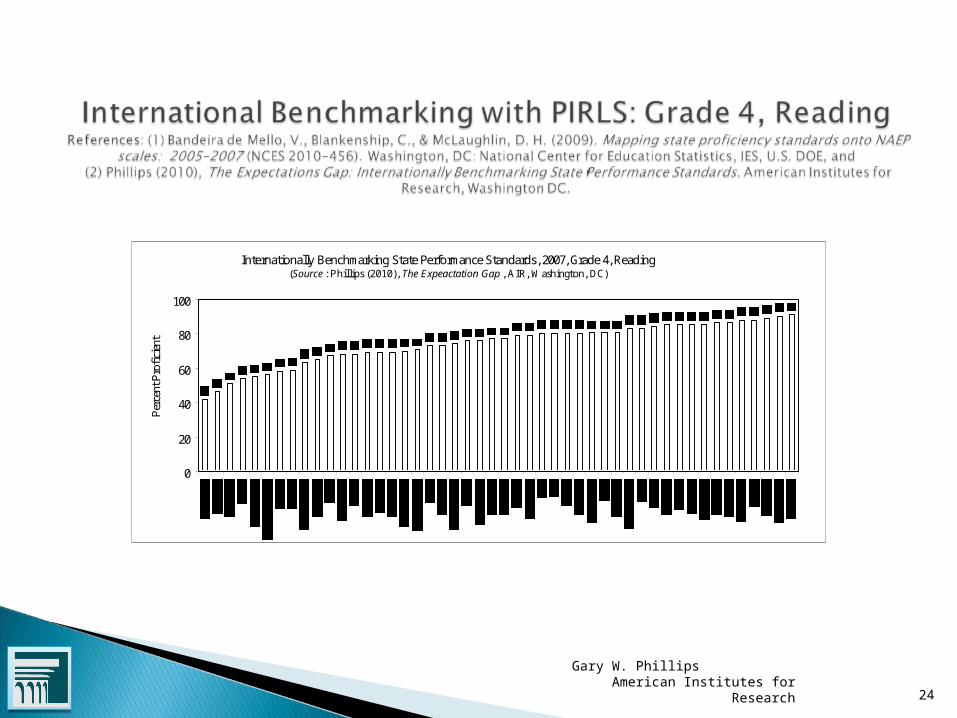
Internationally Benchmarking State Performance Standards, 2007, Grade 4, Reading(Source : Phillips (2010), The Expeactation Gap , AIR, Washington, DC)
0
20
40
60
80
100
Per
cent
Pro
fici
ent

25Gary W. Phillips
American Institutes for Research
Internationally Benchmarking State Performance Standards, 2007, Grade 4, Reading(Source : Phillips (2010), The Expeactation Gap , AIR, Washington, DC)
B-
B
D+
D
C-
C
D+
C-C-C-C-C-C-
C
C-C-
CCC
C+
C-
CCC
C-
C+C+C+
C
C+C+
C
C+C+C+
B-
C
C+
B-B-
C+C+
C
C+
B
C+C+C+
0
20
40
60
80
100
Per
cent
Pro
fici
ent

26Gary W. Phillips
American Institutes for Research
Internationally Benchmarking State Performance Standards, 2007, Grade 4, Reading(Source : Phillips (2010), The Expeactation Gap , AIR, Washington, DC)
B-
B
D+
D
C-
C
D+
C-C-C-C-C-C-
C
C-C-
CCC
C+
C-
CCC
C-
C+C+C+
C
C+C+
C
C+C+C+
B-
C
C+
B-B-
C+C+
C
C+
B
C+C+C+
0
20
40
60
80
100
Per
cent
Pro
fici
ent
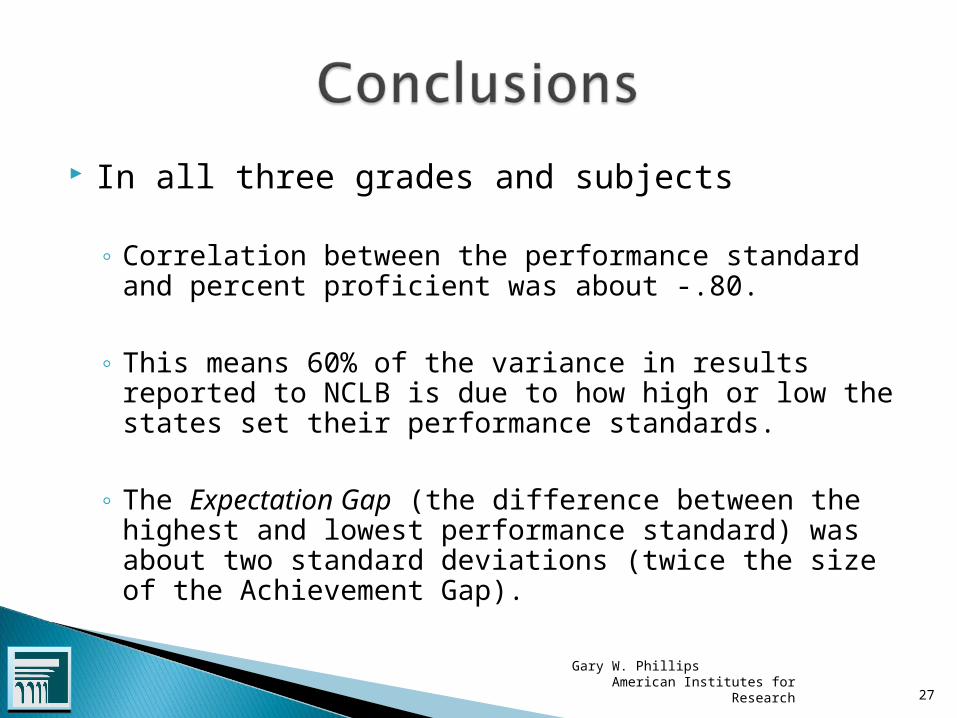
In all three grades and subjects
◦ Correlation between the performance standard and percent proficient was about -.80.
◦ This means 60% of the variance in results reported to NCLB is due to how high or low the states set their performance standards.
◦ The Expectation Gap (the difference between the highest and lowest performance standard) was about two standard deviations (twice the size of the Achievement Gap).
Gary W. Phillips American Institutes for Research 27

The fundamental problem with the existing state testing paradigm is lack of transparency.
◦ Low expectations in most states.
◦ Misleads the public because high levels of proficiency are often obtained by using low standards.
◦ Students in states with low standards do not have the opportunity to learn challenging content.
International benchmarking provides a mechanism for calibrating the difficulty and an external referent for gauging the global competitiveness of each state performance standard.
28Gary W. Phillips
American Institutes for Research
Envisioned by the CCSSO/NGA Common Standards.
Promoted by the Race to the Top Assessment Program competition.
Gary W. Phillips American Institutes for Research 29

Gary W. Phillips American Institutes for Research 30
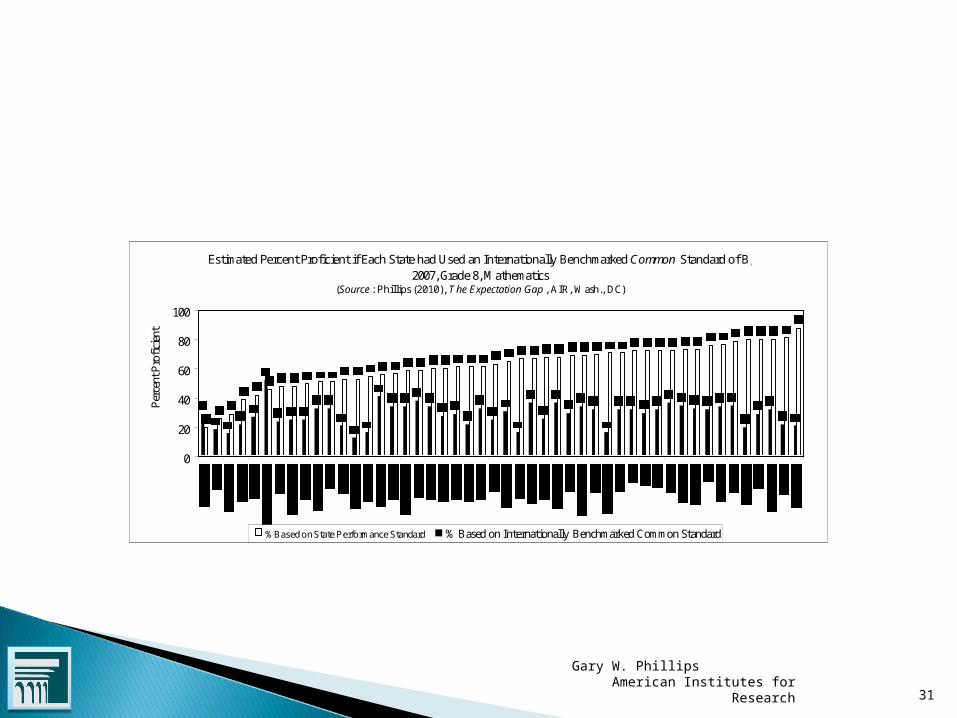
Estimated Percent Proficient if Each State had Used an Internationally Benchmarked Common Standard of B, 2007, Grade 4, Mathematics
(Source : Phillips (2010), The Expectation Gap, AIR, Wash., DC)
0
20
40
60
80
100
Per
cent
Pro
fici
ent
% Based on State Performance Standard % Based on Internationally Benchmarked Common Standard
Gary W. Phillips American Institutes for Research 31
Estimated Percent Proficient if Each State had Used an Internationally Benchmarked Common Standard of B, 2007, Grade 8, Mathematics
(Source : Phillips (2010), T he Expectation Gap , AIR, Wash., DC)
0
20
40
60
80
100
Per
cent
Pro
fici
ent
% Based on State Performance Standard % Based on Internationally Benchmarked Common Standard

Gary W. Phillips American Institutes for Research 32
Estimated Percent Proficient if Each State had Used an Internationally Benchmarked Common Standard of B, 2007, Grade 4, Reading
(Source : Phillips (2010), The Expectation Gap , AIR, Wash., DC)
0
20
40
60
80
100
Per
cent
Pro
fici
ent
% Based on State Performance Standard % Based on Internationally Benchmarked Common Standard

When the data were reanalyzed based on a level playing field there was a dramatic drop among the states reporting the highest levels of proficiency. Using Grade 4mathematics as an example we find:
◦ Tennessee and Colorado dropped from 90% and 91% to 29% and 40%, respectively.
◦ ◦ Massachusetts goes from being one of the states with the
lowest percent proficient (49%) based on NCLB results to the highest achieving state with 63% percent proficient.
◦ This is consistent with NAEP results that indicate Massachusetts is the highest achieving state in the nation.
Gary W. Phillips American Institutes for Research 33


![[Bob Phillips] Phillips' Book of Great Thoughts (Book4You)](https://img.pdfslide.us/doc/110x75/563db77e550346aa9a8b927f/bob-phillips-phillips-book-of-great-thoughts-book4you.jpg)