Embed Size (px)
Citation preview
Gary StudenASTR 4985/13/05
Martian Crater Dating through Isochrons
Introduction
The universe is a vast and seemingly-endless array of space and matter that
harbors many mysteries. Through advances in technology, scientists have been able to
explore space and advance mankind’s understanding of the world around us. Arguably
the most studied object in the universe besides Earth is the planet Mars. The Mars Global
Surveyor (MGS) is an orbiter that was launched in 1996 by N.A.S.A. and is designed to
study the climate, atmosphere, topography, gravity, and other properties of Mars while
also providing high resolution images of the surface. Unlike Earth, Mars has been largely
geologically inactive for a few billion years, which is reflected in the abundance of craters
on the surface. Although craters may seem like mere holes in the ground, they serve the
important function of being able to help scientists date planetary surfaces through crater
dating. This process involves counting the number of craters in an area and using this to
approximate the age of the planetary surface. A large number of craters indicate an older
surface while few craters suggest that the surface has been altered recently.
Crater dating is an important process for two main reasons. First, it allows
scientists to be able to accurately date past stages of geologic activity on a planetary
surface. For example, if a surface is particularly saturated with craters and can be roughly
dated, then it is possible to estimate the last eruption of a nearby volcano. As a result,
scientists can determine if a planet is geologically active at all due to the presence of
craters. Second, crater dating is a way to test various theories about the formation of the
solar system as well as stages within those theories. The heavy bombardment is a period
near the end of the formation of the solar system when large planetesimals slammed into
the surfaces of planets and their moons. A surface that is extremely saturated with
craters, which is the result of being unaltered since heavy bombardment, is evidence for
the heavy bombardment stage of the widely accepted Nebular Theory. These theories can
then be applied to other various solar systems in the universe. Due to crater dating, the
local testing of theories can be applied to systems throughout the galaxy.
A convenient way to plot the measurements of craters is through the use of
isochrons. An isochron is a plot of crater size vs. crater density for one particular age.
Parallel curves are created when multiple ages are plotted. When plotting isochrons, the
log of both the crater size and crater density is used to produce a straight isochron. The
isochrons that I am using were derived by William K. Hartmann. Hartmann attempted to
create more precise isochrons and created the ones he used in his testing based on data
from the Moon. One fact about craters accepted by scientists is that smaller craters
should be more abundant than larger ones. Therefore, an inverse relationship exists

between crater size and crater density. The main goal in my experiment of counting
craters is to have my data lie on an isochron or between two isochrons, which would
allow me to estimate the age it best represents. It is particularly difficult to have my data
match up exactly to an isochron that is plotted or that can be estimated because of the
small size of my sample. However, if by eye, my data is generally linear once it is plotted,
then I am able to approximate the various ages of the surfaces I sampled.
Data
All of the data I used in my testing originates from the Malin Space Science
Systems (MSSS), which extensively analyzed the data sent back by the MGS. The
images referenced were taken by the Mars Orbital Camera (MOC) and then MSSS
derived the various measurements applicable to the images, such as the length and width
(in meters), pixel to meter conversion, and latitude and longitude of the image to name a
few. These various derivations were placed into tables along with the images, which were
given a name that I will reference. Particular information regarding MSSS and the MOC
can be ascertained from the MSSS website at http://www.msss.com/moc_gallery/. The
following is information listing the crater name and the applicable data used that was
gathered from MSSS.
CraterName
M03-00005
R02-00837
M01-00392
R10-04230
M12-00992
M07-05058

Longitudeof imagecenter
180.10ºW
6.46ºW 280.63ºW
356.76ºW
299.41ºW
269.43ºW
Latitude ofimagecenter
34.76ºS 29.56ºS 20.98ºS 30.05ºS 29.32ºN 1.40ºN
Scale pixelwidth(meters)
237.88 247.17 235.31 246.85 254.19 242.42
Scaledimagewidth(kilometers)
176.34 119.88 253.18 119.73 123.27 117.38
Scaledimageheight(kilometers)
253.72 119.93 1014.96 118.82 117.07 118.84
Analysis
Measurement of Crater Sizes
The first step towards plotting my crater sizes involved physically counting and
measuring the craters in the various images. Since I measured the craters by hand, the
craters had to physically be large enough in order to ascertain a proper measurement.
Therefore, I had to create a limit as to how small the crater could be in order for my eyes
to distinguish it properly. The smallest craters I decided to include in my data are around
3-4 pixels in size. I used a tool for measuring distances, in pixels, in an image editing
program called GIMP (http://www.gimp.org). In order to be as accurate as possible, I
measured the diameter of the perceived long side of the crater and then the diameter of
the angle perpendicular to the previous measurement. I then took the average of those two
numbers.
Conversion to Kilometers
All of the measurements that were made were done in pixels. Therefore, I had to
convert the various pixel sizes into kilometers before I plotted my data. As previously
stated, MSSS provided all of the necessary conversion information so I simply had to use
the scaled pixel width to convert all of my measurements. The scaled pixel width was in
meters, which required me to convert the meters into kilometers and then multiply the
average pixel size of each crater by the scaled pixel width in kilometers. For example,
one crater in the image M03-00005 averaged 14 pixels in size with a scaled pixel width in
meters of 237.88. Therefore, the calculation to convert the crater size into kilometers is
simply (14*(237.88/1000)), which is 24.72 kilometers.
Binning Method
The process of binning involves placing the craters into various categories based
on their size. This is done in order to reduce the significance of each data point by
mitigating the effects of an error in size measurement. I created eight different categories
of crater sizes in kilometers as follows: a) 0.25 < 0.5, b) 0.5 < 1, c) 1 < 2, d) 2 < 4, e) 4 <
8, f) 8 < 16, g) 16 < 32, h) 32 < 64. Once each crater was placed into its respective bin, I

counted the number of craters corresponding to each bin and calculated the average size
of the craters in that bin. The average size of the craters in each bin would be the number
used in plotting each bin along with calculating the error of each point that was plotted.
Error Calculation
As with any experiment, there is a degree to which error is a possibility in
explaining the results. In this case, there is a degree to which the number of craters
counted for a particular surface as well as their sizes is incorrect. I chose to treat my data
as a Poisson distribution in determining the error. A Poisson distribution assumes that
the observances in any situation are largely random. Therefore, I applied Poisson’s
theory by assuming the number of craters in each bin was random within a particular area
observed. Poisson derived the value for the error as the vN (where N is the number).
However, the average sizes in each bin only correspond to specific area. The error
then is now (vN)/A (where A is the area). For each bin the crater density therefore
becomes N/A +/- (vN)/A. When the log of the entire equation is taken, the error is not
symmetric so it results in an upper and lower limit. The upper limit then becomes the log
(N/A + (vN)/A) and the lower limit is the log(N/A - (vN)/A). For example, in the image
M03-00005, the bin for sizes of 1 < 2 km has 11 craters. Therefore, the crater density is
N/A, which equals 11/ 44740.98 km2 or 0.00024586 per km2 and the log of that is
-3.60931. The error of (vN)/A equals (v11)/ 44740.98 km2 or 7.41E-05 per km2 The

upper limit becomes log(0.00024586 + 7.41E-05) = -3.49486 and the lower limit is the
log(0.00024586 - 7.41E-05) = -3.76515. In some cases where the number of craters in a
bin was equal to one, when deriving the lower limit it would turn out that N/A and (vN)/
A were equal, which would produce an indeterminate result since the log of 0 is
undefined. When this was the case, I made the lower limit equal to the upper limit in
order to have an error to plot.
Isochron Plotting and Age Determination
M03-00005
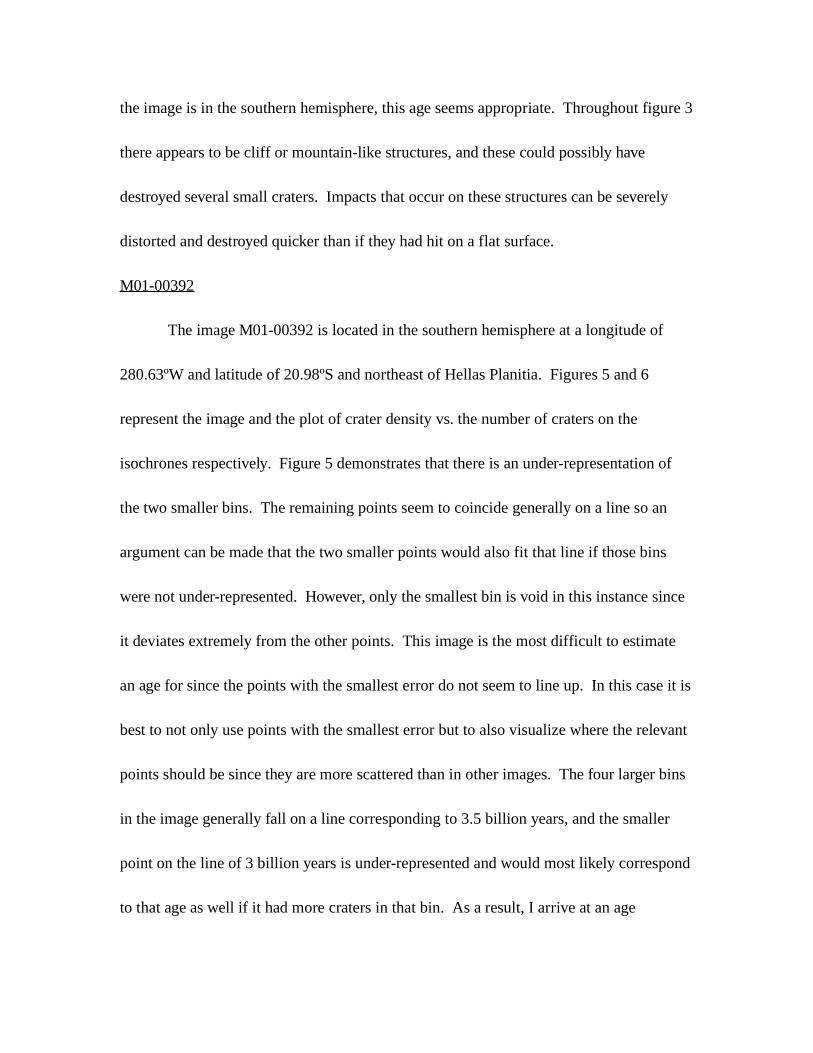
The image M03-00005 is located at longitude 180.10ºW and latitude 34.76ºS. On
a map of Mars, this puts it in the southern hemisphere and east of Terras Cimmeria. The
corresponding image is figure 1 and the plot of crater density vs. the number of craters on
the isochrons is figure 2. By analyzing the points on the plot, it becomes apparent that
the middle points are parallel to an isochron, but not all of the points follow the expected
relation. An occurrence in this image and many others were points that deviated from the
general linear plot that resulted. These points are characteristic of both the under-
representation and over-representation of certain craters. As I stated previously, it is
generally the case that smaller craters should be more abundant than larger craters due to
the fact that there were many more small objects than large ones in the solar system.
However, this image has both an abnormally low crater density for the smallest bin and an

abnormally high crater density for the largest bin. This observance reflects a problem
mentioned earlier about limiting factors in crater counting.
Since I performed crater measurements by hand, I had to set a minimum pixel
limit so that I could properly see all sides of the crater and produce an accurate
measurement. However, figure 1 has many small craters that I simply did not have the
capacity to measure, and I also may have missed measuring some craters that were near
my minimum pixel size threshold. These craters that were not counted resulted in the
smallest bin being under-represented. In addition, there are several fairly large craters in
the image, which is an over-representation for the large bins. As a result, the two outside
plots on the graph are void due to their inaccuracy. The remaining three points can be
used to estimate by eye a best fit line and the corresponding age measurement based on
other isochrons. These points roughly fall in between the isochrons of 1 billion and 3
billion years old, which would make the age estimation around 2 billion years old, but the
error on the smaller bin is significantly lower than the error on the larger bin. As a result,
this point is weighted more heavily, and I arrive at an estimation corresponding to an age
of about 1.5 billion years old. Since the image is in the southern hemisphere, it would be
expected that the surface would be much older, which will be the case in the other
images. However, there are explanations that can account for this unusually young age.
The possibility exists that craters in the image have been destroyed. By analyzing
the features in the image, it can be determined if this is a likelihood. In the upper right
hand corner of figure 1, a white streak is observed to run from a large crater. This streak
could be outflow in the form of a dried up river channel or a cliff. These types of features
distort or even destroy craters. In addition, a few craters in the image seem shallow and
appear to be covered in dust. These craters could simply have been covered up by the
large amounts of dust that gets strewn about Mars. As a result, smaller craters would be
the first to be erased, which further emphasizes the under-representation of small craters.
R02-00837
At a location of longitude 6.46ºW and latitude 29.56ºS, the image R02-0083 lies
in the southern hemisphere of Mars and slightly northeast of Argyre Planitia. The image
and crater density vs. the number of craters plot on the isochrons is figures 3 and 4
respectively. Similar to the case in the previous image, there is both an under-
representation of the smallest bin and over-representation of the larger bin. However, in
this image the second largest bin is also over-represented, which makes it void as well. In
addition, there are many small craters that were below my required pixel size and several
large craters, which explain this problem. Please see the previous section for an
explanation of this occurrence. Therefore, the remaining four points can be used to
estimate the approximate age. These points all hover around an isochron corresponding
to an age of roughly 3.2 billion years with minimal error in two of the four points. Since
the image is in the southern hemisphere, this age seems appropriate. Throughout figure 3
there appears to be cliff or mountain-like structures, and these could possibly have
destroyed several small craters. Impacts that occur on these structures can be severely
distorted and destroyed quicker than if they had hit on a flat surface.
M01-00392
The image M01-00392 is located in the southern hemisphere at a longitude of
280.63ºW and latitude of 20.98ºS and northeast of Hellas Planitia. Figures 5 and 6
represent the image and the plot of crater density vs. the number of craters on the
isochrones respectively. Figure 5 demonstrates that there is an under-representation of
the two smaller bins. The remaining points seem to coincide generally on a line so an
argument can be made that the two smaller points would also fit that line if those bins
were not under-represented. However, only the smallest bin is void in this instance since
it deviates extremely from the other points. This image is the most difficult to estimate
an age for since the points with the smallest error do not seem to line up. In this case it is
best to not only use points with the smallest error but to also visualize where the relevant
points should be since they are more scattered than in other images. The four larger bins
in the image generally fall on a line corresponding to 3.5 billion years, and the smaller
point on the line of 3 billion years is under-represented and would most likely correspond
to that age as well if it had more craters in that bin. As a result, I arrive at an age

estimation of approximately 3.5 billion years. This age seems appropriate due to the
image being located in the southern hemisphere. In figure 4, many of the craters appear
to be shallow, and it is possible that dust has largely filled in these craters and even
completely erased smaller ones.
R10-04230
At longitude 356.76ºW and latitude 30.05ºS, the image R10-04230 is north of
Noachis Terra in the southern hemisphere of Mars. Figure 7 is the image and figure 8 is
the plot of crater density vs. the number of craters on isochrons. As figure 8
demonstrates, there is once again an under-representation of the smaller bin. The
remaining four points generally fall in the same region. However, the smallest bin
included has a much smaller error than the larger bin, which results in it being weighted
heavier. As a result, I chose an age estimation corresponding to 3.2 billion years. This
age seems appropriate for its location.
The presence of wind in this image is essential in understanding the large under-
representation that was in the smallest bin. In figure 7, there are white streaks extending
out the right side of many craters. This is indicative of the fact that the presence of dust
due to the wind could possibly have destroyed small craters. In addition, there are a large
number of shallow craters. Dust seems to have filled in these craters, and even some of
the smallest craters are becoming difficult to discern in the image.

M12-00992
The image M12-00992 is located at longitude 299.41ºW and latitude 29.32ºN. It
is northeast of Isidis Planitia in the northern hemisphere of Mars. The corresponding
image is figure 9 and the plot of crater density vs. the number of craters on isochrons is
figure 10. In this image, there is a slight under-representation of the smaller bin, and a
large over-representation of the larger bin. When looking at figure 9, it is apparent that
there are many large craters and very few small craters, which distorts the representation
of the bins when plotted. There are so many large craters in this image that the large bin
actually passes the saturation line. However, this bin is so over-represented, and since it
is impossible for a point to pass the saturation line in theory, the larger bin is void in this
case. The three remaining points hover around a line corresponding to 3.4 billion years,
which is the age I have chosen. This age seems old based on the fact that this image lies
in the northern hemisphere. Although, figures 1 and 2 prove it is not unlikely for an
image’s age to not reflect the general knowledge about that terrain.
When looking at figure 9, several striking features are present that help explain
the unexpected old age of that particular area. There appears to be a series of large
craters in a row. One explanation is that a rather large object hit this area on Mars and
actually broke up into several different pieces that resulted in chain impacts. These large
impacts would have erased many craters that were in the area. In addition, a large crack
runs though almost the entire image, which could represent a cliff or mountain. This
crack could have also erased small craters from this image. As a whole, this image is rare
anomaly in the sense that there is an extreme over-representation of large craters, which
even passed the established saturation line.
M07-05058
The image M07-05058 is located at longitude 269.43ºW and latitude 1.40ºN. It is
in the northern hemisphere of Mars and south of Syrtis Major Planitia. The
corresponding image is figure 11 and the plot of crater density vs. the number of craters
on isochrons is figure 12. Figure 12 demonstrates that both the smallest and largest bin
are void due to under-representation and over-representation. The remaining three points
largely deviate from a line, which makes it difficult to attribute them to a particular
isochron. Therefore, it is appropriate to set a minimum age for this image since the data
does not enable me to be more precise. The smallest of the three bins has a minor error
compared to the rest of the data and is located at about 3.2 billion years old. However,
the remaining two points are much closer between 3.6 billion years and 4 billion years.
As a result, I am estimating the age of this surface to be at least 3.3 billion years old. The
fact that two of the three bins represent a much older age than the third elevates the
minimum age from 3.2 billion years to about 3.3 billion years. This age seems young
since the image is located in the northern hemisphere. However, it is not too far from the

equator, which does not allow me to be as definitive with my assessment of the age being
young since the differences in the terrains between the hemispheres is speculative at the
equator.
Figure 11 is similar to figure 9 in that there are several large craters and a crack
that runs through a large portion of the image. The high number of large craters explains
the over-representation of the largest bin that crosses the saturation line. The crack in the
image has probably erased several of the smaller craters, which attributes to the under-
representation of the smaller craters.
Improvements for Future
After performing my research involving the dating of planetary surfaces based on
crater counting, there are two main factors I have determined that should be considered in
order to improve the results in future replications of this nature. In almost every image, I
had some combination of the under-representation or over-representation of my small and
large bins. As a result, I had to eliminate two data points in some cases from my age
assessment. It is critical to choose images that have a large amount of craters so that the
some of the results are not invalidated. Initially, I simply picked images because they
were aesthetically pleasing, which often meant images with several large craters and was
unaware as to how important small craters were. On this same note, I feel it is important
to have a computer program actually measure the sizes of craters. A computer program is

much more accurate than measuring with a distance tool in a program similar to GIMP,
especially in regards to craters that approached my size threshold. It is possible that I
incorrectly measured many of the small craters because it was difficult for my eye to
discern them properly. Even in regards to large craters, it was often hard to tell where the
biggest diameters appeared to be due to the chaotic terrain in the images.
Conclusion
Although my experiment with crater counting had a few limiting factors, it was
generally successful. I was able to plot the various bins and estimate the ages based on
the isochrons that Hartmann derived because the points that I had generally coincided on
or near a line. In the cases where my data was not as accurate, there were details within
the images that allowed me to hypothesize the lack of particular sizes of craters in the
images. It is definitely possible to replicate Hartmann’s work, which is a testament to the
validity of his isochrons. As crater counting becomes a more technical means of
estimating the ages of planetary surfaces, its accuracy can only increase, and it will
continue to provide insight about the mysteries that exist in our galaxy.

Appendix
Figure 1
Age: 1.5 billion years
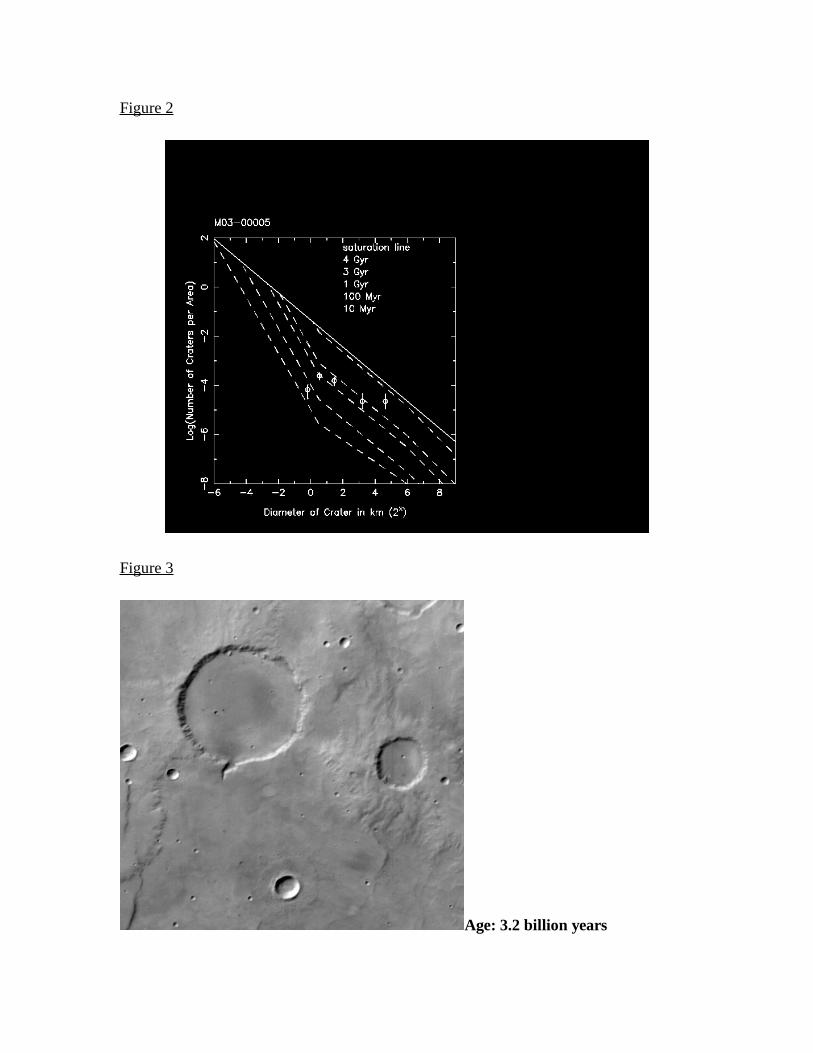
Figure 2
Figure 3
Age: 3.2 billion years
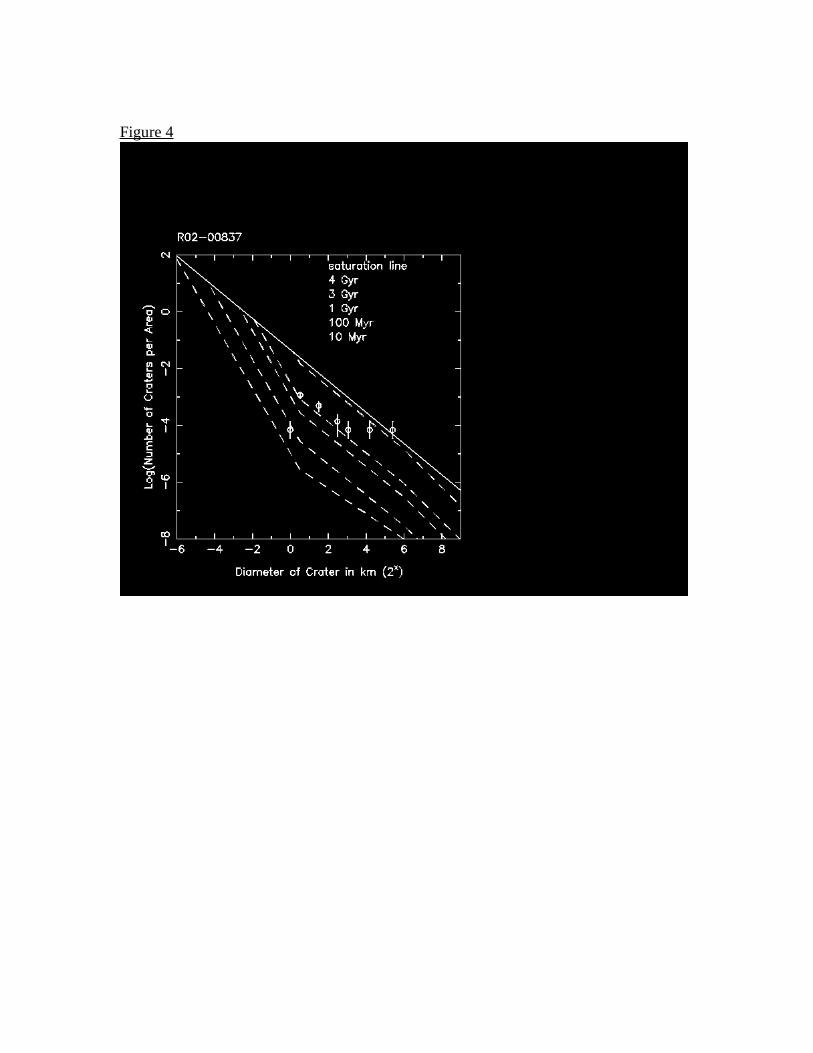
Figure 4
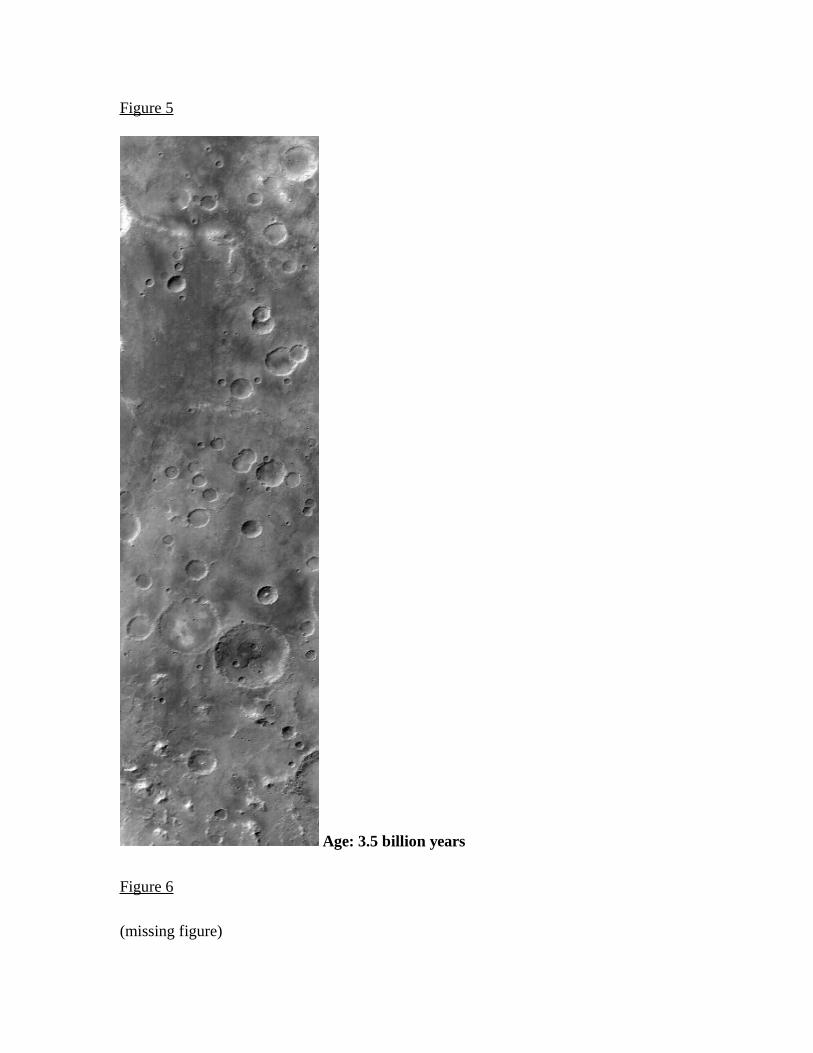
Figure 5
Age: 3.5 billion years
Figure 6
(missing figure)

Figure 7
Age: 3.2 billion years
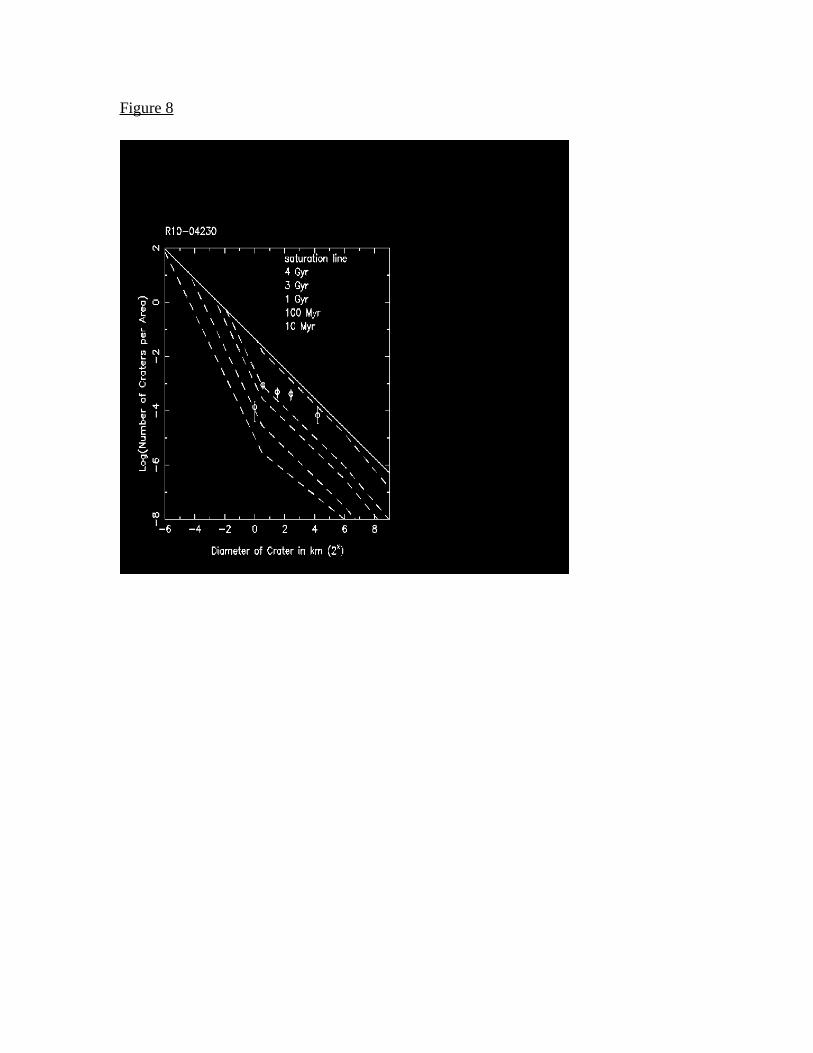
Figure 8
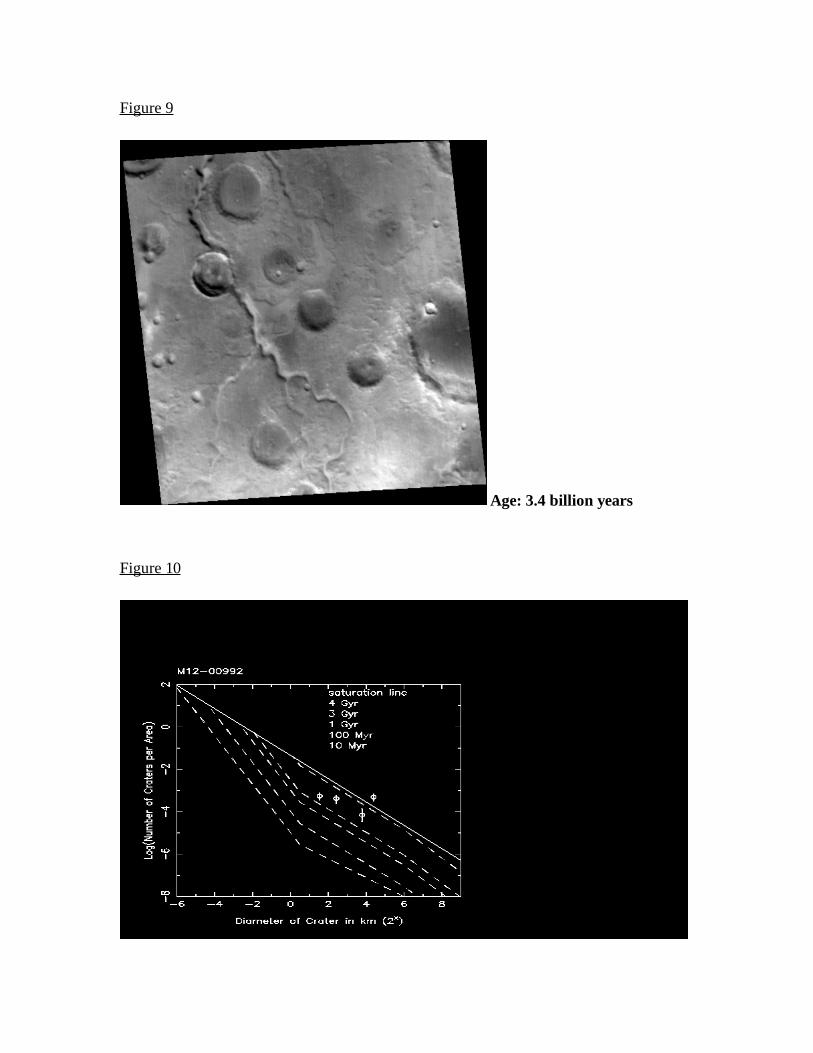
Figure 9
Age: 3.4 billion years
Figure 10
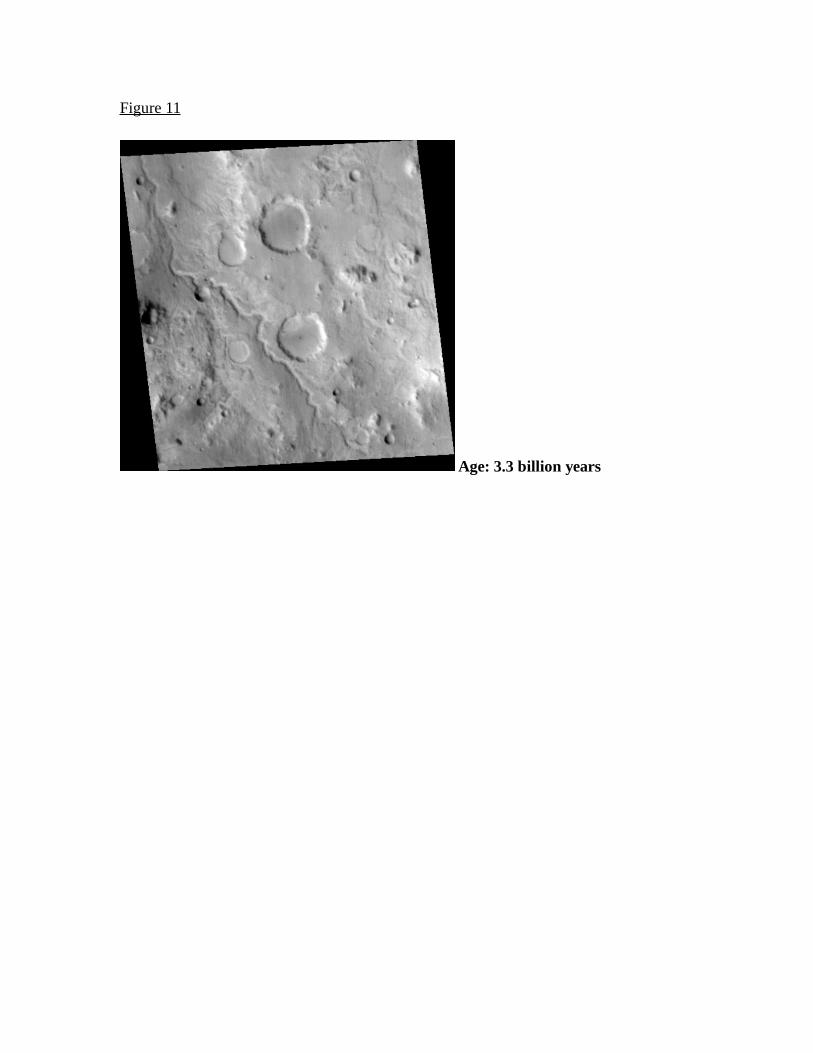
Figure 11
Age: 3.3 billion years
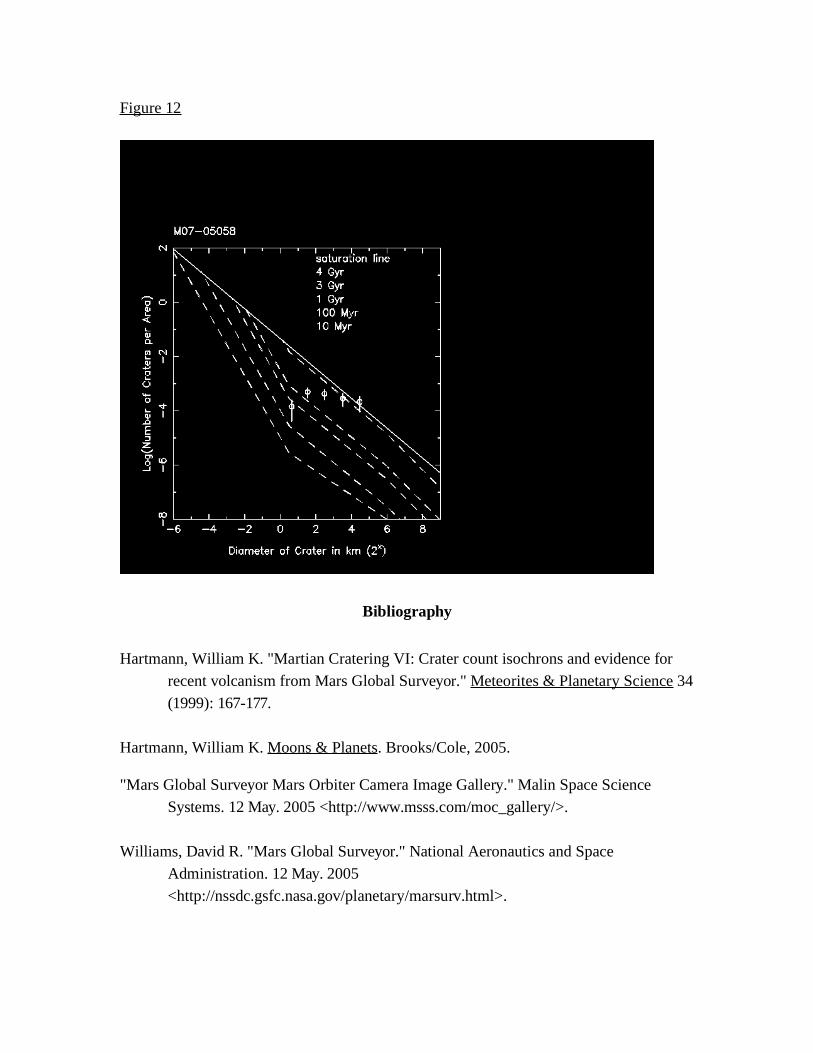
Figure 12
Bibliography
Hartmann, William K. "Martian Cratering VI: Crater count isochrons and evidence forrecent volcanism from Mars Global Surveyor." Meteorites & Planetary Science 34(1999): 167-177.
Hartmann, William K. Moons & Planets. Brooks/Cole, 2005.
"Mars Global Surveyor Mars Orbiter Camera Image Gallery." Malin Space ScienceSystems. 12 May. 2005 <http://www.msss.com/moc_gallery/>.
Williams, David R. "Mars Global Surveyor." National Aeronautics and SpaceAdministration. 12 May. 2005<http://nssdc.gsfc.nasa.gov/planetary/marsurv.html>.