Embed Size (px)
Citation preview
Supplemental Digital Content
Readmissions to Intensive Care: A prospective multicenter study in Australia and New Zealand
Authors
John D Santamaria MD,
Graeme J Duke MD
David V Pilcher MD
D James Cooper MD
John Moran MD
Rinaldo Bellomo MD
Participating Hospitals
New Zealand: Auckland City Hospital (Cardio Thoracic & Vascular ICU), Auckland; Auckland City Hospital, Department Critical Care Medicine, Auckland; Christchurch Hospital, Christchurch; Hawke’s Bay Hospital, Hastings; Middlemore Hospital, Papatoetoe; Tauranga Hospital, Tauranga; Wellington Hospital, Wellington.
Australia:ACT: Canberra Hospital, Garran.NSW: Blacktown Hospital, Blacktown; ,Concord Repatriation General Hospital, Concord; John Hunter Hospital, New Lambton; Lismore Base Hospital, Lismore; Liverpool Hospital, Liverpool; Nepean Hospital, Kingswood; Prince of Wales Hospital, Randwick; Royal Prince Alfred Hospital, Camperdown; St George Hospital, Kogarah; St Vincent’s Hospital Darlinghurst; Westmead Hospital, Westmead. NT: Royal Darwin Hospital, Darwin.QLD: Townsville Hospital, Douglas; Wesley Hospital, Auchenflower.SA: Flinders Medical Centre, Bedford Park; Queen Elizabeth Hospital, Woodville South; TAS: Royal Hobart Hospital, Hobart.VIC: Alfred Hospital, Melbourne; Austin Hospital, Heidelberg; Bendigo Hospital, Bendigo; Box Hill Hospital, Box Hill; Central Gippsland Hospital, Sale; Frankston Hospital, Frankston; Geelong Hospital, Geelong; Monash Medical Centre, Clayton; Royal Melbourne Hospital, Melbourne; St Vincent’s Hospital Melbourne, Fitzroy; The Northern Hospital, Epping; Western Hospital, Footscray.WA: Fremantle Hospital, Fremantle; Royal Perth Hospital, Perth; Sir Charles Gairdner Hospital, Nedlands.
Page 1

Legend of Supplemental Digital Content
Table E1. Characteristics of the participating Intensive Care Units
Table E2: Data Dictionary for Discharge & Readmission Evaluation (DARE) Study
Table E3. Primary diagnosis category on admission to ICU (APACHE III, major groups)
Table E4. Twenty (20) most common primary admission diagnoses (APACHE III)
Table E5. Readmission rates according to primary admission diagnosis
Figure E1. Distribution of days between original ICU discharge and readmission to ICU according to planned or unplanned status.
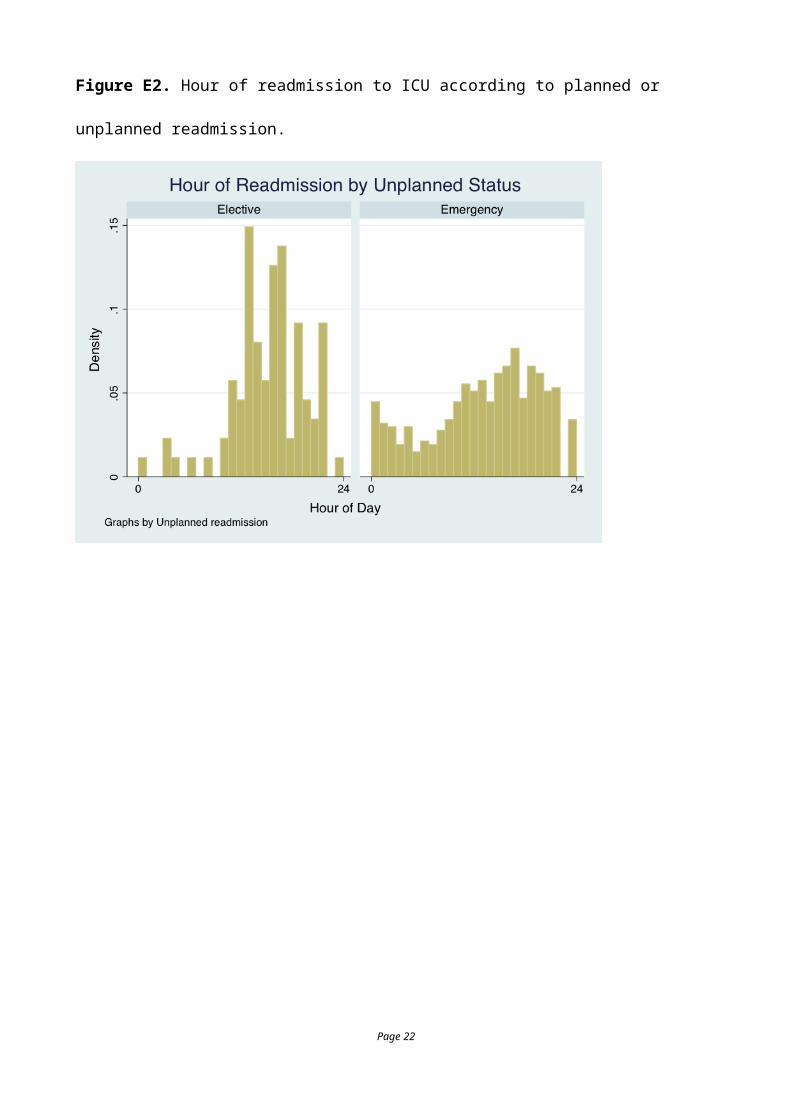
Figure E2. Hour of readmission to ICU according to planned or unplanned readmission.
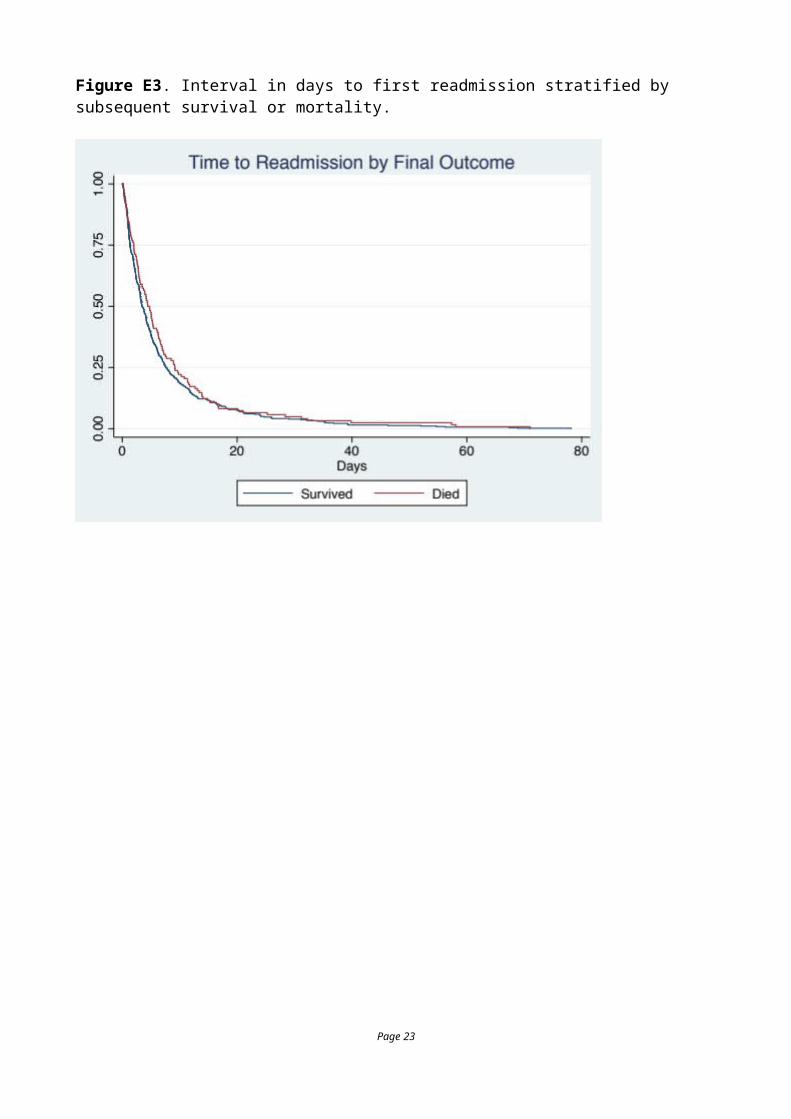
Figure E3. Interval in days to first readmission stratified by subsequent survival or mortality.
Table E6. Comparison of early vs late readmission
Table E7. Comparisons between patients not readmitted (9626) and first readmission to ICU (581).
Table E8. Diagnoses on first and second ICU admission in 581 readmitted patients
Table E9 Results of fixed effects logistic regression predicting unplanned readmission following the first ICU discharge
Table E10.Estimates for the frailty model using STRMCURE.
References
Page 2
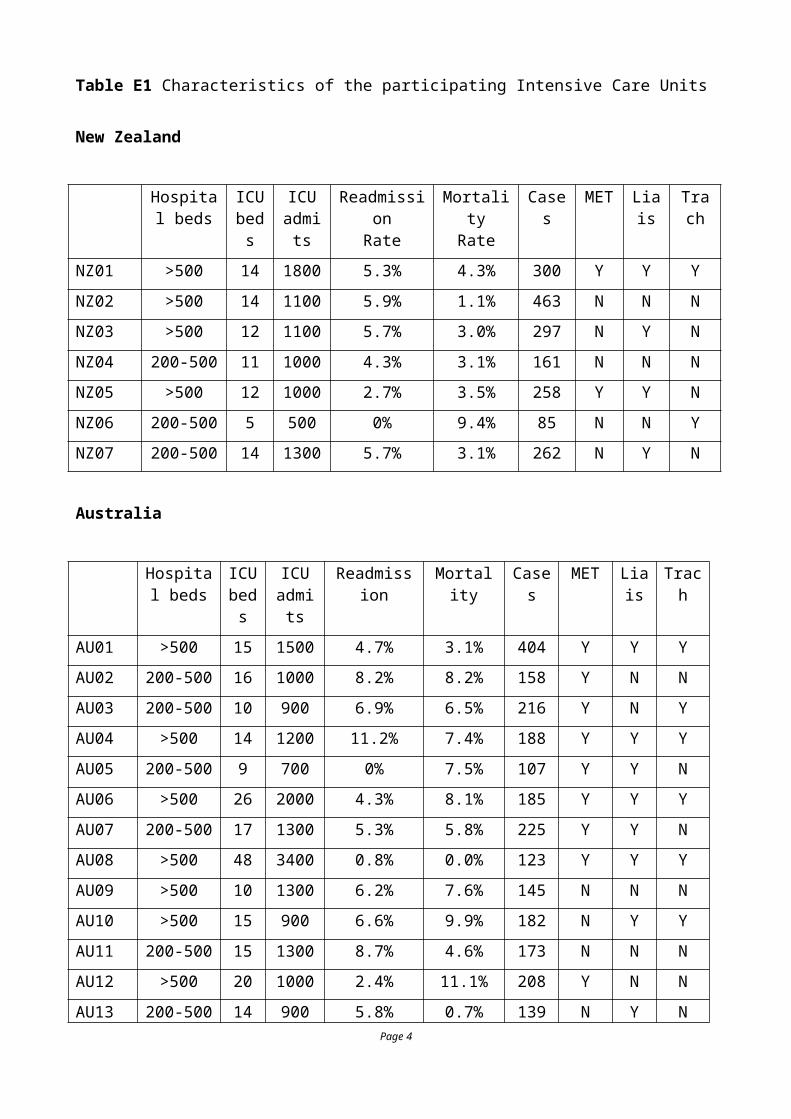
Table E1 Characteristics of the participating Intensive Care Units
New Zealand
Hospital beds
ICU beds
ICU admits
ReadmissionRate
MortalityRate
Cases MET
Liais Trach
NZ01 >500 14 1800 5.3% 4.3% 300 Y Y Y
NZ02 >500 14 1100 5.9% 1.1% 463 N N N
NZ03 >500 12 1100 5.7% 3.0% 297 N Y N
NZ04 200-500 11 1000 4.3% 3.1% 161 N N N
NZ05 >500 12 1000 2.7% 3.5% 258 Y Y N
NZ06 200-500 5 500 0% 9.4% 85 N N Y
NZ07 200-500 14 1300 5.7% 3.1% 262 N Y N
Australia
Hospital beds
ICU beds
ICU admits
Readmission Mortality Cases MET Liais
Trach
AU01 >500 15 1500 4.7% 3.1% 404 Y Y Y
AU02 200-500 16 1000 8.2% 8.2% 158 Y N N
AU03 200-500 10 900 6.9% 6.5% 216 Y N Y
AU04 >500 14 1200 11.2% 7.4% 188 Y Y Y
AU05 200-500 9 700 0% 7.5% 107 Y Y N
AU06 >500 26 2000 4.3% 8.1% 185 Y Y Y
AU07 200-500 17 1300 5.3% 5.8% 225 Y Y N
AU08 >500 48 3400 0.8% 0.0% 123 Y Y Y
AU09 >500 10 1300 6.2% 7.6% 145 N N N
AU10 >500 15 900 6.6% 9.9% 182 N Y Y
AU11 200-500 15 1300 8.7% 4.6% 173 N N N
AU12 >500 20 1000 2.4% 11.1% 208 Y N N
AU13 200-500 14 900 5.8% 0.7% 139 N Y N
AU14 200-500 13 1000 1.7% 2.5% 359 Y N N
AU15 200-500 19 1600 6.2% 2.9% 275
AU16 >500 29 2100 7.0% 7.2% 471 Y N N
AU17 200-500 14 900 7.3% 8.9% 191 Y Y Y
AU18 >500 17 1200 4.7% 3.8% 442 Y Y Y
Page 3
AU19 >500 18 2100 7.7% 7.0% 442 Y Y Y
AU20 200-500 28 1800 9.2% 4.7% 510 Y Y Y
AU21 200-500 7 600 5.6% 4.0% 124 Y Y N
AU22 200-500 9 700 6.8% 10.5% 190 N Y N
AU23 200-500 6 300 4.8% 4.8% 83 Y Y N
AU24 200-500 8 800 3.4% 1.7% 174 Y Y N
AU25 200-500 11 1400 5.4% 3.0% 331 Y Y Y
AU26 >500 19 1600 4.2% 6.4% 312 Y Y N
AU27 200-500 10 800 7.0% 6.0% 199 Y Y Y
AU28 200-500 24 2100 7.1% 6.7% 449 Y Y N
AU29 200-500 11 1100 5.7% 5.0% 565 Y Y Y
AU30 200-500 12 800 6.0% 7.3% 150 Y Y N
AU31 >500 18 1400 7.4% 6.7% 299 Y N N
AU32 200-500 12 800 0% 5.7% 105 N Y N
AU33 >500 31 2700 4.6% 6.2% 389 Y N N
Cases: number of cases provided in the study. MET: presence of medical emergency or rapid response team in the hospital run by ICU. Lias: presence of nurses from ICU specifically to follow patients on the ward. Trach: multidisciplinary team to follow patients with tracheostomy on ward.
There were 5 units situated in regional centres (where short term mechanical ventilation and even renal replacement therapy would be considered); 9 in metropolitan centres (where medium to long term ventilation, renal replacement therapy would be undertaken, and transfers made for specialist cardiac surgery, neurosurgery etc.); 17 tertiary units (ventilation, renal replacement, cardiac surgery and neurosurgery with occasional transfers for quaternary services); 9 centres offering specific quaternary services that might include heart/lung transplant, liver transplant, burns, bone marrow transplantation. Thirty-five of ICUs had University affiliation.
Page 4
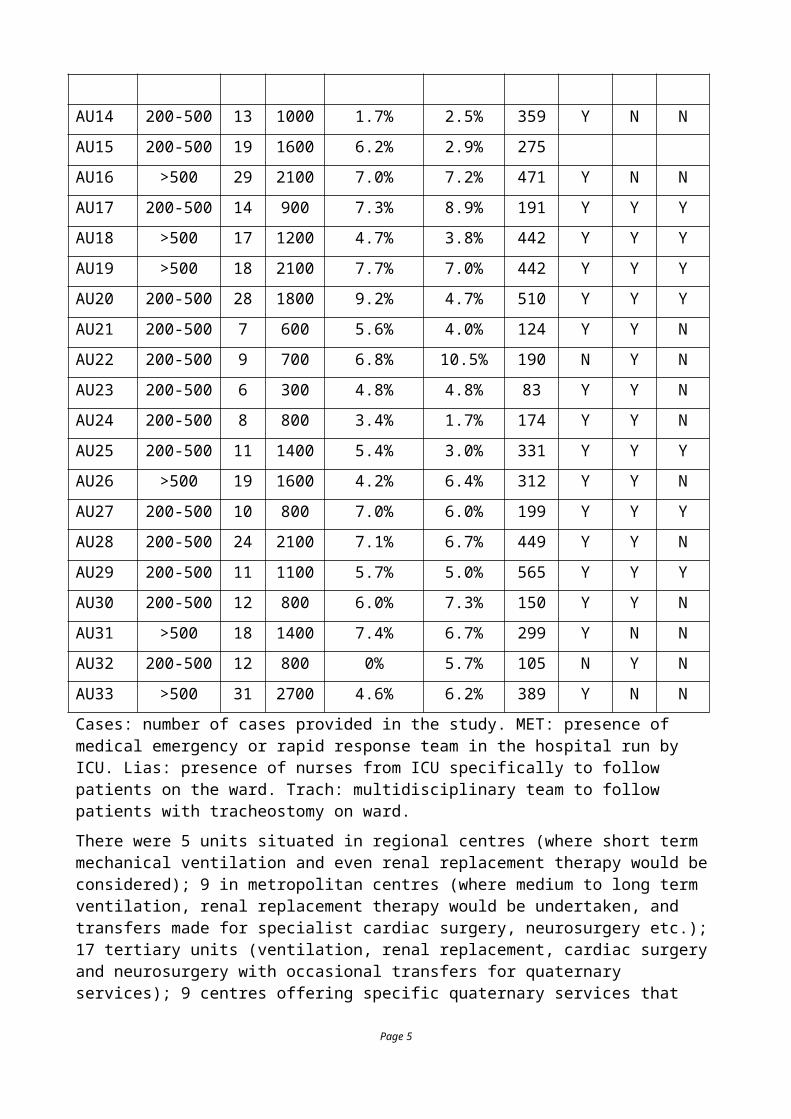
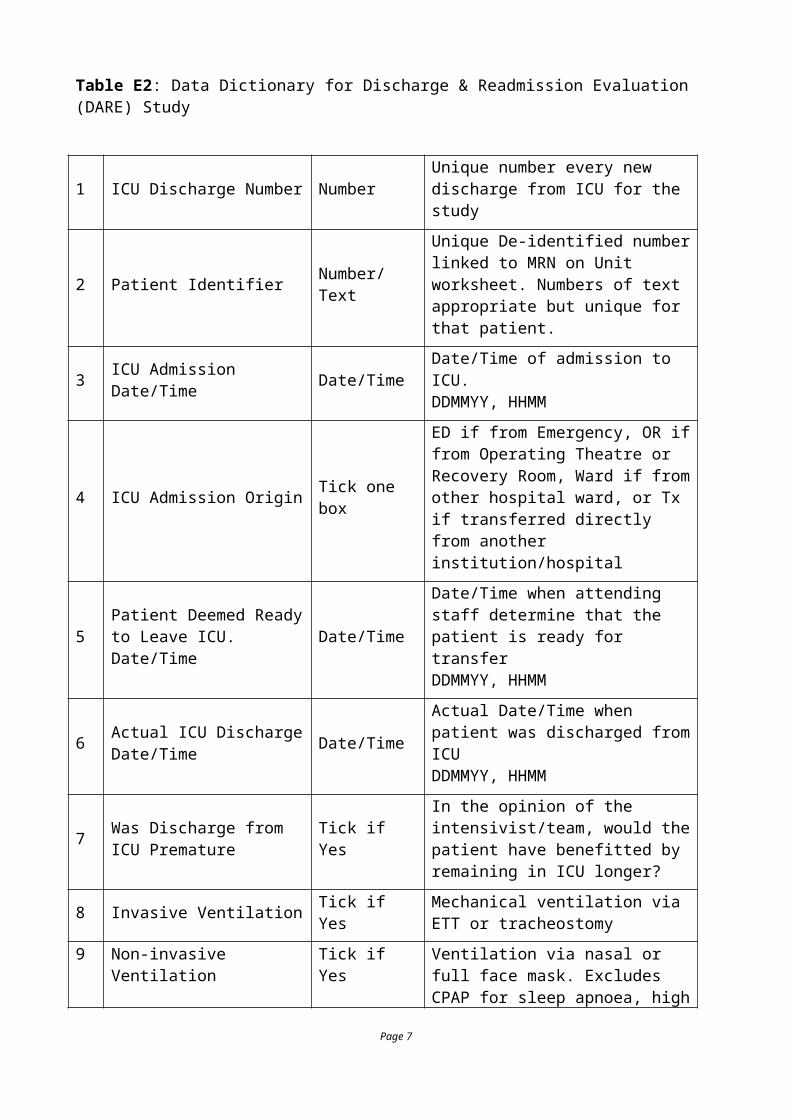
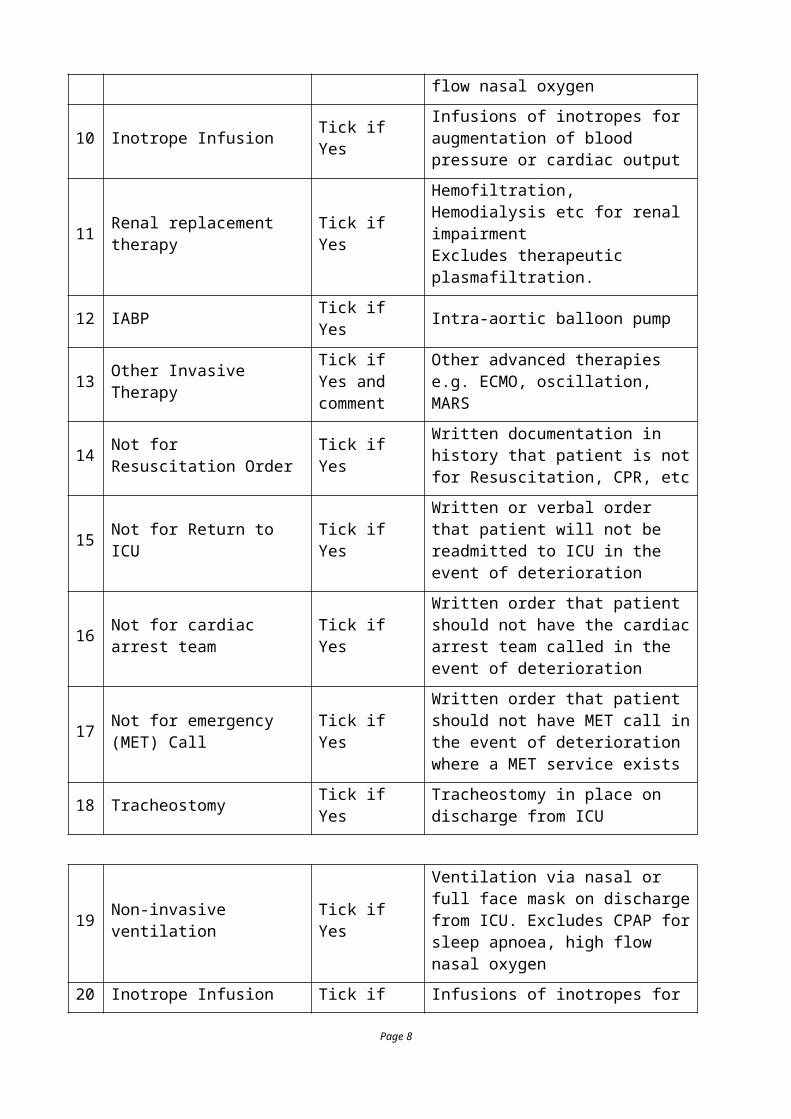
Table E2: Data Dictionary for Discharge & Readmission Evaluation (DARE) Study
1 ICU Discharge Number Number Unique number every new discharge from ICU for the study
2 Patient Identifier Number/Text
Unique De-identified number linked to MRN on Unit worksheet. Numbers of text appropriate but unique for that patient.
3 ICU Admission Date/Time Date/Time Date/Time of admission to ICU.DDMMYY, HHMM
4 ICU Admission Origin Tick one box
ED if from Emergency, OR if from Operating Theatre or Recovery Room, Ward if from other hospital ward, or Tx if transferred directly from another institution/hospital
5 Patient Deemed Ready to Leave ICU. Date/Time Date/Time
Date/Time when attending staff determine that the patient is ready for transferDDMMYY, HHMM
6 Actual ICU Discharge Date/Time Date/Time
Actual Date/Time when patient was discharged from ICUDDMMYY, HHMM
7 Was Discharge from ICU Premature Tick if Yes
In the opinion of the intensivist/team, would the patient have benefitted by remaining in ICU longer?
8 Invasive Ventilation Tick if Yes Mechanical ventilation via ETT or tracheostomy
9 Non-invasive Ventilation Tick if YesVentilation via nasal or full face mask. Excludes CPAP for sleep apnoea, high flow nasal oxygen
10 Inotrope Infusion Tick if Yes Infusions of inotropes for augmentation of blood pressure or cardiac output
11 Renal replacement therapy Tick if YesHemofiltration, Hemodialysis etc for renal impairmentExcludes therapeutic plasmafiltration.
12 IABP Tick if Yes Intra-aortic balloon pump
13 Other Invasive Therapy Tick if Yes and comment
Other advanced therapies e.g. ECMO, oscillation, MARS
14 Not for Resuscitation Order Tick if YesWritten documentation in history that patient is not for Resuscitation, CPR, etc
15 Not for Return to ICU Tick if Yes Written or verbal order that patient will not be readmitted to ICU in the event of
Page 5

deterioration
16 Not for cardiac arrest team Tick if YesWritten order that patient should not have the cardiac arrest team called in the event of deterioration
17 Not for emergency (MET) Call Tick if Yes
Written order that patient should not have MET call in the event of deterioration where a MET service exists
18 Tracheostomy Tick if Yes Tracheostomy in place on discharge from ICU
19 Non-invasive ventilation Tick if Yes
Ventilation via nasal or full face mask on discharge from ICU. Excludes CPAP for sleep apnoea, high flow nasal oxygen
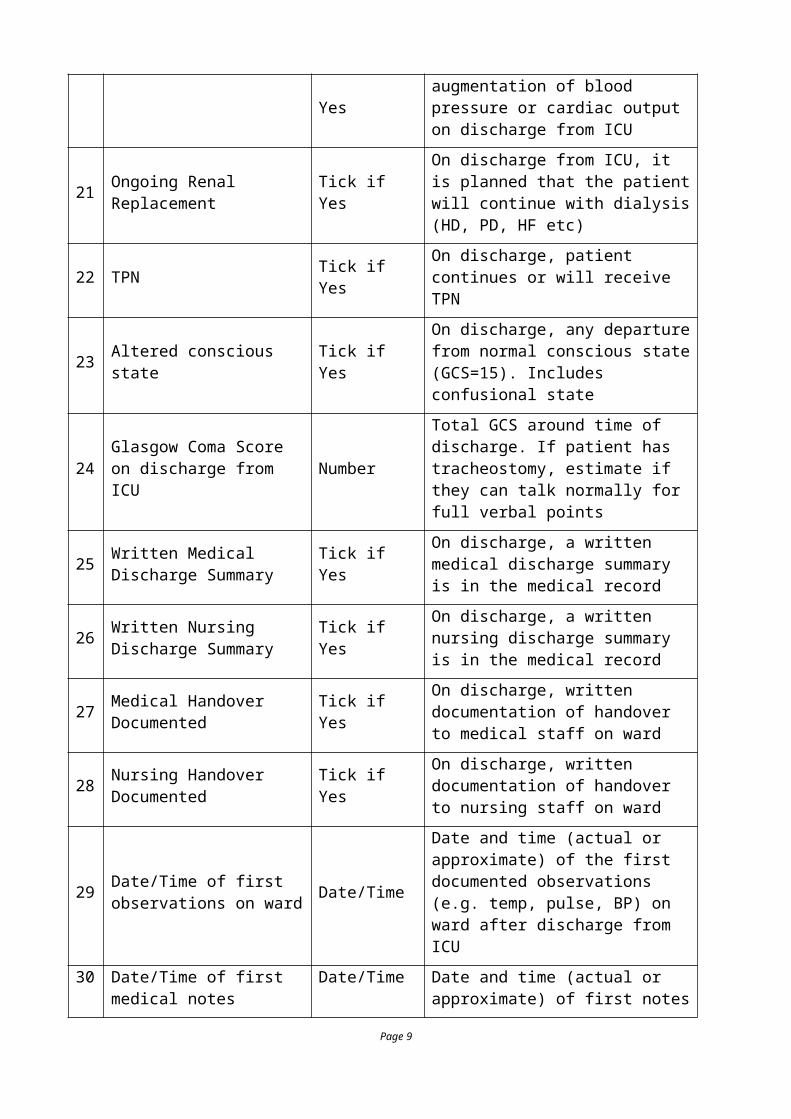
20 Inotrope Infusion Tick if YesInfusions of inotropes for augmentation of blood pressure or cardiac output on discharge from ICU
21 Ongoing Renal Replacement Tick if YesOn discharge from ICU, it is planned that the patient will continue with dialysis (HD, PD, HF etc)
22 TPN Tick if Yes On discharge, patient continues or will receive TPN
23 Altered conscious state Tick if YesOn discharge, any departure from normal conscious state (GCS=15). Includes confusional state
24 Glasgow Coma Score on discharge from ICU Number
Total GCS around time of discharge. If patient has tracheostomy, estimate if they can talk normally for full verbal points
25 Written Medical Discharge Summary Tick if Yes
On discharge, a written medical discharge summary is in the medical record
26 Written Nursing Discharge Summary Tick if Yes
On discharge, a written nursing discharge summary is in the medical record
27 Medical Handover Documented Tick if Yes On discharge, written documentation of
handover to medical staff on ward
28 Nursing Handover Documented Tick if Yes On discharge, written documentation of
handover to nursing staff on ward
29 Date/Time of first observations on ward Date/Time
Date and time (actual or approximate) of the first documented observations (e.g. temp, pulse, BP) on ward after discharge from ICU
Page 6
30 Date/Time of first medical notes Date/Time
Date and time (actual or approximate) of first notes by primary/parent medical/surgical team after discharge from ICU.
31 Date/Time of first visit by senior consultant Date/Time
Date and time (actual or approximate) of first documented visit by senior consultant (physician, surgeon, psychiatrist etc) after discharge from ICU.
32 Patient was discharged from ICU to Tick if Yes
Tick only one box
Discharged to high dependency unit or stepdown when nurse:patient is 1:2
Discharged to specialty ward such as neurosurgery where nurse:patient ratios are the same as general areas
Discharged to general medical/surgical/obstetric ward where nurse:patient ratios are standard
If the patient is a readmission and dies, goes home or to another hospital, leave this section blank.
33 Number of emergency (MET) calls Number
Number of emergency calls between first discharge from ICU and Hospital discharge. Does NOT include cardiac arrest calls
34 Number of cardiac arrest calls Number
Number of cardiac arrest calls between first discharge from ICU and Hospital discharge. Patient required CPR ± defibrillation
35 Number of Liaison Visits NumberNumber of formal nurse/medical liaison visits between first discharge from ICU and Hospital discharge
36 Age Number Age of Patient in years
37 Gender Text M|F
38 Hospital Admission Date and Time
Date/Time Date /Time of admission to Hospital. Can be obtained from AORTIC or equivalent
39 Hospital Admission Source Tick Tick one only of Home, Other Acute Hospital, Other Chronic Hospital (including residential aged care, nursing home), or
Page 7
Other ICU
40 APACHE III risk of death Number Calculated APACHE Risk of Death from AORTIC or equivalent for first 24 hours of admission.If this is not collected electronically, complete the APACHE III calculation sheet. Risk of death will be calculated from the scores and the Diagnostic Code (below)
41 ANZICS APACHE III Diagnostic Code
Number The ANZICS modification to the APACHE III diagnostic codes. See APACHE III Worksheet.
42 Hospital Discharge Date and Time
Date/Time Date/Time of discharge from Hospital.Includes discharge to rehabilitation, mental health, palliative care. Can be obtained from AORTIC or equivalent
43 Hospital Outcome Tick Tick one only of Still in Hospital (at study termination date), Died in Hospital, Discharged home, Transfer to Rehabilitation, Transfer to other ICU, or Transfer to other Hospital
44 Proximate Cause of Death Tick Tick one only for the immediate reason that the patient died.
45 Underlying Causes of Death Tick Tick the boxes for
46 If the patient left ICU without an NFR order AND subsequently died, was an NFR form completed later in the ward?
Tick Tick YES if, following discharge from ICU, the patient subsequently had a written not for resuscitation form completed and placed in the medical record.
Page 8
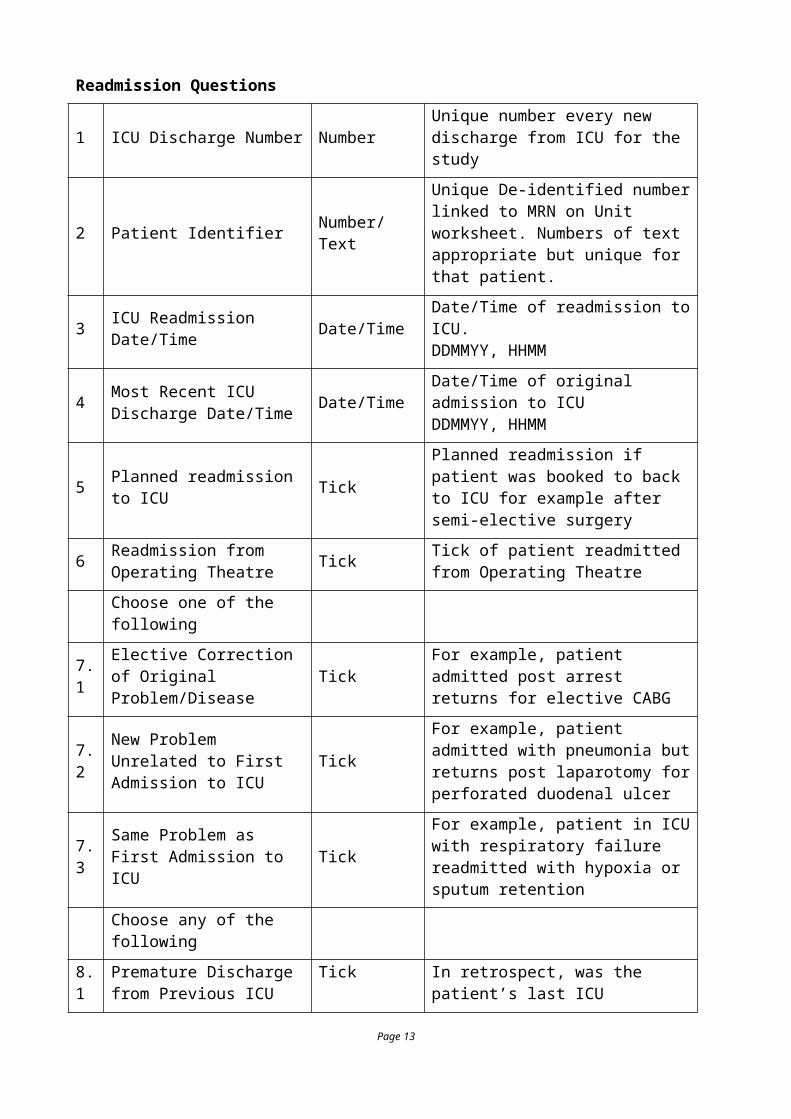
Readmission Questions
1 ICU Discharge Number Number Unique number every new discharge from ICU for the study
2 Patient Identifier Number/Text
Unique De-identified number linked to MRN on Unit worksheet. Numbers of text appropriate but unique for that patient.
3 ICU Readmission Date/Time Date/Time Date/Time of readmission to ICU.DDMMYY, HHMM
4 Most Recent ICU Discharge Date/Time Date/Time Date/Time of original admission to ICU
DDMMYY, HHMM
5 Planned readmission to ICU TickPlanned readmission if patient was booked to back to ICU for example after semi-elective surgery
6 Readmission from Operating Theatre Tick Tick of patient readmitted from
Operating Theatre
Choose one of the following
7.1 Elective Correction of Original Problem/Disease Tick For example, patient admitted post
arrest returns for elective CABG
7.2 New Problem Unrelated to First Admission to ICU Tick
For example, patient admitted with pneumonia but returns post laparotomy for perforated duodenal ulcer
7.3 Same Problem as First Admission to ICU Tick
For example, patient in ICU with respiratory failure readmitted with hypoxia or sputum retention
Choose any of the following
8.1 Premature Discharge from Previous ICU Admission Tick In retrospect, was the patient’s last ICU
discharge premature?
8.2 Issues Related to Care During the Previous ICU Admission Tick
In retrospect, were there things done or omitted in ICU which contributed to the readmission
8.3Issues Related to Care During the Intervening Period on the Ward
TickIn retrospect, were there things done or omitted on the ward which contributed to readmission
8.3 Readmission Following Emergency (MET) call Tick Did the readmission follow a MET call
8.4 Readmission Following Cardiac Arrest Tick Did the readmission follow a cardiac
arrest
8.5 In Your Opinion, Could the Readmission been Prevented Tick
Could the ward staff or ICU have intervened earlier to prevent this readmission.
Page 9
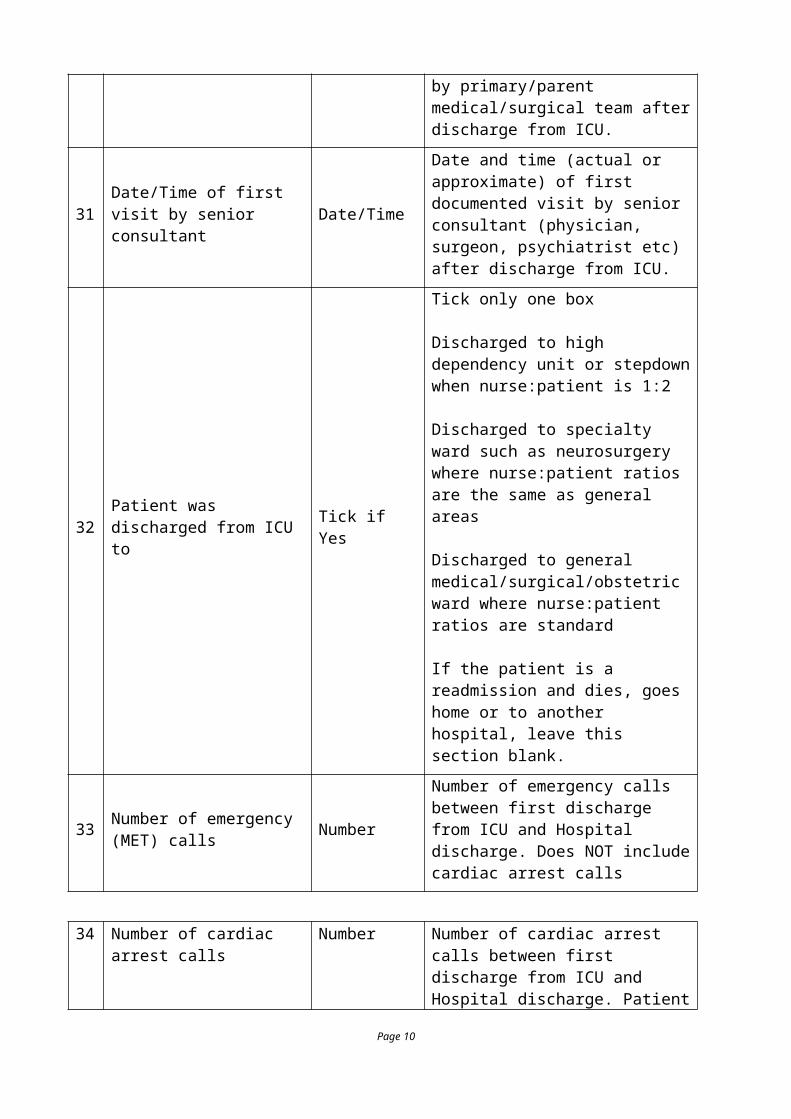
Table E3. Primary diagnosis categories on admission to ICU (APACHE III, major groups)
Medical Surgical
Cardiovascular 664 (6.52%) Cardiovascular 2723 (26.74%)
Respiratory 1101 (10.81%)
Respiratory 409 (4.02%)
Gastrointestinal
371 (3.64%) Gastrointestinal 1205 (11.83%)
Neurological 495 (4.86%) Neurological 419 (4.12%)
Sepsis 610 (5.99%)
Trauma 489 (4.8%) Trauma 241 (2.37%)
Metabolic 578 (5.68%)
Hematological 35 (0.34%)
Renal 159 (1.56%) Renal 159 (1.56%)
Gynecological 89 (0.87%)
Orthopedic 281 (2.76%)
Other 69 (0.68%) Other 85 (0.84%)
Page 10
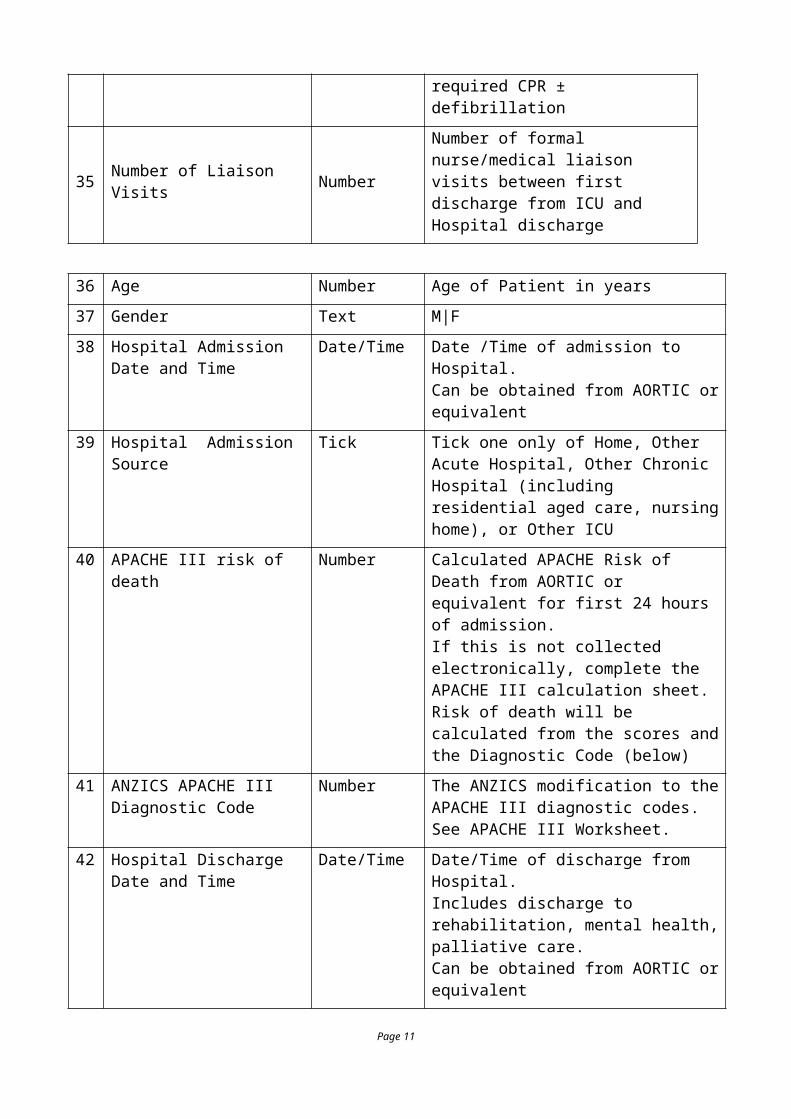
Table E4. Twenty (20) most common primary admission diagnoses (APACHE III)
Coronary artery bypass graft 1202 11.81%
Valvular heart surgery 542 5.32%
GI surgery for tumour 418 4.11%
Overdose 370 3.63%
Bacterial pneumonia 304 2.99%
Coronary bypass surgery with valve 277 2.72%
Sepsis with shock other than urinary 240 2.36%
Sepsis other than urinary 232 2.28%
Post cardiac arrest 218 2.14%
Head trauma ± multi-trauma (non-surgical)
210 2.06%
Orthopedic surgery 200 1.96%
COPD 197 1.93%
Other cardiovascular surgery 197 1.93%
Other gastrointestinal surgery 192 1.89%
Multi-trauma excluding head 190 1.87%
Seizure 170 1.67%
Other medical respiratory disease 169 1.66%
Post surgery for GI rupture or perforation 150 1.47%
Renal diseases 146 1.43%
Post resection of respiratory neoplasm 143 1.40%
Page 11
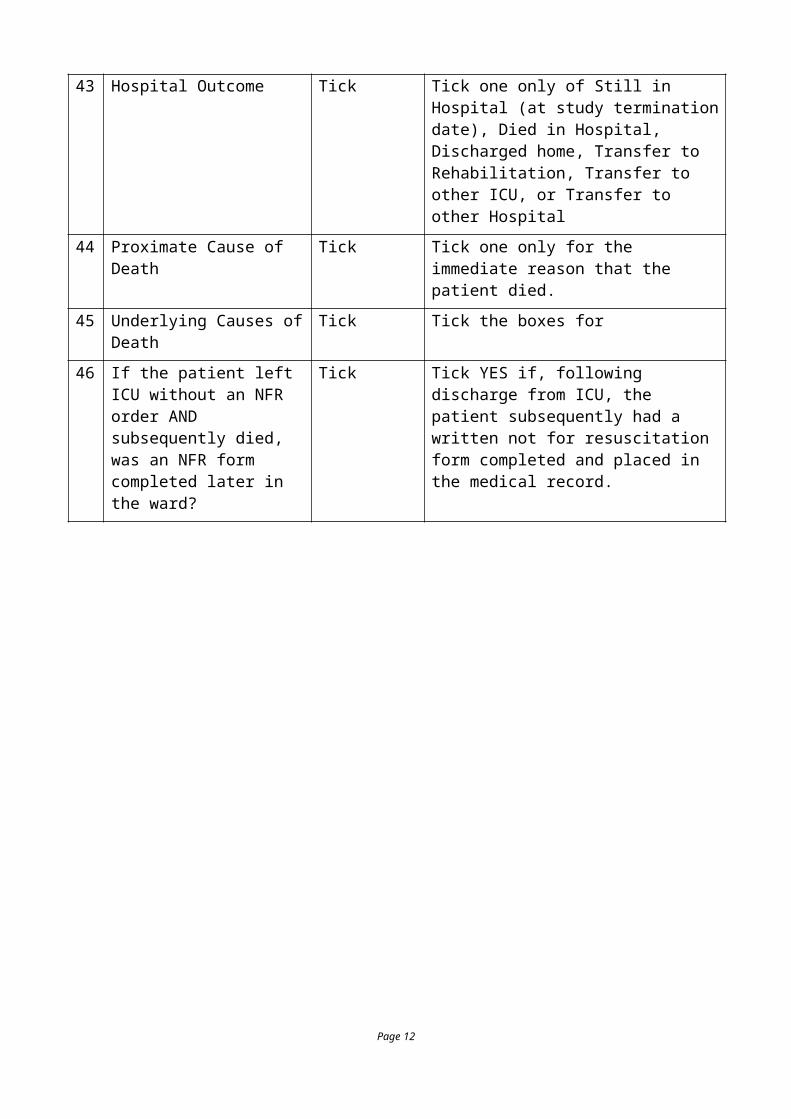
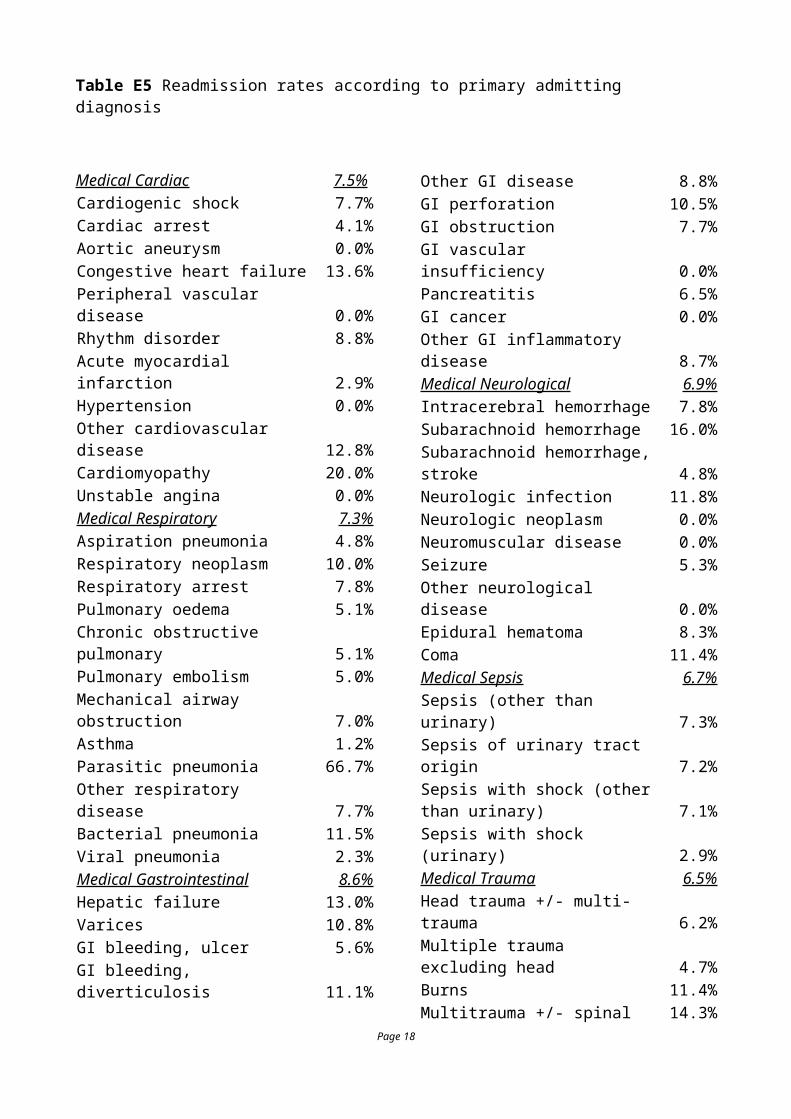
Table E5 Readmission rates according to primary admitting diagnosis
Medical Cardiac 7.5%Cardiogenic shock 7.7%Cardiac arrest 4.1%Aortic aneurysm 0.0%Congestive heart failure 13.6%Peripheral vascular disease 0.0%Rhythm disorder 8.8%Acute myocardial infarction 2.9%Hypertension 0.0%Other cardiovascular disease 12.8%Cardiomyopathy 20.0%Unstable angina 0.0%Medical Respiratory 7.3%Aspiration pneumonia 4.8%Respiratory neoplasm 10.0%Respiratory arrest 7.8%Pulmonary oedema 5.1%Chronic obstructive pulmonary 5.1%Pulmonary embolism 5.0%Mechanical airway obstruction 7.0%Asthma 1.2%Parasitic pneumonia 66.7%Other respiratory disease 7.7%Bacterial pneumonia 11.5%Viral pneumonia 2.3%Medical Gastrointestinal 8.6%Hepatic failure 13.0%Varices 10.8%GI bleeding, ulcer 5.6%GI bleeding, diverticulosis 11.1%Other GI disease 8.8%GI perforation 10.5%GI obstruction 7.7%GI vascular insufficiency 0.0%Pancreatitis 6.5%GI cancer 0.0%Other GI inflammatory disease 8.7%Medical Neurological 6.9%Intracerebral hemorrhage 7.8%Subarachnoid hemorrhage 16.0%Subarachnoid hemorrhage, stroke 4.8%Neurologic infection 11.8%Neurologic neoplasm 0.0%Neuromuscular disease 0.0%Seizure 5.3%Other neurological disease 0.0%
Epidural hematoma 8.3%Coma 11.4%Medical Sepsis 6.7%Sepsis (other than urinary) 7.3%Sepsis of urinary tract origin 7.2%Sepsis with shock (other than urinary) 7.1%Sepsis with shock (urinary) 2.9%Medical Trauma 6.5%Head trauma +/- multi-trauma 6.2%Multiple trauma excluding head 4.7%Burns 11.4%Multitrauma +/- spinal cord 14.3%Isolated cervical cord injury 5.6%Medical Metabolic 1.7%Metabolic coma 0.0%Diabetic ketoacidosis 1.0%Drug overdose 1.6%Other Metabolic disease 3.1%Medical Hematological 5.7%Coagulopathy 5.6%Other hematological disease 5.9%Medical Other 4.3%Renal diseases 4.1%Pre-eclampsia 0.0%Hemorrhage, post-partum 0.0%Other medical disorders 4.7%Musculoskeletal disease 16.7%Cellulitis 0.0%
Page 12
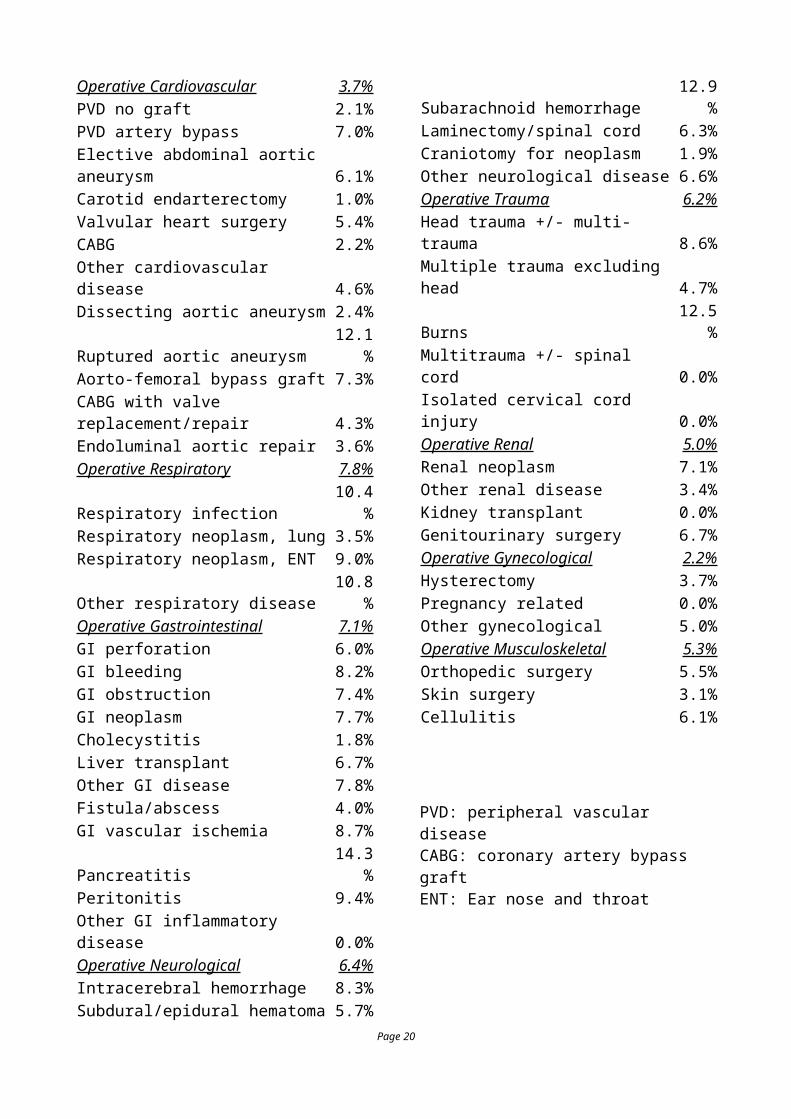
Operative Cardiovascular 3.7%PVD no graft 2.1%PVD artery bypass 7.0%Elective abdominal aortic aneurysm 6.1%Carotid endarterectomy 1.0%Valvular heart surgery 5.4%CABG 2.2%Other cardiovascular disease 4.6%Dissecting aortic aneurysm 2.4%Ruptured aortic aneurysm 12.1%Aorto-femoral bypass graft 7.3%CABG with valve replacement/repair 4.3%Endoluminal aortic repair 3.6%Operative Respiratory 7.8%Respiratory infection 10.4%Respiratory neoplasm, lung 3.5%Respiratory neoplasm, ENT 9.0%Other respiratory disease 10.8%Operative Gastrointestinal 7.1%GI perforation 6.0%GI bleeding 8.2%GI obstruction 7.4%GI neoplasm 7.7%Cholecystitis 1.8%Liver transplant 6.7%Other GI disease 7.8%Fistula/abscess 4.0%GI vascular ischemia 8.7%Pancreatitis 14.3%Peritonitis 9.4%Other GI inflammatory disease 0.0%Operative Neurological 6.4%Intracerebral hemorrhage 8.3%Subdural/epidural hematoma 5.7%Subarachnoid hemorrhage 12.9%Laminectomy/spinal cord 6.3%Craniotomy for neoplasm 1.9%Other neurological disease 6.6%Operative Trauma 6.2%Head trauma +/- multi-trauma 8.6%Multiple trauma excluding head 4.7%Burns 12.5%Multitrauma +/- spinal cord 0.0%Isolated cervical cord injury 0.0%Operative Renal 5.0%Renal neoplasm 7.1%Other renal disease 3.4%Kidney transplant 0.0%Genitourinary surgery 6.7%
Operative Gynecological 2.2%Hysterectomy 3.7%Pregnancy related 0.0%Other gynecological 5.0%Operative Musculoskeletal 5.3%Orthopedic surgery 5.5%Skin surgery 3.1%Cellulitis 6.1%
PVD: peripheral vascular diseaseCABG: coronary artery bypass graftENT: Ear nose and throat
Page 13

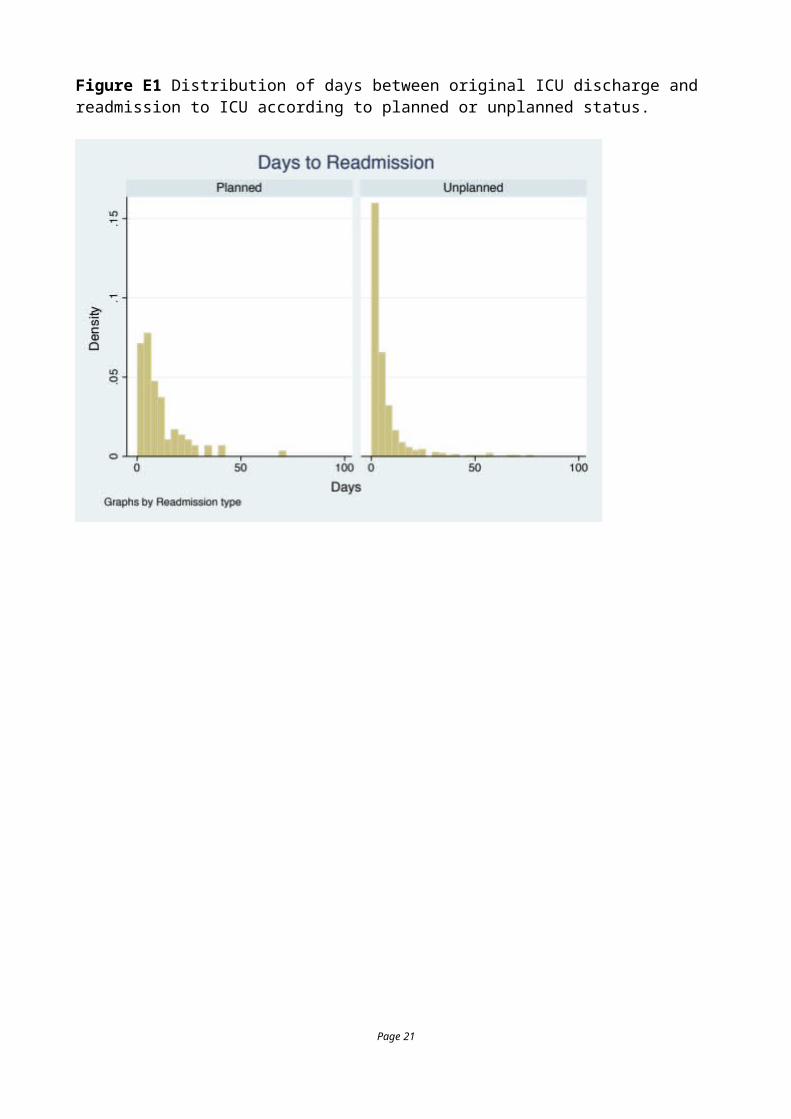
Figure E1 Distribution of days between original ICU discharge and readmission to ICU according to planned or unplanned status.
Page 14
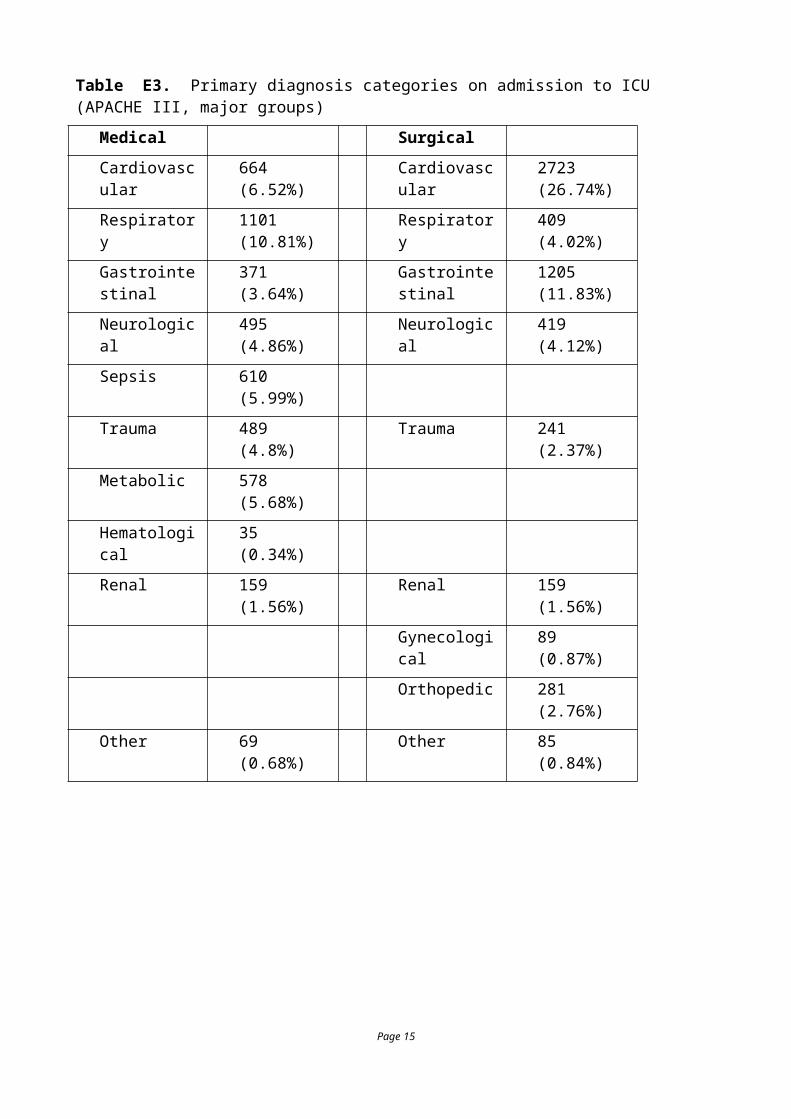
Figure E2. Hour of readmission to ICU according to planned or unplanned readmission.
Page 15
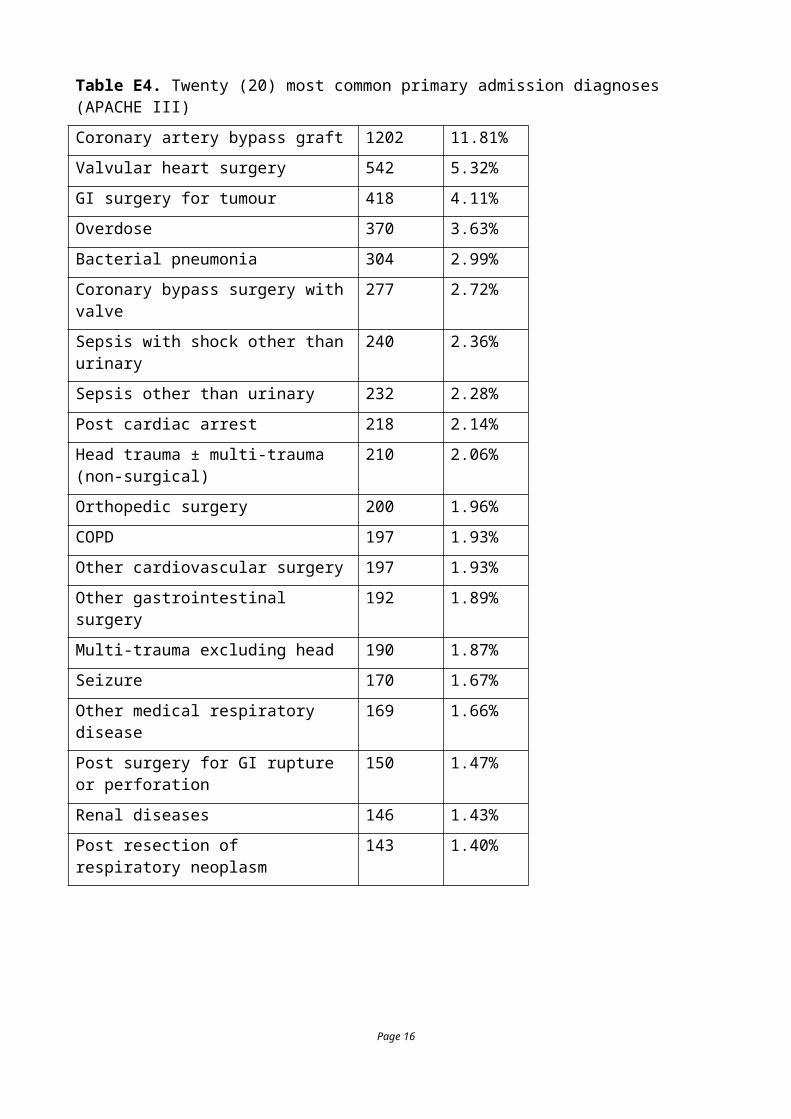
Figure E3. Interval in days to first readmission stratified by subsequent survival or mortality.
Page 16

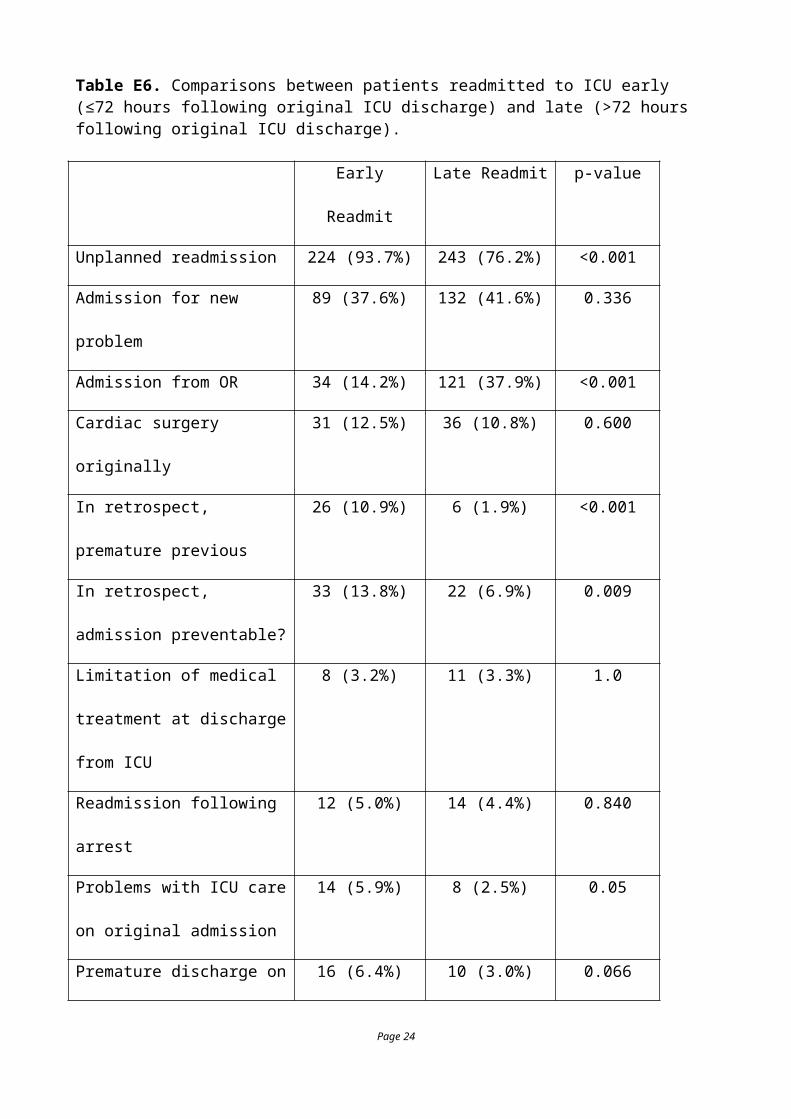
Table E6. Comparisons between patients readmitted to ICU early (≤72 hours following original ICU discharge) and late (>72 hours following original ICU discharge).
Early Readmit Late Readmit p-value
Unplanned readmission 224 (93.7%) 243 (76.2%) <0.001
Admission for new problem 89 (37.6%) 132 (41.6%) 0.336
Admission from OR 34 (14.2%) 121 (37.9%) <0.001
Cardiac surgery originally 31 (12.5%) 36 (10.8%) 0.600
In retrospect, premature previous 26 (10.9%) 6 (1.9%) <0.001
In retrospect, admission
preventable?
33 (13.8%) 22 (6.9%) 0.009
Limitation of medical treatment
at discharge from ICU
8 (3.2%) 11 (3.3%) 1.0
Readmission following arrest 12 (5.0%) 14 (4.4%) 0.840
Problems with ICU care on
original admission
14 (5.9%) 8 (2.5%) 0.05
Premature discharge on original
admission
16 (6.4%) 10 (3.0%) 0.066
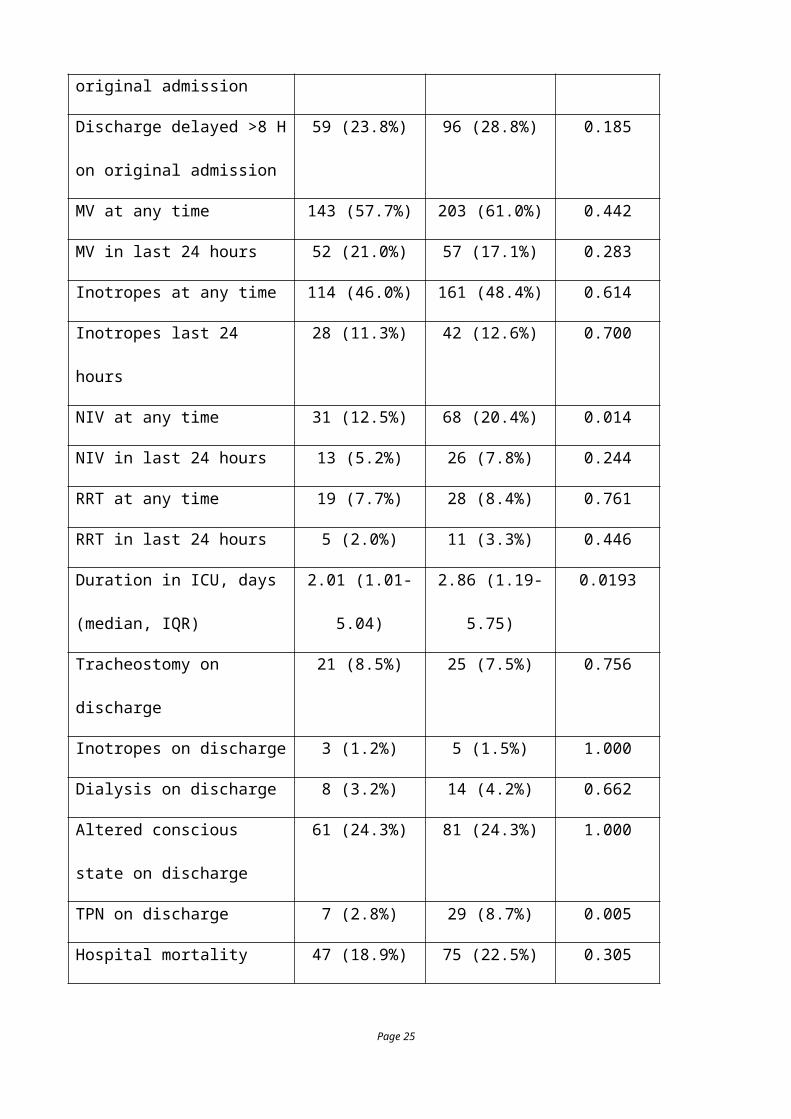
Discharge delayed >8 H on
original admission
59 (23.8%) 96 (28.8%) 0.185
MV at any time 143 (57.7%) 203 (61.0%) 0.442
MV in last 24 hours 52 (21.0%) 57 (17.1%) 0.283
Inotropes at any time 114 (46.0%) 161 (48.4%) 0.614
Inotropes last 24 hours 28 (11.3%) 42 (12.6%) 0.700
NIV at any time 31 (12.5%) 68 (20.4%) 0.014
NIV in last 24 hours 13 (5.2%) 26 (7.8%) 0.244
RRT at any time 19 (7.7%) 28 (8.4%) 0.761
Page 17
RRT in last 24 hours 5 (2.0%) 11 (3.3%) 0.446
Duration in ICU, days
(median, IQR)
2.01 (1.01-5.04) 2.86 (1.19-5.75) 0.0193
Tracheostomy on discharge 21 (8.5%) 25 (7.5%) 0.756
Inotropes on discharge 3 (1.2%) 5 (1.5%) 1.000
Dialysis on discharge 8 (3.2%) 14 (4.2%) 0.662
Altered conscious state on
discharge
61 (24.3%) 81 (24.3%) 1.000
TPN on discharge 7 (2.8%) 29 (8.7%) 0.005
Hospital mortality 47 (18.9%) 75 (22.5%) 0.305
OR is operating room, MV is mechanical ventilation, NIV is non-invasive ventilation, RRT is renal replacement therapy, TPN is total parenteral nutrition
Page 18
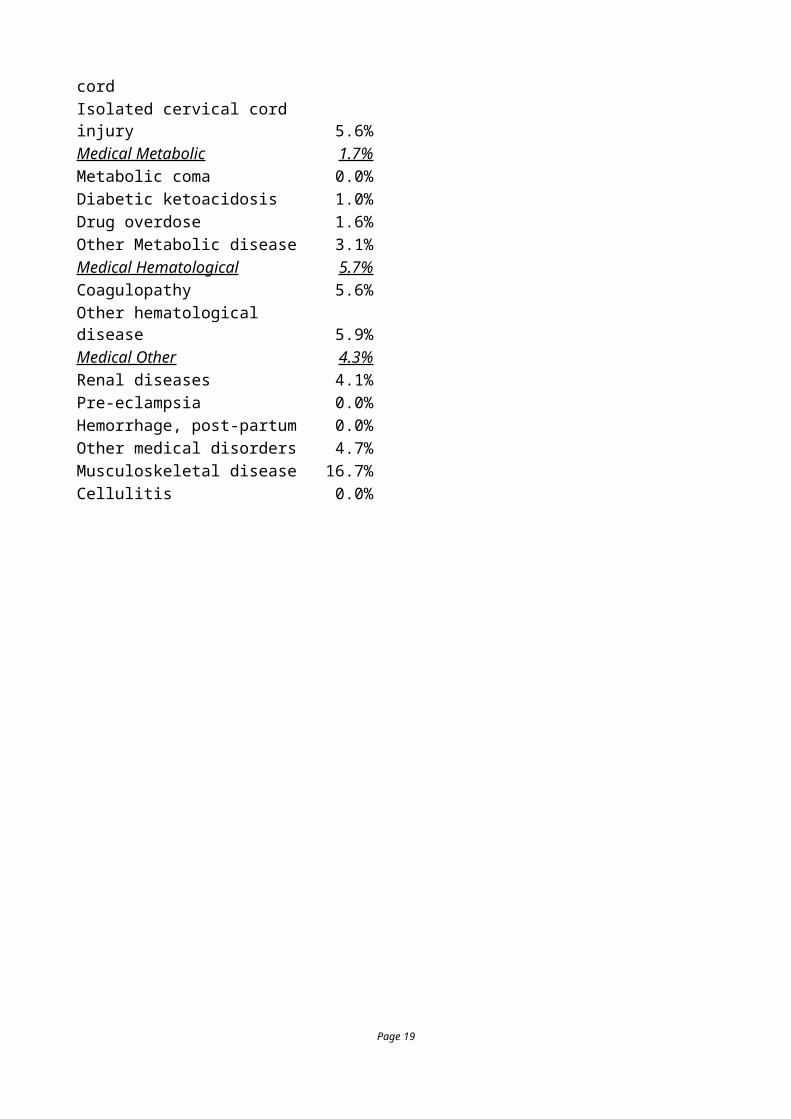
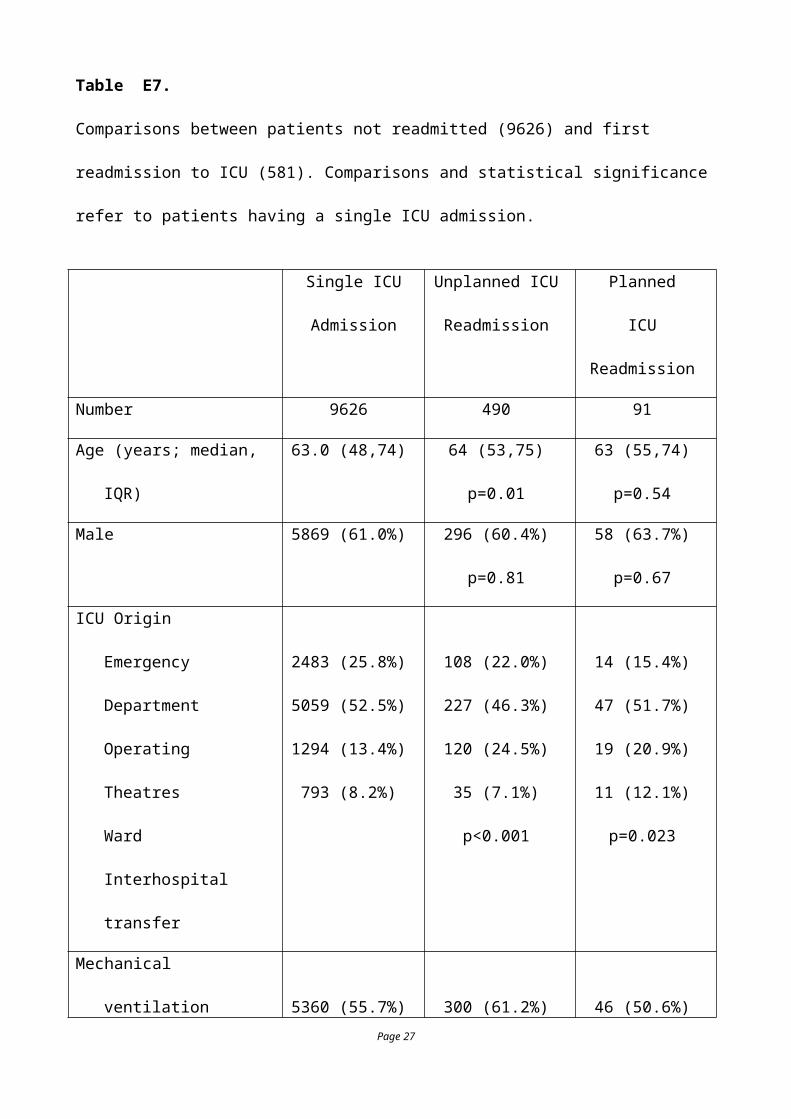
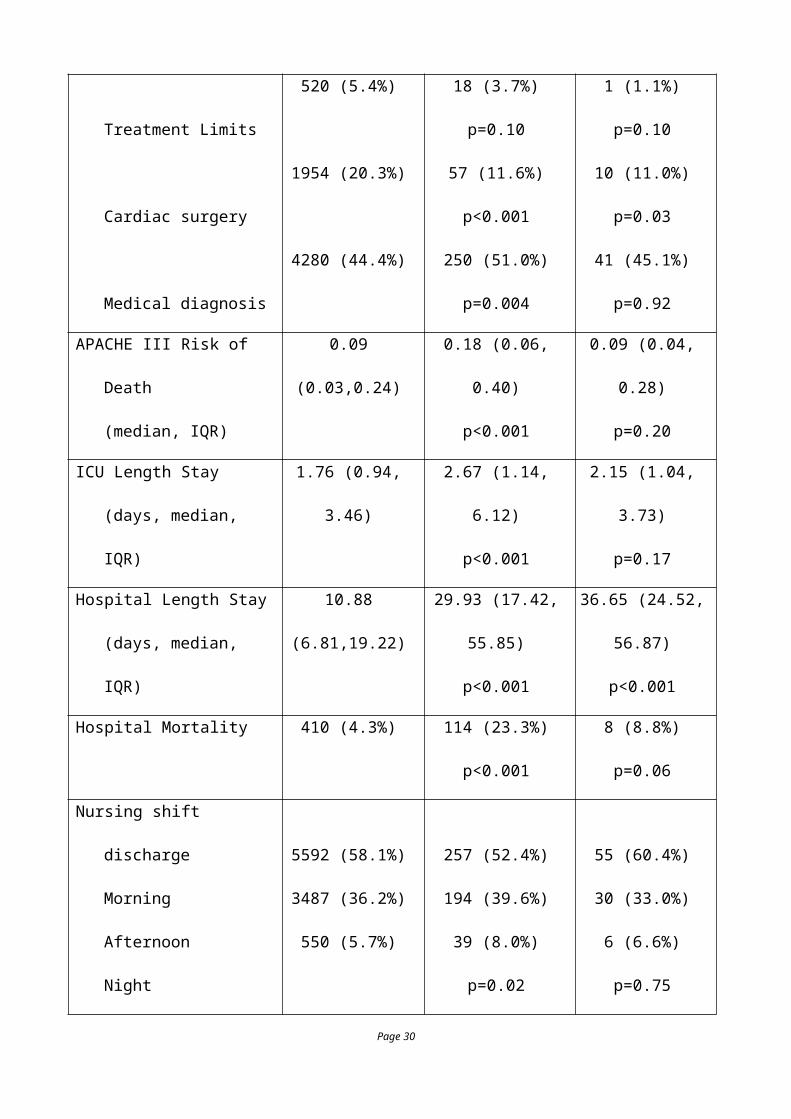
Table E7.
Comparisons between patients not readmitted (9626) and first readmission to ICU (581).
Comparisons and statistical significance refer to patients having a single ICU admission.
Single ICU
Admission
Unplanned ICU
Readmission
Planned
ICU Readmission
Number 9626 490 91
Age (years; median, IQR) 63.0 (48,74) 64 (53,75)
p=0.01
63 (55,74)
p=0.54
Male 5869 (61.0%) 296 (60.4%)
p=0.81
58 (63.7%)
p=0.67
ICU Origin
Emergency Department
Operating Theatres
Ward
Interhospital transfer
2483 (25.8%)
5059 (52.5%)
1294 (13.4%)
793 (8.2%)
108 (22.0%)
227 (46.3%)
120 (24.5%)
35 (7.1%)
p<0.001
14 (15.4%)
47 (51.7%)
19 (20.9%)
11 (12.1%)
p=0.023
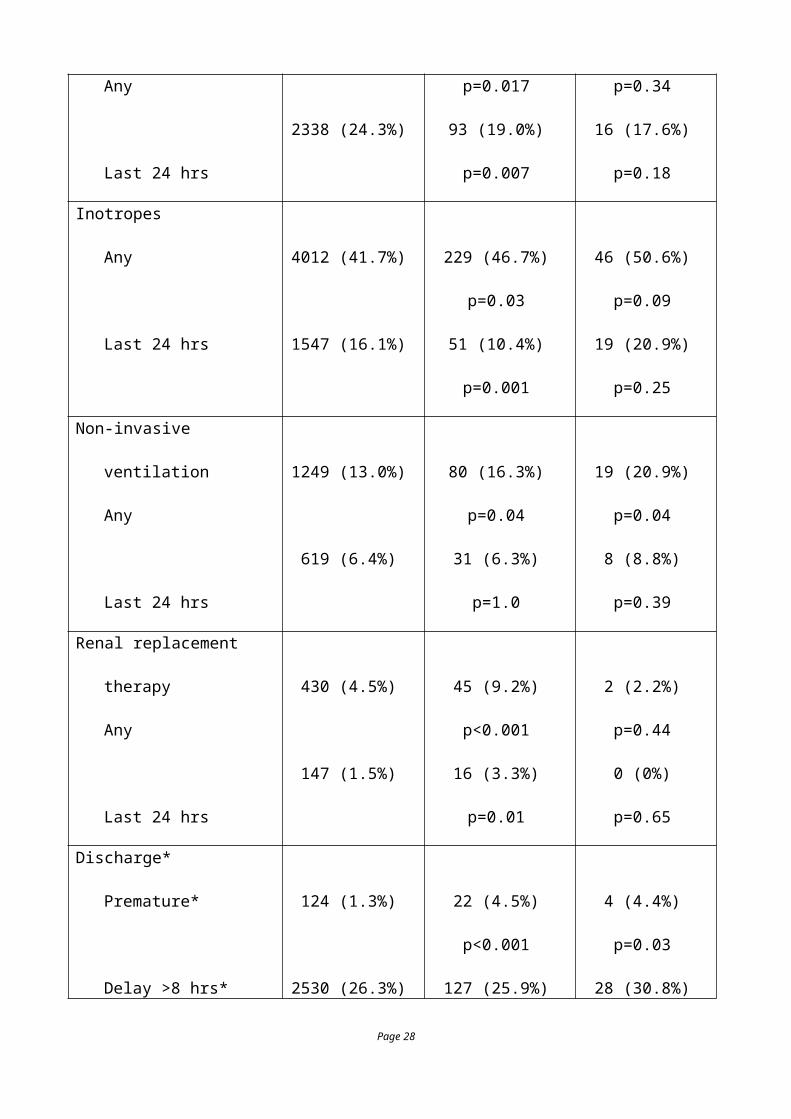
Mechanical ventilation
Any
Last 24 hrs
5360 (55.7%)
2338 (24.3%)
300 (61.2%)
p=0.017
93 (19.0%)
p=0.007
46 (50.6%)
p=0.34
16 (17.6%)
p=0.18
Inotropes
Any
Last 24 hrs
4012 (41.7%)
1547 (16.1%)
229 (46.7%)
p=0.03
51 (10.4%)
46 (50.6%)
p=0.09
19 (20.9%)
Page 19
p=0.001 p=0.25
Non-invasive ventilation
Any
Last 24 hrs
1249 (13.0%)
619 (6.4%)
80 (16.3%)
p=0.04
31 (6.3%)
p=1.0
19 (20.9%)
p=0.04
8 (8.8%)
p=0.39
Renal replacement therapy
Any
Last 24 hrs
430 (4.5%)
147 (1.5%)
45 (9.2%)
p<0.001
16 (3.3%)
p=0.01
2 (2.2%)
p=0.44
0 (0%)
p=0.65
Discharge*
Premature*
Delay >8 hrs*
Delay >24 hrs*
After 6 pm
After 10 pm
124 (1.3%)
2530 (26.3%)
117 (1.2%)
1562 (16.2%)
550 (5.7%)
22 (4.5%)
p<0.001
127 (25.9%)
p=0.92
4 (0.8%)
p=0.67
92 (18.8%)
p=0.15
39 (8.0%)
p=0.05
4 (4.4%)
p=0.03
28 (30.8%)
p=0.34
2 (2.2%)
p=0.31
18 (19.8%)
p=0.39
6 (6.6%)
p=0.65
Therapy on discharge
Tracheostomy
Non-invasive ventilation
305 (3.2%)
168 (1.7%)
42 (8.6%)
p<0.001
10 (2.0%)
4 (4.4%)
p=0.54
0 (0%)
Page 20
Ongoing dialysis
Inotropes
Altered conscious state
166 (1.7%)
105 (1.1%)
1455 (15.1%)
p=0.60
20 (4.1%)
p=0.001
5 (1.0%)
p=1.0
130 (26.5%)
p<0.001
P=0.41
2 (2.2%)
p=0.67
3 (3.3%)
p=0.08
12 (13.2%)
p=0.77
Other factors
Discharge to general
Treatment Limits
Cardiac surgery
Medical diagnosis
4731 (49.1%)
520 (5.4%)
1954 (20.3%)
4280 (44.4%)
228 (46.5%)
p=0.27
18 (3.7%)
p=0.10
57 (11.6%)
p<0.001
250 (51.0%)
p=0.004
39 (42.9%)
p=0.25
1 (1.1%)
p=0.10
10 (11.0%)
p=0.03
41 (45.1%)
p=0.92
APACHE III Risk of Death
(median, IQR)
0.09 (0.03,0.24) 0.18 (0.06, 0.40)
p<0.001
0.09 (0.04, 0.28)
p=0.20
ICU Length Stay
(days, median, IQR)
1.76 (0.94, 3.46) 2.67 (1.14, 6.12)
p<0.001
2.15 (1.04, 3.73)
p=0.17
Hospital Length Stay
(days, median, IQR)
10.88 (6.81,19.22) 29.93 (17.42, 55.85)
p<0.001
36.65 (24.52, 56.87)
p<0.001
Hospital Mortality 410 (4.3%) 114 (23.3%)
p<0.001
8 (8.8%)
p=0.06
Nursing shift discharge
Morning 5592 (58.1%) 257 (52.4%) 55 (60.4%)
Page 21
Afternoon
Night
3487 (36.2%)
550 (5.7%)
194 (39.6%)
39 (8.0%)
p=0.02
30 (33.0%)
6 (6.6%)
p=0.75
Summaries written
Medical Summary
Nursing Summary
Medical Handover
Nursing Handover
8487 (88.1%)
6509 (67.6%)
2637 (27.4%)
2509 (26.1%)
445 (90.8%)
p=0.072
353 (72.0%)
p=0.04
126 (25.7%)
p=0.44
129 (26.3%)
p=0.92
77 (84.6%)
p=0.33
57 (62.6%)
p=0.31
22 (24.2%)
p=0.56
22 (24.2%)
p=0.81
Time to (hrs, Median, IQR)
First observations
First medical review
0.52 (0.25,1.42)
12.0 (2.99, 18.89)
0.50 (0.25,1.25)
p=0.81
6.26 (2.25,15.9)
p<0.001
0.67 (0.25,2.0)
p=0.28
10.53 (3.04,17.12)
p=0.37
Post Discharge Calls
MET/RRT
Cardiac Arrest
457 (4.8%)
50 (0.52%)
222 (45.3%)
p<0.001
29 (5.9%)
p<0.001
8 (8.8%)
p=0.08
1 (1.1%)
p=0.38
* Premature discharge and delayed discharge were assessed at the time of first ICU discharge.
MET/RRT refer to medical emergency or rapid response calls
Table E8.
Diagnoses on first and second ICU admission in 581 readmitted patients. Op. refers to an operative
Page 22
diagnosis. Numbers in brackets are the actual cases recorded. Categories with very small numbers
(e.g. medical hematology, operative genito-urinary) are not list in the table.
Medical Diagnoses Surgical Diagnoses
Admission Readmission Admission Readmission
Cardiovascular
(n=50)
Cardiovascular (18)
Op Cardiovascular (17)
Respiratory (12)
Op Cardiovascular
(n=100)
Op.Cardiovascular (35)
Respiratory (22)
Cardiovascular (19)
Respiratory
(n=80)
Respiratory (49)
Cardiovascular (9)
Sepsis (5)
Op Respiratory
(n=32)
Respiratory (11)
Op.Respiratory (9)
Cardiovascular (3)
Gastrointestinal
(n=32)
Gastrointestinal (13)
Op Gastrointestinal (6)
Respiratory (5)
Op.Gastrointestinal
(n=86)
Op.Gastrointestinal
(42)
Sepsis (15)
Respiratory (10)
Cardiovascular (6)
Neurological
(n=34)
Neurological (20)
Respiratory (8)
Op Neurological (2)
Op.Neurological
(n=27)
Neurological (9)
Op.Neurological (8)
Respiratory (3)
Trauma
(n=32)
Respiratory (8)
Trauma (7)
Op Trauma (5)
Op.Trauma
(n=16)
Respiratory (4)
Sepsis (4)
Op.Trauma (4)
Sepsis
(n=39)
Sepsis (11)
Respiratory (8)
Op Cardiovascular (6)
Page 23
Metabolic
(n=10)
Metabolic (4)
Respiratory (4)
Op.Orthopedic
(n=19)
Op.Orthopedic (4)
Sepsis (3)
Respiratory (2)
Page 24
Statistical Analysis
Unplanned readmission to ICU
As described in the main text, relationships between the outcome measure of mortality, transfer hour, and patient factors were explored with a fixed effects logistic regression; the fixed effect (ICU) was parameterized as an indicator variable (1, 2). Further details on the strategy used for the fixed effects logistic regression are available in our recent publication (3). Basically, we considered readmissions to be a function of care provided within an Australian and New Zealand jurisdiction which provided justification for a fixed effects model reported below. A random effects model was also run; it provided the same estimates but slightly different confidence intervals (as expected) and there was no difference in the power of the analysis between the fixed and random effects models.
Table E9. Results of the fixed effects logistic regression predicting unplanned readmission following the first ICU discharge.
Variable Odds Ratio 95% Confidence interval
Significance
Age (years) 1.011 1.005-1.016 0.000
Original admission ward 1.875 1.488-2.361 0.000
Cardiac surgery 0.528 0.381-0.372 0.000
Duration ICU (days) 1.019 1.009-1.030 0.000
Premature ICU discharge 3.735 2.280-6.116 0.000
Limit Medical Treatment 0.364 0.221-0.599 0.000
Tracheostomy 1.648 1.119-2.428 0.011
Altered conscious state 1.590 1.259-2.008 0.000
Ongoing dialysis 2.086 1.275-3.413 0.003
Parenteral nutrition 2.318 1.552-3.463 0.000
Ventilation on original admission 1.273 1.016-1.595 0.036
Hospital Code
AU02 1.605 0.693-3.716 0.269
AU03 1.256 0.554-2.845 0.585
AU04 1.881 0.877-4.035 0.105
AU05 (no readmissions)
AU06 1.041 0.404-2.682 0.934
AU07 1.140 0.488-2.667 0.762
AU07 0.194 0.025-1.507 0.117
AU09 1.286 0.514-3.216 0.590
AU10 1.162 0.493-2.736 0.732
Page 25
AU11 1.380 0.569-3.344 0.476
AU12 0.544 0.189-1.565 0.258
AU13 1.542 0.596-3.991 0.372
NZ02 1.732 0.845-3.553 0.134
NZ01 1.249 0.572-2.728 0.577
NZ03 1.579 0.747-3.341 0.232
NZ04 0.977 0.370-2.585 0.963
NZ05 0.758 0.296-1.939 0.563
NZ06 (no readmissions)
NZ07 1.427 0.634-3.208 0.390
AU14 0.454 0.159-1.295 0.140
AU15 0.893 0.350-2.280 0.814
AU15 1.760 0.898-3.448 0.100
AU17 1.565 0.692-3.541 0.282
AU18 1.160 0.531-2.536 0.709
AU19 1.381 0.689-2.768 0.363
AU20 2.160 1.133-4.119 0.019
AU21 1.527 0.587-3.970 0.385
AU22 1.705 0.767-3.793 0.191
AU23 1.516 0.476-4.830 0.481
AU24 0.532 0.170-1.669 0.279
AU25 1.287 0.584-2.833 0.531
AU26 0.884 0.385-2.032 0.772
AU27 1.713 0.762-3.854 0.193
AU28 1.717 0.871-3.385 0.118
AU29 1.552 0.789-3.051 0.203
AU30 1.309 0.541-3.164 0.550
AU31 1.560 0.746-3.260 0.237
AU32 (no readmissions)
AU33 0.806 0.371-1.754 0.587
Constant 0.014 0.007-0.027 0.000
Page 26
Impact of readmission on subsequent mortality
The methodology adopted to evaluate the impact of ICU readmissions was that of recurrent events(4); in particular a shared frailty approach(5). That is, a subject-specific frailty (or unobserved heterogeneity(6)) acting multiplicatively on the hazard, and event (readmission) dependence were analysed using a Cox model. Frailty was modelled using a gamma distribution and estimation was undertaken using the EM algorithm (the subject-specific effects are treated as missing variables to be estimated) (7, 8) as opposed to the more conventional profile likelihood. The (shared) frailty model is defined as (9):
where is the conditional hazard function for the jth subject from the ith cluster (in this case
repeated observations on each person); is the baseline hazard, is the fixed effects vector of
dimension p, xij is the vector of covariates, and is the random effect for the ith cluster.
The , i = 1, …, s are the actual values from a density . The model can be rewritten as:
where is called the frailty term for the ith cluster. The , i
= 1,…, s, are the actual values of as sample from a density . The model is a shared frailty model because subjects in the same cluster (in this case, repeated observations of each subject) share the same frailty factor. For the one parameter gamma distribution (a mathematically convenient choice), the formulation is:
, with the gamma function. Note also E(U) = 1 and Var(U) = 0. Thus
individuals in a group i with are frail and of higher risk. The 𝜃 parameter (which is the variance of the frailty effect with a mean assumed to be unity and conventionally reported and expressed in the log-hazard metric) provides information on the variability (heterogeneity) in the population of clusters.
The data set-up was that of multiple-record(s) per patient (10) (the so-called “long” format) consistent with the counting process formulation of time-to-event studies (11). The study exit time was hospital discharge and study entry was ICU admission (deaths in ICU were not considered); study time was in hours. Our approach included all (that is, multiple readmissions) subject to computational requirements. This strategy had statistical advantage, in that potential bias was avoided as: (i) some subjects were presumably more “frail” and subject to repeated events and person-time was thus not truncated to the first readmission, and (ii) event dependence could be formally incorporated using the counting process design, whereby the “time-clock” was not reset to zero after each event. Resetting the clock to zero (“gap time”) after events renders the latter independent, as does stratification of event order (each stratum has a unique baseline hazard function). Under conditions of non-stratification, an initial event is permitted to affect the later
Page 27
0 exp tij ij ih t h t x w
ijh t
0h t
iw
'siw Wf
0 exp tij i ijh t h t u x expi iu w 'siu
Uf
1/ 1
1
exp /( )
1/U
u uf u
1iu
event rate, and estimates are of the total (covariate) effect. As we wished to preserve event dependence, stratification was only considered by ICU site. Computation was performed using the user-written command “strmcure” (7) within the Stata™ statistical software environment; alternate estimates using the Stata™ shared frailty Cox model (“stcox”) and also in a Weibull parametric proportional hazards survival model were also explored. As the “strmcure” frailty model is an expansion of the conventional Cox model, it was of interest to assess the performance of the latter. As more orthodox means of assessment (Harrell’s C and goodness of fit) are not well defined for multi-record survival data, we utilised the user-written “str2ph” module by Royston(12). This module estimates an R-squared for survival models using a training and test sample (50% / 50%) subject to bootstrap replications (1000), where the survival regression is re-estimated in the test sample on the index predicted from the variable list in the training sample (that is, calibration).
The fully covariate adjusted model is shown in Table E7. One can see that none of the three readmissions was statistically significant. The frailty term (𝜃) expresses the variance of the frailty effect and its significance indicates that within patient correlation cannot be ignored. Parameter
estimates are conditional upon 𝜃 (strictly, conditional upon the estimate, ).
Page 28
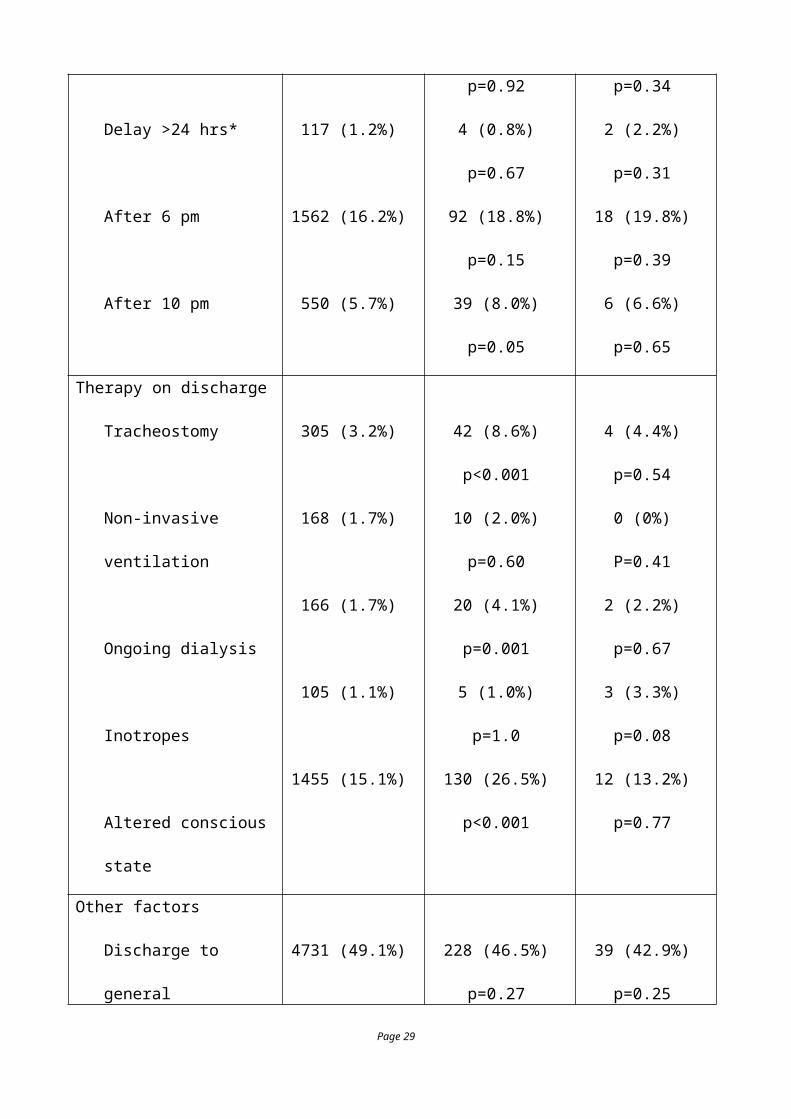
Table E10. Estimates for the frailty model using STRMCURE.
Parameter Hazard ratio Lower 95%CI Upper 95% CI P value
Initial ICU admission 1.000 1.000 1.000 .
First readmission 0.884 0.621 1.258 0.493
Second readmission 0.904 0.407 2.009 0.804
Third readmission 0.435 0.038 4.990 0.503
Age 1.026 1.018 1.034 0.0001
Cardiac surgical 0.515 0.291 0.910 0.022
Medical patient 1.430 1.105 1.851 0.007
Not for resuscitation 17.780 13.717 23.047 0.0001
Tracheostomy 0.380 0.249 0.579 0.0001
Inotrope history 3.470 1.653 7.281 0.001
Renal replacement therapy 1.555 0.943 2.566 0.080
Ward origin of readmission 1.702 1.322 2.190 0.0001
Frailty (q); log-hazard scale 0.818 0.672 0.964 0.0001
The analysis was repeated using a Cox model. This model also demonstrated good performance as assessed by the R-squared statistic: 0.63(95%CI: 0.51, 0.72). Again, hazard ratios for readmissions were not significant.
Page 29
Bibliography
1. Gunasekara FI, Richardson K, Carter K, Blakely T. Fixed effects analysis of repeated measures
data. Int J Epidemiol 2014;43:264-269.
2. Kalbfleisch JD, Wolfe RA. On monitoring outcomes of medical providers. Stat Biosci
2013;5:286-302.
3. Santamaria JD, Duke GJ, Pilcher DV, Cooper DJ, Moran J, Bellomo R. The timing of
discharge from the intensive care unit and subsequent mortality. A prospective, multicenter
study. Am J Respir Crit Care Med 2015;191:1033-1039.
4. Cook RJ, Lawless JF. The statistical analysis of recurrent events. New York: Springer Science
& Business Media, LLC; 2007.
5. Clayton D. Some approaches to the analysis of recurrent event data. Stat Methods Med Res
1994;3:244-262.
6. Aalen OO. Effects of frailty in survival analysis. Stat Methods Med Res 1994;3:227-243.
7. Xu Y, Cheung YB. Frailty models and frailty-mixture models for recurrent event times. Stata
Journal 2015;15:135-154.
8. Xu Y, Cheung YB, Lam KF, Milligan P. Estimation of summary protective efficacy using a
frailty mixture model for recurrent event time data. Stat Med 2012;31:4023-4039.
9. Duchateau L, Janssen P. Frailty models. The frailty model. New York: Springer Science &
Business Media, LLC; 2008. p. 117-197.
10. Stata Coporation STSET command - declare data to be survival-time data. 2013. Available
from: http://www.stata.com/manuals13/ststset.pdf. Accessed 13 December 2015
11. Kalbfleisch JD, Prentice RL. Counting processes and asymptotic theory. Statistical analysis of
failure time data, 2nd Edition ed. Hoboken, NJ: JD Wiley & Sons, Inc; 2002. p. 148-192.
12. Royston P. Explained variation for survival models. Stata Journal 2006;6:83-96.
Page 30