Embed Size (px)
Citation preview
6/27/2012
1
Patterns of Tobacco Use in the United States
Surveillance and Evaluation Net Conference SeriesCDC Office on Smoking and Health
June 27, 2012
Gary A. Giovino, PhD, MSProfessor and Chair
Department of Community Health and Health BehaviorUniversity at Buffalo, School of Public Health and Health Professions
Outline
• Per capita consumption of various tobacco products
• Prevalence estimates from survey comparisons– Current smoking
– Indicators of quitting
– CPD/DPM
– Cigarettes and other tobacco products
• Indicators of hardening
• International
6/27/2012
2
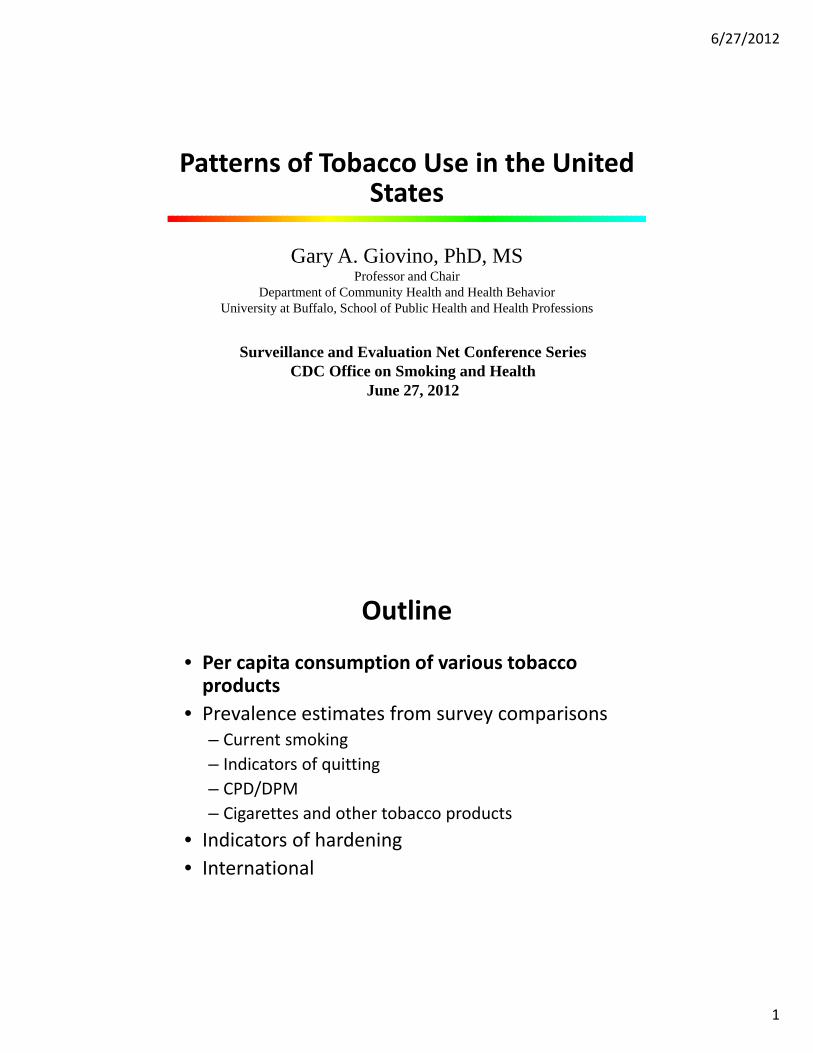
Trends in Per Capita Consumption of Various Tobacco Products – United States,
1880‐2006
Source: Tobacco Situation and Outlook Report, U.S. Department of Agriculture, U.S. CensusNote: Among persons > 18 years old.
Beginning in 1982, fine-cut chewing tobacco was reclassified as snuff.
0
2
4
6
8
10
12
14
1618
8018
8518
9018
9519
0019
0519
1019
1519
2019
2519
3019
3519
4019
4519
5019
5519
6019
6519
7019
7519
8019
8519
9019
9520
0020
05
PO
UN
DS
YEAR
Cigarettes Cigars Pipe/Roll your own Chewing Snuff
Source: US Department of Agriculture
Large Cigarweigh > 1.36 grams
Wide variety of cigar products
Small cigars weigh less than or equal to 1.36 grams
Features common to cigarettes, such as shape, length (70 to 100 mm), and use of filter tips
CigarilloConsidered a “large” cigar for taxation purpose
Source: Cristine Delnevo, UMDNJ School of Public Health
6/27/2012
3
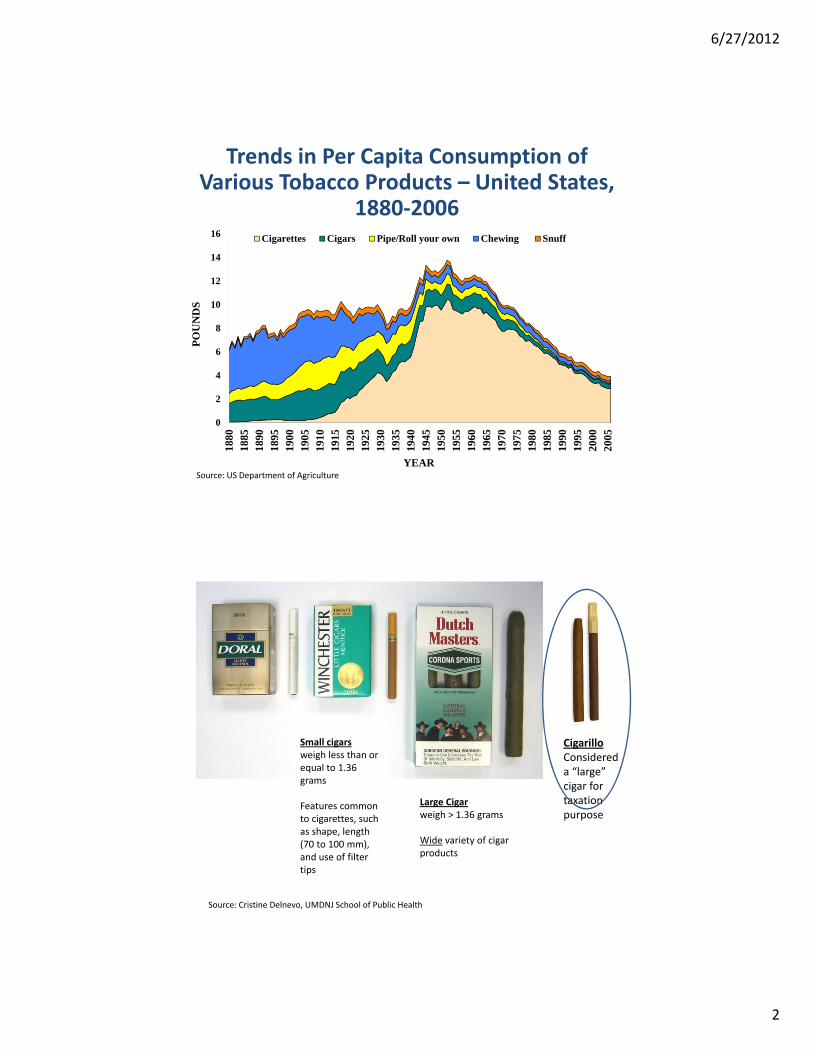
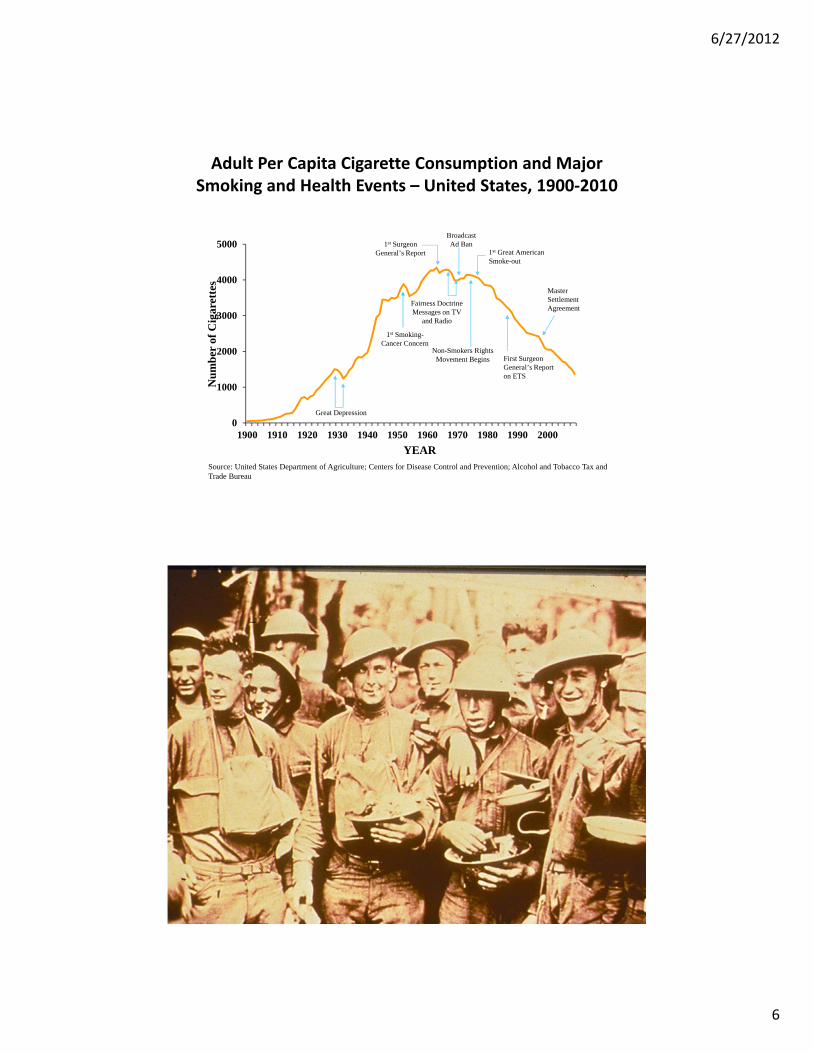
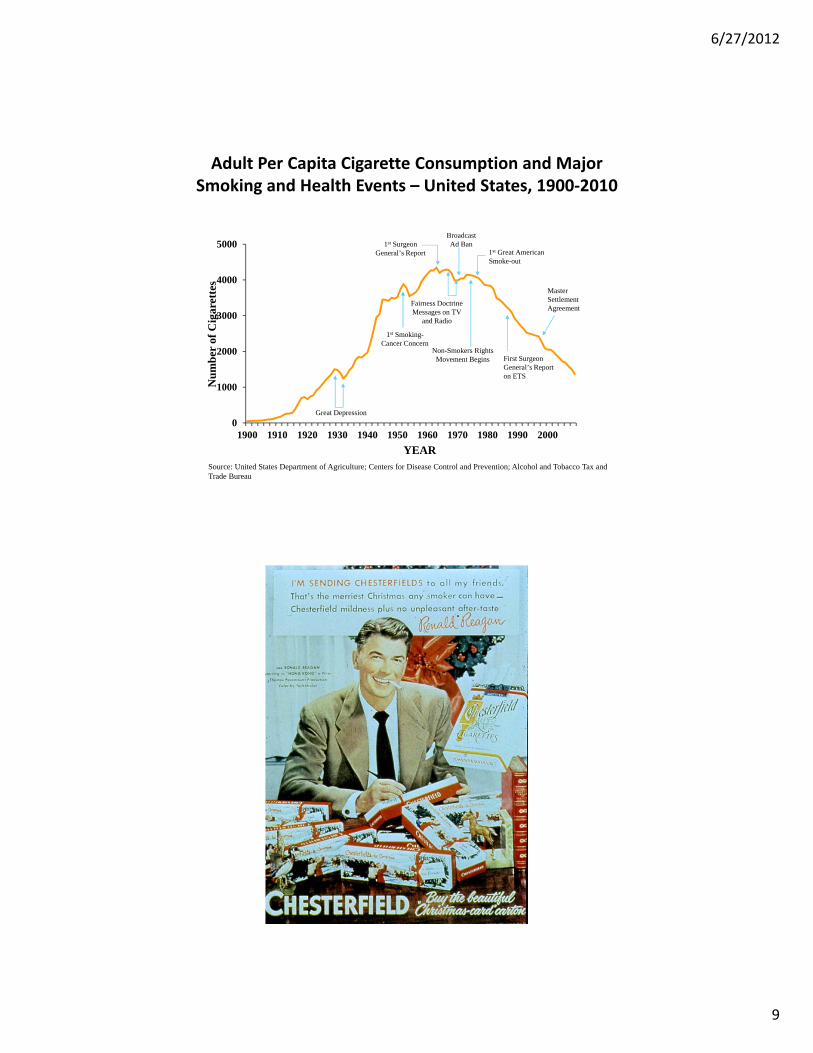
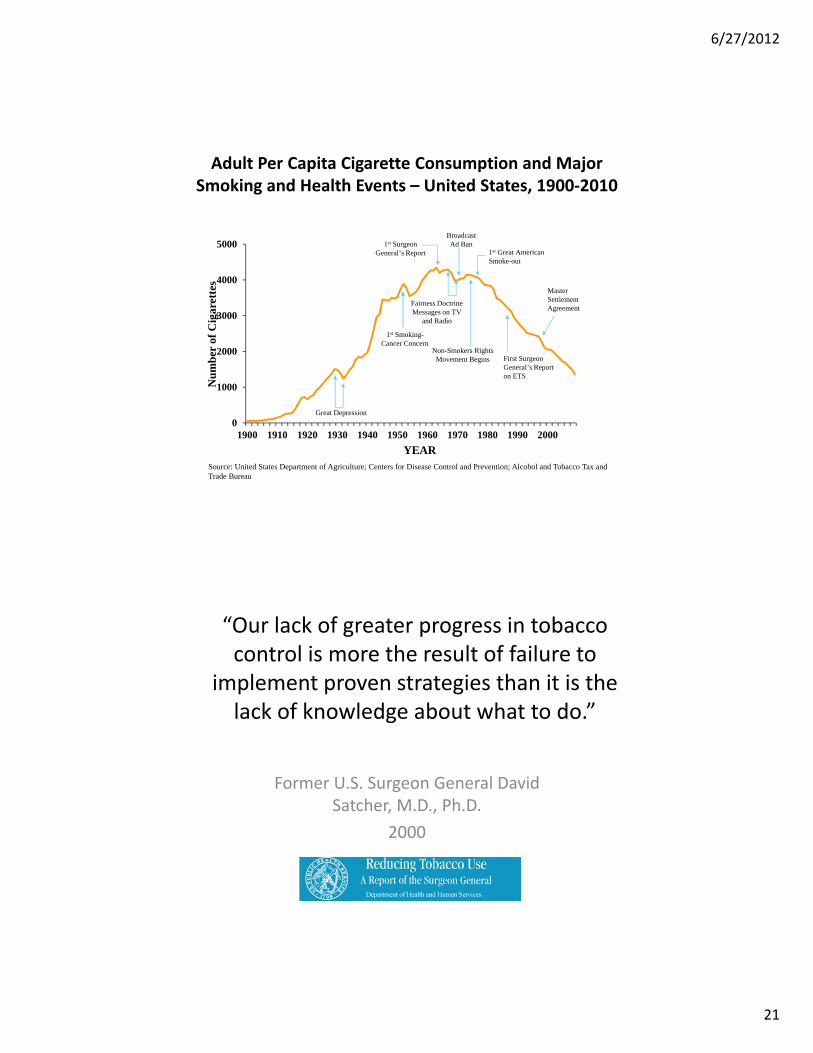
Adult Per Capita Cigarette Consumption and Major Smoking and Health Events – United States, 1900‐2010
0
1000
2000
3000
4000
5000
1900 1910 1920 1930 1940 1950 1960 1970 1980 1990 2000
Nu
mb
er o
f C
igar
ette
s
YEARSource: United States Department of Agriculture; Centers for Disease Control and Prevention; Alcohol and Tobacco Tax and Trade Bureau
1st Smoking-Cancer Concern
Fairness Doctrine Messages on TV
and Radio
Non-Smokers Rights Movement Begins First Surgeon
General’s Report on ETS
1st Surgeon General’s Report
Broadcast Ad Ban
1st Great American Smoke-out
Master Settlement Agreement
Great Depression
Per Capita Consumption of Cigarettes and Cigars (Number of Sticks) – 2000‐2010
0
500
1000
1500
2000
2500
Cigarettes
Cigars‐Small
Cigars‐Large
Source: US Department of Treasury; Alcohol and Tobacco Tax and Trade Bureau
6/27/2012
4
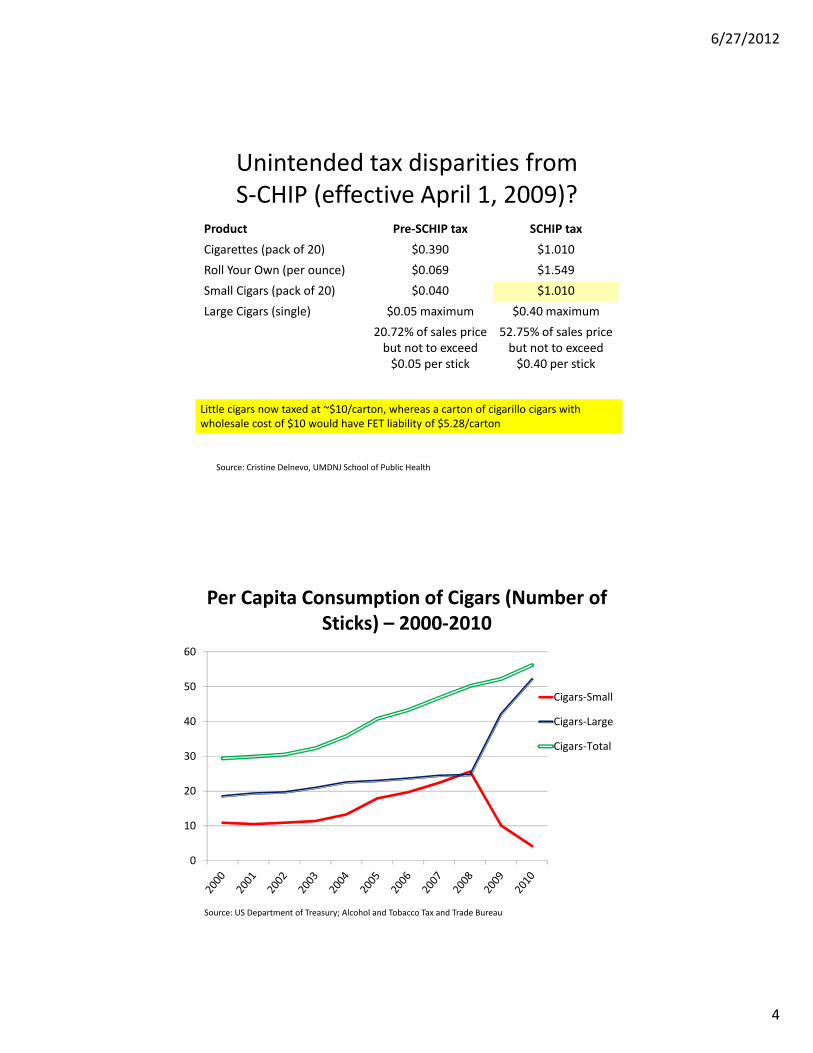
Unintended tax disparities from S‐CHIP (effective April 1, 2009)?
Product Pre‐SCHIP tax SCHIP tax
Cigarettes (pack of 20) $0.390 $1.010
Roll Your Own (per ounce) $0.069 $1.549
Small Cigars (pack of 20) $0.040 $1.010
Large Cigars (single) $0.05 maximum $0.40 maximum
20.72% of sales price but not to exceed $0.05 per stick
52.75% of sales price but not to exceed $0.40 per stick
Snuff (per ounce) $0.037 $0.094
Chewing Tobacco (per ounce) $0.012 $0.032
Pipe Tobacco (per ounce) $0.069 $0.177
Little cigars now taxed at ~$10/carton, whereas a carton of cigarillo cigars with wholesale cost of $10 would have FET liability of $5.28/carton
Source: Cristine Delnevo, UMDNJ School of Public Health
Per Capita Consumption of Cigars (Number of Sticks) – 2000‐2010
0
10
20
30
40
50
60
Cigars‐Small
Cigars‐Large
Cigars‐Total
Source: US Department of Treasury; Alcohol and Tobacco Tax and Trade Bureau
6/27/2012
5
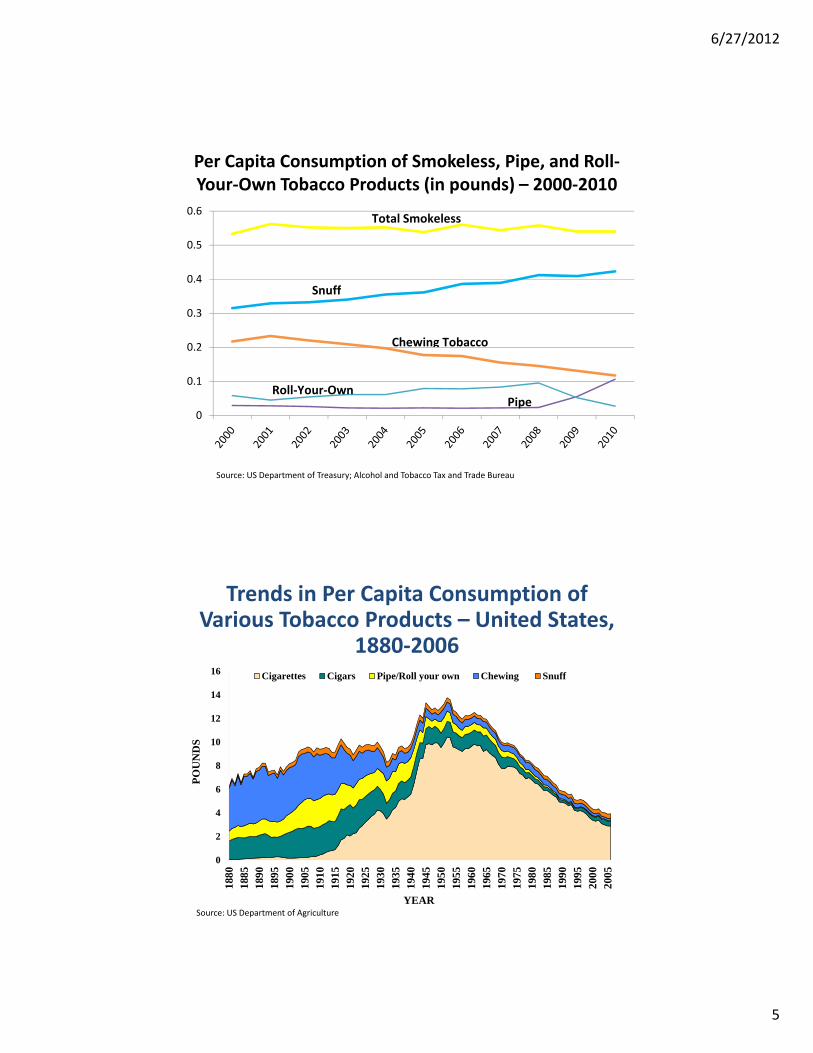
Per Capita Consumption of Smokeless, Pipe, and Roll‐Your‐Own Tobacco Products (in pounds) – 2000‐2010
0
0.1
0.2
0.3
0.4
0.5
0.6Total Smokeless
Snuff
Chewing Tobacco
Roll‐Your‐Own
Source: US Department of Treasury; Alcohol and Tobacco Tax and Trade Bureau
Pipe
Trends in Per Capita Consumption of Various Tobacco Products – United States,
1880‐2006
Source: Tobacco Situation and Outlook Report, U.S. Department of Agriculture, U.S. CensusNote: Among persons > 18 years old.
Beginning in 1982, fine-cut chewing tobacco was reclassified as snuff.
0
2
4
6
8
10
12
14
16
1880
1885
1890
1895
1900
1905
1910
1915
1920
1925
1930
1935
1940
1945
1950
1955
1960
1965
1970
1975
1980
1985
1990
1995
2000
2005
PO
UN
DS
YEAR
Cigarettes Cigars Pipe/Roll your own Chewing Snuff
Source: US Department of Agriculture
6/27/2012
6
Adult Per Capita Cigarette Consumption and Major Smoking and Health Events – United States, 1900‐2010
0
1000
2000
3000
4000
5000
1900 1910 1920 1930 1940 1950 1960 1970 1980 1990 2000
Nu
mb
er o
f C
igar
ette
s
YEARSource: United States Department of Agriculture; Centers for Disease Control and Prevention; Alcohol and Tobacco Tax and Trade Bureau
1st Smoking-Cancer Concern
Fairness Doctrine Messages on TV
and Radio
Non-Smokers Rights Movement Begins First Surgeon
General’s Report on ETS
1st Surgeon General’s Report
Broadcast Ad Ban
1st Great American Smoke-out
Master Settlement Agreement
Great Depression

6/27/2012
7
6/27/2012
8
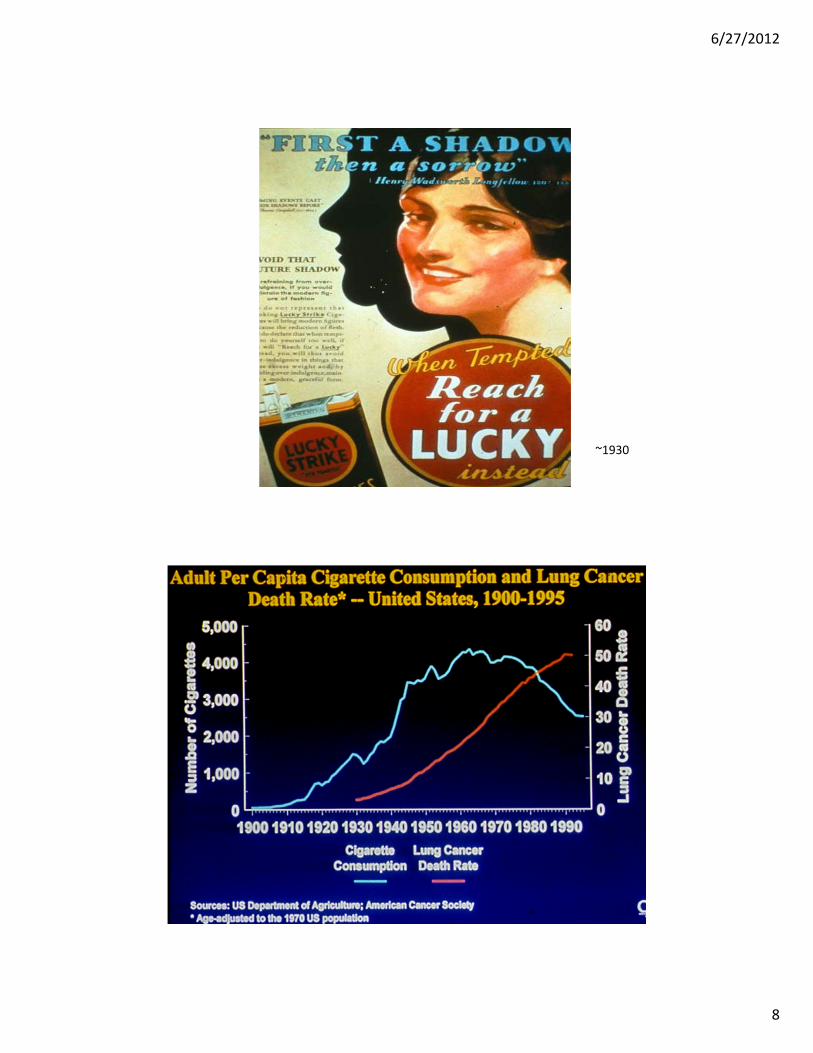
~1930
6/27/2012
9
Adult Per Capita Cigarette Consumption and Major Smoking and Health Events – United States, 1900‐2010
0
1000
2000
3000
4000
5000
1900 1910 1920 1930 1940 1950 1960 1970 1980 1990 2000
Nu
mb
er o
f C
igar
ette
s
YEARSource: United States Department of Agriculture; Centers for Disease Control and Prevention; Alcohol and Tobacco Tax and Trade Bureau
1st Smoking-Cancer Concern
Fairness Doctrine Messages on TV
and Radio
Non-Smokers Rights Movement Begins First Surgeon
General’s Report on ETS
1st Surgeon General’s Report
Broadcast Ad Ban
1st Great American Smoke-out
Master Settlement Agreement
Great Depression
6/27/2012
10
6/27/2012
11
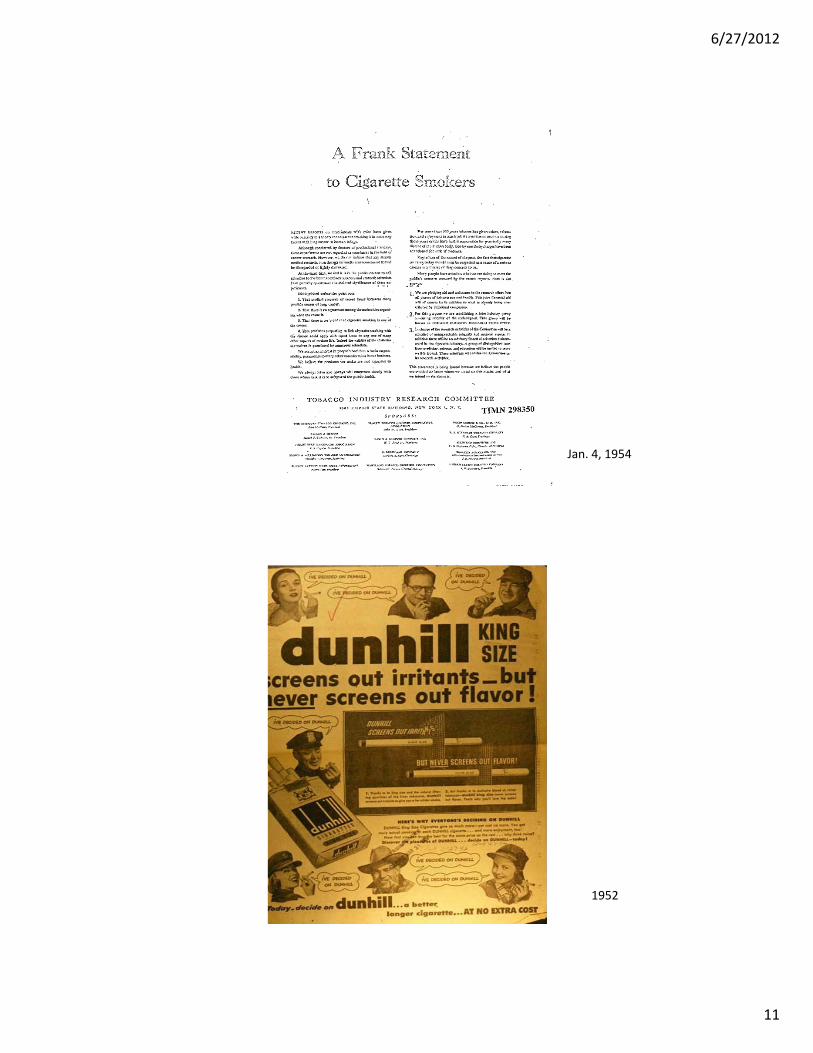
Jan. 4, 1954
1952
6/27/2012
12
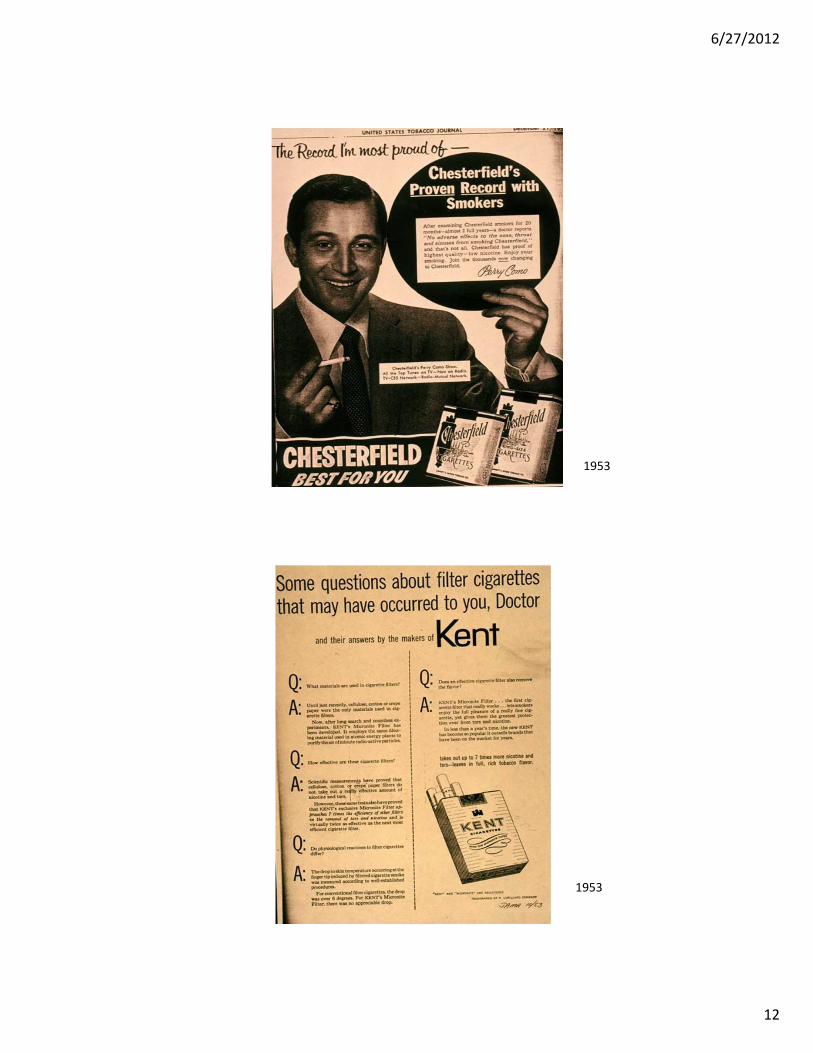
1953
1953
6/27/2012
13
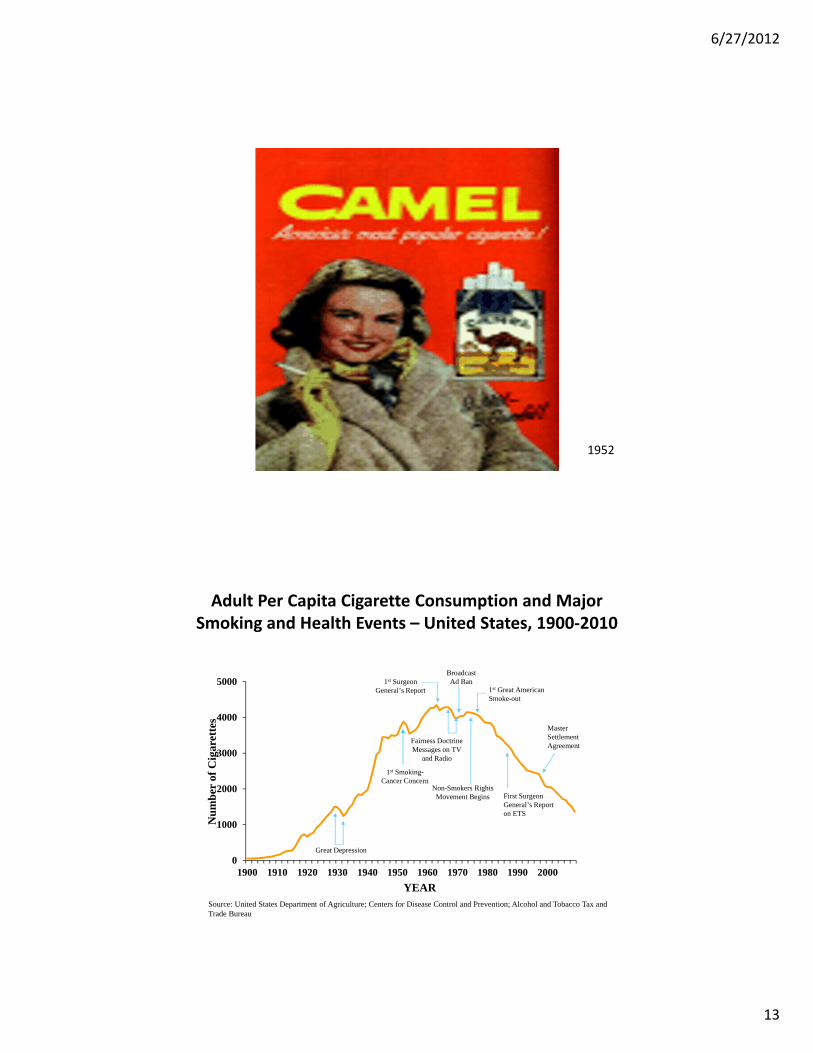
1952
Adult Per Capita Cigarette Consumption and Major Smoking and Health Events – United States, 1900‐2010
0
1000
2000
3000
4000
5000
1900 1910 1920 1930 1940 1950 1960 1970 1980 1990 2000
Nu
mb
er o
f C
igar
ette
s
YEARSource: United States Department of Agriculture; Centers for Disease Control and Prevention; Alcohol and Tobacco Tax and Trade Bureau
1st Smoking-Cancer Concern
Fairness Doctrine Messages on TV
and Radio
Non-Smokers Rights Movement Begins First Surgeon
General’s Report on ETS
1st Surgeon General’s Report
Broadcast Ad Ban
1st Great American Smoke-out
Master Settlement Agreement
Great Depression
6/27/2012
14
Adult Per Capita Cigarette Consumption and Major Smoking and Health Events – United States, 1900‐2010
0
1000
2000
3000
4000
5000
1900 1910 1920 1930 1940 1950 1960 1970 1980 1990 2000
Nu
mb
er o
f C
igar
ette
s
YEARSource: United States Department of Agriculture; Centers for Disease Control and Prevention; Alcohol and Tobacco Tax and Trade Bureau
1st Smoking-Cancer Concern
Fairness Doctrine Messages on TV
and Radio
Non-Smokers Rights Movement Begins First Surgeon
General’s Report on ETS
1st Surgeon General’s Report
Broadcast Ad Ban
1st Great American Smoke-out
Master Settlement Agreement
Great Depression
6/27/2012
15
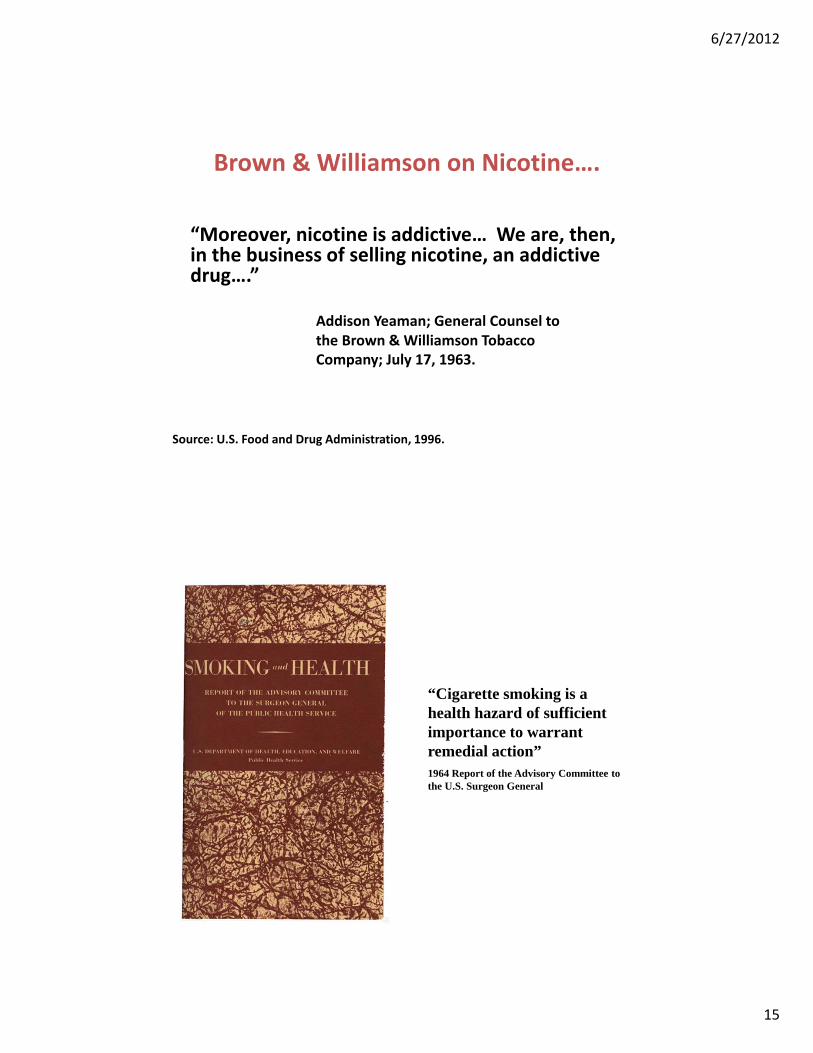
Brown & Williamson on Nicotine….
“Moreover, nicotine is addictive… We are, then, in the business of selling nicotine, an addictive drug….”
Addison Yeaman; General Counsel tothe Brown & Williamson Tobacco Company; July 17, 1963.
Source: U.S. Food and Drug Administration, 1996.
“Cigarette smoking is a health hazard of sufficient importance to warrant remedial action”1964 Report of the Advisory Committee to the U.S. Surgeon General

6/27/2012
16
Philip Morris on Nicotine….
“Think of the cigarette pack as a storage container for a day’s supply of nicotine….Think of the cigarette as a dispenser for a unit dose of nicotine…Think of a puff of smoke as a vehicle of nicotine…
Smoke is beyond question the most optimized vehicle of nicotine and the cigarette the most optimized dispenser of smoke.”
Dr. William Dunn; Philip Morris Tobacco Company, 1972.
Source: U.S. Food and Drug Administration, 1996.
R. J. Reynolds chimes in….
“In a sense, the tobacco industry may be thought of as being a specialized, highly ritualized, and stylized segment of the pharmaceutical industry. Tobacco products uniquely contain and deliver nicotine, a potent drug with a variety of physiological effects.”
Claude Teague, R.J. Reynolds Tobacco Company, 1972.
Source: U.S. Food and Drug Administration, 1996.

6/27/2012
17
6/27/2012
18
Adult Per Capita Cigarette Consumption and Major Smoking and Health Events – United States, 1900‐2010
0
1000
2000
3000
4000
5000
1900 1910 1920 1930 1940 1950 1960 1970 1980 1990 2000
Nu
mb
er o
f C
igar
ette
s
YEARSource: United States Department of Agriculture; Centers for Disease Control and Prevention; Alcohol and Tobacco Tax and Trade Bureau
1st Smoking-Cancer Concern
Fairness Doctrine Messages on TV
and Radio
Non-Smokers Rights Movement Begins First Surgeon
General’s Report on ETS
1st Surgeon General’s Report
Broadcast Ad Ban
1st Great American Smoke-out
Master Settlement Agreement
Great Depression
6/27/2012
19

6/27/2012
20
6/27/2012
21
Adult Per Capita Cigarette Consumption and Major Smoking and Health Events – United States, 1900‐2010
0
1000
2000
3000
4000
5000
1900 1910 1920 1930 1940 1950 1960 1970 1980 1990 2000
Nu
mb
er o
f C
igar
ette
s
YEARSource: United States Department of Agriculture; Centers for Disease Control and Prevention; Alcohol and Tobacco Tax and Trade Bureau
1st Smoking-Cancer Concern
Fairness Doctrine Messages on TV
and Radio
Non-Smokers Rights Movement Begins First Surgeon
General’s Report on ETS
1st Surgeon General’s Report
Broadcast Ad Ban
1st Great American Smoke-out
Master Settlement Agreement
Great Depression
“Our lack of greater progress in tobacco control is more the result of failure to
implement proven strategies than it is the lack of knowledge about what to do.”
Former U.S. Surgeon General David Satcher, M.D., Ph.D.
2000
6/27/2012
22
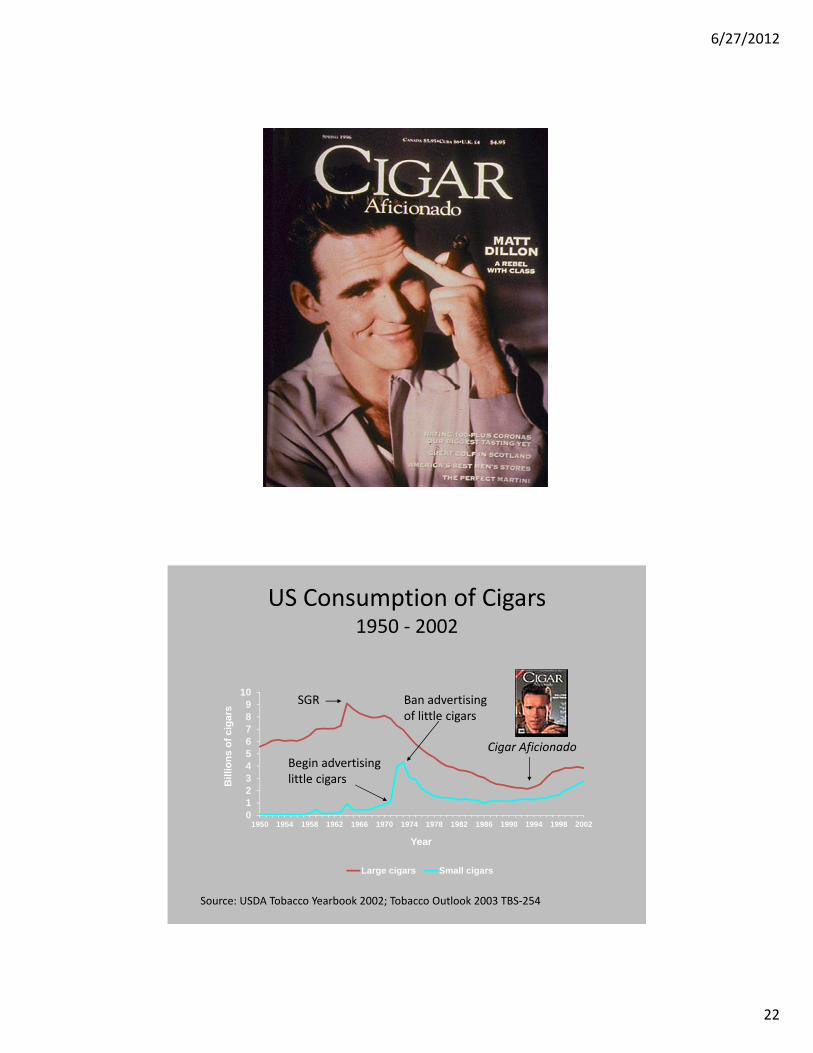
US Consumption of Cigars1950 ‐ 2002
0123456789
10
1950 1954 1958 1962 1966 1970 1974 1978 1982 1986 1990 1994 1998 2002
Bill
ion
s o
f ci
gar
s
Year
Large cigars Small cigars
SGR
Begin advertisinglittle cigars
Ban advertisingof little cigars
Cigar Aficionado
Source: USDA Tobacco Yearbook 2002; Tobacco Outlook 2003 TBS‐254

6/27/2012
23
6/27/2012
24
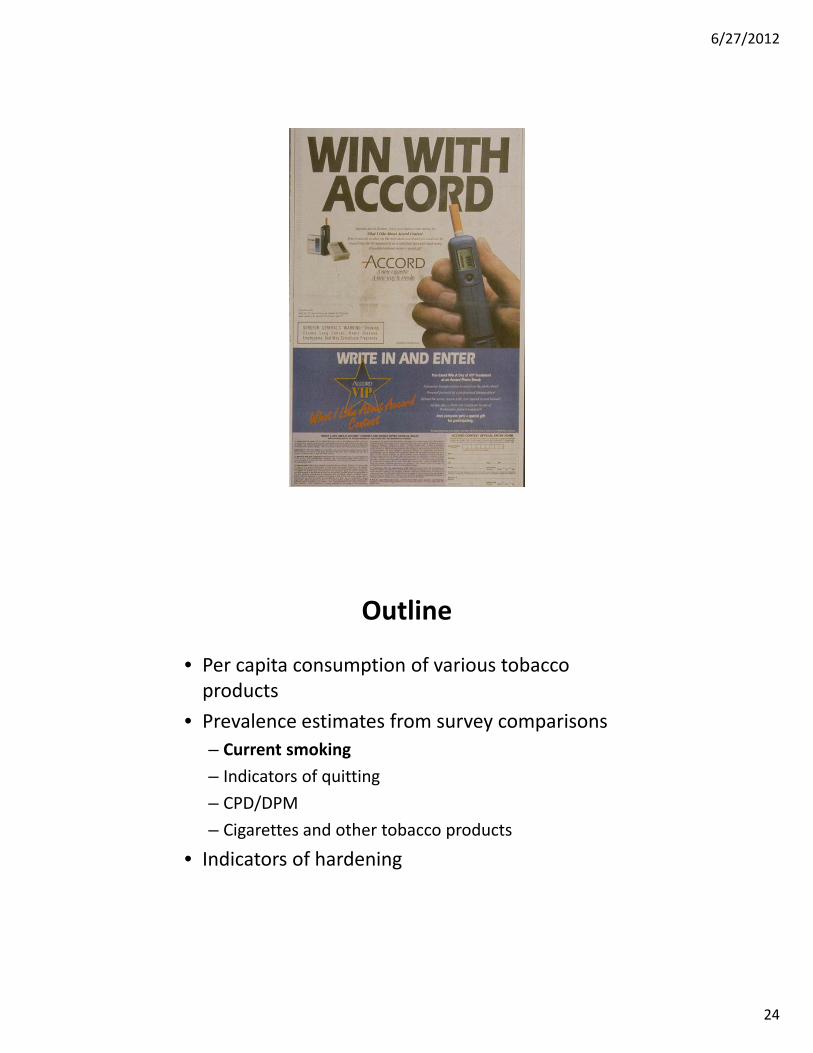
Outline
• Per capita consumption of various tobacco products
• Prevalence estimates from survey comparisons
– Current smoking
– Indicators of quitting
– CPD/DPM
– Cigarettes and other tobacco products
• Indicators of hardening
6/27/2012
25
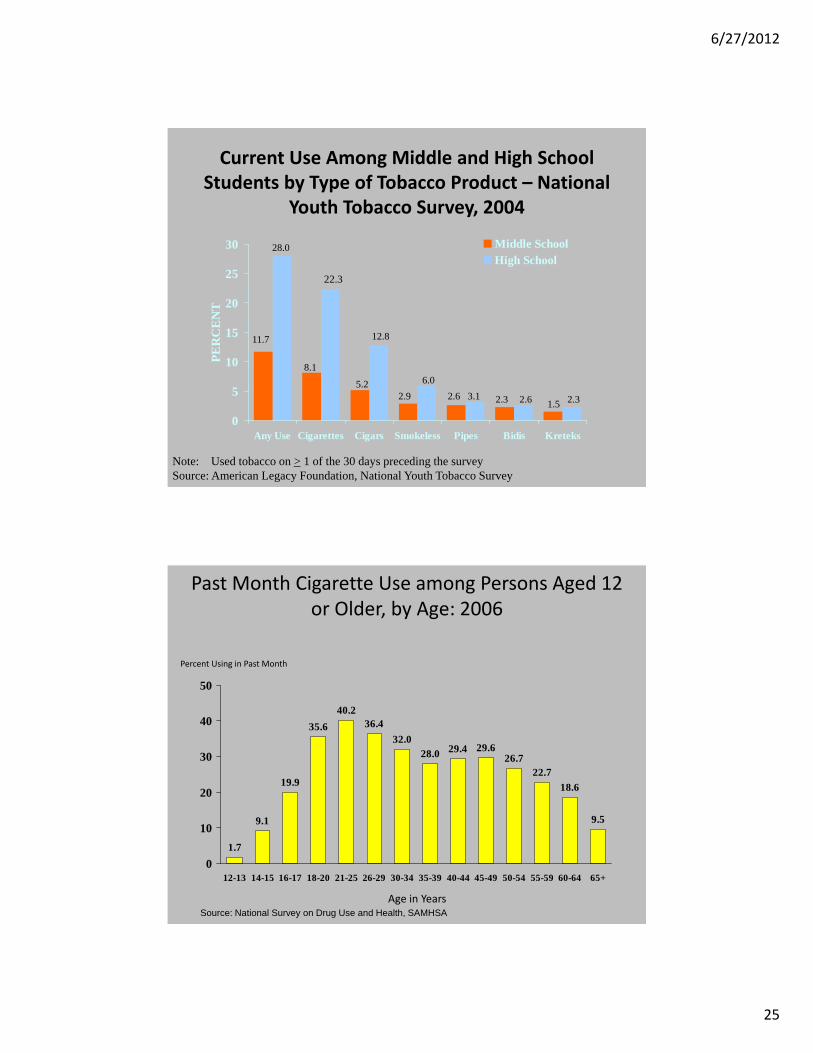
Current Use Among Middle and High School Students by Type of Tobacco Product – National
Youth Tobacco Survey, 2004
0
5
10
15
20
25
30
Any Use Cigarettes Cigars Smokeless Pipes Bidis Kreteks
PE
RC
EN
T
Middle SchoolHigh School
Note: Used tobacco on > 1 of the 30 days preceding the survey Source: American Legacy Foundation, National Youth Tobacco Survey
11.7
28.0
8.1
22.3
5.2
12.8
2.9
6.0
2.6 3.1 2.6 1.52.3 2.3
Past Month Cigarette Use among Persons Aged 12 or Older, by Age: 2006
Percent Using in Past Month
1.7
9.1
19.9
35.6
40.236.4
32.028.0 29.4 29.6
26.722.7
18.6
9.5
0
10
20
30
40
50
12-13 14-15 16-17 18-20 21-25 26-29 30-34 35-39 40-44 45-49 50-54 55-59 60-64 65+
Age in YearsSource: National Survey on Drug Use and Health, SAMHSA
6/27/2012
26
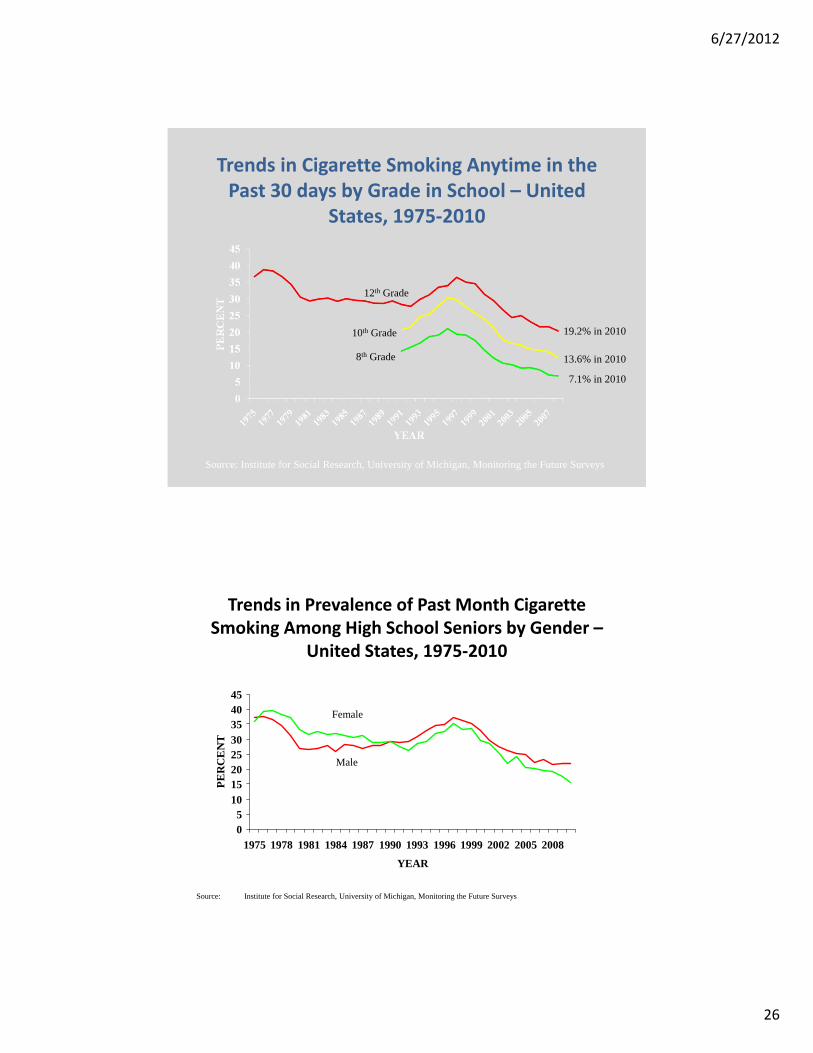
Trends in Cigarette Smoking Anytime in the Past 30 days by Grade in School – United
States, 1975‐2010
Source: Institute for Social Research, University of Michigan, Monitoring the Future Surveys
12th Grade
8th Grade
10th Grade 19.2% in 2010
13.6% in 2010
7.1% in 2010
Trends in Prevalence of Past Month Cigarette Smoking Among High School Seniors by Gender –
United States, 1975‐2010
05
1015202530354045
1975 1978 1981 1984 1987 1990 1993 1996 1999 2002 2005 2008
YEAR
PE
RC
EN
T
Source: Institute for Social Research, University of Michigan, Monitoring the Future Surveys
Male
Female
6/27/2012
27
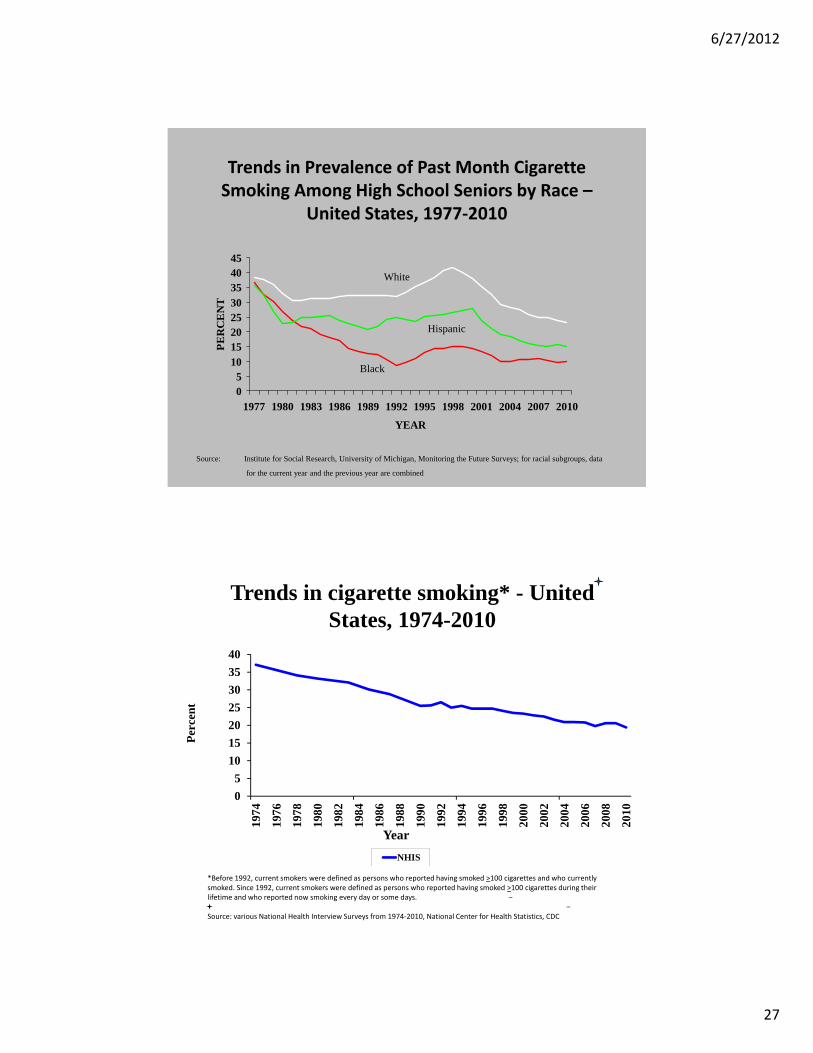
Trends in Prevalence of Past Month Cigarette Smoking Among High School Seniors by Race –
United States, 1977‐2010
05
1015202530354045
1977 1980 1983 1986 1989 1992 1995 1998 2001 2004 2007 2010
YEAR
PE
RC
EN
T
Source: Institute for Social Research, University of Michigan, Monitoring the Future Surveys; for racial subgroups, data
for the current year and the previous year are combined
White
Black
Hispanic
0
5
10
15
20
25
30
35
40
1974
1976
1978
1980
1982
1984
1986
1988
1990
1992
1994
1996
1998
2000
2002
2004
2006
2008
2010
Year
NHIS
Per
cent
Trends in cigarette smoking* - United States, 1974-2010
*Before 1992, current smokers were defined as persons who reported having smoked >100 cigarettes and who currently smoked. Since 1992, current smokers were defined as persons who reported having smoked >100 cigarettes during their lifetime and who reported now smoking every day or some days.
Source: various National Health Interview Surveys from 1974‐2010, National Center for Health Statistics, CDC
6/27/2012
28
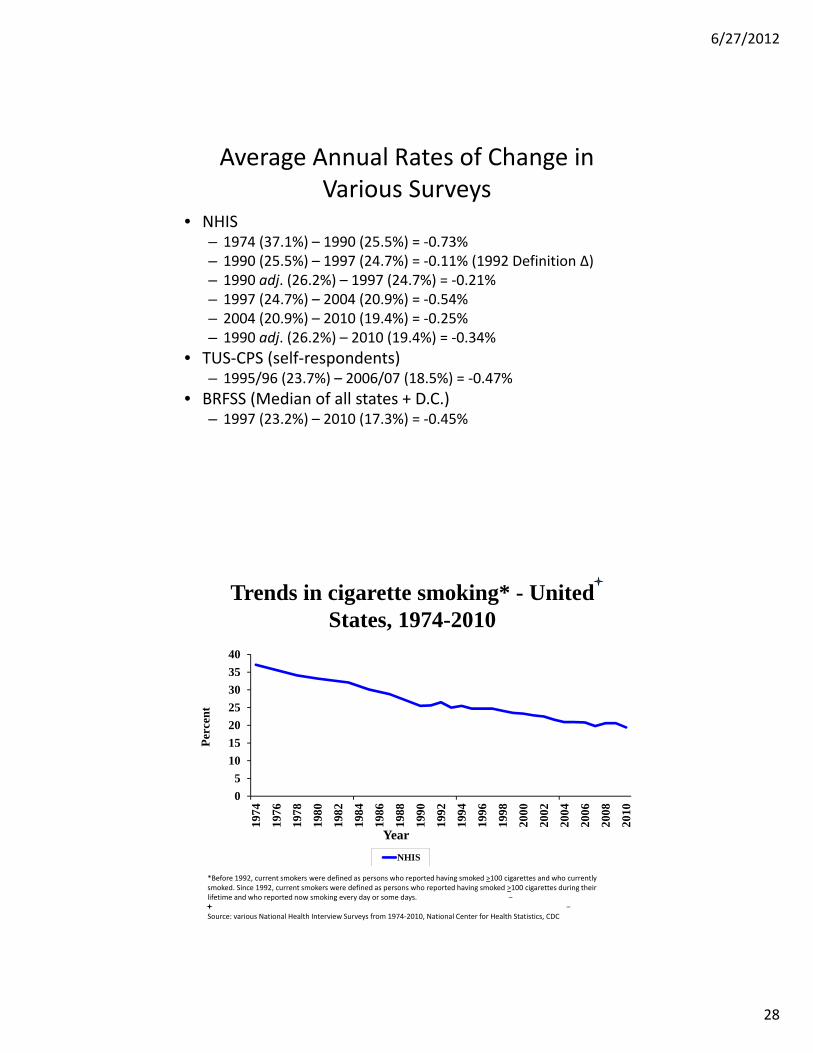
Average Annual Rates of Change in Various Surveys
• NHIS– 1974 (37.1%) – 1990 (25.5%) = ‐0.73%– 1990 (25.5%) – 1997 (24.7%) = ‐0.11% (1992 Definition Δ)– 1990 adj. (26.2%) – 1997 (24.7%) = ‐0.21%– 1997 (24.7%) – 2004 (20.9%) = ‐0.54%– 2004 (20.9%) – 2010 (19.4%) = ‐0.25%– 1990 adj. (26.2%) – 2010 (19.4%) = ‐0.34%
• TUS‐CPS (self‐respondents)– 1995/96 (23.7%) – 2006/07 (18.5%) = ‐0.47%
• BRFSS (Median of all states + D.C.)– 1997 (23.2%) – 2010 (17.3%) = ‐0.45%
0
5
10
15
20
25
30
35
40
1974
1976
1978
1980
1982
1984
1986
1988
1990
1992
1994
1996
1998
2000
2002
2004
2006
2008
2010
Year
NHIS
Per
cent
Trends in cigarette smoking* - United States, 1974-2010
*Before 1992, current smokers were defined as persons who reported having smoked >100 cigarettes and who currently smoked. Since 1992, current smokers were defined as persons who reported having smoked >100 cigarettes during their lifetime and who reported now smoking every day or some days.
Source: various National Health Interview Surveys from 1974‐2010, National Center for Health Statistics, CDC
6/27/2012
29
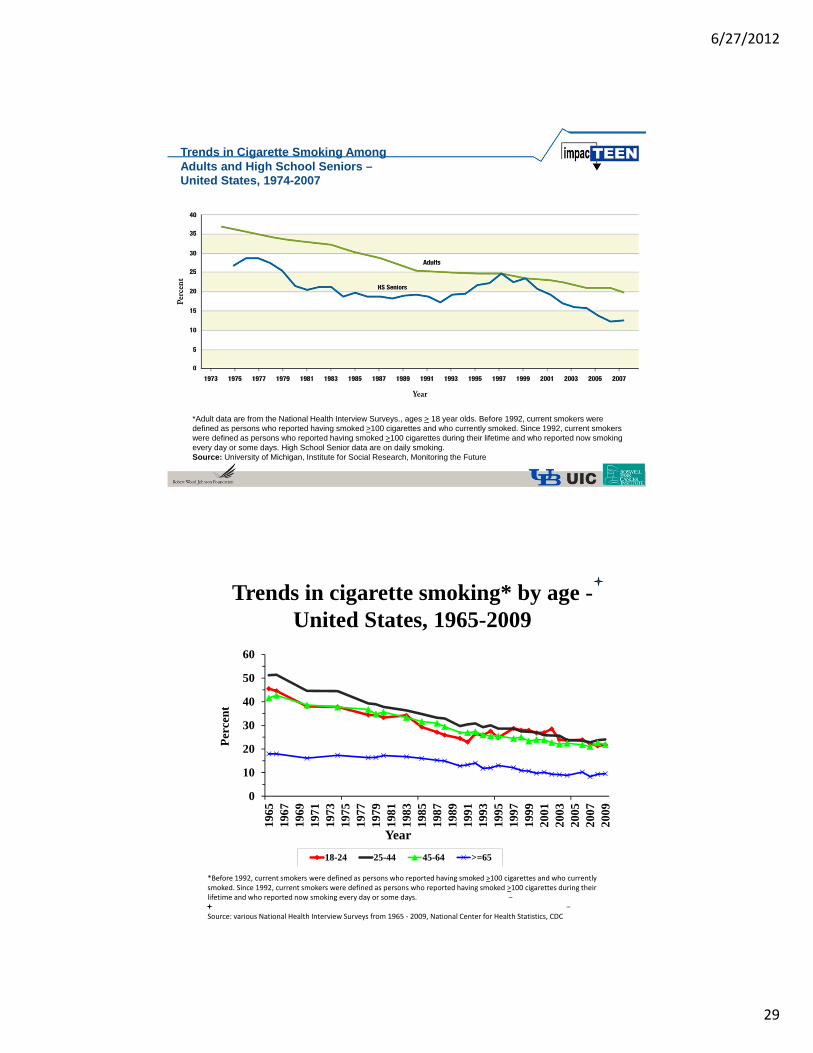
Trends in Cigarette Smoking Among Adults and High School Seniors –United States, 1974-2007
*Adult data are from the National Health Interview Surveys., ages > 18 year olds. Before 1992, current smokers were defined as persons who reported having smoked >100 cigarettes and who currently smoked. Since 1992, current smokers were defined as persons who reported having smoked >100 cigarettes during their lifetime and who reported now smoking every day or some days. High School Senior data are on daily smoking. Source: University of Michigan, Institute for Social Research, Monitoring the Future
0
10
20
30
40
50
60
1965
1967
1969
1971
1973
1975
1977
1979
1981
1983
1985
1987
1989
1991
1993
1995
1997
1999
2001
2003
2005
2007
2009
Year
18-24 25-44 45-64 >=65
Per
cent
Trends in cigarette smoking* by age -United States, 1965-2009
*Before 1992, current smokers were defined as persons who reported having smoked >100 cigarettes and who currently smoked. Since 1992, current smokers were defined as persons who reported having smoked >100 cigarettes during their lifetime and who reported now smoking every day or some days.
Source: various National Health Interview Surveys from 1965 ‐ 2009, National Center for Health Statistics, CDC
6/27/2012
30
0
10
20
30
40
50
60
70
80
Year
18-24 25-44 45-64 >=65
% F
orm
er S
mok
ers
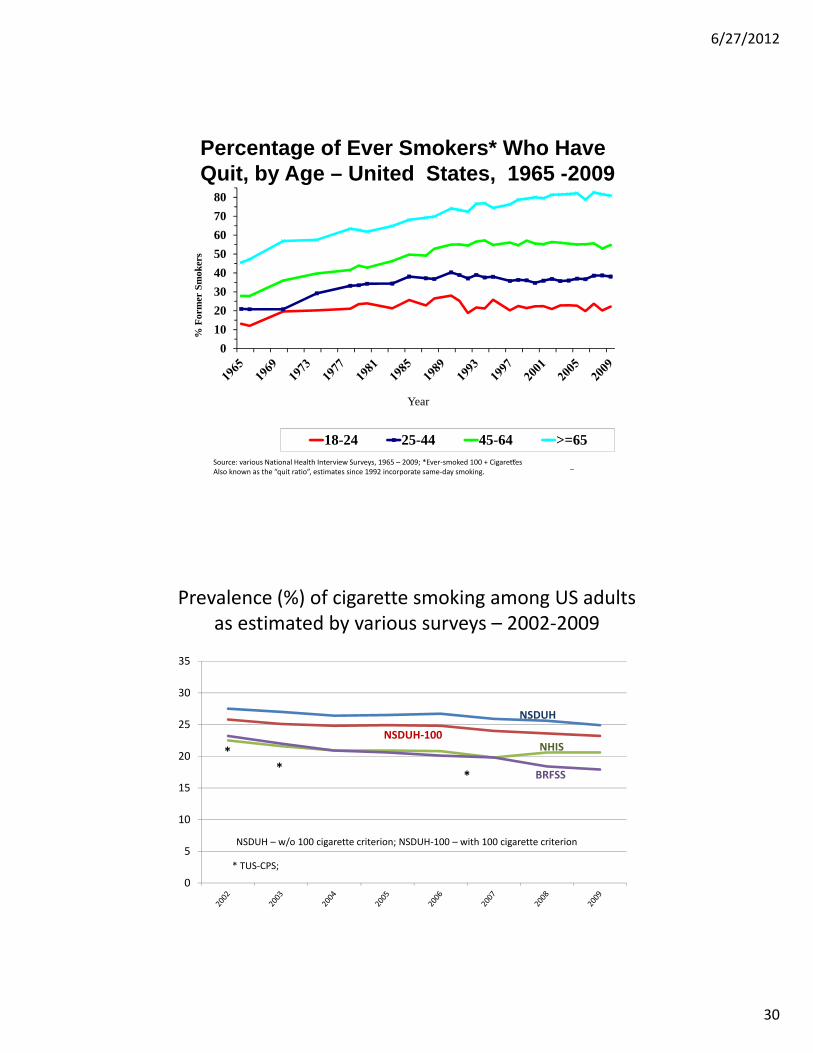
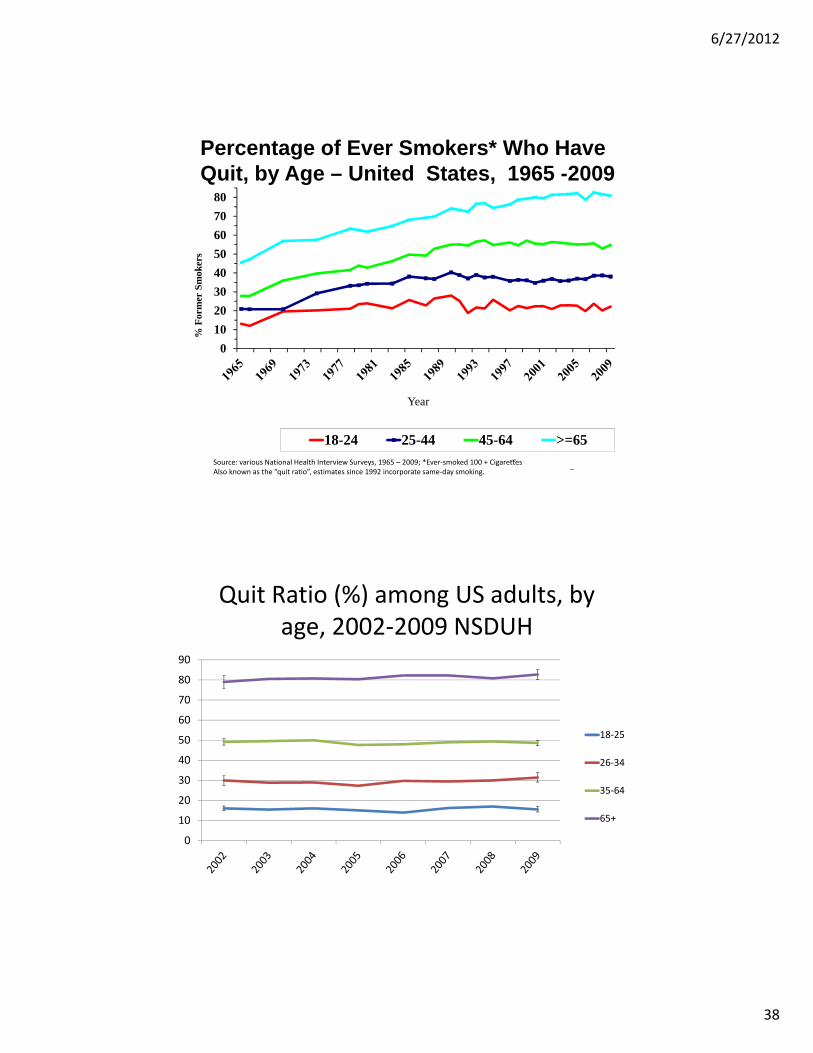
Source: various National Health Interview Surveys, 1965 – 2009; *Ever‐smoked 100 + CigarettesAlso known as the “quit ratio”, estimates since 1992 incorporate same‐day smoking.
Percentage of Ever Smokers* Who Have Quit, by Age – United States, 1965 -2009
Prevalence (%) of cigarette smoking among US adults as estimated by various surveys – 2002‐2009
0
5
10
15
20
25
30
35
NSDUH‐100NHIS
BRFSS
*
* TUS‐CPS;
NSDUH
**
NSDUH – w/o 100 cigarette criterion; NSDUH‐100 – with 100 cigarette criterion
6/27/2012
31
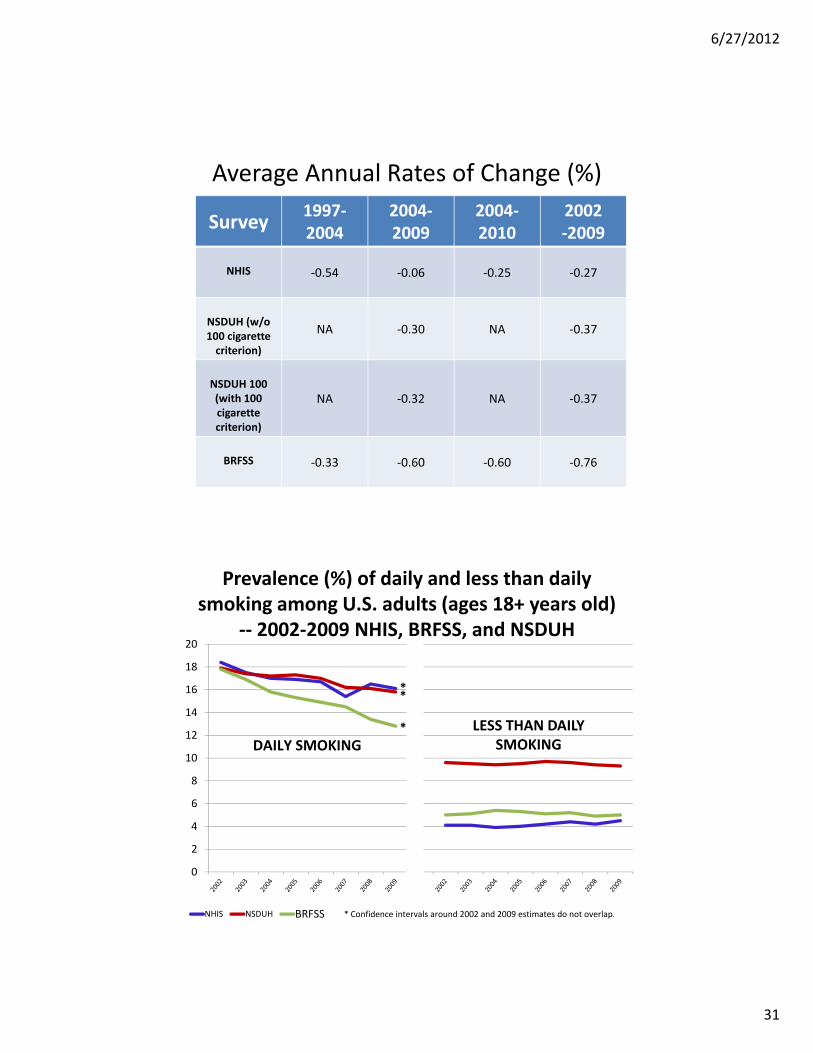
Average Annual Rates of Change (%)
Survey1997‐2004
2004‐2009
2004‐2010
2002‐2009
NHIS ‐0.54 ‐0.06 ‐0.25 ‐0.27
NSDUH (w/o 100 cigarette criterion)
NA ‐0.30 NA ‐0.37
NSDUH 100 (with 100 cigarette criterion)
NA ‐0.32 NA ‐0.37
BRFSS ‐0.33 ‐0.60 ‐0.60 ‐0.76
Prevalence (%) of daily and less than daily smoking among U.S. adults (ages 18+ years old)
‐‐ 2002‐2009 NHIS, BRFSS, and NSDUH
0
2
4
6
8
10
12
14
16
18
20
NHIS NSDUH BRFSS
DAILY SMOKING
*
* Confidence intervals around 2002 and 2009 estimates do not overlap.
LESS THAN DAILY SMOKING
*
*
6/27/2012
32
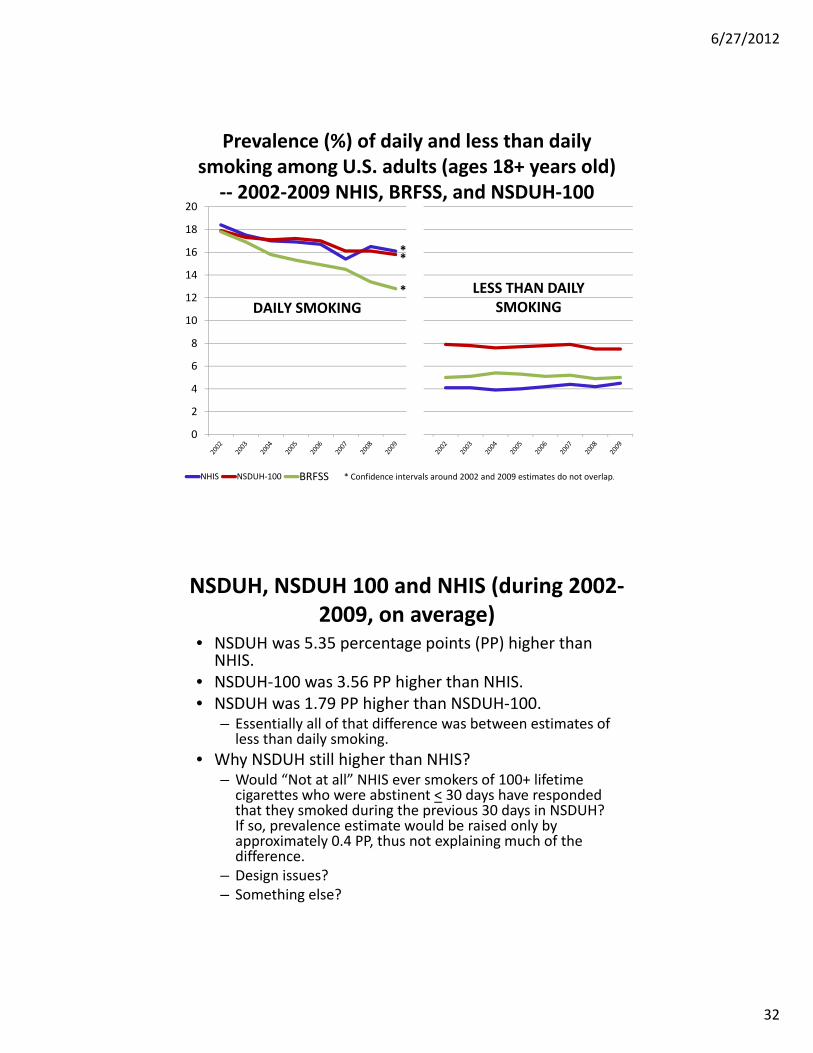
Prevalence (%) of daily and less than daily smoking among U.S. adults (ages 18+ years old)
‐‐ 2002‐2009 NHIS, BRFSS, and NSDUH‐100
0
2
4
6
8
10
12
14
16
18
20
NHIS NSDUH‐100 BRFSS
DAILY SMOKING
*
* Confidence intervals around 2002 and 2009 estimates do not overlap.
LESS THAN DAILY SMOKING
*
*
NSDUH, NSDUH 100 and NHIS (during 2002‐2009, on average)
• NSDUH was 5.35 percentage points (PP) higher than NHIS.
• NSDUH‐100 was 3.56 PP higher than NHIS.• NSDUH was 1.79 PP higher than NSDUH‐100.
– Essentially all of that difference was between estimates of less than daily smoking.
• Why NSDUH still higher than NHIS?– Would “Not at all” NHIS ever smokers of 100+ lifetime cigarettes who were abstinent < 30 days have responded that they smoked during the previous 30 days in NSDUH? If so, prevalence estimate would be raised only by approximately 0.4 PP, thus not explaining much of the difference.
– Design issues? – Something else?
6/27/2012
33
0
10
20
30
40
50
60
1955 1960 1965 1970 1975 1980 1985 1990 1995 2000 2005 2010
% C
UR
RE
NT
SM
OK
ER
S
YEAR
Female
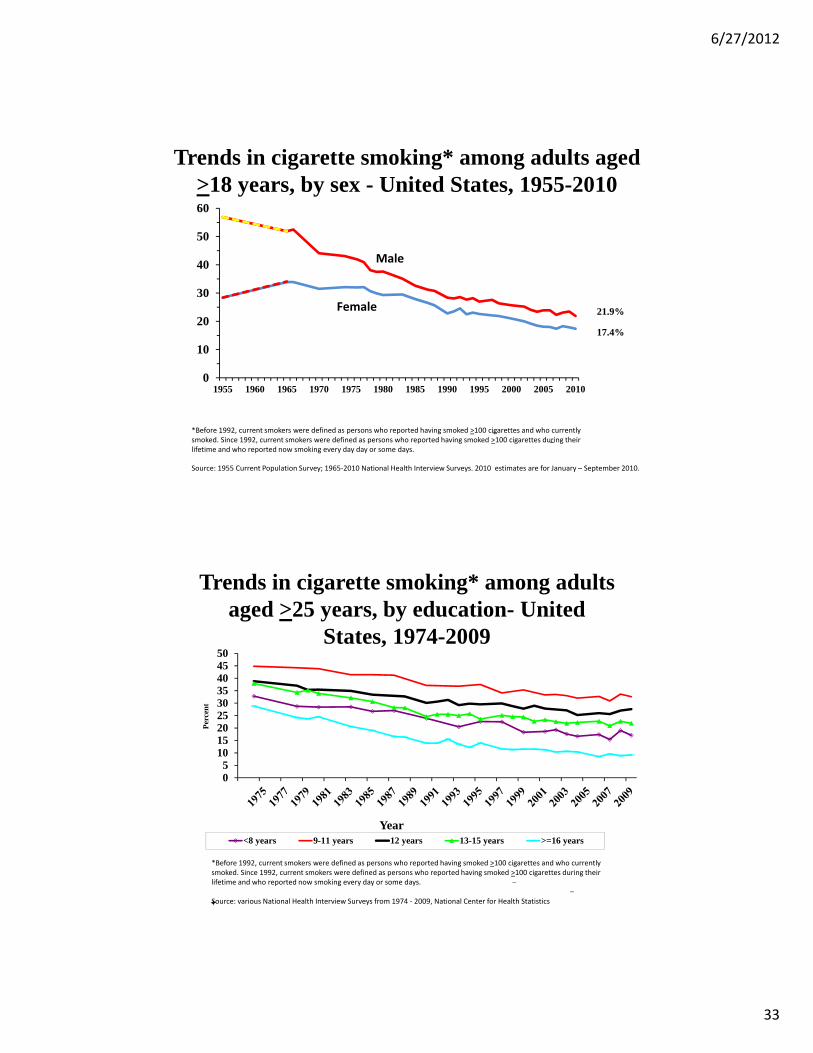
Trends in cigarette smoking* among adults aged >18 years, by sex - United States, 1955-2010
Source: 1955 Current Population Survey; 1965‐2010 National Health Interview Surveys. 2010 estimates are for January – September 2010.
*Before 1992, current smokers were defined as persons who reported having smoked >100 cigarettes and who currently smoked. Since 1992, current smokers were defined as persons who reported having smoked >100 cigarettes during their lifetime and who reported now smoking every day day or some days.
21.9%
17.4%
Male
05
101520253035404550
Year<8 years 9-11 years 12 years 13-15 years >=16 years
Per
cen
t
Trends in cigarette smoking* among adults aged >25 years, by education- United
States, 1974-2009
*Before 1992, current smokers were defined as persons who reported having smoked >100 cigarettes and who currently smoked. Since 1992, current smokers were defined as persons who reported having smoked >100 cigarettes during their lifetime and who reported now smoking every day or some days.
Source: various National Health Interview Surveys from 1974 ‐ 2009, National Center for Health Statistics
6/27/2012
34
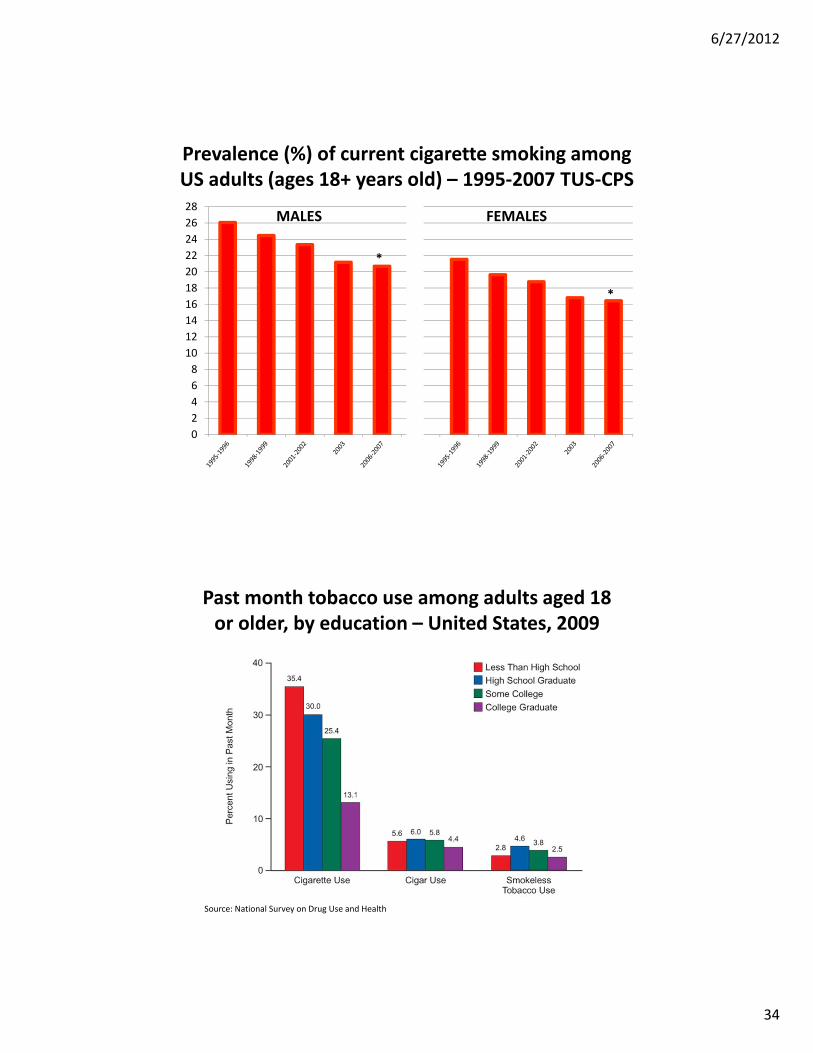
Prevalence (%) of current cigarette smoking among US adults (ages 18+ years old) – 1995‐2007 TUS‐CPS
0
2
4
6
8
10
12
14
16
18
20
22
24
26
28MALES
*
FEMALES
*
Past month tobacco use among adults aged 18 or older, by education – United States, 2009
Source: National Survey on Drug Use and Health
6/27/2012
35
05
1015202530354045
1982
1984
1986
1988
1990
1992
1994
1996
1998
2000
2002
2004
2006
2008
YearAt/above Below Unknown
Per
cen
t
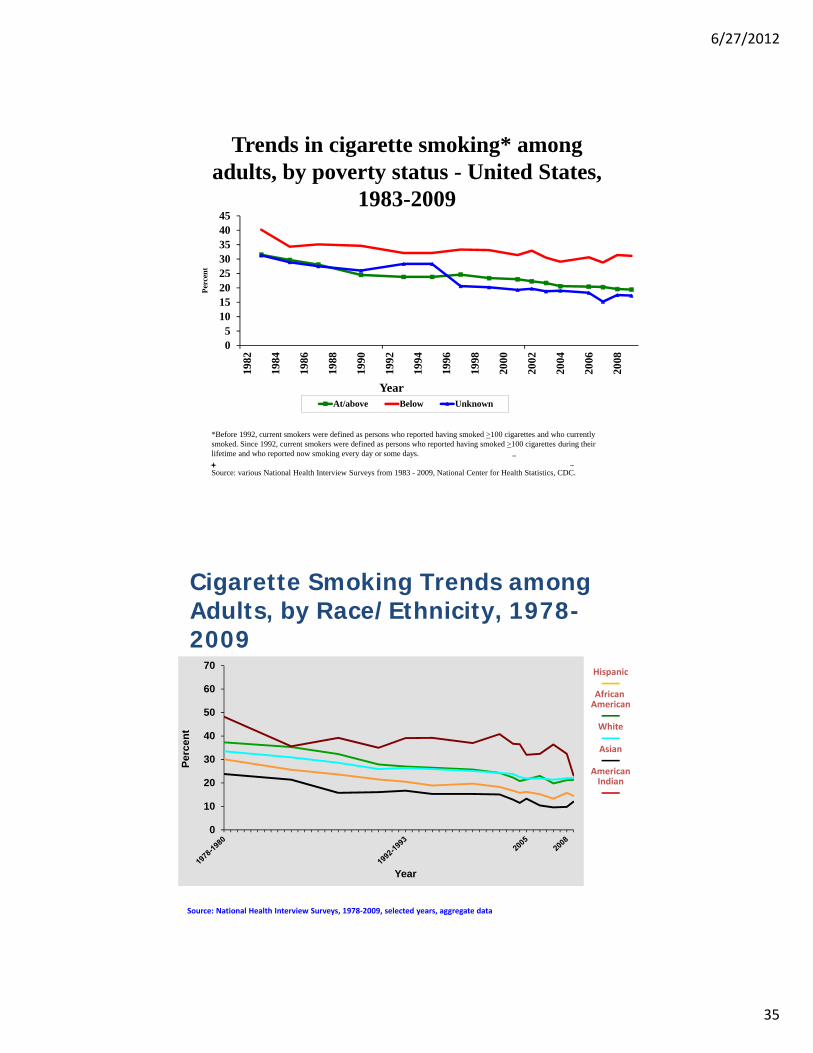
Trends in cigarette smoking* among adults, by poverty status - United States,
1983-2009
*Before 1992, current smokers were defined as persons who reported having smoked >100 cigarettes and who currently smoked. Since 1992, current smokers were defined as persons who reported having smoked >100 cigarettes during their lifetime and who reported now smoking every day or some days.
Source: various National Health Interview Surveys from 1983 - 2009, National Center for Health Statistics, CDC.
Cigarette Smoking Trends among Adults, by Race/Ethnicity, 1978-2009
Source: National Health Interview Surveys, 1978‐2009, selected years, aggregate data
0
10
20
30
40
50
60
70
Per
cen
t
Year
American Indian
Hispanic
Asian
White
African American
6/27/2012
36
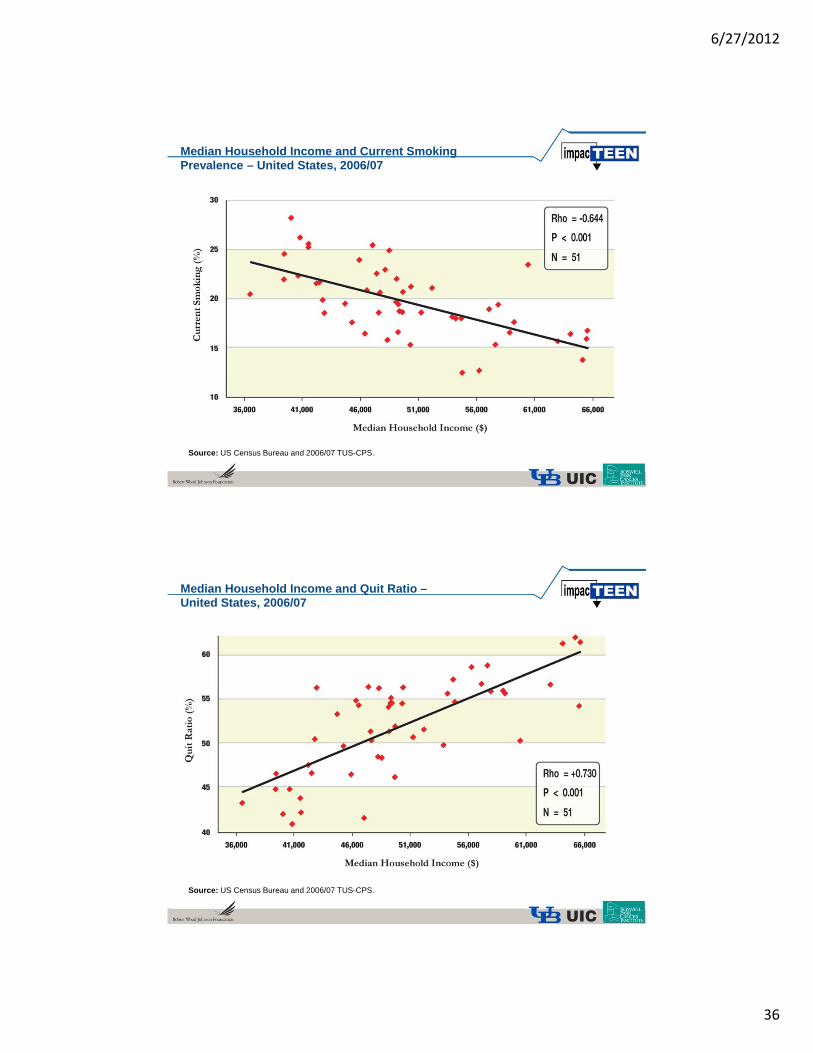
Median Household Income and Current SmokingPrevalence – United States, 2006/07
Source: US Census Bureau and 2006/07 TUS-CPS.
Median Household Income and Quit Ratio –United States, 2006/07
Source: US Census Bureau and 2006/07 TUS-CPS.
6/27/2012
37
Marketing Factoids
• Percent of smokers who were male in:– 1974 ‐ 53%; 2009 – 55%.
• Percent of smokers by race/ethnicity:– Non‐Hispanic White: 1983 – 82%; 2009 – 75%
– Hispanic: 1983 ‐ 5%; 2009 – 10%
– Asian/Pacific Islander: 1983 – 1%; 2009 – 3%
• Percent of smokers by education:– Less than HS: 1974 – 41.1%; 2009 – 18.6%
– Some College: 1974 – 13%; 2009 – 31%
• Percent of smokers below poverty line in:– 1983 – 10%; 2009 – 18%
Outline
• Per capita consumption of various tobacco products
• Prevalence estimates from survey comparisons
– Current smoking
– Indicators of quitting
– CPD/DPM
– Cigarettes and other tobacco products
• Indicators of hardening
6/27/2012
38
0
10
20
30
40
50
60
70
80
Year
18-24 25-44 45-64 >=65
% F
orm
er S
mok
ers
Source: various National Health Interview Surveys, 1965 – 2009; *Ever‐smoked 100 + CigarettesAlso known as the “quit ratio”, estimates since 1992 incorporate same‐day smoking.
Percentage of Ever Smokers* Who Have Quit, by Age – United States, 1965 -2009
Quit Ratio (%) among US adults, by age, 2002‐2009 NSDUH
0
10
20
30
40
50
60
70
80
90
18‐25
26‐34
35‐64
65+
6/27/2012
39
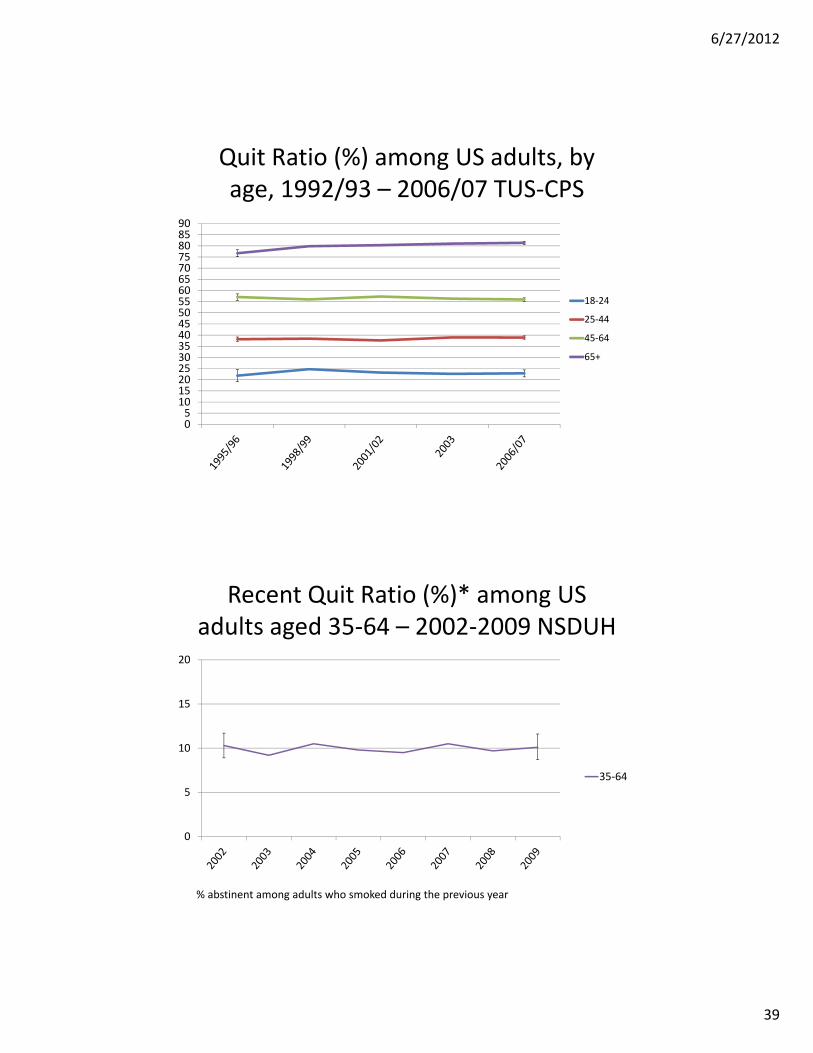
Quit Ratio (%) among US adults, by age, 1992/93 – 2006/07 TUS‐CPS
051015202530354045505560657075808590
18‐24
25‐44
45‐64
65+
Recent Quit Ratio (%)* among US adults aged 35‐64 – 2002‐2009 NSDUH
0
5
10
15
20
35‐64
% abstinent among adults who smoked during the previous year
6/27/2012
40
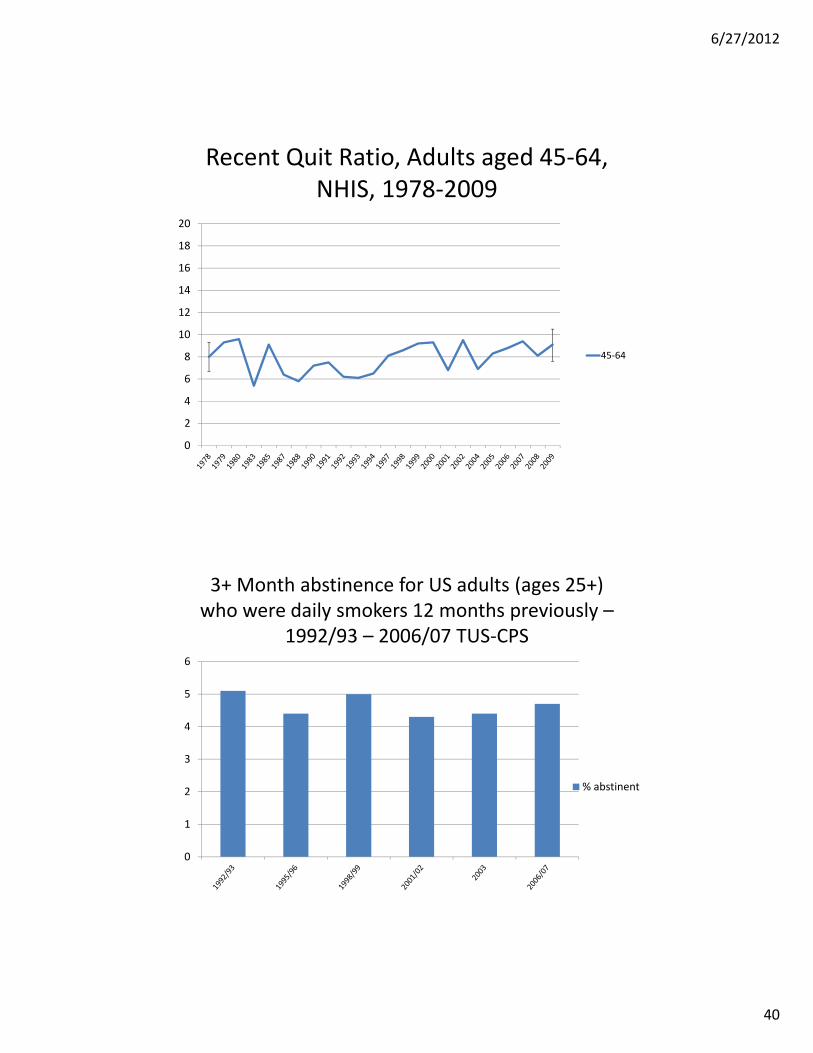
Recent Quit Ratio, Adults aged 45‐64, NHIS, 1978‐2009
0
2
4
6
8
10
12
14
16
18
20
45‐64
3+ Month abstinence for US adults (ages 25+) who were daily smokers 12 months previously –
1992/93 – 2006/07 TUS‐CPS
0
1
2
3
4
5
6
% abstinent
6/27/2012
41
Outline
• Per capita consumption of various tobacco products
• Prevalence estimates from survey comparisons
– Current smoking
– Indicators of quitting
– CPD/DPM
– Cigarettes and other tobacco products
• Indicators of hardening
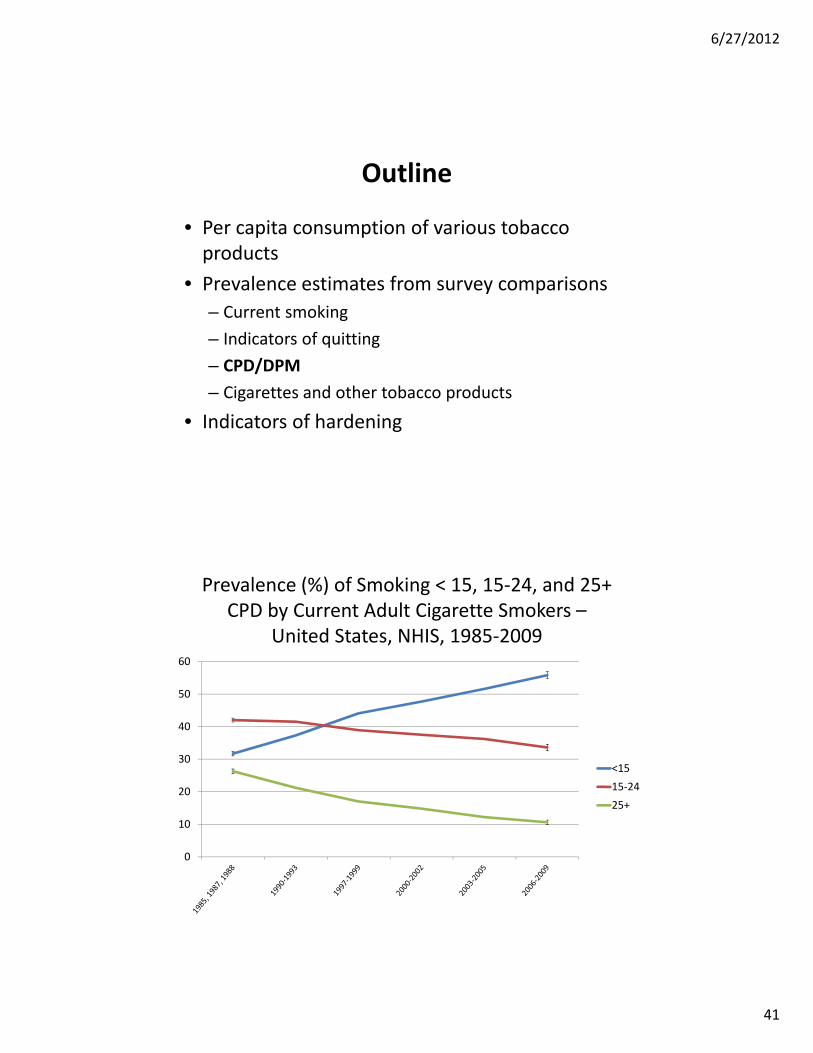
Prevalence (%) of Smoking < 15, 15‐24, and 25+ CPD by Current Adult Cigarette Smokers –
United States, NHIS, 1985‐2009
0
10
20
30
40
50
60
<15
15‐24
25+
6/27/2012
42
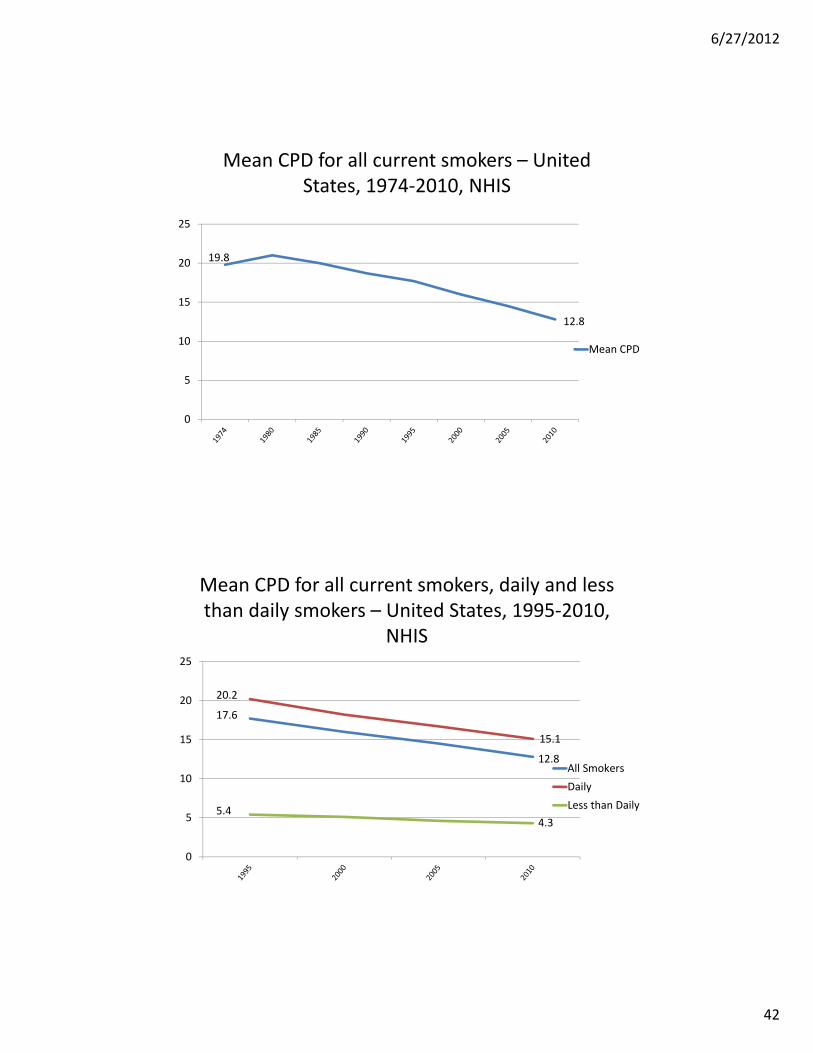
Mean CPD for all current smokers – United States, 1974‐2010, NHIS
0
5
10
15
20
25
Mean CPD
19.8
12.8
Mean CPD for all current smokers, daily and less than daily smokers – United States, 1995‐2010,
NHIS
0
5
10
15
20
25
All Smokers
Daily
Less than Daily
17.6
12.8
20.2
5.44.3
15.1
6/27/2012
43
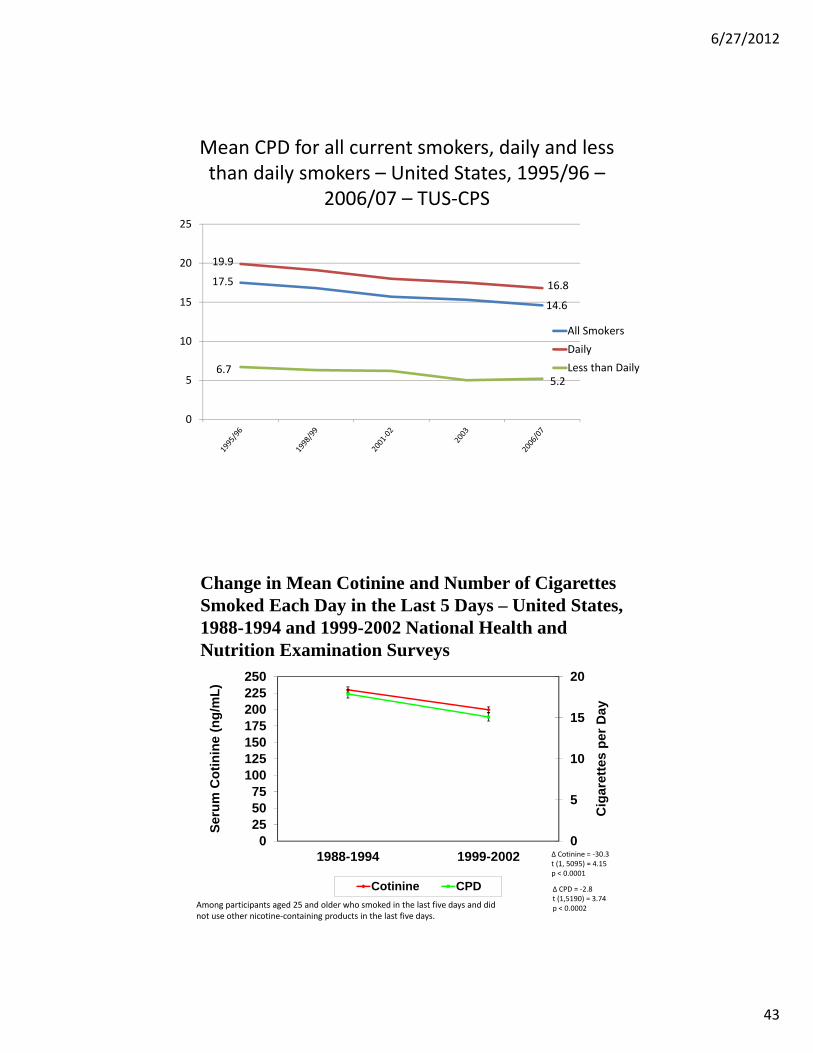
Mean CPD for all current smokers, daily and less than daily smokers – United States, 1995/96 –
2006/07 – TUS‐CPS
0
5
10
15
20
25
All Smokers
Daily
Less than Daily
17.5
14.6
19.9
6.75.2
16.8
0
5
10
15
20
0255075
100125150175200225250
1988-1994 1999-2002
Cig
aret
tes
per
Day
Ser
um
Co
tin
ine
(ng
/mL
)
Cotinine CPD
Δ Cotinine = ‐30.3t (1, 5095) = 4.15p < 0.0001
Δ CPD = ‐2.8t (1,5190) = 3.74p < 0.0002
Change in Mean Cotinine and Number of Cigarettes Smoked Each Day in the Last 5 Days – United States, 1988-1994 and 1999-2002 National Health and Nutrition Examination Surveys
Among participants aged 25 and older who smoked in the last five days and did not use other nicotine‐containing products in the last five days.
6/27/2012
44
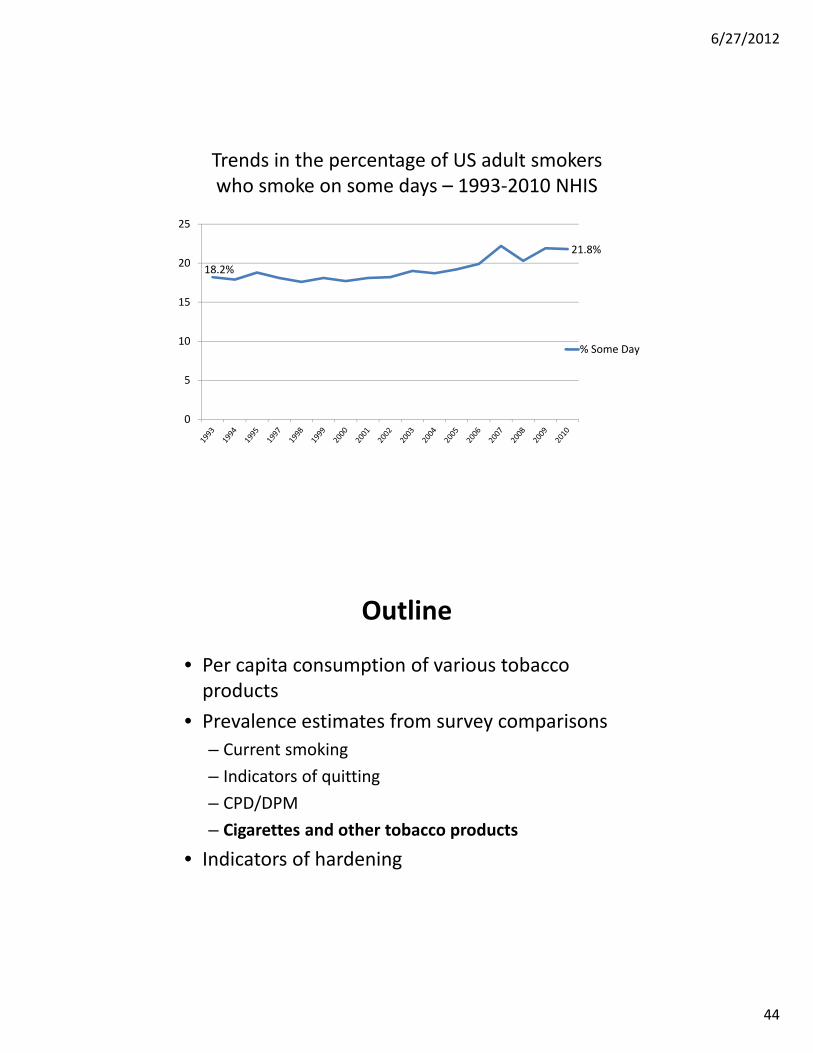
Trends in the percentage of US adult smokers who smoke on some days – 1993‐2010 NHIS
0
5
10
15
20
25
% Some Day
18.2%
21.8%
Outline
• Per capita consumption of various tobacco products
• Prevalence estimates from survey comparisons
– Current smoking
– Indicators of quitting
– CPD/DPM
– Cigarettes and other tobacco products
• Indicators of hardening
6/27/2012
45
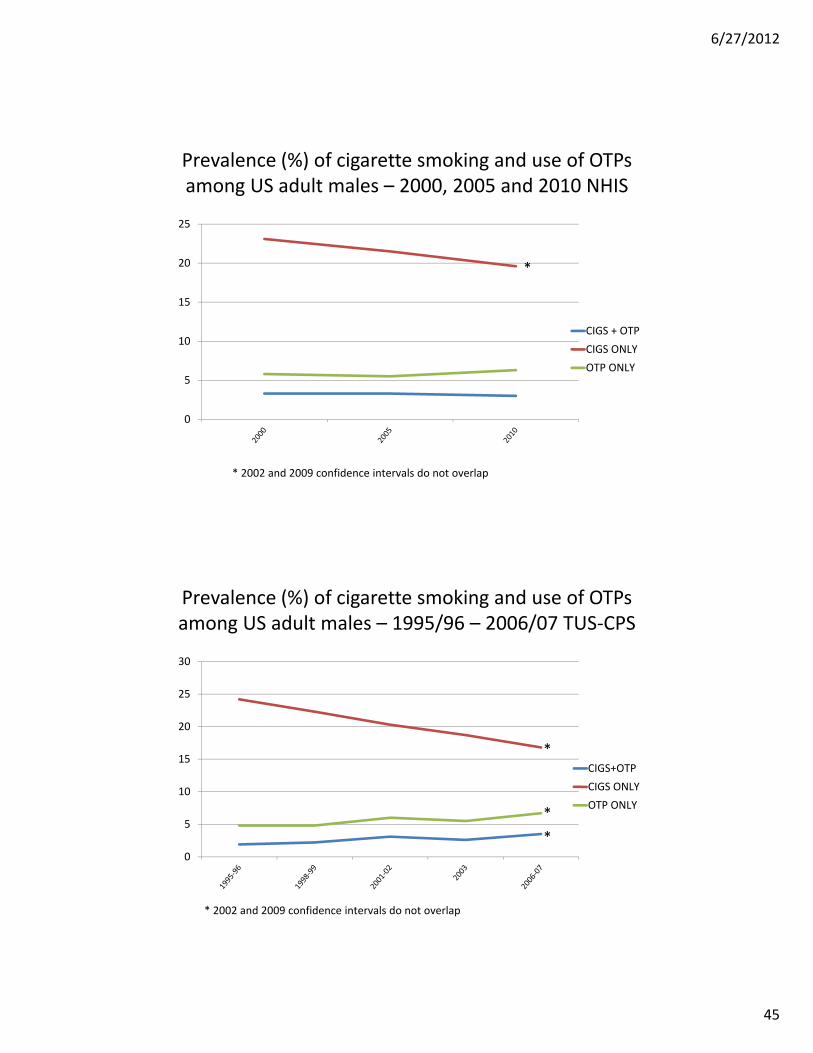
Prevalence (%) of cigarette smoking and use of OTPs among US adult males – 2000, 2005 and 2010 NHIS
0
5
10
15
20
25
CIGS + OTP
CIGS ONLY
OTP ONLY
* 2002 and 2009 confidence intervals do not overlap
*
Prevalence (%) of cigarette smoking and use of OTPs among US adult males – 1995/96 – 2006/07 TUS‐CPS
0
5
10
15
20
25
30
CIGS+OTP
CIGS ONLY
OTP ONLY
*
*
*
* 2002 and 2009 confidence intervals do not overlap
6/27/2012
46
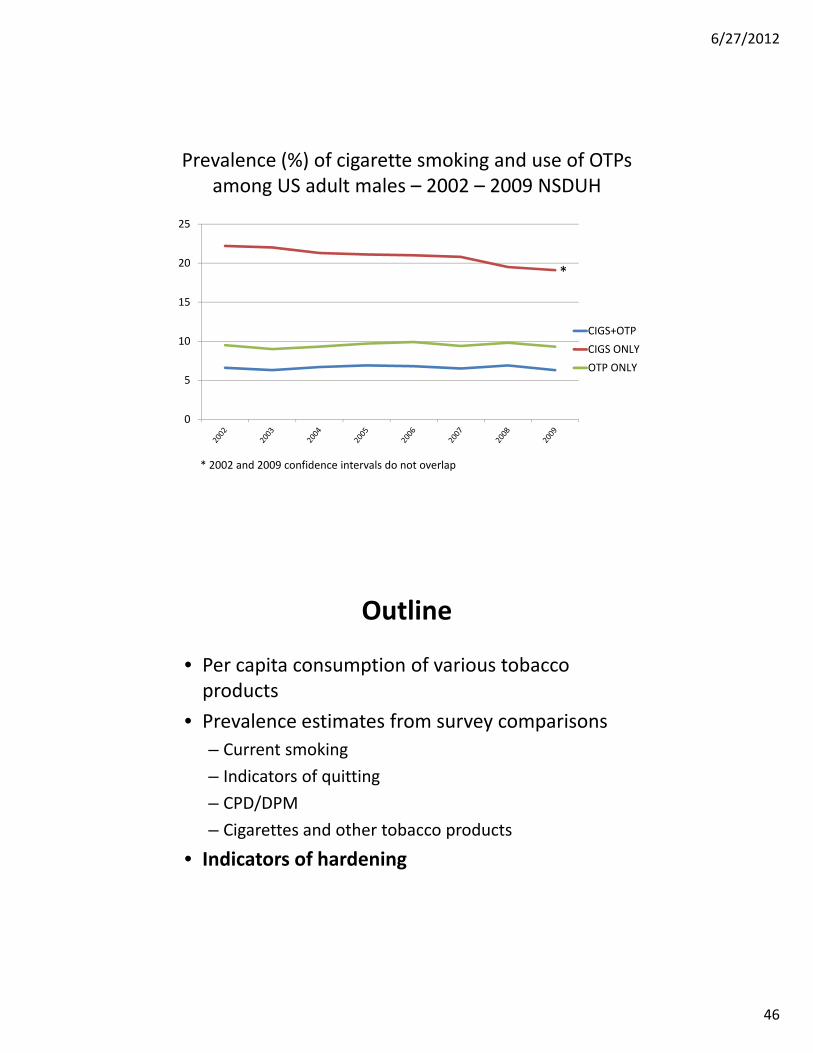
Prevalence (%) of cigarette smoking and use of OTPs among US adult males – 2002 – 2009 NSDUH
0
5
10
15
20
25
CIGS+OTP
CIGS ONLY
OTP ONLY
*
* 2002 and 2009 confidence intervals do not overlap
Outline
• Per capita consumption of various tobacco products
• Prevalence estimates from survey comparisons
– Current smoking
– Indicators of quitting
– CPD/DPM
– Cigarettes and other tobacco products
• Indicators of hardening
6/27/2012
47
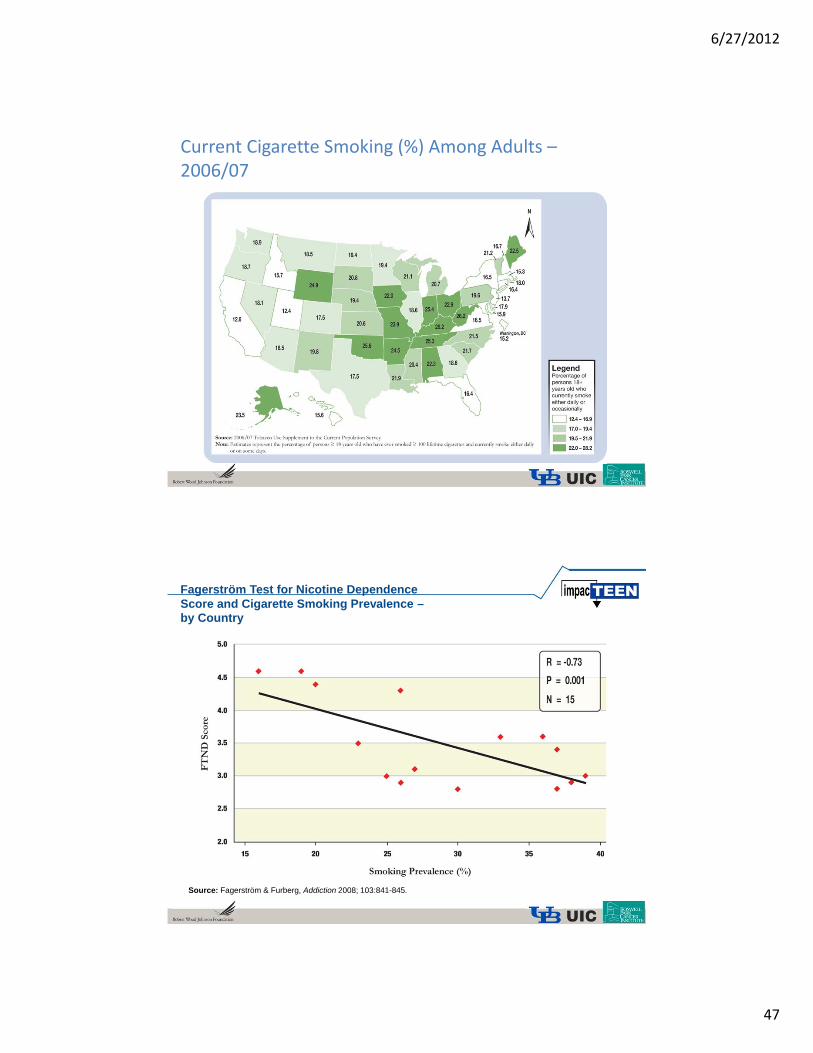
Current Cigarette Smoking (%) Among Adults –2006/07
Fagerström Test for Nicotine DependenceScore and Cigarette Smoking Prevalence –by Country
Source: Fagerström & Furberg, Addiction 2008; 103:841-845.
6/27/2012
48
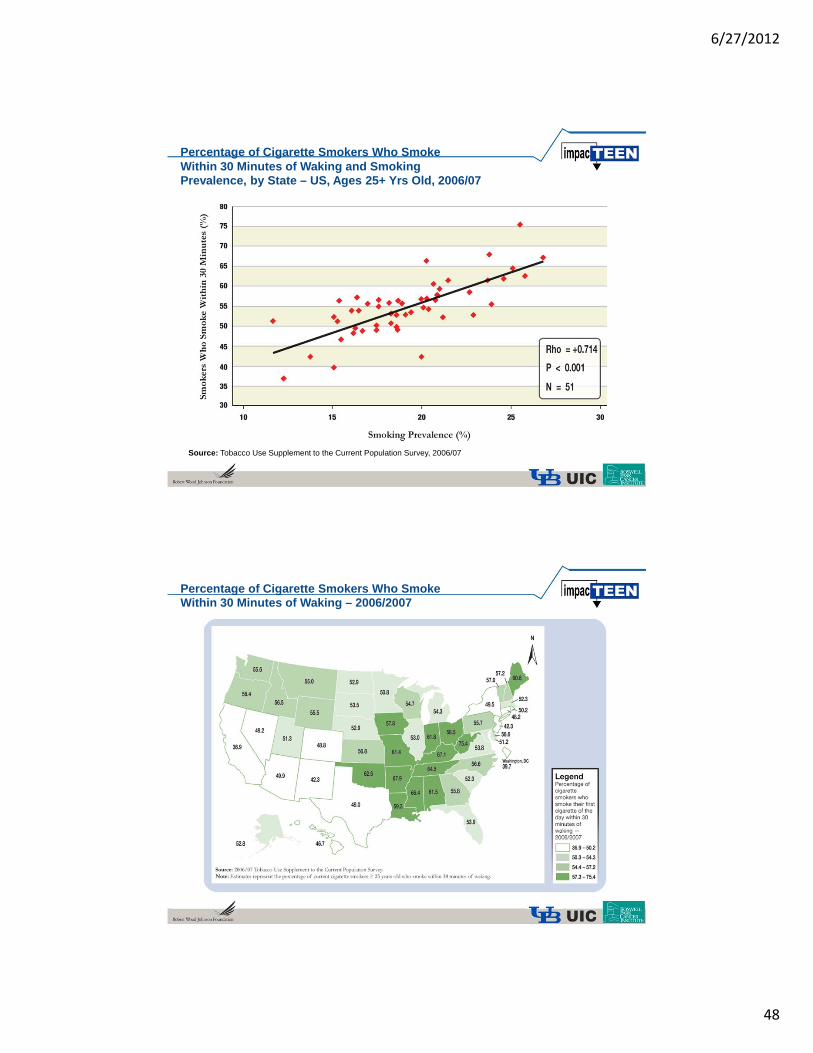
Percentage of Cigarette Smokers Who SmokeWithin 30 Minutes of Waking and SmokingPrevalence, by State – US, Ages 25+ Yrs Old, 2006/07
Source: Tobacco Use Supplement to the Current Population Survey, 2006/07
Percentage of Cigarette Smokers Who SmokeWithin 30 Minutes of Waking – 2006/2007
6/27/2012
49
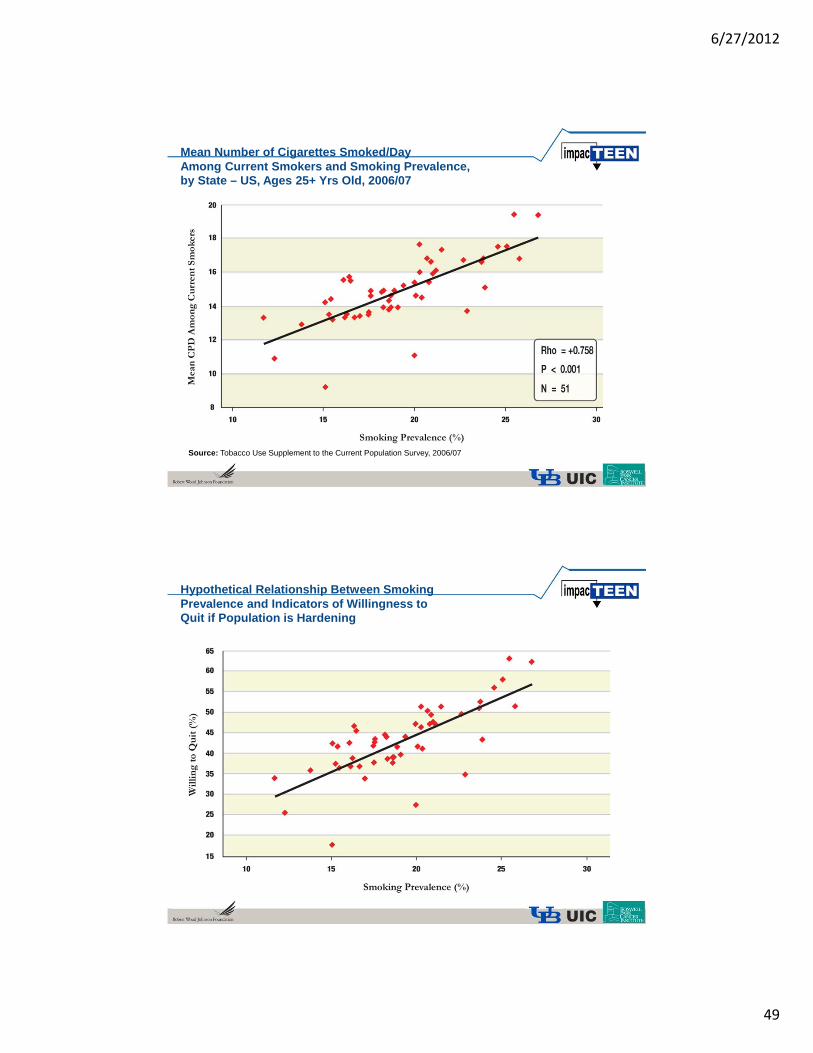
Mean Number of Cigarettes Smoked/DayAmong Current Smokers and Smoking Prevalence,by State – US, Ages 25+ Yrs Old, 2006/07
Source: Tobacco Use Supplement to the Current Population Survey, 2006/07
Hypothetical Relationship Between SmokingPrevalence and Indicators of Willingness to Quit if Population is Hardening
6/27/2012
50
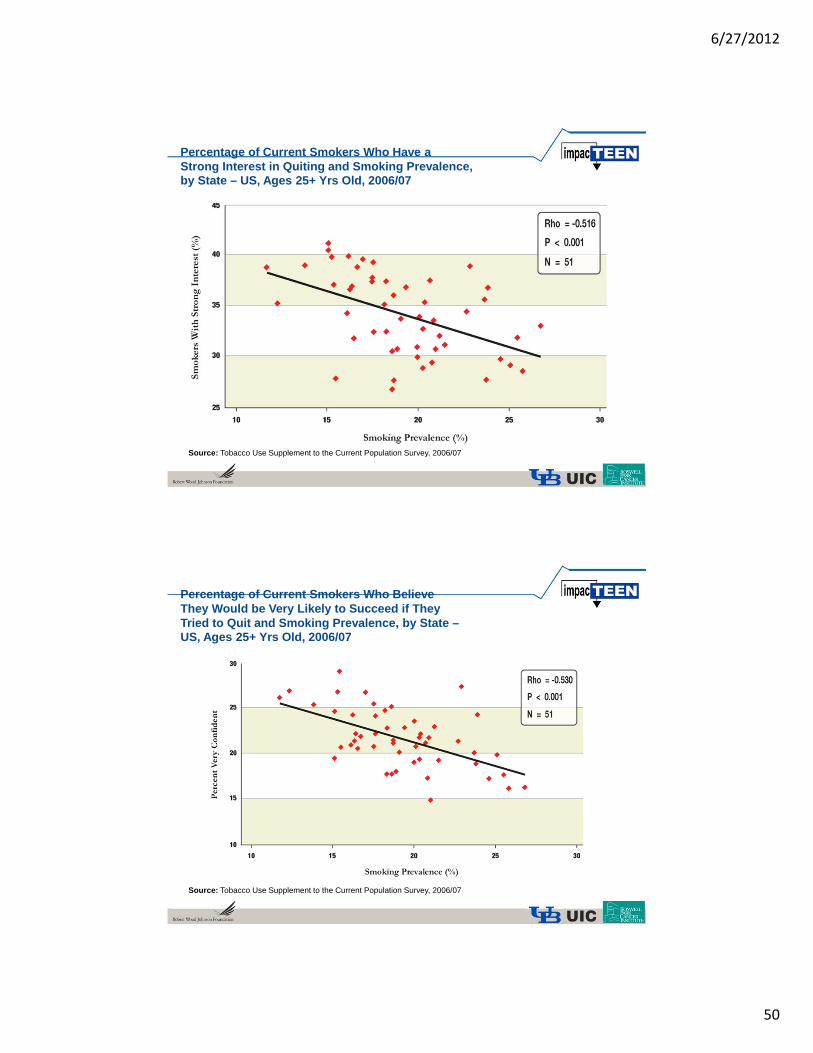
Percentage of Current Smokers Who Have aStrong Interest in Quiting and Smoking Prevalence,by State – US, Ages 25+ Yrs Old, 2006/07
Source: Tobacco Use Supplement to the Current Population Survey, 2006/07
Percentage of Current Smokers Who BelieveThey Would be Very Likely to Succeed if TheyTried to Quit and Smoking Prevalence, by State –US, Ages 25+ Yrs Old, 2006/07
Source: Tobacco Use Supplement to the Current Population Survey, 2006/07
6/27/2012
51
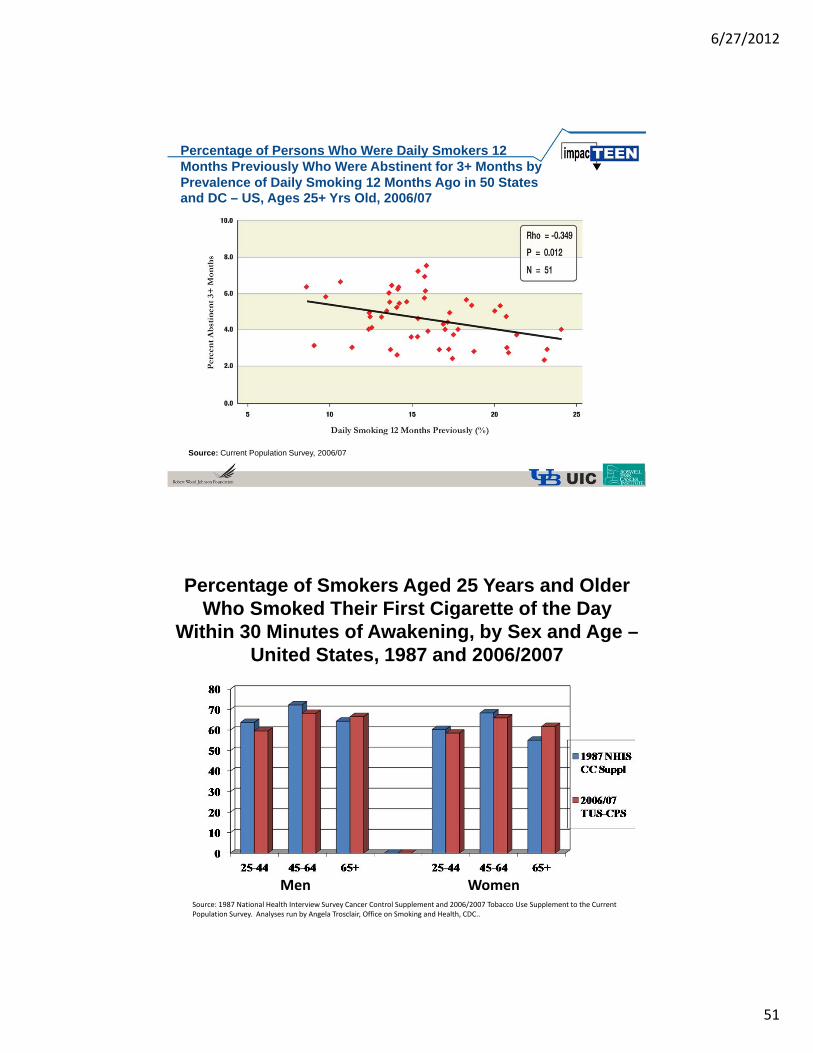
Percentage of Persons Who Were Daily Smokers 12 Months Previously Who Were Abstinent for 3+ Months by Prevalence of Daily Smoking 12 Months Ago in 50 States and DC – US, Ages 25+ Yrs Old, 2006/07
Source: Current Population Survey, 2006/07
Percentage of Smokers Aged 25 Years and Older Who Smoked Their First Cigarette of the Day
Within 30 Minutes of Awakening, by Sex and Age –United States, 1987 and 2006/2007
Source: 1987 National Health Interview Survey Cancer Control Supplement and 2006/2007 Tobacco Use Supplement to the Current Population Survey. Analyses run by Angela Trosclair, Office on Smoking and Health, CDC..
Men Women
6/27/2012
52
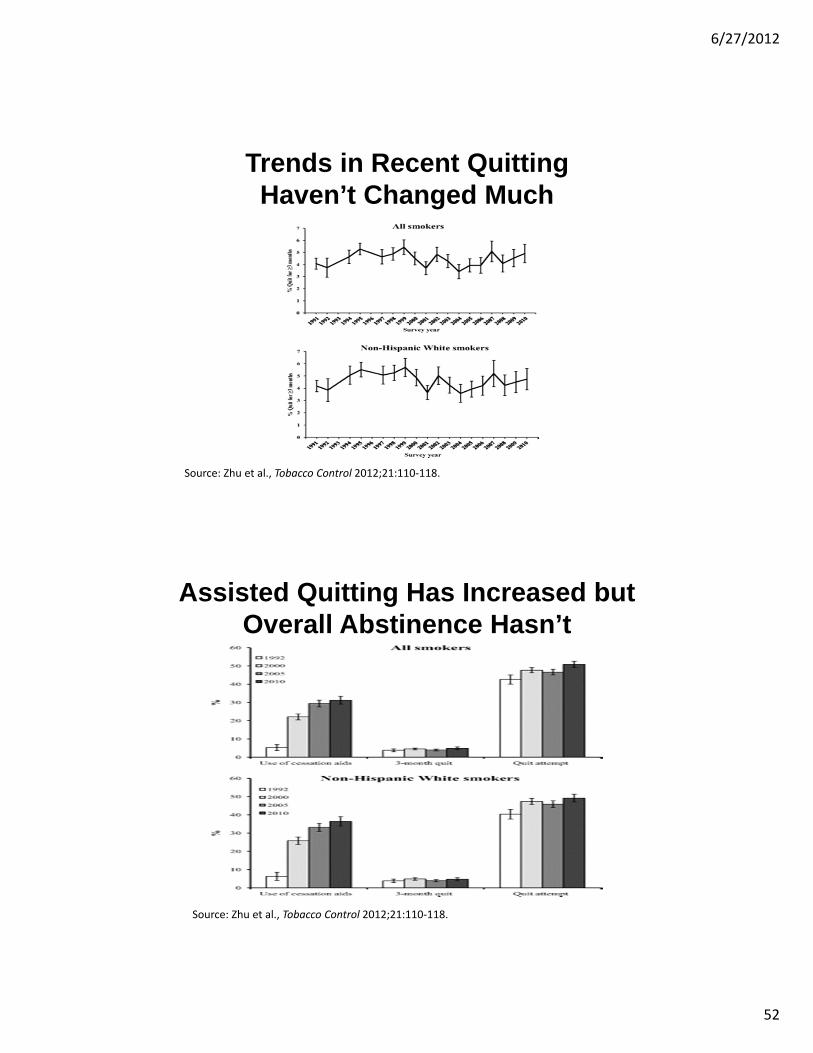
Trends in Recent Quitting Haven’t Changed Much
Source: Zhu et al., Tobacco Control 2012;21:110‐118.
Assisted Quitting Has Increased but Overall Abstinence Hasn’t
Source: Zhu et al., Tobacco Control 2012;21:110‐118.
6/27/2012
53
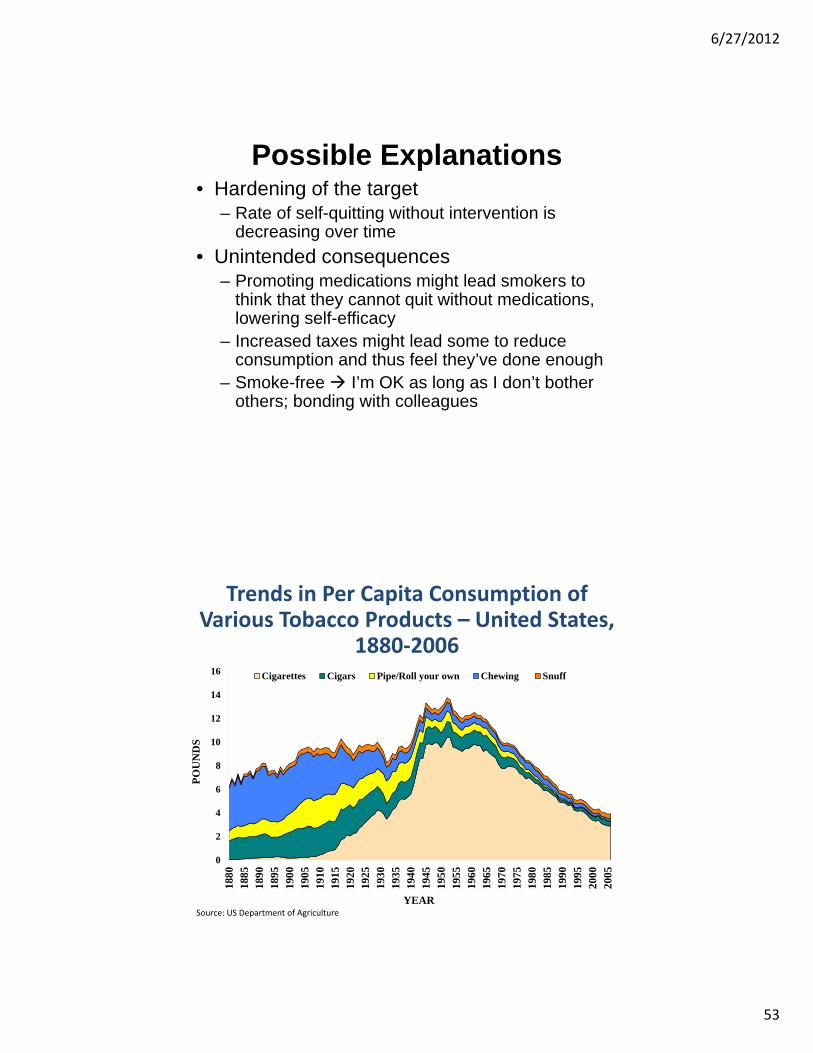
Possible Explanations• Hardening of the target
– Rate of self-quitting without intervention is decreasing over time
• Unintended consequences– Promoting medications might lead smokers to
think that they cannot quit without medications, lowering self-efficacy
– Increased taxes might lead some to reduce consumption and thus feel they’ve done enough
– Smoke-free I’m OK as long as I don’t bother others; bonding with colleagues
Trends in Per Capita Consumption of Various Tobacco Products – United States,
1880‐2006
Source: Tobacco Situation and Outlook Report, U.S. Department of Agriculture, U.S. CensusNote: Among persons > 18 years old.
Beginning in 1982, fine-cut chewing tobacco was reclassified as snuff.
0
2
4
6
8
10
12
14
16
1880
1885
1890
1895
1900
1905
1910
1915
1920
1925
1930
1935
1940
1945
1950
1955
1960
1965
1970
1975
1980
1985
1990
1995
2000
2005
PO
UN
DS
YEAR
Cigarettes Cigars Pipe/Roll your own Chewing Snuff
Source: US Department of Agriculture
6/27/2012
54
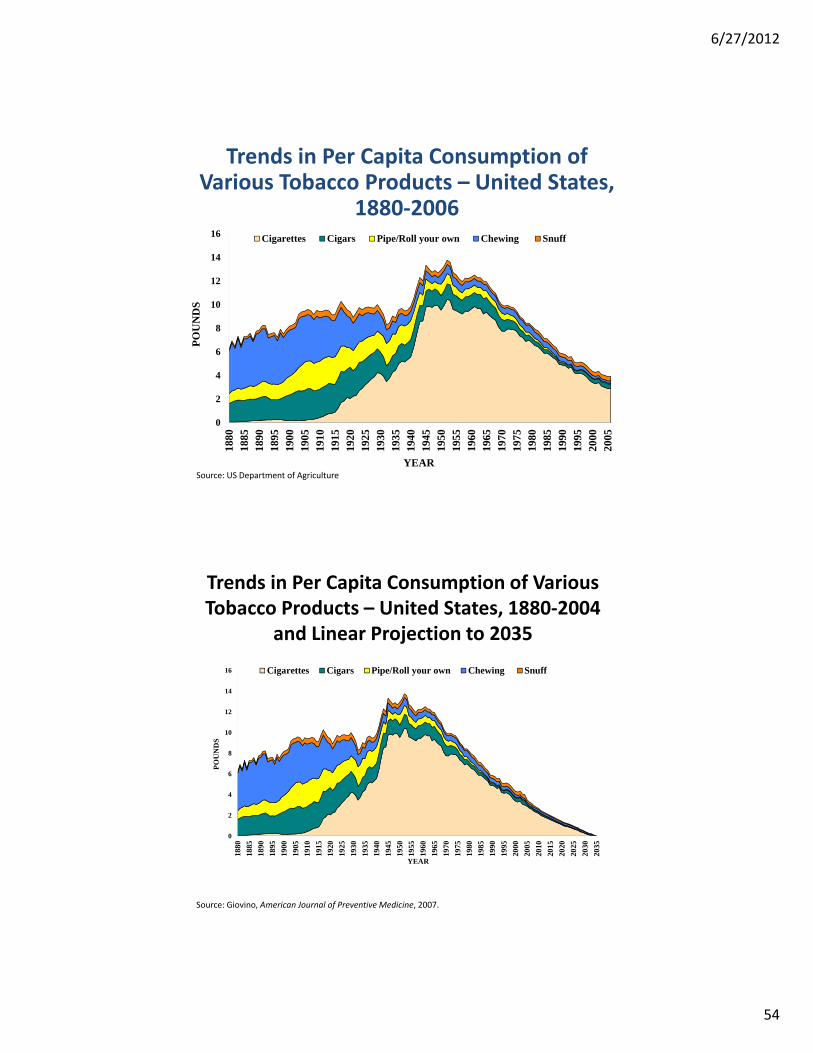
Trends in Per Capita Consumption of Various Tobacco Products – United States,
1880‐2006
Source: Tobacco Situation and Outlook Report, U.S. Department of Agriculture, U.S. CensusNote: Among persons > 18 years old.
Beginning in 1982, fine-cut chewing tobacco was reclassified as snuff.
0
2
4
6
8
10
12
14
1618
8018
8518
9018
9519
0019
0519
1019
1519
2019
2519
3019
3519
4019
4519
5019
5519
6019
6519
7019
7519
8019
8519
9019
9520
0020
05
PO
UN
DS
YEAR
Cigarettes Cigars Pipe/Roll your own Chewing Snuff
Source: US Department of Agriculture
Trends in Per Capita Consumption of Various Tobacco Products – United States, 1880‐2004
and Linear Projection to 2035
0
2
4
6
8
10
12
14
16
1880
1885
1890
1895
1900
1905
1910
1915
1920
1925
1930
1935
1940
1945
1950
1955
1960
1965
1970
1975
1980
1985
1990
1995
2000
2005
2010
2015
2020
2025
2030
2035
PO
UN
DS
YEAR
Cigarettes Cigars Pipe/Roll your own Chewing Snuff
Source: Giovino, American Journal of Preventive Medicine, 2007.
6/27/2012
55
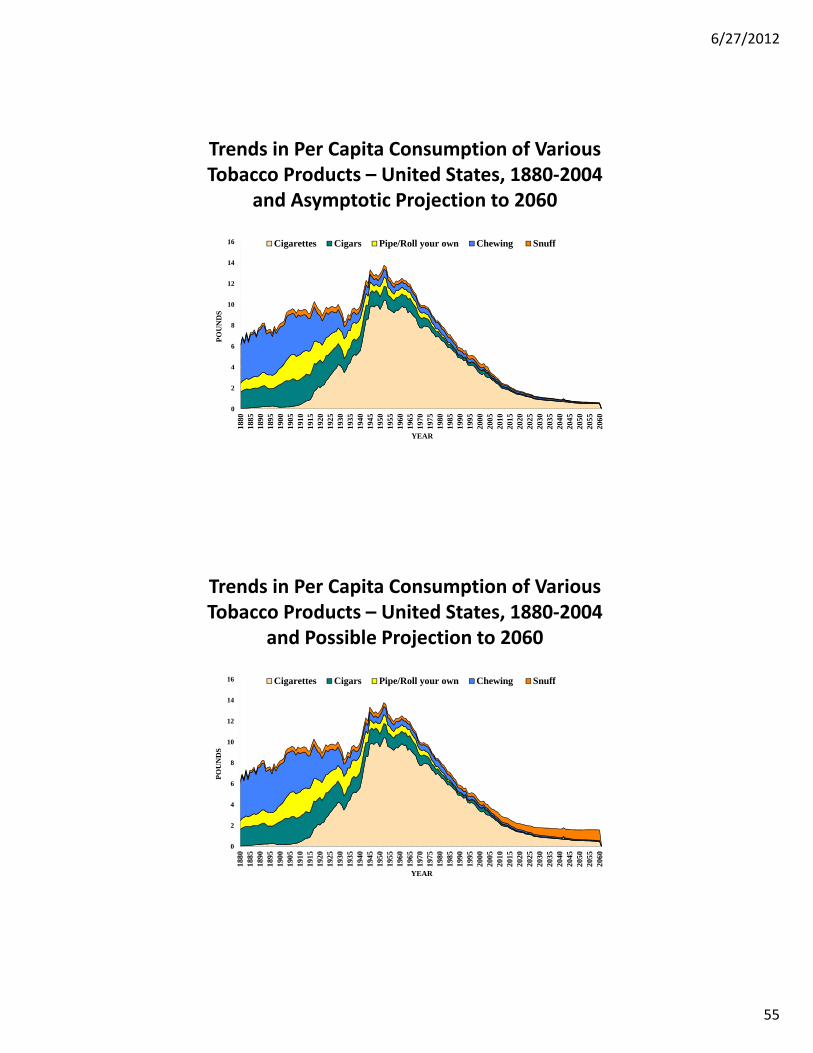
Trends in Per Capita Consumption of Various Tobacco Products – United States, 1880‐2004
and Asymptotic Projection to 2060
0
2
4
6
8
10
12
14
1618
8018
8518
9018
9519
0019
0519
1019
1519
2019
2519
3019
3519
4019
4519
5019
5519
6019
6519
7019
7519
8019
8519
9019
9520
0020
0520
1020
1520
2020
2520
3020
3520
4020
4520
5020
5520
60
PO
UN
DS
YEAR
Cigarettes Cigars Pipe/Roll your own Chewing Snuff
Trends in Per Capita Consumption of Various Tobacco Products – United States, 1880‐2004
and Possible Projection to 2060
0
2
4
6
8
10
12
14
16
1880
1885
1890
1895
1900
1905
1910
1915
1920
1925
1930
1935
1940
1945
1950
1955
1960
1965
1970
1975
1980
1985
1990
1995
2000
2005
2010
2015
2020
2025
2030
2035
2040
2045
2050
2055
2060
PO
UN
DS
YEAR
Cigarettes Cigars Pipe/Roll your own Chewing Snuff
6/27/2012
56
Reflections
• Major reductions in consumption of cigarettes, chewing tobacco.
• Increased consumption of snuff and cigars
• Concerns about waterpipes
• Concerns about industry manipulation – marketing to promote dual product use
• Concerns about OTPs – alone or with cigarettes
• Little population evidence for hardening.
• Continuing need for detailed surveillance to effectively monitor use and factors influencing use
Hardening
• “The ‘hardening hypothesis’ states that tobacco control activities have mostly influenced those smokers who found it easier to quit and, thus, remaining smokers are those who are less likely to stop smoking.” Hughes JR, Drug & Alcohol Dependence 2011.– Has been used to call for better treatment
and in support of harm reduction strategies
The Environment and Drug Use• “ … in animal studies, natural behaviors such as
eating, drinking palatable substances, social access, and opportunities to exercise reduce the rewarding effects of drugs. Likewise, in humans, an environment enriched with positive reinforcers such as opportunities for learning, personal comfort, and social success serves as a deterrent to drug abuse, while negative aspects of the environment such as stress, poverty, and social isolation contribute to drug abuse.”
Carroll, Anker & Perry. Drug and Alcohol Dependence 2009;104S:S70-S78.