Embed Size (px)
Citation preview
IN1592
Case Study
Garmin 2019
This case study was written by Metin Sengul, Associate Professor at Boston College, USA, Javier Gimeno, the Aon Dirk Verbeek Chaired Professor of International Risk and Strategic Management, and Jean Wee, Research Associate, both at INSEAD. It is intended to be used as a basis for class discussion rather than to illustrate either effective or ineffective handling of an administrative situation.
To access INSEAD teaching materials, go to cases.insead.edu.
Copyright © 2019 INSEAD COPIES MAY NOT BE MADE WITHOUT PERMISSION. NO PART OF THIS PUBLICATION MAY BE COPIED, STORED, TRANSMITTED, TRANSLATED, REPRODUCED OR DISTRIBUTED IN ANY FORM OR MEDIUM WHATSOEVER WITHOUT THE PERMISSION OF THE COPYRIGHT OWNER.
06/2019-6356
This document is authorized for use only by Ekkanit Meekul in [MGTS7303] Principles of Strategic Management (St Lucia). Semester 2, 2019 at University of Queensland Business School, 2019.
Copyright © INSEAD 1
Introduction Garmin, a maker of personal navigation devices (PNDs), entered 2008 as the dominant firm in North America and in a leading position worldwide, with a higher market capitalization than General Motors. But technological substitution – smartphones with mapping capabilities – along with falling prices, product convergence and the installation of dashboard navigation devices hit the company hard, especially in the automotive segment, its main market. With the future of the PND industry in question, stock prices tumbled. In the year between the all-time peak in November 2007 and November 2008, Garmin lost 87% of its value, and its main rival TomTom lost 94%.
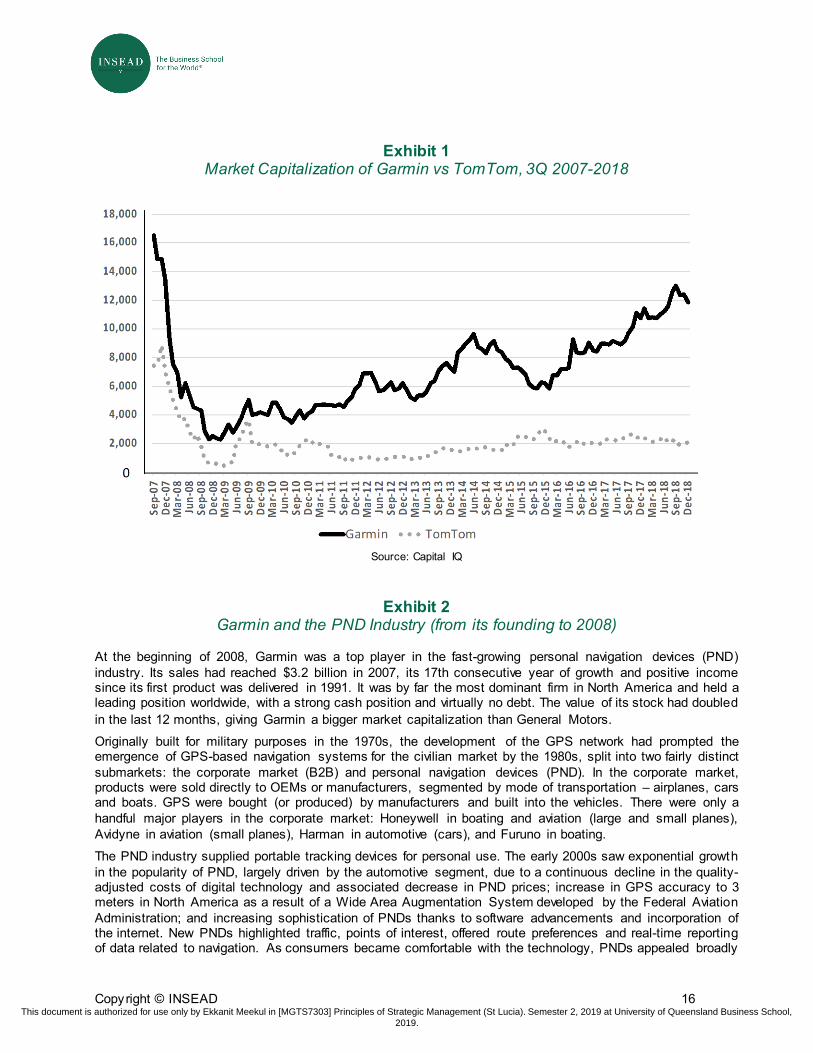
After struggling to find its footing amid drastic changes in the PND industry, Garmin charted a new course. Limiting itself to high-end products in the automotive segment, it turned its attention to other segments to leverage its GPS capabilities, expanding into the fitness and outdoor space with wearables and handheld products – the total share of these two segments grew from 11% to 50% of sales between 2008 and 2018. In addition, it continued its niche strategy in the marine and aviation segments, extending the product portfolio to sonars in marine and helicopters/military planes in aviation. As a result, despite the sudden decline of the PND market, Garmin weathered the storm better than its competitors (see Exhibit 1). It was one of the top-performing stocks in the technology sector in 2018 and some analysts predicted Garmin would “carry on the momentum” in the near term.1
However, new clouds appeared on the horizon. With a diversified portfolio of products – activity trackers, fish-finders, flight decks and smartwatches – Garmin had to compete in new segments against new competitors and threats. In the fitness segment, for example, players with mobile connected ecosystems (Apple, Samsung, Huawei) penetrated the high-end wearables market. The more mature marine and air navigation segments, although profitable, were also unlikely to provide major growth impetus.
As Garmin entered 2019, management had to reassess their strategy across the portfolio of businesses. Did the vertically-integrated, business portfolio approach which had proved successful over the years make sense in the face of disparate competitive pressures in different markets? Could Garmin respond to competitive pressures in its traditional markets by discovering new market opportunities? Or should it refocus on key markets or capabilities (and spin off other units or license their technologies externally) to remain competitive?
The PND Industry since 2008 Originally built by the US government for military purposes in the 1970s, the NAVSTAR Global Positioning System (GPS) network prompted the emergence of GPS-based navigation systems for the civilian market, split into two distinct submarkets: the corporate market and personal navigation devices (PND). In the corporate market, products were sold directly to OEMs or manufacturers, segmented by mode of transportation (planes, cars, boats).
The PND industry supplied portable devices for personal use. The early 2000s saw exponential growth in PNDs, driven by the automotive segment. Garmin’s flagship nüvi range of automotive products, for example, represented 52% of its total consolidated revenues in 2007, from a mere 2% 1 “Here’s w hy you should add Garmin (GRMN) to your portfolio.” Zacks Equity Research. December 20, 2018.
This document is authorized for use only by Ekkanit Meekul in [MGTS7303] Principles of Strategic Management (St Lucia). Semester 2, 2019 at University of Queensland Business School, 2019.
Copyright © INSEAD 2
in 2005. As consumers became comfortable with the technology, PNDs appealed to the mass consumer market with more functionality and lower prices. Industry sales soared from $3.2 billion to $10.9 billion in just four years between 2004 and 2007. In parallel, the average retail price fell nearly one third, from $539 to $368 in the same time span. Key players in the PND market included Garmin, TomTom, MiTAC, and Magellan (later acquired by MiTAC). In 2008, these four accounted for over 74% of PND shipments worldwide (see Exhibit 2).
A Market in Decline
While the PND market continued to grow in 2008, it was on the back of aggressive price cuts. Over 41% of the 41 million PND units shipped worldwide cost less than $200.2 Entry-level models were around $100. Industry insiders and analysts were increasingly concerned that PNDs were becoming commoditized and their value proposition vis-à-vis smartphones was weakening. In the summer of 2008, a 3G iPhone—which allowed users access to music, phone, gaming, the Web, in addition to GPS functions—started at $200. Despite their significant superiority in navigation, PNDs were “not looking like a great deal”.3
Margins came under further pressure in 2008-09 as weak consumer spending wreaked havoc on the broader economy. Consequently, unit prices came crashing down in an effort to win customers. To increase PNDs’ appeal, incumbents and entrepreneurs contemplated adding features that were not (yet) available on smartphones. Silicon Valley start-up Dash Navigation, for example, developed PNDs that could display real-time traffic, weather and gas price information on a map, and sold them on Amazon.4
The most momentous development after the introduction of the iPhone (summer 2007) – for all players in the navigation market – was Google’s announcement (fall 2009) that it would offer a real-time, turn-by-turn directions service—the most requested feature by users of Google Maps—tapping into its existing products/technology for free in the US on Android phones.5 Immediately after the announcement, Motorola and Verizon announced the first Android-based smartphone, Droid. Three months later the world’s largest mobile phone manufacturer Nokia began bundling free navigation with its phones6 – “another nail in the coffin for PND makers” according to an automotive analyst.7
2 Euromonitor International. 3 Matlin, Chadw ick. “Recalculating…” Slate. June 9, 2008 4 Hesseldahl, Arik, and Jennifer L. Schenker. “TomTom and Garmin lose their w ay.” BusinessWeek. April 9, 2008. In June
2009, Research in Motion acquired Dash Navigation for an undisclosed amount and discontinued it the year after. 5 Google products and technologies that w ere linked to the service included Internet search (to f ind the addresses for a
particular destination), Google satellite images and Google Street View (for more realistic view s of a route), voice-recognition (making it w ell-suited for use w hile driving). It could also display live traff ic data that Google collected from various sources, including users of Google. Citing “stringent” hardw are requirements for its new softw are, Google did not made the softw are available for non-Android phones although it mentioned its intention to make it “eventually” available. Alexei Oreskovic , “Google drives into navigation market,” Reuters, October 28, 2009.
6 Richard D. Easton & Eric F. Frazier, GPS declassif ied: From smart bombs to smartphones. Potomac, 2013. Google w as also directly involved in developing smartphones and tablets (w ith OEM partners like HTC, Samsung, LG, Huaw ei, and Asus) starting w ith the Nexus line of products in 2010.
7 David Barkholz & Leslie J. Allen, “Rivalry heats up in navigation device market,” Automotive New s (Vol. 84, Issue 6397), February 1, 2010.
This document is authorized for use only by Ekkanit Meekul in [MGTS7303] Principles of Strategic Management (St Lucia). Semester 2, 2019 at University of Queensland Business School, 2019.
Copyright © INSEAD 3
As new mobile navigation players such as NavFree, skobbler and Waze gained traction with low/free price and high rankings,8 TomTom and Garmin offered proprietary “mobile” apps with high-end features via a one-time license fee. These provided a similar experience to a stand-alone PND unit with more real-time information and extras such as downloadable voices.9 However, the advantage of Garmin and TomTom became increasingly less clear as smartphone hardware and software continued to improve. By early 2010, the accuracy of paid smartphone apps (starting from $25) and turn-by-turn navigation were comparable to PNDs.
Some analysts argued that unlimited data plans by AT&T and others hastened the use of smartphone navigation;10 by August 2011, 95% of American iPhone owners and 83% of owners of smartphones with Google’s Android operating system used a mobile map.11 By 2016, an estimated one billion people globally used a mapping app/service every week.12
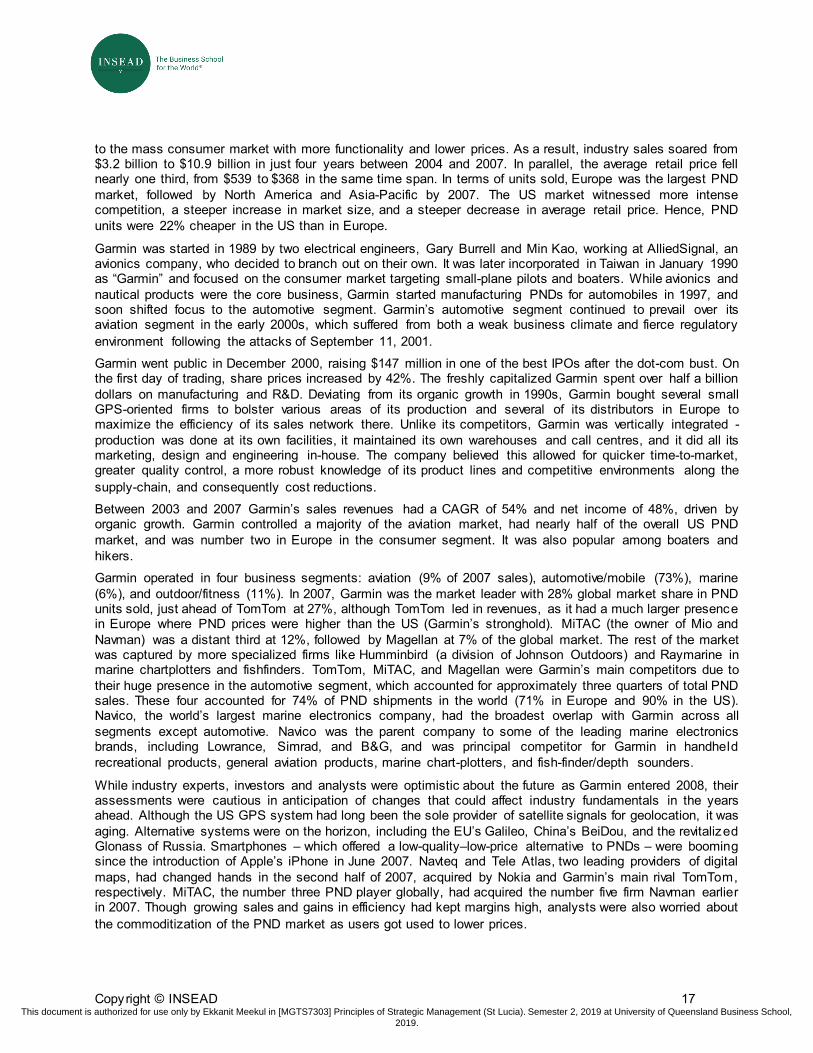
In parallel, dashboard navigation systems became more common. For carmakers, embedded navigation systems were a highly lucrative business, bundled with expensive option packages such as leather seats, sun-roofs and high-end audio systems. By 2013, embedded systems cost between $550 and $2,000. Despite the high price tag, customer satisfaction was low due to difficulty updating (which required a trip to the dealership) and using , technical glitches (problems with touchscreen dashboard controls), and the quality of simple navigation capabilities. As a result, many drivers turned to PNDs or smartphones instead. At the beginning of 2018, carmakers were still “at a disadvantage compared to smartphone apps.”13 Assuming that these problems would be solved in the coming years, installations of in-dash navigation systems worldwide were expected to grow to 31 million by 2022 (Exhibit 3).14
Rapid growth in previously untapped markets like China and India initially slowed the decline in worldwide PND shipments,15 but the writing was on the wall for PNDs. Entering 2019, the decade-long decline continued and was expected to shrink to 10 million units shipped globally by 2022, a quarter of its size in 2008 (Exhibit 3).16
M&A and Industry Consolidation
Industry dynamics had drastic implications for the structure of the PND market, especially among firms that relied on the automotive segment. As the PND market continued to shrink both in volume and margins, it became increasingly less attractive for new firms to enter. Smaller firms fell by the wayside as they could not match the scale of larger rivals or make the necessary investment in building their distribution network.17 As a result, larger PND firms gained market share at their
8 “A quick history of GPS navigation”, http://w ww.yext.com/resources/pocket-guide-to-the-us-gps-navigation-market/qu ick-
history-of-gps-navigation/. UK-based NavFree, later renamed as Navmii, w as the f irst free navigation app on iPhone in Sep 2010; skobbler w as acquired by Telenav in 2014 for $24 million; Waze w as acquired by Google in 2013 for $1.1 billion.
9 TomTom 2009 Annual Report. In 2010, Garmin’s application for Blackberry sold for $99.99 on its w ebsite, and TomTo m’s application for the iPhone started at $39.99 via iTunes.
10 S. John Tilak, “Portable navigation devices may not become obsolete yet,” Reuters, July 8, 2010. 11 “Maps on smartphones: The criticism heaped on Apple show s the grow ing importance of cartography,” The Economis t,
September 12, 2012. 12 Daisuke Wakabayashi, “Rail crossing w arnings are sought for mapping apps,” New York Times. December 19, 2016. 13 “Car Navigation Systems Plot a Course Forw ard Against Phone Apps”, New York Times, February 1, 2018. 14 “Global Automotive Navigation System Market: Key Research Findings 2017”, Yano Research Institute, January 19, 2018. 15 Business Wire, “High grow th reported for the w orld GPS market forecast to 2013” April 23, 2009. 16 “Global Automotive Navigation System Market: Key Research Findings 2017”, Yano Research Institute, January 19, 2018. 17 S. John Tilak, “Portable navigation devices may not become obsolete yet,” Reuters, July 8, 2010.
This document is authorized for use only by Ekkanit Meekul in [MGTS7303] Principles of Strategic Management (St Lucia). Semester 2, 2019 at University of Queensland Business School, 2019.
Copyright © INSEAD 4
expense. Garmin and TomTom’s combined market share increased from 77% to 85% in the US, and 59% to 71% in Europe, between first quarter 2009 and the end of 2010.
Further market consolidation came from a series of acquisitions by leading players. MiTAC acquired the consumer division of Magellan, the number four PND company, at the end of 2008 for $98 million. The same year, Garmin acquired another German company Navigon, the only remaining sizable pure PND firm (for an undisclosed sum). By 2014, Garmin, TomTom and MiTAC held 75% of the global market and a 90% market share in Western Europe and North America. Only a few other firms had local or regional strength, such as United Navigation in Germany, Prestigio in Eastern Europe, and Panasonic in Japan.18 For consumers, the PND market for consumers virtually shrank to essentially three firms, but it was a growth period for Hungarian NNG, Finnish EB Automotive, and other OEMs providing navigation systems to automotive companies.19
Evolution of Value Chain: Digital Maps and Satellites
Digital Maps - The upstream digital map industry was undergoing rapid changes, shifting from static maps stored on a car’s navigation system to a dynamic system that provided drivers with real-time information about traffic and road conditions.20 Following Nokia’s acquisition of Navteq in late 2007, Google switched its map data provision from Navteq to Tele Atlas (acquired by TomTom, also in late 2007) in September 2008 and sped up plans to develop its own digital mapping. In October 2010, Google finally switched to its own data gathered from its StreetView cars, starting in the US, instantly making it a major player in mapping (and soon after, navigation). TomTom developed closer ties with Apple and Tele Atlas eventually replaced Google Maps as the default mapping software of Apple products in June 2012. In China, e-commerce giant Alibaba acquired the number one Chinese mapping company AutoNavi, which held a rare mapping license from the Chinese government and supplied digital map data for China to both Apple and Google, in a two-part deal for nearly $1.9 billion between May 2013 and February 2014.21
Nokia rebranded Navteq as ‘HERE’ in 2012 and in August 2015 sold it to German luxury car makers Audi (a unit of Volkswagen), BMW and Daimler (parent company of Mercedes-Benz) for €2.5 billion ($2.7 billion). Audi-BMW-Daimler outbid Silicon Valley companies in anticipation that cars would become a platform for generating income (by locating restaurants, parking space and booking hotels) and to prevent HERE from falling into the hands of Google, Uber or Apple, in the battle to develop self-driving cars and future automotive safety systems.22 Other later investors in HERE included Intel (15%), Bosch (5%), Continental (5%), and Pioneer (less than 1%).23
High definition (HD) maps became an integral part of the self-driving car’s product development. Unlike the standard definition (SD) maps used in PND devices, HD maps were based on detailed location-specific data. Initially, carmakers thought that the SD maps used in PNDs and (laser or radio 18 Ludovic Privat, “Berg Insight forecasts 10m w orldw ide PND shipments in 2019,” GPS Business New s, September 18, 2014. 19 In 2015, the automotive softw are business of EB (Elektrobit), a Finnish industrial group, w as acquired by German auto-parts
company Continental for €600 million ($680 million). William Boston, “German car-parts makers see bigger role in technology.” Wall Street Journal. September 14, 2015.
20 William Boston, “Audi, BMW and Daimler near deal to buy Nokia Mapping Service.” Wall Street Journal. July 21, 2015. 21 Michael J. De La Merced, “Alibaba seeks control of AutoNavi, a Chinese mapping company,” New York Times, February 10,
2014. 22 William Boston, “Audi, BMW and Daimler near deal to buy Nokia Mapping Service.” Wall Street Journal. July 21, 2015. 23 In 2017, Intel acquired Israeli car-camera company Mobileye for $15.3 billion, Samsung acquired car audio company Harman
International for $8 billion, and automotive supplier Delphi Automotive spun off its engine-components unit to focus on an advanced electronics business in the race to develop self-driving cars.
This document is authorized for use only by Ekkanit Meekul in [MGTS7303] Principles of Strategic Management (St Lucia). Semester 2, 2019 at University of Queensland Business School, 2019.
Copyright © INSEAD 5
wave) sensors would be sufficient for self-driving, but GPS systems were not accurate enough. Even the best sensors could “see” only around a second and a half ahead in a car travelling at motorway speed (assuming no rain, and when objects were not obscured from sensors by other vehicles). In contrast, for HD maps, HERE’s data collection vehicles collected latitude, longitude and elevation ten times over, recorded the vehicle’s yaw, pitch and roll 100 times, calculated its distance from some 600,000 different points (trees, curbs, buildings) every second, and every six meters shot a 96-megapixel, 360-degree panoramic image.
In 2015, Bosch, the world’s largest auto-parts supplier by sales, announced that it would start working with TomTom to develop HD digital maps for self-driving cars.24 Uber, which dropped its joint-bid with Baidu to acquire HERE, also invested heavily in developing its own mapping capabilities.25 By April 2016, Google, HERE, TomTom, and Japanese Zenrin (partially owned by Toyota), taking various approaches to creating HD maps, could position a self-driving car on the road within an accuracy of 10-20 cm.
With maps concentrated in the hands of a few companies, there were attempts to create a free editable map of the world. Most successful was OpenStreetMap (OSM), created in the UK as a non-profit collaborative project in 2004. OSM relied on crowdsourced geographic information, and was made available under the Open Database License.26 OSM only gained significant traction after Google changed its pricing in Fall 2011. It had previously been charging only the largest users, but started charging smaller sites that generated an average of 25,000 map views per day within the same quarter. Industry insiders speculated that it could affect 30-40% of businesses that depended on maps, costing them tens of thousands of dollars a month in fees. In 2012, several websites (e.g., Foursquare and Craigslist) switched from Google to OSM.27 In subsequent years, several other websites and applications followed, including Niantic, maker of popular smartphone game Pokémon Go, in December 2017.28
Satellites - Defying earlier concerns related to aging of GPS, the US government continued to update the satellite network. In 2010, President Obama reaffirmed the commitment of US government to GPS. By 2018, 8 out of 31 operational satellites had been launched within the past five years and no satellites were older than 1997. The government also revised ground systems and control units, spending nearly a billion dollars annually to maintain the GPS.
By 2018, in addition to GPS, there were three major networks: Russia’s GLONASS, European Union’s Galileo, and China’s BeiDou, plus more than a dozen functional/planned national or regional satellite-navigation or supplemental ground-based systems (e.g., Japanese Quasi-Zenith, Indian IRNSS). Common standards had been discussed for years, and completion of GLONASS and substantial progress made in Galileo and BeiDou (both expected to be fully operational by 2020) contributed to the urgency to develop one. A common standard would allow augmenting the GPS
24 William Boston, “German car-parts makers see bigger role in technology.” Wall Street Journal. September 14, 2015. 25 Uber bought the mapping start-up deCarta, acquired street imaging and 3-D view capabilities used by Microsoft’s Bing Maps
service in 2015, and hired talent from Google and Microsoft. Reportedly, Uber w anted to reduce dependence on Google’s and Apple’s mapping technologies, and believed that developing its ow n maps w ould enable it to offer more precise pickups and drop-offs to users and better routes for drivers. Source: “From zero to seventy (billion).” The Economist, September 3, 2016; Shira Ovide, “Uber acquires mapping assets from Microsoft,” Wall Street Journal, June 29, 2015.
26 “OpenStreetMap,”Wikipedia, December 22, 2016. 27 “Websites bypassing Google Maps due to fees”, WebProNew s, March 20, 2012. 28 “‘Pokémon Go’ Map Updated to OSM from Google Maps: What is OpenStreetMap?”, International Business Times ,
December 1, 2017.
This document is authorized for use only by Ekkanit Meekul in [MGTS7303] Principles of Strategic Management (St Lucia). Semester 2, 2019 at University of Queensland Business School, 2019.
Copyright © INSEAD 6
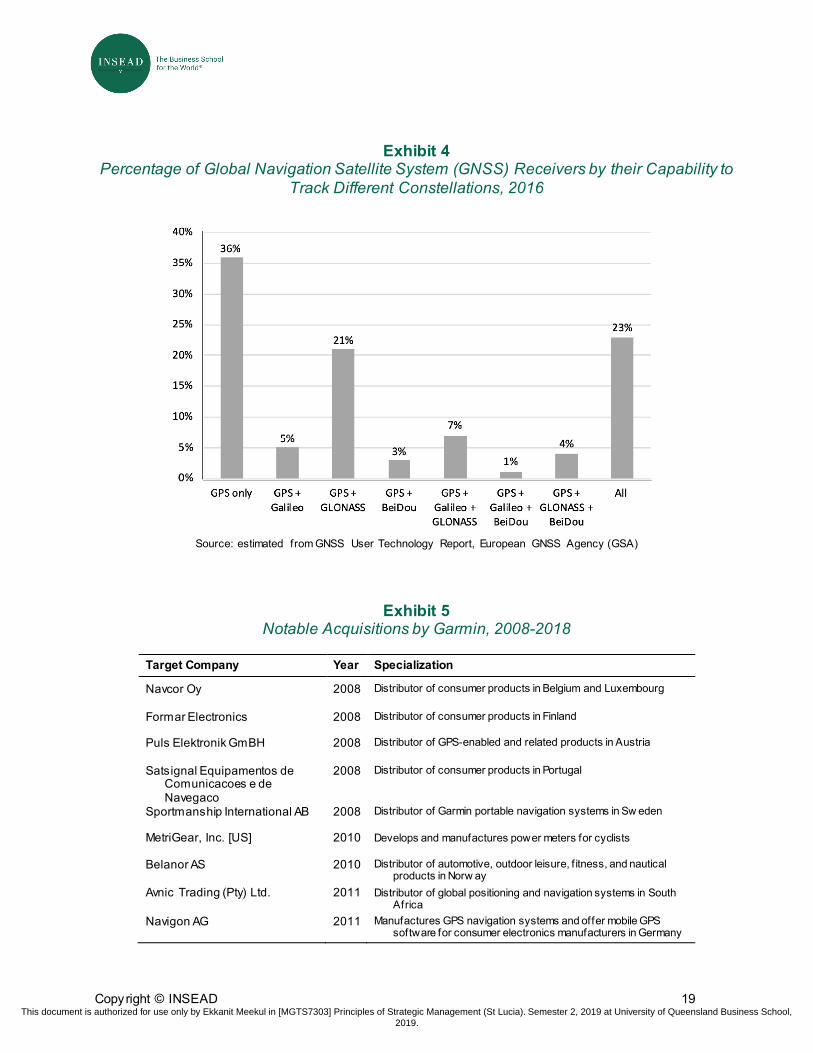
constellation, the gold standard in terms of coverage and reliability, to provide additional flexibility and precision. By 2016, more than two-thirds of all Global Navigation Satellite System (GNSS) chipsets and modules supported multiple networks (Exhibit 4), with 100% adoption expected within the next few years.29
Advancements in satellite technology also made it possible to launch smaller, cheaper satellites for specific purposes than those currently in use. The satellites developed by San Francisco based start-up Planet, for example, weighed just a few kilograms and cost a few hundred thousand dollars. In comparison, aerospace company SSL’s smallest communications satellites sold for $100m or more, the largest costing three times that amount.30 Analysts speculated that these developments would open the door to private satellite networks by making them economically viable.
Emergence of Gadgets and Wearables in the PND Industry
Over the past decade, consumer preferences seemed to shift faster than anticipated for the use of gadgets. Wearables – computing devices typically worn on the wrist or strapped to the body – became the next “in” thing for consumer products when low-priced integrated processor chips made gadgets smaller and much less expensive to make.
Although Garmin concentrated in the automotive segment in 2000s, it also had a foothold in wearables in the outdoor/fitness segment. Garmin first entered wearables in 2003, almost a decade ahead of its rivals with the release of the pager-size GPS-equipped running watch Forerunner 201, priced at $160. Other watches and hand-held consoles followed, providing a range of services (e.g., heart-rate, topography) for fitness and training. However, wearables were a small part of Garmin’s portfolio for many years. It was only after COO Cliff Pemble — who acknowledged the potential of wearables for Garmin soon after the iPhone began eating into sales — replaced Kao as chief executive in 2013, that Garmin accelerated the shift to wearables and expanded beyond running watches to specialized watches for cyclists, runners, triathletes, swimmers, golfers and hikers. Over time, it extended wearables technology to other segments, such as marine smartwatches with comprehensive boat connectivity, and aviator smartwatches with mapping and flight logging capabilities. TomTom and MiTAC followed Garmin, getting into outdoor and fitness products in the early 2010s, with limited success.
Smaller companies like Fitbit and Jawbone had jumped into an early lead in the fitness market, introducing their first activity trackers in 2009 and 2011 respectively (GPS-functionality added after 2015), closely followed by cheaper Chinese brands like Xiaomi and Huawei, making the low-end GPS-based wearables mainstream. Competition was intense and by 2017 the fitness market had hit saturation. In June 2017, Jawbone went into liquidation and CNBC reported that Intel had axed the division that worked on health wearables,31 the latest in a string of companies that had given up on wearables, such as Nike (FuelBand in 2014), Microsoft (Band 2 in 2016), Pebble (bought by Fitbit in December 2016), and various OEMs like Motorola (February 2017) and Asus (May 2017) that worked with Google’s Android Wear platform.
A higher-end wearable – the smartwatch – was first introduced by Sony (in March 2012) followed by Pebble (January 2013), Samsung (September 2013), LG (June 2014), and Apple (April 2015), all of 29 “Multi-constellation GNSS receivers becoming a standard”, Geospatial World, June 10, 2016. 30 “Flocks of cheap little satellites could transform the space business.” The Economist, August 27, 2016. 31 “Intel axed its entire smartw atch and f itness-tracker group to focus on augmented reality, sources say”, CNBC, 19 Jul 2017.
This document is authorized for use only by Ekkanit Meekul in [MGTS7303] Principles of Strategic Management (St Lucia). Semester 2, 2019 at University of Queensland Business School, 2019.
Copyright © INSEAD 7
which needed to be paired with a compatible smartphone to work limited functions. When Apple launched its Apple Watch Series 3, the first smartwatch that could make calls, text, stream music, make payments, without the phone nearby,32 in September 2017, consumer interest intensified, just as demand for fitness wearables reached saturation.
However, with constantly improving hardware and software on smartphones, tablets and other devices, consumer were less and less likely to have multiple gadgets and used their existing electronic device(s) for multiple purposes, like a “Swiss army knife.”33 A December 2016 New York Times article declared that “the gadget age [was] over”. 34 It was not clear whether the smartwatch market would ultimately follow in the footsteps of earlier wearables.
Garmin in 2018 Started in 1989 by two electrical engineers, Gary Burrell and Min Kao, who decided to branch out on their own after working at AlliedSignal, an avionics company, Garmin was the market leader in PND by 2007, with 28% global market share in PND units sold. It operated in four segments: aviation - integrated, panel-mounted flight decks and consoles for planes; automotive - on-dash units that could transition from vehicle to pedestrian mode, navigation apps, as well as OEM in-dash navigation products; marine – integrated consoles for boats, as well as range, depth, and fish finders; and outdoor/fitness – handheld and wearable water-proof PNDs for hikes, walks and other outdoor/fitness uses. At that time, Garmin controlled a majority of the civil aviation market, nearly half of the overall US PND automotive market, and was number two in Europe. It was also popular among boaters and hikers. TomTom, MiTAC, and Magellan were its main competitors, with a significant presence in the automotive segment, which accounted for approximately three quarters of total PND sales.
The decline of the automotive segment of the PND market – which made up over 70% of Garmin’s business at its peak in 2007-2008 – forced it to rethink its strategy and reshape its business. Its first response to the smartphone threat was to introduce its own proprietary smartphone, nüvifone. A hybrid of a traditional Garmin navigator and a smartphone, the nüvifone was the first ever navigation-centric smartphone, combining phone, internet access and GPS capability, and aimed at a different market (from the iPhone). It had better navigation technology, was able to give voice directions and could handle navigation and calls simultaneously – years before other smartphones mastered these. However, analysts were not convinced about the commercial viability of a navigation-centric smartphone compared to the iPhone and other smartphones in the market.35 The first nüvifone, the G60, was released in 2009, and synched exclusively with the AT&T Wireless network.36 It flopped and Garmin took a $200 million write-down in order to liquidate inventory.37 Unfazed, Garmin released six successive nüvifone models between February 2009 and July 2010, before it was discontinued.
In the aftermath, Garmin “fought a successful rear-guard action by grabbing business from other firms, launching high-end products top-shelf products for sportsmen and sailors, and diversifying.” 38
32 LG’s and Samsung’s smartw atches had cellular capability earlier but had not received mass market interest. 33 “The Smartphone Is the Sw iss Army Knife of Gadgets”, Time, November 18, 2013. 34 Farhad Manjoo, “The gadget apocalypse is upon us,” New York Times, December 7, 2016. 35 Matlin, Chadw ick. “Recalculating…” Slate. June 9, 2008. 36 “AT&T to market GPS smartphone.” Zack’s Investment Research. September 30, 2009. 37 Garmin, Ltd. (2009). SEC Form 10-K for the Fiscal Year Ended December 31, 2009. 38 Jessica Leber, “A shrinking Garmin navigates the smartphone storm,” MIT Technology Review , March 8, 2013.
This document is authorized for use only by Ekkanit Meekul in [MGTS7303] Principles of Strategic Management (St Lucia). Semester 2, 2019 at University of Queensland Business School, 2019.
Copyright © INSEAD 8
It focused on milking what profits were left in automotive, investing in the specialized submarkets of marine and aviation where it had long been a major player, and aggressively expanding in the growing outdoor and fitness segments. “People get caught up with 'Garmin is declining,'” said CEO Cliff Pemble. “What people are missing is that we have growth engines.”39 The new strategy eventually paid off. Garmin’s 2018 revenue returned to above $3 billion and net profits to $823 million, turning it into one of the top-performing stocks in the technology sector at the end of year.
Its operations continued to be highly integrated from production to warehouses, call centres, marketing, design and engineering, and even its own app store, ConnectIQ. Despite the high overhead, this level of vertical integration was advantageous, both the company and some analysts argued, because it helped shift production more quickly than rivals and develop better relationships with distributors and end markets. Between 2008 and 2011, Garmin acquired several distributors to build up its sales channels (Exhibit 5). From 2011 onwards, it turned largely to acquiring technology to enhance its portfolio of products. Garmin’s organizational structure was along functional and regional lines.
Garmin remained profitable and debt free throughout the entire period, returning cash to shareholders via a consistently growing dividend, with a pay-out ratio of about 58% in 2018, and through share buybacks in 2008, 2010, and 2015. 40, 41 (See Exhibits 6 and 7)
Segments
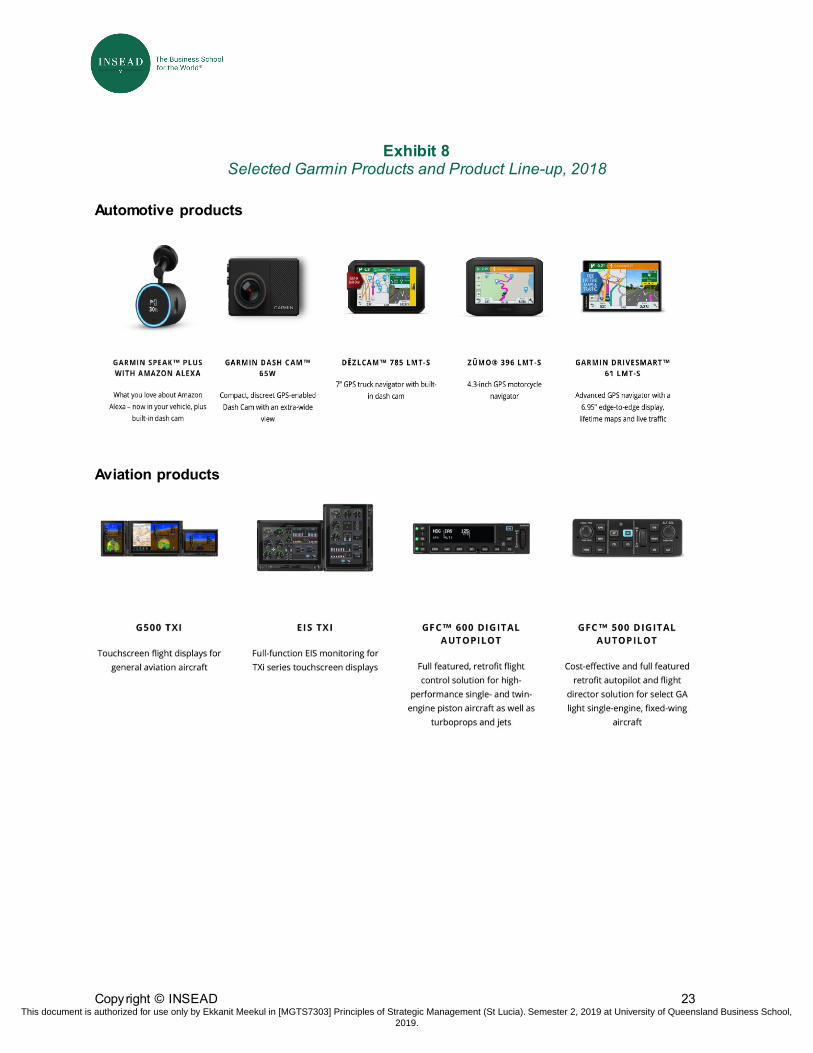
In 2018, Garmin was engaged in the same segments as it had been prior to the decline in the PND market. However, whereas previously the bulk of its business was in automotive (nearly three-quarters), by 2018 its business was more evenly spread over the five segments (outdoor and fitness having split into separate segments). The segments were managed separately, taking into account the fact that “the nature of products and types of customers for the five segments can vary significantly”.42 (See Exhibit 8)
Automotive (19% of 2018 sales) – Despite a decade of steep and continuous decline, the segment remained a significant part of Garmin’s business, accounting for $634 million in sales in 2018. Garmin had responded by retreating to the high-end of the segment and focusing on high-attribute-high-price models. It also pushed for sales in still-unsaturated geographic markets, especially Asia, which initially (2009-10) helped to compensate for some of the lost sales. Garmin offered more app-based navigation tools too —starting with the Garmin Mobile XT, a mobile app that turned a smartphone into a PND-like navigators, in 2008— as a partial solution to its most threatened subsegment, the lower-end PND competing directly with smartphones. In 2011 it acquired German Navigon, the only remaining sizable pure PND firm at the time focusing on smartphone applications, “known in recent years for pioneering a free traffic information, along with graphic innovations such as reality view and lane assist.” 43 The acquisition was seen as a (late) attempt to catch up with the app competition rather than grabbing market share.
39 “How Garmin Mapped Out A New Direction With Fitness Wearables” Forbes, September 14, 2016. 40 Garmin intends to increase its dividend in 2019 from $2.12 to $2.28. Source: 4Q18 earnings announcement. 41 Garmin made multiple share repurchase: May 7, 2008; August 6, 2008; February 24 and 25, 2010; February 20, 2013; and
February 18, 2015 (a $300 million buyback plan extended to 31 Dec 2017. Capital IQ. 42 Garmin Annual Report 2018, Management’s Discussion and Analysis of Financial Conditions and Results of Operations. 43 Jeff Bartlett, “GPS giant Garmin buys Navigon, navigation w orld gets smaller,” Consumer Reports, July 26, 2011.
This document is authorized for use only by Ekkanit Meekul in [MGTS7303] Principles of Strategic Management (St Lucia). Semester 2, 2019 at University of Queensland Business School, 2019.
Copyright © INSEAD 9
In 2017, it introduced Garmin Speak into its PNDs, a voice interface powered by Amazon’s Alexa to control infotainment and navigation, plus Alexa’s other features. In parallel, Garmin increased sales to the OEM market. It announced its first factory-installed dashboard “infotainment” system for cars (for Suzuki) in April 2012 after four years of investment, and developed strong OEM relationships with large car companies like BMW, Daimler, Honda and Volkswagen. However, the large automotive companies were increasingly directly involved in navigation as the race to develop self-driving cars intensified (see section Digital Maps). Garmin also faced stiff competition from Apple’s CarPlay and Google’s Android Auto, which connected in-dash systems with drivers’ mobile devices using a similar user interface as that on smartphones.
Aviation (18%) – This was Garmin’s most mature market, accounting for $603 million in 2018 sales, where it reigned supreme with a wide range of products of flight decks and consoles, transponders, flight instruments, traffic and weather surveillance systems, and pilot wearables. Initially targeting the personal or business jet market to provide services, Garmin expanded to the helicopter market in 2009 and – after winning a contract to provide avionics for the Textron Airland Scorpion light attack aircraft in 2017 – to the government and defense market. Demand was strong for Garmin’s avionics as aviation customers rarely changed suppliers because the interface was fairly complicated; once pilots became comfortable using a certain interface they continued using it. The segment was further supported by new regulations that mandated existing aircraft to be retrofitted with new avionics by 2020 that used automatic dependent surveillance-broadcast out (ADS-B out) and the Future Air Navigation System (FANS), which enabled satellite-based positioning coupled with a direct data link to air traffic controllers. Newly manufactured aircraft needed to have ADS-B out and FANS equipment as of June 2016. Garmin, whose products were compliant, commanded 75% of the retrofit market, and in the OEM market 90% of the smaller piston engine aircraft category (and smaller percentages for larger planes).44 Leadership in this segment, however, required significant capital investment. Garmin invested the greatest volume of resources into aviation over the past decade, surpassing automotive as of 2014. In 2018, Garmin spent $202 million in R&D in this area, roughly 36% of its total R&D expenditure.
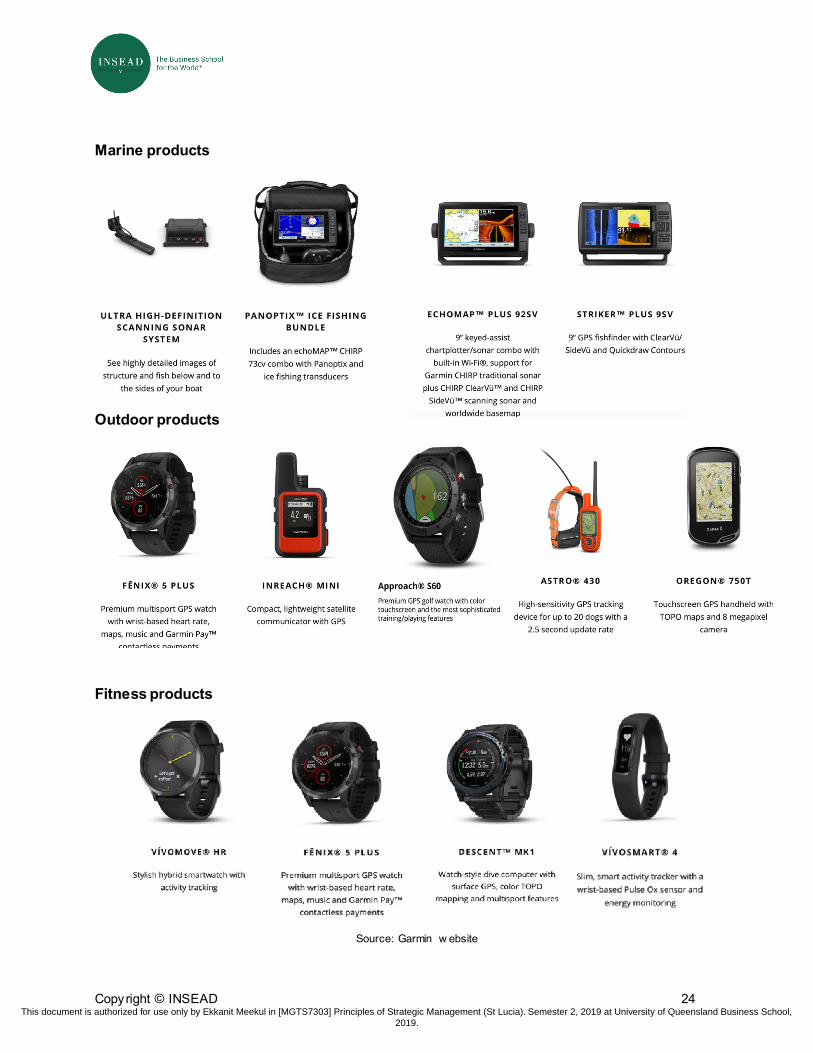
Marine (13%) – The smallest business segment in Garmin’s portfolio ($442 million in 2018 sales), it had grown in size. Garmin invested significantly in the development of its marine products line, maintaining a strong position in the market as one of the few full-suite marine vendors with product lines for both commercial and recreational use, such as autopilot systems, chartplotters, fish finders, radar, entertainment and information systems, along with wrist-worn devices for sailing and entertainment products (marine stereo systems). It developed a number of important OEM partnerships with some of the major marine equipment manufacturers (Chaparral Boats, Mastercraft, Sportsman Boats), and in October 2017, bought Navionics, a leading provider of electronic navigational charts and mobile applications for the marine industry to further boost the business. Garmin also sought to build up a community of fishing enthusiasts and lock in users with the launch of Quickdraw Contours in 2015, a free software that let mariners instantly create personalized HD fishing maps with 1-foot contours on any body of water.
Outdoor (24%) - Originally only a small part of Garmin’s business, the outdoor segment had grown to $810 million in sales by 2018, becoming (along with fitness) a major growth engine for Garmin. Garmin focused on making the best products within a niche. One of its successful outdoor products was the Golf handheld GPS and watches. The $399 Approach S60, launched in 2017, came with
44 Garmin earnings call, November 1, 2017.
This document is authorized for use only by Ekkanit Meekul in [MGTS7303] Principles of Strategic Management (St Lucia). Semester 2, 2019 at University of Queensland Business School, 2019.
Copyright © INSEAD 10
over 40,000 preloaded golf courses and measured a golfer’s swing speed, provided golfers with exact yardage to greens, fairways and hazards, plus club recommendations. Another high growth product was its dog-tracking devices, which Garmin entered after acquiring Tri-Tronics in 2011. However, its greatest hit started with the Fenix, the first GPS multi-sport smartwatch for outdoor enthusiasts, introduced in 2012, which was named the gear of the year by National Geographic. By 2017-18 the Fenix line of adventure watches had gathered momentum among outdoor adventurers and casual fitness enthusiasts, with features for specific sports (running, swimming, golf), as well as general exercise. The Fenix 5 enabled monitoring of track speed, stroke count for swimming, and golf yardage; could read three satellite network signals (GPS, GLONASS, and Galileo); and came with payment capability (Garmin Pay45), music, storm alerts, advanced fitness features and wrist-based heart rate. To encourage adoption of Garmin smart wearables (including fitness, see below), Garmin set up its own app store ConnectIQ in 2014 to build a community of users. By February 2018, ConnectIQ offered more than 3,500 (own and third-party) apps, widgets and watch faces, and had generated over 45 million downloads since inception.
Fitness (26%) – Fitness, once grouped together with outdoor, became the fastest growing segment of Garmin,46 raking in $858 million in sales in 2018. Garmin fitness watches provided key fitness metrics such as time, distance, pace, heart rate, and calories burned, were waterproof, and featured longer battery lives than comparable products. Garmin fitness products had a strong reputation and following. “If you’re a hard-core runner, it’s not a tough decision to make. You’ll buy a Garmin,” said analyst Andrew Uerkwitz. “There’s a loyalty that runners and hikers have for Garmin’s products, because they know they work.”47 Prices varied across products/features but were high. For example, the Forerunner 735XT watch for triathletes, which measured distance, heart monitoring, swimming strokes, cycling metrics and oxygen efficiency, retailed at $450 in 2016. However, low-cost watches for non-professional athletes that connected to an easy-to-use application took a significant of chunk of the market.
While Garmin continued to produce high-end, high-performance fitness wearables (like their outdoor equivalents, the fitness GPS smartwatch line Vivoactive came with payment capability, music, advanced fitness features and wrist-based heart rate), it entered a sub-segment fairly late – activity trackers. These were technologically unsophisticated, lower priced items, targeting a different set of customers, e.g., “the semi-sedentary couch potato concerned more about daily steps than their race pace.”48 Garmin launched its activity trackers, the no-frills Vivofit, and the more sophisticated Vivosmart in 2014. The addition of activity trackers to the product line-up significantly boosted wearable shipments and revenues.
45 Garmin Pay w as f irst introduced via its Vivoactive line of f itness w atches in September 2017. Fitbit, Garmin’s competitor in
the f itness market, also come up w ith payment capability (Fitbit Pay) around the same period in October 2017. Apple Pay w as available in September 2014.
46 Sonam Chatterjje, “Aviation, f itness sales drive Garmin profit; shares jump,” Reuters, February 12, 2014. 47 Alex Knapp, “How Garmin mapped out a new direction w ith f itness w earables”, Forbes, September 14, 2016. 48 Alex Knapp, “How Garmin mapped out a new direction w ith f itness w earables”, Forbes, September 14, 2016. Garmin has
introduced an unrelated, different type of tracker in 2011, to keep track of children, pets and property by monitoring the device’s location through either a phone or the internet.
This document is authorized for use only by Ekkanit Meekul in [MGTS7303] Principles of Strategic Management (St Lucia). Semester 2, 2019 at University of Queensland Business School, 2019.
Copyright © INSEAD 11
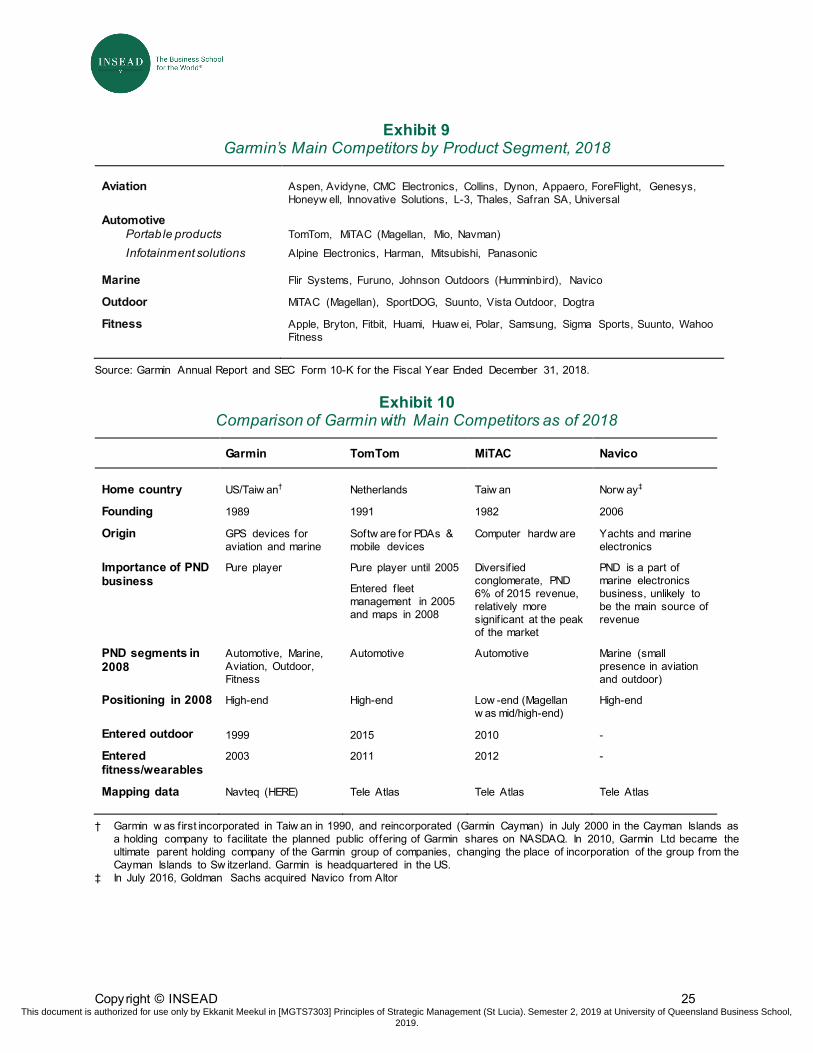
Major Competitors Across its five segments, Garmin competed with a large number of firms. Exhibit 9 lists Garmin’s main competitors by segment and Exhibit 10 provides a comparison of Garmin with three of its most important competitors as of 2018.
TomTom
Taking a different route to cope with the same challenges, TomTom continued focusing on PND software. It leveraged its mapping data to pump up its OEM automotive business, by developing connected navigation systems that included traffic and road data and analytics, along with navigation software for car manufacturers and car deck vendors. Later on, in 2018, its systems included data on electrical vehicle charging points in North America as well as on-street parking locations in 100 European cities.
In parallel, TomTom licensed data and software to other technology firms, such as Apple and Uber, for use in their mapping solutions. It released a version for the iPhone in the Apple App Store in August 2009, and an app for Android in September 2012, the same month in which TomTom replaced Google Maps as the main mapping data provider for Apple.49 In March 2015, TomTom switched from a one-time fee with lifetime updates for Android to a freemium subscription model, free for the first 50 miles per year. TomTom’s online APIs for location technology were integrated into the Microsoft Azure cloud platform in 2017, to power a variety of applications including IoT and smart city applications. It also announced new collaborations and contracts with MAPI, Michelin, Sony, and TripAdvisor.
TomTom’s fleet management originally formed only a small part of its revenue base. Post 2008, TomTom tapped into the growing fleet management system market in Europe and other regions by providing commercial vehicle telematics, which gave vehicle diagnostics and helped fleet owners more easily and efficiently track those vehicles in real time. In 2015, it expanded the telematics business to a new market segment it called ‘Connected cars’, where it sold its telematics services to OEMs, dealers, and leasing companies.
TomTom also tried to jump on the sports wearables bandwagon, teaming up with Nike in 2011 to create a fitness watch, diversifying into the GPS sports watch market in 2013 by introducing its own watches, which it extended to golf players. It also launched its sports action camera, The Bandit, in 2015. However, the fitness market became saturated, its products did not gain traction, and TomTom exited the fitness segment in early 2018.
At the heart of TomTom’s new direction was its HD mapping business. Moving on from the earlier Tele Atlas standard definition (SD) maps, TomTom poured resources into building HD maps, working with partners like Qualcomm, Nvidia, and Bosch, with an eye to developing products for advanced 49 Apple’s decision to replace Google Maps as its default mapping softw are w as reportedly triggered by Apple executives’
frustration w ith Google over its refusal to provide turn-by-turn navigation, a highly popular feature available on Google's own Android operating system on iPhone in late 2009. The introduction w as a public relations f iasco that cost the head of the iPhone softw are team and Apple maps chief their jobs as the new iOS maps, using TomTom data, w ere littered w ith errors, lack details, and did not have public-transportation information. Entering into maps eight years after Google, it took years for Apple to catch up w ith Google. Source: Charles Arthur, “Apple maps: How Google lost w hen everyone thought it had w on,” The Guardian, November 13, 2013; “Maps on smartphones: The criticism heaped on Apple show s the grow ing importance of cartography,” The Economist, September 12, 2012.
This document is authorized for use only by Ekkanit Meekul in [MGTS7303] Principles of Strategic Management (St Lucia). Semester 2, 2019 at University of Queensland Business School, 2019.
Copyright © INSEAD 12
assisted driving systems (ADAS) in the fast-developing autonomous car market. In 2017, TomTom acquired Autonomos, a Berlin start-up which brought expertise in automated driving systems and smart camera technology to form the basis of high-volume, low-cost data acquisition to build and maintain HD Maps.50 It also announced a collaboration with China’s Baidu to create HD maps in China: TomTom would provide the technology – database structures and technologies, and tools – while Baidu would populate the databases through camera observations and edits on the database. The maps would generate license fees for TomTom (but not a large amount of money in the short term) and enable the company to get a foothold in China. The company moved towards a subscription-based model in its connected cars and HD maps business. In a 4Q 2017 conference call, TomTom CEO Harold Goddijn indicated that the current pricing of an HD map per annum was higher than the current SD map licence for the entire contract period (typically 3-5 years); with increasing usage the pricing of the HD subscription would probably come down, but over a lifetime was still likely to be significantly higher than the SD license payment.
By the end of 2017, over 60% of TomTom’s revenue mix was derived from data, software and services, contributing 83% of total gross profit,51 a trend that continued in 2018. TomTom’s PND business (classified under consumer products together with an unsuccessful venture into the fitness wearables segment) was still cash-generative despite a declining market, and provided funds for its investment into HD maps. Overall, investors did not respond well to TomTom’s renewal strategies. Unlike Garmin, its stock price (adjusted for dividends and splits) never recovered to November 2007 peak, and hovered below 20% of its peak value from 2008 onwards (see Exhibits 11 and 12).
MiTAC
As the PND market started to decline, Taiwanese conglomerate MiTAC initially focused on capturing worldwide market share and brand recognition in the existing PND market. MiTAC acquired Magellan in 2008 for an estimated $96 million.52 Although Magellan had struggled to keep up with Garmin and TomTom in terms of features, innovation and customer support, it still had considerable brand recognition and a decent retail presence in the US (in contrast with MiTAC’s main PND brand Mio). Magellan’s products fared better than Mio in tests and were priced at the higher end of the scale.53 After acquiring Magellan and Navman (in 2007), number four and five PND firms respectively, within a span of two years MiTAC had solidified its position as the number three player behind Garmin and TomTom.
MiTAC had intended to use a division strategy targeting different regional market for the three different brands: Mio, Navman and Magellan.54 However, the integration of Magellan was a challenge. Its past acquisition of Navman had not been a success, especially in markets where both Mio and Navman were present: 18 months after the acquisition of Navman, its market share remained below that of the two brands’ combined market share at the time of the merger.55 In 2009, it established a US subsidiary, MiTAC Digital, to expand its handheld GPS business to North America.
As the worldwide PND market shrank and TomTom and Garmin increased their dominance in US and Europe, MiTAC shifted its focus back to Asia. Its products were recognized as the number one 50 TomTom earnings conference call, February 6, 2018. 51 Ibid. 52 Ludovic Privat, “Magellan consumer sold to MiTAC,” GPS Business New s, December 15, 2008. 53 Mark Hachman, “MiTAC Buys Magellan’s GPS Unit,” PCmag.com, December 15, 2008. 54 MiTAC International Annual Report 2008. 55 Ludovic Privat, “Magellan consumer sold to MiTAC,” GPS Business New s, December 15, 2008.
This document is authorized for use only by Ekkanit Meekul in [MGTS7303] Principles of Strategic Management (St Lucia). Semester 2, 2019 at University of Queensland Business School, 2019.
Copyright © INSEAD 13
GPS brand in Taiwan and received awards nationally and regionally. In an effort to expand MiTAC’s range of offerings, Magellan launched the company’s first recreational GPS product with a built-in geo-caching game in 2010 and the company’s first GPS watch product, the Magellan Switch series, to satisfy the needs of runners, cyclists, and triathletes in 2012. Unlike Mio and Navman, Magellan already had a presence in the outdoor handheld GPS segment and in some B2B GPS activities, such as GIS applications,56 at the time of its acquisition by MiTAC in 2008.57 In 2012, Mio launched the Mio Cyclo products dedicated to sports and fitness purposes. Nonetheless, MiTAC remained far behind Garmin in the outdoor and fitness markets.
Over the years, “trend-oriented” MiTAC kept shifting focus, entering high-growth industries that were somewhat computer-related. More recently, the company became active in cloud services (which it tried to link it to its other products and services, including navigation devices). According to the company website, Mio was still Asia’s leading and the world’s third leading brand of GPS products in 2018.58 Although MiTAC did not report segment results, total sales of wholly-owned subsidiaries Mio International and Mio Technology were NT$3.5 Billion ($110 million), slightly over 6% of MiTAC total revenue.59
Navico
Navico, the world’s largest marine electronics company formed by the merger of leading marine electronic brands Simrad, Lowrance, and Brunswick in 2006-07, spent the following years systematically integrating the three companies, consolidating seven brands into three and six factories into one, and building a common technology platform for the entire company.60 Focusing on innovation, Navico launched a new product every 20 days, steadily building its market share from 2009 onwards.
After focusing on organic growth for seven years, Navico made three new acquisitions in 2014: Consilium’s radar business, mapping and geospatial software company Contour Innovations (the creator of the LakeTrax platform that powers Navico’s global map-making tool), and Maritime Information Systems (MARIS). The same year, Navico launched its new GoFree brand, a digital brand that provided mapping, telematics, applications, and software solutions.61 Two years later, in early 2016, Navico expanded its manufacturing plant in Mexico, adding 50,000 square feet to the facility and 300 jobs to the existing 700 employees there.
56 Geographic information system (GIS) tools allow users to create interactive queries (user-created searches), analyse spatial
information, edit data in maps, and present the results of all these operations. 57 Ludovic Privat, “What w ent w rong at Magellan?” GPS Business New s, September 4, 2008. 58 MiTAC stopped releasing annual reports after merging into a bigger conglomerate MiTAC-SYNNEX in 2012. MiTA C-
SYNNEX Group’s scope of business include f ive main areas: Food, chemical & materials, design & manufacturing, distribution & fulf ilment, and system integration & mobile solutions. It has many subsidiaries and six listed companies, f ive in Taiw an (MiTAC Holdings, SYNNEX Technology, UPC Technology, Lien Hw a Industrial, and Getac technology) and one in NYSE (SYNNEX).
59 Case authors’ calculation based on data from MiTAC Annual Report 2015. 60 Navico w as born from the merger of Norw egian Simrad Yachting (founded in 1947) and American Low rance Electronics
(founded in 1957) by their common ow ners, Sw edish private equity f irm Altor Equity Partners in 2006. Navico acquired the marine electronics business of Brunsw ick in 2007 - its Navman (marine), Northstar and Mx-Marine brands - adding to the portfolio consisting of Eagle, Low rance, B&G, and Simrad lines.
61 “Navico history,” Company w ebsite, accessed December 27, 2016. GoFree products included a personalised mapping service w ith community data sharing, an aquatic map SaaS (‘Softw are as a Service’ is a softw are licensing and delivery model in w hich softw are is licensed on a subscription basis and is centrally hosted), an online shop, w ireless telematics solutions, and mobile apps for iOS and Android products.
This document is authorized for use only by Ekkanit Meekul in [MGTS7303] Principles of Strategic Management (St Lucia). Semester 2, 2019 at University of Queensland Business School, 2019.
Copyright © INSEAD 14
According to the company website, Navico was the most profitable player in the marine industry, with 2015 revenues of $309 million on EBITDA of $62 million. In July 2016, Goldman Sachs acquired Navico from Altor, along with another Altor-owned company Digital Marine Solution (owner of marine cartography business Jeppesen Marine) for an undisclosed amount.62 At that time, Navico employed 1500 people. Following the acquisition, Navico continued to invest in strengthening its dominant position in the marine segment.
Others
With Garmin now more evenly spread over all five segments compared to the pre-2008 period, where the dominant automotive segment had a few large competitors (TomTom, MiTAC), it now had a myriad of non-overlapping competitors in different segments (Exhibit 9). For example, in aviation, the biggest competitor of Garmin was Honeywell, which specialized in aviation but had much broader offering within the segment than Garmin. The key product on which the two companies competed was the flight deck. In the fitness segment, Garmin faced leading electronics firms like Apple and Samsung, and at the lower end Fitbit, Xiaomi, and other low-cost producers. Initially, Apple’s smartwatch had not received much interest and had lagged LG and Samsung in achieving cellular capability. Following the launch of the Apple Watch Series 3 in 2017, however, Apple overtook Xiaomi in the wearables market (Exhibit 13) and overwhelmed the smartwatch subsegment (Exhibit 14) by the end of 2018. The Apple Watch (Apple Watch 4 was launched in 3Q18), like Garmin’s Fenix, had a payment capability and the support of the Apple ecosystem. The other prominent players in wearables (apart from Apple and Xiaomi) were Fitbit, Huawei, and Samsung.
Recent Developments Despite initial setbacks following the emergence of smartphones as a viable substitute for its core products (with the introduction of the iPhone in 2007), Garmin managed to recover much of its lost ground as a GPS device manufacturer in the following decade. In October 2018, rather than declining with the PND market, Garmin announced that it had sold more than 200 million products to customers around the world in the automotive, aviation, marine, outdoor and fitness markets, just six years after it reached its 100 millionth product. By the end of 2018, on a dividend-adjusted basis, Garmin shares had regained 90% of the peak value in November 2007.
In contrast, TomTom, pursuing a different path with HD maps and self-driving cars, was locked in a battle with major players including automobile manufacturers and Google. In June 2018, Apple’s announcement that it was rebuilding its own iPhone maps app (which used TomTom’s data) caused TomTom’s stock price to fall, from fears that it was losing a major customer in its maps business. Following the announcement, TomTom lost OEM supply contracts with Renault and Volvo to Google, which TomTom CEO Harold Goddijn described as a “wake-up call” for TomTom and the auto industry. In October 2018, TomTom announced that it was considering selling its telematics business – classified as a discontinued operation in its most recent annual report – to concentrate on competing head-to-head with Google in car navigation software.
For Garmin, despite the current rosy outlook, clouds were on the horizon. In September 2018, Apple released its Apple Watch Series 4, with better cellular connectivity. It was also cleared by the FDA and endorsed by the American Heart Association for its range of health-tracking features, such as 62 Mikkel Stern-Peltz, “Altor sells Navico, DMS to Goldman Sachs and reinvests” Unquote, July 13, 2016.
This document is authorized for use only by Ekkanit Meekul in [MGTS7303] Principles of Strategic Management (St Lucia). Semester 2, 2019 at University of Queensland Business School, 2019.
Copyright © INSEAD 15
better heartrate tracking, an electrocardiogram sensor that detected unusually low heart rate or irregular rhythm, and an improved accelerometer and gyroscope able to detect if someone had fallen and alert SOS contacts. These enhanced features, along with Apple’s strong ecosystem, enabled Apple to increase its footprint in the smartwatch space. However, despite improved heartrate monitoring and sports features like a golf app, Apple Watch “encroachments” were not on par with Garmin’s technology and dedicated sportsmen still preferred Garmin’s products for their quality and performance. (Exhibit 15 shows a comparison of Garmin’s top-of-the-range smartwatch Fenix 5 versus the Apple Watch Series 4).
Facing strong competition in the various segments – Apple in fitness, Navico in marine, Honeywell in aviation – it was unclear whether Garmin’s diversified approach still made sense, going forward. Despite the common GPS component, Garmin’s segments varied in terms of technology and even distribution channels. It was not possible to cross-sell Garmin products that catered to B2C markets (such as outdoor and fitness products that customers could easily pick up in a store or online) and those that mainly catered to B2B markets (such as aviation, which required a salesforce with more technical knowledge as well as installation skills). Garmin had to also consider the opportunity cost of spreading itself too thin, facing a different set of competitors in each segment with a more focused approach to R&D and marketing in GPS-based devices.
Perhaps it was time for Garmin to reconsider its broad scope and refocus on some of the key markets or capabilities (and spin off other units or license their technologies externally) in order to remain competitive. On the other hand, several observers were critical of such a change, arguing that Garmin would be better off sticking to an approach that had proven highly successful over the past three decades.
This document is authorized for use only by Ekkanit Meekul in [MGTS7303] Principles of Strategic Management (St Lucia). Semester 2, 2019 at University of Queensland Business School, 2019.
Copyright © INSEAD 16
Exhibit 1 Market Capitalization of Garmin vs TomTom, 3Q 2007-2018
Source: Capital IQ
Exhibit 2 Garmin and the PND Industry (from its founding to 2008)
At the beginning of 2008, Garmin was a top player in the fast-growing personal navigation devices (PND) industry. Its sales had reached $3.2 billion in 2007, its 17th consecutive year of growth and positive income since its first product was delivered in 1991. It was by far the most dominant firm in North America and held a leading position worldwide, with a strong cash position and virtually no debt. The value of its stock had doubled in the last 12 months, giving Garmin a bigger market capitalization than General Motors. Originally built for military purposes in the 1970s, the development of the GPS network had prompted the emergence of GPS-based navigation systems for the civilian market by the 1980s, split into two fairly distinct submarkets: the corporate market (B2B) and personal navigation devices (PND). In the corporate market, products were sold directly to OEMs or manufacturers, segmented by mode of transportation – airplanes, cars and boats. GPS were bought (or produced) by manufacturers and built into the vehicles. There were only a handful major players in the corporate market: Honeywell in boating and aviation (large and small planes), Avidyne in aviation (small planes), Harman in automotive (cars), and Furuno in boating. The PND industry supplied portable tracking devices for personal use. The early 2000s saw exponential growth in the popularity of PND, largely driven by the automotive segment, due to a continuous decline in the quality-adjusted costs of digital technology and associated decrease in PND prices; increase in GPS accuracy to 3 meters in North America as a result of a Wide Area Augmentation System developed by the Federal Aviation Administration; and increasing sophistication of PNDs thanks to software advancements and incorporation of the internet. New PNDs highlighted traffic, points of interest, offered route preferences and real-time reporting of data related to navigation. As consumers became comfortable with the technology, PNDs appealed broadly
This document is authorized for use only by Ekkanit Meekul in [MGTS7303] Principles of Strategic Management (St Lucia). Semester 2, 2019 at University of Queensland Business School, 2019.
Copyright © INSEAD 17
to the mass consumer market with more functionality and lower prices. As a result, industry sales soared from $3.2 billion to $10.9 billion in just four years between 2004 and 2007. In parallel, the average retail price fell nearly one third, from $539 to $368 in the same time span. In terms of units sold, Europe was the largest PND market, followed by North America and Asia-Pacific by 2007. The US market witnessed more intense competition, a steeper increase in market size, and a steeper decrease in average retail price. Hence, PND units were 22% cheaper in the US than in Europe.
Garmin was started in 1989 by two electrical engineers, Gary Burrell and Min Kao, working at AlliedSignal, an avionics company, who decided to branch out on their own. It was later incorporated in Taiwan in January 1990 as “Garmin” and focused on the consumer market targeting small-plane pilots and boaters. While avionics and nautical products were the core business, Garmin started manufacturing PNDs for automobiles in 1997, and soon shifted focus to the automotive segment. Garmin’s automotive segment continued to prevail over its aviation segment in the early 2000s, which suffered from both a weak business climate and fierce regulatory environment following the attacks of September 11, 2001. Garmin went public in December 2000, raising $147 million in one of the best IPOs after the dot-com bust. On the first day of trading, share prices increased by 42%. The freshly capitalized Garmin spent over half a billion dollars on manufacturing and R&D. Deviating from its organic growth in 1990s, Garmin bought several small GPS-oriented firms to bolster various areas of its production and several of its distributors in Europe to maximize the efficiency of its sales network there. Unlike its competitors, Garmin was vertically integrated - production was done at its own facilities, it maintained its own warehouses and call centres, and it did all its marketing, design and engineering in-house. The company believed this allowed for quicker time-to-market, greater quality control, a more robust knowledge of its product lines and competitive environments along the supply-chain, and consequently cost reductions. Between 2003 and 2007 Garmin’s sales revenues had a CAGR of 54% and net income of 48%, driven by organic growth. Garmin controlled a majority of the aviation market, had nearly half of the overall US PND market, and was number two in Europe in the consumer segment. It was also popular among boaters and hikers. Garmin operated in four business segments: aviation (9% of 2007 sales), automotive/mobile (73%), marine (6%), and outdoor/fitness (11%). In 2007, Garmin was the market leader with 28% global market share in PND units sold, just ahead of TomTom at 27%, although TomTom led in revenues, as it had a much larger presence in Europe where PND prices were higher than the US (Garmin’s stronghold). MiTAC (the owner of Mio and Navman) was a distant third at 12%, followed by Magellan at 7% of the global market. The rest of the market was captured by more specialized firms like Humminbird (a division of Johnson Outdoors) and Raymarine in marine chartplotters and fishfinders. TomTom, MiTAC, and Magellan were Garmin’s main competitors due to their huge presence in the automotive segment, which accounted for approximately three quarters of total PND sales. These four accounted for 74% of PND shipments in the world (71% in Europe and 90% in the US). Navico, the world’s largest marine electronics company, had the broadest overlap with Garmin across all segments except automotive. Navico was the parent company to some of the leading marine electronics brands, including Lowrance, Simrad, and B&G, and was principal competitor for Garmin in handheld recreational products, general aviation products, marine chart-plotters, and fish-finder/depth sounders.
While industry experts, investors and analysts were optimistic about the future as Garmin entered 2008, their assessments were cautious in anticipation of changes that could affect industry fundamentals in the years ahead. Although the US GPS system had long been the sole provider of satellite signals for geolocation, it was aging. Alternative systems were on the horizon, including the EU’s Galileo, China’s BeiDou, and the revitalized Glonass of Russia. Smartphones – which offered a low-quality–low-price alternative to PNDs – were booming since the introduction of Apple’s iPhone in June 2007. Navteq and Tele Atlas, two leading providers of digital maps, had changed hands in the second half of 2007, acquired by Nokia and Garmin’s main rival TomTom, respectively. MiTAC, the number three PND player globally, had acquired the number five firm Navman earlier in 2007. Though growing sales and gains in efficiency had kept margins high, analysts were also worried about the commoditization of the PND market as users got used to lower prices.
This document is authorized for use only by Ekkanit Meekul in [MGTS7303] Principles of Strategic Management (St Lucia). Semester 2, 2019 at University of Queensland Business School, 2019.
Copyright © INSEAD 18
Through all this, Garmin had continued to position itself as a premium brand, offering best-of-breed navigation, ease of use, and top-notch customer support. However, given the developments, it was unclear whether it could remain a premium brand. Source: “Garmin at the Crossroads”, Metin Sengul, Phillip DeBruin, and Javier Gimeno, INSEAD case
Exhibit 3 Global Markets of Automotive Navigation Systems, PNDs, and Display Audios
(in thousands of devices sold), 2015-2022
A display audio (DA) is a device that consists of “a display and AV (AM/FM radio) function” w ithout any navigation function. If it aligns w ith a smartphone, the applications of the phone (including navigation) can be displayed on a DA monitor.
Source: Adapted from “Global Automotive Navigation System Market: Key Research Findings 2017”, Yano Research Institute, January 19, 2018
This document is authorized for use only by Ekkanit Meekul in [MGTS7303] Principles of Strategic Management (St Lucia). Semester 2, 2019 at University of Queensland Business School, 2019.
Copyright © INSEAD 19
Exhibit 4 Percentage of Global Navigation Satellite System (GNSS) Receivers by their Capability to
Track Different Constellations, 2016
Source: estimated from GNSS User Technology Report, European GNSS Agency (GSA)
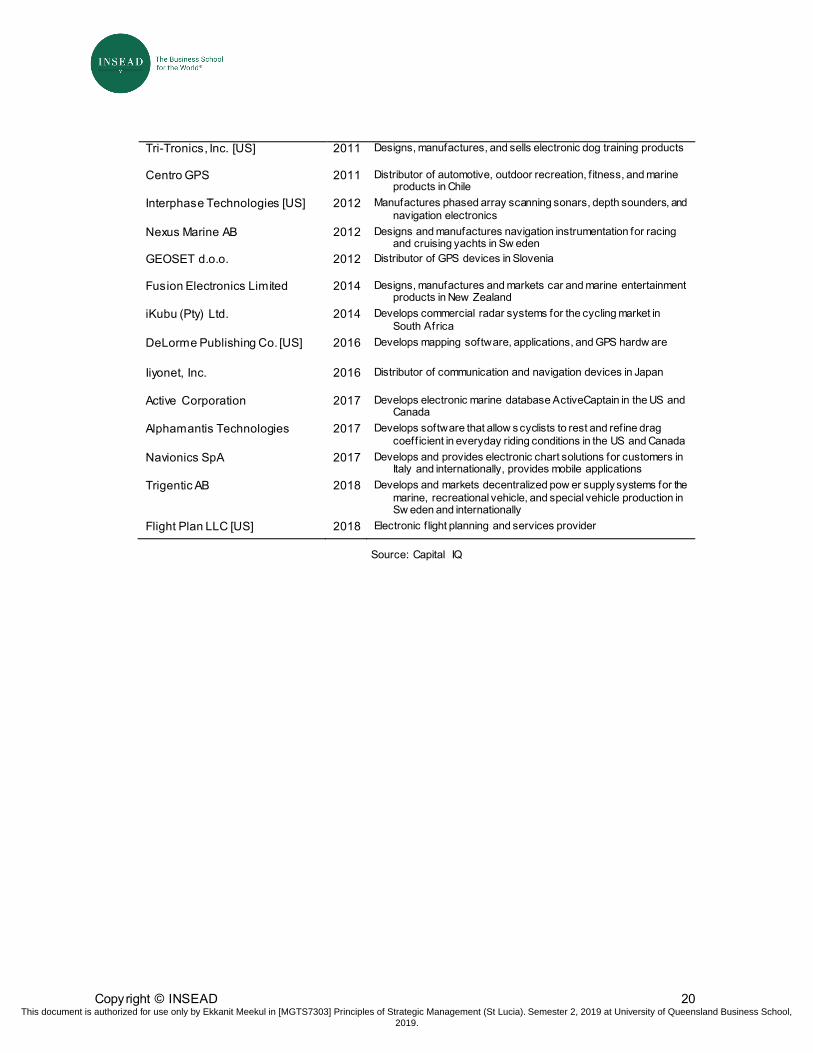
Exhibit 5 Notable Acquisitions by Garmin, 2008-2018
Target Company Year Specialization Navcor Oy
2008
Distributor of consumer products in Belgium and Luxembourg
Formar Electronics 2008 Distributor of consumer products in Finland
Puls Elektronik GmBH
2008
Distributor of GPS-enabled and related products in Austria
Satsignal Equipamentos de Comunicacoes e de Navegaco
2008 Distributor of consumer products in Portugal
Sportmanship International AB 2008 Distributor of Garmin portable navigation systems in Sw eden
MetriGear, Inc. [US] 2010 Develops and manufactures power meters for cyclists
Belanor AS 2010 Distributor of automotive, outdoor leisure, f itness, and nautical products in Norw ay
Avnic Trading (Pty) Ltd. 2011 Distributor of global positioning and navigation systems in South Africa
Navigon AG 2011 Manufactures GPS navigation systems and offer mobile GPS software for consumer electronics manufacturers in Germany
This document is authorized for use only by Ekkanit Meekul in [MGTS7303] Principles of Strategic Management (St Lucia). Semester 2, 2019 at University of Queensland Business School, 2019.
Copyright © INSEAD 20
Tri-Tronics, Inc. [US] 2011 Designs, manufactures, and sells electronic dog training products
Centro GPS 2011 Distributor of automotive, outdoor recreation, f itness, and marine products in Chile
Interphase Technologies [US] 2012
Manufactures phased array scanning sonars, depth sounders, and navigation electronics
Nexus Marine AB
2012 Designs and manufactures navigation instrumentation for racing and cruising yachts in Sw eden
GEOSET d.o.o. 2012 Distributor of GPS devices in Slovenia
Fusion Electronics Limited 2014 Designs, manufactures and markets car and marine entertainment products in New Zealand
iKubu (Pty) Ltd. 2014 Develops commercial radar systems for the cycling market in South Africa
DeLorme Publishing Co. [US] 2016 Develops mapping software, applications, and GPS hardw are
Iiyonet, Inc. 2016 Distributor of communication and navigation devices in Japan
Active Corporation 2017 Develops electronic marine database ActiveCaptain in the US and Canada
Alphamantis Technologies 2017 Develops software that allow s cyclists to rest and refine drag coeff icient in everyday riding conditions in the US and Canada
Navionics SpA 2017 Develops and provides electronic chart solutions for customers in Italy and internationally, provides mobile applications
Trigentic AB 2018 Develops and markets decentralized pow er supply systems for the marine, recreational vehicle, and special vehicle production in Sw eden and internationally
Flight Plan LLC [US] 2018 Electronic f light planning and services provider
Source: Capital IQ
This document is authorized for use only by Ekkanit Meekul in [MGTS7303] Principles of Strategic Management (St Lucia). Semester 2, 2019 at University of Queensland Business School, 2019.
Copyright © INSEAD 21
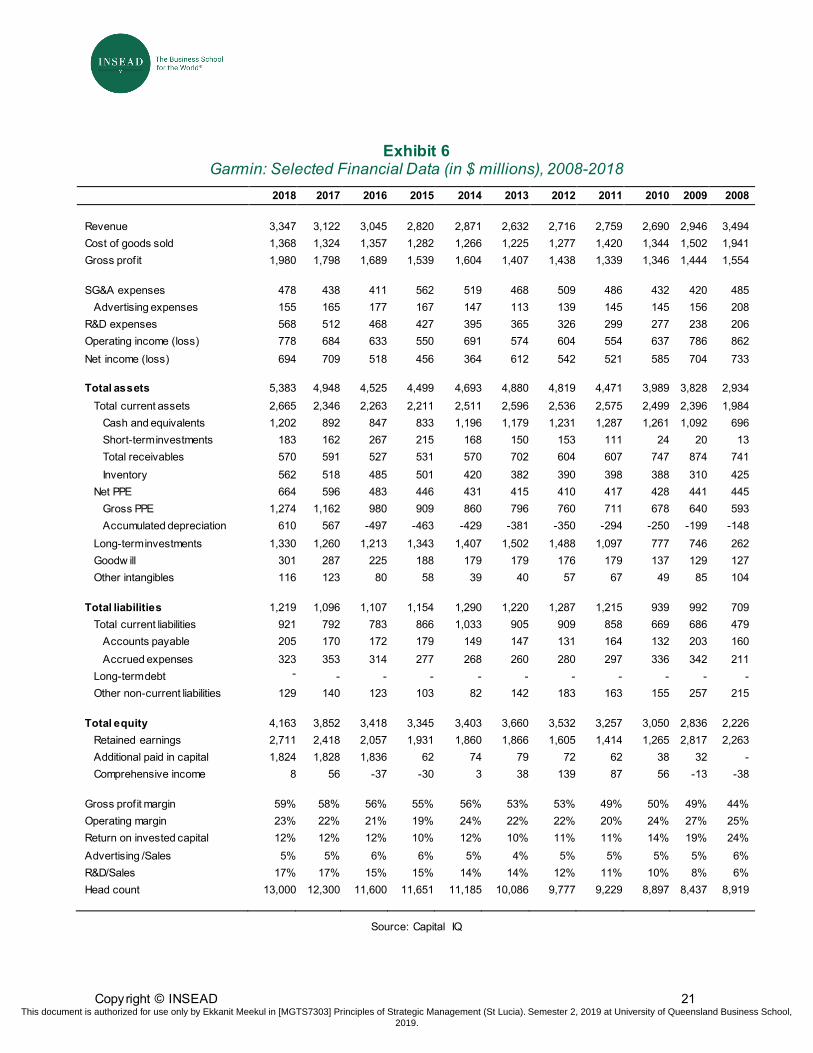
Exhibit 6 Garmin: Selected Financial Data (in $ millions), 2008-2018
2018 2017 2016 2015 2014 2013 2012 2011 2010 2009 2008
Revenue 3,347 3,122 3,045 2,820 2,871 2,632 2,716 2,759 2,690 2,946 3,494 Cost of goods sold 1,368 1,324 1,357 1,282 1,266 1,225 1,277 1,420 1,344 1,502 1,941 Gross profit 1,980 1,798 1,689 1,539 1,604 1,407 1,438 1,339 1,346 1,444 1,554 SG&A expenses 478 438 411 562 519 468 509 486 432 420 485 Advertising expenses 155 165 177 167 147 113 139 145 145 156 208 R&D expenses 568 512 468 427 395 365 326 299 277 238 206 Operating income (loss) 778 684 633 550 691 574 604 554 637 786 862 Net income (loss) 694 709 518 456 364 612 542 521 585 704 733 Total assets 5,383 4,948 4,525 4,499 4,693 4,880 4,819 4,471 3,989 3,828 2,934 Total current assets 2,665 2,346 2,263 2,211 2,511 2,596 2,536 2,575 2,499 2,396 1,984 Cash and equivalents 1,202 892 847 833 1,196 1,179 1,231 1,287 1,261 1,092 696 Short-term investments 183 162 267 215 168 150 153 111 24 20 13 Total receivables 570 591 527 531 570 702 604 607 747 874 741 Inventory 562 518 485 501 420 382 390 398 388 310 425 Net PPE 664 596 483 446 431 415 410 417 428 441 445 Gross PPE 1,274 1,162 980 909 860 796 760 711 678 640 593 Accumulated depreciation 610 567 -497 -463 -429 -381 -350 -294 -250 -199 -148 Long-term investments 1,330 1,260 1,213 1,343 1,407 1,502 1,488 1,097 777 746 262 Goodw ill 301 287 225 188 179 179 176 179 137 129 127 Other intangibles 116 123 80 58 39 40 57 67 49 85 104 Total liabilities 1,219 1,096 1,107 1,154 1,290 1,220 1,287 1,215 939 992 709 Total current liabilities 921 792 783 866 1,033 905 909 858 669 686 479 Accounts payable 205 170 172 179 149 147 131 164 132 203 160 Accrued expenses 323 353 314 277 268 260 280 297 336 342 211 Long-term debt -
- - - - - - - - - -
Other non-current liabilities 129 140 123 103 82 142 183 163 155 257 215 Total equity 4,163 3,852 3,418 3,345 3,403 3,660 3,532 3,257 3,050 2,836 2,226 Retained earnings 2,711 2,418 2,057 1,931 1,860 1,866 1,605 1,414 1,265 2,817 2,263 Additional paid in capital 1,824 1,828 1,836 62 74 79 72 62 38 32 - Comprehensive income 8 56 -37 -30 3 38 139 87 56 -13 -38 Gross profit margin 59% 58% 56% 55% 56% 53% 53% 49% 50% 49% 44% Operating margin 23% 22% 21% 19% 24% 22% 22% 20% 24% 27% 25% Return on invested capital 12% 12% 12% 10% 12% 10% 11% 11% 14% 19% 24% Advertising /Sales 5% 5% 6% 6% 5% 4% 5% 5% 5% 5% 6% R&D/Sales 17% 17% 15% 15% 14% 14% 12% 11% 10% 8% 6% Head count 13,000 12,300 11,600 11,651 11,185 10,086 9,777 9,229 8,897 8,437 8,919
Source: Capital IQ
This document is authorized for use only by Ekkanit Meekul in [MGTS7303] Principles of Strategic Management (St Lucia). Semester 2, 2019 at University of Queensland Business School, 2019.
Copyright © INSEAD 22
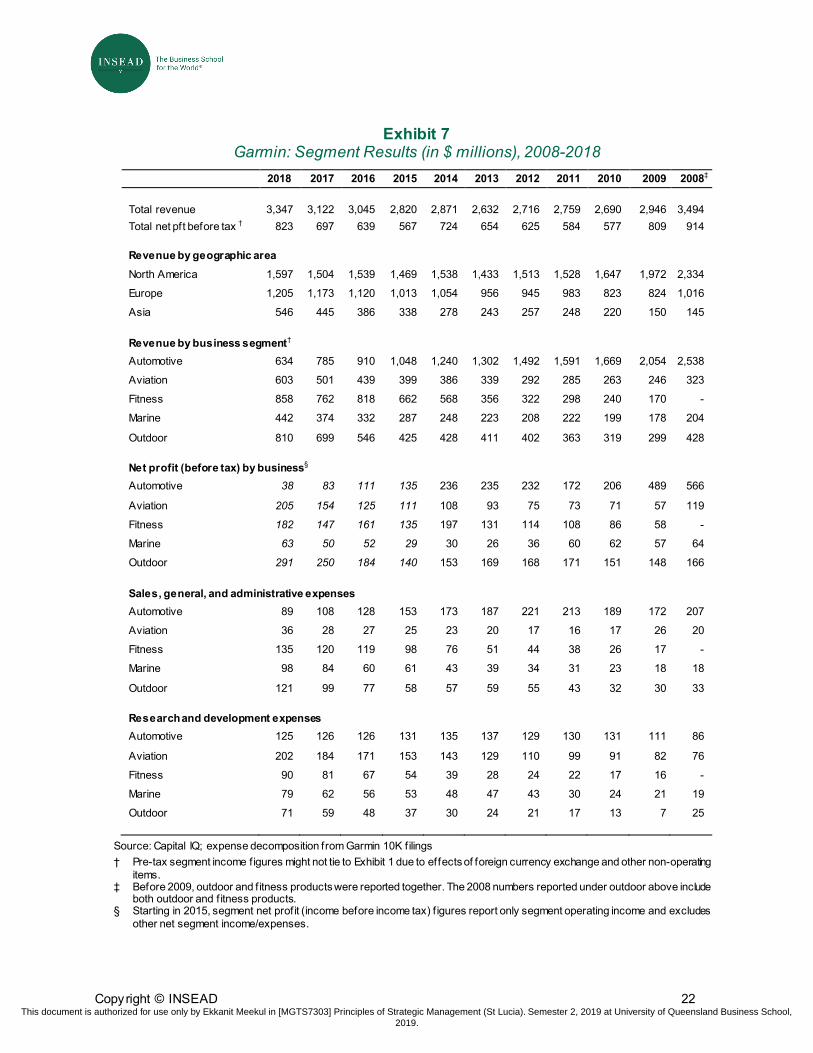
Exhibit 7 Garmin: Segment Results (in $ millions), 2008-2018
2018 2017 2016 2015 2014 2013 2012 2011 2010 2009 2008‡
Total revenue 3,347 3,122 3,045 2,820 2,871 2,632 2,716 2,759 2,690 2,946 3,494 Total net pft before tax † 823 697 639 567 724 654 625 584 577 809 914 Revenue by geographic area
North America 1,597 1,504 1,539 1,469 1,538 1,433 1,513 1,528 1,647 1,972 2,334
Europe 1,205 1,173 1,120 1,013 1,054 956 945 983 823 824 1,016
Asia 546 445 386 338 278 243 257 248 220 150 145
Revenue by business segment†
Automotive 634 785 910 1,048 1,240 1,302 1,492 1,591 1,669 2,054 2,538
Aviation 603 501 439 399 386 339 292 285 263 246 323
Fitness 858 762 818 662 568 356 322 298 240 170 -
Marine 442 374 332 287 248 223 208 222 199 178 204
Outdoor 810 699 546 425 428 411 402 363 319 299 428
Net profit (before tax) by business§ Automotive 38 83 111 135 236 235 232 172 206 489 566
Aviation 205 154 125 111 108 93 75 73 71 57 119
Fitness 182 147 161 135 197 131 114 108 86 58 -
Marine 63 50 52 29 30 26 36 60 62 57 64
Outdoor 291 250 184 140 153 169 168 171 151 148 166
Sales, general, and administrative expenses Automotive 89 108 128 153 173 187 221 213 189 172 207
Aviation 36 28 27 25 23 20 17 16 17 26 20
Fitness 135 120 119 98 76 51 44 38 26 17 -
Marine 98 84 60 61 43 39 34 31 23 18 18
Outdoor 121 99 77 58 57 59 55 43 32 30 33 Research and development expenses Automotive 125 126 126 131 135 137 129 130 131 111 86
Aviation 202 184 171 153 143 129 110 99 91 82 76
Fitness 90 81 67 54 39 28 24 22 17 16 -
Marine 79 62 56 53 48 47 43 30 24 21 19
Outdoor 71 59 48 37 30 24 21 17 13 7 25
Source: Capital IQ; expense decomposition from Garmin 10K filings † Pre-tax segment income figures might not tie to Exhibit 1 due to effects of foreign currency exchange and other non-operating
items. ‡ Before 2009, outdoor and f itness products were reported together. The 2008 numbers reported under outdoor above include
both outdoor and f itness products. § Starting in 2015, segment net profit (income before income tax) f igures report only segment operating income and excludes
other net segment income/expenses.
This document is authorized for use only by Ekkanit Meekul in [MGTS7303] Principles of Strategic Management (St Lucia). Semester 2, 2019 at University of Queensland Business School, 2019.
Copyright © INSEAD 23
Exhibit 8 Selected Garmin Products and Product Line-up, 2018
Automotive products
Aviation products
This document is authorized for use only by Ekkanit Meekul in [MGTS7303] Principles of Strategic Management (St Lucia). Semester 2, 2019 at University of Queensland Business School, 2019.
Copyright © INSEAD 24
Marine products
Outdoor products
Fitness products
Source: Garmin w ebsite
This document is authorized for use only by Ekkanit Meekul in [MGTS7303] Principles of Strategic Management (St Lucia). Semester 2, 2019 at University of Queensland Business School, 2019.
Copyright © INSEAD 25
Exhibit 9 Garmin’s Main Competitors by Product Segment, 2018
Aviation Aspen, Avidyne, CMC Electronics, Collins, Dynon, Appaero, ForeFlight, Genesys,
Honeyw ell, Innovative Solutions, L-3, Thales, Safran SA, Universal
Automotive Portab le products TomTom, MiTAC (Magellan, Mio, Navman)
Infotainment solutions Alpine Electronics, Harman, Mitsubishi, Panasonic
Marine Flir Systems, Furuno, Johnson Outdoors (Humminbird), Navico
Outdoor MiTAC (Magellan), SportDOG, Suunto, Vista Outdoor, Dogtra
Fitness Apple, Bryton, Fitbit, Huami, Huaw ei, Polar, Samsung, Sigma Sports, Suunto, Wahoo Fitness
Source: Garmin Annual Report and SEC Form 10-K for the Fiscal Year Ended December 31, 2018.
Exhibit 10 Comparison of Garmin with Main Competitors as of 2018
Garmin TomTom MiTAC Navico
Home country US/Taiw an† Netherlands Taiw an Norw ay‡
Founding 1989 1991 1982 2006
Origin GPS devices for aviation and marine
Softw are for PDAs & mobile devices
Computer hardw are Yachts and marine electronics
Importance of PND business
Pure player Pure player until 2005
Entered f leet management in 2005 and maps in 2008
Diversif ied conglomerate, PND 6% of 2015 revenue, relatively more signif icant at the peak of the market
PND is a part of marine electronics business, unlikely to be the main source of revenue
PND segments in 2008
Automotive, Marine, Aviation, Outdoor, Fitness
Automotive Automotive Marine (small presence in aviation and outdoor)
Positioning in 2008 High-end High-end Low -end (Magellan w as mid/high-end)
High-end
Entered outdoor 1999 2015 2010 -
Entered fitness/wearables
2003 2011 2012 -
Mapping data Navteq (HERE) Tele Atlas Tele Atlas Tele Atlas
† Garmin w as f irst incorporated in Taiw an in 1990, and reincorporated (Garmin Cayman) in July 2000 in the Cayman Islands as a holding company to facilitate the planned public offering of Garmin shares on NASDAQ. In 2010, Garmin Ltd became the ultimate parent holding company of the Garmin group of companies, changing the place of incorporation of the group from the Cayman Islands to Sw itzerland. Garmin is headquartered in the US.
‡ In July 2016, Goldman Sachs acquired Navico from Altor
This document is authorized for use only by Ekkanit Meekul in [MGTS7303] Principles of Strategic Management (St Lucia). Semester 2, 2019 at University of Queensland Business School, 2019.
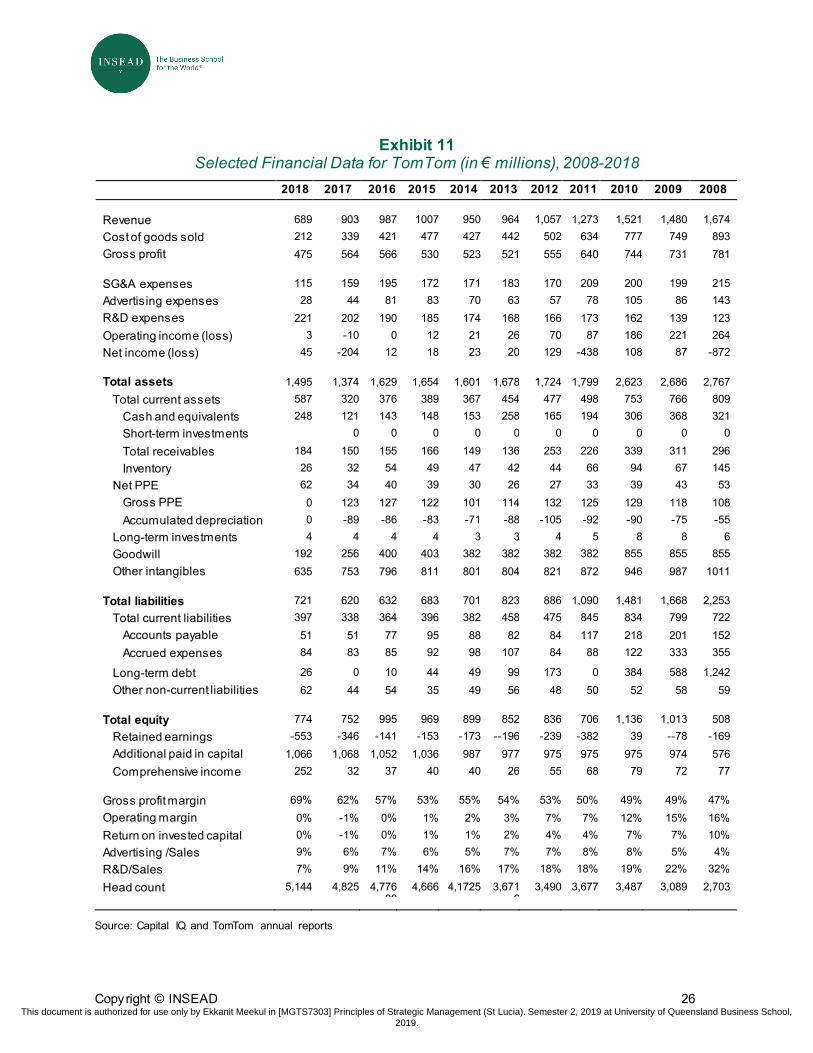
Copyright © INSEAD 26
Exhibit 11 Selected Financial Data for TomTom (in € millions), 2008-2018
2018 2017 2016 2015 2014 2013 2012 2011 2010 2009 2008 Revenue 689 903 987 1007 950 964 1,057
1,273
1,521 1,480 1,674
Cost of goods sold 212
339 421 477 427 442 502 634 777 749 893 Gross profit 475 564 566 530 523 521 555 640 744 731 781
SG&A expenses 115 159 195 172 171 183 170 209 200 199 215 Advertising expenses 28 44 81 83
70 63 57 78 105 86 143
R&D expenses 221 202 190 185 174 168 166 173 162 139 123 Operating income (loss) 3 -10 0 12 21 26 70 87 186 221 264 Net income (loss) 45 -204 12 18 23 20 129 -438
108 87 -872
Total assets 1,495 1,374 1,629 1,654 1,601 1,678 1,724 1,799 2,623 2,686 2,767 Total current assets 587 320 376 389 367 454 477 498 753 766 809 Cash and equivalents 248 121 143 148 153 258 165 194 306 368 321 Short-term investments 0 0 0 0 0 0 0 0 0 0
Total receivables 184 150 155 166 149 136 253 226 339 311 296 Inventory 26 32 54 49 47 42 44 66 94 67 145 Net PPE 62 34 40 39 30 26 27 33 39 43 53 Gross PPE 0 123 127 122 101 114 132 125 129 118 108 Accumulated depreciation 0 -89 -86 -83 -71 -88 -105 -92 -90 -75 -55 Long-term investments 4 4 4 4 3 3 4 5 8 8 6 Goodwill 192 256 400 403 382 382 382 382 855 855 855 Other intangibles 635 753 796 811 801 804 821 872 946 987 1011
Total liabilities 721 620 632 683 701 823 886 1,090 1,481 1,668 2,253 Total current liabilities 397 338 364 396 382 458 475 845 834 799 722 Accounts payable 51 51 77 95 88 82 84 117 218 201 152 Accrued expenses 84 83 85 92 98 107 84 88 122 333 355
Long-term debt 26 0 10 44 49 99 173 0 384 588 1,242 Other non-current liabilities 62 44 54 35 49 56 48 50 52 58 59
Total equity 774 752 995 969 899 852 836 706 1,136 1,013 508
Retained earnings -553 -346 -141 -153 -173 --196 -239 -382 39 --78 -169 Additional paid in capital 1,066 1,068 1,052 1,036 987 977 975 975 975 974 576 Comprehensive income 252 32 37 40 40 26 55 68 79 72 77
Gross profit margin 69% 62% 57% 53% 55% 54% 53% 50% 49% 49% 47% Operating margin 0% -1% 0% 1% 2% 3% 7% 7% 12% 15% 16% Return on invested capital 0% -1% 0% 1% 1% 2% 4% 4% 7% 7% 10% Advertising /Sales 9% 6% 7% 6% 5% 7% 7% 8% 8% 5% 4% R&D/Sales 7% 9% 11% 14% 16% 17% 18% 18% 19% 22% 32%
Head count 5,144 4,825 4,77600
4,666 4,1725 3,6716
3,490 3,677 3,487 3,089 2,703
Source: Capital IQ and TomTom annual reports
This document is authorized for use only by Ekkanit Meekul in [MGTS7303] Principles of Strategic Management (St Lucia). Semester 2, 2019 at University of Queensland Business School, 2019.
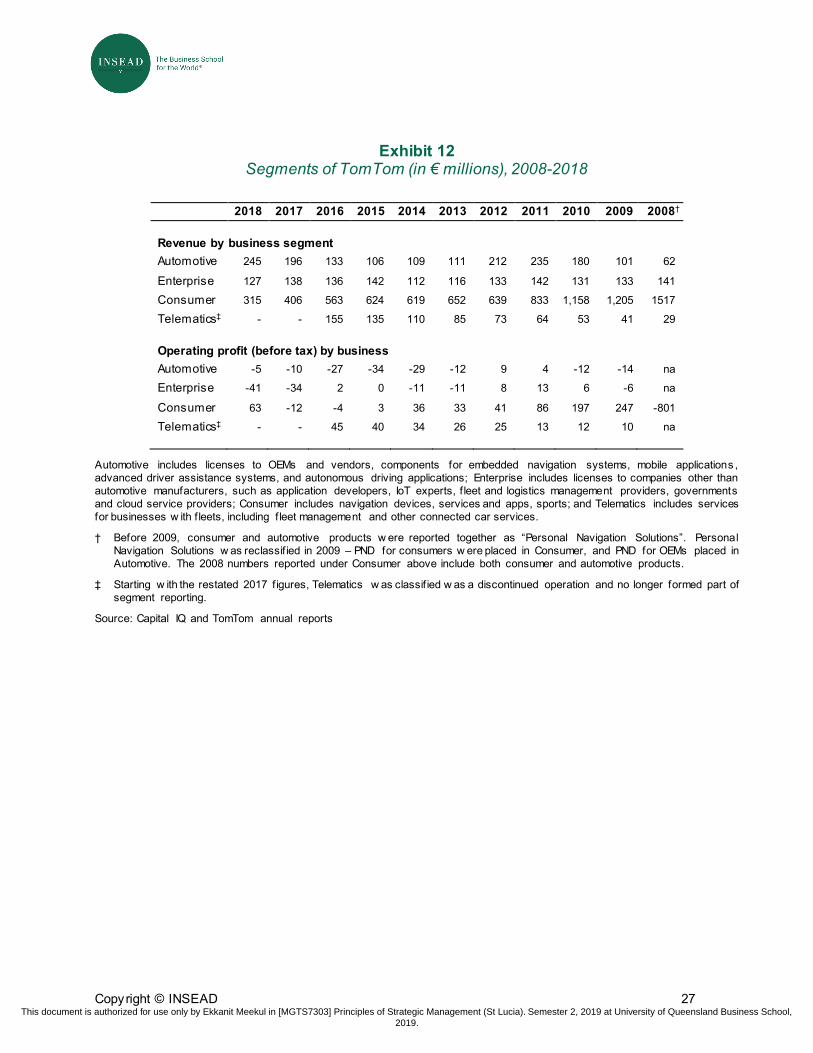
Copyright © INSEAD 27
Exhibit 12 Segments of TomTom (in € millions), 2008-2018
2018 2017 2016 2015 2014 2013 2012 2011 2010 2009 2008† Revenue by business segment Automotive 245 196 133 106 109 111 212 235 180 101 62
Enterprise 127 138 136 142 112 116 133 142 131 133 141
Consumer 315 406 563 624 619 652 639 833 1,158 1,205 1517
Telematics‡ - - 155 135 110 85 73 64 53 41 29 Operating profit (before tax) by business Automotive -5 -10 -27 -34 -29 -12 9 4 -12 -14 na
Enterprise -41 -34 2 0 -11 -11 8 13 6 -6 na
Consumer 63 -12 -4 3 36 33 41 86 197 247 -801
Telematics‡ - - 45 40 34 26 25 13 12 10 na
Automotive includes licenses to OEMs and vendors, components for embedded navigation systems, mobile applications , advanced driver assistance systems, and autonomous driving applications; Enterprise includes licenses to companies other than automotive manufacturers, such as application developers, IoT experts, f leet and logistics management providers, governments and cloud service providers; Consumer includes navigation devices, services and apps, sports; and Telematics includes services for businesses w ith f leets, including f leet management and other connected car services.
† Before 2009, consumer and automotive products w ere reported together as “Personal Navigation Solutions”. Personal Navigation Solutions w as reclassif ied in 2009 – PND for consumers w ere placed in Consumer, and PND for OEMs placed in Automotive. The 2008 numbers reported under Consumer above include both consumer and automotive products.
‡ Starting w ith the restated 2017 f igures, Telematics w as classif ied w as a discontinued operation and no longer formed part of segment reporting.
Source: Capital IQ and TomTom annual reports
This document is authorized for use only by Ekkanit Meekul in [MGTS7303] Principles of Strategic Management (St Lucia). Semester 2, 2019 at University of Queensland Business School, 2019.
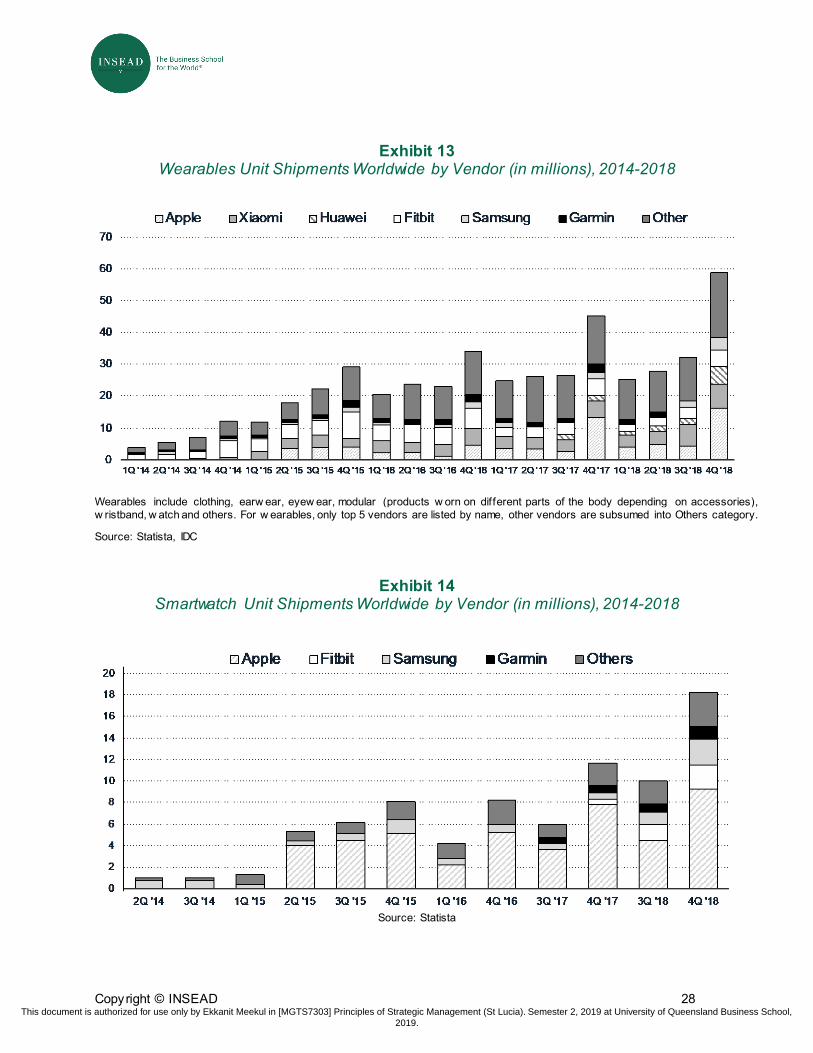
Copyright © INSEAD 28
Exhibit 13 Wearables Unit Shipments Worldwide by Vendor (in millions), 2014-2018
Wearables include clothing, earw ear, eyew ear, modular (products w orn on different parts of the body depending on accessories), w ristband, w atch and others. For w earables, only top 5 vendors are listed by name, other vendors are subsumed into Others category.
Source: Statista, IDC
Exhibit 14 Smartwatch Unit Shipments Worldwide by Vendor (in millions), 2014-2018
Source: Statista
This document is authorized for use only by Ekkanit Meekul in [MGTS7303] Principles of Strategic Management (St Lucia). Semester 2, 2019 at University of Queensland Business School, 2019.
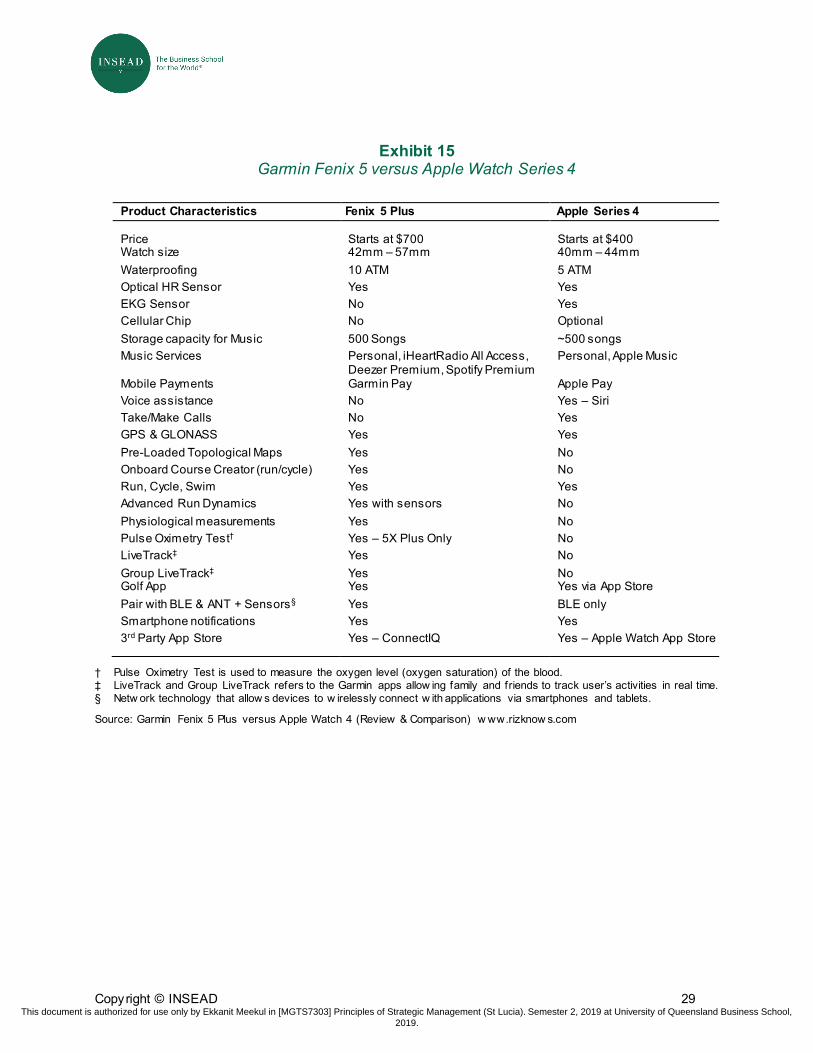
Copyright © INSEAD 29
Exhibit 15 Garmin Fenix 5 versus Apple Watch Series 4
Product Characteristics Fenix 5 Plus Apple Series 4
Price Starts at $700 Starts at $400 Watch size 42mm – 57mm 40mm – 44mm Waterproofing 10 ATM 5 ATM Optical HR Sensor Yes Yes EKG Sensor No Yes Cellular Chip No Optional Storage capacity for Music 500 Songs ~500 songs Music Services Personal, iHeartRadio All Access,
Deezer Premium, Spotify Premium Personal, Apple Music
Mobile Payments Garmin Pay Apple Pay Voice assistance No Yes – Siri Take/Make Calls No Yes GPS & GLONASS Yes Yes Pre-Loaded Topological Maps Yes No Onboard Course Creator (run/cycle) Yes No Run, Cycle, Swim Yes Yes Advanced Run Dynamics Yes with sensors No Physiological measurements Yes No Pulse Oximetry Test† Yes – 5X Plus Only No LiveTrack‡ Yes No Group LiveTrack‡ Yes No Golf App Yes Yes via App Store Pair with BLE & ANT + Sensors§ Yes BLE only Smartphone notifications Yes Yes 3rd Party App Store Yes – ConnectIQ Yes – Apple Watch App Store
† Pulse Oximetry Test is used to measure the oxygen level (oxygen saturation) of the blood. ‡ LiveTrack and Group LiveTrack refers to the Garmin apps allow ing family and friends to track user’s activities in real time. § Netw ork technology that allow s devices to w irelessly connect w ith applications via smartphones and tablets.
Source: Garmin Fenix 5 Plus versus Apple Watch 4 (Review & Comparison) w ww.rizknow s.com
This document is authorized for use only by Ekkanit Meekul in [MGTS7303] Principles of Strategic Management (St Lucia). Semester 2, 2019 at University of Queensland Business School, 2019.