Embed Size (px)
Citation preview
1
February 15, 2018
Gardner Denver Reports Strong Fourth Quarter and Full Year 2017 Results
FOURTH QUARTER 2017 HIGHLIGHTS
Revenues of $665 million increased 15% over the prior year, supported by strong double-digit order growth across
all three segments
Reported net income of $143.8 million compared to a prior year net loss of $4.3 million
Adjusted EBITDA of $172.6 million grew 16% over the prior year, reflecting a margin of 26.0%, an improvement of
30 basis points
Free cash flow of $96.2 million increased 213% over the prior year
Acquired Runtech Systems in February 2018 for approximately $93 million, strengthening the Industrials segment
product offering
FULL YEAR 2017 HIGHLIGHTS
Revenues of $2.375 billion increased 22% over the prior year driven by market growth and penetration of new
products, most notably in the Industrials and Energy segments
Reported net income of $18.5 million compared to a prior year net loss of $31.3 million
Adjusted EBITDA of $561.5 million grew 40% over the prior year, reflecting a margin of 23.6%, an improvement of
290 basis points
Free cash flow of $143.7 million increased 58% over the prior year
Net debt to Adjusted EBITDA leverage ratio of 2.9x, a decline of 130 basis points from the time of the IPO
2018 OUTLOOK
Full year 2018 Adjusted EBITDA expected to be $650 to $670 million
Milwaukee, WI (February 15, 2018) -- Gardner Denver Holdings, Inc. (NYSE: GDI) announced today fourth
quarter revenues of $665.0 million, up 15% compared to the prior year and an 11% increase excluding the
impact of foreign currency (“FX”).
Net income in the quarter was $143.8 million, or $0.69 per share based on share count of 209.3 million,
compared to a prior year net loss of $4.3 million, or a $0.07 loss per share based on share count of 148.7 million.
2
Adjusted net income increased 51% to $100.1 million, or $0.48 per share, compared to $66.4 million, or $0.44
per share, in the prior year. Adjusted EBITDA was $172.6 million, up 16% compared to the prior year. Adjusted
EBITDA as a percentage of revenues expanded 30 basis points to 26.0% as compared to 25.7% in the prior year.
The margin expansion versus prior year was driven by volume gains and operational improvements within the
Energy and Industrials segments, partially offset by a decline in Medical margins due to the prior year impact of
a price surcharge as part of the previously disclosed dual sourcing customer transition.
In the fourth quarter, Gardner Denver generated $116.6 million of cash flow from operating activities and
invested $20.4 million in capital expenditures, resulting in free cash flow of $96.2 million, up 213% compared to
the prior year. Fourth quarter net debt to Adjusted EBITDA leverage improved to 2.9x from 3.2x as compared to
the third quarter of 2017 largely due to the improved Adjusted EBITDA performance over the past year as well
as increased cash generation. This is within our targeted mid-term leverage range of 2.5x to 3.0x.
Total year revenues for 2017 were $2.375 billion, up 22% compared to the prior year and a 21% increase
excluding the impact of FX. Net income for the year was $18.5 million, or $0.10 per share based on share count
of 188.4 million compared to a prior year net loss of $31.3, or a $0.25 loss per share based on share count of
149.2 million. Adjusted net income increased 87% to $249.3 million, or $1.32 per share, compared to $133.6
million, or $0.88 per share, in the prior year. Adjusted EBITDA was $561.5 million, up 40% compared to the prior
year. Adjusted EBITDA as a percentage of revenues expanded 290 basis points to 23.6% as compared to 20.7%
in the prior year. Gardner Denver generated $200.5 million of cash flow from operating activities in the year and
invested $56.8 million in capital expenditures, resulting in free cash flow of $143.7 million, up 58% compared to
prior year.
Runtech Systems Acquisition
Gardner Denver announced on February 14, 2018 the acquisition of privately-held Runtech Systems for
approximately $93 million, funded by cash on hand. Based in Kolho, Finland, Runtech is a market-leading global
manufacturer of environmentally-friendly and energy-efficient turbo blowers and vacuum systems for use in a
variety of process-oriented industrial end markets. Runtech will be part of the company’s Industrials segment.
Business Trends and Outlook
“2017 was a landmark year for Gardner Denver as we completed our IPO and returned to the public markets
while continuing to successfully execute on our simple, yet focused strategy of building talent across the
3
organization, expanding margins, accelerating growth, and effectively allocating capital,” said Vicente Reynal,
Chief Executive Officer. “Our success is evident in our solid financial results. We increased revenues by over
20%, grew Adjusted EBITDA margins by 290 basis points and increased free cash flow by 58% compared to the
prior year. As a result, we reduced our leverage position by 130 basis points during the course of the year to
2.9x and expect further meaningful improvement in 2018. In addition, we have now closed on two attractive
and strategic acquisitions in our Industrials segment, LeRoi Compressors and Runtech Systems,” added Reynal.
“We enter 2018 with strong business momentum as all three segments had order growth of 20% or higher in the
fourth quarter, which we believe demonstrates the continued penetration of our new products. I would like to
thank the entire Gardner Denver team for their efforts in making 2017 a highly successful year and continuing to
build a strong foundation for future profitable growth.”
Fourth quarter 2017 performance:
Industrials
- Orders of $319.2 million, up 25% compared to the prior year, and up 20% excluding the impact of FX
- Revenues of $311.7 million, up 12% compared to the prior year, and up 7% excluding the impact of FX
- Segment Adjusted EBITDA of $69.0 million, up 12% from $61.4 million in the prior year
- Segment Adjusted EBITDA margin of 22.1%, up 10 basis points from 22.0% in the prior year
Energy
- Orders of $281.2 million, up 62% compared to the prior year, and up 58% excluding the impact of FX
- Revenues of $295.1 million, up 22% compared to the prior year, and up 18% excluding the impact of FX
- Segment Adjusted EBITDA of $96.9 million, up 32% from $73.5 million in the prior year
- Segment Adjusted EBITDA margin of 32.8%, up 250 basis points from 30.3% in the prior year
Medical
- Orders of $66.8 million, up 29% compared to the prior year, and up 23% excluding the impact of FX
- Revenues of $58.2 million, up 3% compared to the prior year, and down 1% excluding the impact of FX
- Segment Adjusted EBITDA of $15.5 million, down 10% from $17.2 million in the prior year
- Segment Adjusted EBITDA margin of 26.6%, down 380 basis points from 30.4% in the prior year
4
2018 Guidance
“Looking forward to 2018, our strategy will remain consistent as we build upon the successes of 2017,” stated
Reynal. “We are introducing full year 2018 guidance for Adjusted EBITDA of $650 million to $670 million which
includes the impact of the recently announced Runtech acquisition. In addition, we expect net debt to Adjusted
EBITDA leverage to be in the range of 2.1x to 2.3x by the end of 2018, excluding the impact of any potential future
acquisitions. We believe our continued focus on commercial execution combined with a disciplined approach to
operational excellence and capital allocation will continue to deliver solid results in 2018 and drive long-term value
creation for our shareholders.”
Conference Call Gardner Denver will broadcast a conference call to discuss results for the fourth quarter of 2017 on Friday,
February 16, 2017 at 8:00 a.m. Eastern time (7:00 a.m. Central time) through a live webcast. This webcast will
be available in listen-only mode and can be accessed, for up to ninety days following the call, through the
Investors section on the Gardner Denver website at http://investors.gardnerdenver.com.
5
Forward Looking Statements This press release contains forward-looking statements within the meaning of Section 27A of the Securities Act
of 1933, as amended (the "Securities Act") and Section 21E of the Securities Exchange Act of 1934. These
statements include, but are not limited to, statements related to our expectations regarding the performance of
our business, our financial results, our liquidity and capital resources and other non-historical statements,
including the statements in the "2018 Outlook” and “2018 Guidance" sections of this press release. You can
identify these forward-looking statements by the use of words such as "outlook," “guidance,” "believes,"
"expects," "potential," "continues," "may," "will," "should," "could," "seeks," "projects," "predicts," "intends,"
"plans," "estimates," "anticipates" or the negative version of these words or other comparable words. Such
forward-looking statements are subject to various risks and uncertainties, including macroeconomic factors
beyond the Company’s control, risks of doing business outside the United States, the Company’s dependence on
the level of activity in the energy industry, potential governmental regulations restricting the use of hydraulic
fracturing, raw material costs and availability, the risk of a loss or reduction of business with key customers or
consolidation or the vertical integration of the Company’s customer base, loss of or disruption in the Company’s
distribution network, the risk that ongoing and expected restructuring plans may not be as effective as the
Company anticipates, and the Company’s substantial indebtedness. Additional factors that could cause Gardner
Denver’s results to differ materially from those described in the forward-looking statements can be found under
the section entitled "Risk Factors" in our most recent annual report on form 10-K filed with the Securities and
Exchange Commission (“SEC”), as such factors may be updated from time to time in our periodic filings with the
SEC, which are accessible on the SEC's website at www.sec.gov. Accordingly, there are or will be important
factors that could cause actual outcomes or results to differ materially from those indicated in these statements.
These factors should not be construed as exhaustive and should be read in conjunction with the other
cautionary statements that are included in this release and in our filings with the SEC. We undertake no
obligation to publicly update or review any forward-looking statement, whether as a result of new information,
future developments or otherwise, except as required by law.
About Gardner Denver Gardner Denver (NYSE: GDI) is a leading global provider of mission-critical flow control and compression
equipment and associated aftermarket parts, consumables and services, which it sells across multiple attractive
end-markets within the industrial, energy and medical industries. Its broad and complete range of compressor,
pump, vacuum and blower products and services, along with its application expertise and over 155 years of
engineering heritage, allows Gardner Denver to provide differentiated product and service offerings for its
customers' specific uses. Gardner Denver supports its customers through its global geographic footprint of 39
key manufacturing facilities, more than 30 complementary service and repair centers across six continents, and
approximately 6,500 employees world-wide.
Gardner Denver uses its website www.gardnerdenver.com as a channel of distribution of Company information.
Financial and other important information regarding the Company is routinely accessible through and posted on
its website. Accordingly, investors should monitor Gardner Denver’s website, in addition to following the
Company’s press releases, SEC filings and public conference calls and webcasts. In addition, you may
6
automatically receive e-mail alerts and other information about Gardner Denver when you enroll your e-mail
address by visiting the “Email Alerts” section of Gardner Denver’s website at
http://investors.gardnerdenver.com.
Contact Gardner Denver Holdings, Inc.
Investor Relations Contact
Vikram Kini
(414) 212-4753
Non-U.S. GAAP Measures of Financial Performance In addition to consolidated GAAP financial measures, Gardner Denver reviews various non-GAAP financial
measures, including “Adjusted EBITDA,” “Adjusted Net Income,” “Adjusted Diluted EPS” and “Free Cash Flow.”
Gardner Denver believes Adjusted EBITDA, Adjusted Net Income and Adjusted Diluted EPS are helpful
supplemental measures to assist management and investors in evaluating the Company’s operating results as they
exclude certain items that are unusual in nature or whose fluctuation from period to period do not necessarily
correspond to changes in the operations of Gardner Denver’s business. Adjusted EBITDA represents net income
(loss) before interest, taxes, depreciation, amortization and certain non-cash, non-recurring and other adjustment
items. Adjusted Net Income is defined as net income (loss) including interest, depreciation and amortization of
non-acquisition related intangible assets and excluding other items used to calculate Adjusted EBITDA and further
adjusted for the tax effect of these exclusions. Gardner Denver believes that the adjustments applied in
presenting Adjusted EBITDA and Adjusted Net Income are appropriate to provide additional information to
investors about certain material non-cash items and about non-recurring items that the Company does not expect
to continue at the same level in the future. Adjusted Diluted EPS is defined as Adjusted Net Income divided by
Adjusted Diluted Average Shares Outstanding.
Gardner Denver uses Free Cash Flow to review the liquidity of its operations. Gardner Denver measures Free Cash
Flow as cash flows from operating activities less capital expenditures. Gardner Denver believes Free Cash Flow is
a useful supplemental financial measure for management and investors in assessing the Company’s ability to
pursue business opportunities and investments and to service its debt. Free Cash Flow is not a measure of our
liquidity under GAAP and should not be considered as an alternative to cash flows from operating activities.
Management and Gardner Denver’s board of directors regularly use these measures as tools in evaluating the
Company’s operating and financial performance and in establishing discretionary annual compensation. Such
measures are provided in addition to, and should not be considered to be a substitute for, or superior to, the
comparable measures under GAAP. In addition, Gardner Denver believes that Adjusted EBITDA, Adjusted Net
Income, Adjusted Diluted EPS and Free Cash Flow are frequently used by investors and other interested parties in
the evaluation of issuers, many of which also present Adjusted EBITDA, Adjusted Net Income, Adjusted Diluted
7
EPS and Free Cash Flow when reporting their results in an effort to facilitate an understanding of their operating
and financial results and liquidity.
Adjusted EBITDA, Adjusted Net Income, Adjusted Diluted EPS and Free Cash Flow should not be considered as
alternatives to net income (loss), diluted earnings per share or any other performance measure derived in
accordance with GAAP, or as alternatives to cash flow from operating activities as a measure of our liquidity.
Adjusted EBITDA, Adjusted Net Income, Adjusted Diluted EPS and Free Cash Flow have limitations as analytical
tools, and you should not consider such measures either in isolation or as substitutes for analyzing Gardner
Denver’s results as reported under GAAP.
Reconciliations of Adjusted EBITDA, Adjusted Net Income, Adjusted Diluted EPS and Free Cash Flow to their
most comparable U.S. GAAP financial metrics for historical periods are presented in the tables below.
Reconciliations of non-GAAP measures related to full year 2018 guidance have not been provided due to the
unreasonable efforts it would take to provide such reconciliations.
8
2017 2016 2017 2016
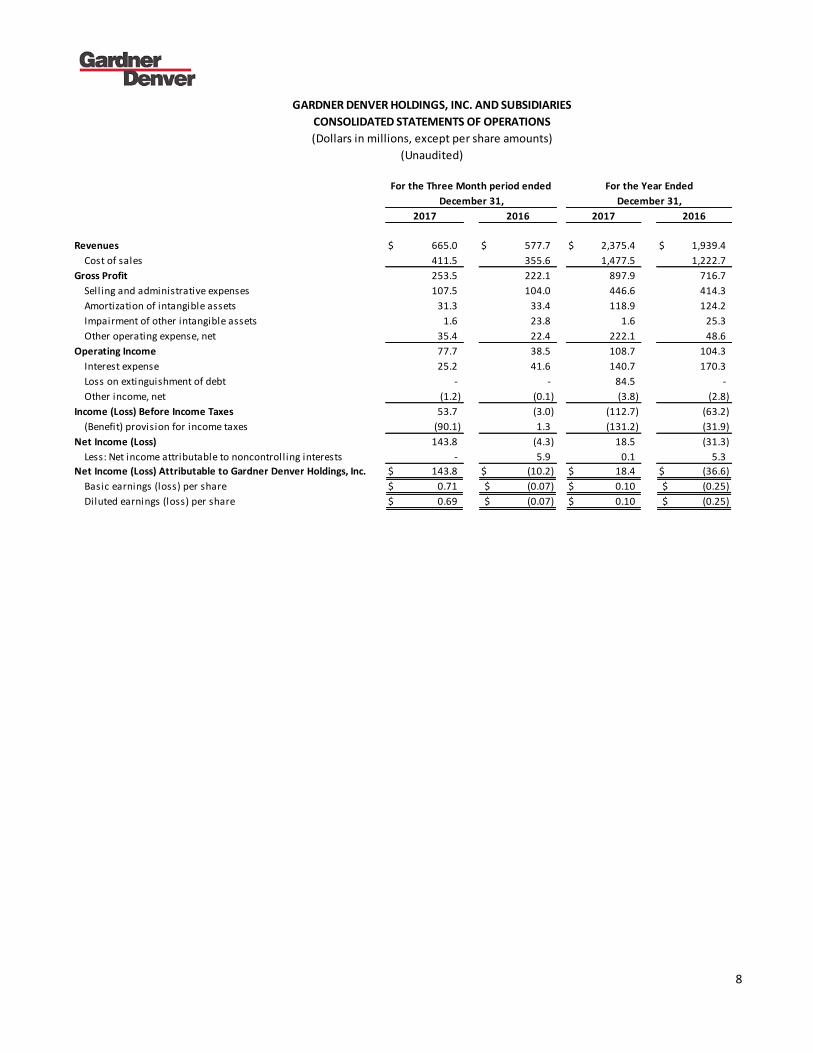
Revenues 665.0$ 577.7$ 2,375.4$ 1,939.4$
Cost of sales 411.5 355.6 1,477.5 1,222.7
Gross Profit 253.5 222.1 897.9 716.7
Selling and administrative expenses 107.5 104.0 446.6 414.3
Amortization of intangible assets 31.3 33.4 118.9 124.2
Impairment of other intangible assets 1.6 23.8 1.6 25.3
Other operating expense, net 35.4 22.4 222.1 48.6
Operating Income 77.7 38.5 108.7 104.3
Interest expense 25.2 41.6 140.7 170.3
Loss on extinguishment of debt - - 84.5 -
Other income, net (1.2) (0.1) (3.8) (2.8)
Income (Loss) Before Income Taxes 53.7 (3.0) (112.7) (63.2)
(Benefit) provision for income taxes (90.1) 1.3 (131.2) (31.9)
Net Income (Loss) 143.8 (4.3) 18.5 (31.3)
Less: Net income attributable to noncontrolling interests - 5.9 0.1 5.3
Net Income (Loss) Attributable to Gardner Denver Holdings, Inc. 143.8$ (10.2)$ 18.4$ (36.6)$
Basic earnings (loss) per share 0.71$ (0.07)$ 0.10$ (0.25)$
Diluted earnings (loss) per share 0.69$ (0.07)$ 0.10$ (0.25)$
December 31, December 31,
GARDNER DENVER HOLDINGS, INC. AND SUBSIDIARIES
CONSOLIDATED STATEMENTS OF OPERATIONS
(Dollars in millions, except per share amounts)
(Unaudited)
For the Three Month period ended For the Year Ended
9
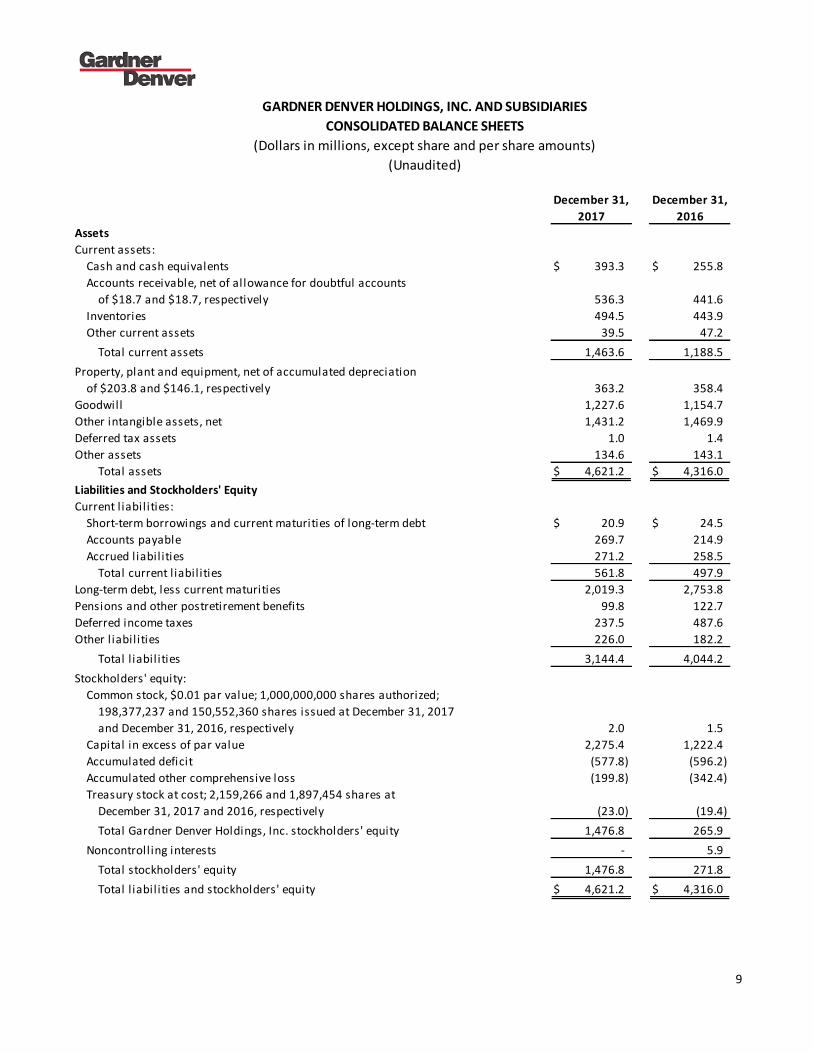
December 31, December 31,
2017 2016
Assets
Current assets:
Cash and cash equivalents 393.3$ 255.8$
Accounts receivable, net of allowance for doubtful accounts
of $18.7 and $18.7, respectively 536.3 441.6
Inventories 494.5 443.9
Other current assets 39.5 47.2
Total current assets 1,463.6 1,188.5
Property, plant and equipment, net of accumulated depreciation
of $203.8 and $146.1, respectively 363.2 358.4
Goodwill 1,227.6 1,154.7
Other intangible assets, net 1,431.2 1,469.9
Deferred tax assets 1.0 1.4
Other assets 134.6 143.1
Total assets 4,621.2$ 4,316.0$
Liabilities and Stockholders' Equity
Current l iabilities:
Short-term borrowings and current maturities of long-term debt 20.9$ 24.5$
Accounts payable 269.7 214.9
Accrued liabilities 271.2 258.5
Total current l iabilities 561.8 497.9
Long-term debt, less current maturities 2,019.3 2,753.8
Pensions and other postretirement benefits 99.8 122.7
Deferred income taxes 237.5 487.6
Other l iabilities 226.0 182.2
Total l iabil ities 3,144.4 4,044.2
Stockholders' equity:
Common stock, $0.01 par value; 1,000,000,000 shares authorized;
198,377,237 and 150,552,360 shares issued at December 31, 2017
and December 31, 2016, respectively 2.0 1.5
Capital in excess of par value 2,275.4 1,222.4
Accumulated deficit (577.8) (596.2)
Accumulated other comprehensive loss (199.8) (342.4)
Treasury stock at cost; 2,159,266 and 1,897,454 shares at
December 31, 2017 and 2016, respectively (23.0) (19.4)
Total Gardner Denver Holdings, Inc. stockholders' equity 1,476.8 265.9
Noncontrolling interests - 5.9
Total stockholders' equity 1,476.8 271.8
Total l iabil ities and stockholders' equity 4,621.2$ 4,316.0$
GARDNER DENVER HOLDINGS, INC. AND SUBSIDIARIES
CONSOLIDATED BALANCE SHEETS
(Dollars in millions, except share and per share amounts)
(Unaudited)
10
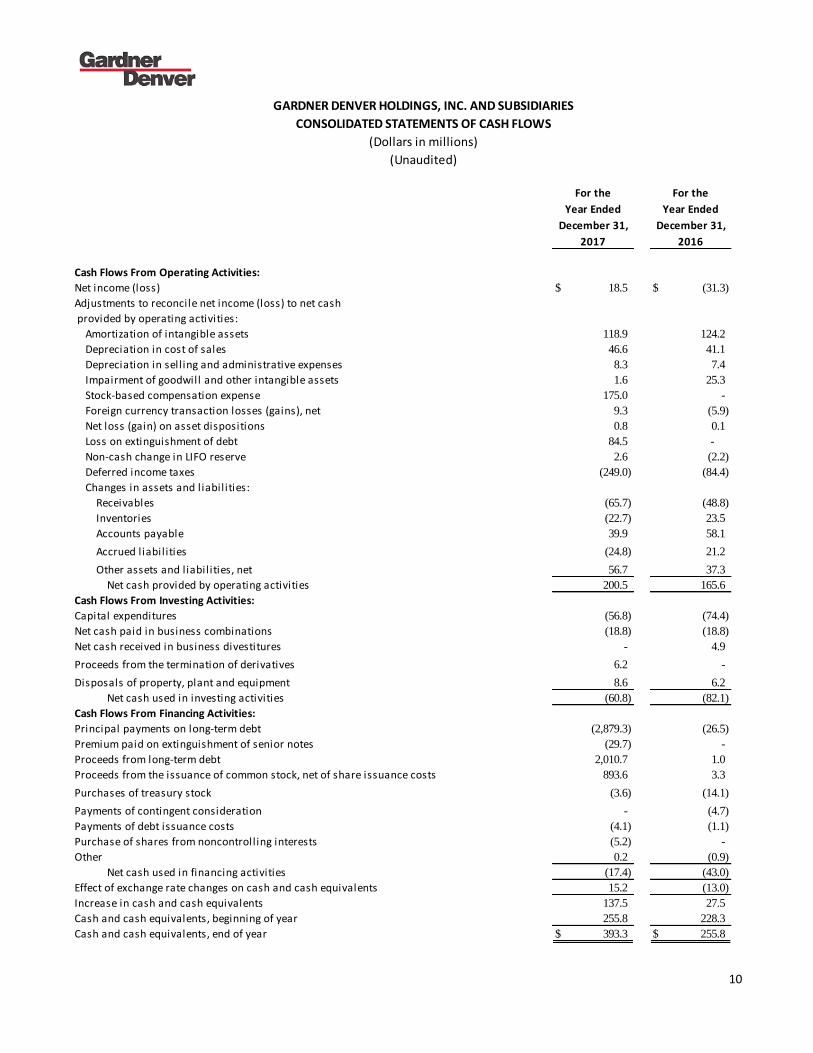
For the For the
Year Ended Year Ended
December 31, December 31,
2017 2016
Cash Flows From Operating Activities:
Net income (loss) 18.5$ (31.3)$
Adjustments to reconcile net income (loss) to net cash
provided by operating activities:
Amortization of intangible assets 118.9 124.2
Depreciation in cost of sales 46.6 41.1
Depreciation in sell ing and administrative expenses 8.3 7.4
Impairment of goodwill and other intangible assets 1.6 25.3
Stock-based compensation expense 175.0 -
Foreign currency transaction losses (gains), net 9.3 (5.9)
Net loss (gain) on asset dispositions 0.8 0.1
Loss on extinguishment of debt 84.5 -
Non-cash change in LIFO reserve 2.6 (2.2)
Deferred income taxes (249.0) (84.4)
Changes in assets and liabilities:
Receivables (65.7) (48.8)
Inventories (22.7) 23.5
Accounts payable 39.9 58.1
Accrued liabilities (24.8) 21.2
Other assets and liabilities, net 56.7 37.3
Net cash provided by operating activities 200.5 165.6
Cash Flows From Investing Activities:
Capital expenditures (56.8) (74.4)
Net cash paid in business combinations (18.8) (18.8)
Net cash received in business divestitures - 4.9
Proceeds from the termination of derivatives 6.2 -
Disposals of property, plant and equipment 8.6 6.2
Net cash used in investing activities (60.8) (82.1)
Cash Flows From Financing Activities:
Principal payments on long-term debt (2,879.3) (26.5)
Premium paid on extinguishment of senior notes (29.7) -
Proceeds from long-term debt 2,010.7 1.0
Proceeds from the issuance of common stock, net of share issuance costs 893.6 3.3
Purchases of treasury stock (3.6) (14.1)
Payments of contingent consideration - (4.7)
Payments of debt issuance costs (4.1) (1.1)
Purchase of shares from noncontrolling interests (5.2) -
Other 0.2 (0.9)
Net cash used in financing activities (17.4) (43.0)
Effect of exchange rate changes on cash and cash equivalents 15.2 (13.0)
Increase in cash and cash equivalents 137.5 27.5
Cash and cash equivalents, beginning of year 255.8 228.3
Cash and cash equivalents, end of year 393.3$ 255.8$
GARDNER DENVER HOLDINGS, INC. AND SUBSIDIARIES
CONSOLIDATED STATEMENTS OF CASH FLOWS
(Dollars in millions)
(Unaudited)
11
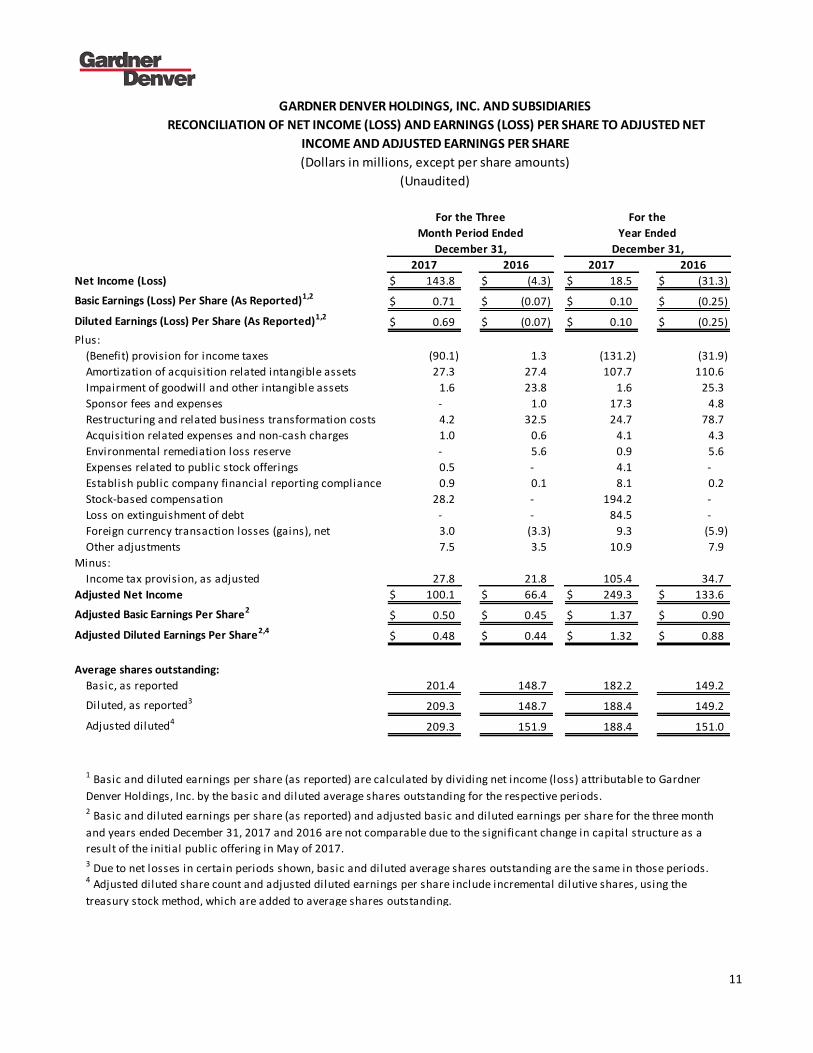
2017 2016 2017 2016
Net Income (Loss) 143.8$ (4.3)$ 18.5$ (31.3)$
Basic Earnings (Loss) Per Share (As Reported)1,20.71$ (0.07)$ 0.10$ (0.25)$
Diluted Earnings (Loss) Per Share (As Reported)1,20.69$ (0.07)$ 0.10$ (0.25)$
Plus:
(Benefit) provision for income taxes (90.1) 1.3 (131.2) (31.9)
Amortization of acquisition related intangible assets 27.3 27.4 107.7 110.6
Impairment of goodwill and other intangible assets 1.6 23.8 1.6 25.3
Sponsor fees and expenses - 1.0 17.3 4.8
Restructuring and related business transformation costs 4.2 32.5 24.7 78.7
Acquisition related expenses and non-cash charges 1.0 0.6 4.1 4.3
Environmental remediation loss reserve - 5.6 0.9 5.6
Expenses related to public stock offerings 0.5 - 4.1 -
Establish public company financial reporting compliance 0.9 0.1 8.1 0.2
Stock-based compensation 28.2 - 194.2 -
Loss on extinguishment of debt - - 84.5 -
Foreign currency transaction losses (gains), net 3.0 (3.3) 9.3 (5.9)
Other adjustments 7.5 3.5 10.9 7.9
Minus:
Income tax provision, as adjusted 27.8 21.8 105.4 34.7
Adjusted Net Income 100.1$ 66.4$ 249.3$ 133.6$
Adjusted Basic Earnings Per Share20.50$ 0.45$ 1.37$ 0.90$
Adjusted Diluted Earnings Per Share2,40.48$ 0.44$ 1.32$ 0.88$
Average shares outstanding:
Basic, as reported 201.4 148.7 182.2 149.2
Diluted, as reported3209.3 148.7 188.4 149.2
Adjusted diluted4209.3 151.9 188.4 151.0
3 Due to net losses in certain periods shown, basic and diluted average shares outstanding are the same in those periods.4 Adjusted diluted share count and adjusted diluted earnings per share include incremental dilutive shares, using the
treasury stock method, which are added to average shares outstanding.
1 Basic and diluted earnings per share (as reported) are calculated by dividing net income (loss) attributable to Gardner
Denver Holdings, Inc. by the basic and diluted average shares outstanding for the respective periods.2 Basic and diluted earnings per share (as reported) and adjusted basic and diluted earnings per share for the three month
and years ended December 31, 2017 and 2016 are not comparable due to the significant change in capital structure as a
result of the initial public offering in May of 2017.
Month Period Ended Year Ended
December 31, December 31,
GARDNER DENVER HOLDINGS, INC. AND SUBSIDIARIES
RECONCILIATION OF NET INCOME (LOSS) AND EARNINGS (LOSS) PER SHARE TO ADJUSTED NET
INCOME AND ADJUSTED EARNINGS PER SHARE
(Dollars in millions, except per share amounts)
(Unaudited)
For the Three For the
12
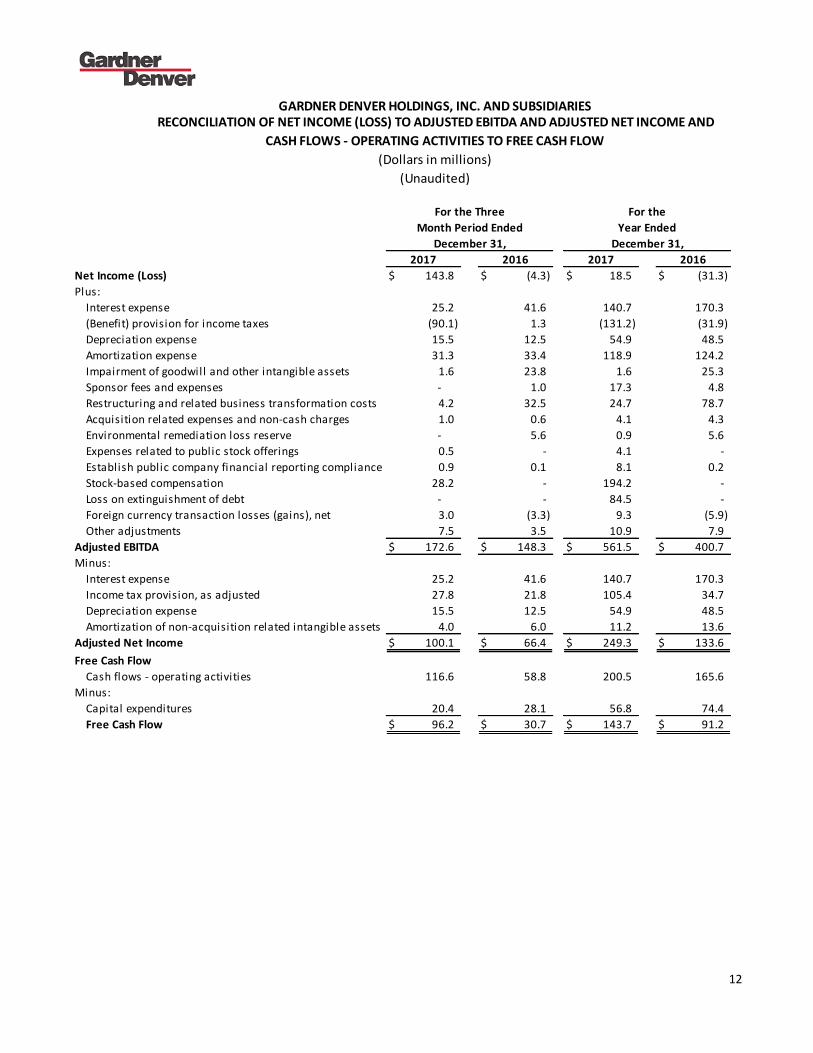
2017 2016 2017 2016
Net Income (Loss) 143.8$ (4.3)$ 18.5$ (31.3)$
Plus:
Interest expense 25.2 41.6 140.7 170.3
(Benefit) provision for income taxes (90.1) 1.3 (131.2) (31.9)
Depreciation expense 15.5 12.5 54.9 48.5
Amortization expense 31.3 33.4 118.9 124.2
Impairment of goodwill and other intangible assets 1.6 23.8 1.6 25.3
Sponsor fees and expenses - 1.0 17.3 4.8
Restructuring and related business transformation costs 4.2 32.5 24.7 78.7
Acquisition related expenses and non-cash charges 1.0 0.6 4.1 4.3
Environmental remediation loss reserve - 5.6 0.9 5.6
Expenses related to public stock offerings 0.5 - 4.1 -
Establish public company financial reporting compliance 0.9 0.1 8.1 0.2
Stock-based compensation 28.2 - 194.2 -
Loss on extinguishment of debt - - 84.5 -
Foreign currency transaction losses (gains), net 3.0 (3.3) 9.3 (5.9)
Other adjustments 7.5 3.5 10.9 7.9
Adjusted EBITDA 172.6$ 148.3$ 561.5$ 400.7$
Minus:
Interest expense 25.2 41.6 140.7 170.3
Income tax provision, as adjusted 27.8 21.8 105.4 34.7
Depreciation expense 15.5 12.5 54.9 48.5
Amortization of non-acquisition related intangible assets 4.0 6.0 11.2 13.6
Adjusted Net Income 100.1$ 66.4$ 249.3$ 133.6$
Free Cash Flow
Cash flows - operating activities 116.6 58.8 200.5 165.6
Minus:
Capital expenditures 20.4 28.1 56.8 74.4
Free Cash Flow 96.2$ 30.7$ 143.7$ 91.2$
Month Period Ended Year Ended
December 31, December 31,
For the Three For the
GARDNER DENVER HOLDINGS, INC. AND SUBSIDIARIES RECONCILIATION OF NET INCOME (LOSS) TO ADJUSTED EBITDA AND ADJUSTED NET INCOME AND
CASH FLOWS - OPERATING ACTIVITIES TO FREE CASH FLOW
(Dollars in millions)
(Unaudited)
13
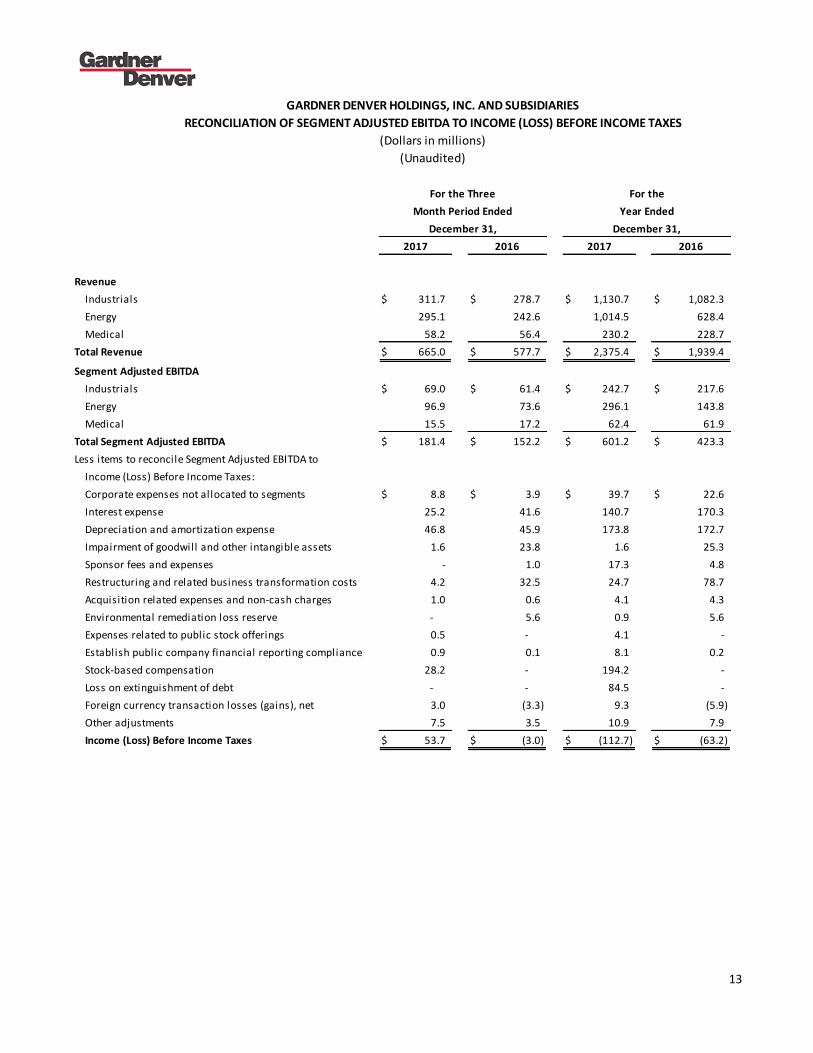
2017 2016 2017 2016
Revenue
Industrials 311.7$ 278.7$ 1,130.7$ 1,082.3$
Energy 295.1 242.6 1,014.5 628.4
Medical 58.2 56.4 230.2 228.7
Total Revenue 665.0$ 577.7$ 2,375.4$ 1,939.4$
Segment Adjusted EBITDA
Industrials 69.0$ 61.4$ 242.7$ 217.6$
Energy 96.9 73.6 296.1 143.8
Medical 15.5 17.2 62.4 61.9
Total Segment Adjusted EBITDA 181.4$ 152.2$ 601.2$ 423.3$
Less items to reconcile Segment Adjusted EBITDA to
Income (Loss) Before Income Taxes:
Corporate expenses not allocated to segments 8.8$ 3.9$ 39.7$ 22.6$
Interest expense 25.2 41.6 140.7 170.3
Depreciation and amortization expense 46.8 45.9 173.8 172.7
Impairment of goodwill and other intangible assets 1.6 23.8 1.6 25.3
Sponsor fees and expenses - 1.0 17.3 4.8
Restructuring and related business transformation costs 4.2 32.5 24.7 78.7
Acquisition related expenses and non-cash charges 1.0 0.6 4.1 4.3
Environmental remediation loss reserve - 5.6 0.9 5.6
Expenses related to public stock offerings 0.5 - 4.1 -
Establish public company financial reporting compliance 0.9 0.1 8.1 0.2
Stock-based compensation 28.2 - 194.2 -
Loss on extinguishment of debt - - 84.5 -
Foreign currency transaction losses (gains), net 3.0 (3.3) 9.3 (5.9)
Other adjustments 7.5 3.5 10.9 7.9
Income (Loss) Before Income Taxes 53.7$ (3.0)$ (112.7)$ (63.2)$
Month Period Ended Year Ended
December 31, December 31,
For the Three For the
GARDNER DENVER HOLDINGS, INC. AND SUBSIDIARIES
RECONCILIATION OF SEGMENT ADJUSTED EBITDA TO INCOME (LOSS) BEFORE INCOME TAXES
(Dollars in millions)
(Unaudited)