Embed Size (px)
Citation preview
Gardner DenverInvestor PresentationJune 2017
Disclaimer
Forward-Looking Statements
During the course of this presentation, we may make “forward-looking statements” within themeaning of the US federal securities laws. In fact, all statements made during this presentation otherthan statements of historical fact are forward-looking statements. Words such as “expects,”“anticipates,” “believes,” “estimates,” “plans,” “intends,” “projects” and “indicates” and variations ofsuch words or similar expressions are intended to identify forward-looking statements. Although theyreflect our current expectations, these statements are not guarantees of future performance, andactual results may differ materially from what is expressed in or indicated by these forward-lookingstatements. Forward-looking statements are subject to risks and uncertainties that could causeactual performance or results to differ materially from those expressed in such forward-lookingstatements, including those risks and uncertainties described under the section titled “Risk Factors”in our prospectus dated May 11, 2017, filed with Securities and Exchange Commission (“SEC”) onMay 15, 2017, which risks and uncertainties may be updated from time to time in our periodic filingswith the SEC (accessible on the SEC’s website at www.sec.gov). Forward-looking statements speakonly as of the date the statements are made. The Company does not undertake to update anyforward-looking statements as a result of future developments or new information, except asrequired by law.
Non-GAAP Financial Measures
Included in this presentation are certain non-GAAP financial measures designed to supplement, andnot substitute, the financial information presented in accordance with generally accepted accountingprinciples in the United States of America because management believes such measures are usefulto investors. Examples of non-GAAP measures include Adjusted EBITDA and Unlevered Free CashFlow. For a reconciliation of these non-GAAP measures refer to "Adjusted EBITDA Reconciliation"and “Unlevered Free Cash Flow Conversion Reconciliation” in the Appendix.
2
Company Overview & Strategy
Gardner Denver Today
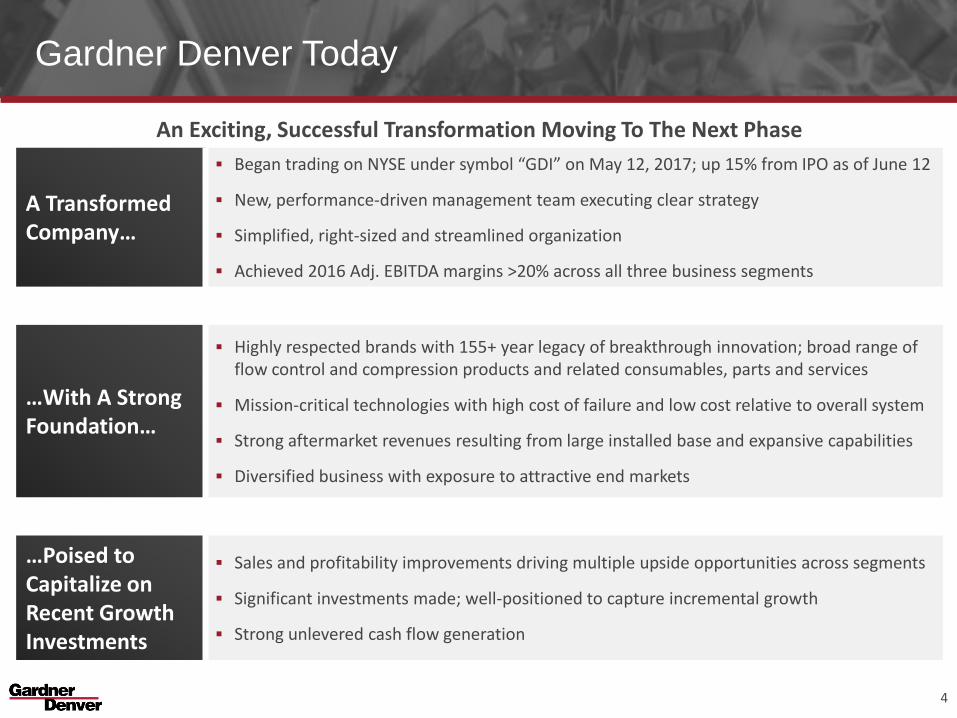
An Exciting, Successful Transformation Moving To The Next Phase
A Transformed Company…
Began trading on NYSE under symbol “GDI” on May 12, 2017; up 15% from IPO as of June 12
New, performance-driven management team executing clear strategy
Simplified, right-sized and streamlined organization
Achieved 2016 Adj. EBITDA margins >20% across all three business segments
…With A Strong Foundation…
Highly respected brands with 155+ year legacy of breakthrough innovation; broad range of flow control and compression products and related consumables, parts and services
Mission-critical technologies with high cost of failure and low cost relative to overall system
Strong aftermarket revenues resulting from large installed base and expansive capabilities
Diversified business with exposure to attractive end markets
…Poised to Capitalize on Recent Growth Investments
Sales and profitability improvements driving multiple upside opportunities across segments
Significant investments made; well-positioned to capture incremental growth
Strong unlevered cash flow generation
4
Americas41%
EMEA41%
APAC18%
Industrials56%
Energy32%
Medical12%
Company Snapshot
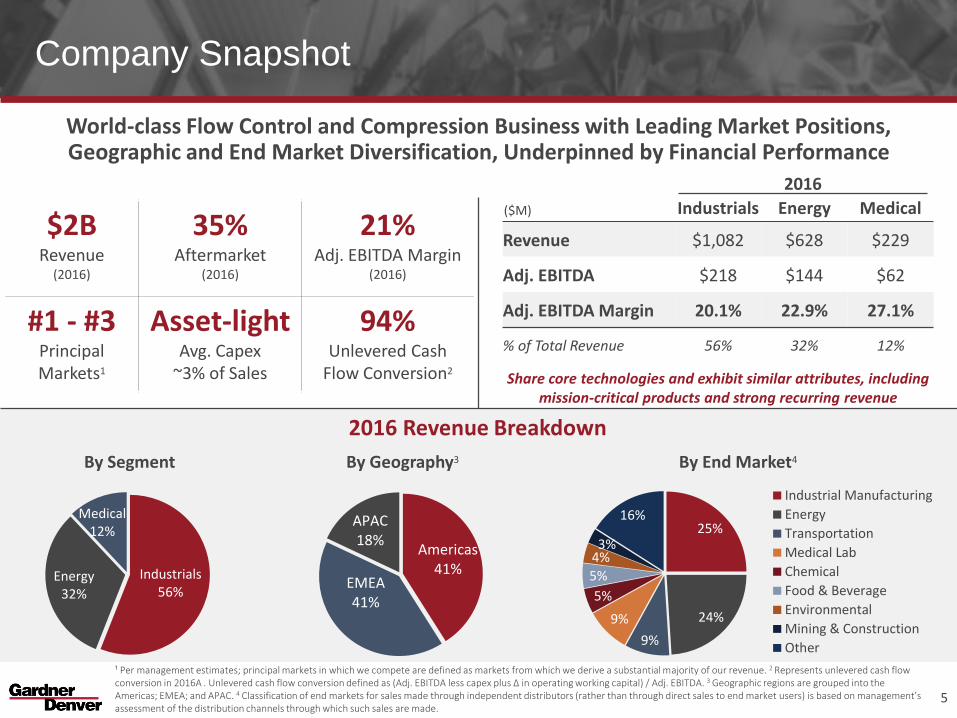
World-class Flow Control and Compression Business with Leading Market Positions, Geographic and End Market Diversification, Underpinned by Financial Performance
25%
24%
9%
9%
5%
5%
4%3%
16%
Industrial Manufacturing
Energy
Transportation
Medical Lab
Chemical
Food & Beverage
Environmental
Mining & Construction
Other
By Geography3By Segment By End Market4
$2BRevenue
(2016)
35%Aftermarket
(2016)
21%Adj. EBITDA Margin
(2016)
#1 - #3PrincipalMarkets1
Asset-lightAvg. Capex
~3% of Sales
94%Unlevered Cash
Flow Conversion2
($M) Industrials Energy Medical
Revenue $1,082 $628 $229
Adj. EBITDA $218 $144 $62
Adj. EBITDA Margin 20.1% 22.9% 27.1%
% of Total Revenue 56% 32% 12%
Share core technologies and exhibit similar attributes, including mission-critical products and strong recurring revenue
2016 Revenue Breakdown
¹ Per management estimates; principal markets in which we compete are defined as markets from which we derive a substantial majority of our revenue. 2 Represents unlevered cash flow conversion in 2016A . Unlevered cash flow conversion defined as (Adj. EBITDA less capex plus ∆ in operating working capital) / Adj. EBITDA. 3 Geographic regions are grouped into the Americas; EMEA; and APAC. 4 Classification of end markets for sales made through independent distributors (rather than through direct sales to end market users) is based on management’s assessment of the distribution channels through which such sales are made.
5
2016
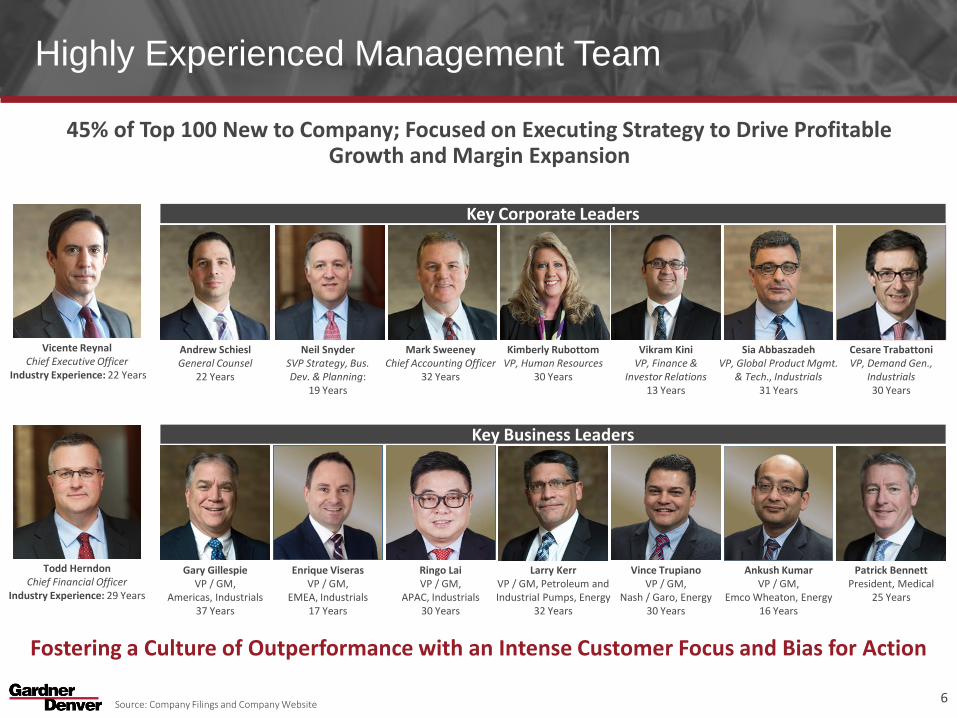
Highly Experienced Management Team
Fostering a Culture of Outperformance with an Intense Customer Focus and Bias for Action
45% of Top 100 New to Company; Focused on Executing Strategy to Drive Profitable Growth and Margin Expansion
6Source: Company Filings and Company Website
Cesare TrabattoniVP, Demand Gen.,
Industrials30 Years
Key Corporate Leaders
Vicente ReynalChief Executive Officer
Industry Experience: 22 Years
Todd HerndonChief Financial Officer
Industry Experience: 29 Years
Andrew SchieslGeneral Counsel
22 Years
Vikram KiniVP, Finance &
Investor Relations13 Years
Mark SweeneyChief Accounting Officer
32 Years
Kimberly RubottomVP, Human Resources
30 Years
Sia AbbaszadehVP, Global Product Mgmt.
& Tech., Industrials31 Years
Neil SnyderSVP Strategy, Bus. Dev. & Planning:
19 Years
Key Business Leaders
Larry KerrVP / GM, Petroleum andIndustrial Pumps, Energy
32 Years
Patrick BennettPresident, Medical
25 Years
Enrique ViserasVP / GM,
EMEA, Industrials17 Years
Gary GillespieVP / GM,
Americas, Industrials37 Years
Vince TrupianoVP / GM,
Nash / Garo, Energy30 Years
Ankush KumarVP / GM,
Emco Wheaton, Energy16 Years
Ringo LaiVP / GM,
APAC, Industrials 30 Years
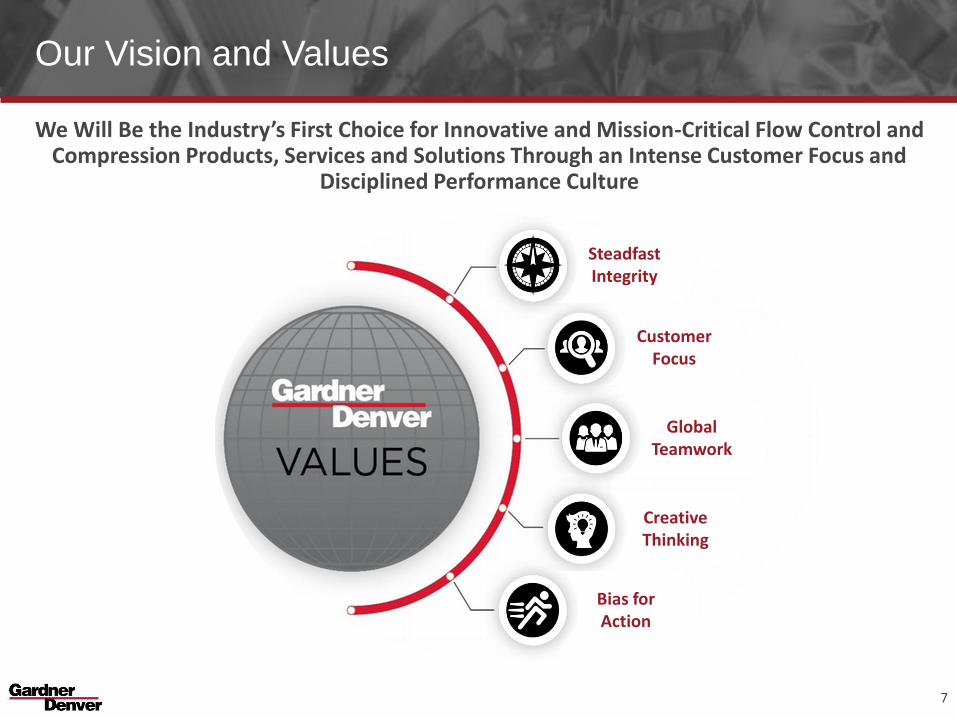
Our Vision and Values
We Will Be the Industry’s First Choice for Innovative and Mission-Critical Flow Control and Compression Products, Services and Solutions Through an Intense Customer Focus and
Disciplined Performance Culture
Customer Focus
Steadfast Integrity
Global Teamwork
Creative Thinking
Bias for Action
7
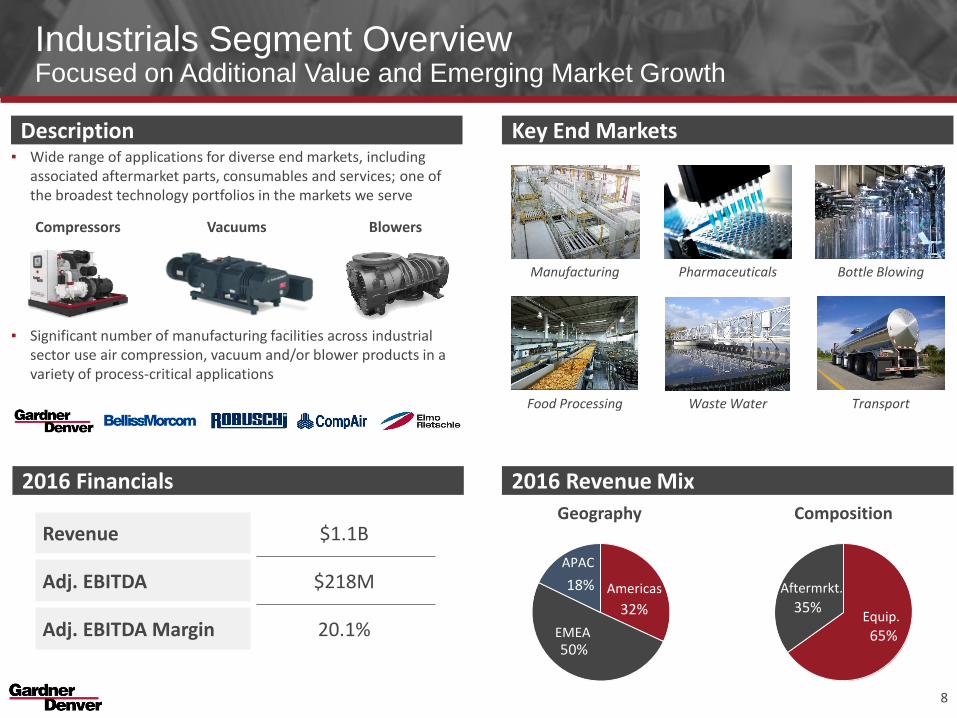
Industrials Segment OverviewFocused on Additional Value and Emerging Market Growth
▪ Wide range of applications for diverse end markets, including associated aftermarket parts, consumables and services; one of the broadest technology portfolios in the markets we serve
▪ Significant number of manufacturing facilities across industrial sector use air compression, vacuum and/or blower products in a variety of process-critical applications
Revenue $1.1B
Adj. EBITDA $218M
Adj. EBITDA Margin 20.1% 65%
35%
Composition
32%
50%
18%
Geography
Description
2016 Revenue Mix2016 Financials
Manufacturing Pharmaceuticals Bottle Blowing
Food Processing Waste Water Transport
Key End Markets
Compressors Vacuums Blowers
Americas
EMEA
APAC
Equip.
Aftermrkt.
8
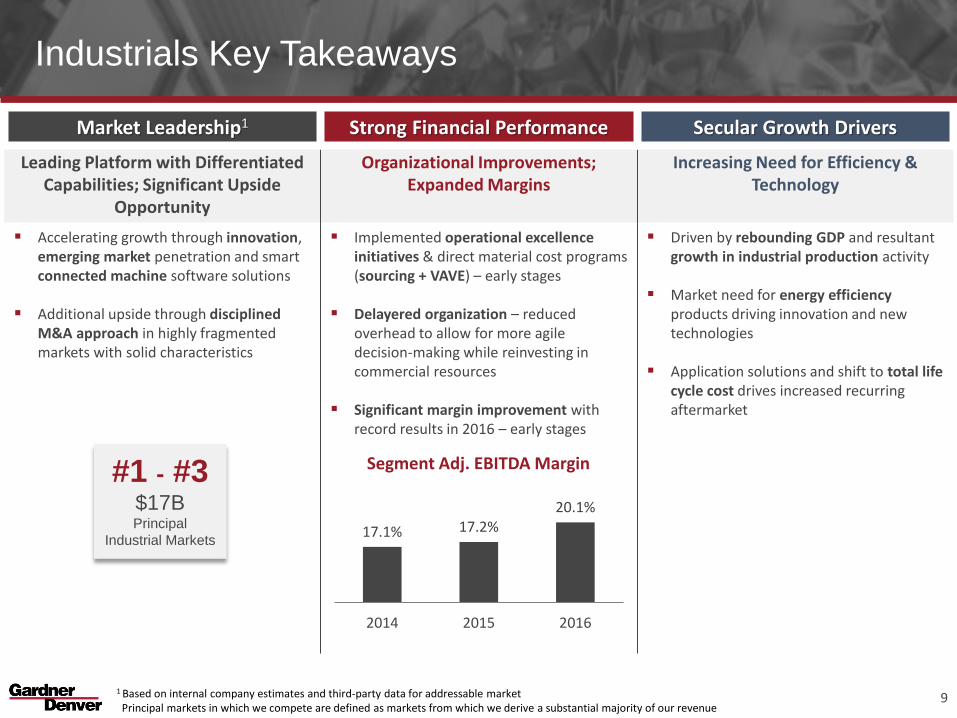
Market Leadership1 Strong Financial Performance Secular Growth Drivers
Leading Platform with Differentiated Capabilities; Significant Upside
Opportunity
Organizational Improvements; Expanded Margins
Increasing Need for Efficiency & Technology
Accelerating growth through innovation, emerging market penetration and smart connected machine software solutions
Additional upside through disciplined M&A approach in highly fragmented markets with solid characteristics
Implemented operational excellence initiatives & direct material cost programs (sourcing + VAVE) – early stages
Delayered organization – reduced overhead to allow for more agile decision-making while reinvesting in commercial resources
Significant margin improvement with record results in 2016 – early stages
Driven by rebounding GDP and resultant growth in industrial production activity
Market need for energy efficiency products driving innovation and new technologies
Application solutions and shift to total life cycle cost drives increased recurring aftermarket
Industrials Key Takeaways
91 Based on internal company estimates and third-party data for addressable marketPrincipal markets in which we compete are defined as markets from which we derive a substantial majority of our revenue
17.1% 17.2%20.1%
2014 2015 2016
Segment Adj. EBITDA Margin#1 - #3$17BPrincipal
Industrial Markets
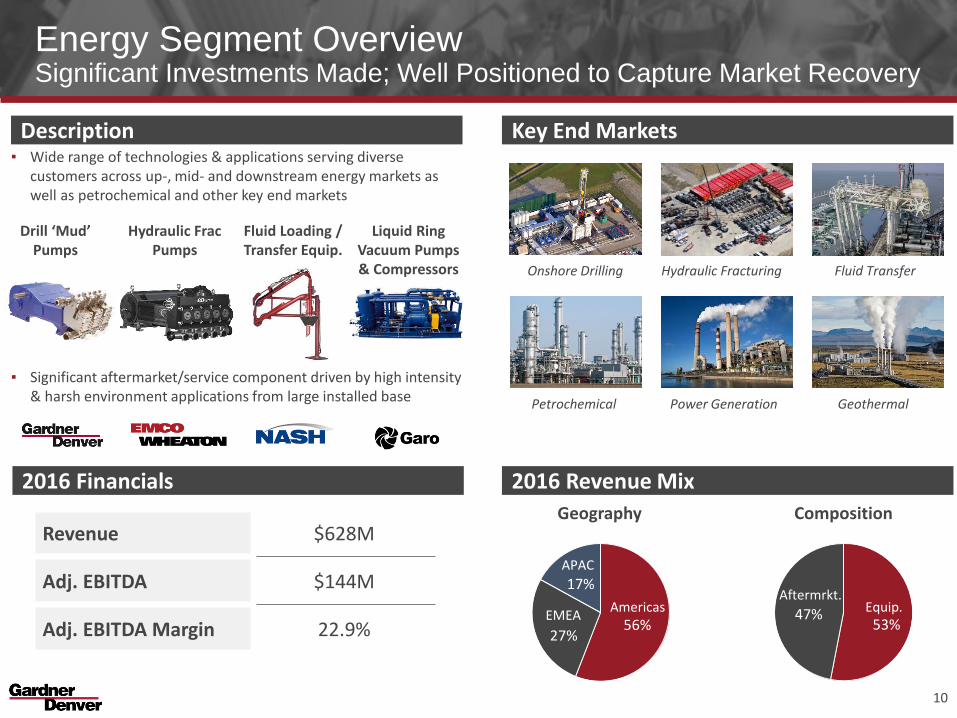
▪ Wide range of technologies & applications serving diverse customers across up-, mid- and downstream energy markets as well as petrochemical and other key end markets
▪ Significant aftermarket/service component driven by high intensity & harsh environment applications from large installed base
Drill ‘Mud’ Pumps
Energy Segment Overview Significant Investments Made; Well Positioned to Capture Market Recovery
Revenue $628M
Adj. EBITDA $144M
Adj. EBITDA Margin 22.9%
Description
2016 Revenue Mix2016 Financials
Key End Markets
Liquid Ring Vacuum Pumps & Compressors
Fluid Loading / Transfer Equip.
Hydraulic Frac Pumps
53%47%
Composition
56%27%
17%
Geography
AmericasEMEA
APAC
Equip.Aftermrkt.
Onshore Drilling Hydraulic Fracturing
Petrochemical Power Generation
Fluid Transfer
Geothermal
10
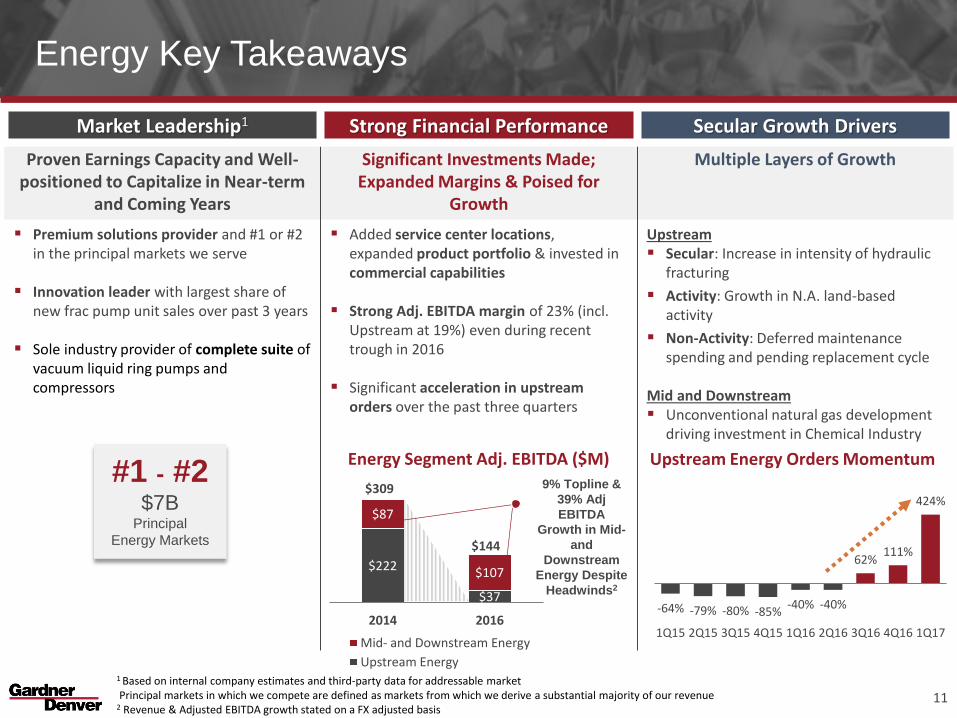
Market Leadership1 Strong Financial Performance Secular Growth Drivers
Proven Earnings Capacity and Well-positioned to Capitalize in Near-term
and Coming Years
Significant Investments Made; Expanded Margins & Poised for
Growth
Multiple Layers of Growth
Premium solutions provider and #1 or #2 in the principal markets we serve
Innovation leader with largest share of new frac pump unit sales over past 3 years
Sole industry provider of complete suite of vacuum liquid ring pumps and compressors
Added service center locations, expanded product portfolio & invested in commercial capabilities
Strong Adj. EBITDA margin of 23% (incl. Upstream at 19%) even during recent trough in 2016
Significant acceleration in upstream orders over the past three quarters
Upstream Secular: Increase in intensity of hydraulic
fracturing
Activity: Growth in N.A. land-based activity
Non-Activity: Deferred maintenance spending and pending replacement cycle
Mid and Downstream Unconventional natural gas development
driving investment in Chemical Industry
Energy Key Takeaways
11
-64% -79% -80% -85%-40% -40%
62%111%
424%
1Q15 2Q15 3Q15 4Q15 1Q16 2Q16 3Q16 4Q16 1Q17
Upstream Energy Orders Momentum
$222
$37
$87
$107
2014 2016
Mid- and Downstream Energy
Upstream Energy
$309
$144
Energy Segment Adj. EBITDA ($M)
9% Topline &
39% Adj
EBITDA
Growth in Mid-
and
Downstream
Energy Despite
Headwinds2
#1 - #2$7B
Principal
Energy Markets
1 Based on internal company estimates and third-party data for addressable marketPrincipal markets in which we compete are defined as markets from which we derive a substantial majority of our revenue
2 Revenue & Adjusted EBITDA growth stated on a FX adjusted basis
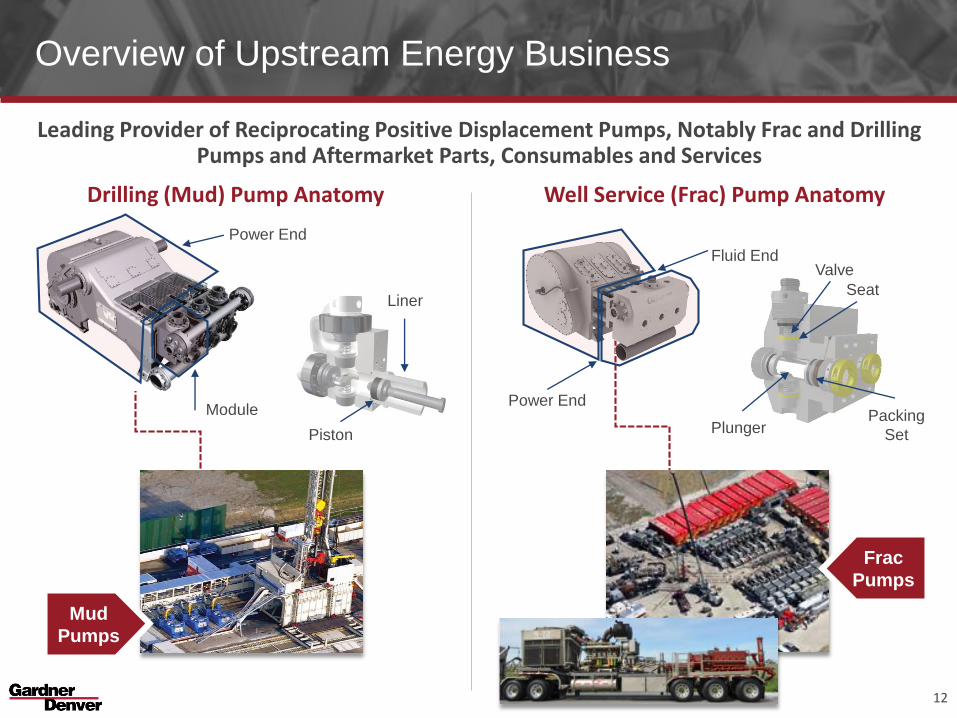
Overview of Upstream Energy Business
Leading Provider of Reciprocating Positive Displacement Pumps, Notably Frac and Drilling Pumps and Aftermarket Parts, Consumables and Services
12
Well Service (Frac) Pump Anatomy
Fluid End
Power End
Valve
Seat
Packing
SetPlunger
Drilling (Mud) Pump Anatomy
Module
Liner
Piston
Power End
Mud
Pumps
Frac
Pumps
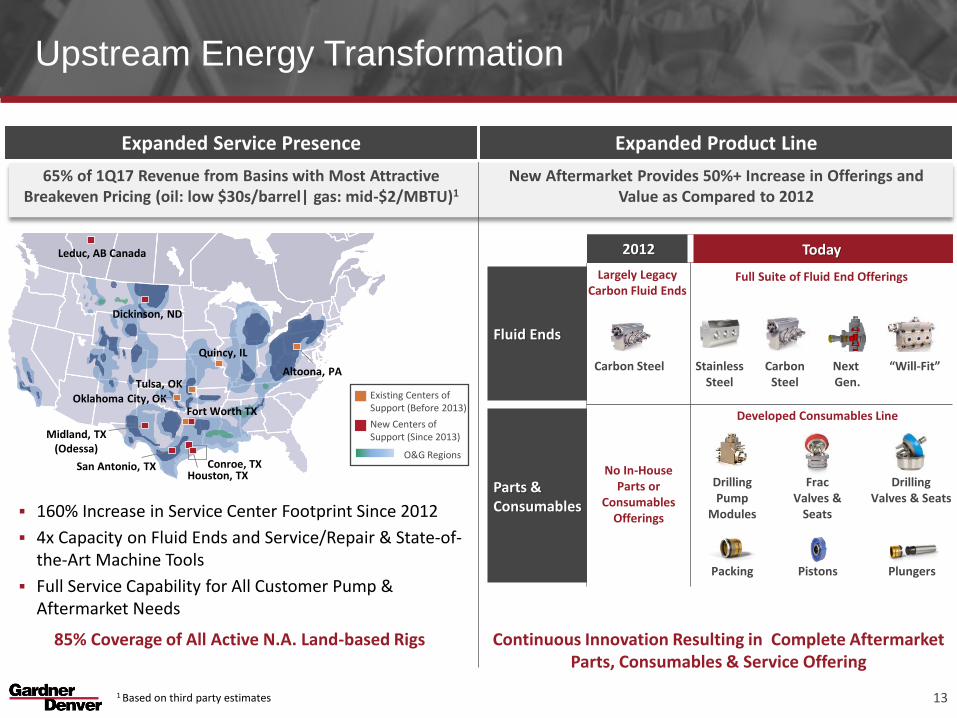
Expanded Service Presence Expanded Product Line
65% of 1Q17 Revenue from Basins with Most Attractive Breakeven Pricing (oil: low $30s/barrel| gas: mid-$2/MBTU)1
New Aftermarket Provides 50%+ Increase in Offerings and Value as Compared to 2012
Upstream Energy Transformation
13
160% Increase in Service Center Footprint Since 2012
4x Capacity on Fluid Ends and Service/Repair & State-of-the-Art Machine Tools
Full Service Capability for All Customer Pump & Aftermarket Needs
2012 Today
Fluid Ends
Full Suite of Fluid End Offerings
Parts &Consumables
No In-House Parts or
Consumables Offerings
Developed Consumables Line
Carbon Steel StainlessSteel
CarbonSteel
Next Gen.
“Will-Fit”
Drilling Pump
Modules
Frac Valves &
Seats
Pistons
Drilling Valves & Seats
Packing Plungers
Continuous Innovation Resulting in Complete Aftermarket Parts, Consumables & Service Offering
85% Coverage of All Active N.A. Land-based Rigs
Tulsa, OK
Conroe, TX
Fort Worth TX
Quincy, IL
Midland, TX(Odessa)
San Antonio, TXHouston, TX
Oklahoma City, OK
Dickinson, ND
Leduc, AB Canada
Altoona, PA
Existing Centers of Support (Before 2013)
New Centers of Support (Since 2013)
O&G Regions
Largely Legacy Carbon Fluid Ends
1 Based on third party estimates
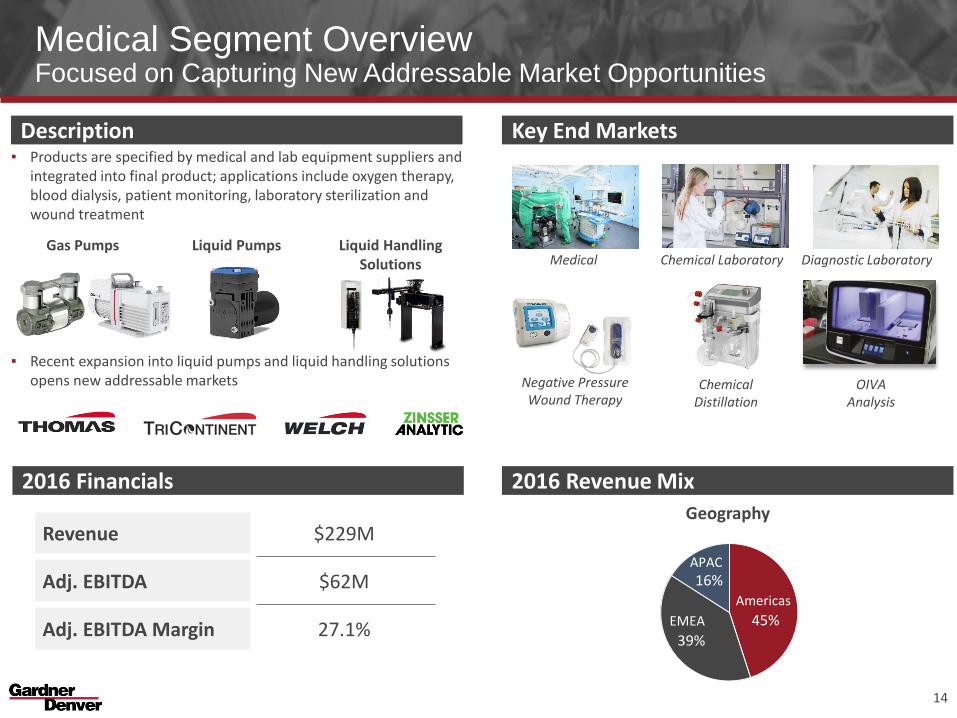
Medical Segment OverviewFocused on Capturing New Addressable Market Opportunities
▪ Products are specified by medical and lab equipment suppliers and integrated into final product; applications include oxygen therapy, blood dialysis, patient monitoring, laboratory sterilization and wound treatment
▪ Recent expansion into liquid pumps and liquid handling solutions opens new addressable markets
Revenue $229M
Adj. EBITDA $62M
Adj. EBITDA Margin 27.1%
Description Key End Markets
Medical
Negative Pressure Wound Therapy
Chemical Laboratory
Chemical Distillation
Diagnostic Laboratory
OIVA Analysis
Gas Pumps Liquid Pumps Liquid Handling Solutions
45%
39%
16%
Geography
Americas
EMEA
APAC
14
2016 Revenue Mix2016 Financials
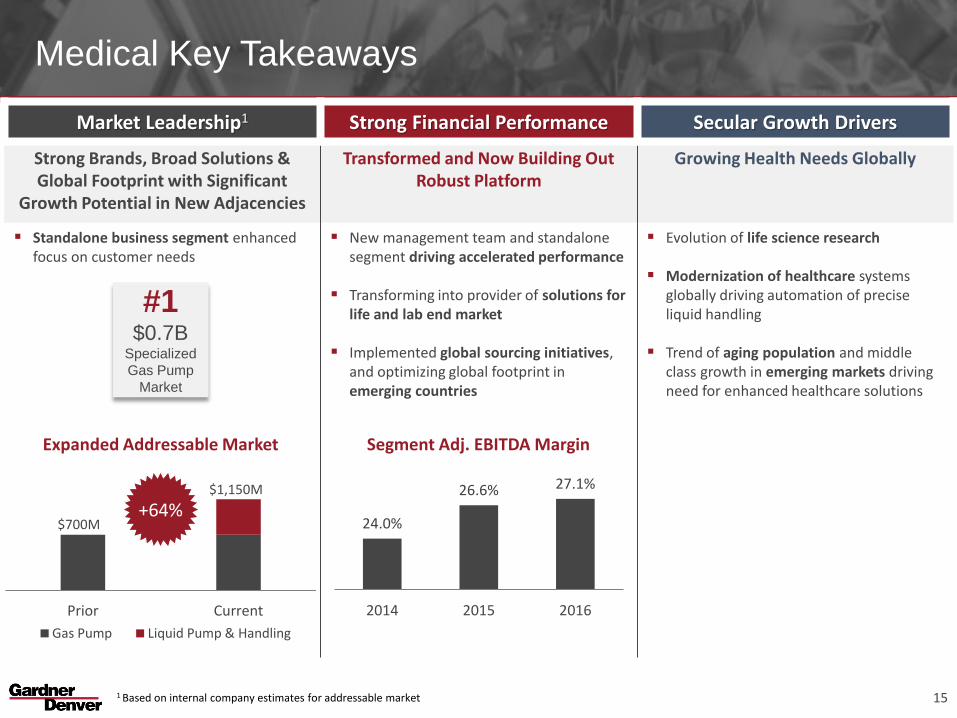
Market Leadership1 Strong Financial Performance Secular Growth Drivers
Strong Brands, Broad Solutions & Global Footprint with Significant
Growth Potential in New Adjacencies
Transformed and Now Building Out Robust Platform
Growing Health Needs Globally
Standalone business segment enhanced focus on customer needs
New management team and standalone segment driving accelerated performance
Transforming into provider of solutions for life and lab end market
Implemented global sourcing initiatives, and optimizing global footprint in emerging countries
Evolution of life science research
Modernization of healthcare systems globally driving automation of precise liquid handling
Trend of aging population and middle class growth in emerging markets driving need for enhanced healthcare solutions
Medical Key Takeaways
15
24.0%
26.6% 27.1%
2014 2015 2016
Segment Adj. EBITDA Margin
Prior Current
Gas Pump Liquid Pump & Handling
$700M
$1,150M
+64%
Expanded Addressable Market
#1$0.7B
Specialized
Gas Pump
Market
1 Based on internal company estimates for addressable market
Our Strategy Will Continue to Drive Results and Shareholder Value
16
Deploy Talent
Expand Margins
Accelerate Growth
Allocate Capital Effectively
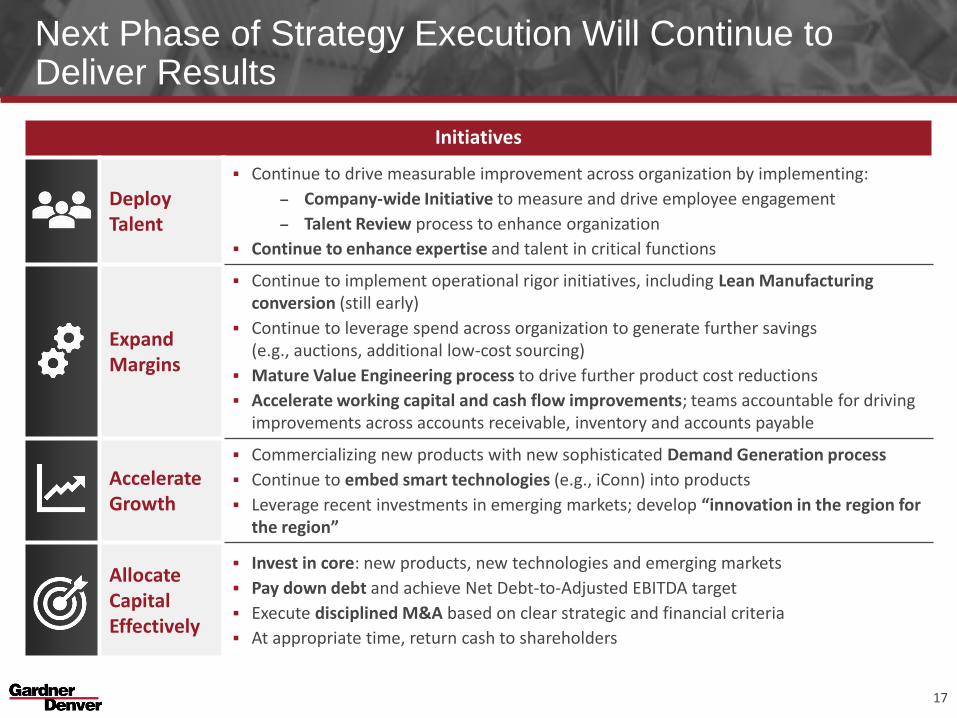
Next Phase of Strategy Execution Will Continue to Deliver Results
Initiatives
Deploy Talent
Continue to drive measurable improvement across organization by implementing:
– Company-wide Initiative to measure and drive employee engagement
– Talent Review process to enhance organization
Continue to enhance expertise and talent in critical functions
Expand Margins
Continue to implement operational rigor initiatives, including Lean Manufacturing conversion (still early)
Continue to leverage spend across organization to generate further savings (e.g., auctions, additional low-cost sourcing)
Mature Value Engineering process to drive further product cost reductions
Accelerate working capital and cash flow improvements; teams accountable for driving improvements across accounts receivable, inventory and accounts payable
Accelerate Growth
Commercializing new products with new sophisticated Demand Generation process
Continue to embed smart technologies (e.g., iConn) into products
Leverage recent investments in emerging markets; develop “innovation in the region for the region”
Allocate Capital Effectively
Invest in core: new products, new technologies and emerging markets
Pay down debt and achieve Net Debt-to-Adjusted EBITDA target
Execute disciplined M&A based on clear strategic and financial criteria
At appropriate time, return cash to shareholders
17
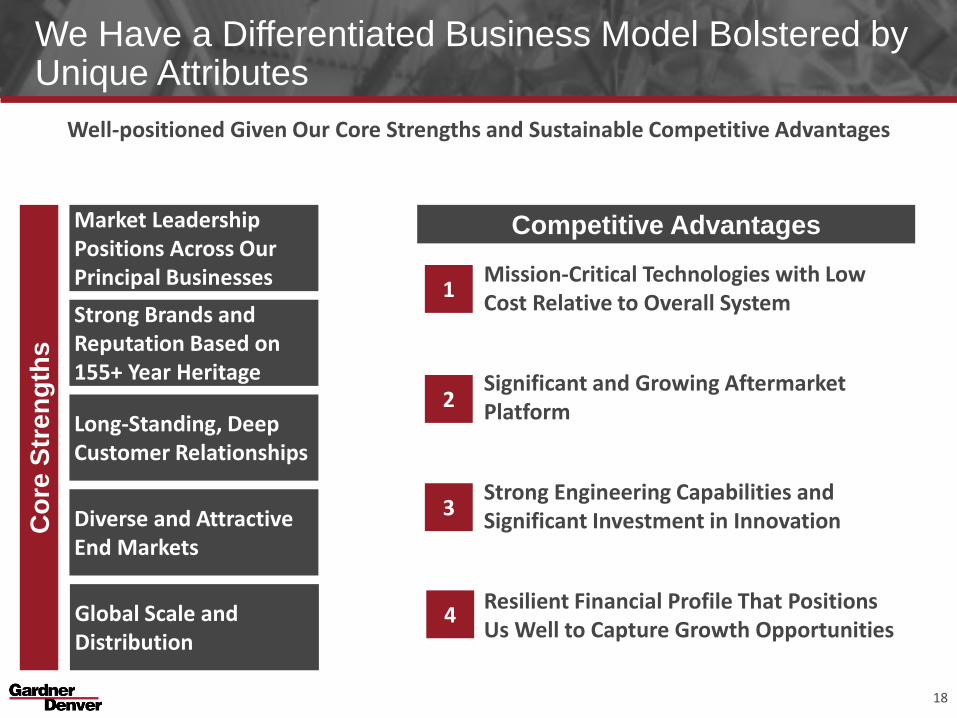
We Have a Differentiated Business Model Bolstered by Unique Attributes
Well-positioned Given Our Core Strengths and Sustainable Competitive Advantages
Co
re S
tre
ng
ths
Market Leadership Positions Across Our Principal Businesses
Strong Brands and Reputation Based on 155+ Year Heritage
Long-Standing, Deep Customer Relationships
Diverse and Attractive End Markets
Global Scale and Distribution
Competitive Advantages
Mission-Critical Technologies with Low Cost Relative to Overall System
Significant and Growing Aftermarket Platform
Strong Engineering Capabilities and Significant Investment in Innovation
Resilient Financial Profile That Positions Us Well to Capture Growth Opportunities
1
2
3
4
18
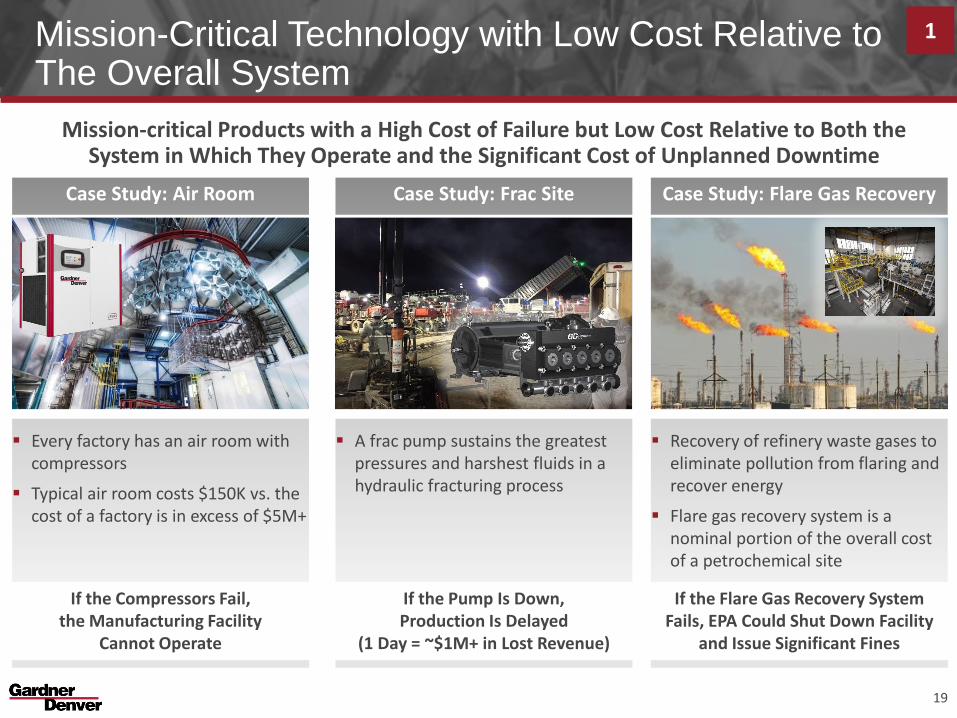
Mission-Critical Technology with Low Cost Relative to The Overall System
Mission-critical Products with a High Cost of Failure but Low Cost Relative to Both the System in Which They Operate and the Significant Cost of Unplanned Downtime
Case Study: Air Room
Every factory has an air room with compressors
Typical air room costs $150K vs. the cost of a factory is in excess of $5M+
Case Study: Frac Site
A frac pump sustains the greatest pressures and harshest fluids in a hydraulic fracturing process
Case Study: Flare Gas Recovery
Recovery of refinery waste gases to eliminate pollution from flaring and recover energy
Flare gas recovery system is a nominal portion of the overall cost of a petrochemical site
1
19
If the Flare Gas Recovery System Fails, EPA Could Shut Down Facility
and Issue Significant Fines
If the Pump Is Down, Production Is Delayed
(1 Day = ~$1M+ in Lost Revenue)
If the Compressors Fail, the Manufacturing Facility
Cannot Operate
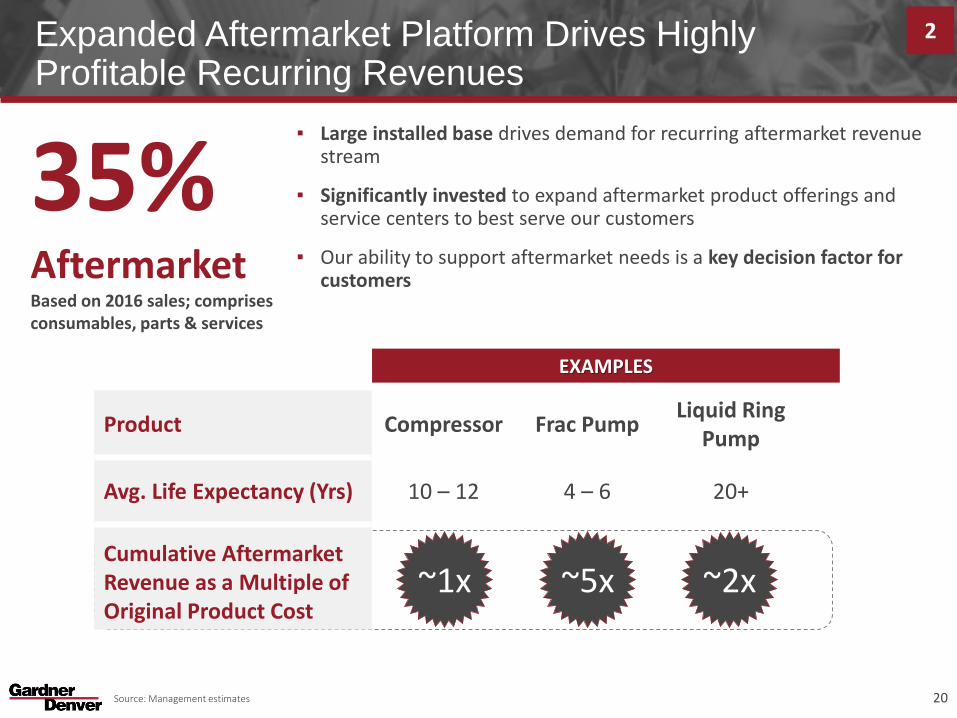
Expanded Aftermarket Platform Drives Highly Profitable Recurring Revenues
▪ Large installed base drives demand for recurring aftermarket revenue stream
▪ Significantly invested to expand aftermarket product offerings and service centers to best serve our customers
▪ Our ability to support aftermarket needs is a key decision factor for customers
Source: Management estimates
EXAMPLES
35% Aftermarket Based on 2016 sales; comprises consumables, parts & services
2
~1x ~5x ~2x
20
Product Compressor Frac PumpLiquid Ring
Pump
Avg. Life Expectancy (Yrs) 10 – 12 4 – 6 20+
Cumulative Aftermarket Revenue as a Multiple of Original Product Cost
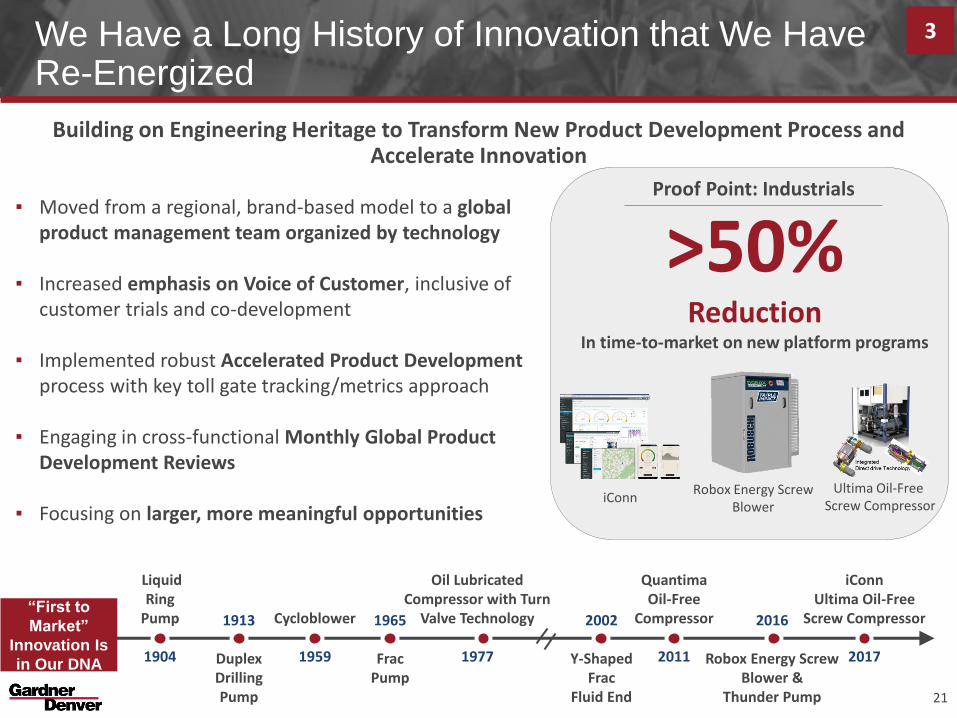
We Have a Long History of Innovation that We Have Re-Energized
Building on Engineering Heritage to Transform New Product Development Process and Accelerate Innovation
▪ Moved from a regional, brand-based model to a global product management team organized by technology
▪ Increased emphasis on Voice of Customer, inclusive of customer trials and co-development
▪ Implemented robust Accelerated Product Development process with key toll gate tracking/metrics approach
▪ Engaging in cross-functional Monthly Global Product Development Reviews
▪ Focusing on larger, more meaningful opportunities
Liquid Ring
Pump
1904
1913
Duplex Drilling Pump
Cycloblower
1959
1965
Frac Pump
“First to
Market”
Innovation Is
in Our DNA
3
2016
Robox Energy Screw Blower &
Thunder Pump
QuantimaOil-Free
Compressor
2011
iConn Ultima Oil-Free
Screw Compressor
2017
21
2002
Y-Shaped Frac
Fluid End
Oil Lubricated Compressor with Turn
Valve Technology
1977
Proof Point: Industrials
>50% Reduction
In time-to-market on new platform programs
iConnRobox Energy Screw
Blower
Ultima Oil-Free Screw Compressor
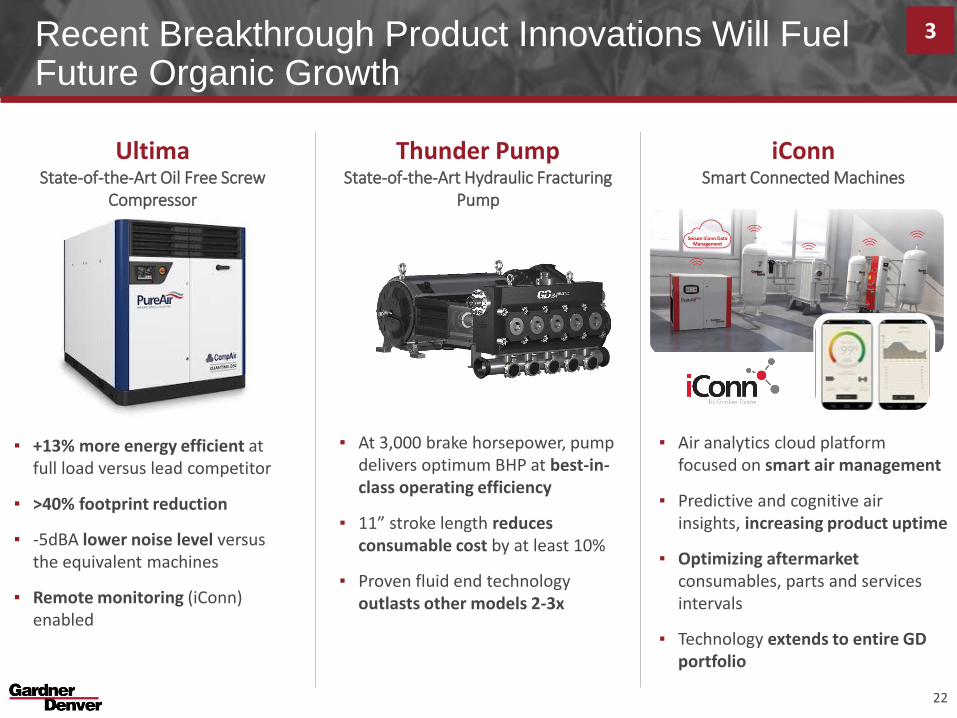
Recent Breakthrough Product Innovations Will Fuel Future Organic Growth
3
22
▪ +13% more energy efficient at full load versus lead competitor
▪ >40% footprint reduction
▪ -5dBA lower noise level versus the equivalent machines
▪ Remote monitoring (iConn) enabled
UltimaState-of-the-Art Oil Free Screw
Compressor
▪ At 3,000 brake horsepower, pump delivers optimum BHP at best-in-class operating efficiency
▪ 11” stroke length reduces consumable cost by at least 10%
▪ Proven fluid end technology outlasts other models 2-3x
Thunder PumpState-of-the-Art Hydraulic Fracturing
Pump
iConnSmart Connected Machines
▪ Air analytics cloud platform focused on smart air management
▪ Predictive and cognitive air insights, increasing product uptime
▪ Optimizing aftermarket consumables, parts and services intervals
▪ Technology extends to entire GD portfolio
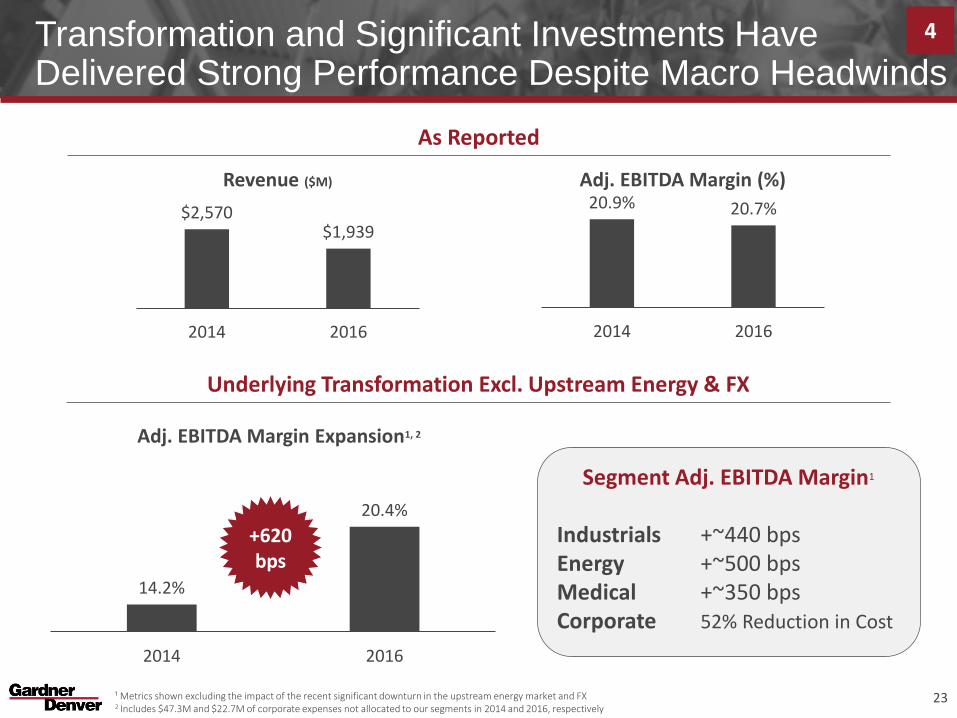
Transformation and Significant Investments Have Delivered Strong Performance Despite Macro Headwinds
$2,570$1,939
2014 2016
Revenue ($M)
20.9% 20.7%
2014 2016
Adj. EBITDA Margin (%)
14.2%
20.4%
2014 2016
Adj. EBITDA Margin Expansion1, 2
+620 bps
Segment Adj. EBITDA Margin1
Industrials +~440 bpsEnergy +~500 bpsMedical +~350 bpsCorporate 52% Reduction in Cost
As Reported
Underlying Transformation Excl. Upstream Energy & FX
23¹ Metrics shown excluding the impact of the recent significant downturn in the upstream energy market and FX2 Includes $47.3M and $22.7M of corporate expenses not allocated to our segments in 2014 and 2016, respectively
4

Financial Overview
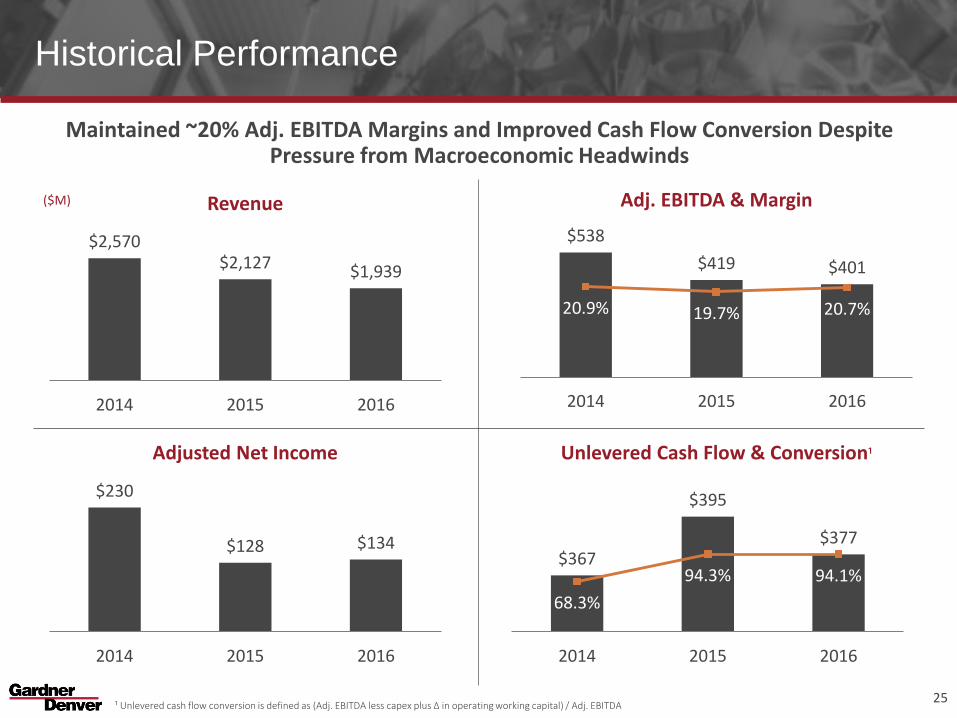
Historical Performance
Maintained ~20% Adj. EBITDA Margins and Improved Cash Flow Conversion Despite Pressure from Macroeconomic Headwinds
Adj. EBITDA & MarginRevenue
Unlevered Cash Flow & Conversion¹Adjusted Net Income
$2,570$2,127 $1,939
2014 2015 2016
$230
$128 $134
2014 2015 2016
$367
$395
$377
68.3%
94.3% 94.1%
$34 0
$35 0
$36 0
$37 0
$38 0
$39 0
$40 0
2014 2015 2016
20. 0%
40. 0%
60. 0%
80. 0%
100 .0%
120 .0%
140 .0%
$538
$419 $401
20.9% 19.7% 20.7%
$0
$10
$20
$30
$40
$50
$60
$70
$80
$90
$10 0
$11 0
$12 0
$13 0
$14 0
$15 0
$16 0
$17 0
$18 0
$19 0
$20 0
$21 0
$22 0
$23 0
$24 0
$25 0
$26 0
$27 0
$28 0
$29 0
$30 0
$31 0
$32 0
$33 0
$34 0
$35 0
$36 0
$37 0
$38 0
$39 0
$40 0
$41 0
$42 0
$43 0
$44 0
$45 0
$46 0
$47 0
$48 0
$49 0
$50 0
$51 0
$52 0
$53 0
$54 0
$55 0
$56 0
2014 2015 2016
0.0 %
5.0 %
10. 0%
15. 0%
20. 0%
25. 0%
30. 0%
($M)
25¹ Unlevered cash flow conversion is defined as (Adj. EBITDA less capex plus ∆ in operating working capital) / Adj. EBITDA
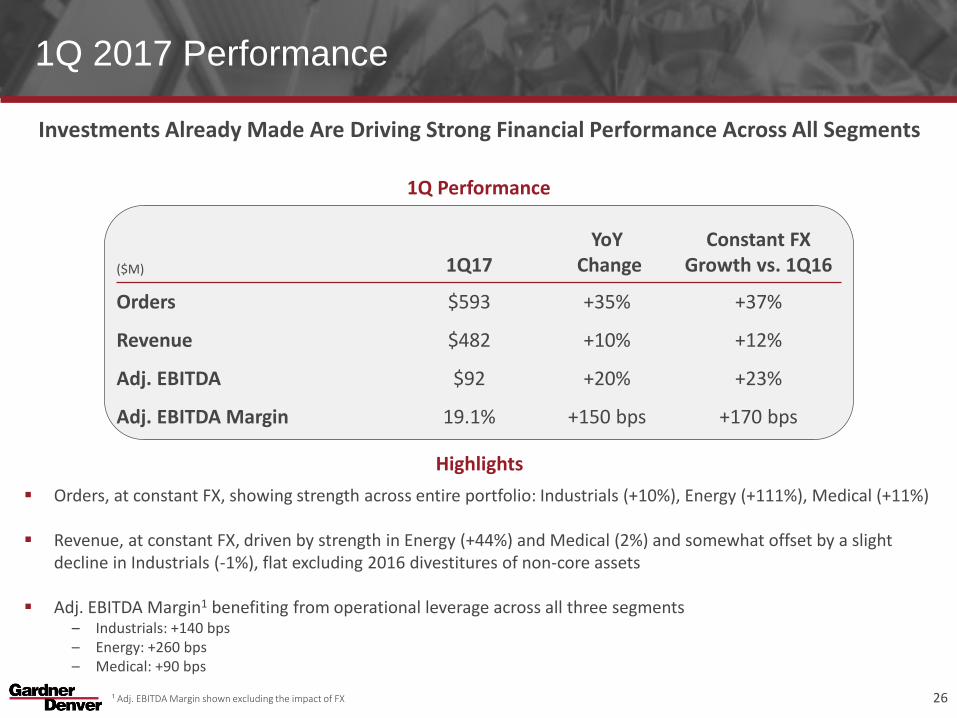
1Q 2017 Performance
Investments Already Made Are Driving Strong Financial Performance Across All Segments
1Q Performance
($M) 1Q17YoY
ChangeConstant FX
Growth vs. 1Q16
Orders $593 +35% +37%
Revenue $482 +10% +12%
Adj. EBITDA $92 +20% +23%
Adj. EBITDA Margin 19.1% +150 bps +170 bps
Highlights
Orders, at constant FX, showing strength across entire portfolio: Industrials (+10%), Energy (+111%), Medical (+11%)
Revenue, at constant FX, driven by strength in Energy (+44%) and Medical (2%) and somewhat offset by a slight decline in Industrials (-1%), flat excluding 2016 divestitures of non-core assets
Adj. EBITDA Margin1 benefiting from operational leverage across all three segments– Industrials: +140 bps – Energy: +260 bps – Medical: +90 bps
26¹ Adj. EBITDA Margin shown excluding the impact of FX
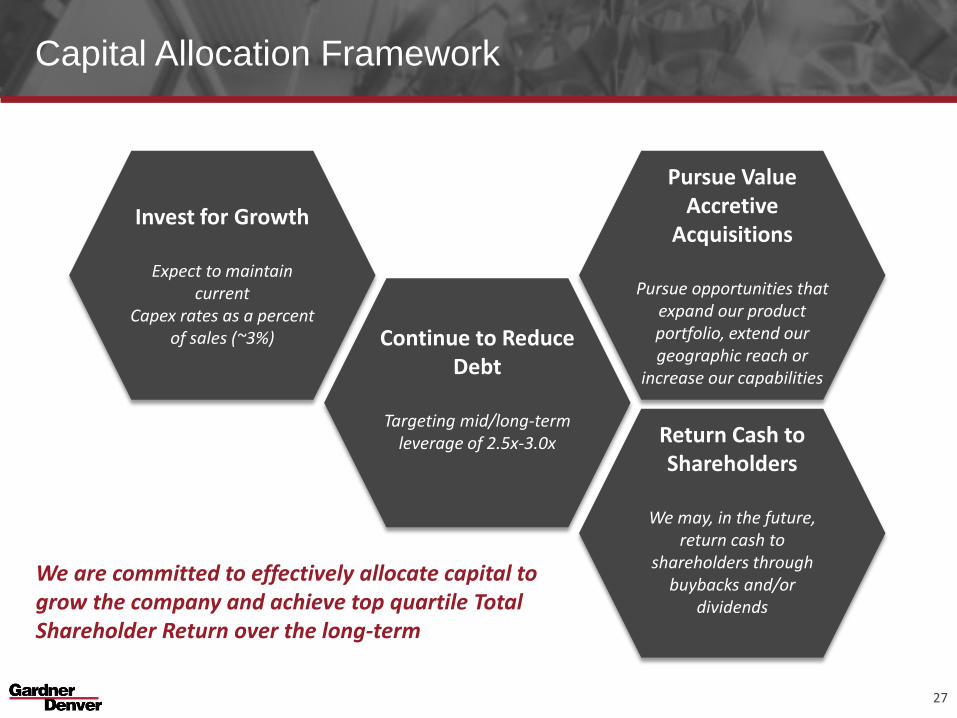
Capital Allocation Framework
We are committed to effectively allocate capital to grow the company and achieve top quartile Total Shareholder Return over the long-term
27
Invest for Growth
Expect to maintain current
Capex rates as a percent of sales (~3%) Continue to Reduce
Debt
Targeting mid/long-term leverage of 2.5x-3.0x
Pursue Value Accretive
Acquisitions
Pursue opportunities that expand our product portfolio, extend our geographic reach or
increase our capabilities
Return Cash to Shareholders
We may, in the future, return cash to
shareholders through buybacks and/or
dividends
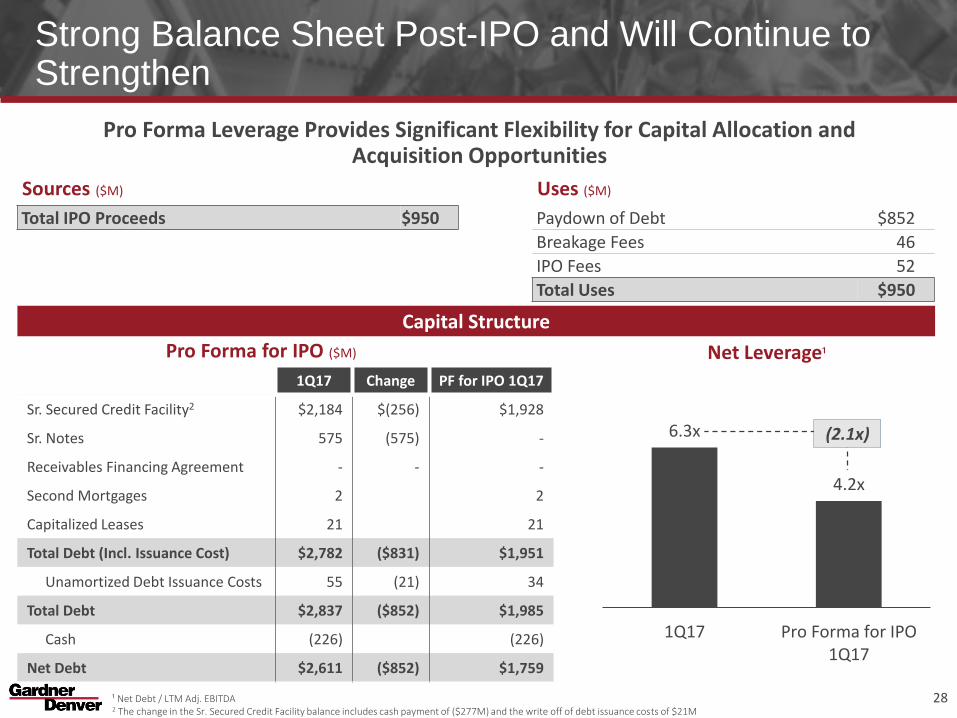
Strong Balance Sheet Post-IPO and Will Continue to Strengthen
Pro Forma Leverage Provides Significant Flexibility for Capital Allocation and Acquisition Opportunities
¹ Net Debt / LTM Adj. EBITDA2 The change in the Sr. Secured Credit Facility balance includes cash payment of ($277M) and the write off of debt issuance costs of $21M
Sources ($M)
Total IPO Proceeds $950
Uses ($M)
Paydown of Debt $852
Breakage Fees 46
IPO Fees 52
Total Uses $950
(2.1x)
Net Leverage¹
1Q17 Change PF for IPO 1Q17
Sr. Secured Credit Facility2 $2,184 $(256) $1,928
Sr. Notes 575 (575) -
Receivables Financing Agreement - - -
Second Mortgages 2 2
Capitalized Leases 21 21
Total Debt (Incl. Issuance Cost) $2,782 ($831) $1,951
Unamortized Debt Issuance Costs 55 (21) 34
Total Debt $2,837 ($852) $1,985
Cash (226) (226)
Net Debt $2,611 ($852) $1,759
Capital Structure
Pro Forma for IPO ($M)
28
6.3x
4.2x
1Q17 Pro Forma for IPO1Q17
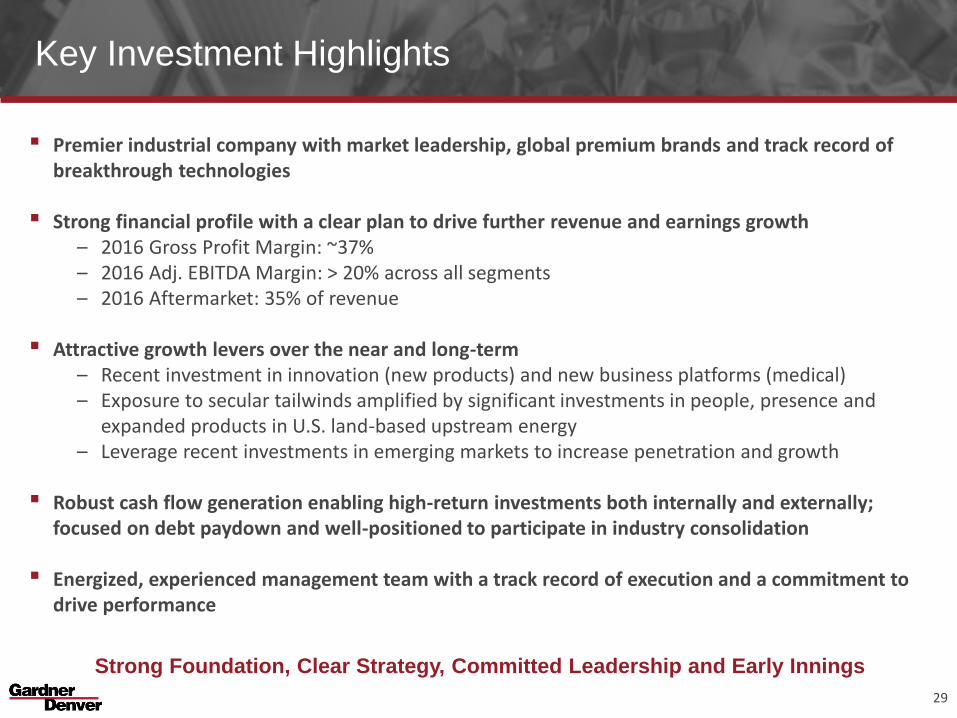
Key Investment Highlights
▪ Premier industrial company with market leadership, global premium brands and track record of breakthrough technologies
▪ Strong financial profile with a clear plan to drive further revenue and earnings growth– 2016 Gross Profit Margin: ~37% – 2016 Adj. EBITDA Margin: > 20% across all segments – 2016 Aftermarket: 35% of revenue
▪ Attractive growth levers over the near and long-term– Recent investment in innovation (new products) and new business platforms (medical)– Exposure to secular tailwinds amplified by significant investments in people, presence and
expanded products in U.S. land-based upstream energy– Leverage recent investments in emerging markets to increase penetration and growth
▪ Robust cash flow generation enabling high-return investments both internally and externally; focused on debt paydown and well-positioned to participate in industry consolidation
▪ Energized, experienced management team with a track record of execution and a commitment to drive performance
Strong Foundation, Clear Strategy, Committed Leadership and Early Innings
29

Appendix
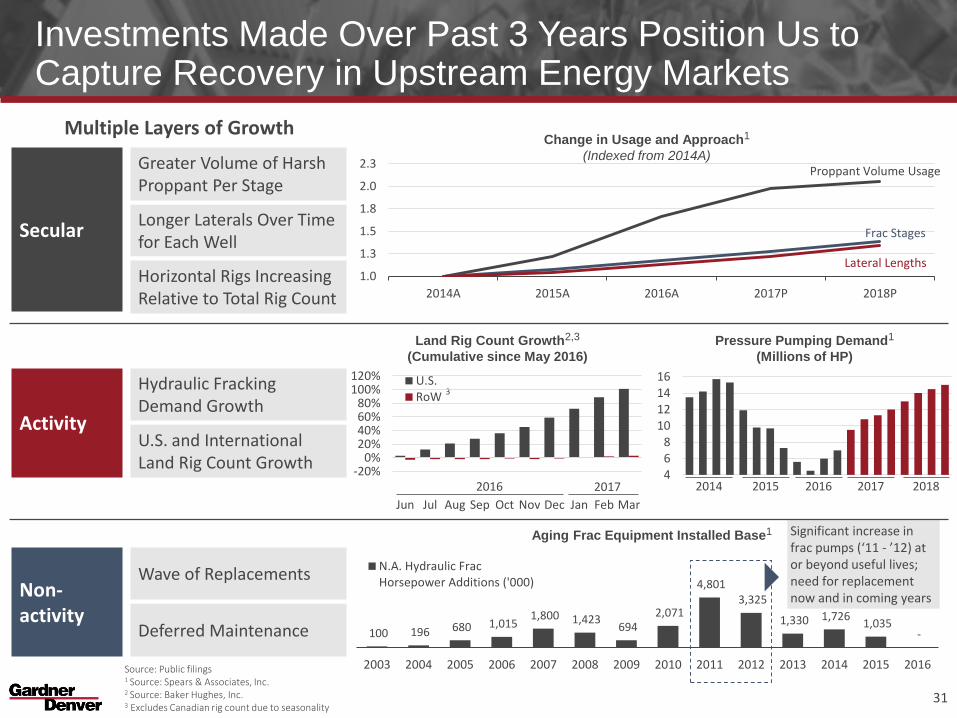
Significant increase in frac pumps (‘11 - ’12) at or beyond useful lives; need for replacement now and in coming years
Investments Made Over Past 3 Years Position Us to Capture Recovery in Upstream Energy Markets
Multiple Layers of Growth
SecularLonger Laterals Over Time for Each Well
Greater Volume of Harsh Proppant Per Stage
Horizontal Rigs Increasing Relative to Total Rig Count
ActivityU.S. and International Land Rig Count Growth
Hydraulic Fracking Demand Growth
Non-activity
Deferred Maintenance
Wave of Replacements
Land Rig Count Growth2,3
(Cumulative since May 2016)
Source: Public filings1 Source: Spears & Associates, Inc.2 Source: Baker Hughes, Inc.3 Excludes Canadian rig count due to seasonality
468
10121416
Change in Usage and Approach1
(Indexed from 2014A)
2016 2017
Pressure Pumping Demand1
(Millions of HP)
100 196 680 1,015 1,800 1,423
694 2,071
4,801 3,325
1,330 1,726 1,035
-
2003 2004 2005 2006 2007 2008 2009 2010 2011 2012 2013 2014 2015 2016
N.A. Hydraulic FracHorsepower Additions ('000)
Aging Frac Equipment Installed Base1
31
3
1.0
1.3
1.5
1.8
2.0
2.3
2014A 2015A 2016A 2017P 2018P
Lateral Lengths
Frac Stages
Proppant Volume Usage
2014 2015 2016 2017 2018-20%
0%20%40%60%80%
100%120%
Jun Jul Aug Sep Oct Nov Dec Jan Feb Mar
U.S.RoW
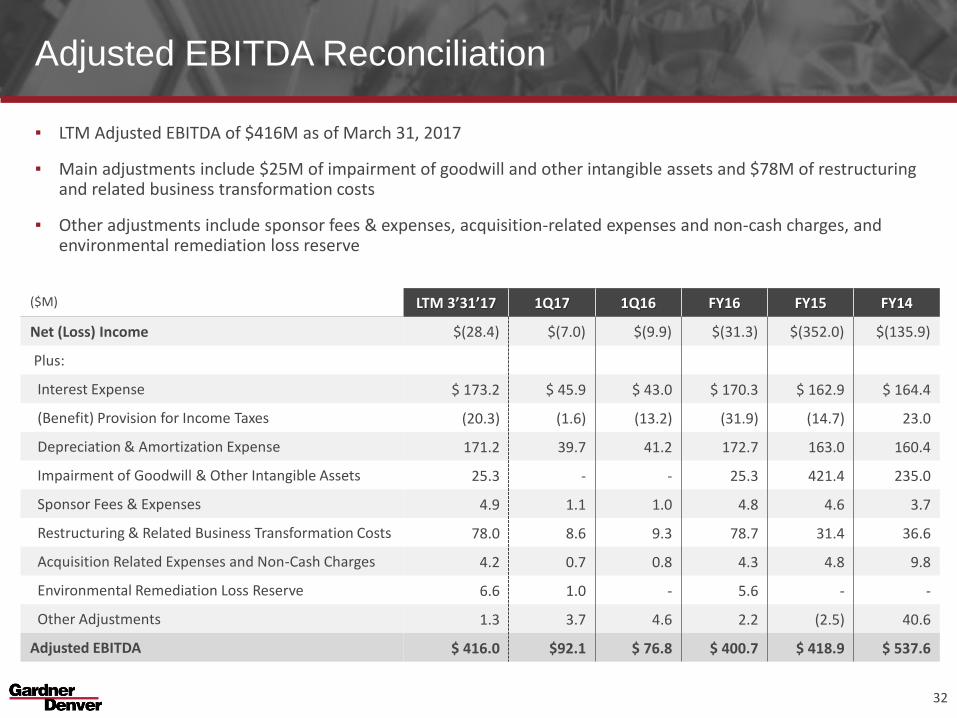
Adjusted EBITDA Reconciliation
▪ LTM Adjusted EBITDA of $416M as of March 31, 2017
▪ Main adjustments include $25M of impairment of goodwill and other intangible assets and $78M of restructuring and related business transformation costs
▪ Other adjustments include sponsor fees & expenses, acquisition-related expenses and non-cash charges, and environmental remediation loss reserve
($M) LTM 3’31’17 1Q17 1Q16 FY16 FY15 FY14
Net (Loss) Income $(28.4) $(7.0) $(9.9) $(31.3) $(352.0) $(135.9)
Plus:
Interest Expense $ 173.2 $ 45.9 $ 43.0 $ 170.3 $ 162.9 $ 164.4
(Benefit) Provision for Income Taxes (20.3) (1.6) (13.2) (31.9) (14.7) 23.0
Depreciation & Amortization Expense 171.2 39.7 41.2 172.7 163.0 160.4
Impairment of Goodwill & Other Intangible Assets 25.3 - - 25.3 421.4 235.0
Sponsor Fees & Expenses 4.9 1.1 1.0 4.8 4.6 3.7
Restructuring & Related Business Transformation Costs 78.0 8.6 9.3 78.7 31.4 36.6
Acquisition Related Expenses and Non-Cash Charges 4.2 0.7 0.8 4.3 4.8 9.8
Environmental Remediation Loss Reserve 6.6 1.0 - 5.6 - -
Other Adjustments 1.3 3.7 4.6 2.2 (2.5) 40.6
Adjusted EBITDA $ 416.0 $92.1 $ 76.8 $ 400.7 $ 418.9 $ 537.6
32
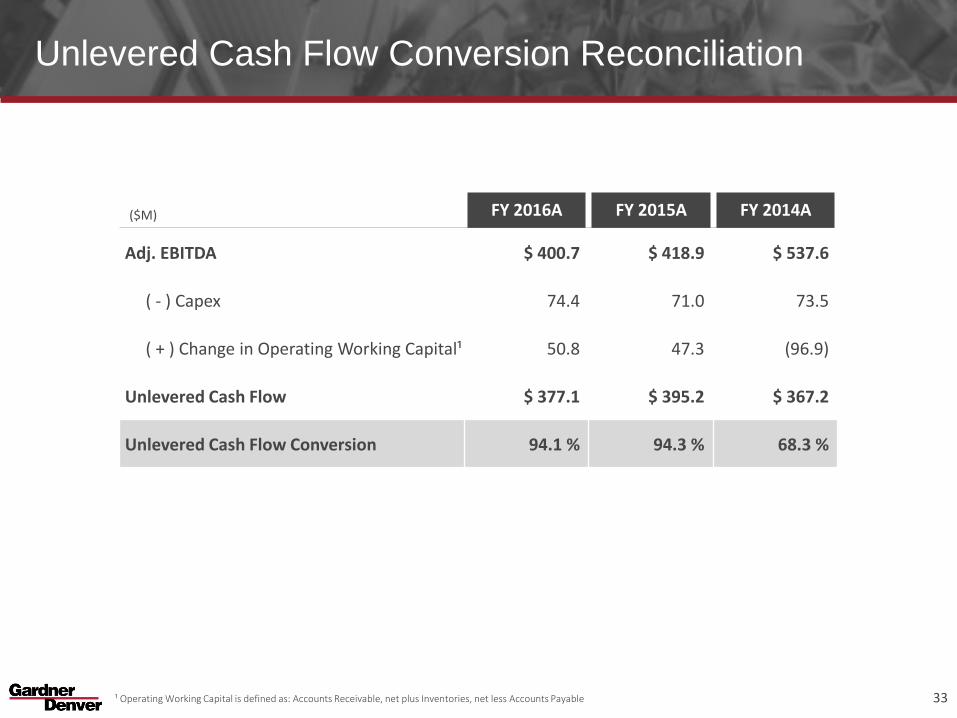
Unlevered Cash Flow Conversion Reconciliation
¹ Operating Working Capital is defined as: Accounts Receivable, net plus Inventories, net less Accounts Payable
($M) FY 2016A FY 2015A FY 2014A
Adj. EBITDA $ 400.7 $ 418.9 $ 537.6
( - ) Capex 74.4 71.0 73.5
( + ) Change in Operating Working Capital¹ 50.8 47.3 (96.9)
Unlevered Cash Flow $ 377.1 $ 395.2 $ 367.2
Unlevered Cash Flow Conversion 94.1 % 94.3 % 68.3 %
33


![Gardner Denver PZ-11revF3[1].Ppt](https://img.pdfslide.us/doc/110x75/552fb3f94a795943298b4570/gardner-denver-pz-11revf31ppt.jpg)