Embed Size (px)
Citation preview
GARBAGE PICKING AS A STRATEGY FOR SURVIVAL
by
Rachelle de Kock
Development Studies Unit
Un ivers i t y of Uatal
Durban
1986
Development Studies Uni t
The Development Studies U n i t i s a inu 1 1 i - d i s c i p l i n a r y u n i t w i t h i n the Centre f o r A p p l i e d S o c i a l Sciences at the Univers i ty of Uatal in Durban. The Development Studies Uni t was established at the beginning of 1902 w i th the purpose of p r o v i d i n g a focus fo r research i n t o the problems of developing areas, w i th a view to ass is t ing the Un ivers i t y to p lay a meaningful r o l e in the upgrading of the q u a l i t y of l i f e in the poorer area surrounding i t .
As w e l l as under tak ing research in many areas of South A f r i c a , the Unit o f fers a post-graduate Masters programme in development studies.
ISBN 0-86980-514-2
INDEX
1. INTRODUCTION I
1.1 Method 3
2. DEMOGRAPHIC CHARACTERISTICS 4
2.1 Sex and Age Structure of Population 7 2.2 Marital Status 7 2.3 'Family S ize ' 2.4 The Importance of the Earnings from Picking
to the Family 8 2.5 Rural Links 9 2.6 Educational Qual i f icat ions of the Pickers 10
3. IS PICKING A TEMPORARY OR PERMANENT OCCUPATION? 12
4. ECONOMIC ASPECTS OF GARBAGE PICKING 17
4.1 Items C o l l e c t e d , the Use thereof and the L inks with the Informal and Formal Sector 17
4.2 Informal/Formal Sector Links 19
5. INCOME EARNED FROM GARBAGE PICKING 25
5.1 Earnings From Picking by Family Size 26 5.2 Earnings From Picking by Age of Pickers 27 5.3 Earnings From Picking by Sex of Pickers 28 5.4 Earnings From Picking by Educational Level 29 5.5 Earnings From Picking by Preference for Picking
or Wage Employment 30 5.6 Earnings From Picking by Length of Time in Occupation 31 5.7 Earnings From Picking by Time Spent on the Dump 32 5.8 Earn ing , Leve ls in Garbage P i c k i n g R e l a t i v e
to Other Informal A c t i v i t i e s . 33
6. WORK HISTORY 34
7. WORKING CONDITIONS AND HARDSHIP 36
7.1 Harrassment 37 7.2 Hours spent Picking, Transportation and Assistance 39 7.3 Reason why Person Picks 41 7.4 Status in Community 42
8. CONCLUSION 43
APPENDIX
BIBLIOGRAPHY
1. INTRODUCTION
The phenomenon of people l i v i n g off garbage dumps is found world wide
and i s l i k e l y to become even more prominent as the u r b a n i z a t i o n
p r o c e s s i n c r e a s e s , e s p e c i a l l y i n the deve lop ing w o r l d where
urbanization rates great ly exceed the rate of job creation.
I t i s c o n s e r v a t i v e l y est imated that South A f r i c a w i l l have an urban
population of 24 055 000 by the year 2000 (which is 44 percent of i t s
t o t a l present popu la t ion ) . (Ci 11 i e r s & Groenewald 1982:37 ). With
such rap id growth rates in the urban work force and the genera l l y
slowing pace of the urban economy, the question must ar ise as to how
a l l these people w i l l l i v e . Formal sector employment l e v e l s are
cer ta in ly unl ikely to be able to increase s u f f i c i e n t l y to of fer work
to a l l those who need i t . And in the absence of an adequate sa fe ty
net in the form of unemployment bene f i t s i t i s c e r t a i n that
s ign i f i cant numbers of the urban dwellers w i l l be forced to seek some
other s u r v i v a l strategy.
I t i s o f ten argued that the in fo rma l sector in the towns f i l l s t h i s
r o l e (Hat t rass , N.J. 1985; Wei l i n g s & S u t c l i f f e , 1984). However
empirical studies of the informal sector show that even here there are
l i m i t a t i o n s on entry i n t o c e r t a i n sectors such as commerce and
construction and that consequently the rea l l y dest i tute have only very
l i m i t e d opt ions even in the in fo rmal sector (Nattrass and Glass,
1986). Garbage picking is one area in which, from an economic point
of v iew, entry i s r e l a t i v e l y open. Th is openness, coupled w i t h the
u n a t t r a c t i v e working cond i t ions and the r e l a t i v e l y low rates of
1
return, (which discourage entrance into the sector by those who can do
b e t t e r ) , means that i t i s an a c t i v i t y which l i k e that of s t r e e t
trading, can be used as a survival strategy.
Even though garbage p i ck ing i s common, very l i t t l e i s known about
e i t h e r the economics of the process or the c h a r a c t e r i s t i c s of the
people themselves.
"From what l i t t l e has been w r i t t e n about these people, and i t i s
indeed l i t t l e , i t is clear that most observers have been strongly of
the a t t i t u d e that garbage p i cke rs are a hopeless ly pover ty s t r i c k e n
group who are scratching out a meagre existence from the crumbs of the
r i c h e r man's t a b l e " (Birbeck, 1979:161).
I t is generally accepted, without any real empir ical foundation, that
garbage pickers are poor, and are forced to pick because they cannot
f ind employment elsewhere. Garbage picking is not o f f i c i a l l y regarded
as work or employment. The purpose of t h i s study i s to examine the
work done by the garbage picker in Durban's metropolitan area, and to
f i n d out where and how the p icker f i t s i n t o the soc io -economic
h i e r a r c h y , as w e l l as the r o l e , i f any, he/she p lays in the economy.
An attempt w i l l be made to determine just how wel l a person can l i v e
from p i ck ing garbage and whether i t i s indeed a v i a b l e a l t e r n a t i v e
strategy for surv ival .
Indeed the o v e r a l l aim of t h i s study w i l l be to t r y to d iscover to
what ex tent Durban's garbage p ickers are merely an express ion of
2
p o v e r t y , and to what e x t e n t , i f any , they fo rm p a r t of the
informal/formal economy.
The study took place on three garbage dumps in the greater Durban area
and the fo l lowing information was obtained, by means of a survey.
1. The demographic character ist ics of the pickers, in terms of sex,
age, mar i t ia l status, educational qua l i f i ca t ions , place of b i r th
and res ident ia l status in the area.
2. The income col lected through the garbage co l lec t ion and i t s major
use.
3. The relat ionship between the average income, age and sex of the
picker and his/her level of education and items collected.
4. The r e l a t i o n s h i p between income earned and the types of i tems
col lected.
4. The working conditions and hardships endured by pickers.
1.1 METHODOLOGY
A survey was conducted dur ing November and December 1985 among
Durban's garbage p ickers and scavengers. A s t ruc tu red , pre-coded
i n t e r v i e w schedule was used which inc luded quest ions r e l a t i n g to
demography, income, work pat terns and a t t i t u d e s to the work being
done. A copy of the questionnaire is given in Appendix I . A to ta l of
96 people were i n t e r v i e w e d 69 of whom were i n t e r v i e w e d at the
Westv i l le Dump, 10 in Pinetown and 18 at the Spr ing f ie ld garbage dump.
3
These dumps were chosen as survey s i t e s fo r two reasons : f i r s t l y
because of the presence of pickers on these dumps., secondly, because
permiss ion could be obtained from the appropr ia te a u t h o r i t i e s to
conduct i n t e r v i e w s w i t h the p ickers on the r e s p e c t i v e dumps. At
Pinetown only 10 p i ckers were a l lowed on the dump to p i ck , at
W e s t v i l l e not a l l the p ickers were i n t e r v i e w e d , as the sample was
considered adequate. A l though there were more p ickers on the
Spr ingf ie ld Dump, a smaller sample was used because the pickers are
a l l owed to pick fo r only two hours a day there , and i t was f e l t that
by interviewing them we were keeping these pickers from their work,
( interviews lasted about half an hour).
Pickers were interviewed at random, depending on thei r presence and
t h e i r w i l l i n g n e s s to be in te rv iewed . Some of the people were
embarrassed to be approached but very few a c t u a l l y refused to be
in te rv iewed . I t became c lea r to the i n t e r v i e w e r s as the research
proceeded that the t o p i c of research was h i g h l y emotive from the
pickers view point and many expressed the hope that through the study,
the i r lo t might be improved.
2. THE DEMOGRAPHIC CHARACTERISTICS OF THE PICKERS SURVEYED
2.1 The Age and Sex Structure of the Sairple
I f garbage picking is a strategy for survival , one would expect to f ind
i t dominated by people who cannot f ind a l ternat ive employment. From
the sex ra t i o point of view, because women in general experience more
4
d i f f i c u l t y in obtaining work, one might expect to f ind a predominance
of women amongst the p ickers . In January 1986 f o r example, of the
unemployed Blacks counted in the Current Population Survey, 53 percent
were women and 47 percent men ( S t a t i s t i c a l News Release p.374
20.5.1986).
Uomen are discriminated against in the formal workplace and there is
no reason to assume that thei r posit ion w i l l be that d i f ferent in the
informal economy. This being so,one would expect women to f i l t e r down
to the lowest occupational strata in the informal sector in much the
same way as they do in the formal sector and to be r e l a t i v e l y over
represented in areas such as garbage picking. In ac tua l i t y , however
al though women did dominate, making up 56 percent of the p ickers
surveyed, the extent of the i r dominance was lower than expected.
In view of the h igher than expected presence of men i t i s usefu l to
ask why were there so many men scavenging on garbage dumps? South
A f r i ca has been experiencing an economic recession during the last few
years. More men, than usual are unemployed, as a resul t , and have to
f ind an a l ternat ive way to support them and their famil ies. Garbage
picking offers one such an alternat ive.
The age d is t r ibu t ion of the pickers surveyed is also very interest ing
and i s given in Table 2.1 below.
5
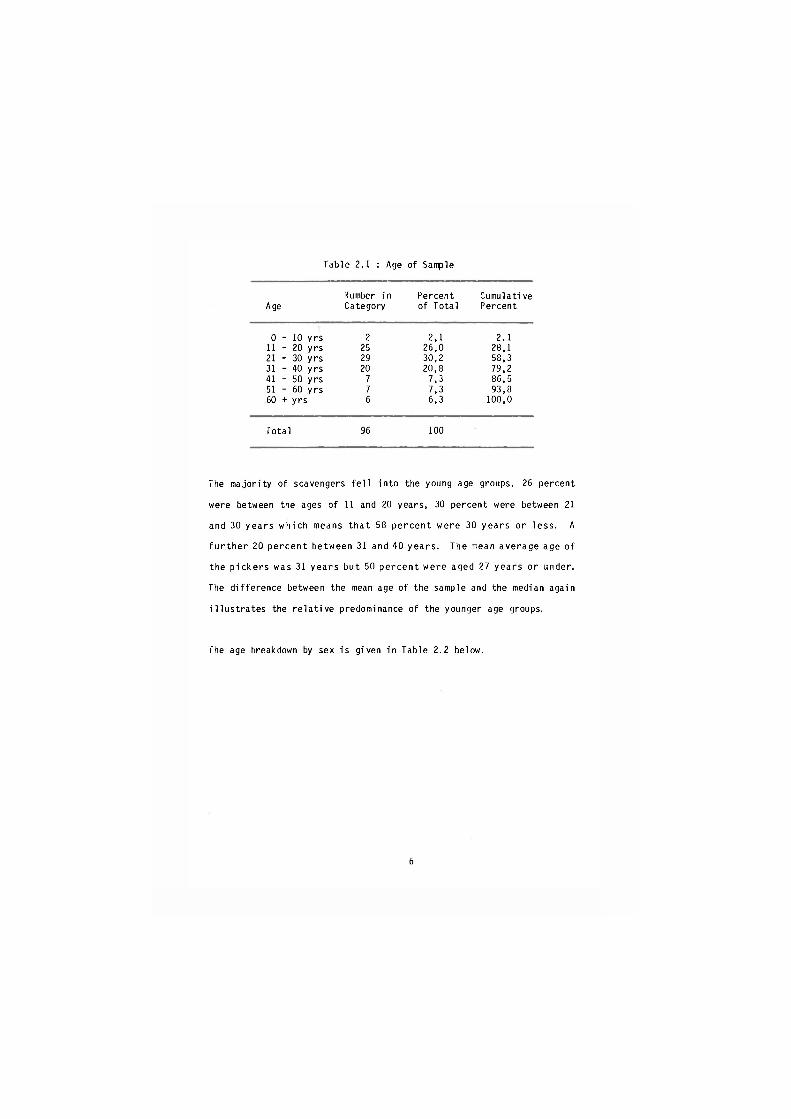
Table 2.1 : Age of Sample
Number in Percent Cumulati ve Age Category of Total Percent
0 - 1 0 yrs 2 2,1 2.1 11 - 20 y rs 25 26,0 28,1 21 - 30 yrs 29 30,2 58,3 31 - 40 yrs 20 20,8 79,2 41 - 50 yrs 7 7,3 86,5 51 - 60 yrs 7 7,3 93,8 60 + y rs 6 6,3 100,0
Total 96 100
The majority of scavengers f e l l into the young age groups, 26 percent
were between the ages of 11 and 20 years, 30 percent were between 21
and 30 years which means that 58 percent were 30 years or less. A
f u r t h e r 20 percent between 31 and 40 years . The mean average age of
the p ickers was 31 years but 50 percent were aged 27 years or under.
The difference between the mean age of the sample and the median again
i l l u s t r a t e s the re la t i ve predominance of the younger age groups.
The age breakdown by sex is given in Table 2.2 below.
6
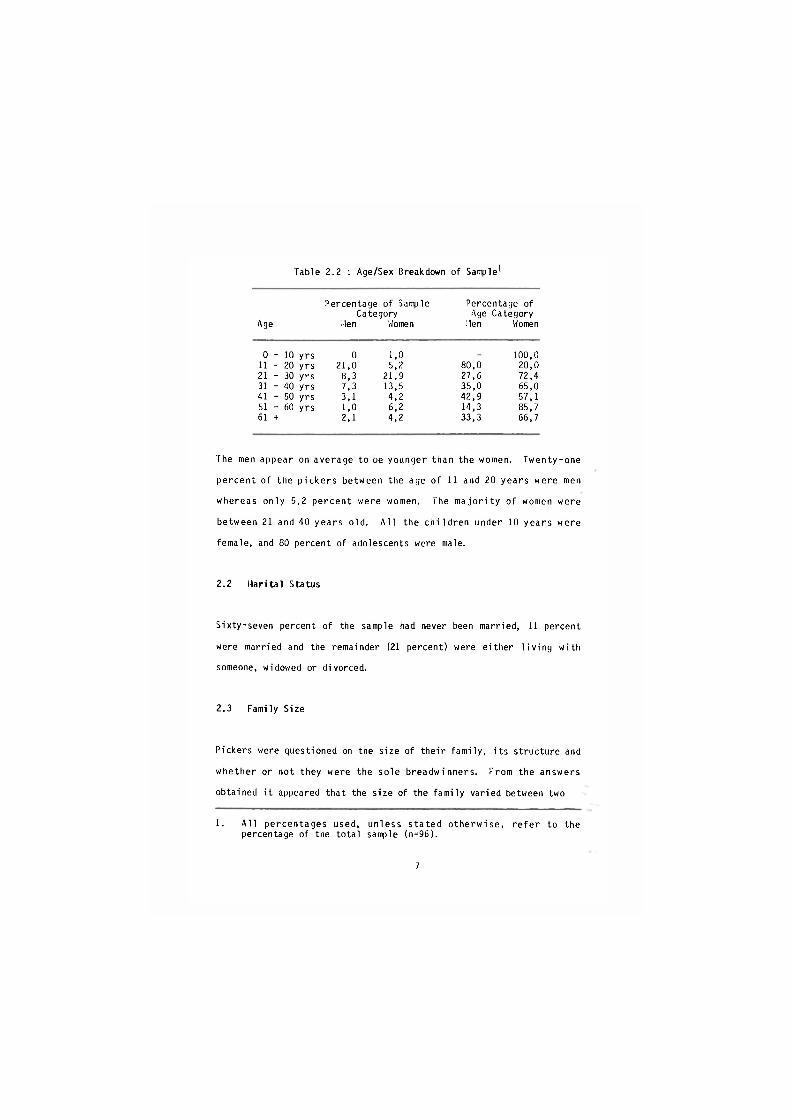
Table 2.2 : Age/Sex Breakdown of Sample^
Age
Percentage of Sample Category
Men Uomen
Percentage of Age Category
Men Women
0 - 1 0 yrs 11 - 20 yrs 21 - 30 yrs 31 - 40 yrs 41 - 50 yrs 51 - 60 yrs 61 +
0 1,0 21,0 5,2
8,3 21,9 7,3 13,5 3,1 4,2 1,0 6,2 2,1 4,2
80,0 20,0 27,6 72,4 35,0 65,0 42,9 57,1 14,3 85,7 33,3 66,7
1 0 0 , 0
The men appear on average to be younger than the women. Twenty-one
percent of the p ickers between the age of 11 and 20 years were men
whereas only 5,2 percent were women. The m a j o r i t y of women were
between 21 and 40 years old. A l l the c h i l d r e n under 10 years were
female, and 80 percent of adolescents were male.
2.2 Marital Status
Sixty-seven percent of the sample had never been married, 11 percent
were married and the remainder (21 percent) were either l i v i n g w i th
someone, widowed or divorced.
2.3 Family Size
Pickers were questioned on the size of thei r fami ly , i t s structure and
whether or not they were the sole breadwinners. From the answers
obtained i t appeared that the size of the family varied between two
1. A l l percentages used, unless s tated o therw ise , r e f e r to the percentage of the total sample (n=96).
7
and s i x teen people, w i t h the mean f a m i l y s i z e being s i x people.
Nearly two t h i r d s of the p ickers had between one and f i v e c h i l d r e n ,
6,3 percent had between s i x and ten c h i l d r e n . The r e l a t i v e l y high
percentage (31 percent ) who had no c h i l d r e n i s exp la ined by the
overal l youthful lness of the sample.
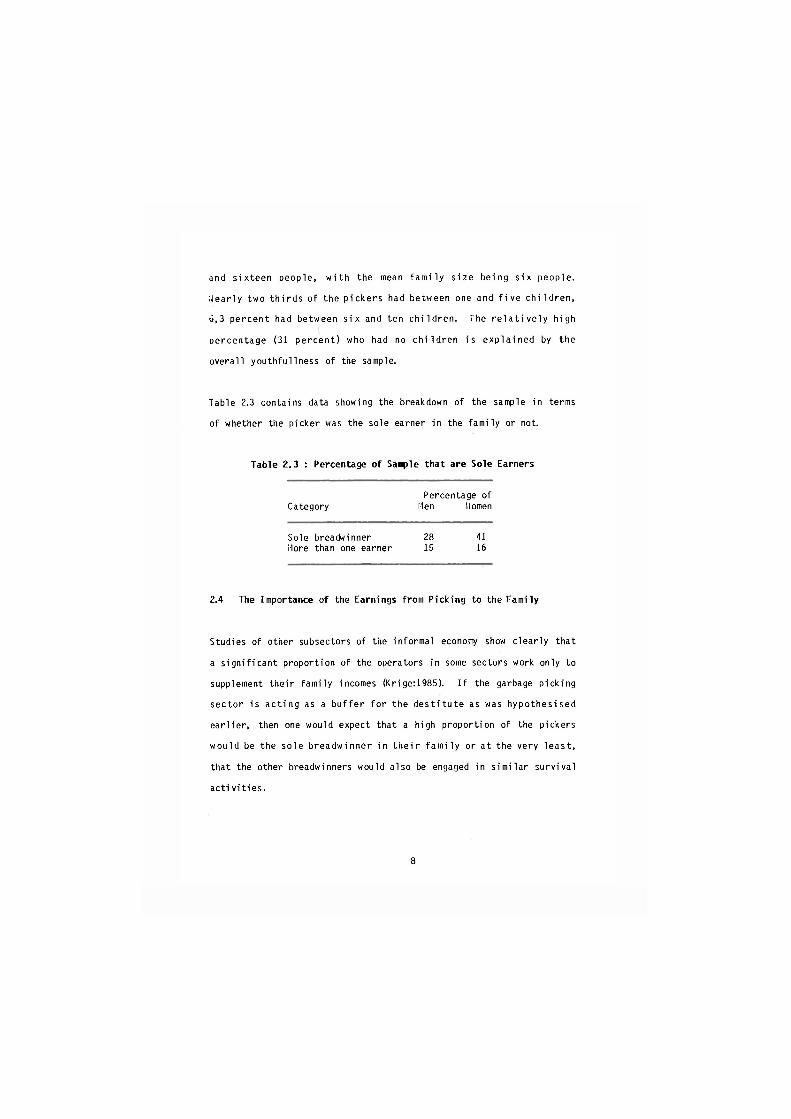
Table 2.3 contains data showing the breakdown of the sample in terms
of whether the picker was the sole earner in the family or not.
Table 2.3 : Percentage of Sanple that are Sole Earners
Percentage of Category lien Uomen
Sole breadwinner 28 41 More than one earner 15 16
2.4 The Importance of the Earnings from Picking to the Family
Studies of other subsectors of the informal economy show c lear l y that
a s ign i f i cant proportion of the operators in some sectors work only to
supplement the i r family incomes (Krige:1985). I f the garbage picking
sector is a c t i n g as a bu f fe r fo r the d e s t i t u t e as was hypothesised
ear l ie r , then one would expect that a high proportion of the pickers
would be the sole breadwinner in t h e i r f a m i l y or at the very l e a s t ,
that the other breadwinners would also be engaged in s imi la r surv ival
act i v i t i e s .
8
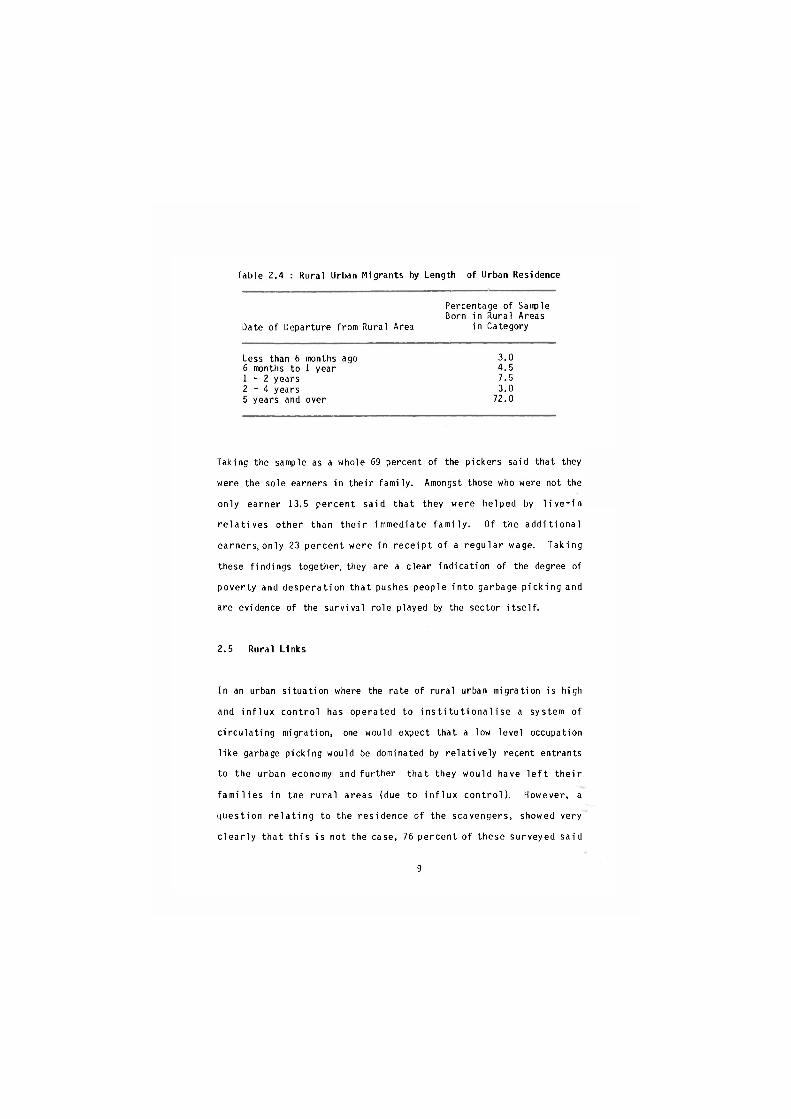
Table 2.4 : Rural Urban Migrants by Length of Urban Residence
Date of Departure from Rural Area
Percentage of Sample Born in Rural Areas
in Category
Less than 6 months ago 6 months to 1 year 1 - 2 years 2 - 4 years 5 years and over
3.0 4.5 7.5 3.0
72.0
Taking the sample as a whole 69 percent of the pickers said that they
were the sole earners in thei r family . Amongst those who were not the
only earner 13.5 percent sa id that they were helped by l i v e - i n
r e l a t i v e s other than t h e i r immediate f a m i l y . Of the a d d i t i o n a l
earners, only 23 percent were in r e c e i p t of a r e g u l a r wage. Taking
these f indings together, they are a clear indicat ion of the degree of
pover ty and desperat ion that pushes people i n t o garbage p i ck ing and
are evidence of the survival role played by the sector i t s e l f .
2.5 Rural Links
In an urban s i tuat ion where the rate of rural urban migration is high
and i n f l u x con t ro l has operated to i n s t i t u t i o n a l i s e a system of
c i rcu la t ing migration, one would expect that a low level occupation
l ike garbage picking would be dominated by r e l a t i v e l y recent entrants
to the urban economy and further that they would have l e f t t h e i r
f a m i l i e s in the r u r a l areas (due to i n f l u x c o n t r o l ) . However, a
quest ion r e l a t i n g to the residence of the scavengers, showed very
c l e a r l y that t h i s i s not the case, 76 percent of these surveyed sa id
9
that they l ived wi th the i r famil ies - suggesting that garbage picking
as an occupation is dominated by the w e l l es tab l i shed urban poor
rather than by the new rural entrants.
This f inding is further supported by the fact that although 70 percent
of the sample sa id they had been born in a r u r a l area 73 percent of
the rural born had been l i v i n g in the town for longer than f i ve years.
The data in Table 2.4 gives detai ls of the rura l urban movement of the
sample and shows c l e a r l y that the m a j o r i t y of the p ickers were long
term c i t y dwellers and not new rural urban migrants.
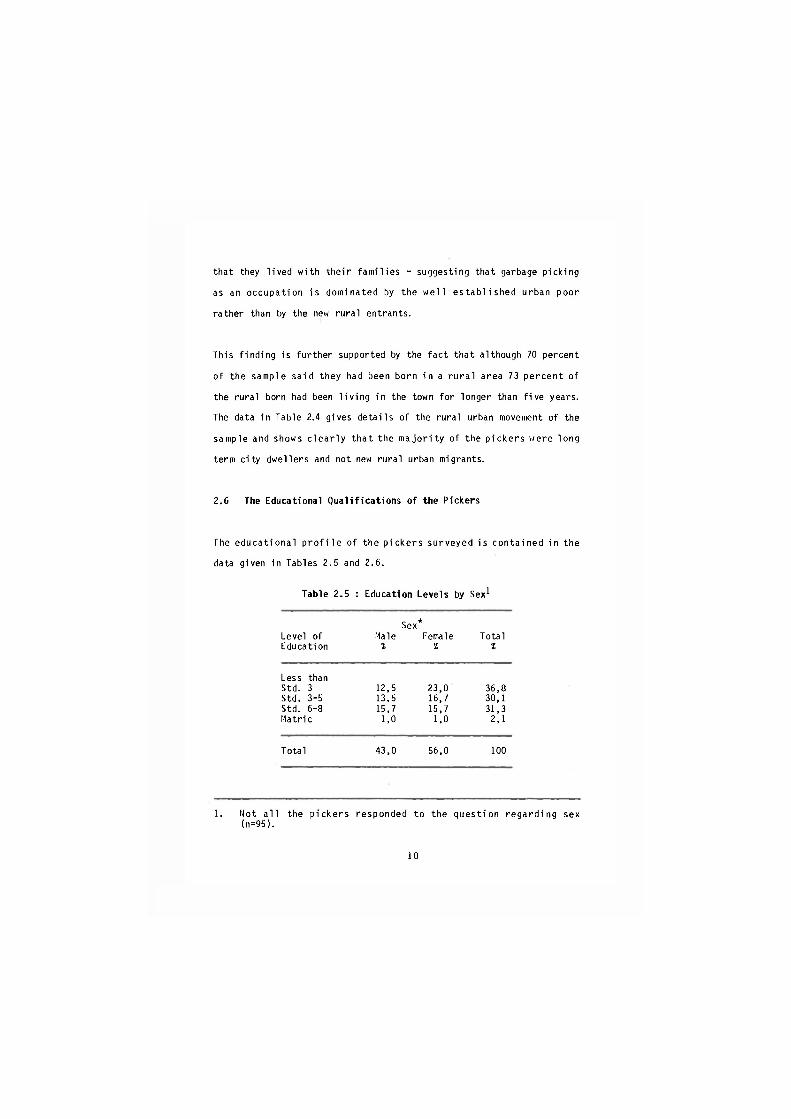
2.6 The Educational Qual i f i cat ions of the Pickers
The educat ional p r o f i l e of the p i cke rs surveyed i s contained in the
data given in Tables 2.5 and 2.6.
Table 2.5 : Education Levels by Sex1
Sex* Level of Male Female Total Education % % %
Less than Std. 3 12, ,5 23,0 36,8 Std. 3-5 13. ,5 16,7 30,1 Std. 6-8 15, ,7 15,7 31,3 Matrie 1 , , 0 1,0 2,1
Total 43, .0 56,0 100
1. Not a l l the p ickers responded to the quest ion regard ing sex (n=95).
10
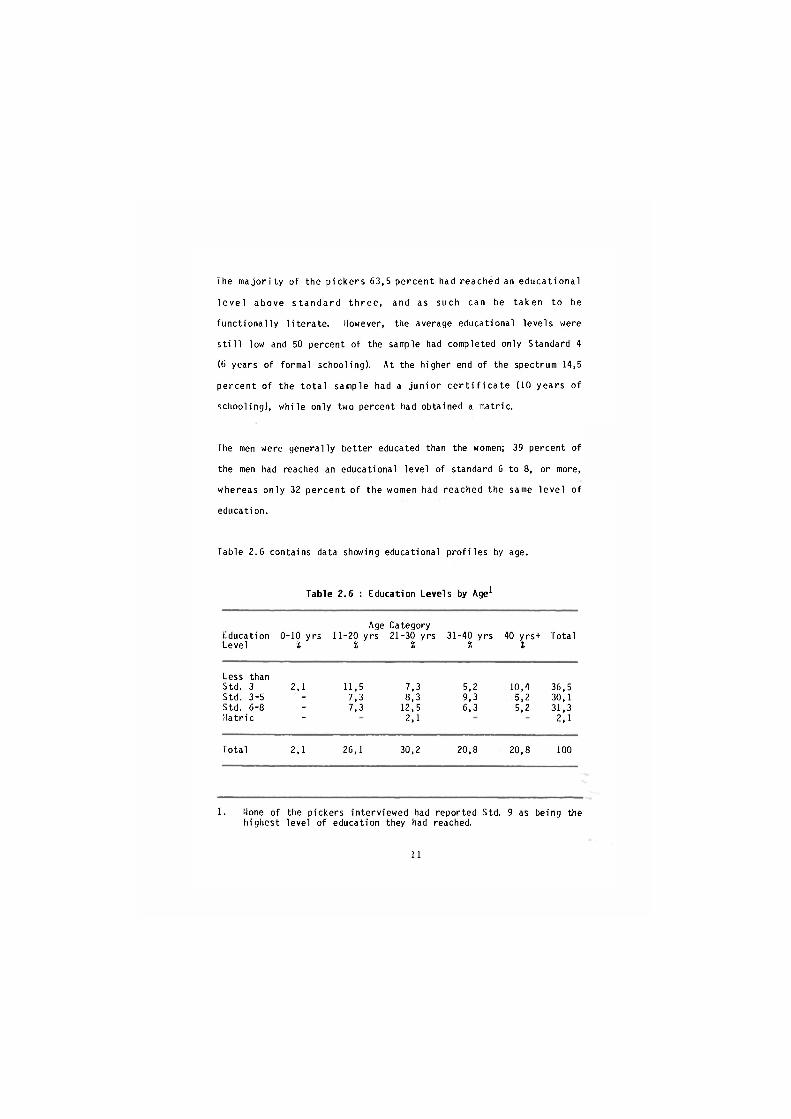
The m a j o r i t y of the p ickers 63,5 percent had reached an educat ional
l e v e l above s t a n d a r d t h r e e , and as such can be taken to be
funct ional ly l i te ra te . However, the average educational levels were
s t i l l low and 50 percent of the sample had completed only Standard 4
(6 years of formal schooling). At the higher end of the spectrum 14,5
percent of the t o t a l sample had a j u n i o r c e r t i f i c a t e (10 years of
schooling), while only two percent had obtained a matric.
The men were generally better educated than the women; 39 percent of
the men had reached an educational level of standard 6 to 8, or more,
whereas only 32 percent of the women had reached the same l e v e l of
education.
Table 2.6 contains data showing educational p ro f i les by age.
Table 2.6 : Education Levels by Age1
Age Category Education 0-10 yrs 11-20 yrs 21-30 yrs 31-40 yrs 40 yrs+ Total Level i % % % %
Less than Std. 3 2,1 11, ,5 7, ,3 5, ,2 10,4 36,5 Std. 3-5 - 7, ,3 8, ,3 9, ,3 5,2 30,1 Std. 6-8 - 7, ,3 12, ,5 6, ,3 5,2 31,3 Matric - 2, ,1 2,1
Total 2,1 26, ,1 30, ,2 20, ,8 20,8 100
1. Hone of the pickers interviewed had reported Std. 9 as being the highest level of education they had reached.
11
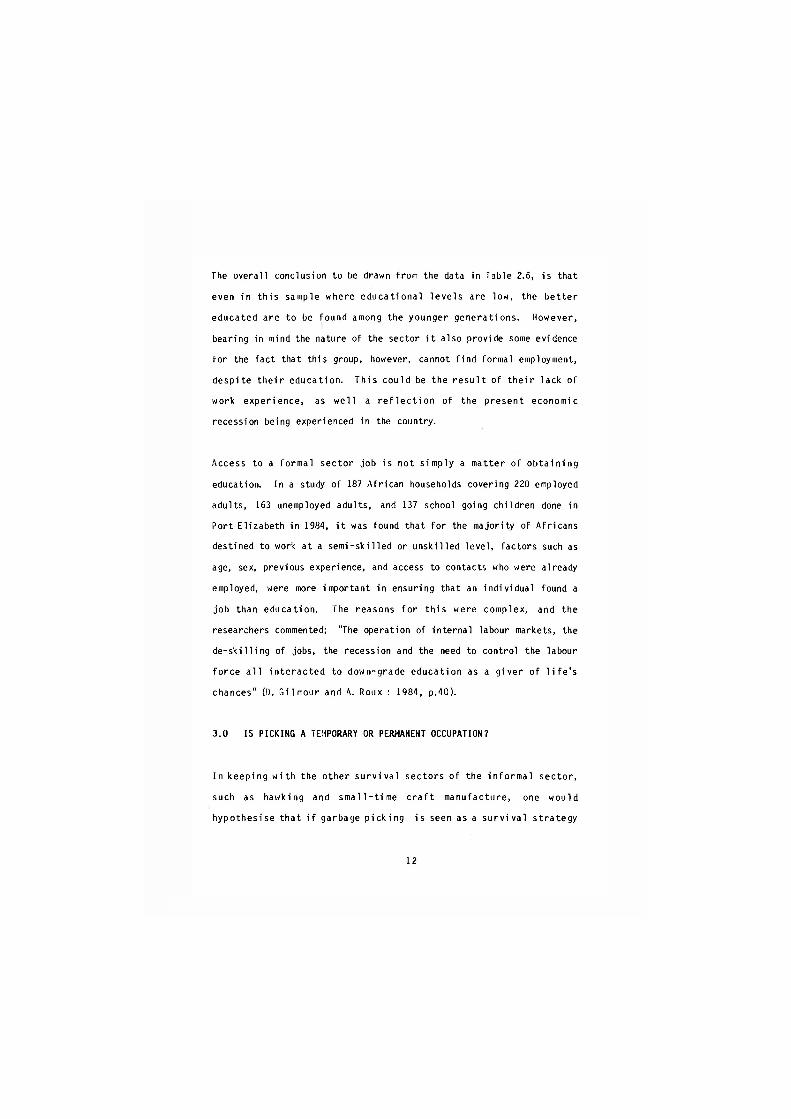
The overal l conclusion to be drawn from the data in Table 2.6, is that
even in t h i s sample where educat ional l e v e l s are low, the be t te r
educated are to be found among the younger generat ions. However,
bearing in mind the nature of the sector i t also provide some evidence
for the fact that th is group, however, cannot f ind formal employment,
despi te t h e i r education. Th is could be the r e s u l t of t h e i r lack of
work exper ience, as w e l l a r e f l e c t i o n of the present economic
recession being experienced in the country.
Access to a formal sector job i s not s imply a matter of ob ta in ing
education. In a study of 187 Afr ican households covering 220 employed
adults, 163 unemployed adults, and 137 school going children done in
Port El izabeth in 1984, i t was found that for the majority of Afr icans
destined to work at a semi -sk i l led or unski l led level , factors such as
age, sex, previous experience, and access to contacts who were already
employed, were more important in ensuring that an individual found a
job than education. The reasons f o r t h i s were complex, and the
researchers commented; "The operation of internal labour markets, the
d e - s k i l l i n g of jobs, the recession and the need to control the labour
fo rce a l l i n t e r a c t e d to down-grade educat ion as a g i v e r of l i f e ' s
chances" (0, Gi lmour and A. Roux : 1984, p.40).
3.0 IS PICKING A TEMPORARY OR PERMANENT OCCUPATION?
In keeping w i t h the other s u r v i v a l sectors of the in fo rmal sec to r ,
such as hawking and s m a l l - t i m e c r a f t manufacture, one would
hypothesise that i f garbage p ick ing i s seen as a s u r v i v a l s t r a t e g y
1 2
then i t would be viewed by those in the a c t i v i t y , as a temporary
occupation - something to t ide them over u n t i l they can f ind a better
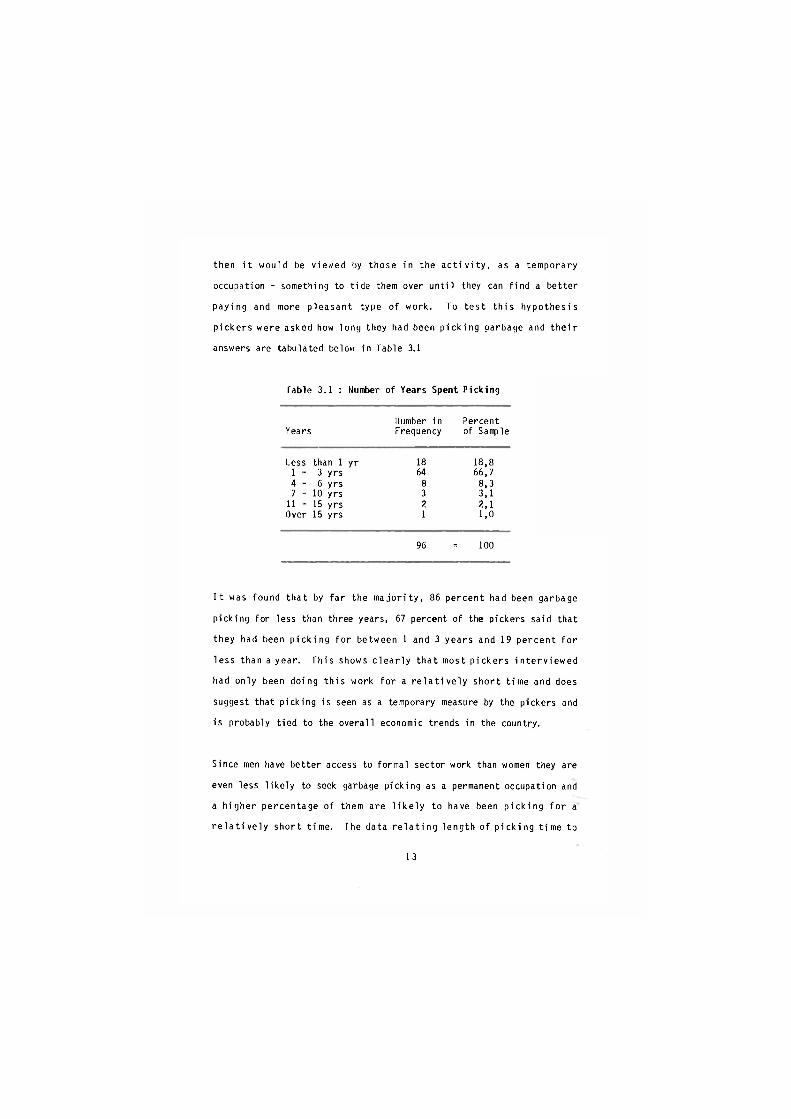
paying and more pleasant type of work. To t e s t t h i s hypothes is
p ickers were asked how long they had been p ick ing garbage and t h e i r
answers are tabulated below in Table 3.1
fable 3.1 : Number of Years Spent Picking
Number in Percent Years Frequency of Sample
Less than 1 y r 18 18,8 1 - 3 yrs 64 66,7 4 - 6 yrs 8 8,3 7 - 10 yrs 3 3,1
11 - 15 yrs 2 2,1 Over 15 yrs 1 1,0
96 = 100
I t was found that by fa r the m a j o r i t y , 86 percent had been garbage
picking for less than three years, 67 percent of the pickers said that
they had been p i ck ing fo r between 1 and 3 years and 19 percent f o r
less than a year. This shows c l e a r l y that most p ickers i n t e r v i e w e d
had only been doing t h i s work for a r e l a t i v e l y shor t t ime and does
suggest that picking is seen as a temporary measure by the pickers and
is probably t ied to the overal l economic trends in the country.
Since men have better access to formal sector work than women they are even less l i k e l y to seek garbage picking as a permanent occupation and a h igher percentage of them are l i k e l y to have been p i ck ing f o r a r e l a t i v e l y short t ime. The data r e l a t i n g length of p i ck ing t ime to
1 3
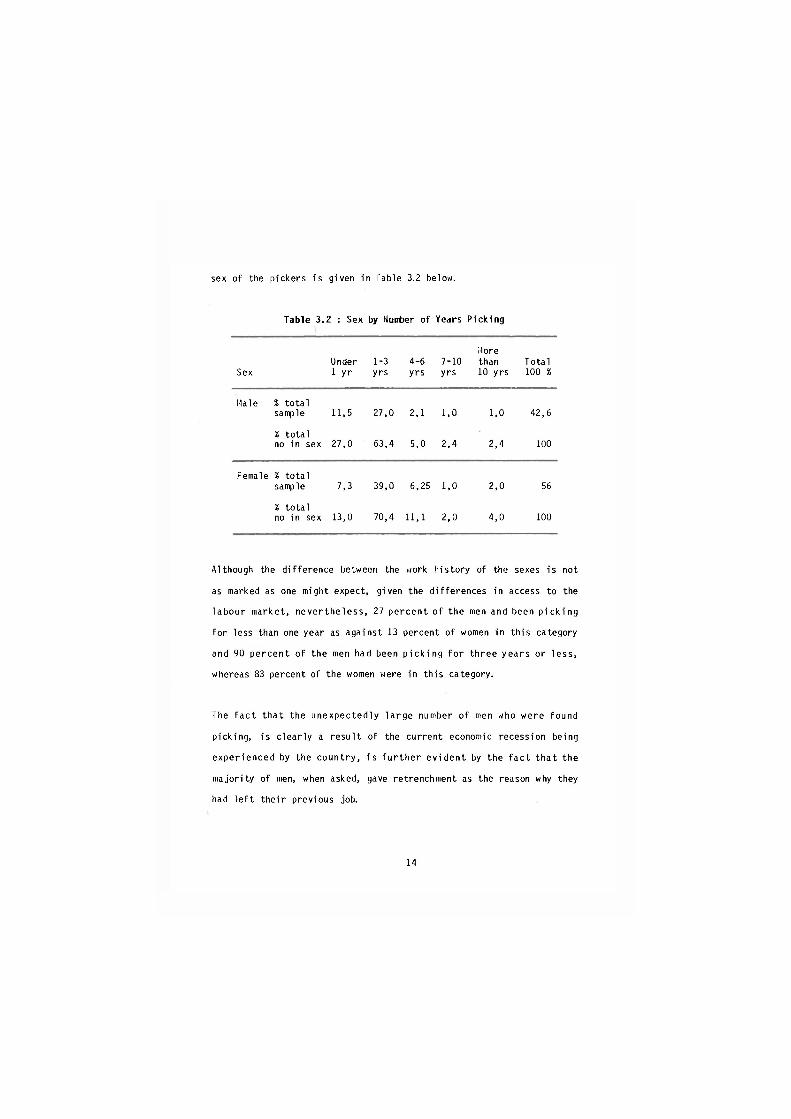
sex of the pickers is given in fable 3.2 below.
Table 3.2 : Sex by Hunter of Years Picking
More Under 1-3 4-6 7-10 than Total
Sex 1 y r yrs yrs yrs 10 yrs 100 %
Male % tota l sample 11,5 27,0 2,1 1,0 1,0 42,6
% tota l no in sex 27,0 63,4 5,0 2,4 2,4 100
Female % tota l sample 7,3 39,0 6,25 1,0 2,0 56
% tota l no in sex 13,0 70,4 11,1 2,0 4,0 100
Although the difference between the work history of the sexes is not
as marked as one might expect, given the differences in access to the
labour market, never the less , 27 percent of the men and been p i c k i n g
for less than one year as against 13 percent of women in this category
and 90 percent of the men had been p i c k i n g f o r three years or less ,
whereas 83 percent of the women were in th is category.
The fac t that the unexpectedly la rge number of men who were found
picking, is c lear ly a resul t of the current economic recession being
exper ienced by the count ry , i s f u r t h e r ev ident by the f a c t that the
majority of men, when asked, gave retrenchment as the reason why they
had l e f t the i r previous job.
14
Taken as a whole, however, the number of years that women have been
p i ck ing i s not s i g n i f i c a n t l y d i f f e r e n t than that found f o r men,1
except many more women (12,8%) f e l l into the 4 - 6 yrs category than
men (6,7%). Th is leads one to suspect that women are a f f e c t e d f i r s t
by an economic recession, and are possibly more vulnerable.
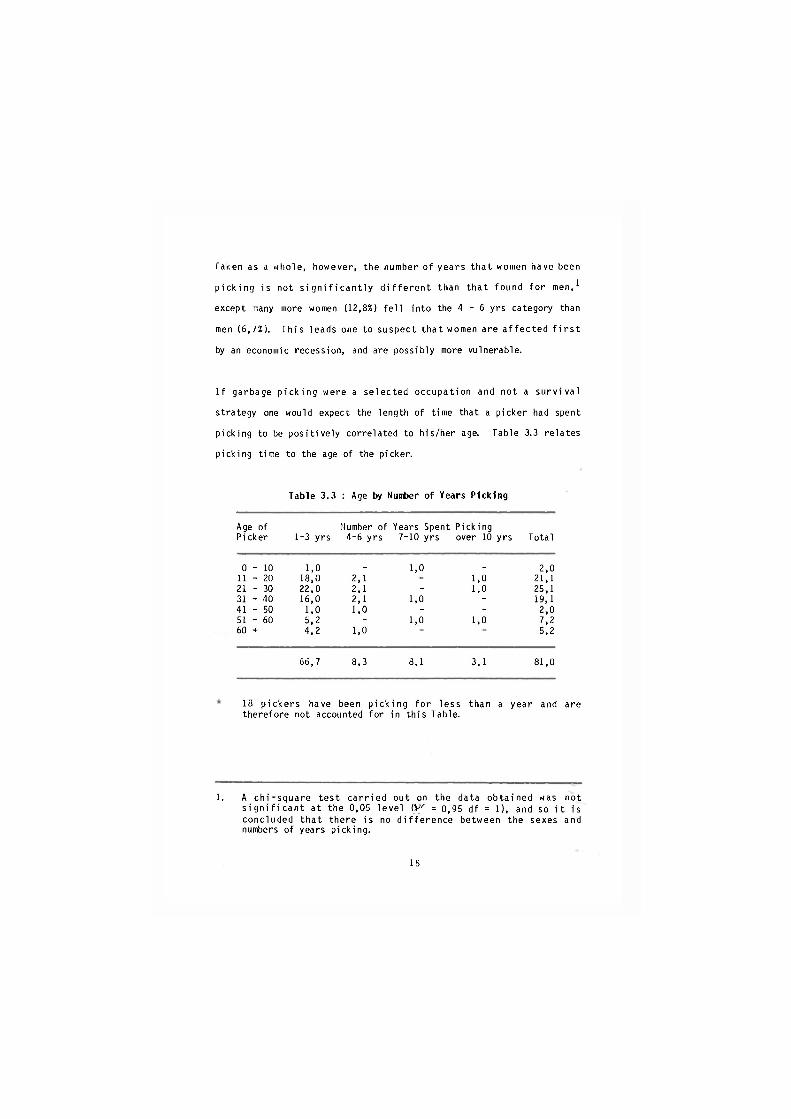
I f garbage p i c k i n g were a se lected occupation and not a s u r v i v a l
strategy one would expect the length of time that a picker had spent
picking to be pos i t i ve l y correlated to his/her age. Table 3.3 relates
picking time to the age of the picker.
Table 3.3 : Age by Dumber of Years Picking
Age of Humber of Years Spent Picking Picker 1-3 y rs 4-6 y rs 7-10 yrs over 10 yrs Total
0 - 10 1, ,0 _ 1, ,0 _ 2,0 11 - 20 18, ,0 2,1 - 1, ,0 21,1 21 - 30 22, ,0 2,1 - 1, ,0 25,1 31 - 40 16, ,0 2,1 1, ,0 - 19,1 41 - 50 1, ,0 1,0 - - 2,0 51 - 60 5, ,2 - 1, ,0 1, ,0 7,2 60 + 4, ,2 1,0 5,2
66, ,7 8,3 8, ,1 3, ,1 81,0
18 p ickers have been p ick ing f o r less than a year and are therefore not accounted for in th is Table.
1. A ch i - square tes t c a r r i e d out on the data obtained was not s i g n i f i c a n t at the 0,05 leve l = 0,95 df = 1), and so i t i s concluded that there i s no d i f f e r e n c e between the sexes and numbers of years picking.
15
The data show that in a l l age groups, the major i ty of pickers had only
been p i ck ing f o r a r e l a t i v e l y short t ime, between 1 and 3 years .
Except ions did, however, occur, f o r instance 1 percent of p ickers
between the ages of 21 and 50 years sa id that they had been p i ck ing
for more than 6 years.
The f a c t that 50 percent of p ickers under ten years had been p i c k i n g
f o r between 7 and 10 years , i n d i c a t e s that these c h i l d r e n have more
than l i k e l y spent most of the i r l i ves co l lec t ing garbage on the c i t y ' s
dumps. Since mothers work for themselves and are not supervised, the
c h i l d r e n are taken to the dump where the mother can keep an eye on
them. The author saw young chi ldren playing on the dumps. I t is then
only natural that these chi ldren should s tar t co l lect ing items, e i ther
to play wi th or to se l l fo r pocket money.
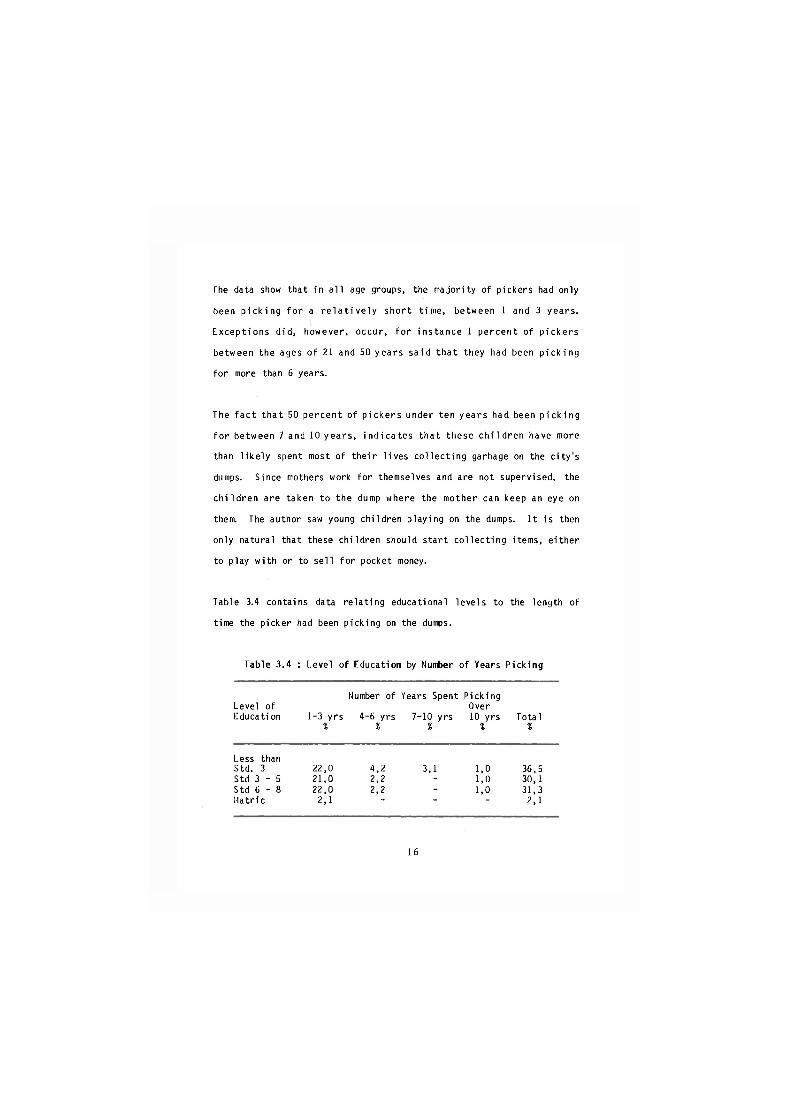
Table 3.4 contains data re lat ing educational levels to the length of
time the picker had been picking on the dumps.
Table 3.4 : Level of Education by Number of Years Picking
Number of Years Spent Picking Level of Over Education 1-3 yrs 4-6 yrs 7-10 yrs 10 yrs Total
% % % % %
Less than Std. 3 22,0 4,2 3,1 1,0 36,5 Std 3 - 5 21,0 2,2 - 1,0 30,1 Std 6 - 8 22,0 2,2 - 1,0 31,3 Matrie 2,1 - - - 2,1
16
The data c o n f i r m s the e a r l i e r f i n d i n g s and shows again that
i r respect ive of the educational level reached, the majority of pickers
had only been picking for one to three years. Those pickers who were
f u n c t i o n a l l y i l l i t e r a t e were found in most categor ies i n d i c a t i n g
length of t ime invo l ved in p i ck ing . A l though 72 percent had picked
f o r only between 1 and 3 years 13 percent had picked f o r from 4 to 6
years and 10 percent for 7 to 10 years, and 3 percent for more than 10
years.
4.0 THE ECONOMIC ASPECTS OF GARBAGE PICKING
4.1 Items Collected, the Use thereof and the Links wi th the Formal
and Informal Sector
The survey showed that the scavengers w i l l co l lec t anything that i s of
value either because i t can be of use in thei r homes or because i t can
be sold. They do, however, tend to concentrate on co l lect ing spec i f ic
i tems which can be so ld in the townships and squatter areas, to
r e c y c l e r s , to scrapyards, to garages and to hawkers/brokers. The
f o l l o w i n g tab le i n d i c a t e s the items c o l l e c t e d and the number of
scavengers, who stated that they col lected that par t icu lar items.
17
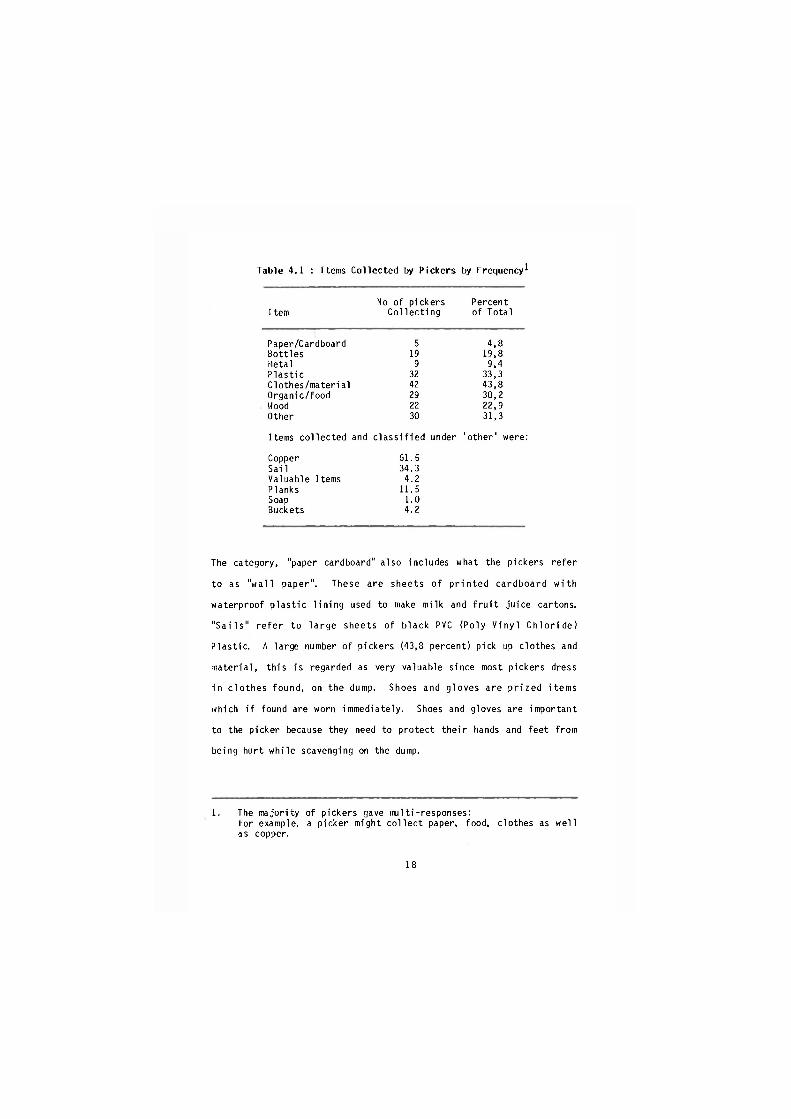
Table 4.1 : Items Col lected by Pickers by Frequency1
I tern No of pickers Percent
Col lect ing of Total
Paper/Cardboard Bottles Metal P las t ic Clothes/material Organic/food Wood Other
5 19 9
32 42 29 22 30
43,8 30.2 22,9 31.3
9,4 33,3
4,8 19,8
Items col lected and c lass i f i ed under 'other ' were:
Buckets
Copper Sai l Valuable Items Planks Soap
61.5 34.3 4.2
11.5 1.0 4.2
The category, "paper cardboard" also includes what the pickers refer
to as " w a l l paper". These are sheets of p r i n t e d cardboard w i t h
waterproof p las t i c l in ing used to make milk and f r u i t ju ice cartons.
" S a i l s " r e f e r to la rge sheets of black PVC (Poly V i n y l C h l o r i d e )
P last ic . A large number of pickers (43,8 percent) pick up clothes and
material , th is is regarded as very valuable since most pickers dress
i n c lo thes found, on the dump. Shoes and gloves are p r i z e d items
which i f found are worn immediately. Shoes and gloves are important
to the picker because they need to protect the i r hands and feet from
being hurt while scavenging on the dump.
1. The majority of pickers gave multi-responses: for example, a picker might co l l ec t paper, food, clothes as we l l as copper.
18
'Own use' inc lude food picked up on the dump. From answers to other
questions one can conclude that many, i f not most of the pickers eat
o f f the garbage dumps.1 Embarrassment may be the reason why many
pickers did not respond to this question.
The multiple use aspect of garbage picking is further i l l u s t r a t e d by
the answers obtained from a question to which 60,4 percent said that
some items were used at home; 91,7 percent said they sold part or a l l
of t h e i r c o l l e c t i o n s and only 1 percent sa id they used the items
found, to manufacture a product for sale, (see p.24).
4.2 Informal/Formal Sector Links
I n the waste indust r y we f i n d that not only i s the removal of waste
and the safe disposal thereof important, but also of importance is the
recycl ing of waste. The picker plays an important role in the waste
recycl ing process. The picker not only recycles the waste by making
personal use of i t , but a lso s e l l s i t to r e c y c l i n g companies and
brokers/hawkers. The garbage p icker p lays an important r o l e in the
sort ing of waste for recycl ing purposes. The picker thus deals with
waste a t the g r a s s - r o o t s l e v e l . F i g u r e 4.1 i l l u s t r a t e s the
relat ionship between the garbage picker and other dealers in waste.
1. The author saw a man car ry a carcas from the dump on his back, which had probably been dumped by a butcher, i t was assumed that the bones were going to be used to make soup.
1 9
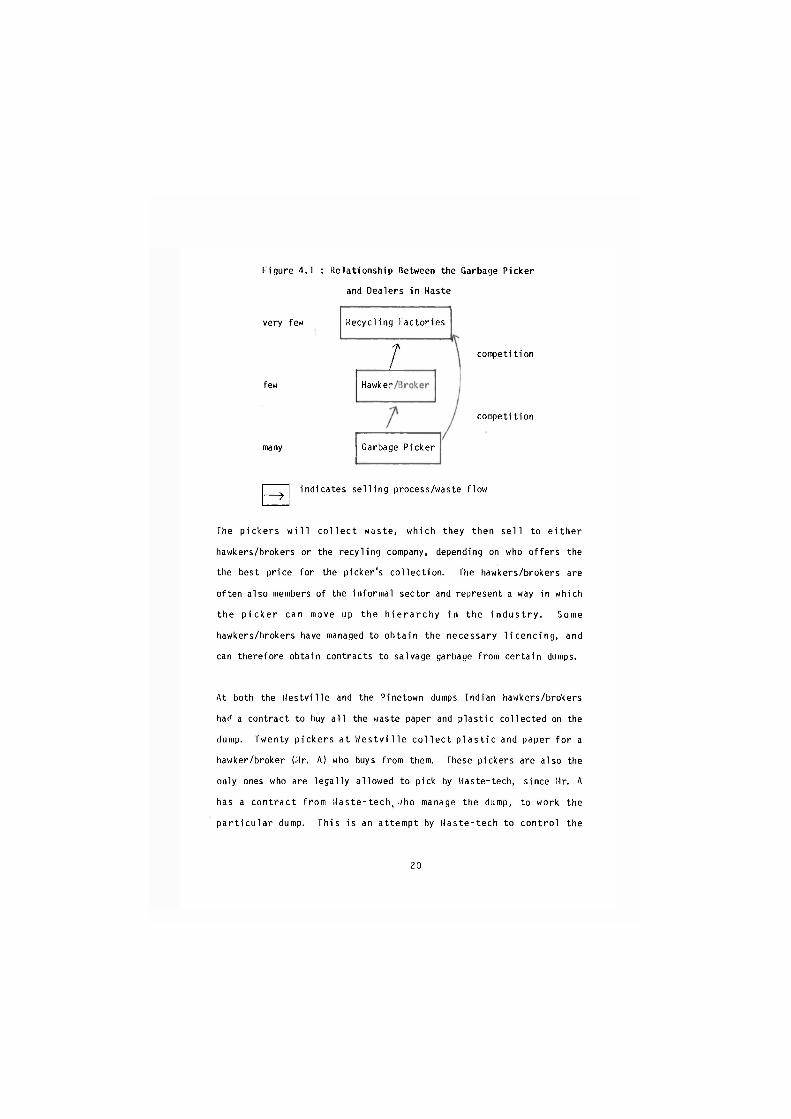
Figure 4.1 : Relationship Between the Garbage Picker
and Dealers in Haste
very few Recycling Factories
t competi t ion
few Hawke-
competition
many Garbage Picker
0 indicates se l l ing process/waste flow
The p ickers w i l l c o l l e c t waste, which they then s e l l to e i t h e r
hawkers/brokers or the recy l ing company, depending on who of fers the
the best price for the picker's co l lect ion. The hawkers/brokers are
often also members of the informal sector and represent a way in which
the p i c k e r can move up the h i e r a r c h y i n the i n d u s t r y . Some
hawkers/brokers have managed to obta in the necessary l i c e n c i n g , and
can therefore obtain contracts to salvage garbage from certain dumps.
At both the U e s t v i l l e and the Pinetown dumps Indian hawkers/brokers
had a contract to buy a l l the waste paper and p las t i c col lected on the
dump. Twenty p ickers at U e s t v i l l e c o l l e c t p l a s t i c and paper f o r a
hawker/broker (Mr. A) who buys from them. These pickers are also the
only ones who are lega l l y allowed to pick by Haste-tech, since Mr. A
has a cont rac t from H a s t e - t e c h , ./ho manage the dump, to work the
p a r t i c u l a r dump. Th is i s an attempt by Haste - tech to con t ro l the
2 0
number of p ickers present. When Waste-Tech s t a r t e d working the
W e s t v i l l e dump they were opposed to the idea of p ickers and d id not
a l l o w anyone to pick on the dump. Th is dec is ion was, however,
s t r o n g l y r e s i s t e d by the p ickers . The dump was set on f i r e , a
ni ghtwatchman was stabbed and Waste-Tech machinery was damaged.
Waste-Tech compromised by a l l o w i n g twenty people to pick f o r Mr. A.
These pickers carry ident i t y cards wi th them, which they show pol ice
dur ing ra ids by the a u t h o r i t i e s . 1 Uaste-Tech i s however, s t i l l
f i n d i n g i t very d i f f i c u l t to c o n t r o l the number of p ickers on the
dump, despite the above mentioned strategy and pol ice raids.
At the Pinetown dump an Indian businessman (Mr. B) has a contract wi th
the Pinetown Municipal i ty to salvage a l l garbage that can be used for
r e c y c l i n g purposes. He has nine p ickers who c o l l e c t f o r him on a
regu lar basis. These p ickers are, however, not employed by him,
because according to him, they do not possess the necessary passes and
he is not prepared to run the r isk of prosecution. Nonetheless these
pickers work on a regular basis and are at least assured of a regular
buyer.
Mr. B paid h is p ickers a t the end of the week. They were paid R2 per
bag of rubbish. These bags/sacks were provided by him and were 1 lm2
by 750mm high. A good p icker f i l l s up to 6 bags a day. Mr B. r e -
se l ls the p las t i c for an average of 22c per kg and paper at 6c per kg.
The p i cke rs do however, a l so s e l l d i r e c t l y to la rge r e c y c l i n g
1. More detai ls see p.32.
2 1
companies. They were unable to say who these r e c y c l e r s were, but
a f t e r contact ing three l a r g e r e c y c l i n g companies i n Durban, i t was
learnt that they do indeed buy from garbage pickers. Many pickers go
to the company's branches and depots, where t h e i r garbage ( i n t h i s
case p last ic and paper) is bought a f ter being weighed.
Metal col lected by pickers is sold to scrapyard owners as we l l as to
r e c y c l e r s and/or salvage companies. Copper i s regarded as very
va luable and i s much sought a f t e r , s ince i t can be so ld a t Rl,20 per
kg. Aluminium can be sold at 80c per kg.
From the above i t is clear that l inks between the Informal Sector, as
represented by the p i c k e r s , and the Formal Sector ( r e c y c l e r s and
scrapyard owners) not only e x i s t but are s u b s t a n t i a l . However, the
re lat ionship is not an equal one, to quote Davies;
"The in fo rma l sec to r , on the one hand, represents a s u b s i d i a r y ,
p e r i p h e r a l and dependent mode of p roduct ion , having to e x i s t
w i t h i n a s o c i a l fo rmat ion i t cannot d i r e c t l y in f luence . The
in fo rma l sec tor ' s nature and ex is tence depend on the formal
sector . Th is i s not to suggest that the in fo rma l sector i s
i r r e l e v a n t to the formal sector . . . " (R. Davies:1979, 89).
The recycler and picker are dependent on one another, the picker needs
a buyer f o r h is/her c o l l e c t i o n and the r e c y c l e r obtains h is raw
mater ia l (paper and p l a s t i c ) d i r e c t l y f rom the p icker or i n d i r e c t l y
through hawkers/brokers. As is shown in the Pinetown case the pickers
2 2
are not employed by the hawker/broker, even though they work for him
and so have no security of employment. Many pickers have been se l l i ng
to, and picking for , the same recycler for several years.
The pickers appear to be working for themselves, and not withstanding
the obvious dependent r e l a t i o n s h i p that p i cke rs have w i t h the
recyclers (some even gave 'independence' as the reason why they l iked
picking as opposed to wage employment). The picker can decide whether
or not to work, at what t imes to work, where to work and what to
co l l ec t and these factors probably create an i l l u s i o n of independence.
However, i t must be remembered that the p icker i s in f a c t not
independent but f i r m l y l inked into the indust r ia l system by his/her
dependence on the recyc ler , or scrapyard owner as buyers. The picker
is also affected by trends in the market. " I f the steel industry, fo r
example is in a c r i s i s so w i l l the scrap metal co l lectors be, l ikewise
i f the demand for waste paper increases i t is l i k e l y that they w i l l be
earning more" (Birbeck, 1979:181).
The quest ion a r i s e s why these p ickers are not employed on a more
permanent basis by the r e c y c l e r s . The Pinetown dump - r e c y c l e r ' s
answer, regarding in f lux control measures, may be val id, and re f lec ts
the desperate s i t u a t i o n the p icker f i nds h im/herse l f in . Under the
i n f l u x control laws, which were inforced at the time of the survey, i f
the p i cker does not possess a pass, he/she can be excluded from the
labour market. Th is a lso places the p i cker in a more vu lnerab le
economic posit ion, in that he/she cannot be formally employed, even
though the resul t of his/her labour can be bought and th is undermines
the re la t i ve bargaining strength of the picker.
2 3
However, one must accept that the lack of a pass can also provide the
r e c y c l e r w i t h a convenient excuse f o r not employing p ickers . The
r e c y c l e r t r i e s to keep h is costs low and i f he had to employ p ickers
he would, in a l l l i k e l i h o o d , have to pay the p i cker more and have to
take out some form of insurance to cover pickers against in ju r ies on
the dumps. He would also have to provide some form of pension and he
c o u l d run the r i s k of l a b o u r o r g a n i z a t i o n among p i c k e r s .
Consequently, quite apart from the issue of the pass, i t may wel l be
that i t suits the recycler to make use of the present system whereby
he buys waste from the picker on an informal basis. In th is respect,
i t w i l l be i n t e r e s t i n g to note what happens once i n f l u x c o n t r o l has
gone. H i l l the recycler then employ the pickers?
A l l other i tems are so ld among the p i c k e r s ' neighbours i n the
townships or in the squat ter areas. Hood (p lanks) , ' s a i l s ' and
'wallpaper' are sold to squatters as bui lding material. Wallpaper is
so ld fo r about 50c per metre, the sheets being 1,25m wide. Food and
clothes are usually for own use, but are also sold in some instances.
The p ickers do not s e l l from a shop or s t a l l or even a s p e c i f i e d
p lace, as some hawkers do. Some s e l l f rom t h e i r homes to o ld
customers, others merely se l l the i r wares in the street.
The picker who said that he manufactured something from the items he c o l l e c t e d was a man who had been a carpenter before he became a picker. He made doors, tables and chairs out of planks and wood found
24
on the dump, which he then sold to his neighbours.
The fact that nearly 92 percent of the pickers se l l the i r co l lec t ions ,
c lear l y indicates that they are a part of the monetised segment of the
informal sector of the economy.
5. INCOME EARNED FROM GARBAGE PICKING
The pickers were asked questions d i rec t l y pertaining to the i r income
from garbage picking. Since the majority of pickers - 57,3 percent -
sold the i r co l lect ions once a week, and those picking for recyclers
were also paid per week, a l l income f igures given below w i l l be given
on a weekly basis.
Of the twenty-nine pickers who pick for recyclers, 45 percent earned
on average R15 per week. W h i l s t the earnings of the others ranged
from between R2 and R30 per week. Even though these pickers were not
spec i f i ca l l y asked whether they also sold items elsewhere, in addit ion
to what they so ld to the r e c y c l e r s , one can assume that they d id , in
view of the fact that 64,6 percent of a l l pickers said that they sold
to thei r neighbours as wel l as in other townships, 52 percent sold to
scrapyards and 8,3 percent said that they so ld goods in squat ter
areas.
The f o l l o w i n g f i g u r e s g iven in Table 5.1 show the average weekly
earnings of the scavengers interviewed.
2 5
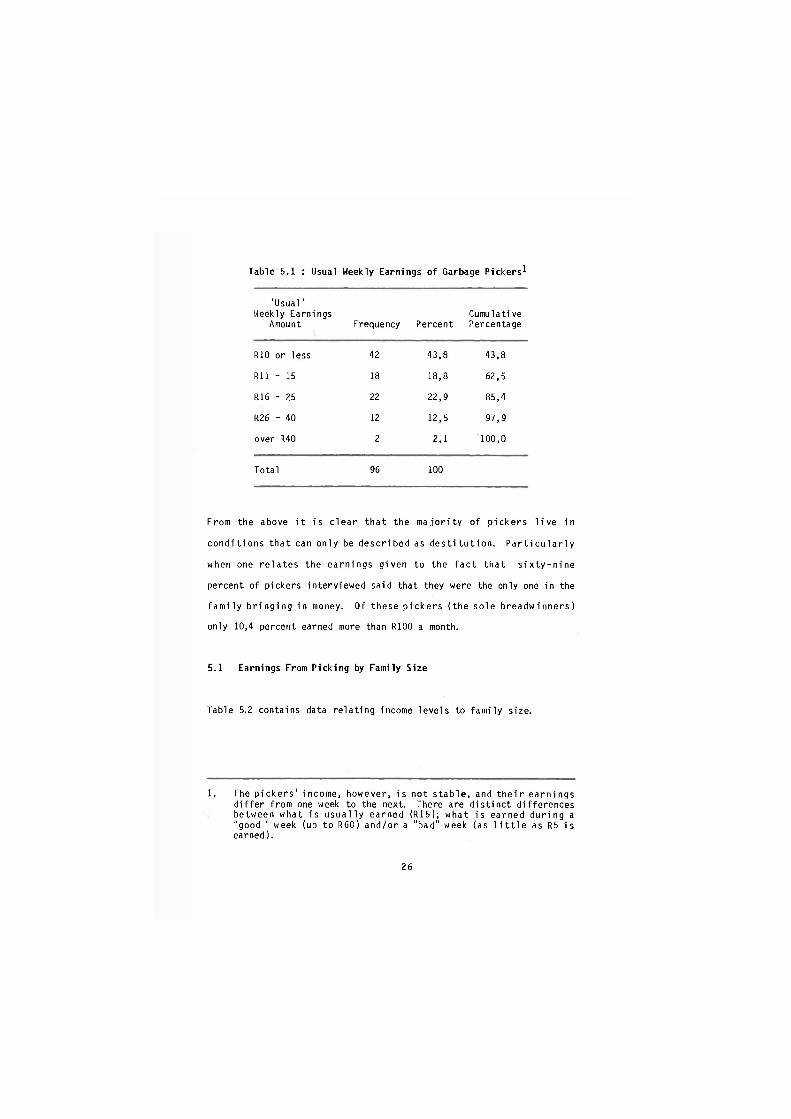
Table 5.1 : Usual Weekly Earnings of Garbage Pickers1
'Usual ' Weekly Earnings Cumulative
Amount Frequency Percent Percentage
RIO or less 42 43, ,8 43, ,8
R l l - 15 18 18, ,8 62, ,5
R16 - 25 22 22, ,9 85, ,4
R26 - 40 12 12, ,5 97, ,9
over R40 2 2, ,1 100, .0
Total 96 100
From the above i t i s c l ea r that the m a j o r i t y of p ickers l i v e i n
cond i t i ons that can only be descr ibed as d e s t i t u t i o n . P a r t i c u l a r l y
when one r e l a t e s the earnings g iven to the f a c t that s i x t y - n i n e
percent of pickers interviewed said that they were the only one in the
f a m i l y b r i n g i n g in money. Of these p i cke rs (the sole breadwinners)
only 10,4 percent earned more than R100 a month.
5.1 Earnings From Picking by Family Size
Table 5.2 contains data re la t ing income levels to family size.
1. The p i c k e r s ' income, however, i s not s t a b l e , and t h e i r earn ings d i f f e r from one week to the next. There are d i s t inc t differences between what i s u s u a l l y earned (R15); what i s earned dur ing a "good " week (up to R60) and/or a "bad" week (as l i t t l e as R5 i s earned).
2 6
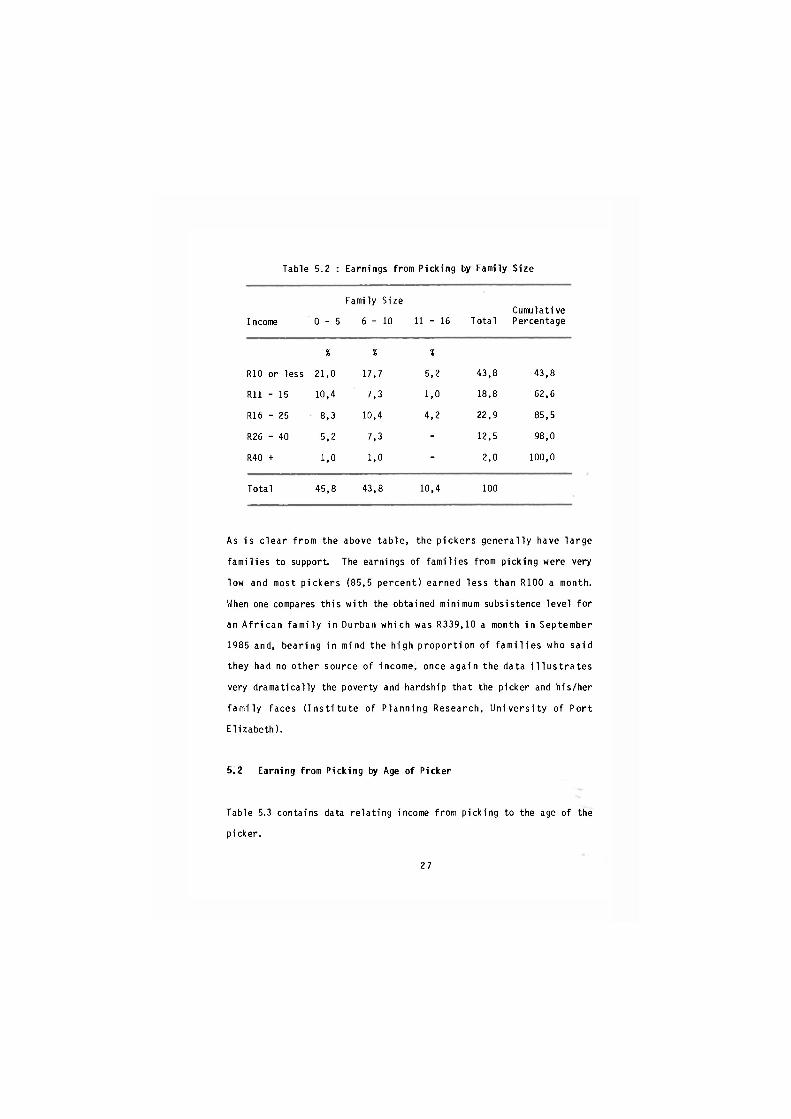
Table 5.2 : Earnings from Picking by Family Size
Income 0 - 5
Family Size
6 - 1 0 11 - 16 Total Cumulati ve Percentage
RIO or less
%
21,0
%
17,7
%
5,2 43,8 43,8
R l l - 15 10,4 7,3 1,0 18,8 62,6
R16 - 25 8,3 10,4 4,2 22,9 85,5
R26 - 40 5,2 7,3 - 12,5 98,0
R40 + 1,0 1,0 - 2,0 100,0
Total 45,8 43,8 10,4 100
As i s c lear from the above tab le , the p ickers genera l l y have la rge
fami l ies to support. The earnings of fami l ies from picking were very
low and most p ickers (85,5 percent) earned less than R100 a month.
When one compares th is wi th the obtained minimum subsistence level for
an A f r i c a n f a m i l y in Durban which was R339,10 a month i n September
1985 and, bearing in mind the high p r o p o r t i o n of f a m i l i e s who sa id
they had no other source of income, once again the data i l l u s t r a t e s
very dramatically the poverty and hardship that the picker and his/her
f a m i l y faces ( I n s t i t u t e of P lanning Research, U n i v e r s i t y of Po r t
E l i zabeth) .
5.2 Earning from Picking by Age of Picker
Table 5.3 contains data re lat ing income from picking to the age of the
picker.
2 7
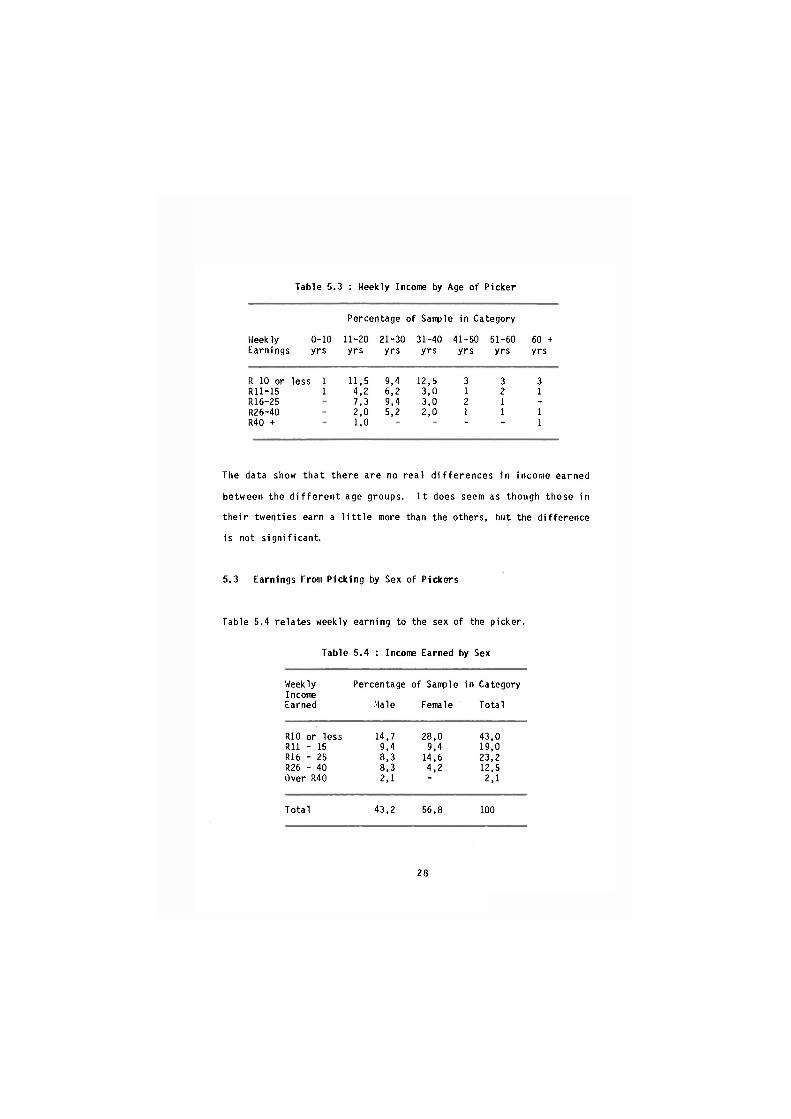
Table 5.3 : Weekly Income by Age ot" Picker
Percentage of Sample in Category
Weekly 0-10 11-20 21-30 31-40 41-50 51-60 60 + Earnings yrs y rs y rs yrs y rs yrs yrs
R 10 or less 1 11, ,5 9, ,4 12,5 3 3 3 Rl l -15 1 4, ,2 6, ,2 3,0 1 2 1 R16-25 7, ,3 9, ,4 3,0 2 1 -
R26-40 2, ,0 5, ,2 2,0 1 1 1 R40 + 1, ,0
" "
1
The data show that there are no rea l d i f f e r e n c e s in income earned
between the d i f f e r e n t age groups. I t does seem as though those in
the i r twenties earn a l i t t l e more than the others, but the difference
is not s ign i f i cant .
5.3 Earnings From Picking by Sex of Pickers
Table 5.4 relates weekly earning to the sex of the picker.
Table 5.4 : Income Earned by Sex
Weekly Percentage of Sample in Category Income Earned Male Female Total
R10 or less 14,7 28,0 43,0 R l l - 15 9,4 9,4 19,0 R16 - 25 8,3 14,6 23,2 R26 - 40 8,3 4,2 12,5 Over R40 2,1 ~ 2,1
Total 43,2 56,8 100
2 8
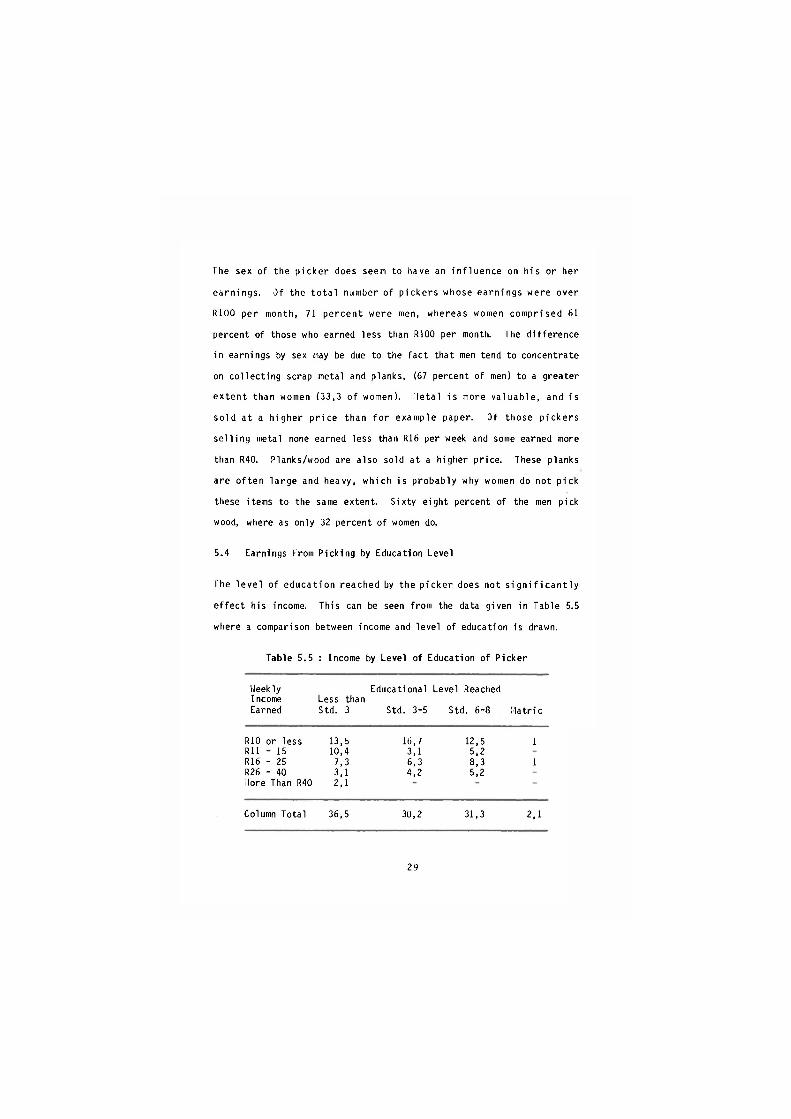
The sex of the p i c k e r does seem to have an in f luence on h is or her
earnings. Of the t o t a l number of p ickers whose earnings were over
R100 per month, 71 percent were men, whereas women comprised 61
percent of those who earned less than R100 per month. The difference
in earnings by sex may be due to the fact that men tend to concentrate
on col lect ing scrap metal and planks, (67 percent of men) to a greater
ex ten t than women (33,3 of women). Metal i s more va luab le , and i s
so ld at a higher p r i c e than f o r example paper. Of those p i cke rs
se l l ing metal none earned less than R16 per week and some earned more
than R40. Planks/wood are also sold at a higher price. These planks
are o f ten la rge and heavy, which i s probably why women do not p ick
these items to the same extent. S ix ty eight percent of the men pick
wood, where as only 32 percent of women do.
5.4 Earnings From Picking by Education Level
The l e v e l of educat ion reached by the p icker does not s i g n i f i c a n t l y
e f fect his income. This can be seen from the data given in Table 5.5
where a comparison between income and level of education is drawn.
Table 5.5 : Income by Level of Education of Picker
Weekly Educational Level Reached Income Less than Earned Std. 3 Std. 3-5 Std. 6-8 l la t r i c
RIO or less 13,5 16,7 12,5 1 R l l - 15 10,4 3,1 5,2 R16 - 25 7,3 6,3 8,3 1 R26 - 40 3,1 4,2 5,2 ilore Than R40 2,1
Column Total 36,5 30,2 31,3 2,1
2 9
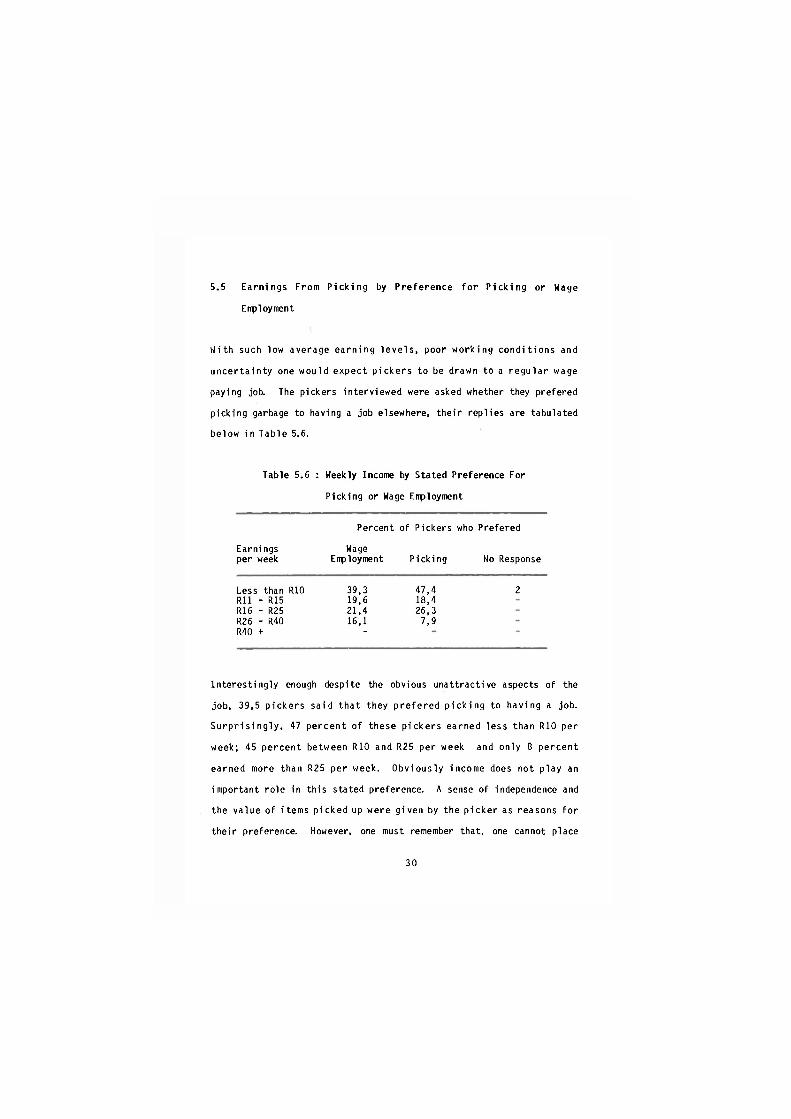
5.5 Earnings From P i c k i n g by Pre ference f o r P i c k i n g or Wage
Eirployment
With such low average earning l e v e l s , poor working cond i t i ons and
u n c e r t a i n t y one would expect p ickers to be drawn to a r e g u l a r wage
paying job. The pickers interviewed were asked whether they prefered
picking garbage to having a job elsewhere, the i r repl ies are tabulated
below in Table 5.6.
Table 5.6 : Weekly Income by Stated Preference For
Picking or Wage Employment
Percent of Pickers who Prefered
Earnings Wage per week Eirployment Picking No Response
Less than RIO 39,3 47,4 2 R l l - R15 19,6 18,4 R16 - R25 21,4 26,3 R26 - R40 16,1 7,9 R40 + -
In terest ing ly enough despite the obvious unattract ive aspects of the
job, 39,5 p ickers sa id that they p re fe red p i c k i n g to having a job.
S u r p r i s i n g l y , 47 percent of these p i cke rs earned less than RIO per
week; 45 percent between RIO and R25 per week and only 8 percent
earned more than R25 per week. Obv ious l y income does not p lay an
important role in th is stated preference. A sense of independence and
the value of items picked up were g iven by the p i cker as reasons fo r
thei r preference. However, one must remember that, one cannot place
3 0
too much emphasis on th is type of response since people have st rong
tendencies to r a t i o n a l i s e t h e i r ex i s tence in order to ad jus t to the
emotional st resses caused by unpleasant s i t u a t i o n s . An outcome of
such a ra t iona l i sa t ion would be the transformation of a s i tuat ion of
'no choice ' i n t o one in which a choice was perce ived to have been
exercised - in other words pickers who f e l t that they had no chance of
obtaining a wage job would say that they preferred picking.
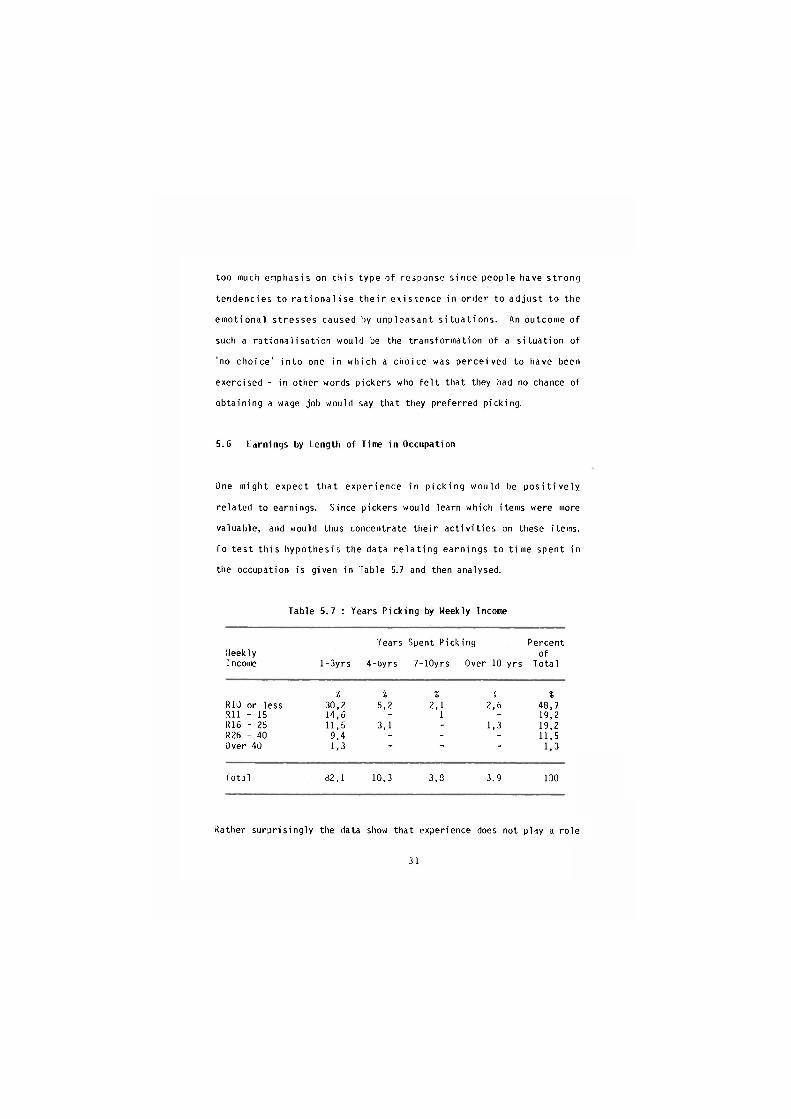
5.6 Earnings by Length of Time in Occupation
One might expect that exper ience in p ick ing would be p o s i t i v e l y
related to earnings. Since pickers would learn which items were more
valuable, and would thus concentrate thei r a c t i v i t i e s on these items,
fo tes t t h i s hypothesis the data r e l a t i n g earnings to t ime spent in
the occupation is given in Table 5.7 and then analysed.
Table 5.7 : Years Picking by Weekly Income
Years Spent Picking Percent Weekly of Income l - 3 y r s 4-6yrs 7-10yrs Over 10 yrs Total
i i % 5 % RIO or less 30,2 5,2 2,1 2, ,6 48,7 R l l - 15 14,6 - 1 - 19,2 R16 - 25 11,5 3,1 - 1, ,3 19,2 R26 - 40 9,4 - - - 11,5 Over 40 1,3 - - - 1,3
Total 32,1 10,3 3,3 3. 9 100
Rather surpr is ing ly the data show that experience does not play a ro le
3 1
in determining income levels , since those who earn most, (between R26
and R40+) had only been picking for 1 to 3 years.
I t is of course possible that the amount of time spent on the dumps is
a more important determinant of income and is able to of fset the gains
from experience, i.e the less experienced pickers work longer hours.
This is discussed in Section 5.8 below.
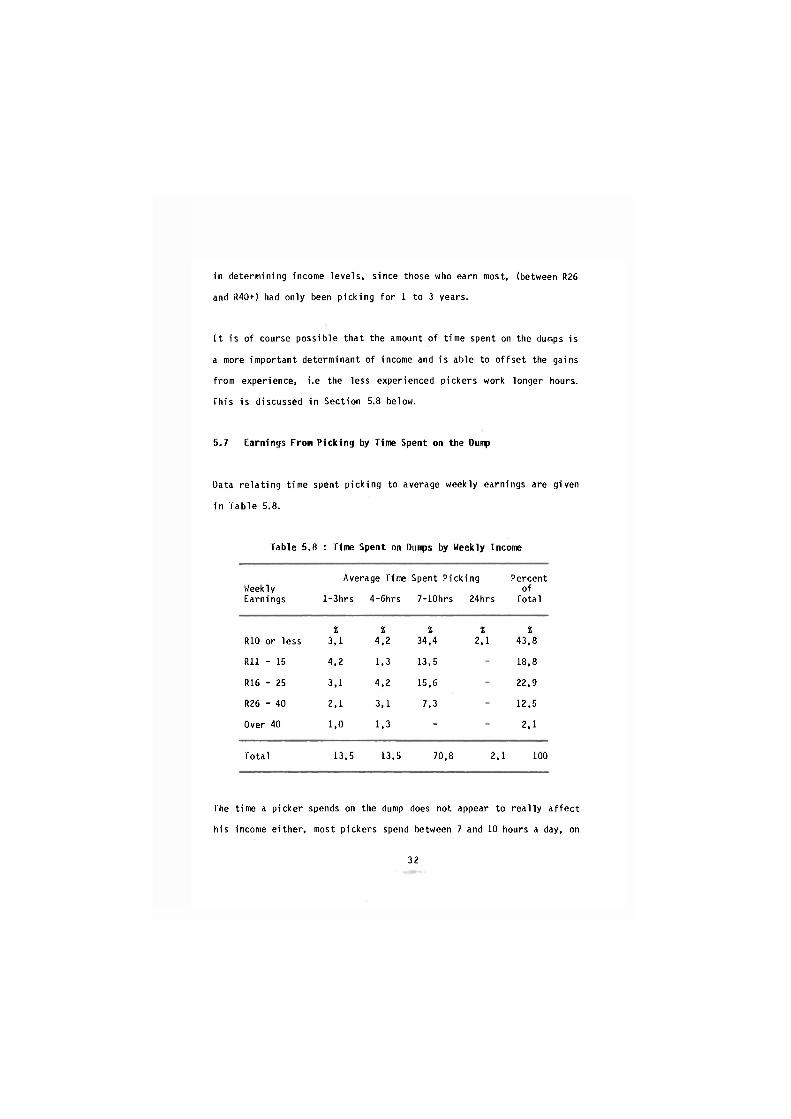
5.7 Earnings From Picking by Time Spent on the Dunp
Data re lat ing time spent picking to average weekly earnings are given
in Table 5.8.
Table 5.8 : Time Spent on Dunps by Weekly Income
Average Time Spent Picking Percent Weekly of Earnings l -3hrs 4-6hrs 7-10hrs 24hrs Total
% % % % % RIO or less 3,1 4,2 34,4 2,1 43,8
R l l - 15 4,2 1,3 13,5 18,8
R16 - 25 3,1 4,2 15,6 22,9
R26 - 40 2,1 3,1 7,3 12,5
Over 40 1,0 1,3 - 2,1
Total 13,5 13,5 70,8 2,1 100
The time a picker spends on the dump does not appear to rea l l y a f fec t
his income ei ther , most pickers spend between 7 and 10 hours a day, on
3 2
the dump and 34,4 percent of p ickers s t i l l earned less than RIO per
week, even though they spent between 7 and 10 hours a day p i ck ing .
Only two pickers earned more than R40 a week and both said that they
spend less than 5 hours a day p ick ing . I t i s c l ea r that the l e v e l of
income earned i s more dependent on f a c t o r s such as, the i tem
c o l l e c t e d , the buyer, and the e f f o r t the p icker puts in. Those
p ickers who do pick everyday seem to earn more than those who pick
once or twice a week.
5.8 Earning Leve ls i n Garbage P i ck ing R e l a t i v e to Other I n f o r m a l
A c t i v i t i e s
Studies of the informal sector in general have shown that on average
earning levels are low. Studies undertaken r e l a t i v e l y recently in the
Greater Durban Area conf i rm these general f i n d i n g s and i t i s
i n t e r e s t i n g to see where the garbage p ickers f i t in to the in fo rma l
economic hierarchy of occupations.
I t was found that in the in fo rma l sec tor in the Inanda and Clermont
area, hawking and a r t i s a n a l a c t i v i t i e s were the lowest earning
categories, wh i l s t bui lding and entertainment were the categories that
offered the highest earning levels (Uattrass and Glass, 1986). Table
5.9 contains data comparing the d is t r ibu t ion of earnings from hawking
and art isanal work in the Inanada/Clermont study wi th those found in
t h i s study.
3 3
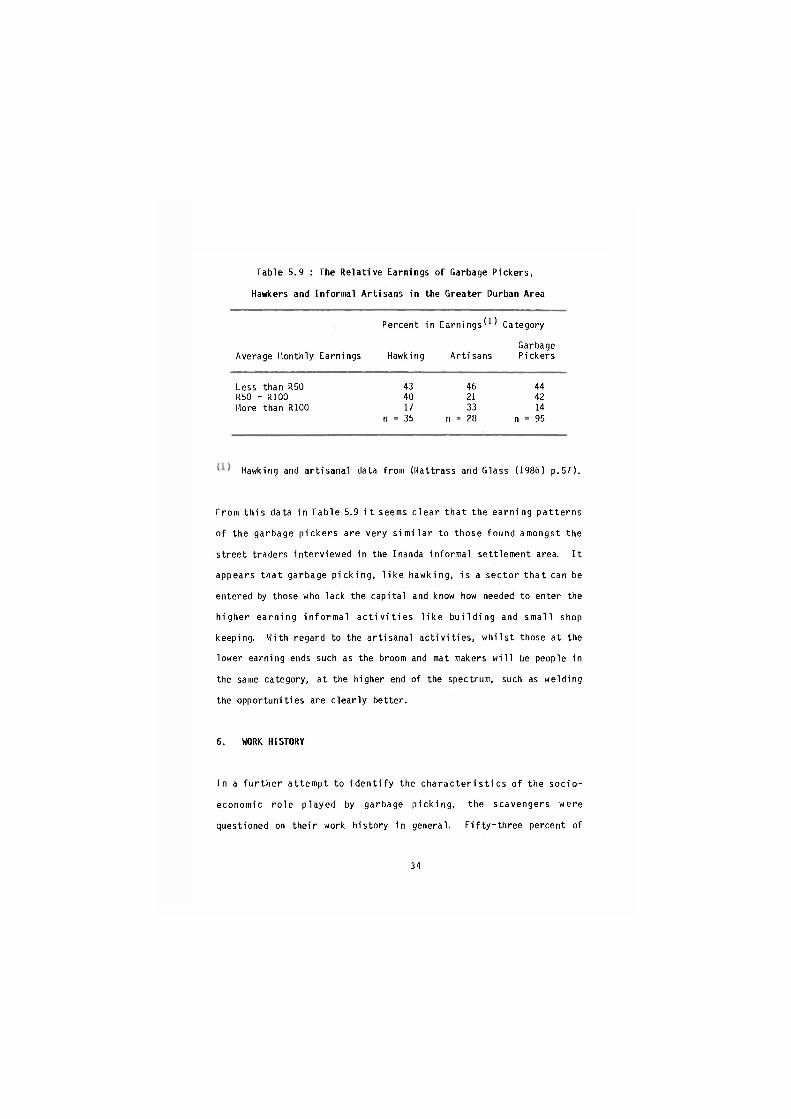
Table 5.9 : The Relat ive Earnings of Garbage Pickers,
Hawkers and Informal Art isans in the Greater Durban Area
Percent in Earn ings ' 1 ' Category
Garbage Average Monthly Earnings Hawking Art isans Pickers
Less than R5D 43 46 44 R50 - R100 40 21 42 More than R100 17 33 14
n = 35 n = 28 n = 95
Hawking and art isanal data from (Nattrass and Glass (1986) p.57).
From t h i s data in Table 5.9 i t seems c lea r that the earning pat terns
of the garbage p ickers are very s i m i l a r to those found amongst the
street traders interviewed in the Inanda informal settlement area. I t
appears that garbage p i c k i n g , l i k e hawking, i s a sec tor that can be
entered by those who lack the capital and know how needed to enter the
h igher earning in fo rma l a c t i v i t i e s l i k e b u i l d i n g and smal l shop
keeping. With regard to the art isanal a c t i v i t i e s , wh i l s t those at the
lower earning ends such as the broom and mat makers w i l l be people in
the same category, at the higher end of the spectrum, such as welding
the opportunities are c lear l y better.
6. WORK HISTORY
In a f u r t h e r attempt to i d e n t i f y the c h a r a c t e r i s t i c s of the s o c i o -
economic r o l e p layed by garbage p i c k i n g , the scavengers were
questioned on the i r work history in general. F i f t y - t h r e e percent of
34
the pickers interviewed said that they had never had a steady paying
job. Of these 58 percent were women and 38 percent men.
Members of the subsample of 47 p ickers who had p r e v i o u s l y been
employed were asked what the i r last job was, why they l e f t that job,
what they had earned and how long ago they had held a job.
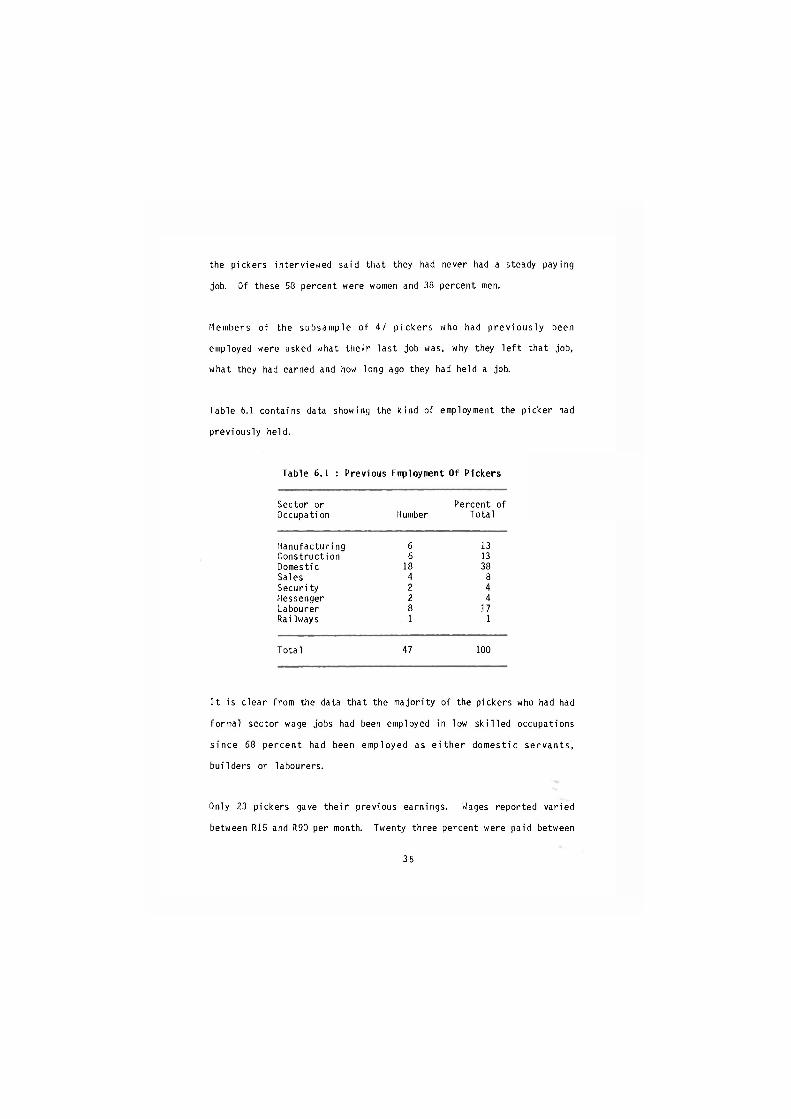
Table 6.1 contains data showing the kind of employment the picker had
previously held.
Table 6.1 : Previous Enployment Of Pickers
Sector or Percent of Occupati on Number Total
Manufacturing 6 13 Construction 6 13 Domestic 18 38 Sales 4 8 Securi ty 2 4 Messenger 2 4 Labourer 8 17 RaiIways 1 1
Total 47 100
I t is clear from the data that the majority of the pickers who had had
formal sector wage jobs had been employed in low s k i l l e d occupations
s ince 68 percent had been employed as e i t h e r domestic servants ,
builders or labourers.
Only 23 pickers gave the i r previous earnings. Wages reported varied
between R15 and R90 per month. Twenty three percent were paid between
3 5
Rbl and R70 a month. (These f i g u r e s can on ly be taken as a rough
ind icat ion , since most pickers have been p ick ing for more than a year ,
and i t i s d i f f i c u l t to determine jus t when they become unemployed).
The reasons g i ven f o r l e a v i n g the p r e v i o u s job v a r i e d . Ten of the
t h i r t y - e i g h t (26%) who answered the q u e s t i o n s a i d they had been
r e t r e n c h e d - they were a l l men. W h i l s t amongst the o ther reasons
g i v e n were h e a l t h reasons (16%), inadequate wages (13%), and f i r m s
c losure (24%).
Scavenging i s c l e a r l y one of the l a s t r e s o r t s of the unemployed.
Those who said that they would rather be formal l y employed (58,3%) as
opposed to c o n t i n u i n g to p i c k , gave the f o l l o w i n g reasons : ( i )
p icking i s not s t imu la t ing work; ( i i ) they need to earn more; ( i i i ) i t
i s regarded as a low s t a t u s job ; ( i v ) p i c k e r s need a permanent j o b ;
( v ) t h e i r work i s i n s e c u r e , i n t h a t they can be e v i c t e d a t any t ime;
( v i ) p i c k e r s have no access to a workers union and ( v i i ) the p i c k e r
has an education or trade which he is not using wh i le picking. When
asked whether they were ac tua l l y looking fo r another job 85,4 percent
r e p l i e d t h a t they were. The p o s s i b l e reasons f o r t h i s r e p l y w i l l
become clear in the next sect ion dealing w i t h working condit ions and
general hardship the picker has to contend wi th .
7. WORKING CONDITIONS AND HARDSHIP
As can be imagined, the physical environment in which the pickers work
is not very pleasant. This i s c l e a r l y r e f l e c t e d in the answers given
3 6
to the questions "What do you d is l i ke about this work?", "What is your
g reatest problem in doing t h i s work?" and "What would you l i k e to
change about t h i s work?" In answer to two of the quest ions the
m a j o r i t y i n d i c a t e d that the smel l of the dump was o f f e n s i v e . Many
c i t e d the d i r t , broken g lass , r o t t e n food and poisons, the high r i s k
of becoming i l l , as wel l as the weather.
7.1 Harrassment
From the answers to above quest ions i t was a lso c l e a r that p ickers
have to contend w i t h cont inua l harrassment from p o l i c e , munic ipal
author i t ies and the waste company working the part icu lar dump. The
f i n e f o r p i c k i n g i s R20. A l t h o u g h o n l y n ine o f the p i c k e r s
i n t e r v i e w e d had a c t u a l l y been f ined , in rep l y to the quest ion "What
would you l i k e to change about t h i s job?" twenty nine p ickers sa id
that they would l i ke the harrassment to stop. Pickers f e l t that they
should be a l lowed to pick on the dumps f r e e l y and that the e f f e c t of
the harrassment was to prevent them from feeding the i r fami l ies.
From conversat ions w i t h the p ickers i t appeared that when a rumour
reached them that the pol ice or the author i t ies would be v i s i t i n g , the
p ickers s imply l e f t the dumps and, wa i ted and watched from a safe
distance away, u n t i l the police or author i t ies l e f t the s i te . Should
this happen without pr io r warning many pickers would simply run away
and hide in the surrounding bush.
When questioned on what the att i tudes of the pol ice or the author i t ies
were to picking, pickers said that they had been to ld the fo l lowing:
3 7
1. You are stealing
2. You are not allowed to pick garbage
3. You are i l l e g a l , and do not have the r i g h t to be in the area
4. You are contravening the provisions of the Group Areas Act
5. You people cause trouble.
From interviews held wi th the Umhlanga and Pinetown munic ipal i t ies as
we l l as w i th Waste Tech i t was clear that the presence of pickers on
the dumps was not desired. Indeed i t was these author i t ies who, in an
attempt to get r i d of the pickers, cal led in the pol ice.
Amongst the reasons g iven as to why p i cke rs are not welcome on the
dumps, are the fo l lowing :
1) Huge t ractors , with spoked wheels, are used to crush the garbage
and bu l ldoze rs as w e l l as t i p p i n g l o r r i e s , are used on the dump
continual ly throughout the day. I t is feared that a picker might
be i n j u r e d or k i l l e d by these machines, which i s a l i k e l y
occurance since the pickers swarm around the trucks, as they t ip
the garbage and indeed some p ickers and employed workers had
a c t u a l l y been i n j u r e d . The m u n i c i p a l i t i e s and Waste Tech fear
the p u b l i c i t y and the p o s s i b i l i t y of a la rge insurance c l a i m
resul t ing from an accident.
2) The presence of pickers does not f i t the image Waste-tech wants
to br ing across to the pub l i c . The idea i s that Waste- tech, by
working these la rge dumps, w i l l improve the environment and
3 8
that parks, s p o r t f i e l d s and other recreat ional f a c i l i t i e s w i l l
eventually be created on the site.
3) The dumps are a lso an unpleasant s i g h t and attempts have been
made on other garbage s i t e s to hide the dump. Wal ls are b u i l t
around the dump and f lower gardens are made to beautify the spot
The presence of pickers makes the picture even more unattract ive.
4) The heal th department i s concerned about the health conditions
found on the dump and regular ly warns the pickers against poisons
and diseases. As with pol ice harrassment, these warnings do not
succeed in keeping pickers away.
In an attempt to stop p i c k i n g , the strong measures that have been
considered, include the erection of e l e c t r i f i e d fencing and the use of
co i l s of barbed wi re , around the dumps.
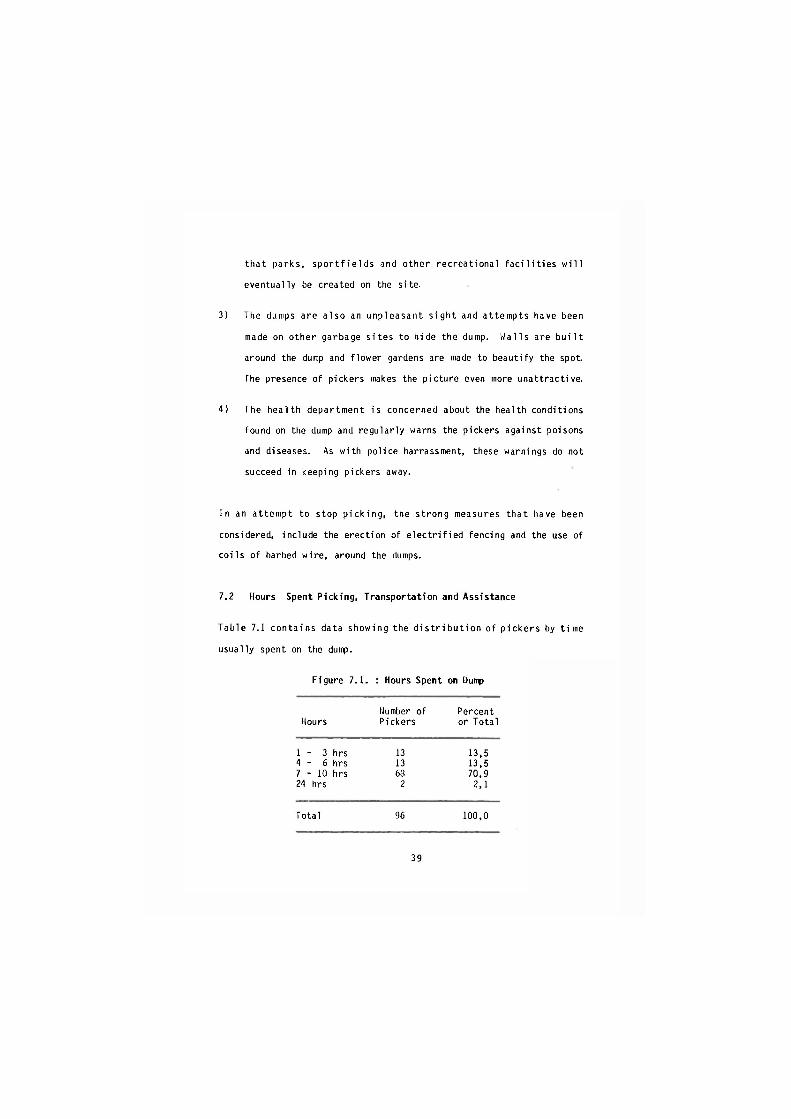
7.2 Hours Spent Picking, Transportation and Assistance
Table 7.1 conta ins data showing the d i s t r i b u t i o n of p i cke rs by t ime
usually spent on the dunp.
Figure 7.1. : Hours Spent on Durp
Number of Percent Hours Pickers or Total
1 - 3 hrs 13 13,5 4 - 6 hrs 13 13,5 7 - 10 hrs 63 70,9 24 hrs 2 2,1
Total 96 100,0
3 9
/•lost p ickers picked every day (42%) or t w i c e a week (6,3%), ( f o r t y
p ickers d id not respond to t h i s quest ion) . Host p ickers (70%) spent
between 7 and 10 hours a day on the dumps. Two pickers spent 24 hours
on the dump, which s i gn i f i es that they l ive/sleep in the bush around
the actual dump. The r e s t of the p i cke rs spent between one and s i x
hours on the dump.
P ickers of a l l ages pick between seven and ten hours a day. Those
p ickers who only picked 1 to 3 hours a day vary in age from under 10
to 50 years .
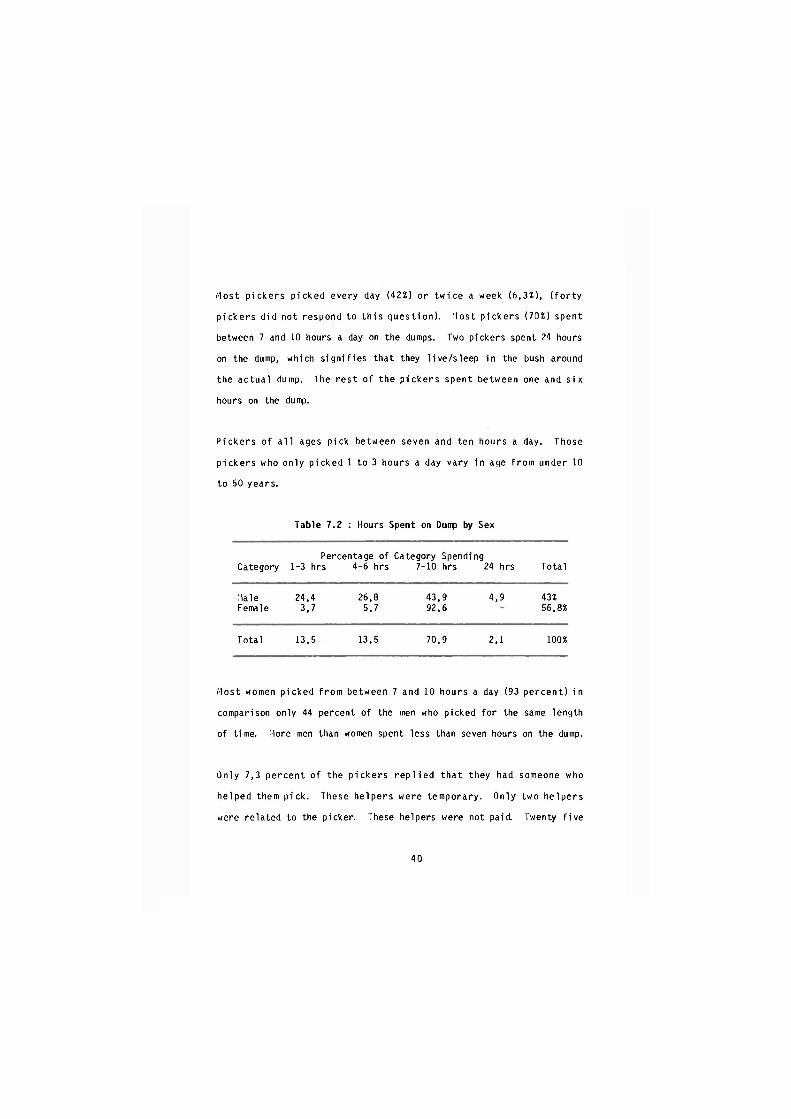
Table 7.2 : Hours Spent on Dunp by Sex
Percentage of Category Spending Category 1-3 hrs 4-6 hrs 7-10 hrs 24 hrs Total
Male 24,4 26,8 43,9 4,9 43% Female 3,7 5,7 92,6 56,8%
Total 13,5 13,5 70,9 2,1 100%
Most women picked from between 7 and 10 hours a day (93 percent ) i n
comparison only 44 percent of the men who picked for the same length
of time. More men than women spent less than seven hours on the dump.
Only 7,3 percent of the p i cke rs r e p l i e d that they had someone who
helped them pick. These helpers were temporary. Only two he lpers
were related to the picker. These helpers were not paid. Twenty f i ve
4 0
pickers (26%) co l l ec t in groups; twenty of them being the group from
W e s t v i l l e who s e l l p l a s t i c to the businessman on a r e g u l a r basis.
Those pickers working in groups do not, however, swop items, in fact ,
none of the pickers swop items.
As far as could be attained the pickers did not have to pay anyone to
gain access to the dumps. A l though, s ince b r i b e r y i s i l l e g a l , t h i s
question may not have been accurately answered.
The m a j o r i t y of the p ickers walked to the dumps (75 percent ) , 19
percent made use of a bus to get to the dump, 3 percent used the t ra in
and the remainder made use of other means of t r a n s p o r t a t i o n .
C o l l e c t i o n s were t ranspor ted in the same manner, except that more
p ickers made use of a bus. I t cost the p ickers between R3 and R14 a
week to get to the dumps and back.
7.3 Reason why person picks
I n answer to the quest ion, "Why d id you s t a r t doing t h i s work?" 59
percent answered that they started scavenging in order to provide for
the basic needs of t h e i r f a m i l i e s : these needs were food, c l o t h i n g ,
rent, etcetera. Other reasons given were as fo l lows:
scavenging because of unenployment; 23 percent.
enable t h e i r c h i l d r e n to go to school ; 13,5 percent.
retrenched from their previous jobs; 11 percent.
no education and were therefore unemployed; 5 percent.
4 1
no pass or permit to work in Durban; 7 percent.
because of the valuable items they found on the dump; 7 percent.
The pickers were asked what they l iked about picking - the answers are
l i s ted below:
Ho comment 3
provides them with basic
needs (food, clothes, shelter , e t c . ) 68
No one to cheat me 2
do not need a permit 1
Independence 3
Can afford to send chi ldren to school 8
Nothing - no a l ternat ive 11
Extra income 2
Find valuable items 10
"People are kind" - group feel ing 11
The bread and b u t t e r issue seems by f a r to be the most impor tant , a
clear indicator of the poverty of these pickers.
7.4 Status i n Coanunity
The p ickers perce ived themselves to be viewed w i t h susp ic ion ,
r id icu led and despised by the i r community. Some accept pickers only
because they se l l goods cheaply. Others are sympathetic towards the
pickers and often give them old clothes. Nine pickers kept the fact
that they picked a secret.
4 2
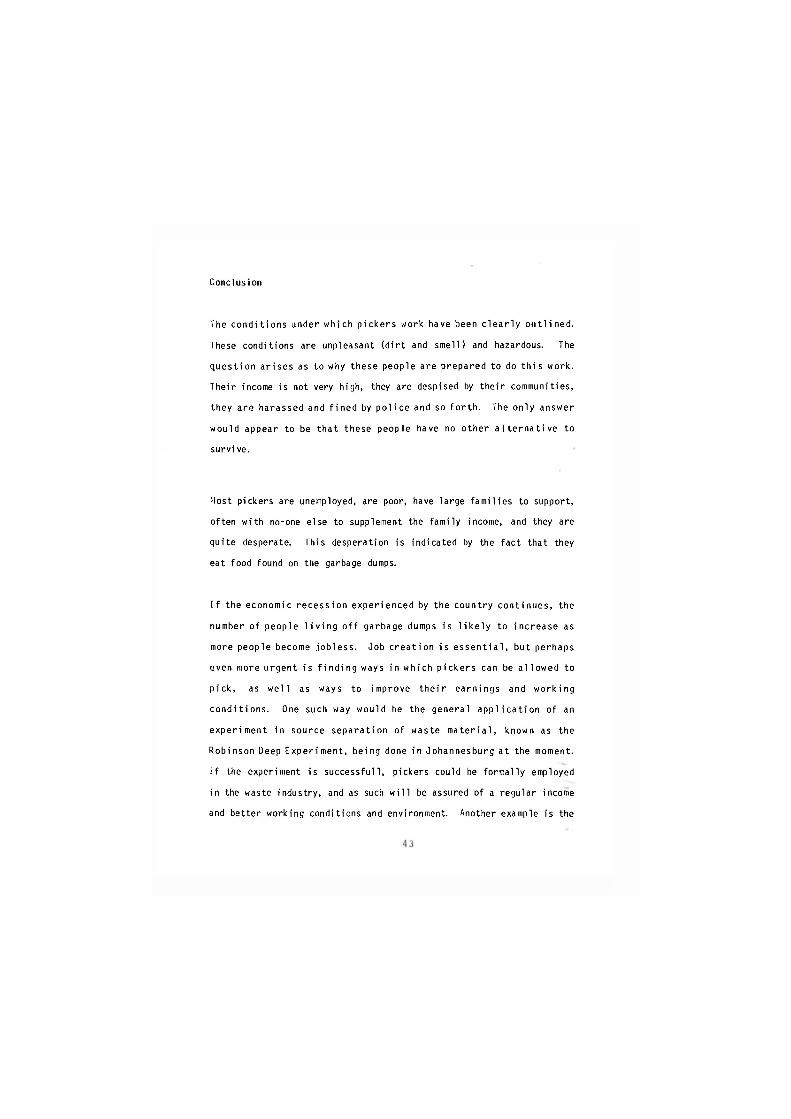
Conclusion
The cond i t ions under which p ickers work have been c l e a r l y o u t l i n e d .
These conditions are unpleasant (d i r t and smell) and hazardous. The
quest ion a r i ses as to why these people are prepared to do t h i s work.
Their income is not very high, they are despised by thei r communities,
they are harassed and f i n e d by p o l i c e and so f o r t h . The only answer
would appear to be that these people have no other a l t e r n a t i v e to
survive.
Most pickers are unemployed, are poor, have large fami l ies to support,
often wi th no-one else to supplement the family income, and they are
quite desperate. This desperation is indicated by the fact that they
eat food found on the garbage dumps.
I f the economic recess ion exper ienced by the country cont inues, the
number of people l i v i n g o f f garbage dumps i s l i k e l y to increase as
more people become job less . Job c r e a t i o n i s e s s e n t i a l , but perhaps
even more urgent i s f i n d i n g ways i n which p ickers can be a l lowed to
p ick , as w e l l as ways to improve t h e i r earnings and working
cond i t ions . One such way would be the general a p p l i c a t i o n of an
exper iment in source separat ion of waste m a t e r i a l , known as the
Robinson Oeep Exper iment , being done in Johannesburg at the moment.
I f the experiment is successful l , pickers could be formally employed
in the waste industry, and as such w i l l be assured of a regular income
and better working conditions and environment. Another example is the
Spr ingf ie ld dump, where a successful compromise was reached. In th is
case pickers are allowed to pick f reely af ter hours, between 4 and 6
pm, af ter the machines have stopped and before the gates are locked.
P i ck ing does prov ide a haven f o r the unemployed and stands between
starvation and surv iva l !
4 4
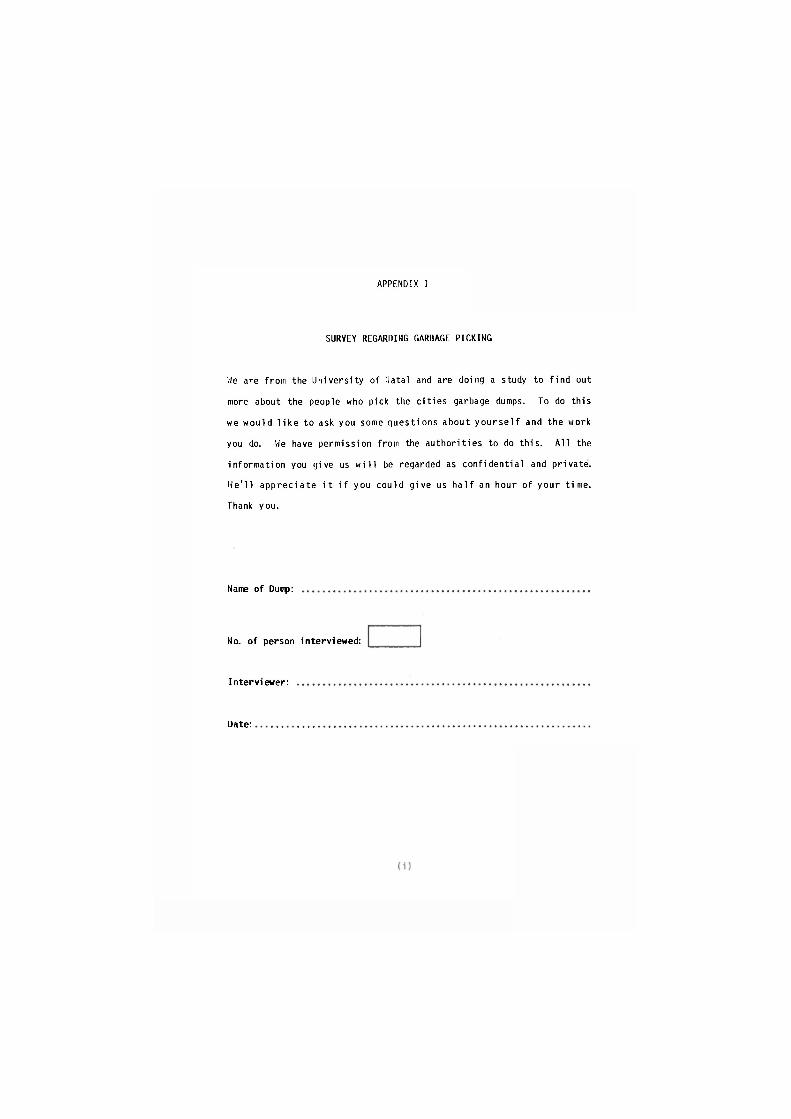
APPENDIX I
SURVEY REGARDING GARBAGE PICKING
He are from the Univers i ty of llatal and are doing a study to f ind out
more about the people who pick the c i t i e s garbage dumps. To do this
we would l i k e to ask you some questions about y o u r s e l f and the work
you do. He have permission from the author i t ies to do this . A l l the
information you give us w i l l be regarded as conf ident ial and private.
H e ' l l apprec iate i t i f you could g ive us h a l f an hour of your t ime.
Thank you.
Name of Dunp:
No. of person interviewed:
Interviewer:
Date:
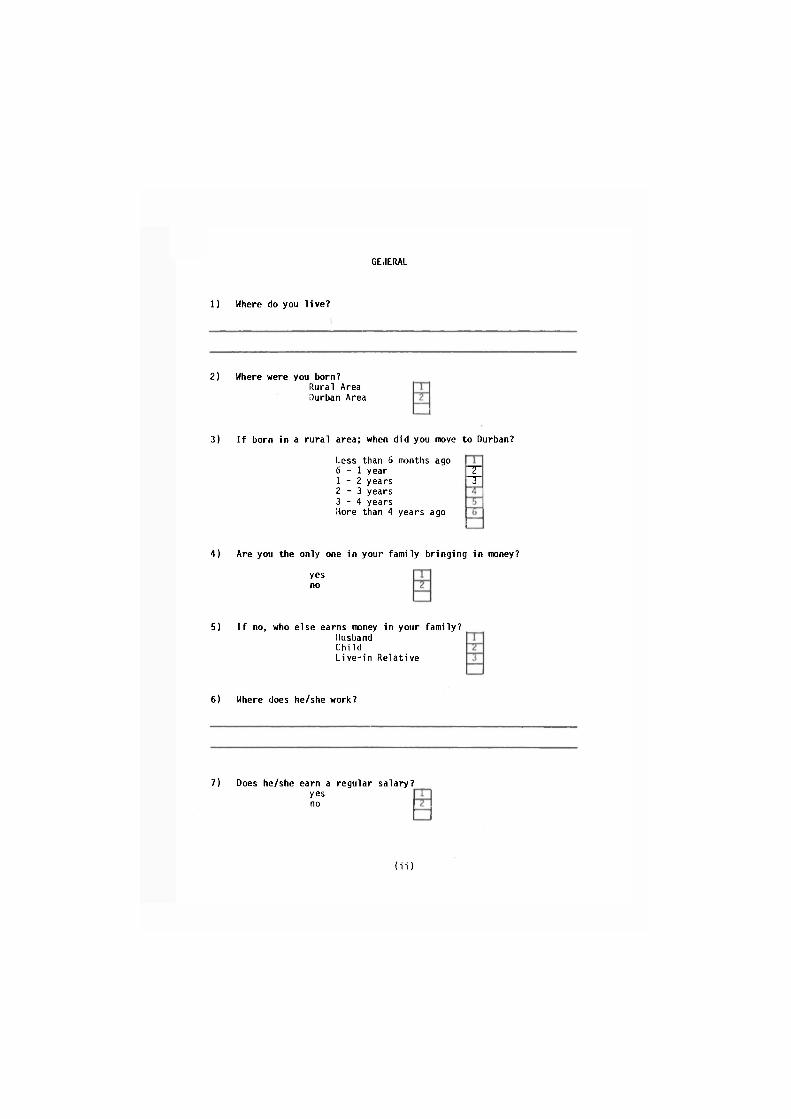
GENERAL
1) Where do you l i ve?
2) Where were you born? Rural Area Durban Area
3) I f born in a rura l area; when did you move to Durban?
Less than 6 months ago 6 - 1 year 1 - 2 years 2 - 3 years 3 - 4 years More than 4 years ago
T " T
4) Are you the only one in your family bringing in money?
yes no
5) I f no, who else earns money in your family? Husband Chi ld L i v e - i n Relat ive
6) Where does he/she work?
7) Does he/she earn a regular salary? yes no
(ii)
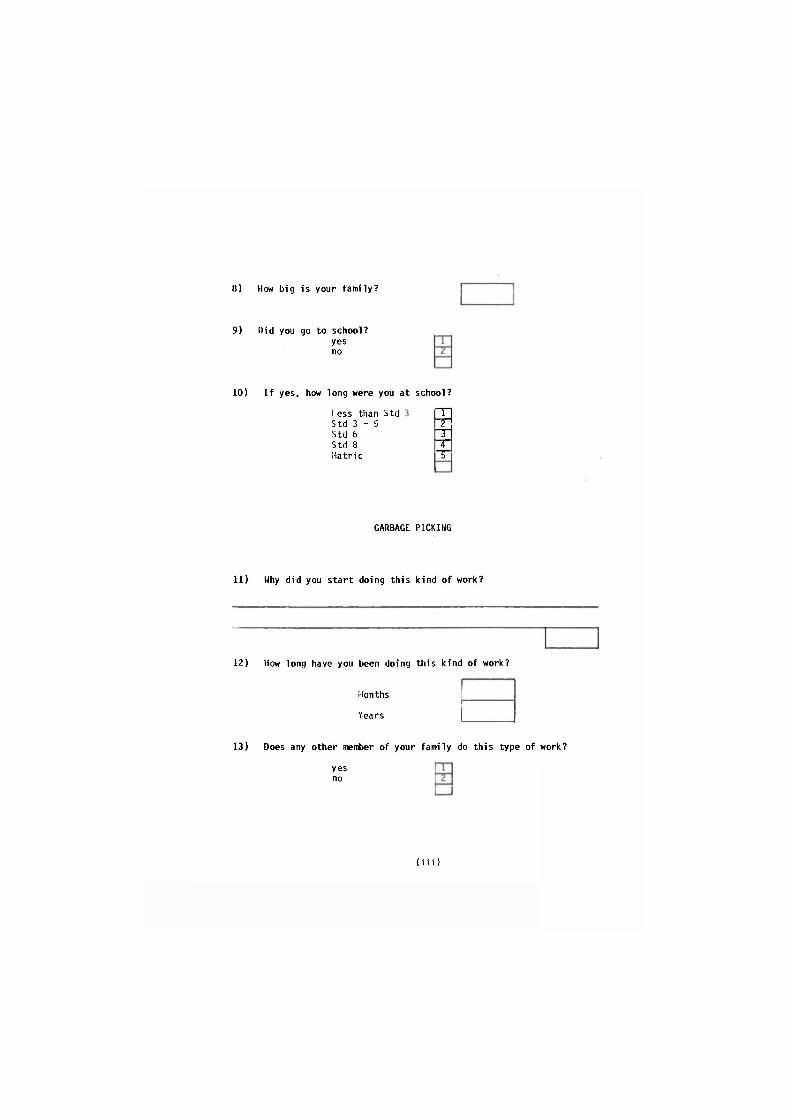
8) How big is your family?
9) Did you go to school? yes no
10) I f yes, how long were you at school?
Less than Std Std 3 - 5 Std 6 Std 8 Matric
i - r
GARBAGE PICKING
11) Why did you s ta r t doing th is kind of work?
12) How long have you been doing this kind of work?
Months
Years
13) Does any other member of your family do th is type of work?
yes no
(iii)
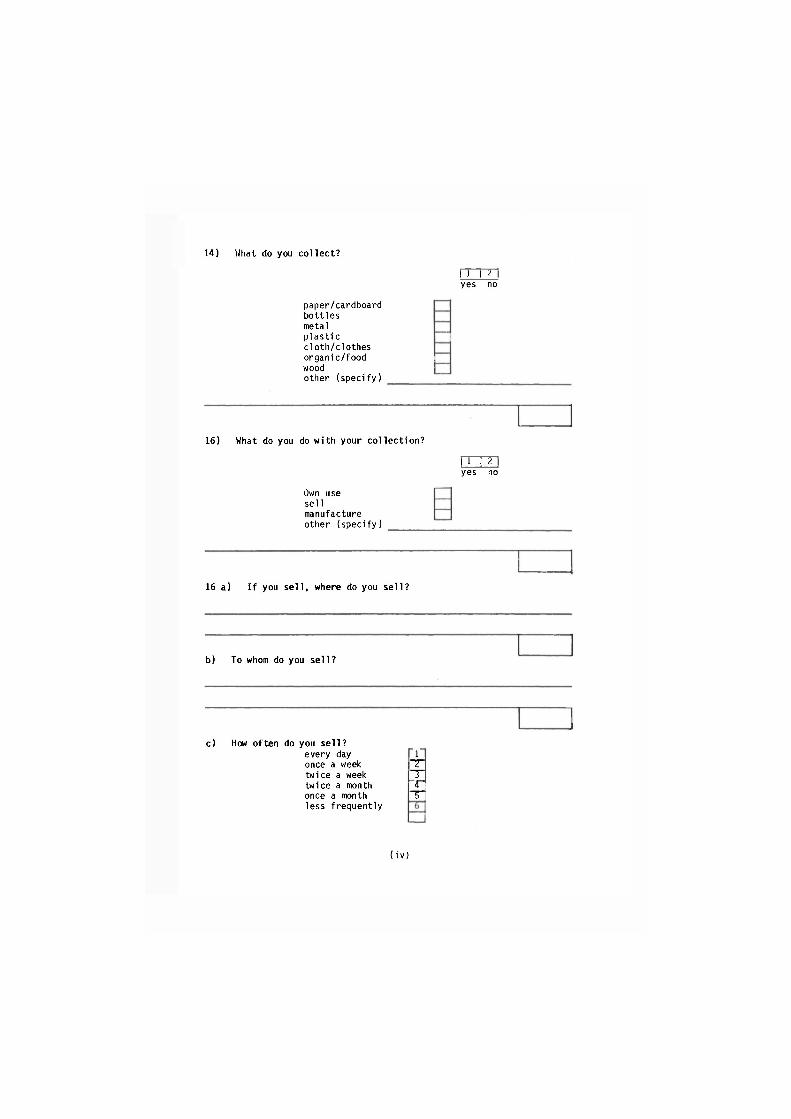
14) What do you co l lect?
paper/cardboard bott les metal p las t i c cloth/clothes organic/food wood other (speci fy )
H~T~H yes no
16) What do you do with your col lect ion?
Q n x i yes no
Own use se l l manufacture other (speci fy )
16 a) I f you s e l l , where do you se l l ?
b) To whom do you se l l ?
c) How often do you se l l? every day once a week twice a week twice a month once a month less frequently
1 ~T T j T T l
(iv)
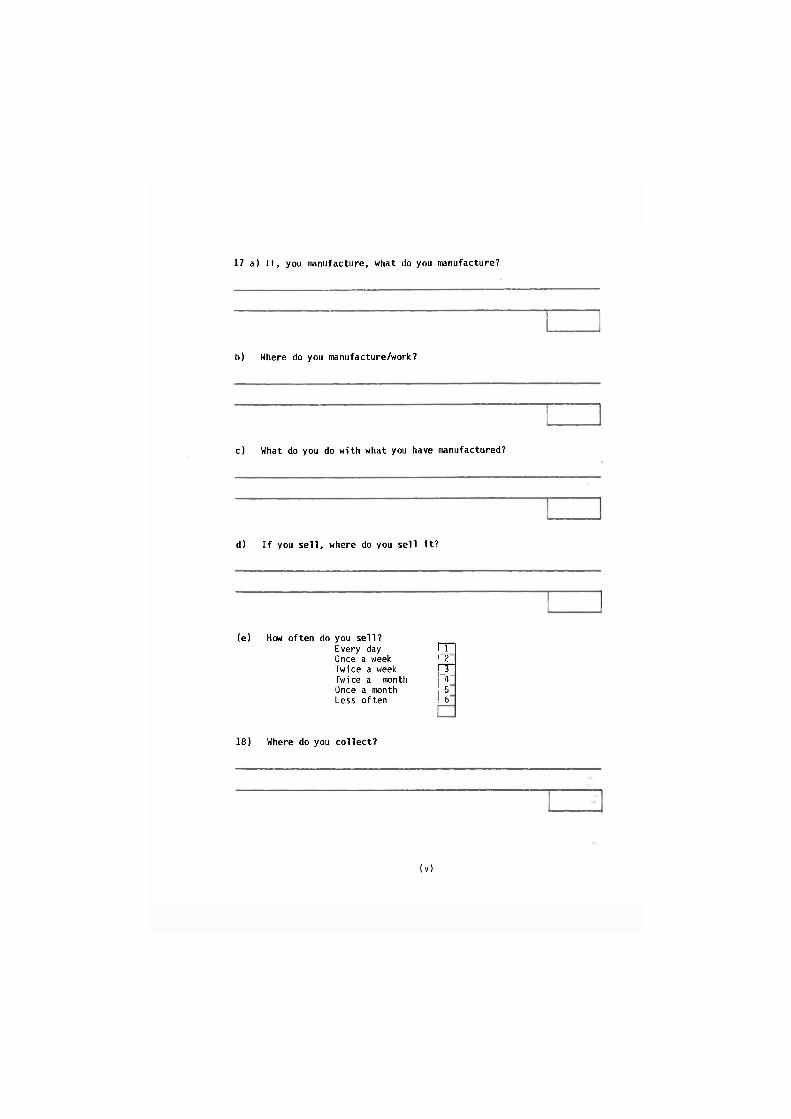
17 a) I f , you manufacture, what do you manufacture?
b) Where do you manufacture/work?
c) What do you do with what you have manufactured?
d) I f you s e l l , where do you se l l i t ?
(e) How often do you se l l? Every day m Once a week l Twice a week m Twice a month 4 Once a month 5 Less often 6
18) Where do you co l lect?
(v)
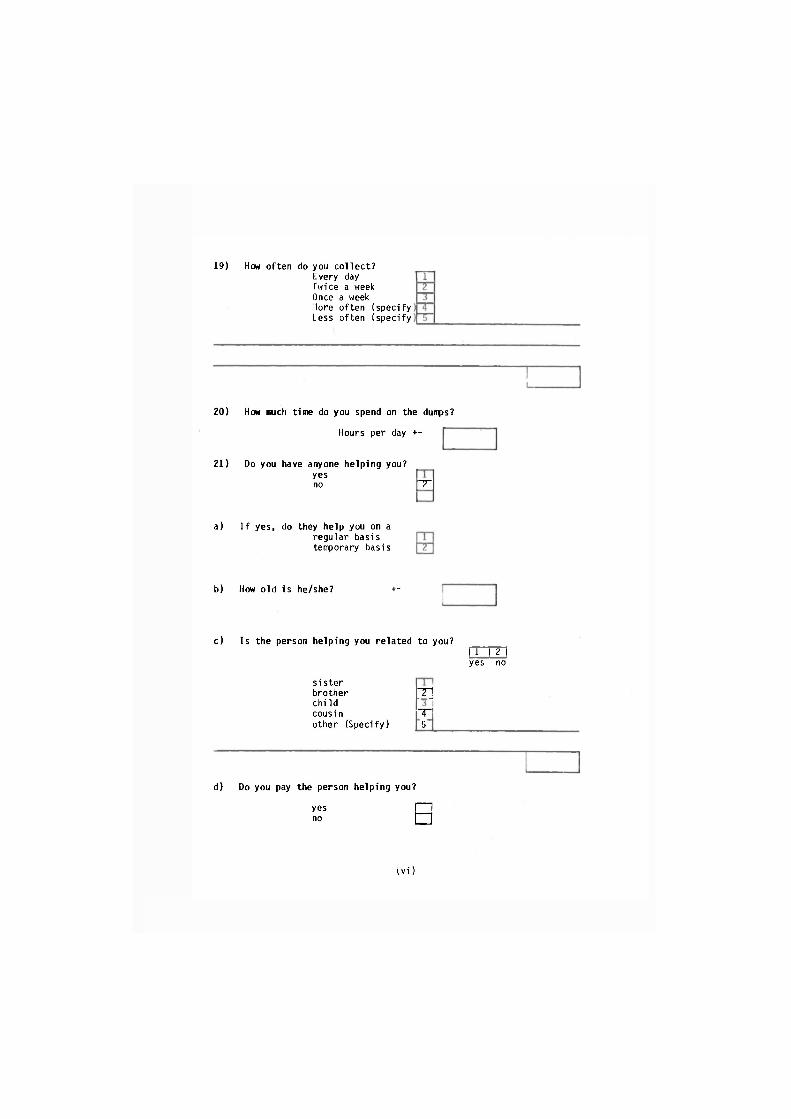
19) How often do you col lect? Every day Twice a week Once a week • lore often (specify Less often (specify
20) How much time do you spend on the dunps?
Hours per day +-
21) Do you have anyone helping you? yes no
a) I f yes, do they help you on a regular basis temporary basis
T
b) How old is he/she? +-
c) Is the person helping you related to you? n~m yes no
s is ter brother [ T ^ ch i ld cousin T other (Specify) 5
d) Do you pay the person helping you?
yes r n no •
ivi)
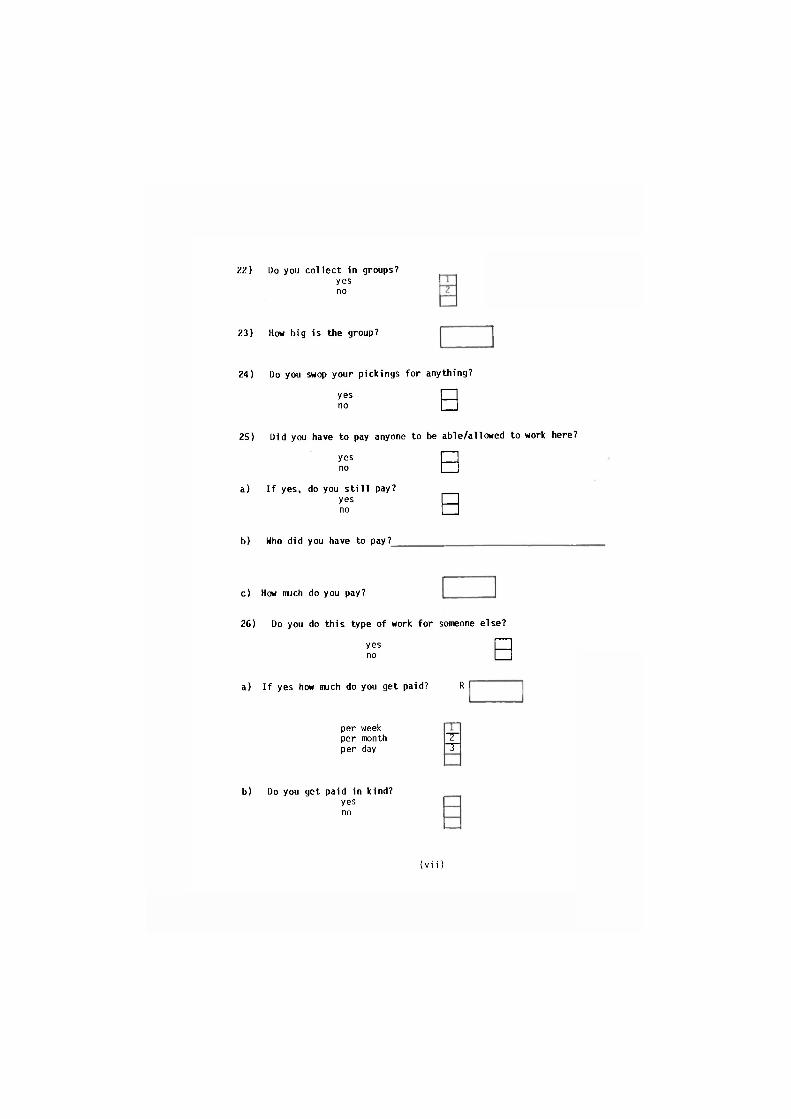
22) Do you co l lec t in groups? yes no
23) How big is the group?
24) Do you swop your pickings for anything?
yes r n no •
25) Did you have to pay anyone to be able/allowed to work here?
yes n no •
a) I f yes, do you s t i l l pay? yes • no •
b) Who did you have to pay?_
c) How much do you pay?
26) Do you do th is type of work for someone else?
yes no B
a) I f yes how much do you get paid? R
per week per month per day
T ~T
b) Do you get paid in kind? yes no
(vii)
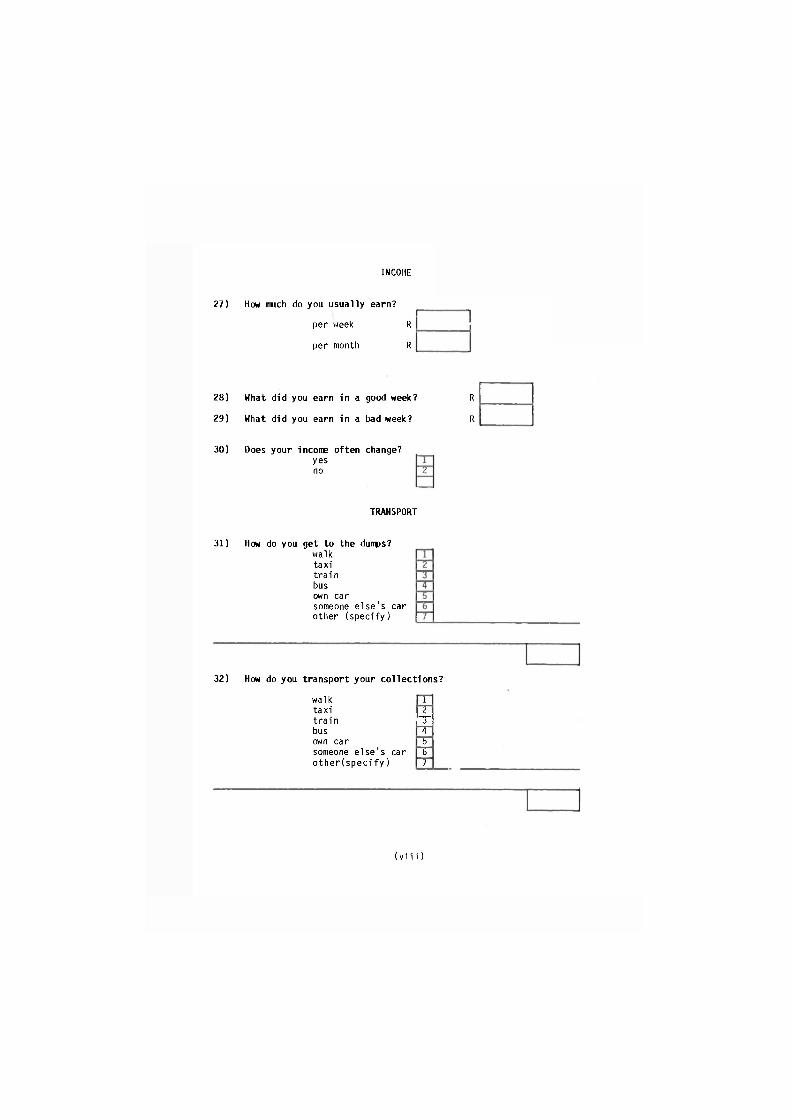
INCOME
27) How much do you usually earn?
per week R
per month R
28) What did you earn in a good week? R
29) What did you earn in a bad week? R
30) Does your income often change? yes no
TRANSPORT
31) How do you get to the dunps? walk taxi t ra in bus own car someone e lse 's car other (spec i fy )
32) How do you transport your col lect ions?
walk 1 tax i 2 t ra in T bus 4 own car 5 someone e lse 's car 6 o ther lspec i f y ) 1
(viii)
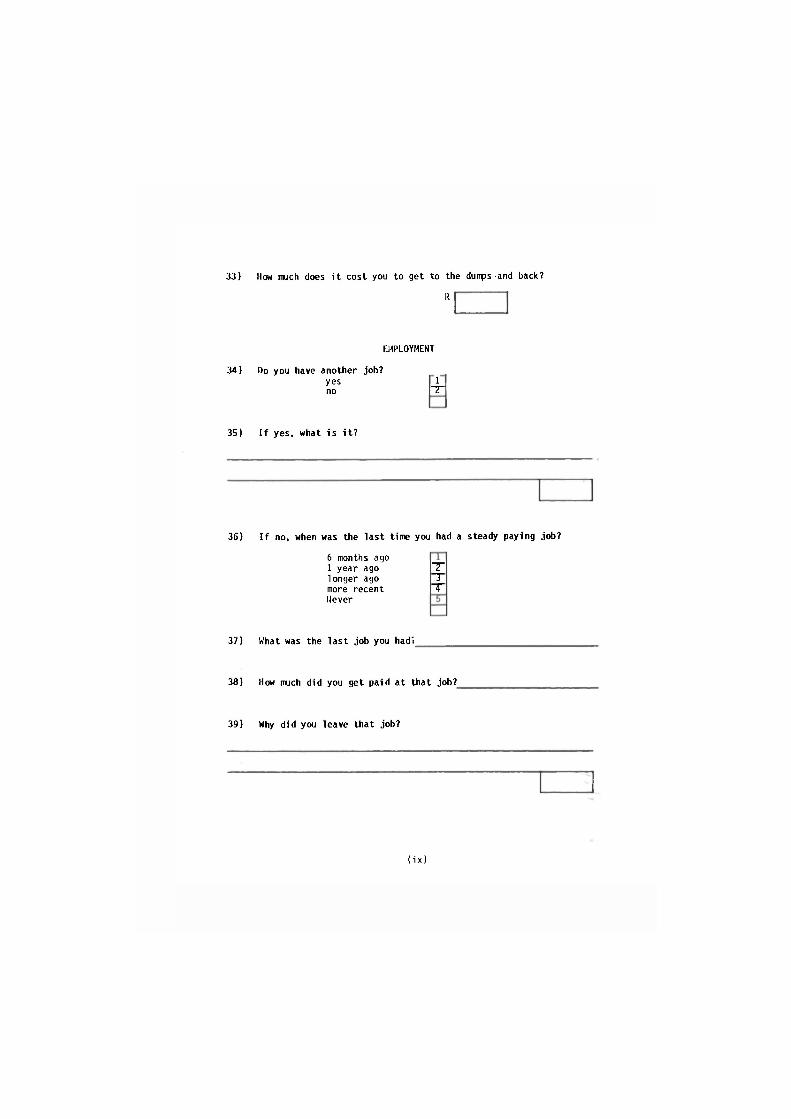
33) How much does i t cost you to get to the dunps and back?
R
EMPLOYMENT
34) Do you have another job? yes no
1 T 1
35) I f yes, what is i t ?
36) I f no, when was the last time you had a steady paying job?
6 months ago 1 year ago longer ago more recent Never
T T T
37) What was the last job you had;
38) How much did you get paid at that job?
39) Why did you leave that job?
(ix)
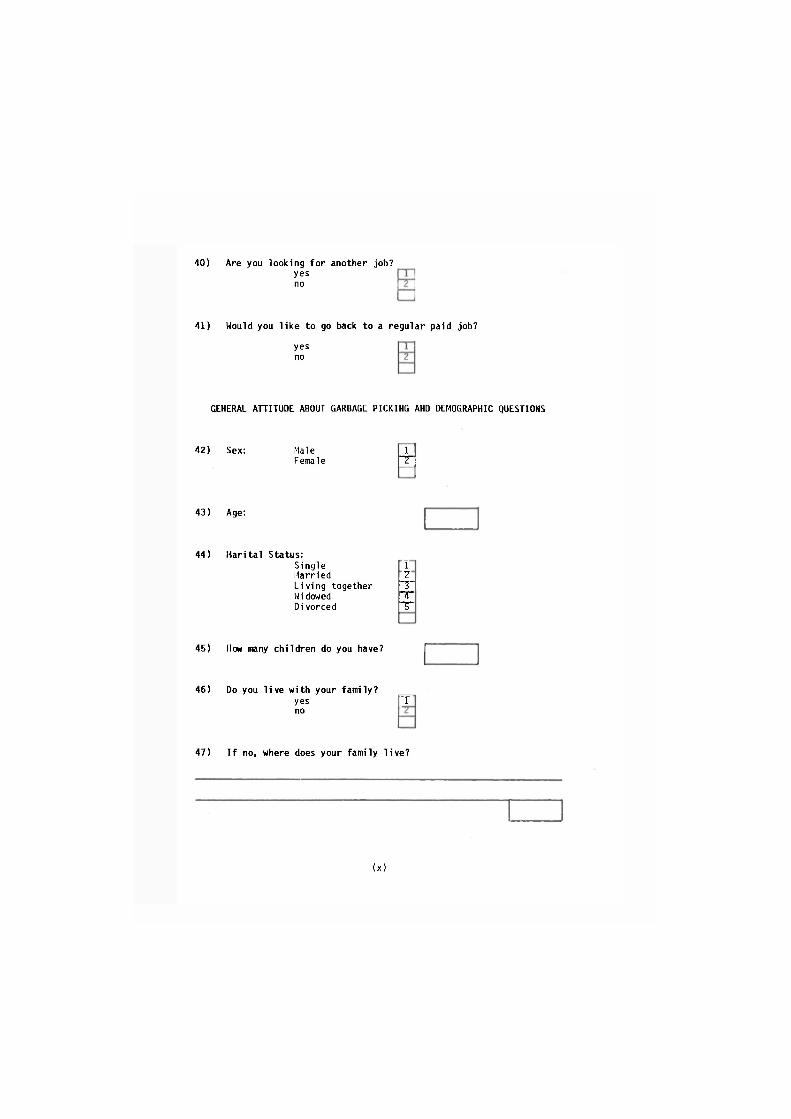
40) Are you looking for another job? yes no
41) Would you l i ke to go back to a regular paid job?
yes no
GENERAL ATTITUDE ABOUT GARBAGE PICKING AND DEMOGRAPHIC QUESTIONS
42) Sex: Male Female
1 m
43) Age:
44) Marital Status: Single Married L iv ing together Wi dowed Di vorced
1 7
1-3-1 T T
45) How many chi ldren do you have?
46) Do you l i v e with your family? yes [~T no
47) I f no, where does your family l i ve?
(x)
48) T e l l me more about this kind of work you do:
a) What do you l i ke about this work?
b) What do you d i s l i k e about this work?
(Only ask those who do not pick for someone else)
49) Would you rather do this kind of work than working for someone else?
yes no
50) Why?
51) What would you l i ke to change about this work?
52) What is your greatest problem in doing th is kind of work?
1
(xi)
53) How do the people in your community view your type of work?
(Probe : fo r example) : Do they l i ke i t ? They do not l i k e i t ? Would they also l i k e to do this kind of work? They do not regard i t as work?
54) Do people t r y to chase you away from th i s work?
m T
yes no
55) Who does th is?
n~pn yes no
The pol ice the munic ipal i ty other author i t ies
56) What do they say?
57) Have you been f ined for doing this work?
(xii)
BIBLIOGRAPHY
B i r b e c k , C., and C. G e r r y 1981 : The P e t t y Commodity P roducer i n T h i r d Word C i t i e s , Pe t i t -Bourgeo is or "Disguised" P r o l e t a r i a n ? i n B e c h o f e r , F. and B. E l l i o t (eds) T h e P e t i t e B o u r g e o i s i e -Conparat ive Studies of the Uneasy Stratum, MacMillan, London.
B i r b e c k , C., 1979 : Garbage, I n d u s t r y , and the ' V u l t u r e s ' of C a l i , Columbia in R. Bromley and C. Gerry (ed) Casua l Work and P o v e r t y i n T h i r d W o r l d C i t i e s , John Wi ley and Sons L t d
Bekkevo ld , S. , 1983 : Source S e p a r a t i o n of p l a s t i c wastes y i e l d and q u a l i t i e s f r o m a p i l o t study i n Norway , Waste Management and Research, Vo l . No. 3.
Carnegie Conference Paper No. 120, SALDRU, Cape Town, 1984, p.40.
C i l l i e r s , S.P. and Groenewald C . J . , 1982 : U r b a n G r o w t h i n S o u t h A f r i c a 1936-2000 : A Demographic O v e r v i e w , Research U n i t f o r Socio logy of Development, U n i v e r s i t y of Ste l lenbosch.
Davies, R., 1979 : Informal Sector or Subordinate Mode of Product ion? A model. R. Bromley and G. Ge r r y ed. Casua l Hork and P o v e r t y I n T h i r d World C i t i e s , John Wi ley and Sons L td .
Dewar, D. and V. Watson, 1981 Unemployment and the I n f o r m a l S e c t o r : some P r o p o s a l s , The urban problems research u n i t , U n i v e r s i t y of Cape Town.
G i l m o u r , D. and Roux, A. , 1984 : U r b a n B l a c k U n e m p l o y m e n t and E d u c a t i o n i n the E a s t e r n Cape, Survey of Race Relat ions in South A f r i c a , South A f r i c a n I n s t i t u t e of Race Re la t ions , Johannesburg.
K r i g e , D . J . , 1985 : The Urban I n f o r m a l S e c t o r i n S.A. : What o p t i o n s f o r development? A Case study of KwaMashu, N a t a l . M a s t e r ' s thes is , U n i v e r s i t y of Nata l , Durban.
Mpanza, Z., 1984 : A P r o f i l e of Registered Unemployment i n the Durban Area, Development Studies U n i t , U n i v e r s i t y of Nata l , Durban.
. N a t t r a s s , N., 1984 : S t r e e t T r a d i n g i n the T r a n s k e i : A S t r u g g l e a g a i p s t p o v e r t y , p e r s e c u t i o n and p r o s e c u t i o n , Working Paper No. 7, Development Studies U n i t , U n i v e r s i t y of Nata l , Durban.
Nat t rass , J and H. Glass, 1986 : Informal Black Business in Durban.
S t a t i s t i c a l News Release : 20.5.1986, p.374.
Survey of Race R e l a t i o n s i n South A f r i c a ; 1984 : South A f r i c a n I n s t i t u t e of Race Re la t ions , Johannesburg.
Wei 1 i n g s , P. and S u t c l i f f e , M., 1984 ; D e v e l o p i ng the Urban I nf or ma 1 S e c t o r i n SA : The R e f o r m i s t Parad igm and i t s F a l l a c i e s , Development and Change, Vo l . 15.
( x i i i )
MUUtCOPv Ou.hJ"

This work is licensed under a Creative Commons Attribution - Noncommercial - NoDerivs 3.0 Licence.
To view a copy of the licence please see: http://creativecommons.Org/licenses/by-nc-nd/3.0/