Embed Size (px)
Citation preview
GAPRUS - GENETIC ALGORITHMS BASED PIPE ROUTING USING
TESSELLATED OBJECTS
Sunand SandurkarSoftware Engineer
Structural Dynamics Research CorporationCincinnati, Ohio
Dr. Wei Chen*Assistant Professor
Mechanical EngineeringUniversity of Illinois at Chicago
*Corresponding Author:Dr. Wei Chen
Mechanical Engineering (M/C 251)842 W. Taylor St.
University of Illinois at ChicagoChicago IL 60607-7022
Phone: (312) 996-5318Fax: (312) 413-0447
e-mail: [email protected]
FINAL VERSION SUBMITTED TOTHE JOURNAL OF COMPUTERS IN INDUSTRY, SEPT. 10, 98
2
ABSTRACT
Pipe routing is the technique of developing collision free routes for pipes between
two locations in an environment scattered with obstacles. In the past, research has been
primarily focused on the use of deterministic optimization techniques to derive the optimal
route. Computational efficiency of deterministic techniques is low for highly nonlinear and
sometimes discontinuous problems like pipe routing. Besides, due to limitations in the
representation of 3D geometry, the shapes of obstacles have been restricted to primitives.
In this research, a novel approach to overcome these limitations is presented.
A nondeterministic optimization approach based on Genetic Algorithms is
proposed to generate pipe routing solution sets with a good searching efficiency.
Representation of the objects and pipes in the tessellated format offers huge benefits in
computation as well as usage. The versatility of the current approach and its ability to
accommodate and efficiently solve problems involving 3D freeform obstacles is
demonstrated.
Key words: Pipe Routing, Genetic Algorithms, Tessellated Objects, Freeform CAD
Geometries
3
GLOSSARY
S Location of Start point of the pipe
G Location of Goal point of the pipe
Route Path between Start and Goal points
STL format Boundary surface description of CAD model as a connected array of
triangles (tessellated format)
GAPRUS Genetic Algorithm based Pipe Routing Using .STL files
Bends Location of points where the pipe changes its direction
CAD Computer Aided Design
GA Genetic Algorithms
RAPID Collision Detection Library for .STL files
IVECS Interactive Virtual Environment for Correction of .STL files.
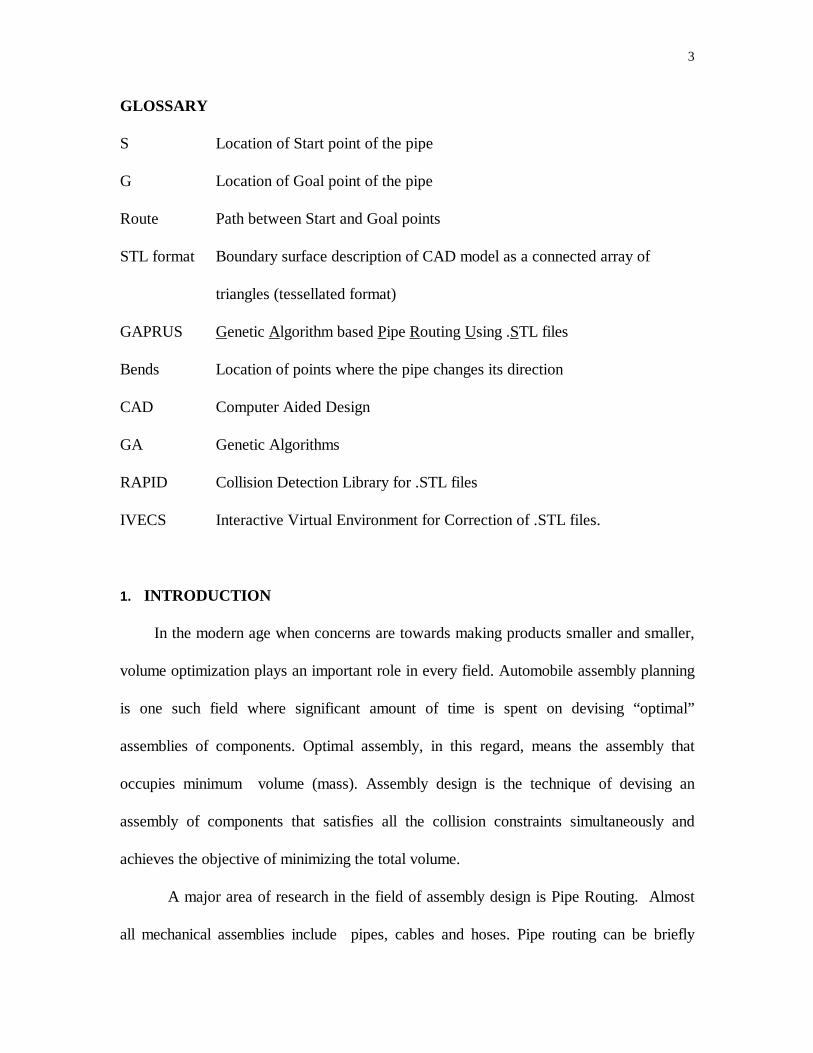
1. INTRODUCTION
In the modern age when concerns are towards making products smaller and smaller,
volume optimization plays an important role in every field. Automobile assembly planning
is one such field where significant amount of time is spent on devising “optimal”
assemblies of components. Optimal assembly, in this regard, means the assembly that
occupies minimum volume (mass). Assembly design is the technique of devising an
assembly of components that satisfies all the collision constraints simultaneously and
achieves the objective of minimizing the total volume.
A major area of research in the field of assembly design is Pipe Routing. Almost
all mechanical assemblies include pipes, cables and hoses. Pipe routing can be briefly
4
defined as the technique of devising collision free routes for pipes in an assembly. By this
definition, pipe routing can be understood to be a subset of assembly design.
The various fields that require a pipe route planner include automobile assembly design
and maintenance, path planning in robotics, cable routing in electrical engineering, route
planning of pipes and hoses in refrigeration and heat transfer, route planning of channels
and ducts in fluid flow, etc. In each of these cases, minimization of the total length of
pipes/cables is usually desired. Interferences with obstacles in the assembly are often
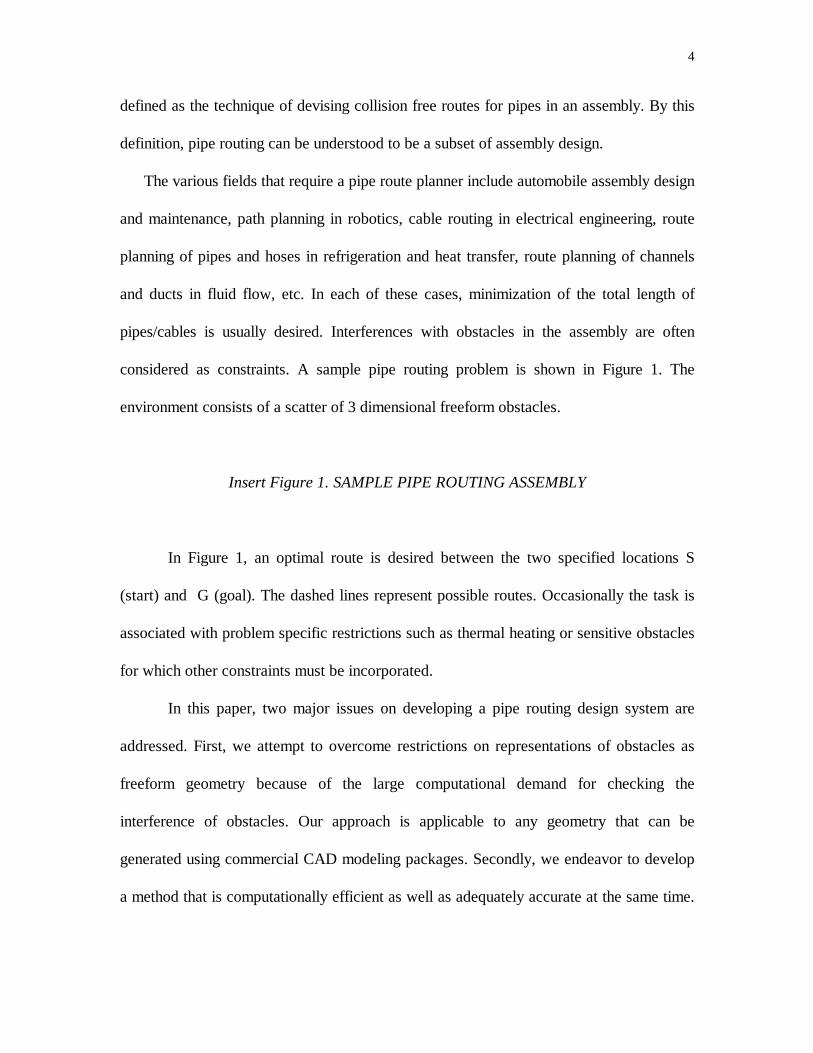
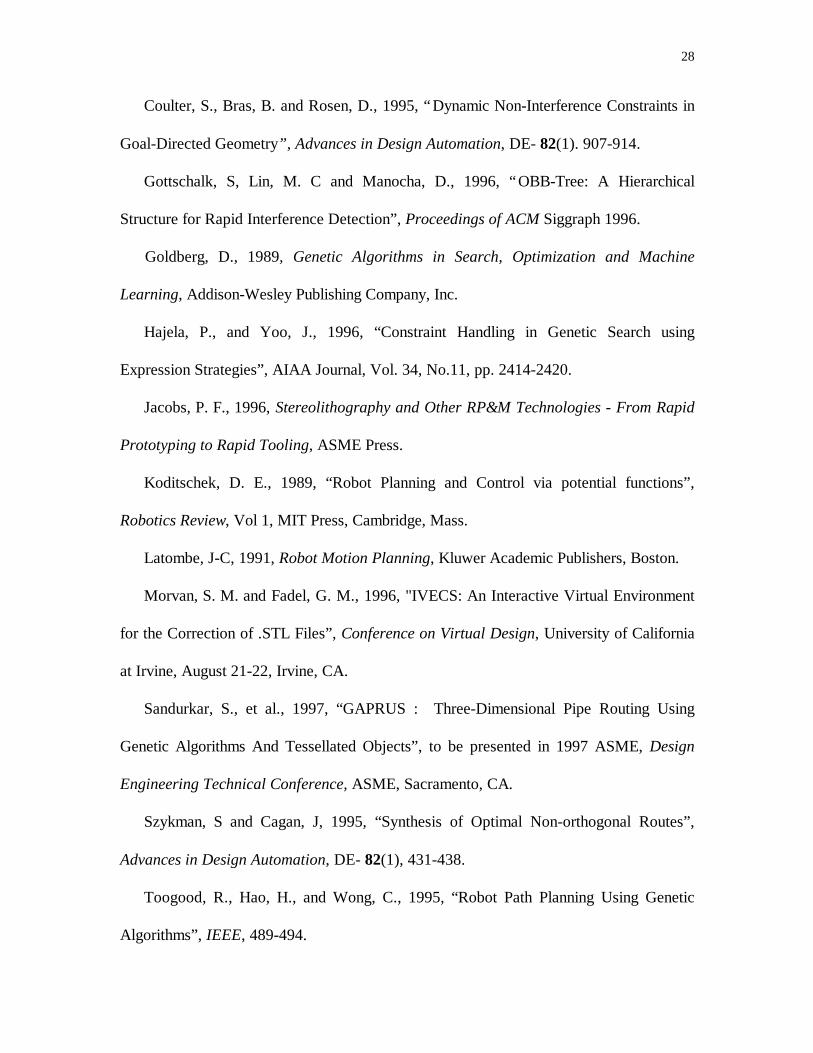
considered as constraints. A sample pipe routing problem is shown in Figure 1. The
environment consists of a scatter of 3 dimensional freeform obstacles.
Insert Figure 1. SAMPLE PIPE ROUTING ASSEMBLY
In Figure 1, an optimal route is desired between the two specified locations S
(start) and G (goal). The dashed lines represent possible routes. Occasionally the task is
associated with problem specific restrictions such as thermal heating or sensitive obstacles
for which other constraints must be incorporated.
In this paper, two major issues on developing a pipe routing design system are
addressed. First, we attempt to overcome restrictions on representations of obstacles as
freeform geometry because of the large computational demand for checking the
interference of obstacles. Our approach is applicable to any geometry that can be
generated using commercial CAD modeling packages. Secondly, we endeavor to develop
a method that is computationally efficient as well as adequately accurate at the same time.
5
The measure of accuracy is in terms of both precision of geometric representation of the
assembly as well as realistic modeling of engineering problems.
1.1 Review of Existing Methods
Pipe routing has been a research topic for a long time resulting in various
approaches. Starting with the stationary 2D workspace and simple obstacles, research has
grown to the stage of 3D dynamic, multi constraint and multi objective problems.
Methods for pipe routing can be traced back to techniques for robot path planning
that have been traditionally classified into four major categories. They are the Skeleton
Search (Roadmap), the Cell Decomposition approach (Ahuja and Hwang, 1992), the
Potential Field method and the Mathematical Programming method (Ahuja and Hwang,
1992). These four approaches cannot be strictly demarcated from each other since there is
an inherent overlap of their features.
Briefly speaking, Skeleton or Roadmap approach involves capturing the set of
feasible motions (free space) in a network of one dimensional lines and conducting a graph
search of this network (Aurenhammer, 1991). The Cell Decomposition approach consists
of decomposing the free space into cells and connecting the start and goal configurations
by a sequence of connected cells. In the Potential Field Method, a scalar mathematical
function is constructed whose value is minimum when the robot is at the goal
configuration, and maximum near the obstacles (Koditschek, 1989). The path from the
start to the goal is determined by putting a small marble at the start and following its
movement. The Mathematical Programming approach deals with computing the path as a
mathematical objective function and trying to minimize it while satisfying constraints
6
(obstacle avoidance). While the first three methods more or less belong to the Artificial
Intelligence (AI) techniques, the last one falls into the category of optimization.
Mathematical Programming techniques would be further classified into
deterministic and nondeterministic methods based on the search algorithms employed.
Deterministic techniques guarantee the same solution for a problem when run at different
times with the same starting solution, while nondeterministic techniques generate different
solutions to the same problem at different runs due to the randomness involved in the
solution process. Deterministic methods such as the linear and nonlinear programming
methods usually behave inefficiently with highly nonlinear and sometimes discontinuous
problems like the pipe routing and often result in a local optimum. In contrast,
nondeterministic algorithms such as genetic algorithms and simulated annealing are aimed
at generating a set of globally good solutions. This feature is of practical relevance in
engineering applications.
Research of pipe routing in the past few years have produced remarkable results
with interesting applications to packing problems and emphasis on employing novel
approaches (usually heuristic based) and unconventional optimization methods such as
nondeterministic methods to improve design productivity. A few approaches are briefly
highlighted below. The list of approaches mentioned below is definitely not exhaustive.
Conru and Cutkosky (1993) solve the pipe routing problem from a cable harness routing
perspective. They introduce a novel approach, by which, an initial solution is generated
without considering the obstacles. The obstacles are introduced individually, thereby
intensifying the complexity of the problem gradually. Szykman and Cagan (1995) focus on
developing a pipe routing algorithm to solve for nonorthogonal routes. Simulated
7
annealing is the optimization algorithm used to obtain the optimal route. They utilize the
versatility of this nondeterministic technique to overcome limitations associated with
orthogonal routing and thus generate shorter routes. Chang and Li (1995) consider a
simplified routing problem in the domain of automobile assembly maintainability. Their
method changes the search resolution dynamically with respect to the complexity of the
environment. Coulter, et al., (1995) incorporate the concept of path planning from
assembly design point of view. In their approach (COnfiguration Design of Assemblies -
CODA), emphasis is more on configuration and parametric design of assemblies. Their
research has a novel perspective of design and considers several research issues like design
for assembly, disassembly, recycling, servicing, manufacturing, etc. Toogood et al. (1995)
look at the routing problem from the robotics point of view. Their emphasis is more
towards the coding scheme for effective optimization. They have incorporated more
complex features of robots like time and joint torques along with distance optimization.
From the brief review of the recent approaches to solving the pipe routing
problem, conclusions can be made regarding their inherent limitations.
Firstly, most of the research approaches adopt an approximation of the real
geometric model of the problem. While some of the approaches decompose the assembly
space into cells, some use the 2 dimensional shadows of the 3 dimensional assembly.
Though these methods could be used for simple and uncluttered assemblies, their utility
diminishes as the complexity of the problem increases and as the shapes of the obstacles
tend to be of freeform nature. In such problems, the two dimensional shadows of the
obstacles on the coordinate planes result in the overlap of the obstacles leading to the
misrepresentation of the assembly.
8
Secondly, the use of deterministic optimization techniques often proves to be
inappropriate due to the fact that the pipe routing problems are highly nonlinear over
design spaces which are often irregular and discontinuous because of mixed types of
variables. This means that the feasible solution might not be found in the direction of the
steepest descent. Hence it is necessary that such problems be tackled by the use of
nondeterministic optimization techniques.
A generic pipe routing approach needs to be developed to incorporate the diverse
concerns of the various applications.
1.2 Introduction to Our Approach
In this paper, we present an alternative approach to addressing the pipe routing
problem. Our approach is similar to some of the existing approaches in that the problem is
modeled and solved as an optimization problem. Most of the practical pipe routing
problems behave in a highly irregular fashion like the Traveling Salesman problems.
Comparing within the optimization techniques, nondeterministic methods are considered
to be more efficient than the deterministic methods for this type of problems. This is
because of the fact that nondeterministic techniques produce a set of feasible and close to
optimal solutions instead of a single optimum solution. With relevance to real world
problems, the designer would prefer to have a choice of near optimal solutions within the
time limits. However, the nondeterministic problems are often time consuming, offering
hindrance to productivity.
We implement a nondeterministic mathematical optimization technique, Genetic
Algorithms, coupled with tessellated representations of CAD models of obstacles to
9
significantly improve the computational efficiency. The emphasis of our work is on the
significant gain in computational efficiency by the representation of the assembly of
obstacles in the tessellated format and the adjustment of the optimization model to ensure
the accuracy of the design solution. Our technique eliminates restrictions on shapes of
obstacles.
A brief background of GA and the tessellated representation of the assembly is
provided in the following subsections.
1.2.1 Genetic Algorithms
Genetic Algorithms (GAs) are adaptive methods which can be used to solve
search-and-optimization problems. They are based on the genetic processes of evolution
of biological organisms. Over many generations, natural populations have evolved
according to the principles of natural selection. By adopting this process, genetic
algorithms are able to "evolve" solutions to real world problems (Goldberg, 1989).
GAs work with a population of "individuals", each representing a possible
solution, described by (d1, d2, ...), to a given problem. Genetic Algorithms discretize the
design variables and therefore can incorporate the integer type, real type and the discrete
type variables for the design variables. These variables are attached one after the other to
form a genome. The GA supplies values for these variables from the prespecified range in
the same order as in this genome. Each individual solution is assigned a "fitness score"
according to how good a solution to the problem it is. The highly fit individuals are given
opportunities to "reproduce" (selection), by "crossbreeding" (crossover) with other
individuals in the population. This produces new individuals as "offspring", which share
10
some features taken from each "parent". Mutation, when applied to a child, randomly
alters a gene with a small probability. It is to provide a small amount of random search and
to prevent convergence to a local optimum. By favoring the mating of the more fit
individuals, the most promising areas of the search space are explored.
1.2.2 Tessellated Representation of Obstacles
The .STL (STereoLithography) file format is originally the standard used for data
exchange between CAD systems and 3D prototyping systems such as rapid prototyping
(RP) machines (Jacobs, 1996). The tessellated representation of obstacles is employed in
this work to improve the computational efficiency for interference checking and
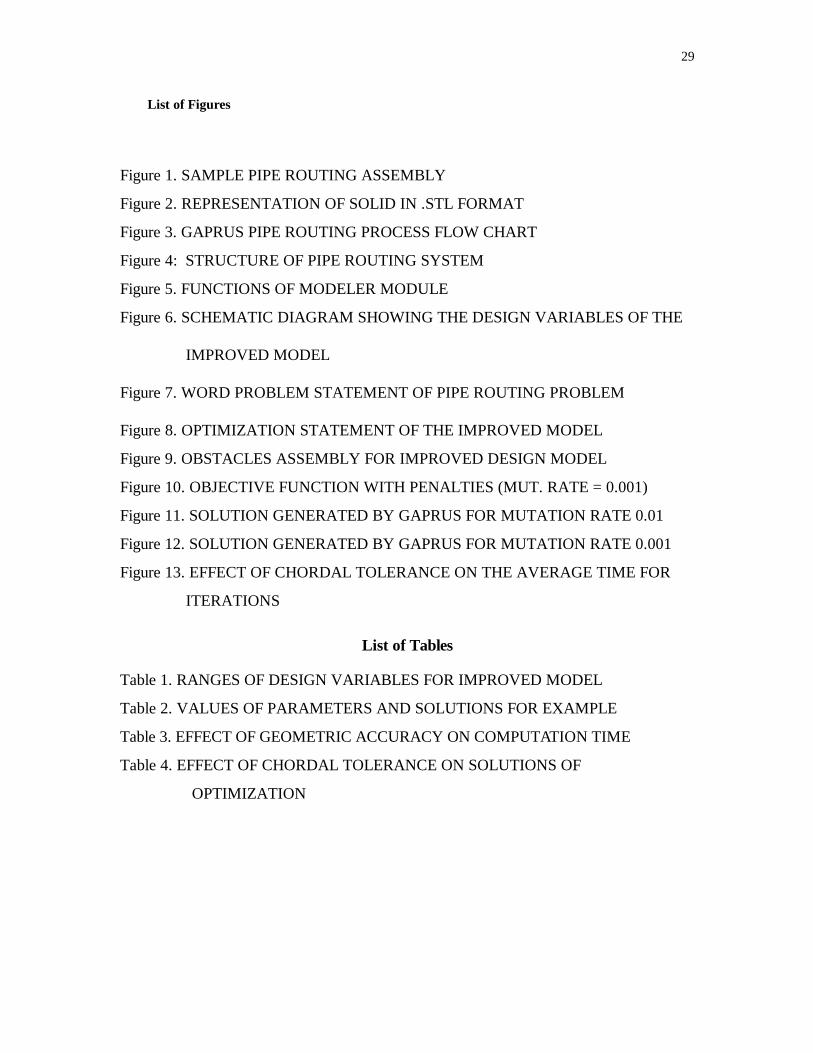
optimization. A .STL file defines a model as a set of triangles forming its boundary as
shown in Figure 2. This file basically consists of the X, Y and Z coordinates of the three
vertices of each surface triangle, as well as the coordinates of the surface normal. With the
tessellated representation each edge is shared by only two triangles.
Insert Figure 2. REPRESENTATION OF SOLID IN .STL FORMAT
The triangles intersect at their edges and have exactly three adjacent triangles, one
along each edge. Thus a tessellated model is “water-tight” without any cracks.
Generating a .STL file of an assembly is a common feature supported by over 40
solid modeling packages. As the data must be translated from a CAD representation to a
faceted representation, the tessellated model is always an approximation of the real surface
of the object. Facets are hard to avoid on curved surfaces and are sometimes apparent in
the final model. However, the size of triangles can be varied to control accuracy. Smaller
11
triangles result in finer resolution of curved surfaces and improved RP part accuracy
through reduced chordal deviations, while larger triangles minimize system storage
requirements at the expense of accuracy. In this work, we use IVECS which is a program
developed at Clemson University for the correction of .STL files to visualize the solutions
(Morvan, et al., 1996).
2. GAPRUS - Genetic Algorithms Based Pipe Routing Using .STL Files
An endeavor is made to develop a pipe routing approach that can cater to the wide
range of applications including automobile assembly design, robot path planning, cable
routing, refrigeration, etc. Though each of these diverse fields has different problem-
specifications, a system developed to cater to the needs of one of them can be adopted and
implemented to others with minor changes.
2.1 What is GAPRUS?
GAPRUS (Genetic Algorithms based Pipe Routing Using STL files) is developed
in this work as a computer aided technique of devising a collision free and efficient route
for pipes in an environment scattered with obstacles. The system accepts an .STL file of
the assembly of obstacles and returns a set of optimal routes between the specified start
and goal locations, based on the specified criteria.
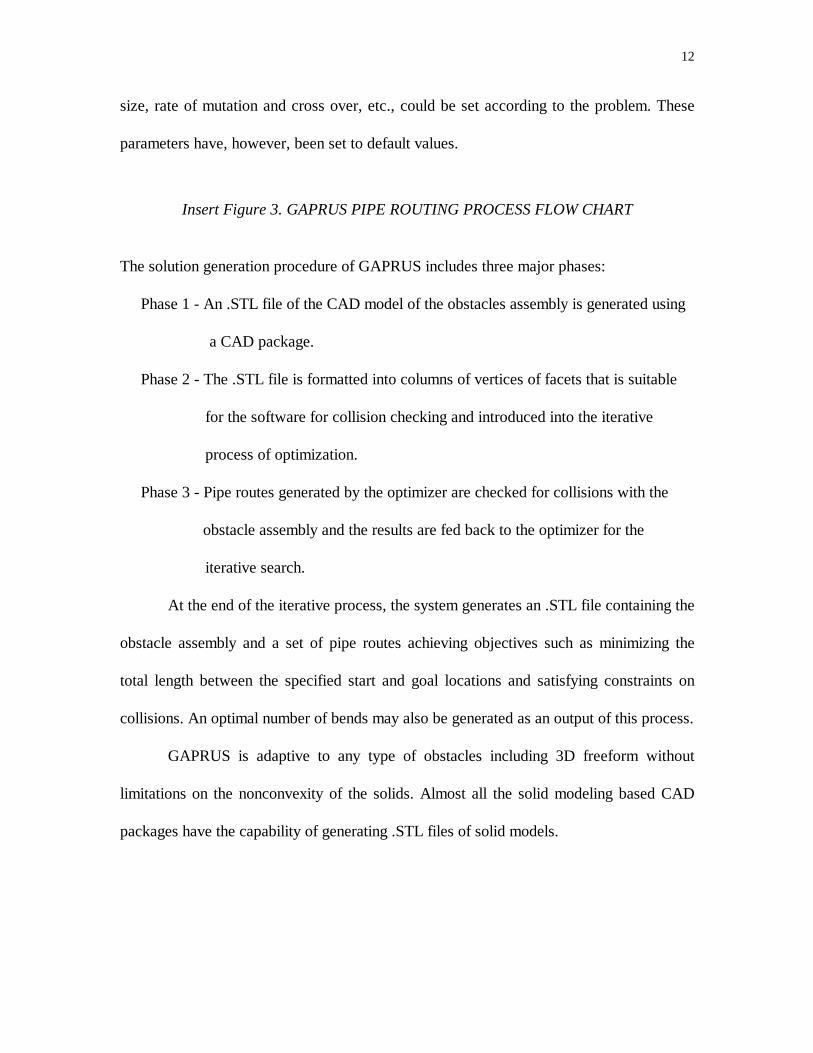
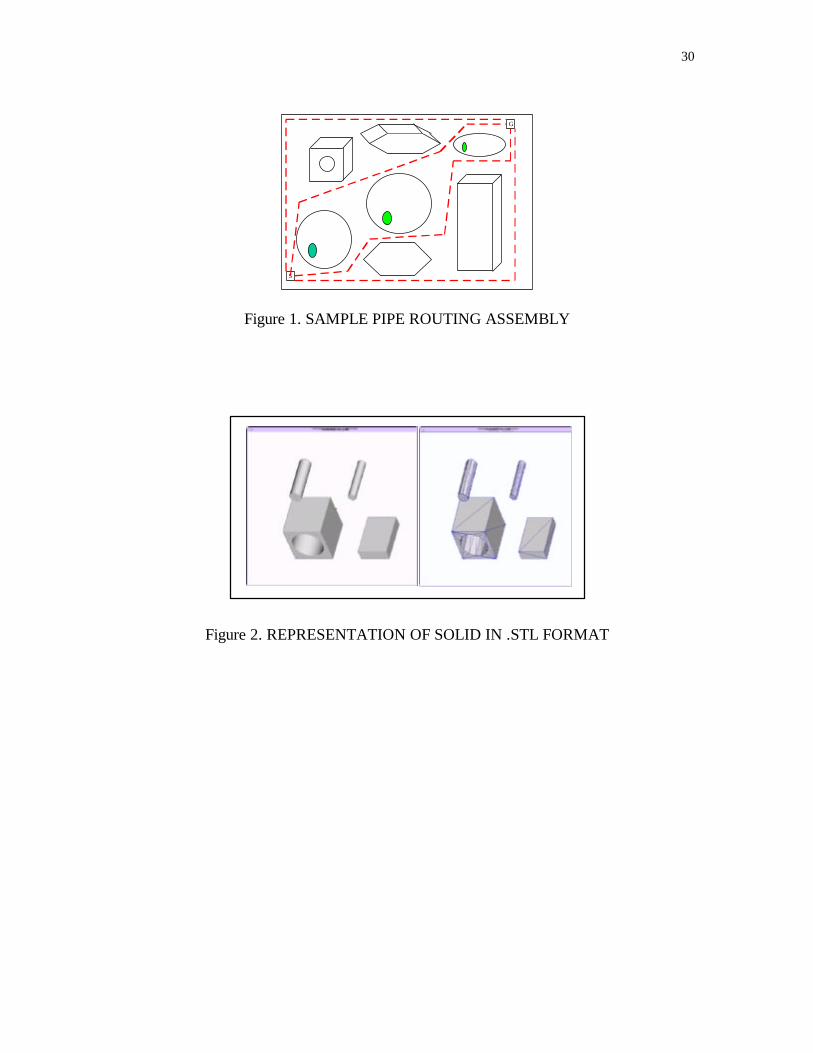
The primary flowchart of the pipe route generation process is highlighted in Figure
3. The user invokes GAPRUS at the input terminal by supplying a CAD file of the
assembly of obstacles and the coordinates of start and goal locations. In addition to this,
other supporting parameters related to GA like the number of generations, population
12
size, rate of mutation and cross over, etc., could be set according to the problem. These
parameters have, however, been set to default values.
Insert Figure 3. GAPRUS PIPE ROUTING PROCESS FLOW CHART
The solution generation procedure of GAPRUS includes three major phases:
Phase 1 - An .STL file of the CAD model of the obstacles assembly is generated using
a CAD package.
Phase 2 - The .STL file is formatted into columns of vertices of facets that is suitable
for the software for collision checking and introduced into the iterative
process of optimization.
Phase 3 - Pipe routes generated by the optimizer are checked for collisions with the
obstacle assembly and the results are fed back to the optimizer for the
iterative search.
At the end of the iterative process, the system generates an .STL file containing the
obstacle assembly and a set of pipe routes achieving objectives such as minimizing the
total length between the specified start and goal locations and satisfying constraints on
collisions. An optimal number of bends may also be generated as an output of this process.
GAPRUS is adaptive to any type of obstacles including 3D freeform without
limitations on the nonconvexity of the solids. Almost all the solid modeling based CAD
packages have the capability of generating .STL files of solid models.
13
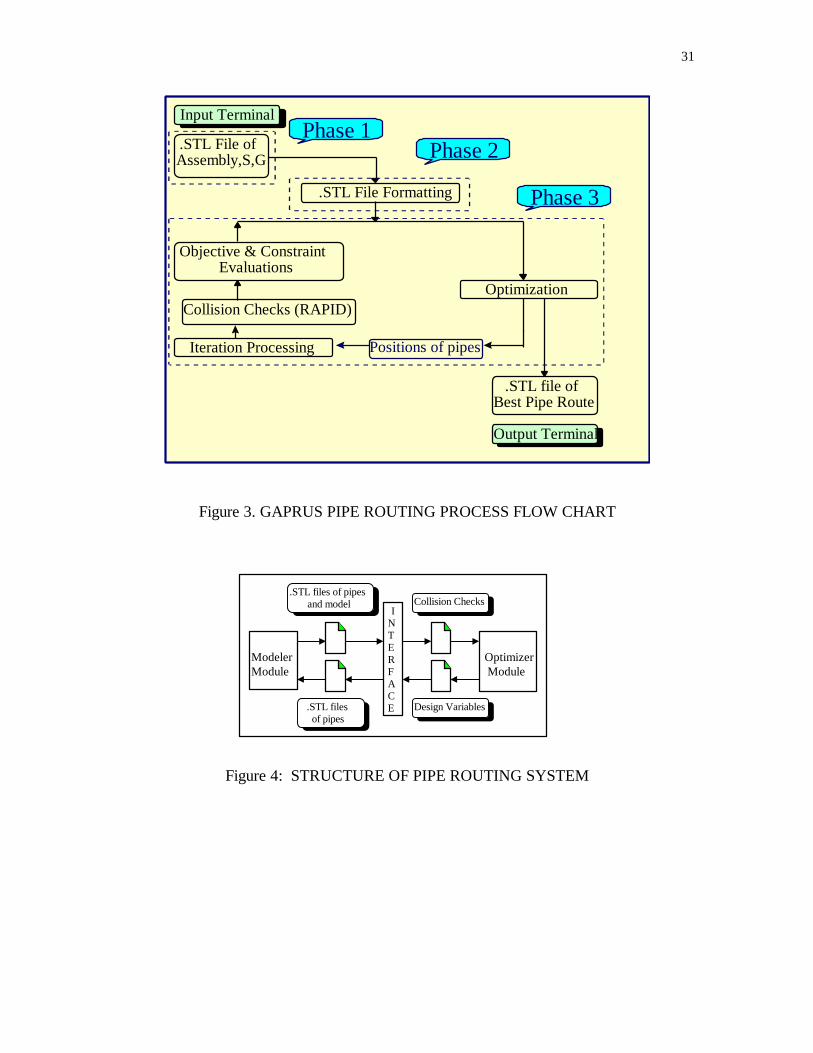
2.2 Infrastructure
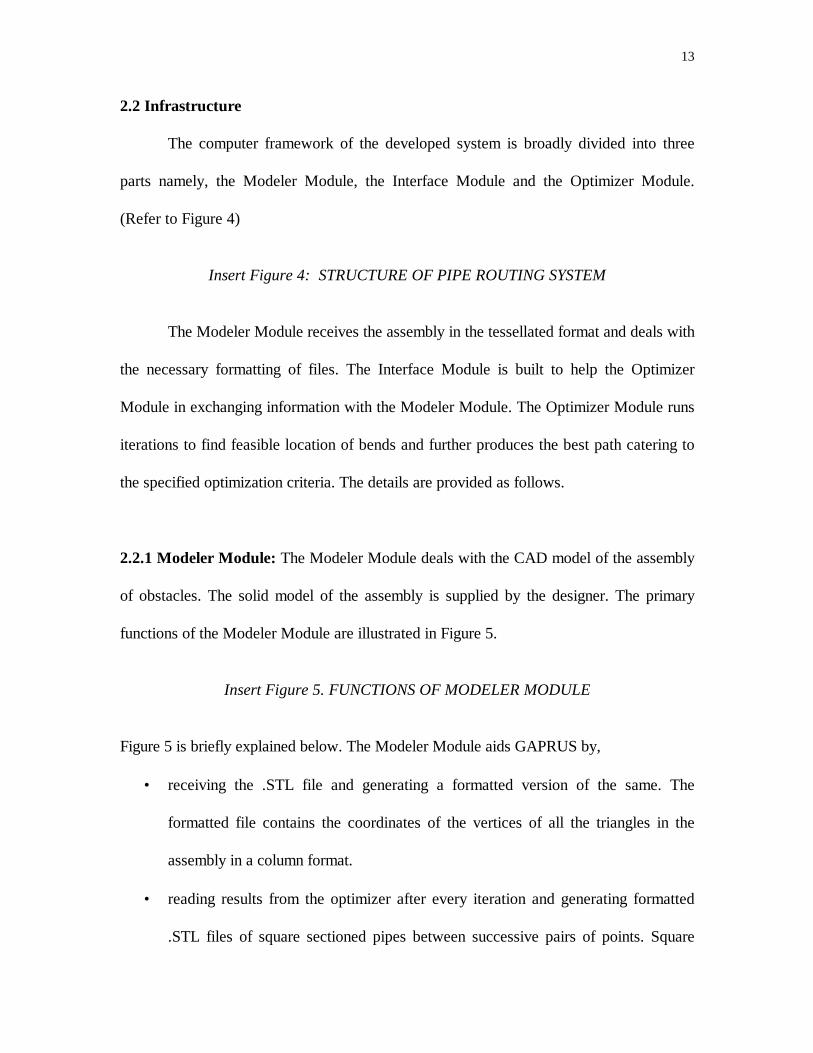
The computer framework of the developed system is broadly divided into three
parts namely, the Modeler Module, the Interface Module and the Optimizer Module.
(Refer to Figure 4)
Insert Figure 4: STRUCTURE OF PIPE ROUTING SYSTEM
The Modeler Module receives the assembly in the tessellated format and deals with
the necessary formatting of files. The Interface Module is built to help the Optimizer
Module in exchanging information with the Modeler Module. The Optimizer Module runs
iterations to find feasible location of bends and further produces the best path catering to
the specified optimization criteria. The details are provided as follows.
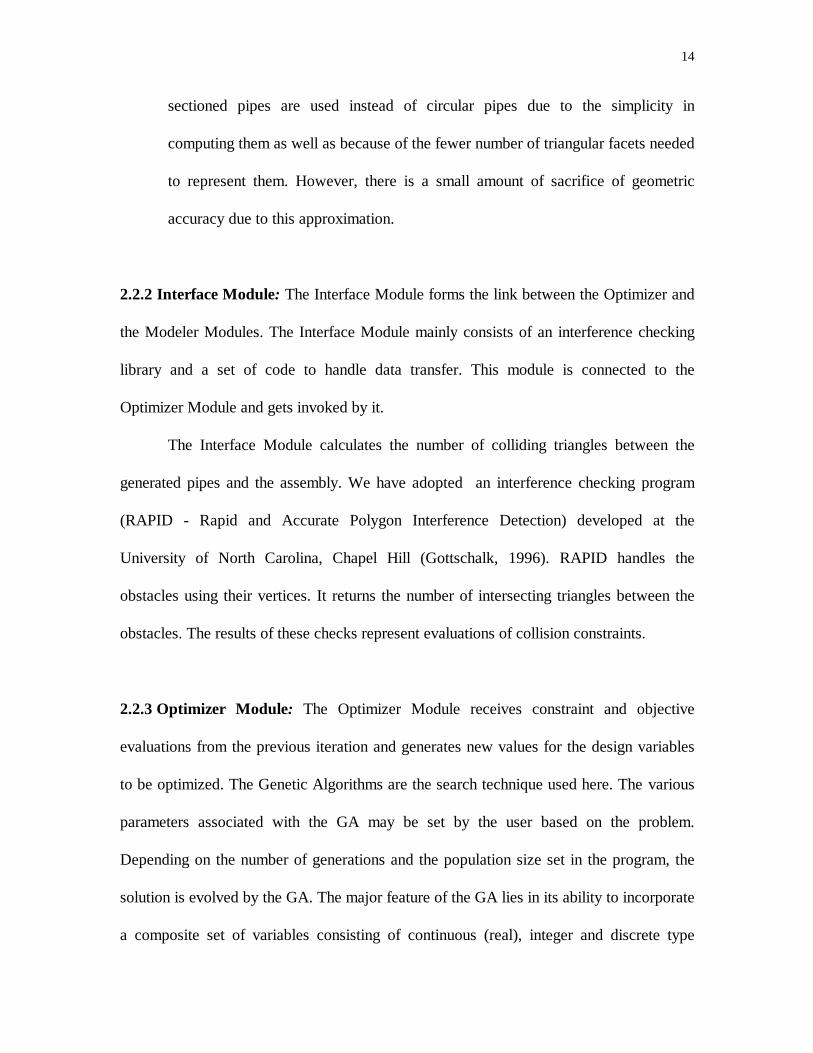
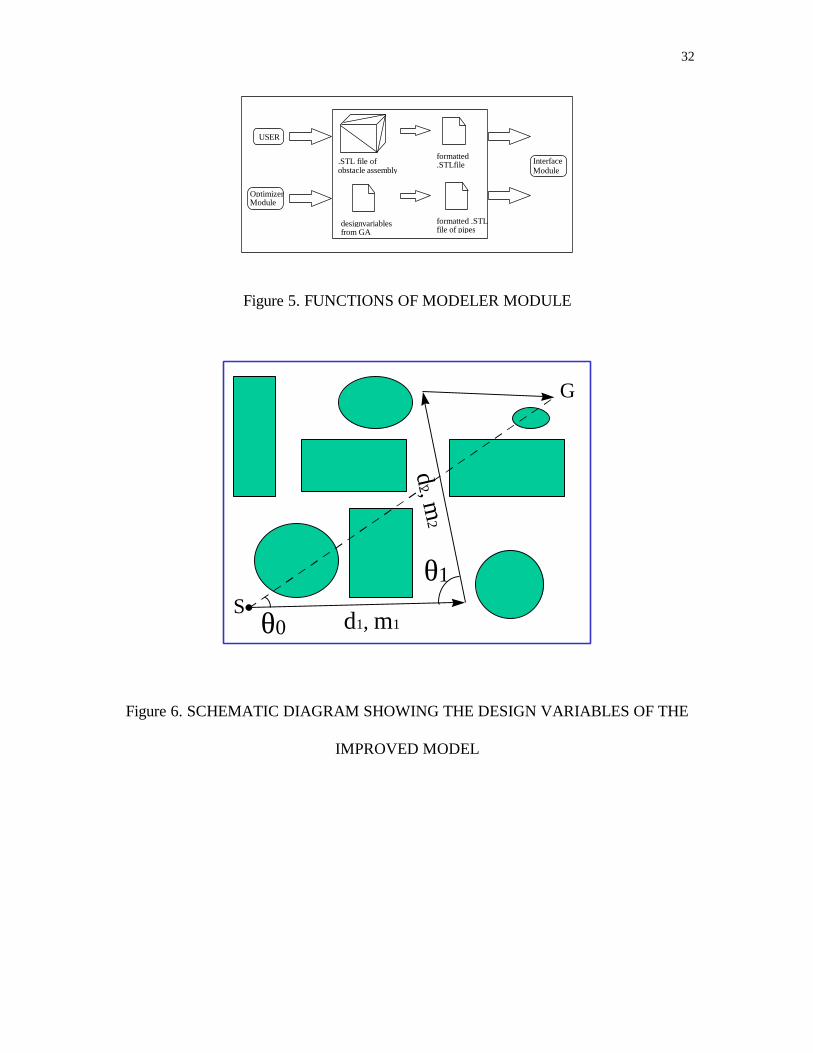
2.2.1 Modeler Module: The Modeler Module deals with the CAD model of the assembly
of obstacles. The solid model of the assembly is supplied by the designer. The primary
functions of the Modeler Module are illustrated in Figure 5.
Insert Figure 5. FUNCTIONS OF MODELER MODULE
Figure 5 is briefly explained below. The Modeler Module aids GAPRUS by,
• receiving the .STL file and generating a formatted version of the same. The
formatted file contains the coordinates of the vertices of all the triangles in the
assembly in a column format.
• reading results from the optimizer after every iteration and generating formatted
.STL files of square sectioned pipes between successive pairs of points. Square
14
sectioned pipes are used instead of circular pipes due to the simplicity in
computing them as well as because of the fewer number of triangular facets needed
to represent them. However, there is a small amount of sacrifice of geometric
accuracy due to this approximation.
2.2.2 Interface Module: The Interface Module forms the link between the Optimizer and
the Modeler Modules. The Interface Module mainly consists of an interference checking
library and a set of code to handle data transfer. This module is connected to the
Optimizer Module and gets invoked by it.
The Interface Module calculates the number of colliding triangles between the
generated pipes and the assembly. We have adopted an interference checking program
(RAPID - Rapid and Accurate Polygon Interference Detection) developed at the
University of North Carolina, Chapel Hill (Gottschalk, 1996). RAPID handles the
obstacles using their vertices. It returns the number of intersecting triangles between the
obstacles. The results of these checks represent evaluations of collision constraints.
2.2.3 Optimizer Module: The Optimizer Module receives constraint and objective
evaluations from the previous iteration and generates new values for the design variables
to be optimized. The Genetic Algorithms are the search technique used here. The various
parameters associated with the GA may be set by the user based on the problem.
Depending on the number of generations and the population size set in the program, the
solution is evolved by the GA. The major feature of the GA lies in its ability to incorporate
a composite set of variables consisting of continuous (real), integer and discrete type
15
variables. The Genetic Algorithm evolves solutions based on the ranges of values specified
by the user. The user can take advantage of this process by narrowing down the search
space as close as possible to the given assembly.
The modeling aspects and the related mathematical details are discussed in the next
section.
2.3 Mathematical Modeling
This model of the pipe routing problem is of practical significance since it
addresses the concerns and requirements of the automobile underhood pipe assembly
problem. In the initial stages of this research, a simple design model was used that
consisted of the coordinates of bends as the design variables. Minimization of the total
length of the pipes was considered as the only objective with the collision avoidance as the
constraint. The promising results from this model (Sandurkar, et al., 1997) motivated the
improvement of the model by the inclusion of some more constraints and objectives. The
improved optimization model is described here.
The improved mathematical model is an enhanced form of the preliminary model.
This model caters to a few practical concerns of the automobile pipe routing problem.
Firstly, the number of bends (elbows) in the pipes needs to be minimized since they are
usually more expensive than the pipes. Secondly, these elbows might be available with
limited choice of angles. These concerns are incorporated in this model and are explained
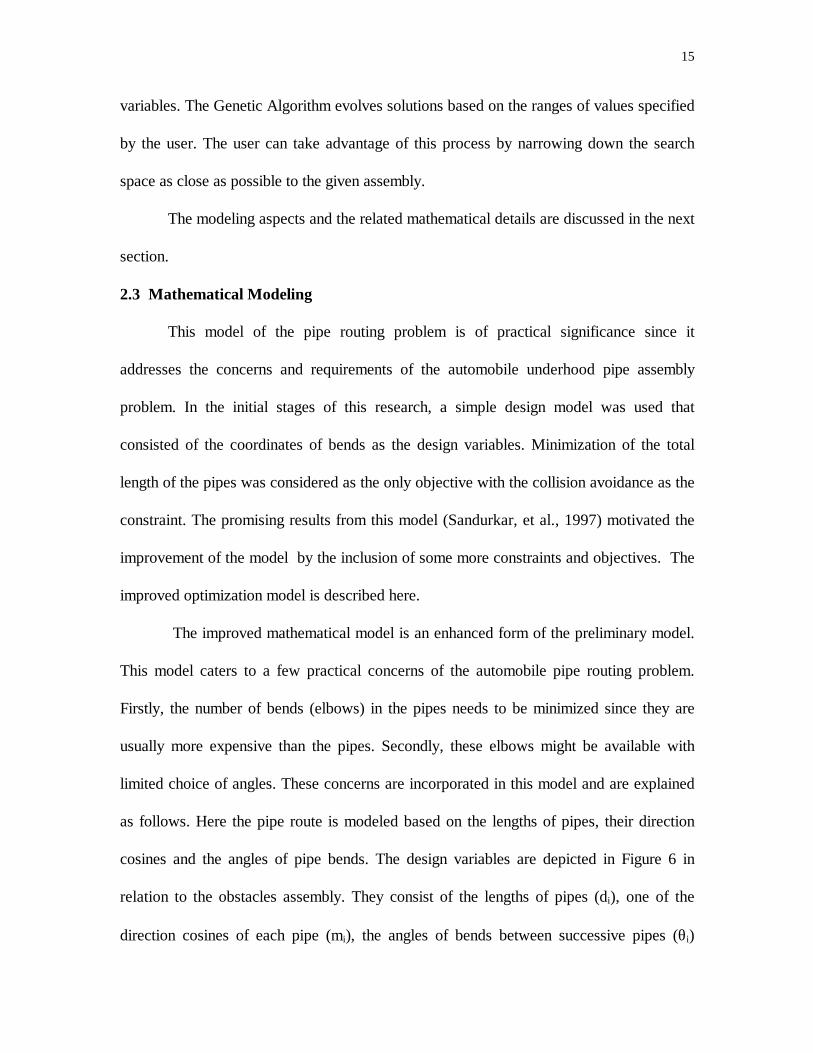
as follows. Here the pipe route is modeled based on the lengths of pipes, their direction
cosines and the angles of pipe bends. The design variables are depicted in Figure 6 in
relation to the obstacles assembly. They consist of the lengths of pipes (di), one of the
direction cosines of each pipe (mi), the angles of bends between successive pipes (θi)
16
along with the number of bends (N) as an important deciding variable. The incorporation
of the number of bends as a design variable and the choice of the angles of bends from a
catalog are significant improvements in the realistic modeling of the pipe routing problem.
These variables indicate the practical concerns of this model.
Insert Figure 6. SCHEMATIC DIAGRAM SHOWING THE DESIGN VARIABLES OF
THE IMPROVED MODEL
According to the available equations related to these variables the number of
variables is (3N+1), where N is the number of bends. The selection of variables is
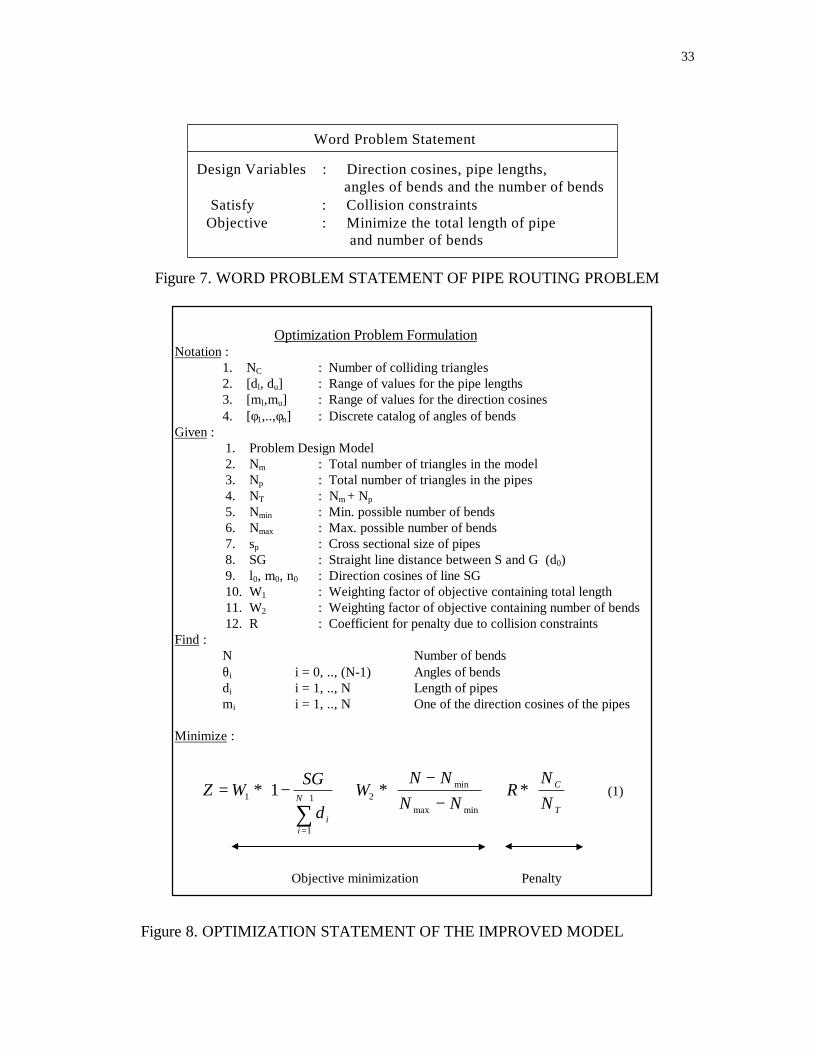
explained in detail in the following paragraphs. The model is expressed as a word problem
statement in Figure 7 and as an optimization problem statement in Figure 8.
Insert Figure 7. WORD PROBLEM STATEMENT OF PIPE ROUTING PROBLEM
Insert Figure 8. OPTIMIZATION STATEMENT OF THE IMPROVED MODEL
There are two types of variables involved in the generation of the pipes, namely,
the design variables and the intermediate variables. The variables generated by the GA are
called design variables (N, d, m, θ). Intermediate variables are those that are deduced from
the design variables by the use of Equations 2 and 3 (l, n, x, y, z). The intermediate
variables are used to generate the pipes.
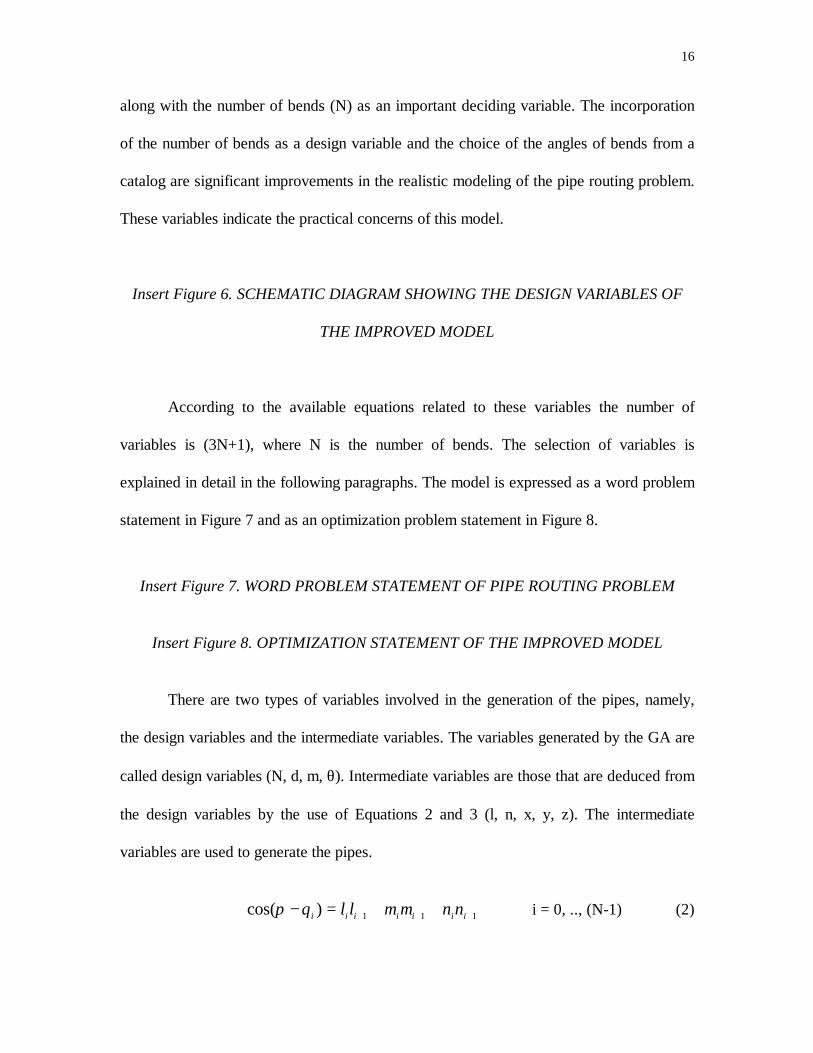
cos( )π θ− = + ++ + +i i i i i i il l m m n n1 1 1 i = 0, .., (N-1) (2)
17
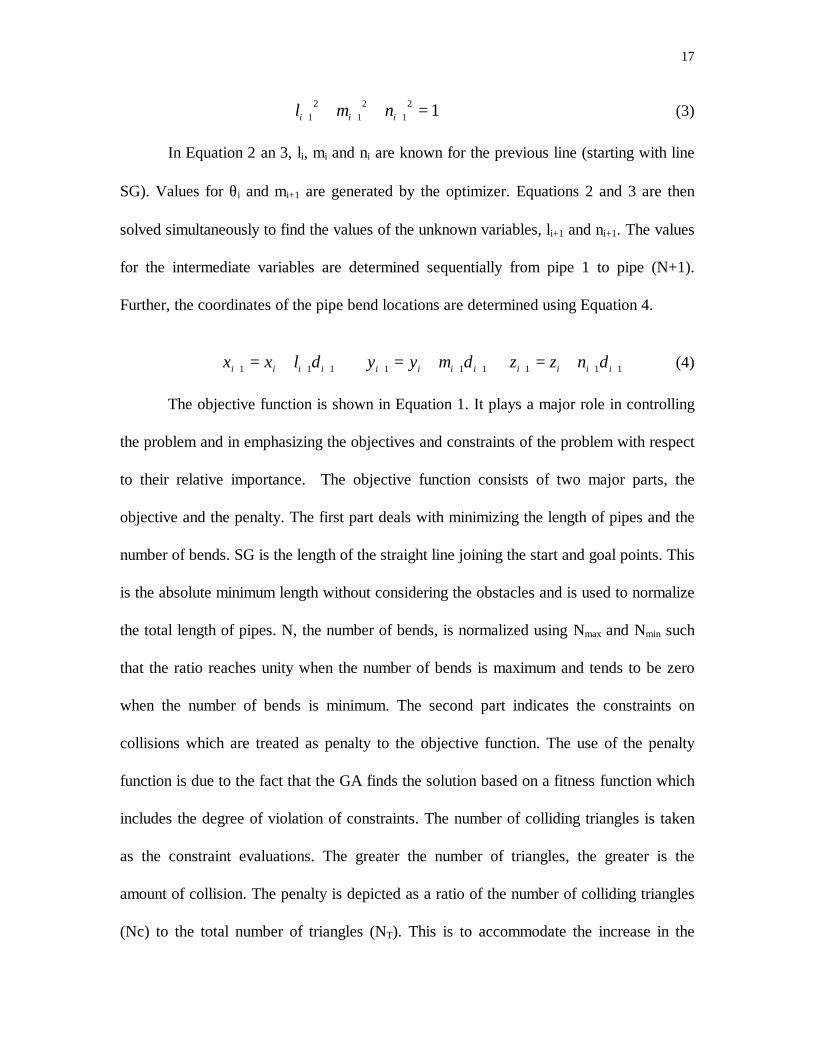
l m ni i i+ + ++ + =12
12
12 1 (3)
In Equation 2 an 3, li, mi and ni are known for the previous line (starting with line
SG). Values for θi and mi+1 are generated by the optimizer. Equations 2 and 3 are then
solved simultaneously to find the values of the unknown variables, li+1 and ni+1. The values
for the intermediate variables are determined sequentially from pipe 1 to pipe (N+1).
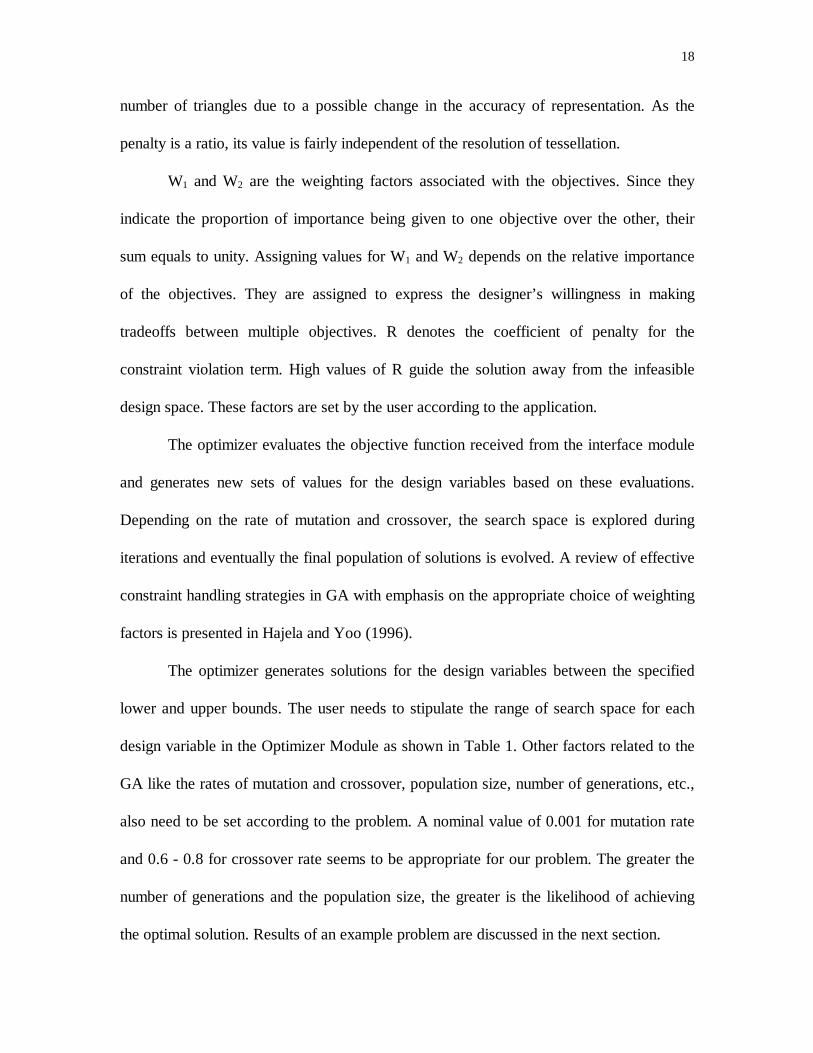
Further, the coordinates of the pipe bend locations are determined using Equation 4.
x x l di i i i+ + += +1 1 1 y y m di i i i+ + += +1 1 1 z z n di i i i+ + += +1 1 1 (4)
The objective function is shown in Equation 1. It plays a major role in controlling
the problem and in emphasizing the objectives and constraints of the problem with respect
to their relative importance. The objective function consists of two major parts, the
objective and the penalty. The first part deals with minimizing the length of pipes and the
number of bends. SG is the length of the straight line joining the start and goal points. This
is the absolute minimum length without considering the obstacles and is used to normalize
the total length of pipes. N, the number of bends, is normalized using Nmax and Nmin such
that the ratio reaches unity when the number of bends is maximum and tends to be zero
when the number of bends is minimum. The second part indicates the constraints on
collisions which are treated as penalty to the objective function. The use of the penalty
function is due to the fact that the GA finds the solution based on a fitness function which
includes the degree of violation of constraints. The number of colliding triangles is taken
as the constraint evaluations. The greater the number of triangles, the greater is the
amount of collision. The penalty is depicted as a ratio of the number of colliding triangles
(Nc) to the total number of triangles (NT). This is to accommodate the increase in the
18
number of triangles due to a possible change in the accuracy of representation. As the
penalty is a ratio, its value is fairly independent of the resolution of tessellation.
W1 and W2 are the weighting factors associated with the objectives. Since they
indicate the proportion of importance being given to one objective over the other, their
sum equals to unity. Assigning values for W1 and W2 depends on the relative importance
of the objectives. They are assigned to express the designer’s willingness in making
tradeoffs between multiple objectives. R denotes the coefficient of penalty for the
constraint violation term. High values of R guide the solution away from the infeasible
design space. These factors are set by the user according to the application.
The optimizer evaluates the objective function received from the interface module
and generates new sets of values for the design variables based on these evaluations.
Depending on the rate of mutation and crossover, the search space is explored during
iterations and eventually the final population of solutions is evolved. A review of effective
constraint handling strategies in GA with emphasis on the appropriate choice of weighting
factors is presented in Hajela and Yoo (1996).
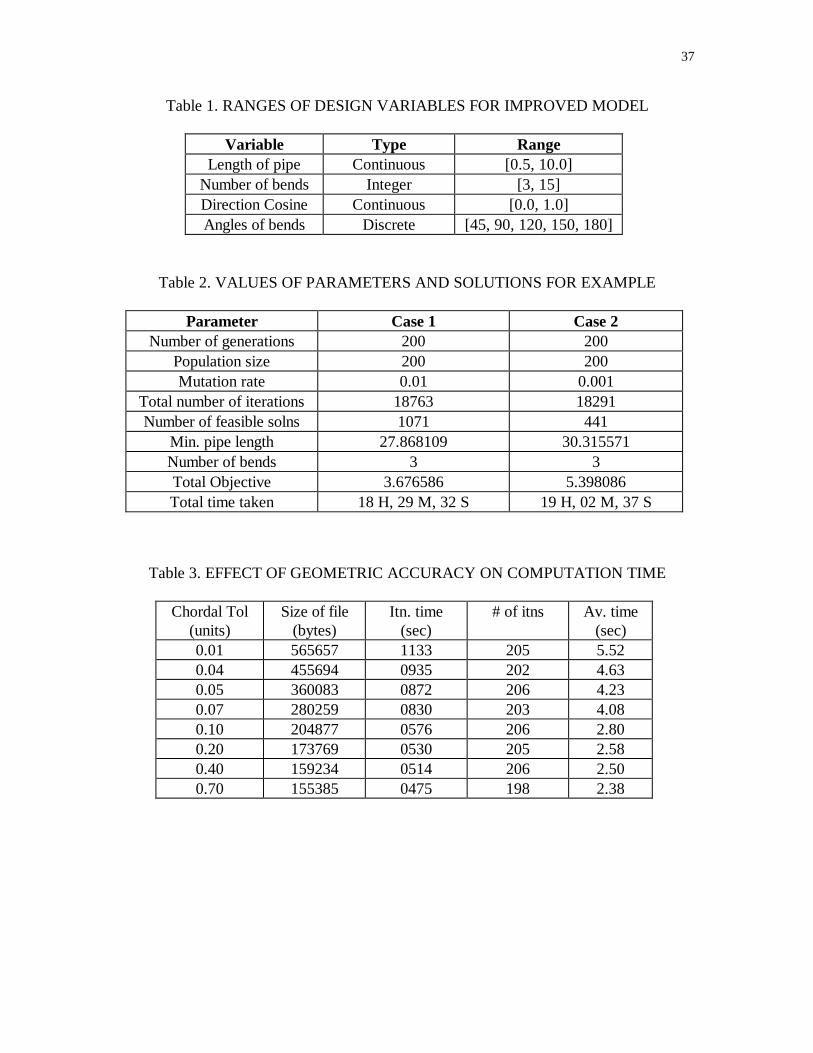
The optimizer generates solutions for the design variables between the specified
lower and upper bounds. The user needs to stipulate the range of search space for each
design variable in the Optimizer Module as shown in Table 1. Other factors related to the
GA like the rates of mutation and crossover, population size, number of generations, etc.,
also need to be set according to the problem. A nominal value of 0.001 for mutation rate
and 0.6 - 0.8 for crossover rate seems to be appropriate for our problem. The greater the
number of generations and the population size, the greater is the likelihood of achieving
the optimal solution. Results of an example problem are discussed in the next section.
19
3. RESULTS AND DISCUSSION
The automobile underhood assembly designer is one of the many groups of people
who can utilize GAPRUS for simplifying (automating) their pipe routing tasks. Here we
present a simplified example that belongs to this category of applications.
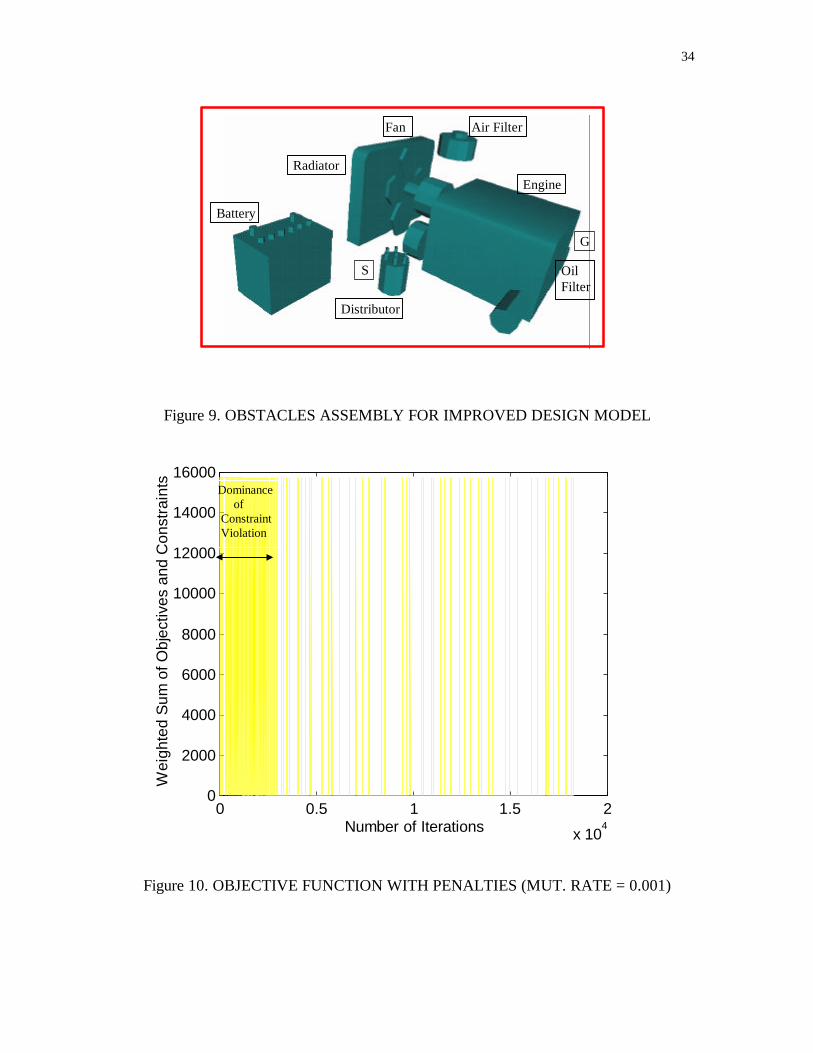
A simplified solid model of the automobile underhood is generated using
ProEngineer . The model consists of most of the chief components (obstacles) in the
underhood, namely, engine, battery, radiator and fan, air filter, distributor, oil filter,
alternator, power steering and a/c compressor. It is required to draw a pipe from the
distributor (between battery and engine) to a point near the oil filter (beside the engine,
not visible in this figure) as shown in Figure 9.
Insert Figure 9. OBSTACLES ASSEMBLY FOR IMPROVED DESIGN MODEL
The main objective is to connect the specified Start and Goal points with a pipe of
shortest length and the minimum number of bends. Constraints include avoidance of
collisions with any obstacle and the selection of pipe bend elbows from a prespecified
catalog of angles of bends.
The assembly pipe routing problem is solved with a population size of 200 over
200 generations. The problem is solved for two different rates of mutation of 0.01 (case 1)
and 0.001 (case 2) to compare the results. The ranges of design variables are given in
Table 1, while the solution is provided in Table 2.
20
Insert Table 1. RANGES OF DESIGN VARIABLES FOR IMPROVED MODEL
Insert Table 2. VALUES OF PARAMETERS AND SOLUTIONS FOR EXAMPLE
From Table 2 it is noted that the achieved minimum lengths of pipes are close to
the straight line length of 23.77 between S and G. The number of bends is reduced to the
minimum of 3. The number of feasible solutions are found to be 1071 and 441 over the
total number of iterations of 18763 and 18291 respectively. A large portion of the feasible
solutions are repeated designs of the pipe routes due to the reproduction operation of the
optimization approach. While the first case for mutation rate of 0.01 consumed 18 hours,
29 minutes and 32 seconds (66572 seconds), the second case consumed 19 hours, 02
minutes and 37 seconds (68557 seconds) on a SUN SPARC 20 work station. Figure 10
shows the trace of the value of the total objective function (including the penalty of
violating the constraints) with respect to the number of iterations.
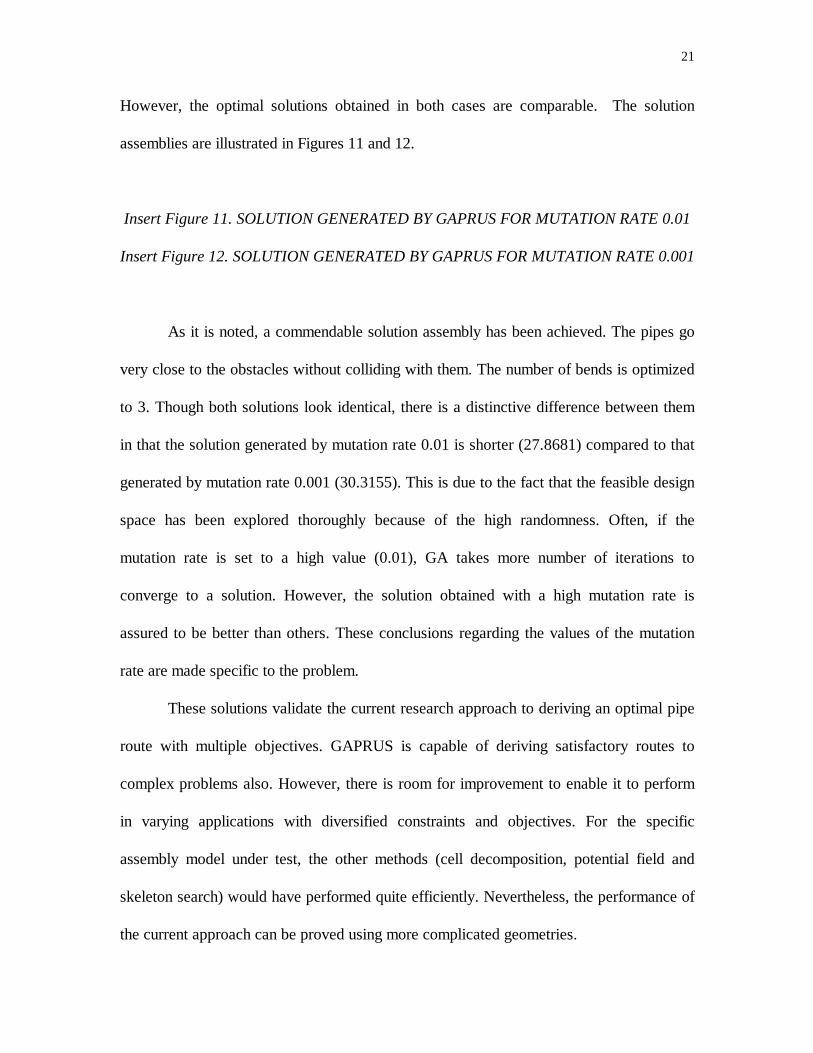
Insert Figure 10. OBJECTIVE FUNCTION WITH PENALTIES (MUT. RATE = 0.001)
The phases of dominance of the constraints are noted from this plot. For the first
3000 iterations (approximately), the constraints are violated. This results in high values of
the total objective function. After this phase, GA has located the feasible search spaces
and continues to search them with an infinitesimal amount of randomness. Hence the
region after 3000 iterations has a low objective score with intermittent shootings
indicating the randomness. The plot consists of spikes till the end of the optimization
process since the search space is still being explored with a high amount of randomness.
21
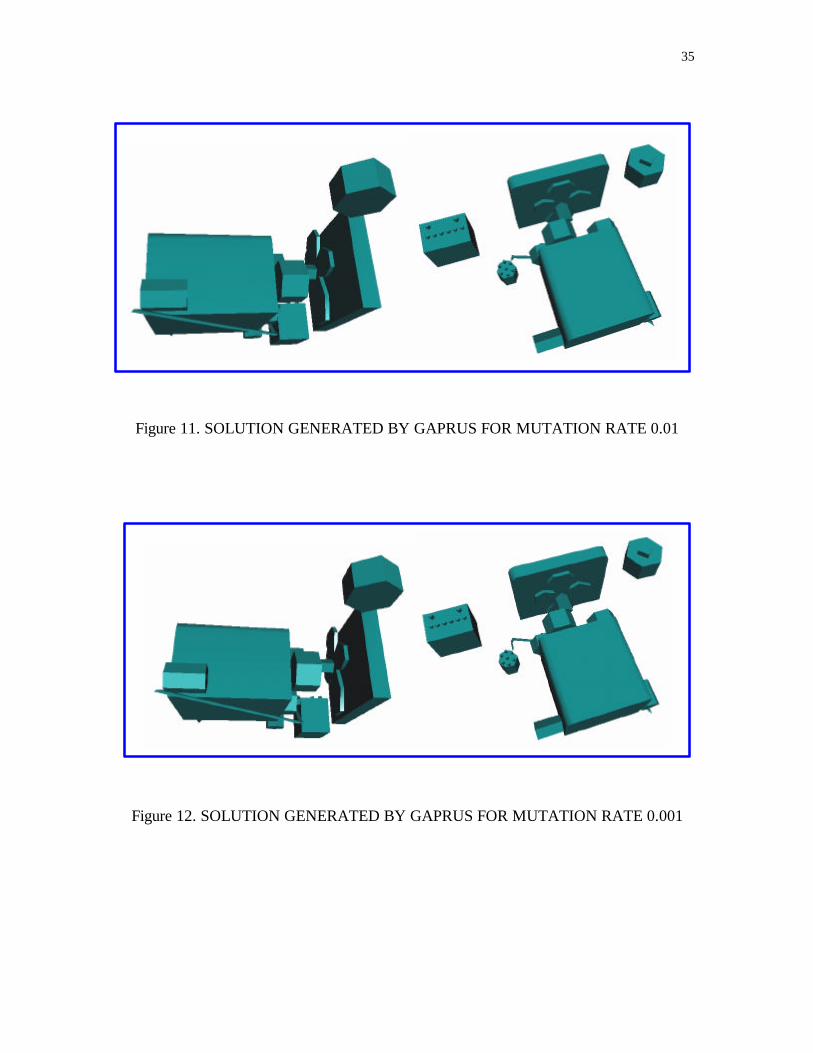
However, the optimal solutions obtained in both cases are comparable. The solution
assemblies are illustrated in Figures 11 and 12.
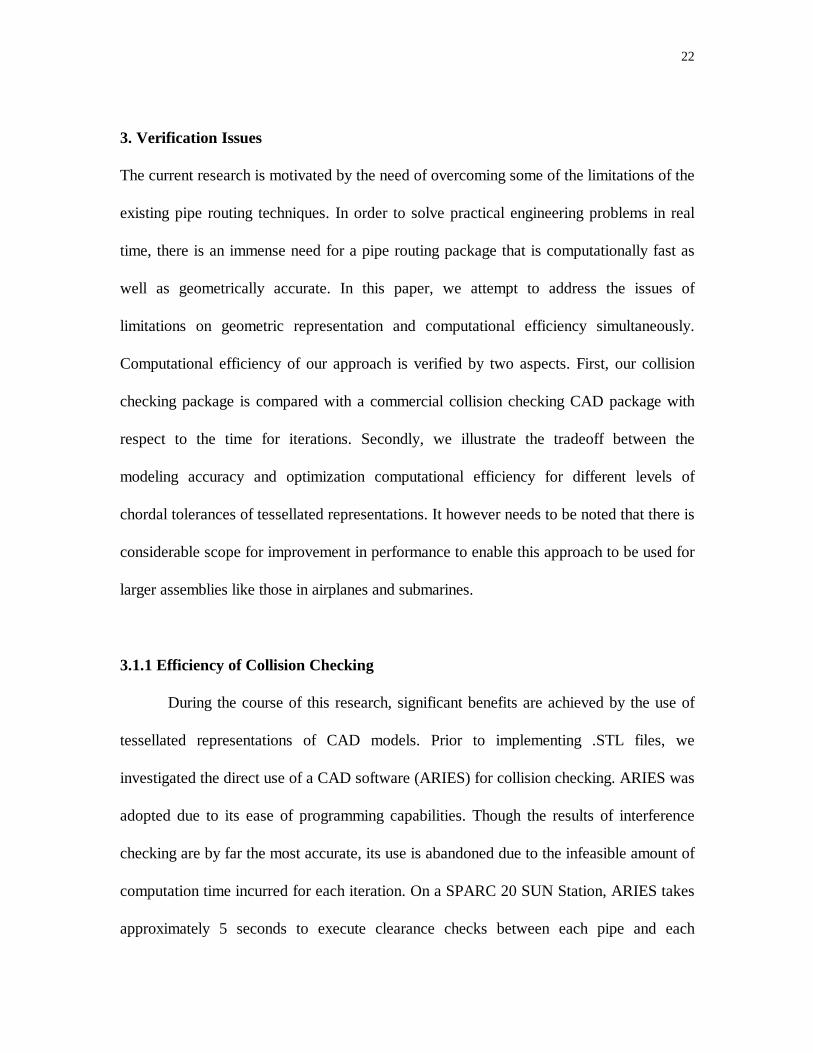
Insert Figure 11. SOLUTION GENERATED BY GAPRUS FOR MUTATION RATE 0.01
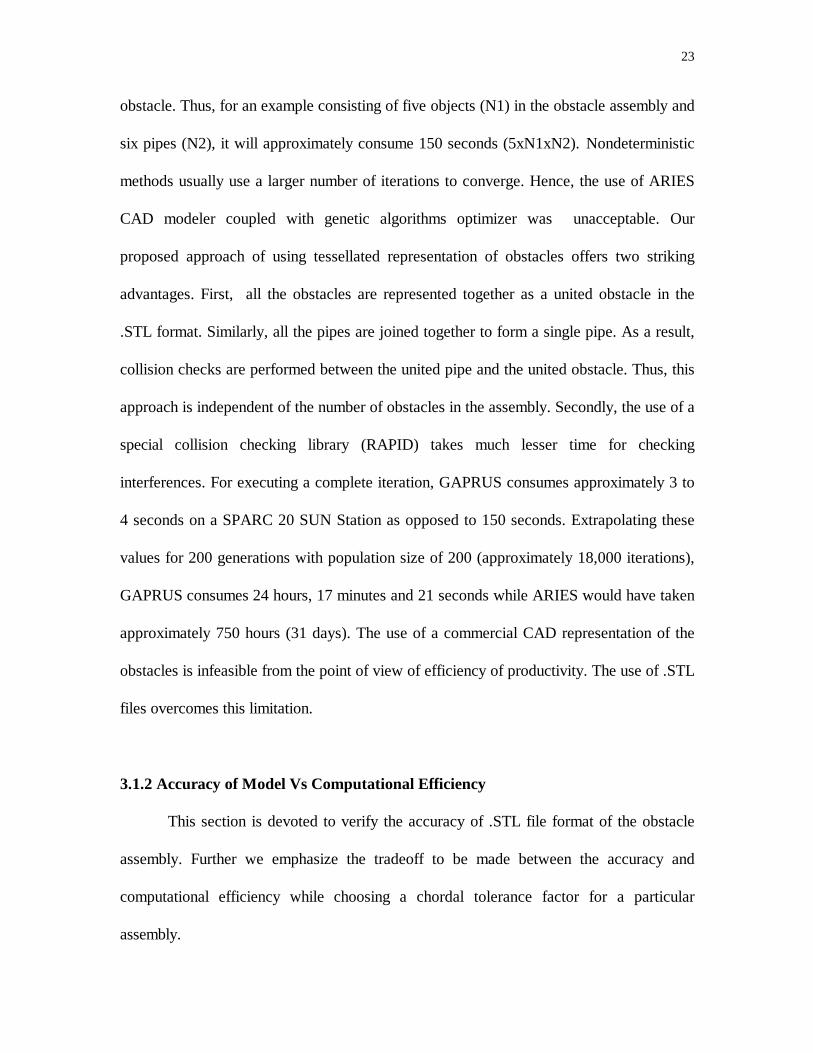
Insert Figure 12. SOLUTION GENERATED BY GAPRUS FOR MUTATION RATE 0.001
As it is noted, a commendable solution assembly has been achieved. The pipes go
very close to the obstacles without colliding with them. The number of bends is optimized
to 3. Though both solutions look identical, there is a distinctive difference between them
in that the solution generated by mutation rate 0.01 is shorter (27.8681) compared to that
generated by mutation rate 0.001 (30.3155). This is due to the fact that the feasible design
space has been explored thoroughly because of the high randomness. Often, if the
mutation rate is set to a high value (0.01), GA takes more number of iterations to
converge to a solution. However, the solution obtained with a high mutation rate is
assured to be better than others. These conclusions regarding the values of the mutation
rate are made specific to the problem.
These solutions validate the current research approach to deriving an optimal pipe
route with multiple objectives. GAPRUS is capable of deriving satisfactory routes to
complex problems also. However, there is room for improvement to enable it to perform
in varying applications with diversified constraints and objectives. For the specific
assembly model under test, the other methods (cell decomposition, potential field and
skeleton search) would have performed quite efficiently. Nevertheless, the performance of
the current approach can be proved using more complicated geometries.
22
3. Verification Issues
The current research is motivated by the need of overcoming some of the limitations of the
existing pipe routing techniques. In order to solve practical engineering problems in real
time, there is an immense need for a pipe routing package that is computationally fast as
well as geometrically accurate. In this paper, we attempt to address the issues of
limitations on geometric representation and computational efficiency simultaneously.
Computational efficiency of our approach is verified by two aspects. First, our collision
checking package is compared with a commercial collision checking CAD package with
respect to the time for iterations. Secondly, we illustrate the tradeoff between the
modeling accuracy and optimization computational efficiency for different levels of
chordal tolerances of tessellated representations. It however needs to be noted that there is
considerable scope for improvement in performance to enable this approach to be used for
larger assemblies like those in airplanes and submarines.
3.1.1 Efficiency of Collision Checking
During the course of this research, significant benefits are achieved by the use of
tessellated representations of CAD models. Prior to implementing .STL files, we
investigated the direct use of a CAD software (ARIES) for collision checking. ARIES was
adopted due to its ease of programming capabilities. Though the results of interference
checking are by far the most accurate, its use is abandoned due to the infeasible amount of
computation time incurred for each iteration. On a SPARC 20 SUN Station, ARIES takes
approximately 5 seconds to execute clearance checks between each pipe and each
23
obstacle. Thus, for an example consisting of five objects (N1) in the obstacle assembly and
six pipes (N2), it will approximately consume 150 seconds (5xN1xN2). Nondeterministic
methods usually use a larger number of iterations to converge. Hence, the use of ARIES
CAD modeler coupled with genetic algorithms optimizer was unacceptable. Our
proposed approach of using tessellated representation of obstacles offers two striking
advantages. First, all the obstacles are represented together as a united obstacle in the
.STL format. Similarly, all the pipes are joined together to form a single pipe. As a result,
collision checks are performed between the united pipe and the united obstacle. Thus, this
approach is independent of the number of obstacles in the assembly. Secondly, the use of a
special collision checking library (RAPID) takes much lesser time for checking
interferences. For executing a complete iteration, GAPRUS consumes approximately 3 to
4 seconds on a SPARC 20 SUN Station as opposed to 150 seconds. Extrapolating these
values for 200 generations with population size of 200 (approximately 18,000 iterations),
GAPRUS consumes 24 hours, 17 minutes and 21 seconds while ARIES would have taken
approximately 750 hours (31 days). The use of a commercial CAD representation of the
obstacles is infeasible from the point of view of efficiency of productivity. The use of .STL
files overcomes this limitation.
3.1.2 Accuracy of Model Vs Computational Efficiency
This section is devoted to verify the accuracy of .STL file format of the obstacle
assembly. Further we emphasize the tradeoff to be made between the accuracy and
computational efficiency while choosing a chordal tolerance factor for a particular
assembly.
24
As discussed in the previous section (Section 3.1.1), .STL files are adopted in this
research to overcome the limitations on the geometric representation of the assembly and
to improve the computational efficiency. However, the use of .STL files introduces
approximations in the geometric representations. Further, the use of the collision checking
library (RAPID) incorporates a small amount of anomaly in the representation of the
amounts of collisions. This limitation can be overcome to a satisfactory level by
normalizing the total number of trianglular facets in the model as discussed in Section 2.3.
On the other hand, the accuracy of representation of the model in the .STL format
can be controlled by the chordal tolerance factor. In general, the largest allowable value
for the chordal tolerance factor depends on the size of the smallest feature present in the
assembly. If this factor is set to a value greater than the smallest feature, the CAD package
(ProE) does not generate a .STL file. .STL files of varying chordal tolerance factors are
generated on ProE for the sample automobile assembly model shown in Figure 9. The
optimizer is run with a fixed number of generations (20) and populations (20). The time
for iterations and the sizes of the assembly files are recorded in Table 3.
Insert Table 3. EFFECT OF GEOMETRIC ACCURACY ON COMPUTATION TIME
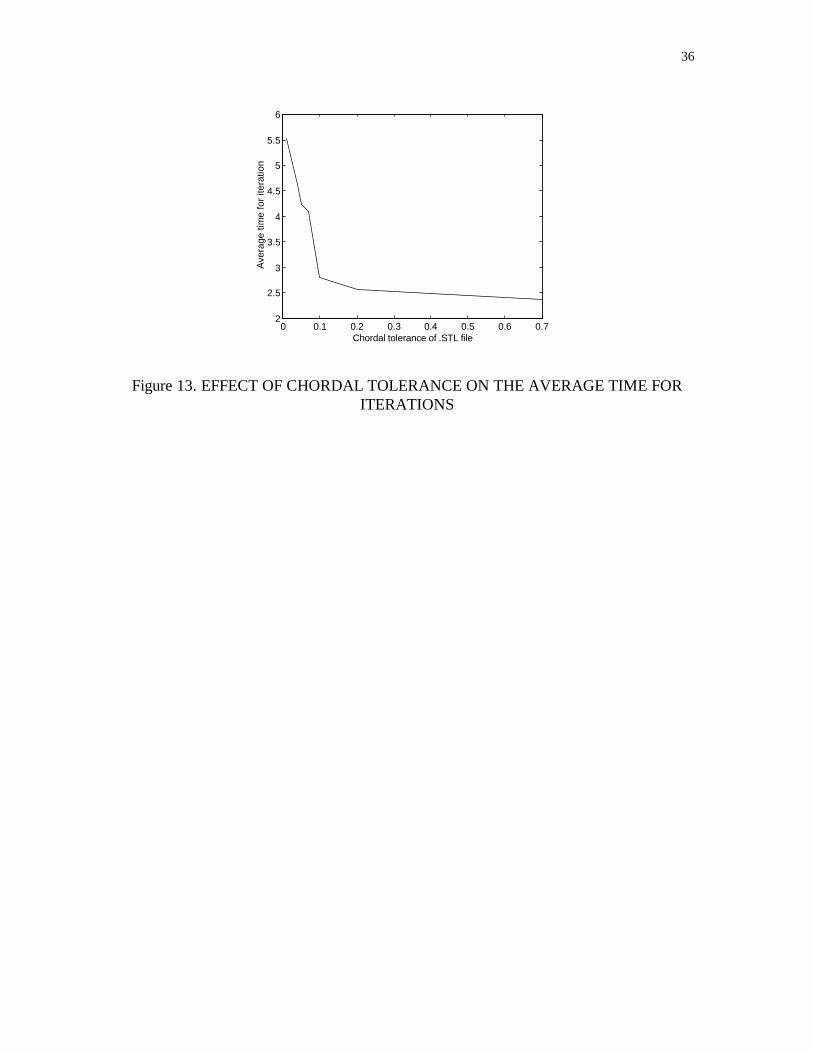
As it can be noticed, the average time for one iteration decreases as the chordal
tolerance of the .STL is increased. Figure 13 shows the variation of average time for
iterations with the chordal tolerance.
Insert Figure 13. EFFECT OF CHORDAL TOLERANCE ON THE AVERAGE TIMEFOR ITERATIONS
25
The curve has a sharp decrease from chordal tolerance values of 0.01 to 0.1. After
0.1, there is a minor variation of the average time with respect to the tolerance factor.
From this plot it can be concluded that there lies a range of values of the tolerance factor
when the average time tends to become steady. In this plot this range is between 0.08 to
0.25 where the average time reduces from approximately 3.0 to 2.6 seconds. In this range
a judicial tradeoff between the two aspects is achieved. Hence a tolerance factor in this
range will suffice the need by reducing the time for iterations as well as providing
sufficient accuracy of modeling.
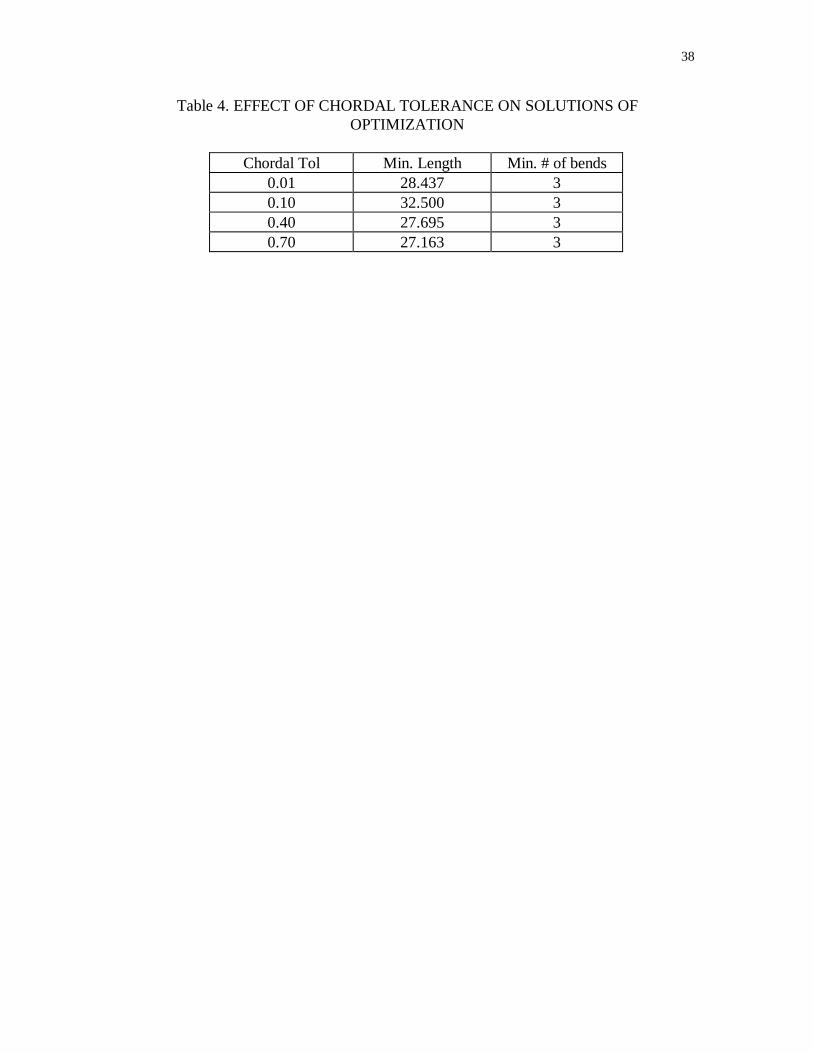
Assemblies with different chordal tolerances are picked from the above table and
GAPRUS is executed with each of them for 200 generations with a population size of
200. Results of the optimization are listed in Table 4.
Insert Table 4. EFFECT OF CHORDAL TOLERANCE ON SOLUTIONS OFOPTIMIZATION
From Table 4 it is noted that the chordal tolerance factor does not produce a
significant effect on the solutions. The total length of pipes of the best solution is within
comparable limits, the straight line distance between S and G being 23.77. In each of these
cases the number of bends is minimized to 3. Thus it can be concluded that the objectives
are fairly independent of the chordal tolerance values when using the tessellated object
representations.
26
4. CONCLUSIONS
We develop a novel technique to solve the pipe routing problem that makes use of
Genetic Algorithms for optimization and the tessellated format for representation of the
obstacles. GAPRUS is a versatile pipe route planning package that efficiently generates
the route of the optimal set of pipes between specified points. Genetic algorithms, a
nondeterministic optimization method, is adopted due to its versatile features related to
searching global optimal solution. A mathematical programming optimization approach is
utilized as it allows the modeling of both the design constraints and objectives. With
regard to the priorities in the problem, "weights" can be imposed on the objective
functions. Genetic Algorithms employ a random selection of values from the specified
design space and hence could increase the chances of finding the global optimum.
In this paper, we present the use of .STL files to represent the obstacles and
highlight the distinctive advantages associated with it. The tessellation of obstacles
involves a negligible amount of sacrifice of accuracy since the objects are approximated
into facets (triangles). However, the chordal tolerance values can be adjusted to reduce
this approximation factor while generating the .STL file. We have demonstrated the
tradeoff between these two factors in the previous section.
The system currently caters to the simple cases of constraints and objectives. It has
been implemented to optimize the total length of the connecting pipes and the number of
bends while avoiding obstacles. Thus we have illustrated the applicability of fundamental
principles related to pipe routing. Future work will focus on addressing more complex and
realistic problems including the maintainability problems. Complex objectives like
minimizing cost, time, etc., and complex constraints like avoiding hot and sensitive objects
27
need to be incorporated. Implementation of new features like minimizing pressure drops at
bends are being considered.
ACKNOWLEDGEMENTS
The authors wish to thank Matthew Wall at Massachusetts Institute of Technology
for letting us use GALib (Genetic Algorithm Library) for this research. Thanks also go to
Stefan Gottschalk at University of North Carolina, Chapel Hill for letting us use RAPID
(Rapid and Accurate Polygon Interference Detection) for this research. The support from
NSF faculty early career award (DMI 9624363) is gratefully acknowledged.
REFERENCES
Ahuja, N. and Hwang Y.K., 1992, "Gross Motion Planning - A Survey", ACM
Computing Surveys, 24(3), 219 -291.
Aurenhammer, F., 1991, “Voronoi Diagrams - A survey of fundamental geometric
data structure”, ACM Computing Survey, 23(3) (Sept.), 345-405.
Beasley, D., Bull, D.R., and Martin, R.R., 1993, "An Overview of Genetic
Algorithms : Part 1, Fundamentals", University Computing, 15(2), 58-69.
Chang, H. and Li T-Y. ,1995, "Assembly Maintainability Study with Motion
Planning", IEEE International Conference on Robotics and Automation, 1012-1019.
Conru, A.B and Cutkosky, M. R., 1993, "Computational Support For Interactive
Cable Harness Routing And Design.", Advances in Design Automation, DE- 65(1), 551-
558.
28
Coulter, S., Bras, B. and Rosen, D., 1995, “Dynamic Non-Interference Constraints in
Goal-Directed Geometry”, Advances in Design Automation, DE- 82(1). 907-914.
Gottschalk, S, Lin, M. C and Manocha, D., 1996, “OBB-Tree: A Hierarchical
Structure for Rapid Interference Detection”, Proceedings of ACM Siggraph 1996.
Goldberg, D., 1989, Genetic Algorithms in Search, Optimization and Machine
Learning, Addison-Wesley Publishing Company, Inc.
Hajela, P., and Yoo, J., 1996, “Constraint Handling in Genetic Search using
Expression Strategies”, AIAA Journal, Vol. 34, No.11, pp. 2414-2420.
Jacobs, P. F., 1996, Stereolithography and Other RP&M Technologies - From Rapid
Prototyping to Rapid Tooling, ASME Press.
Koditschek, D. E., 1989, “Robot Planning and Control via potential functions”,
Robotics Review, Vol 1, MIT Press, Cambridge, Mass.
Latombe, J-C, 1991, Robot Motion Planning, Kluwer Academic Publishers, Boston.
Morvan, S. M. and Fadel, G. M., 1996, "IVECS: An Interactive Virtual Environment
for the Correction of .STL Files”, Conference on Virtual Design, University of California
at Irvine, August 21-22, Irvine, CA.
Sandurkar, S., et al., 1997, “GAPRUS : Three-Dimensional Pipe Routing Using
Genetic Algorithms And Tessellated Objects”, to be presented in 1997 ASME, Design
Engineering Technical Conference, ASME, Sacramento, CA.
Szykman, S and Cagan, J, 1995, “Synthesis of Optimal Non-orthogonal Routes”,
Advances in Design Automation, DE- 82(1), 431-438.
Toogood, R., Hao, H., and Wong, C., 1995, “Robot Path Planning Using Genetic
Algorithms”, IEEE, 489-494.
29
List of Figures
Figure 1. SAMPLE PIPE ROUTING ASSEMBLY
Figure 2. REPRESENTATION OF SOLID IN .STL FORMAT
Figure 3. GAPRUS PIPE ROUTING PROCESS FLOW CHART
Figure 4: STRUCTURE OF PIPE ROUTING SYSTEM
Figure 5. FUNCTIONS OF MODELER MODULE
Figure 6. SCHEMATIC DIAGRAM SHOWING THE DESIGN VARIABLES OF THE
IMPROVED MODEL
Figure 7. WORD PROBLEM STATEMENT OF PIPE ROUTING PROBLEM
Figure 8. OPTIMIZATION STATEMENT OF THE IMPROVED MODEL
Figure 9. OBSTACLES ASSEMBLY FOR IMPROVED DESIGN MODEL
Figure 10. OBJECTIVE FUNCTION WITH PENALTIES (MUT. RATE = 0.001)
Figure 11. SOLUTION GENERATED BY GAPRUS FOR MUTATION RATE 0.01
Figure 12. SOLUTION GENERATED BY GAPRUS FOR MUTATION RATE 0.001
Figure 13. EFFECT OF CHORDAL TOLERANCE ON THE AVERAGE TIME FOR
ITERATIONS
List of Tables
Table 1. RANGES OF DESIGN VARIABLES FOR IMPROVED MODEL
Table 2. VALUES OF PARAMETERS AND SOLUTIONS FOR EXAMPLE
Table 3. EFFECT OF GEOMETRIC ACCURACY ON COMPUTATION TIME
Table 4. EFFECT OF CHORDAL TOLERANCE ON SOLUTIONS OF
OPTIMIZATION
30
S
G
Figure 1. SAMPLE PIPE ROUTING ASSEMBLY
Figure 2. REPRESENTATION OF SOLID IN .STL FORMAT
31
.STL File Formatting
Objective & Constraint Evaluations
.STL File ofAssembly,S,G
Output Terminal
Optimization
Iteration Processing
Collision Checks (RAPID)
.STL file ofBest Pipe Route
Input Terminal
Positions of pipes
Phase 1Phase 2
Phase 3
Figure 3. GAPRUS PIPE ROUTING PROCESS FLOW CHART
Figure 4: STRUCTURE OF PIPE ROUTING SYSTEM
ModelerModule
Optimizer Module
I N T E R F A C E Design Variables .STL files
of pipes
.STL files of pipes and model Collision Checks
32
.STL file ofobstacle assembly
formatted.STLfile
designvariablesfrom GA
formatted .STLfile of pipes
USER
OptimizerModule
InterfaceModule
Figure 5. FUNCTIONS OF MODELER MODULE
S
G
θ1
d1, m1
d2, m
2
θ0
Figure 6. SCHEMATIC DIAGRAM SHOWING THE DESIGN VARIABLES OF THE
IMPROVED MODEL
33
Word Problem Statement
Objective : Minimize the total length of pipe and number of bends
Satisfy : Collision constraints
Design Variables : Direction cosines, pipe lengths, angles of bends and the number of bends
Figure 7. WORD PROBLEM STATEMENT OF PIPE ROUTING PROBLEM
Figure 8. OPTIMIZATION STATEMENT OF THE IMPROVED MODEL
Optimization Problem FormulationNotation :
1. NC : Number of colliding triangles2. [dl, du] : Range of values for the pipe lengths3. [ml,mu] : Range of values for the direction cosines4. [φ1,..,φn] : Discrete catalog of angles of bends
Given :1. Problem Design Model2. Nm : Total number of triangles in the model3. Np : Total number of triangles in the pipes4. NT : Nm + Np
5. Nmin : Min. possible number of bends6. Nmax : Max. possible number of bends7. sp : Cross sectional size of pipes8. SG : Straight line distance between S and G (d0)9. l0, m0, n0 : Direction cosines of line SG10. W1 : Weighting factor of objective containing total length11. W2 : Weighting factor of objective containing number of bends12. R : Coefficient for penalty due to collision constraints
Find :N Number of bendsθi i = 0, .., (N-1) Angles of bendsdi i = 1, .., N Length of pipesmi i = 1, .., N One of the direction cosines of the pipes
Minimize :
Z WSG
dW
N NN N
RNN
ii
NC
T
= −
+ −−
+
=
+
∑1
1
1 21* * *min
max min
(1)
Objective minimization Penalty
34
Figure 9. OBSTACLES ASSEMBLY FOR IMPROVED DESIGN MODEL
0 0.5 1 1.5 2
x 104
0
2000
4000
6000
8000
10000
12000
14000
16000
Number of Iterations
Wei
ghte
d S
um o
f Obj
ectiv
es a
nd C
onst
rain
ts
Figure 10. OBJECTIVE FUNCTION WITH PENALTIES (MUT. RATE = 0.001)
Battery
Distributor
Radiator
Fan
Engine
Air Filter
Oil Filter
S
G
Dominance of Constraint Violation
35
Figure 11. SOLUTION GENERATED BY GAPRUS FOR MUTATION RATE 0.01
Figure 12. SOLUTION GENERATED BY GAPRUS FOR MUTATION RATE 0.001
36
0 0.1 0.2 0.3 0.4 0.5 0.6 0.72
2.5
3
3.5
4
4.5
5
5.5
6
Chordal tolerance of .STL file
Ave
rage
tim
e fo
r ite
ratio
n
Figure 13. EFFECT OF CHORDAL TOLERANCE ON THE AVERAGE TIME FORITERATIONS
37
Table 1. RANGES OF DESIGN VARIABLES FOR IMPROVED MODEL
Variable Type RangeLength of pipe Continuous [0.5, 10.0]
Number of bends Integer [3, 15]Direction Cosine Continuous [0.0, 1.0]Angles of bends Discrete [45, 90, 120, 150, 180]
Table 2. VALUES OF PARAMETERS AND SOLUTIONS FOR EXAMPLE
Parameter Case 1 Case 2Number of generations 200 200
Population size 200 200Mutation rate 0.01 0.001
Total number of iterations 18763 18291Number of feasible solns 1071 441
Min. pipe length 27.868109 30.315571Number of bends 3 3Total Objective 3.676586 5.398086Total time taken 18 H, 29 M, 32 S 19 H, 02 M, 37 S
Table 3. EFFECT OF GEOMETRIC ACCURACY ON COMPUTATION TIME
Chordal Tol(units)
Size of file(bytes)
Itn. time(sec)
# of itns Av. time(sec)
0.01 565657 1133 205 5.520.04 455694 0935 202 4.630.05 360083 0872 206 4.230.07 280259 0830 203 4.080.10 204877 0576 206 2.800.20 173769 0530 205 2.580.40 159234 0514 206 2.500.70 155385 0475 198 2.38
38
Table 4. EFFECT OF CHORDAL TOLERANCE ON SOLUTIONS OFOPTIMIZATION
Chordal Tol Min. Length Min. # of bends0.01 28.437 30.10 32.500 30.40 27.695 30.70 27.163 3