Embed Size (px)
Citation preview
Gap Analysis Technical Memorandum
Savannah – Upper Ogeechee Regional Water Planning Council
Supplemental MaterialSavannah – Upper Ogeechee Regional Water PlanOctober 2019
Ogeechee River, Georgia
i
Table of Contents
Section 1 Introduction ..................................................................................................... 1-1
Section 2 Water and Wastewater Forecast Overview ....................................................... 2-1
2.1 Water Demand Summary ...................................................................................................................................... 2-1
2.1.1 Groundwater Forecasts ............................................................................................................................ 2-2
2.1.2 Surface Water Forecasts .......................................................................................................................... 2-2
2.1.3 Municipal Demand Forecast Compared to Permitted Supply.................................................. 2-2
2.2 Wastewater Forecast Summary ......................................................................................................................... 2-4
2.2.1 Comparing Wastewater Forecasts to Permitted Capacity ........................................................ 2-4
Section 3 Groundwater Availability .................................................................................. 3-1
3.1 Crystalline-Rock Aquifer ....................................................................................................................................... 3-1
3.2 Floridan Aquifer ........................................................................................................................................................ 3-1
3.3 Cretaceous Aquifer ................................................................................................................................................... 3-2
Section 4 Surface Water Availability ................................................................................ 4-1
4.1 Surface Water Planning Node Summary ........................................................................................................ 4-1
4.2 Detailed Potential Gap Analysis .......................................................................................................................... 4-3
4.2.1 Potential Gaps at the Claxton Node ..................................................................................................... 4-3
4.2.2 Potential Gaps at Eden Node .................................................................................................................. 4-4
4.2.3 Potential Gaps at Kings Ferry Node .................................................................................................... 4-5
Section 5 Surface Water Quality ...................................................................................... 5-1
5.1 Dissolved Oxygen Assimilative Capacity ........................................................................................................ 5-1
5.2 Non-Point Source Pollution .................................................................................................................................. 5-4
5.3 Nutrient Loading ....................................................................................................................................................... 5-6
Section 6 Gap Analysis Summary ..................................................................................... 6-1

Table of Contents • Gap Analysis Technical Memorandum
ii
List of Figures
Figure 1-1: Savannah-Upper Ogeechee ........................................................................................................................ 1-1
Figure 2-1: Savannah-Upper Ogeechee Regional Water Forecast by Sector and Supply Source ........ 2-1
Figure 2-2: Savannah-Upper Ogeechee Regional Wastewater Forecast by Discharge Method and
Sector ........................................................................................................................................................................................... 2-4
Figure 3-1: Floridan Aquifer (South Central Georgia & Eastern Coastal Plain) Forecasted
Groundwater Demand Compared to Estimated Sustainable Yield ................................................................... 3-2
Figure 3-2: Cretaceous Aquifer Forecasted Groundwater Demand Compared to Estimated
Sustainable Yield .................................................................................................................................................................... 3-3
Figure 4-1: 2050 Potential Surface Water Gap Summary ..................................................................................... 4-2
Figure 5-1: Results of DO Assimilative Capacity Assessment at Permitted Conditions ........................... 5-2
Figure 5-2: Impaired Water Bodies ................................................................................................................................ 5-5
Figure 5-4 Savannah-Upper Ogeechee Watershed Wet Year Nutrient Loadings; Total Phosphorus
Future (2050) Conditions ................................................................................................................................................... 5-8
List of Tables
Table 2-1: Regional Groundwater Forecast by Aquifer (MGD) .......................................................................... 2-2
Table 2-2: Municipal Forecast versus Permitted Capacity ................................................................................... 2-3
Table 2-3: 2050 Municipal Wastewater Forecast versus Existing Permitted Capacity (MGD) ............ 2-5
Table 4-1: Characteristics of Modeled 2050 Potential Surface Water Gaps ................................................. 4-3
Table 4-2: Potential Surface Water Gaps at Claxton Node ................................................................................... 4-4
Table 4-3: Claxton Planning Node Surface Water Forecast and Summary of Potential Gaps by Region
........................................................................................................................................................................................................ 4-4
Table 4-4: Potential Surface Water Gaps at Eden Node ......................................................................................... 4-5
Table 4-5: Eden Planning Node Surface Water Forecast and Summary of Potential Gaps by Region
........................................................................................................................................................................................................ 4-5
Table 4-6: Potential Surface Water Gaps at Kings Ferry Node ........................................................................... 4-5
Table 4-7: Kings Ferry Planning Node Surface Water Forecast and Summary of Potential Gaps by
Region ......................................................................................................................................................................................... 4-6
Table 5-1: Permitted Assimilative Capacity for DO in the Savannah-Upper Ogeechee Region ............ 5-1
Table 5-2: Stream Segments with No or Exceeded Assimilative Capacity Under Current Permitted
Conditions ................................................................................................................................................................................. 5-3
Table 6-1: Summary of Potential Water Resource Issues by County1 ............................................................. 6-2
Appendices
Appendix: Forecasts verse Permitted Capacity by County
1-1
Section 1
Introduction
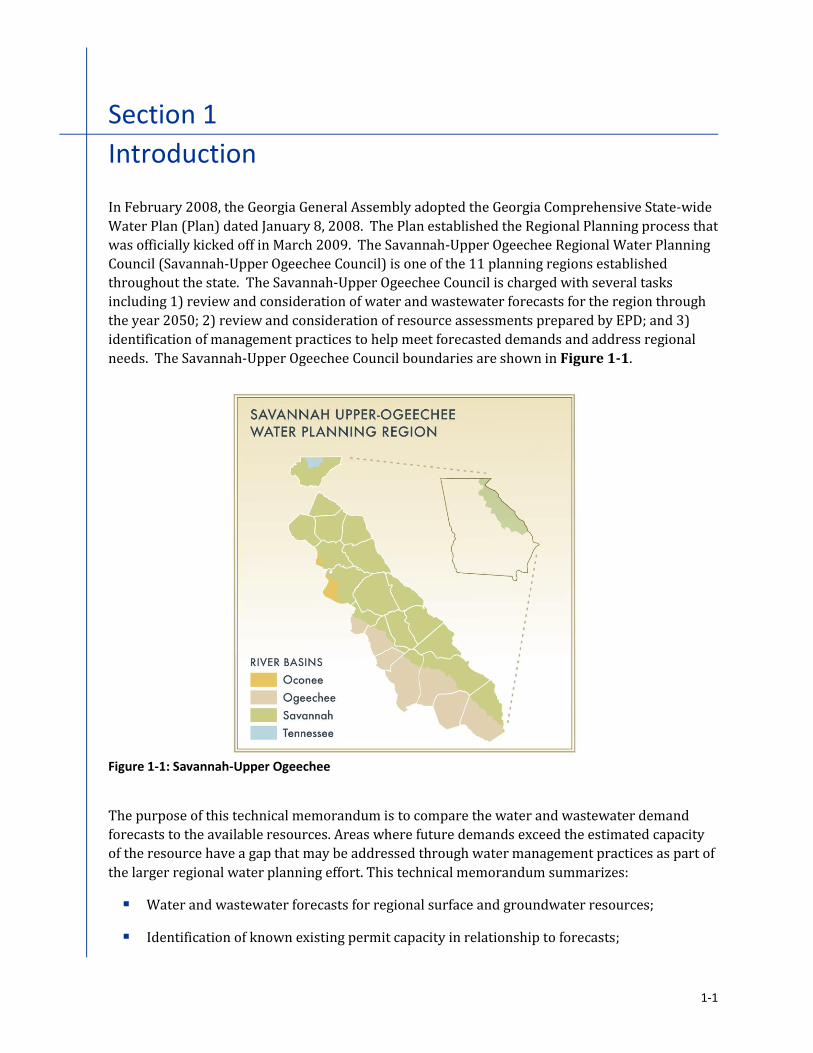
In February 2008, the Georgia General Assembly adopted the Georgia Comprehensive State-wide
Water Plan (Plan) dated January 8, 2008. The Plan established the Regional Planning process that
was officially kicked off in March 2009. The Savannah-Upper Ogeechee Regional Water Planning
Council (Savannah-Upper Ogeechee Council) is one of the 11 planning regions established
throughout the state. The Savannah-Upper Ogeechee Council is charged with several tasks
including 1) review and consideration of water and wastewater forecasts for the region through
the year 2050; 2) review and consideration of resource assessments prepared by EPD; and 3)
identification of management practices to help meet forecasted demands and address regional
needs. The Savannah-Upper Ogeechee Council boundaries are shown in Figure 1-1.
Figure 1-1: Savannah-Upper Ogeechee
The purpose of this technical memorandum is to compare the water and wastewater demand
forecasts to the available resources. Areas where future demands exceed the estimated capacity
of the resource have a gap that may be addressed through water management practices as part of
the larger regional water planning effort. This technical memorandum summarizes:
▪ Water and wastewater forecasts for regional surface and groundwater resources;
▪ Identification of known existing permit capacity in relationship to forecasts;

Section 1 • Introduction
1-2
▪ Estimated sustainable yield of the prioritized aquifers used in the Savannah-Upper
Ogeechee Region in relationship to forecasts;
▪ Estimated surface water availability in relationship to the forecasts while maintaining the
instream flow regime; and
▪ Water quality considerations.

2-1
Section 2
Water and Wastewater Forecast Overview
Water and wastewater forecasts have been developed beginning in 2015 and extending to 2050
for the 20 counties within the region. The major water and wastewater sectors include municipal
(domestic and commercial), industrial, agricultural, and energy (thermoelectric power
production).
A brief summary is provided in this document, but for more details concerning the forecast
methodology and development please see the Water and Wastewater Forecasting Technical
Memorandum for the Savannah-Upper Ogeechee Council.
2.1 Water Demand Summary Figure 2-1 shows the aggregated county water forecasts for the Savannah-Upper Ogeechee
Council region (the Savannah-Upper Ogeechee Region) in 2015 and 2050. Overall, the regional
forecasted water need is expected to increase by 109.2 MGD. The forecasts are associated with a
water source, either surface water (SW) shown in blue or groundwater (GW) shown in brown as
well as the sector associated with the demand. The consumptive demand rather than total
withdrawals from the energy sector are included. The agricultural demands represent dry year
conditions (75th percentile demands).
Figure 2-1: Savannah-Upper Ogeechee Regional Water Forecast by Sector and Supply Source
GW: Agriculture
72.423%
GW: Industrial11.84%
GW: Municipal
Public Supply
12.24%
GW: Municipal Self Supply
11.23%
SW: Agriculture14.55%
SW: Energy
44.914%
SW: Industrial
79.625%
SW: Municipal Public Supply
69.522%
Savannah Upper Ogeechee 2015 Water Forecast
Total: 316.1 MGD
GW: Agriculture
79.618%
GW: Industrial
16.84% GW:
Municipal Public Supply
12.53%
GW: Municipal Self Supply
7.62%
SW: Agriculture16.04%
SW: Energy113.727%
SW: Industrial
89.821%
SW: Municipal Public Supply
89.221%
Savannah Upper Ogeechee2050 Water Forecast
Total: 425.3 MGD

Section 2 • Water and Wastewater Forecast Overview
2-2
2.1.1 Groundwater Forecasts Out of the 109.2 MGD increase in total water need by 2050, 9.0 MGD is projected to come from
groundwater sources. Table 2-1 shows the breakdown of this groundwater forecast by aquifer.
Groundwater demand has been assigned to prioritized aquifers with Gordon aquifer demands
reclassified as Floridan and Dublin aquifer demands reclassified as Cretaceous.
Table 2-1: Regional Groundwater Forecast by Aquifer (MGD)
Aquifer 2015 2050 Difference
Brunswick 0.3 0.3 0.0
Cretaceous 44.1 46.4 2.3
Crystalline-Rock 9.6 10.8 1.3
Floridan 53.7 59.0 5.4
Total 107.7 116.5 9.0
2.1.2 Surface Water Forecasts For the Savannah-Upper Ogeechee Region, surface water is used to meet municipal, industrial,
and agricultural demands as well as cooling system needs at the Plant Vogtle Nuclear Power
Plant. Total surface water demands are expected to increase by 100.2 MGD by 2050 (19.7 MGD
from municipal demands, 10.2 MGD from industrial demands, 1.5 MGD from agricultural
demands, and 68.8 MGD from the energy sector). Counties with the largest projected growth in
surface water usage include Burke and Columbia counties.
2.1.3 Municipal Demand Forecast Compared to Permitted Supply Table 2-2 shows the 2015 and 2050 forecasts for publicly-supplied municipal use covering both
groundwater and surface water. The existing permitted capacity by county is shown as well as
any gap between the permitted capacity and the 2050 forecast. Glascock, Madison, Oglethorpe,
and Taliaferro counties may require additional water supply infrastructure above what is
currently permitted. However, these counties show constant or even decreasing demand trends,
so the actual supply to meet demands may be coming from permits outside of the county
boundaries. In the attached Appendix, municipal demands and permitted capacity are further
subdivided, by county, into surface water and groundwater supplies.

Section 2 • Water and Wastewater Forecast Overview
2-3
Table 2-2: Municipal Forecast versus Permitted Capacity
County
2015 Public Demand Forecast
(AAD – MGD)
2050 Public Demand Forecast
(AAD – MGD)
Existing Permitted Capacity
(AAD – MGD)
Additional Permitted Capacity Needed in
2050 (AAD – MGD)*
Banks 0.8 0.8 1.0 -
Burke 1.1 0.9 4.9 -
Columbia 16.8 37.0 55.1 -
Elbert 1.0 0.9 5.4 -
Franklin 1.9 3.0 7.4 -
Glascock 0.09 0.09 - 0.09
Hart 1.6 2.9 3.8 -
Jefferson 1.4 1.2 3.1 -
Jenkins 0.8 0.7 1.0 -
Lincoln 0.4 0.2 0.9 -
Madison 2.5 2.6 0.6 2.0
McDuffie 1.5 2.5 4.6 -
Oglethorpe 1.3 1.13 0.25 0.88
Rabun 2.0 1.8 8.2 -
Richmond 43.3 41.2 85.6 -
Screven 0.9 0.8 1.3 -
Stephens 3.4 3.3 15 -
Taliaferro 0.05 0.03 - 0.03
Warren 0.2 0.2 0.8 -
Wilkes 0.8 0.6 3.8 -
Values provided are average annual demands in millions of gallons per day (AAD-MGD)
*Analysis does not account for demands in one county that may be met by permits from another county.

Section 2 • Water and Wastewater Forecast Overview
2-4
2.2 Wastewater Forecast Summary Figure 2-2 shows the aggregated county wastewater forecasts for the Savannah-Upper Ogeechee
Region in 2015 and 2050. Overall, the regional forecasted wastewater flows are expected to
increase by approximately 26.2 MGD.
Figure 2-2: Savannah-Upper Ogeechee Regional Wastewater Forecast by Discharge Method and Sector
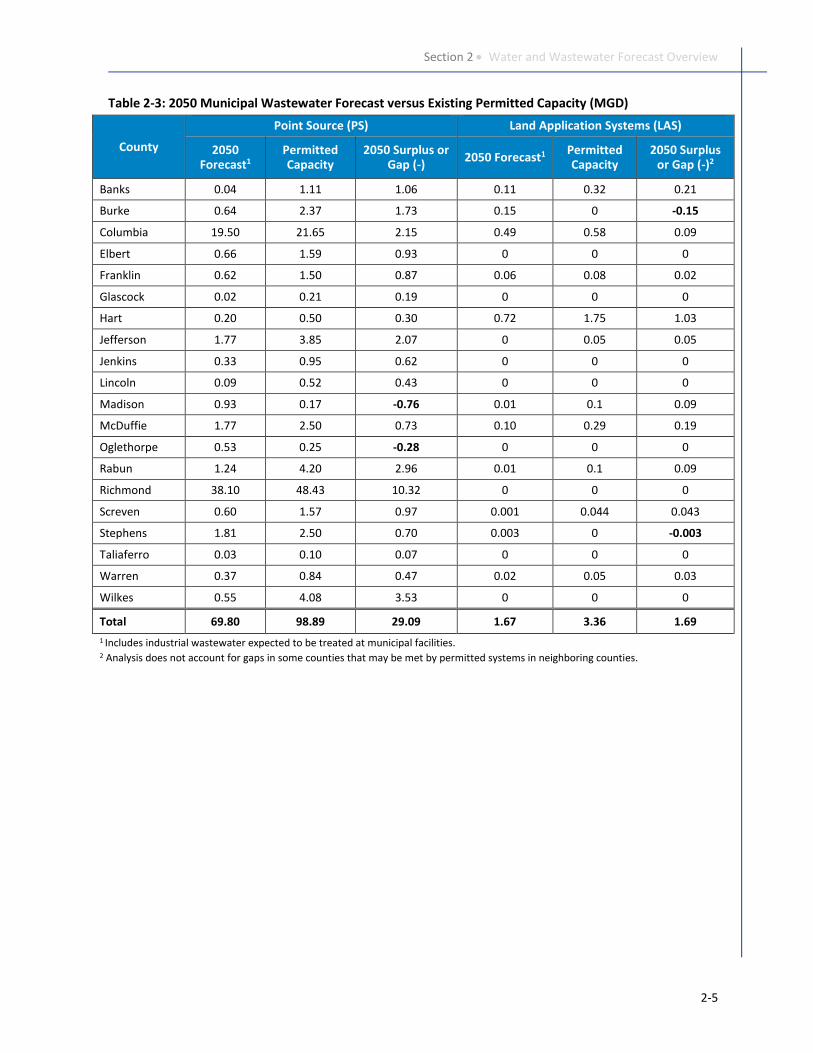
2.2.1 Comparing Wastewater Forecasts to Permitted Capacity About 32% of the total regional wastewater flow is directed to municipal centralized treatment
with ultimate discharge either directly to streams (point source) or through land application
systems (LAS). This includes municipal wastewater as well as industrial wastewater that is
treated and discharged through municipal centralized treatment facilities. Table 2-3 shows the
wastewater forecasts and permitted capacity for these municipal facilities summarized by county.
The difference between the existing permitted capacity and the 2050 forecast is also listed for
each county in terms of either surplus or gap. Based on the forecast wastewater flow, Madison
and Oglethorpe counties may need additional permitted capacity for point source discharge.
Burke and Stephens show minor potential gaps for LAS Permitted capacity. The attached
Appendix has a detailed listing of existing permitted wastewater facilities per county.
Industrial: LAS
0.0040%
Municipal: LAS1.51%
Industrial: Point
Source93.152%
Municipal: Point
Source55.631%
Municipal: Septic28.216%
Savannah Upper Ogeechee2015 Wastewater Forecast
Total: 178.4MGD
Industrial: LAS0.010%
Municipal: LAS1.71%
Industrial: Point
Source107.352%
Municipal: Point
Source69.834%
Municipal: Septic25.813%
Savannah Upper Ogeechee2050 Wastewater Forecast
Total: 204.6 MGD
Section 2 • Water and Wastewater Forecast Overview
2-5
Table 2-3: 2050 Municipal Wastewater Forecast versus Existing Permitted Capacity (MGD)
County
Point Source (PS) Land Application Systems (LAS)
2050 Forecast1
Permitted Capacity
2050 Surplus or Gap (-)
2050 Forecast1 Permitted Capacity
2050 Surplus or Gap (-)2
Banks 0.04 1.11 1.06 0.11 0.32 0.21
Burke 0.64 2.37 1.73 0.15 0 -0.15
Columbia 19.50 21.65 2.15 0.49 0.58 0.09
Elbert 0.66 1.59 0.93 0 0 0
Franklin 0.62 1.50 0.87 0.06 0.08 0.02
Glascock 0.02 0.21 0.19 0 0 0
Hart 0.20 0.50 0.30 0.72 1.75 1.03
Jefferson 1.77 3.85 2.07 0 0.05 0.05
Jenkins 0.33 0.95 0.62 0 0 0
Lincoln 0.09 0.52 0.43 0 0 0
Madison 0.93 0.17 -0.76 0.01 0.1 0.09
McDuffie 1.77 2.50 0.73 0.10 0.29 0.19
Oglethorpe 0.53 0.25 -0.28 0 0 0
Rabun 1.24 4.20 2.96 0.01 0.1 0.09
Richmond 38.10 48.43 10.32 0 0 0
Screven 0.60 1.57 0.97 0.001 0.044 0.043
Stephens 1.81 2.50 0.70 0.003 0 -0.003
Taliaferro 0.03 0.10 0.07 0 0 0
Warren 0.37 0.84 0.47 0.02 0.05 0.03
Wilkes 0.55 4.08 3.53 0 0 0
Total 69.80 98.89 29.09 1.67 3.36 1.69
1 Includes industrial wastewater expected to be treated at municipal facilities. 2 Analysis does not account for gaps in some counties that may be met by permitted systems in neighboring counties.

Section 2 • Water and Wastewater Forecast Overview
2-6
This page intentionally left blank.

3-1
Section 3
Groundwater Availability A Groundwater Availability Resource Assessment was performed by CDM Smith in March 2010
with updated information on the Cretaceous aquifer provided in September 2012. This resource
assessment evaluated the estimated sustainable yield of a group of prioritized aquifers.
Sustainable yield is the estimated amount of water that can be withdrawn from the modeled area
of an aquifer without reaching specific thresholds of local or regional impacts. A separate analysis
was performed in 2016 to investigate the capacity of the Floridan aquifer to replace agricultural
surface water withdrawals in the Canoochee River Basin.
3.1 Crystalline-Rock Aquifer The Crystalline-Rock aquifer is located beneath Columbia, Franklin, Madison, Rabun, Stephens,
and Taliaferro counties.
Within the groundwater resource assessment, a small portion of the Crystalline-Rock aquifer was
modeled. This estimated provided a low range normalized sustainable yield of 0.01 MGD per
square mile of area, giving an estimated sustainable yield of approximately 40 MGD (on an annual
average basis) for the modeled portion of the Crystalline-Rock aquifer. The portion of the
forecasted demand coming from the Savannah-Upper Ogeechee Region accounts for 9.6 MGD
currently and 10.8 MGD in 2050. The 2050 demands are projected to remain under the estimated
range of sustainable yield for this aquifer.
3.2 Floridan Aquifer Currently, the Savannah-Upper Ogeechee Region’s use of the Floridan Aquifer accounts for
slightly more than 8.7% of the total modeled aquifer use.
Within the groundwater resource assessment, an estimated range of sustainable yield of 868 to
982 MGD was determined for the modeled portion of the Floridan Aquifer. This modeled area
encompasses Burke, Glascock, Jefferson, Jenkins, Richmond, and Screven counties for the
Savannah-Upper Ogeechee Region. Other regions modeled as using portions of the Floridan
Aquifer include Altamaha, Coastal Georgia, Middle Ocmulgee, Suwannee-Satilla, Upper Oconee,
Lower Flint-Ochlockonee, and Upper Flint. Figure 3-1 shows the current and forecasted
demands for all regions using the modeled portion of the Floridan Aquifer. The portion of the
demand coming from the Savannah-Upper Ogeechee Region is highlighted and accounts for 53.7
MGD currently and 59 MGD in 2050. 2050 demands are projected to remain under the estimated
range of sustainable yield for this aquifer.
The analysis of whether groundwater from the Floridan aquifer could be utilized to replace
agricultural surface water withdrawals in the Canoochee River Basin showed that groundwater
withdrawals from the Floridan aquifer at existing surface water irrigation locations outside of the
Gulf Trough area could be increased up to a total withdrawal of 10.5 mgd without impacting the
estimated sustainable yield of the aquifer. Within the Gulf Trough area, the properties of the
Floridan aquifer are not as conductive to groundwater development. But based on this study,

Section 3 • Groundwater Availability
3-2
additional groundwater withdrawals are possible within the Canoochee River Basin and can
contribute to reduction of current or future potential surface water gaps in the Canoochee River
at the Claxton node (see Section 4.2.1 for more details).
Figure 3-1: Floridan Aquifer (South Central Georgia & Eastern Coastal Plain) Forecasted Groundwater Demand Compared to Estimated Sustainable Yield
3.3 Cretaceous Aquifer Currently, the Savannah-Upper Ogeechee Region’s use of the Cretaceous Aquifer accounts for
slightly more than 15% of the total modeled aquifer use.
Within the groundwater resource assessment, an estimated range of sustainable yield of 347 to
445 MGD was determined for the modeled portion of the Cretaceous aquifer. This modeled area
encompasses Burke, Columbia, Glascock, Jefferson, Jenkins, McDuffie, Richmond, Screven, and
Warren counties for the Savannah-Upper Ogeechee Region. Other regions modeled as using
portions of the Cretaceous Aquifer include Altamaha, Middle Ocmulgee, Suwannee-Satilla, Upper
Oconee, and Upper Flint. Figure 3-2 shows the current and forecasted demands for all regions
using the modeled portion of the Cretaceous aquifer. The portion of the demand coming from the
Savannah-Upper Ogeechee Region is highlighted and accounts for about 34 MGD currently. 2050
demands are projected to remain constant and under the estimated range of sustainable yield for
this aquifer.
0
200
400
600
800
1000
1200
2015 2050
MG
D
YearSavannah-Upper Ogeechee Other Councils
High Sustainable Yield Low Sustainable Yield

Section 3 • Groundwater Availability
3-3
Figure 3-2: Cretaceous Aquifer Forecasted Groundwater Demand Compared to Estimated Sustainable Yield
0
50
100
150
200
250
300
350
400
450
500
2015 2050
MG
D
YearSavannah-Upper Ogeechee Other Councils
High Sustainable Yield Low Sustainable Yield

Section 3 • Groundwater Availability
3-4
This page intentionally left blank.
4-1
Section 4
Surface Water Availability
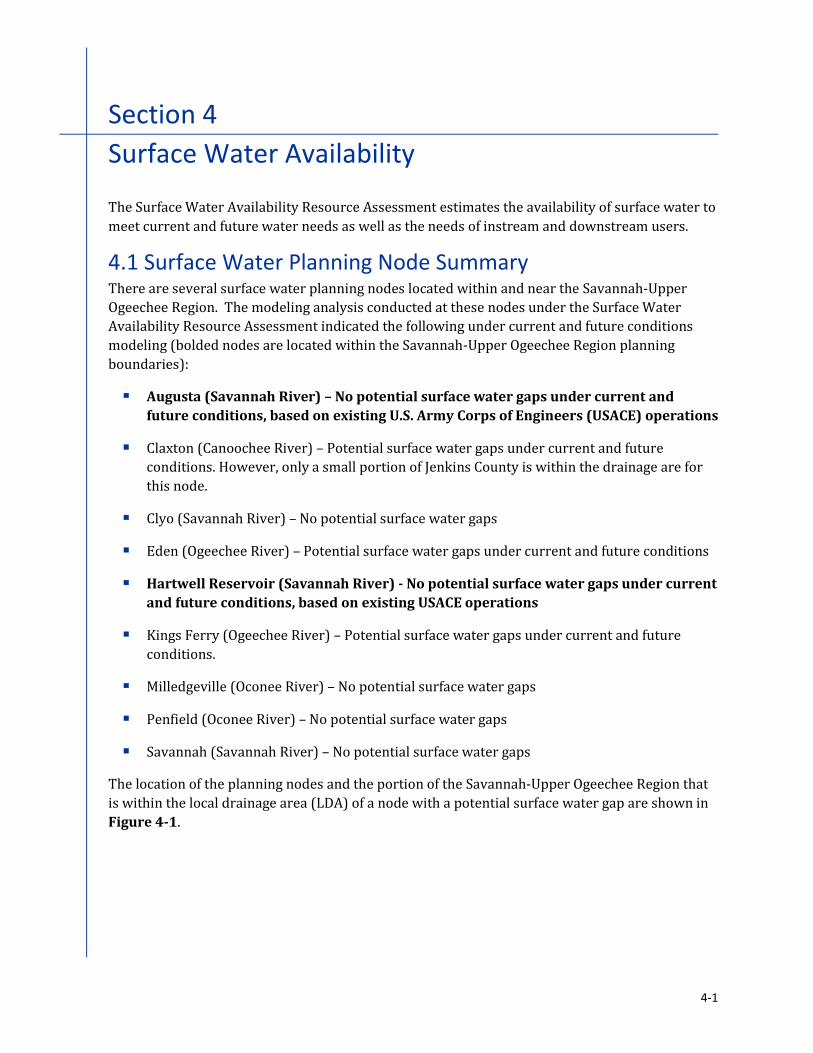
The Surface Water Availability Resource Assessment estimates the availability of surface water to
meet current and future water needs as well as the needs of instream and downstream users.
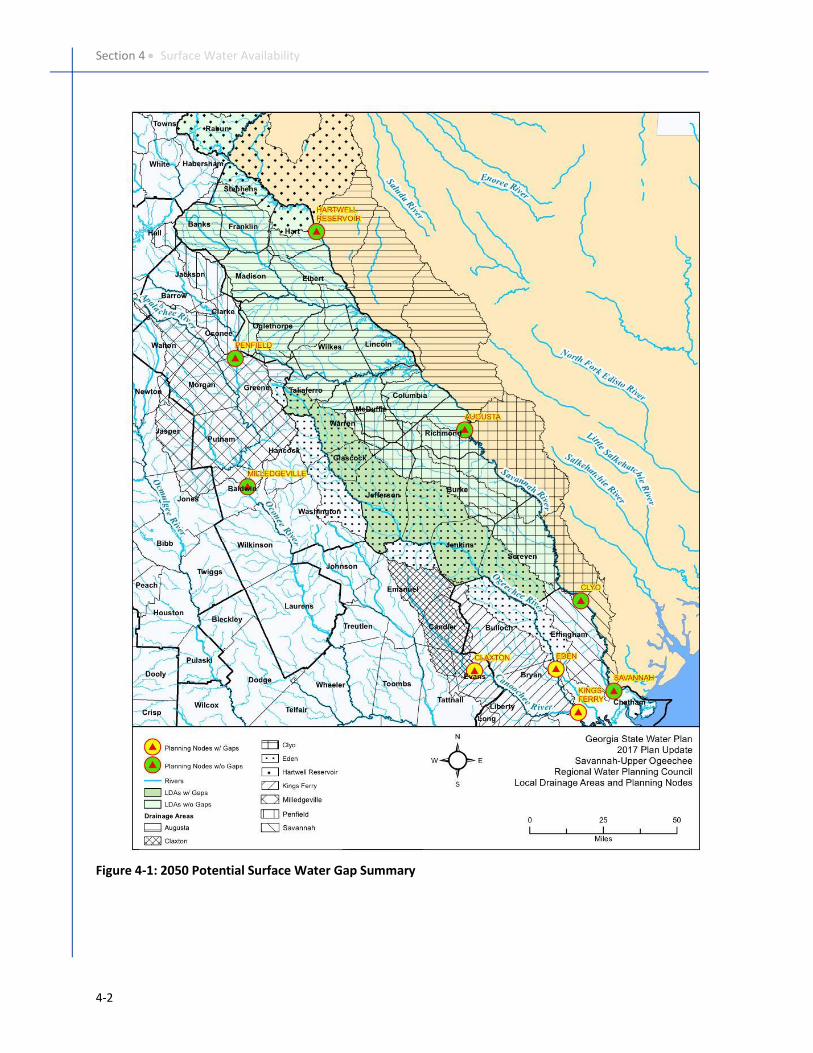
4.1 Surface Water Planning Node Summary There are several surface water planning nodes located within and near the Savannah-Upper
Ogeechee Region. The modeling analysis conducted at these nodes under the Surface Water
Availability Resource Assessment indicated the following under current and future conditions
modeling (bolded nodes are located within the Savannah-Upper Ogeechee Region planning
boundaries):
▪ Augusta (Savannah River) – No potential surface water gaps under current and
future conditions, based on existing U.S. Army Corps of Engineers (USACE) operations
▪ Claxton (Canoochee River) – Potential surface water gaps under current and future
conditions. However, only a small portion of Jenkins County is within the drainage are for
this node.
▪ Clyo (Savannah River) – No potential surface water gaps
▪ Eden (Ogeechee River) – Potential surface water gaps under current and future conditions
▪ Hartwell Reservoir (Savannah River) - No potential surface water gaps under current
and future conditions, based on existing USACE operations
▪ Kings Ferry (Ogeechee River) – Potential surface water gaps under current and future
conditions.
▪ Milledgeville (Oconee River) – No potential surface water gaps
▪ Penfield (Oconee River) – No potential surface water gaps
▪ Savannah (Savannah River) – No potential surface water gaps
The location of the planning nodes and the portion of the Savannah-Upper Ogeechee Region that
is within the local drainage area (LDA) of a node with a potential surface water gap are shown in
Figure 4-1.
Section 4 • Surface Water Availability
4-2
Figure 4-1: 2050 Potential Surface Water Gap Summary

Section 4 • Surface Water Availability
4-3
4.2 Detailed Potential Gap Analysis Modeled surface water gaps are driven by both net consumption (withdrawal minus returns) and
year to year variation in river flows. In wet years, the region is less likely to experience any
potential gaps to instream needs. In dry years, the potential gaps are likely to be more frequent,
larger, and for longer duration. Table 4-1 provides a quantification and frequency of modeled
potential surface water gaps. The majority of the modeled potential gaps were shorter in
duration (1-7 days and 8 -14 days potential gap events).
Table 4-1: Characteristics of Modeled 2050 Potential Surface Water Gaps
1 The total number of modeled gap events is presented for each duration range, as well as the percentage in that duration range to the total number of all modeled gap events. 2 The total number of days within the modeling period (1939-2013) in which a potential gap occurred is presented, as well as the percentage of that total to the total number of days analyzed in the modeling period.
The following subsections provide a more detailed look at the potential gaps at each planning
node. Each subsection provides a comparison of the potential gaps under current demands and
projected 2050 future demands. The potentials gaps are then compared against the forecasted
surface water demands for the Councils and counties within the local drainage area of each node.
4.2.1 Potential Gaps at the Claxton Node The Claxton Node is located on the Canoochee River near Claxton, Georgia. Surface water
withdrawals and discharges in the local drainage area for this node include municipal returns and
agricultural use. Table 4-2 provides an overview of the potential gaps at the Claxton node under
current conditions and future conditions. Table 4-3 shows the Regional Water Planning Councils
Gap Event Duration
Number of Gap Events (% of Total
Gap Events)1
Total Gap Days (% of Total Days)2
Average Daily Flow Deficit per
Event
Average Cumulative Flow Deficit per Event
Claxton Node
1-7 days 139 (51.7%) 482 (1.8%) 3 cfs (2 MGD) 13 cfsd (8 MG)
8-14 days 55 (20.4%) 598 (2.2%) 5 cfs (3 MGD) 56 cfsd (36 MG)
15-30 days 39 (14.5%) 851 (3.1%) 6 cfs (4 MGD) 123 cfsd (80 MG)
>30 days 36 (13.4%) 2181 (8.0%) 6 cfs (4 MGD) 335 cfsd (218 MG)
Totals 269 (100.0%) 4112 (15.0%)
Eden Node
1-7 days 44 (61.1%) 178 (0.6%) 11 cfs (7 MGD) 52 cfsd (34 MG)
8-14 days 12 (16.7%) 114 (0.4%) 15 cfs (10 MGD) 150 cfsd (98 MG)
15-30 days 10 (13.9%) 222 (0.8%) 29 cfs (19 MGD) 633 cfsd (411 MG)
>30 days 6 (8.3%) 388 (1.4%) 28 cfs (18 MGD) 1,795 cfsd (1,167 MG)
Totals 72 (100.0%) 902 (3.3%)
Kings Ferry Node
1-7 days 40 (58.0%) 137 (0.5%) 20 cfs (13 MGD) 82 cfsd (530MG)
8-14 days 9 (13.0%) 98 (0.4%) 41 cfs (27 MGD) 468 cfsd (302 MG)
15-30 days 13 (18.8%) 291 (1.1%) 57 cfs (37 MGD) 1,264 cfsd (817 MG)
>30 days 7 (10.1%) 413 (1.5%) 75 cfs (49 MGD) 4,363 cfsd (2,820 MG)
Totals 69 (100.0%) 939 (3.4%)
Section 4 • Surface Water Availability
4-4
and counties within the local drainage area of the node, the forecasted surface water demand and
the potential gaps for comparison.
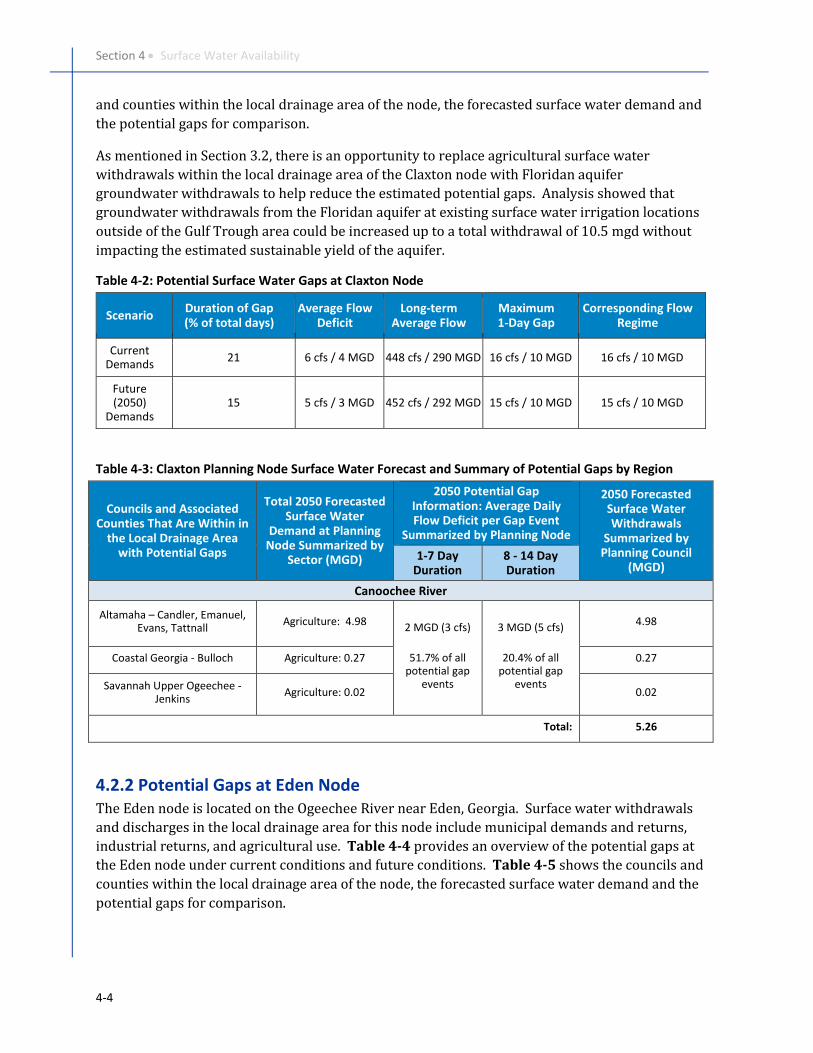
As mentioned in Section 3.2, there is an opportunity to replace agricultural surface water
withdrawals within the local drainage area of the Claxton node with Floridan aquifer
groundwater withdrawals to help reduce the estimated potential gaps. Analysis showed that
groundwater withdrawals from the Floridan aquifer at existing surface water irrigation locations
outside of the Gulf Trough area could be increased up to a total withdrawal of 10.5 mgd without
impacting the estimated sustainable yield of the aquifer.
Table 4-2: Potential Surface Water Gaps at Claxton Node
Scenario Duration of Gap (% of total days)
Average Flow Deficit
Long-term Average Flow
Maximum 1-Day Gap
Corresponding Flow Regime
Current Demands
21 6 cfs / 4 MGD 448 cfs / 290 MGD 16 cfs / 10 MGD 16 cfs / 10 MGD
Future (2050)
Demands 15 5 cfs / 3 MGD 452 cfs / 292 MGD 15 cfs / 10 MGD 15 cfs / 10 MGD
Table 4-3: Claxton Planning Node Surface Water Forecast and Summary of Potential Gaps by Region
Councils and Associated Counties That Are Within in
the Local Drainage Area with Potential Gaps
Total 2050 Forecasted Surface Water
Demand at Planning Node Summarized by
Sector (MGD)
2050 Potential Gap Information: Average Daily Flow Deficit per Gap Event
Summarized by Planning Node
2050 Forecasted Surface Water Withdrawals
Summarized by Planning Council
(MGD) 1-7 Day
Duration 8 - 14 Day Duration
Canoochee River
Altamaha – Candler, Emanuel, Evans, Tattnall
Agriculture: 4.98 2 MGD (3 cfs)
51.7% of all potential gap
events
3 MGD (5 cfs)
20.4% of all potential gap
events
4.98
Coastal Georgia - Bulloch Agriculture: 0.27 0.27
Savannah Upper Ogeechee - Jenkins
Agriculture: 0.02 0.02
Total: 5.26
4.2.2 Potential Gaps at Eden Node The Eden node is located on the Ogeechee River near Eden, Georgia. Surface water withdrawals
and discharges in the local drainage area for this node include municipal demands and returns,
industrial returns, and agricultural use. Table 4-4 provides an overview of the potential gaps at
the Eden node under current conditions and future conditions. Table 4-5 shows the councils and
counties within the local drainage area of the node, the forecasted surface water demand and the
potential gaps for comparison.
Section 4 • Surface Water Availability
4-5
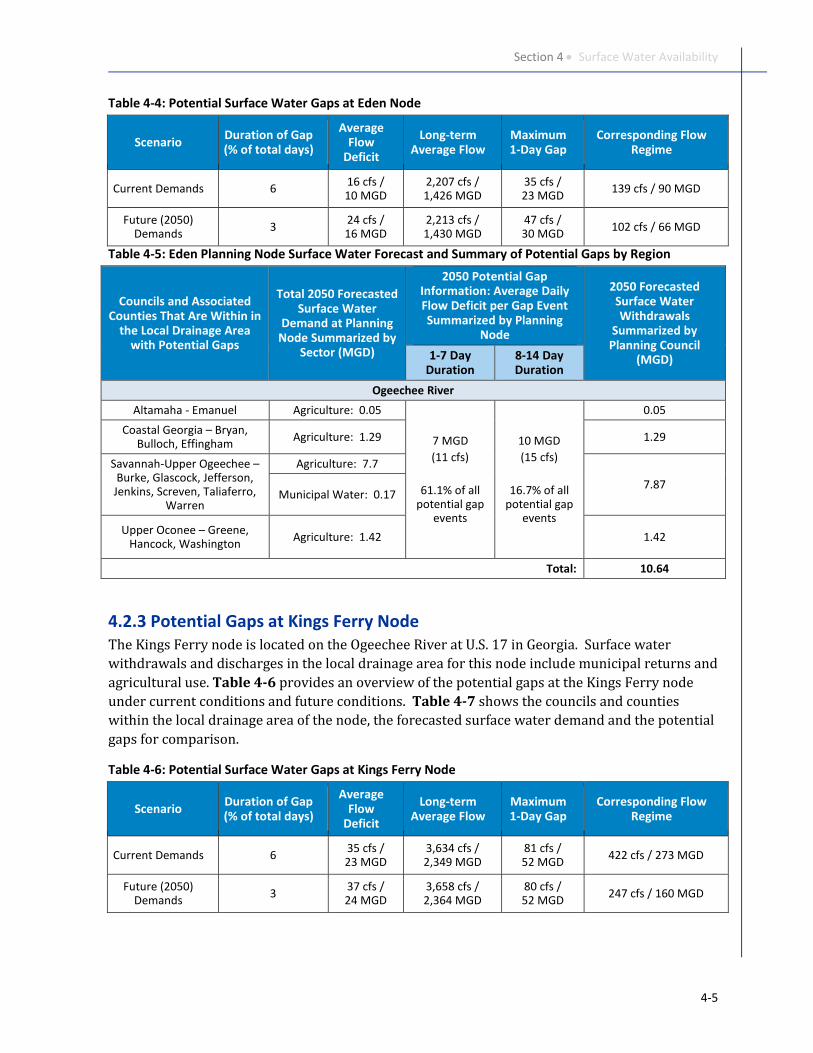
Table 4-4: Potential Surface Water Gaps at Eden Node
Scenario Duration of Gap (% of total days)
Average Flow
Deficit
Long-term Average Flow
Maximum 1-Day Gap
Corresponding Flow Regime
Current Demands 6 16 cfs / 10 MGD
2,207 cfs / 1,426 MGD
35 cfs / 23 MGD
139 cfs / 90 MGD
Future (2050) Demands
3 24 cfs / 16 MGD
2,213 cfs / 1,430 MGD
47 cfs / 30 MGD
102 cfs / 66 MGD
Table 4-5: Eden Planning Node Surface Water Forecast and Summary of Potential Gaps by Region
Councils and Associated Counties That Are Within in
the Local Drainage Area with Potential Gaps
Total 2050 Forecasted Surface Water
Demand at Planning Node Summarized by
Sector (MGD)
2050 Potential Gap Information: Average Daily Flow Deficit per Gap Event Summarized by Planning
Node
2050 Forecasted Surface Water Withdrawals
Summarized by Planning Council
(MGD) 1-7 Day Duration
8-14 Day Duration
Ogeechee River
Altamaha - Emanuel Agriculture: 0.05
7 MGD
(11 cfs)
61.1% of all potential gap
events
10 MGD
(15 cfs)
16.7% of all potential gap
events
0.05
Coastal Georgia – Bryan, Bulloch, Effingham
Agriculture: 1.29 1.29
Savannah-Upper Ogeechee – Burke, Glascock, Jefferson,
Jenkins, Screven, Taliaferro, Warren
Agriculture: 7.7
7.87 Municipal Water: 0.17
Upper Oconee – Greene, Hancock, Washington
Agriculture: 1.42 1.42
Total: 10.64
4.2.3 Potential Gaps at Kings Ferry Node The Kings Ferry node is located on the Ogeechee River at U.S. 17 in Georgia. Surface water
withdrawals and discharges in the local drainage area for this node include municipal returns and
agricultural use. Table 4-6 provides an overview of the potential gaps at the Kings Ferry node
under current conditions and future conditions. Table 4-7 shows the councils and counties
within the local drainage area of the node, the forecasted surface water demand and the potential
gaps for comparison.
Table 4-6: Potential Surface Water Gaps at Kings Ferry Node
Scenario Duration of Gap (% of total days)
Average Flow
Deficit
Long-term Average Flow
Maximum 1-Day Gap
Corresponding Flow Regime
Current Demands 6 35 cfs / 23 MGD
3,634 cfs / 2,349 MGD
81 cfs / 52 MGD
422 cfs / 273 MGD
Future (2050) Demands
3 37 cfs / 24 MGD
3,658 cfs / 2,364 MGD
80 cfs / 52 MGD
247 cfs / 160 MGD

Section 4 • Surface Water Availability
4-6
Table 4-7: Kings Ferry Planning Node Surface Water Forecast and Summary of Potential Gaps by Region
Councils and Associated Counties That Are Within in
the Local Drainage Area with Potential Gaps
Total 2050 Forecasted Surface Water
Demand at Planning Node Summarized by
Sector (MGD)
2050 Potential Gap Information: Average Daily Flow Deficit per Gap Event Summarized by Planning
Node
2050 Forecasted Surface Water Withdrawals
Summarized by Planning Council
(MGD) 1-7 Day Duration
8-14 Day Duration
Ogeechee River
Altamaha – Candler, Emanuel, Evans, Tattnall
Agriculture: 8.12
13 MGD
(20 cfs)
58.0% of all potential gap
events
27 MGD
(41 cfs)
13.0% of all potential gap
events
8.12
Coastal Georgia – Bryan, Bulloch, Chatham, Effingham,
Liberty, Long Agriculture: 4.42 4.42
Savannah-Upper Ogeechee – Burke, Glascock, Jefferson,
Jenkins, Screven, Taliaferro, Warren
Agriculture: 7.83
8.00 Municipal: 0.17
Upper Oconee – Greene, Hancock, Washington
Agriculture: 1.42 1.42
Total: 21.96
5-1
Section 5
Surface Water Quality
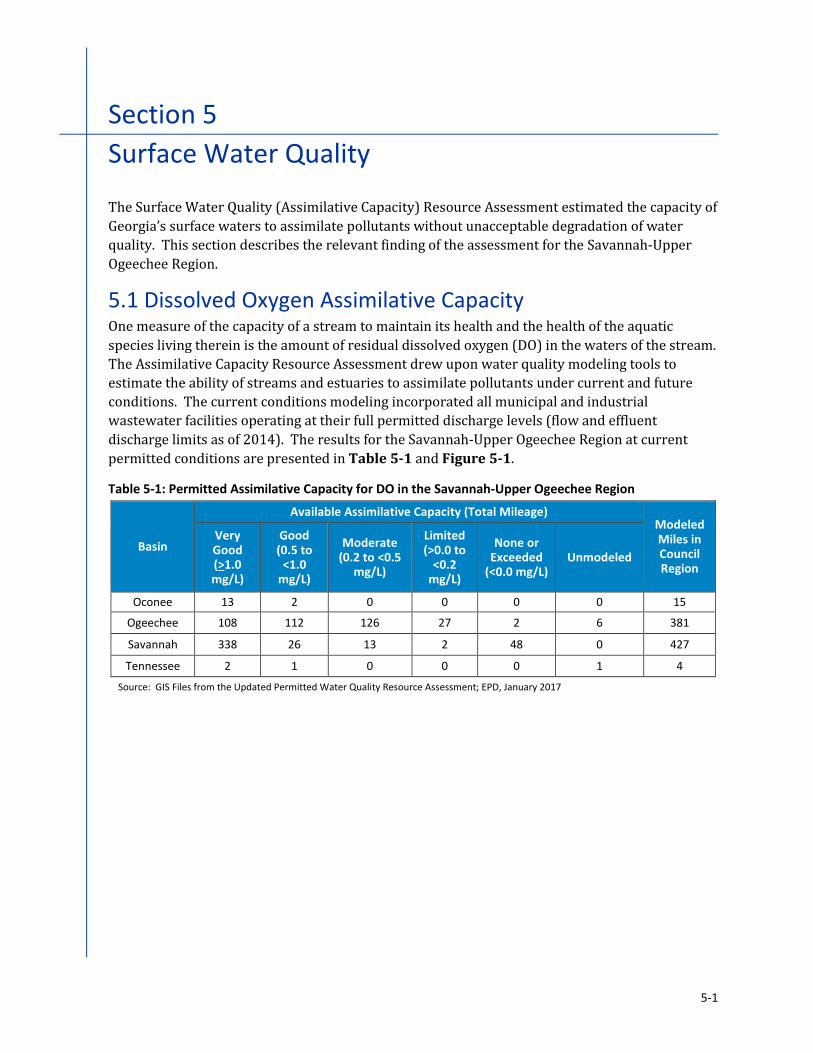
The Surface Water Quality (Assimilative Capacity) Resource Assessment estimated the capacity of
Georgia’s surface waters to assimilate pollutants without unacceptable degradation of water
quality. This section describes the relevant finding of the assessment for the Savannah-Upper
Ogeechee Region.
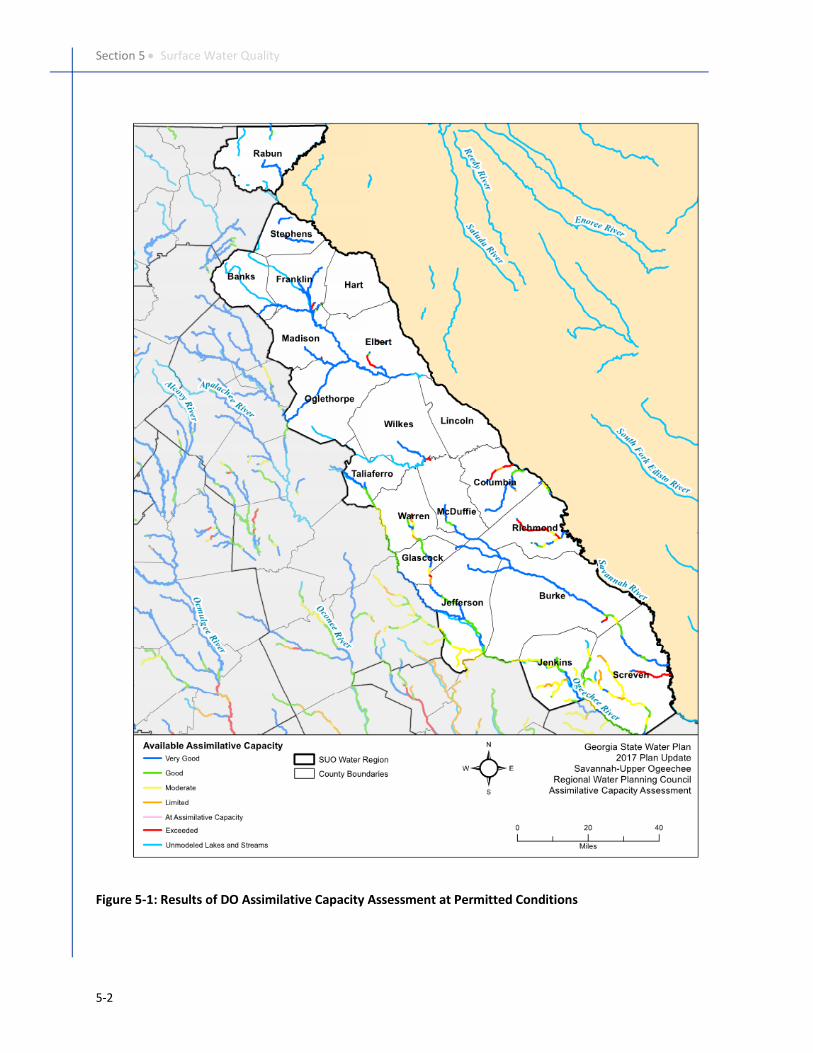
5.1 Dissolved Oxygen Assimilative Capacity One measure of the capacity of a stream to maintain its health and the health of the aquatic
species living therein is the amount of residual dissolved oxygen (DO) in the waters of the stream.
The Assimilative Capacity Resource Assessment drew upon water quality modeling tools to
estimate the ability of streams and estuaries to assimilate pollutants under current and future
conditions. The current conditions modeling incorporated all municipal and industrial
wastewater facilities operating at their full permitted discharge levels (flow and effluent
discharge limits as of 2014). The results for the Savannah-Upper Ogeechee Region at current
permitted conditions are presented in Table 5-1 and Figure 5-1.
Table 5-1: Permitted Assimilative Capacity for DO in the Savannah-Upper Ogeechee Region
Basin
Available Assimilative Capacity (Total Mileage) Modeled Miles in Council Region
Very Good (>1.0 mg/L)
Good (0.5 to
<1.0 mg/L)
Moderate (0.2 to <0.5
mg/L)
Limited (>0.0 to
<0.2 mg/L)
None or Exceeded
(<0.0 mg/L) Unmodeled
Oconee 13 2 0 0 0 0 15
Ogeechee 108 112 126 27 2 6 381
Savannah 338 26 13 2 48 0 427
Tennessee 2 1 0 0 0 1 4
Source: GIS Files from the Updated Permitted Water Quality Resource Assessment; EPD, January 2017
Section 5 • Surface Water Quality
5-2
Figure 5-1: Results of DO Assimilative Capacity Assessment at Permitted Conditions

Section 5 • Surface Water Quality
5-3
The stream segments at or exceeding their assimilative capacity within the Savannah-Upper
Ogeechee Region are listed in Table 5-2.
Table 5-2: Stream Segments with No or Exceeded Assimilative Capacity Under Current Permitted Conditions
Basin Stream Segment Length (miles)
Ogeechee
Goldens Creek - 0.3 miles DS Northside WPCP to Warrenton New WPCP 0.7
Goldens Creek - Warrenton Northside WPCP to 0.3 miles DS of Northside WPCP
0.3
Rocky Comfort Creek - Joes Creek to Clear Creek 1.2
Savannah
Buck Creek - Unnamed Tributary to Savannah River 11.5
Chandlers Branch - Sardis WPCP to Brier Creek 2.8
Eastanollee Creek - Toccoa - Eastonollee Creek WPCP to Unnamed Tributary
0.7
Falling Creek - Contour 480 to Unnamed Tributary 4.7
Fortson Creek - Elberton - Fortson Creek WPCP to Unnamed Tributary 1.5
Franklin Springs - Franklin Springs Pond WPCP to Broad River 2.6
Kiokee Creek - Contour 200 to Savannah River 3.6
Kiokee Creek - Contour 230 to Contour 210 2.4
Kiokee Creek - Contour 240 to Contour 230 1.2
Little River - Rocky Creek to Lake Hartwell 2.3
Spirit Creek - 130 Contour to Little Spirit Creek 2.3
Spirit Creek - U.S. Army - Fort Gordon WPCP to 140 Contour 12.3
Unnamed Tributary to South Fork Broad River - Comer WPCP to Hill Street 0.2
Section 5 • Surface Water Quality
5-4
5.2 Non-Point Source Pollution Under Section 303(d) of the federal Clean Water Act, total maximum daily loads (TMDLs) are
developed for waters that do not meet their designated uses. A TMDL represents the maximum
pollutant loading that a water body can assimilate and continue meeting its designated use (i.e.,
not exceeding State water quality standards).
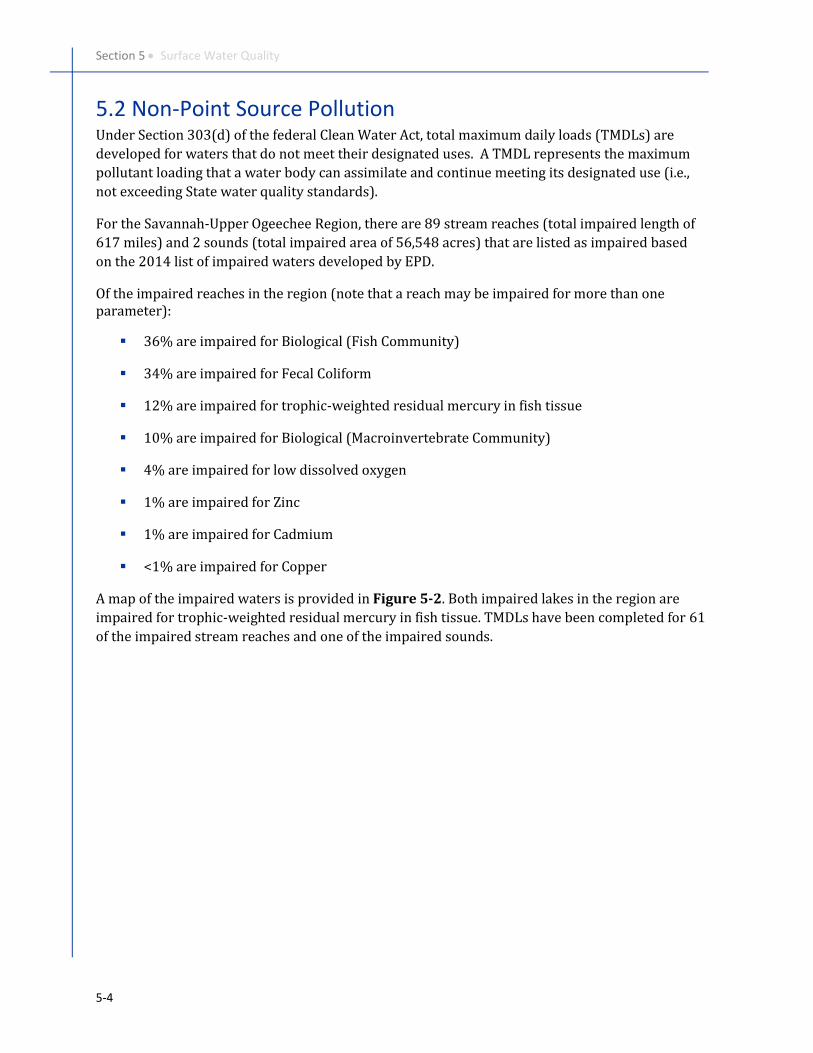
For the Savannah-Upper Ogeechee Region, there are 89 stream reaches (total impaired length of
617 miles) and 2 sounds (total impaired area of 56,548 acres) that are listed as impaired based
on the 2014 list of impaired waters developed by EPD.
Of the impaired reaches in the region (note that a reach may be impaired for more than one parameter):
▪ 36% are impaired for Biological (Fish Community)
▪ 34% are impaired for Fecal Coliform
▪ 12% are impaired for trophic-weighted residual mercury in fish tissue
▪ 10% are impaired for Biological (Macroinvertebrate Community)
▪ 4% are impaired for low dissolved oxygen
▪ 1% are impaired for Zinc
▪ 1% are impaired for Cadmium
▪ <1% are impaired for Copper
A map of the impaired waters is provided in Figure 5-2. Both impaired lakes in the region are
impaired for trophic-weighted residual mercury in fish tissue. TMDLs have been completed for 61
of the impaired stream reaches and one of the impaired sounds.
Section 5 • Surface Water Quality
5-5
Figure 5-2: Impaired Water Bodies
Section 5 • Surface Water Quality
5-6
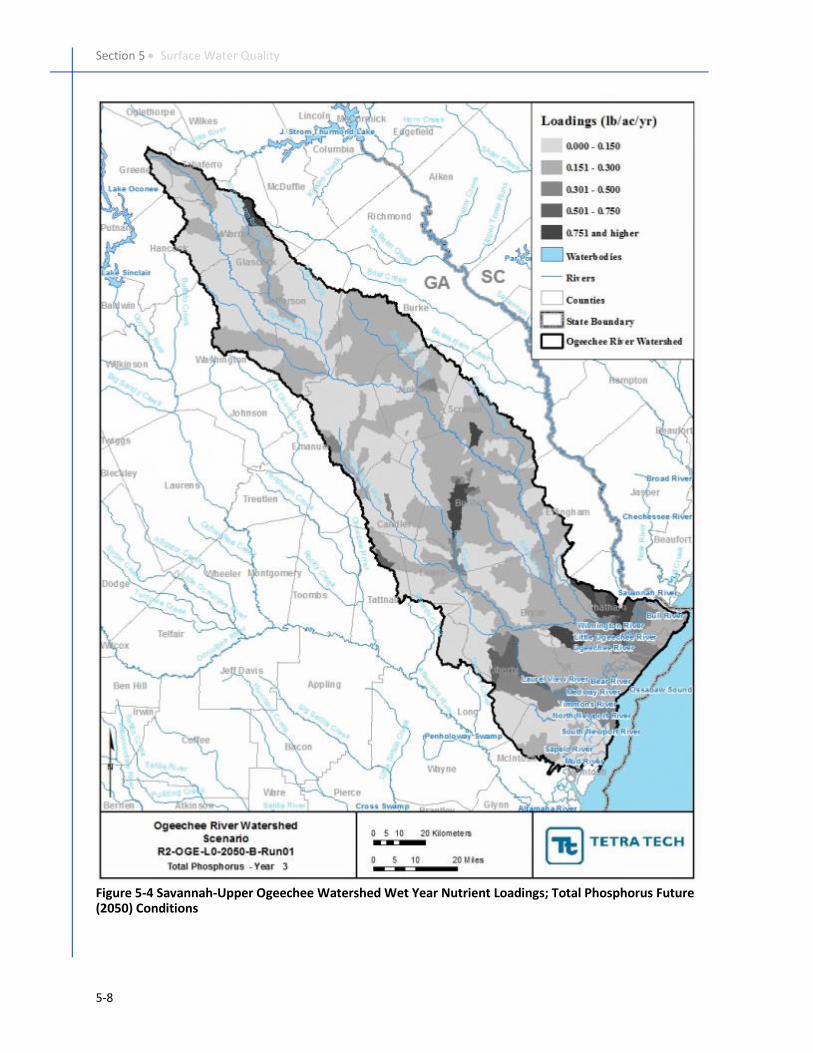
5.3 Nutrient Loading In addition to assimilative capacity modeling for DO, EPD completed nutrient (total nitrogen and
total phosphorus) modeling for the watersheds in the Savannah-Upper Ogeechee Region. The
watershed models evaluate point source and non-point source nutrient loadings. Results are
provided within the resource assessments for wet, dry, and normal years. Example figures of
nutrient loading for the Savannah-Upper Ogeechee watershed under 2050 future conditions for a
wet year (2003) are provided in Figure 5-3 for total nitrogen and Figure 5-4 for total
phosphorus. There are currently no nutrient standards for total nitrogen and total phosphorus in
the region.

Section 5 • Surface Water Quality
5-7
Figure 5-3 Savannah-Upper Ogeechee Watershed Wet Year Nutrient Loadings; Total Nitrogen Future
(2050) Conditions
Section 5 • Surface Water Quality
5-8
Figure 5-4 Savannah-Upper Ogeechee Watershed Wet Year Nutrient Loadings; Total Phosphorus Future (2050) Conditions

6-1
Section 6
Gap Analysis Summary
The Savannah-Upper Ogeechee Region is fortunate to have abundant water supply sources.
Future water availability issues and needs for the Region include:
▪ There is a potential inability to maintain the low flow threshold at all times while meeting
the forecasted 2050 demands at the Eden planning node in the Ogeechee River. Increased
demand in the region may also add to potential surface water gaps downstream of the
region on the Ogeechee River at the Kings Ferry planning node and on the Canoochee River
at the Claxton planning node.
▪ With respect to those aquifers modeled, no groundwater resource shortfalls are expected
to occur over the planning horizon.
▪ Additional permitted water withdrawals and treatment capacity may be needed in some
counties to meet demands.
Future water quality issues and needs for the Region include:
▪ For fast growing counties, additional wastewater treatment capacity may be needed.
▪ To address limited assimilative capacity in several stream segments, additional wastewater
planning and monitoring is needed.
▪ Significant organic load reductions will be required for the Savannah River and Harbor to
address both Georgia and South Carolina discharges.
Table 6-1 summarizes the potential water resource issues and permitted capacity needs in the
Savannah-Upper Ogeechee Region by County.

Section 6 • Gap Analysis Summary
6-2
Table 6-1: Summary of Potential Water Resource Issues by County1
County
Municipal Water
Permitted Capacity Need2
Part of Drainage Area with Modeled Surface Water Gaps
Municipal Wastewater
Permitted Capacity Need2
Water Quality – DO Assimilative Capacity Issues
Source Table 2-2 Figure 4-1 Table 2-3 Figure 5-1
Banks - - - -
Burke - Yes Yes Yes
Columbia - - - Yes
Elbert - - - Yes
Franklin - - - Yes
Glascock Yes Yes - Yes
Hart - - - -
Jefferson - Yes - Yes
Jenkins -- Yes - -
Lincoln - - - -
McDuffie - - - Yes
Madison Yes - Yes Yes
Oglethorpe Yes - Yes -
Rabun - - - -
Richmond - - - Yes
Screven - Yes - Yes
Stephens - - Yes Yes
Taliaferro Yes Yes - -
Warren - Yes - Yes
Wilkes - - - Yes
Notes: 1) "Yes" indicates a potential gap in the indicated county (for surface water, “yes” indicates part or all of the indicated county lies in the area contributing to a potential gap)
2) Permitted capacity need is based on the comparison of permitted municipal capacity versus 2050 forecasted demand.
A-1
Appendix
Municipal Forecasts versus Permitted Capacity by
County
Within this appendix, the water and wastewater forecasts at the County level are compared to
existing permitted capacities for facilities located within the County. These county level results
should not be interpreted at the facility/municipality level, as they do not account for demands in
one county that may be met by permits from another county. Water and wastewater providers
should review the information presented here and incorporate the general trends into their
actual planning and permit needs.

Appendix • Forecasts versus Permitted Capacity
A-2
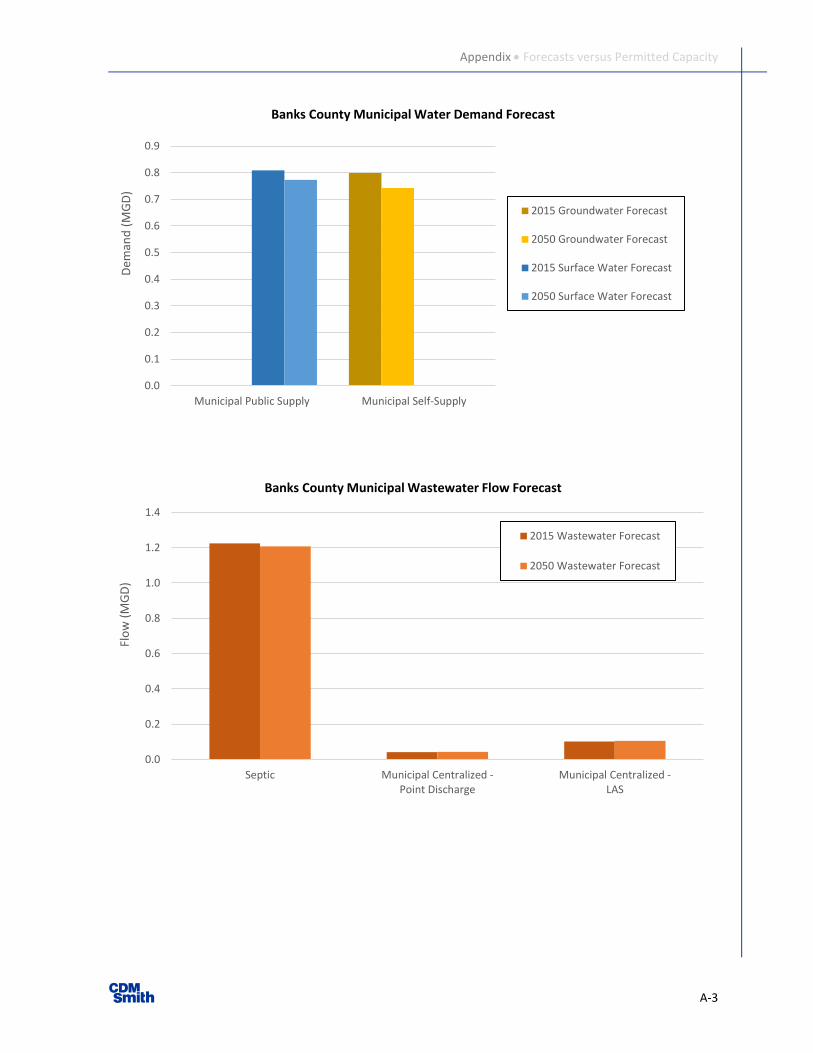
Banks County
Municipal Water and Wastewater Permits Compared to Forecasts
Permit Type Permit Limit (MGD) 2050 Forecast Surplus (+) Shortage (-)
Municipal Water Demands (MGD)
Groundwater 0 0 0
Surface Water 1.00 0.77 0.23
Municipal Wastewater (MGD)
NPDES (Point Source) 1.11 0.04 1.07
LAS (Land Application) 0.32 0.11 0.21
List of Individual Municipal Permits
Permit Holder Permit Number Permit Limit (MGD) Source / Receiving Stream
Existing Withdrawal Permits
Banks County Board of Commissioners
006-0106-05 1.00 Mtn. Cr. Res. Strctr 11
Existing Permitted Wastewater Facilities
Banks County - Southeast GA0050215 1.00 Hudson River
Commerce- Davis House GA0032646 0.067 Grove Creek tributary to the Hudson River tributary to the Broad River
Commerce- Holiday Inn WPCP
GA0032638 0.041
Crooked Creek tributary to the Grove Creek tributary to the Hudson River tributary to the Broad River
Banks County BOC - Atlanta International Dragway WPCP
GAJ020023 0.27 LAS
Banks County BOC- Industrial Park WPCP
GA02-181 0.045 LAS
Appendix • Forecasts versus Permitted Capacity
A-3
0.0
0.1
0.2
0.3
0.4
0.5
0.6
0.7
0.8
0.9
Municipal Public Supply Municipal Self-Supply
Dem
and
(M
GD
)Banks County Municipal Water Demand Forecast
2015 Groundwater Forecast
2050 Groundwater Forecast
2015 Surface Water Forecast
2050 Surface Water Forecast
0.0
0.2
0.4
0.6
0.8
1.0
1.2
1.4
Septic Municipal Centralized -Point Discharge
Municipal Centralized -LAS
Flo
w (
MG
D)
Banks County Municipal Wastewater Flow Forecast
2015 Wastewater Forecast
2050 Wastewater Forecast
Appendix • Forecasts versus Permitted Capacity
A-4
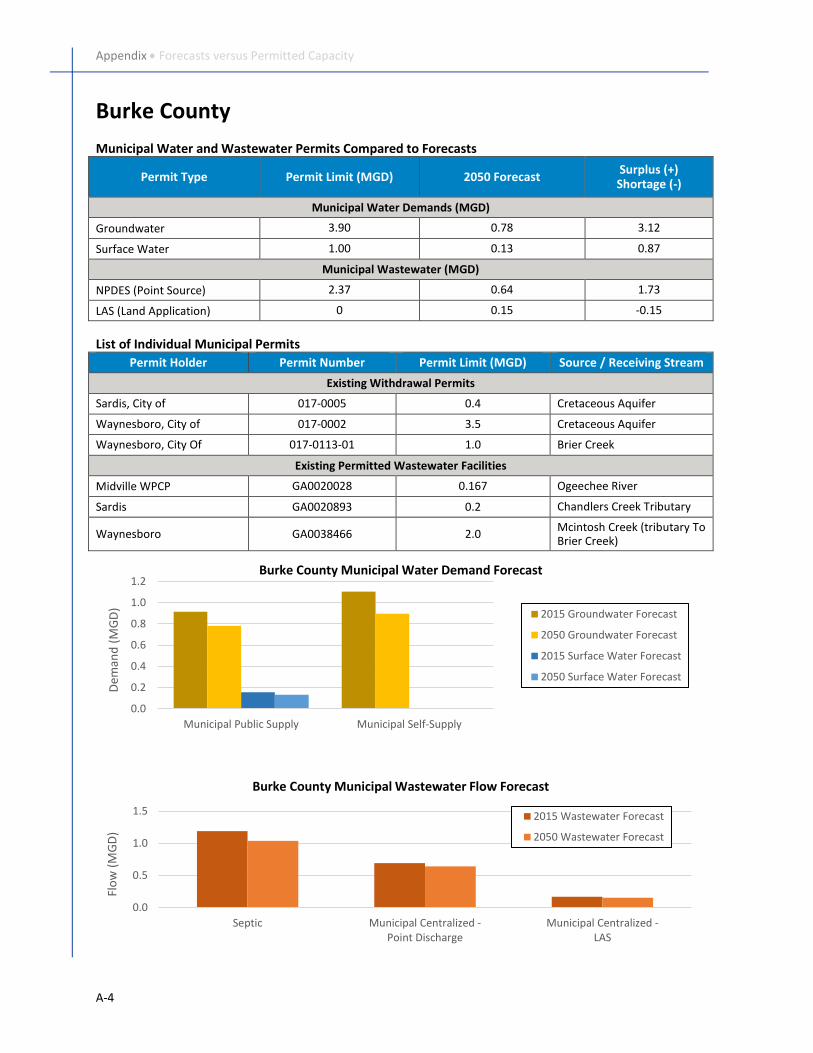
Burke County
Municipal Water and Wastewater Permits Compared to Forecasts
Permit Type Permit Limit (MGD) 2050 Forecast Surplus (+) Shortage (-)
Municipal Water Demands (MGD)
Groundwater 3.90 0.78 3.12
Surface Water 1.00 0.13 0.87
Municipal Wastewater (MGD)
NPDES (Point Source) 2.37 0.64 1.73
LAS (Land Application) 0 0.15 -0.15
List of Individual Municipal Permits
Permit Holder Permit Number Permit Limit (MGD) Source / Receiving Stream
Existing Withdrawal Permits
Sardis, City of 017-0005 0.4 Cretaceous Aquifer
Waynesboro, City of 017-0002 3.5 Cretaceous Aquifer
Waynesboro, City Of 017-0113-01 1.0 Brier Creek
Existing Permitted Wastewater Facilities
Midville WPCP GA0020028 0.167 Ogeechee River
Sardis GA0020893 0.2 Chandlers Creek Tributary
Waynesboro GA0038466 2.0 Mcintosh Creek (tributary To Brier Creek)
0.0
0.2
0.4
0.6
0.8
1.0
1.2
Municipal Public Supply Municipal Self-Supply
Dem
and
(M
GD
)
Burke County Municipal Water Demand Forecast
2015 Groundwater Forecast
2050 Groundwater Forecast
2015 Surface Water Forecast
2050 Surface Water Forecast
0.0
0.5
1.0
1.5
Septic Municipal Centralized -Point Discharge
Municipal Centralized -LAS
Flo
w (
MG
D)
Burke County Municipal Wastewater Flow Forecast
2015 Wastewater Forecast
2050 Wastewater Forecast
Appendix • Forecasts versus Permitted Capacity
A-5
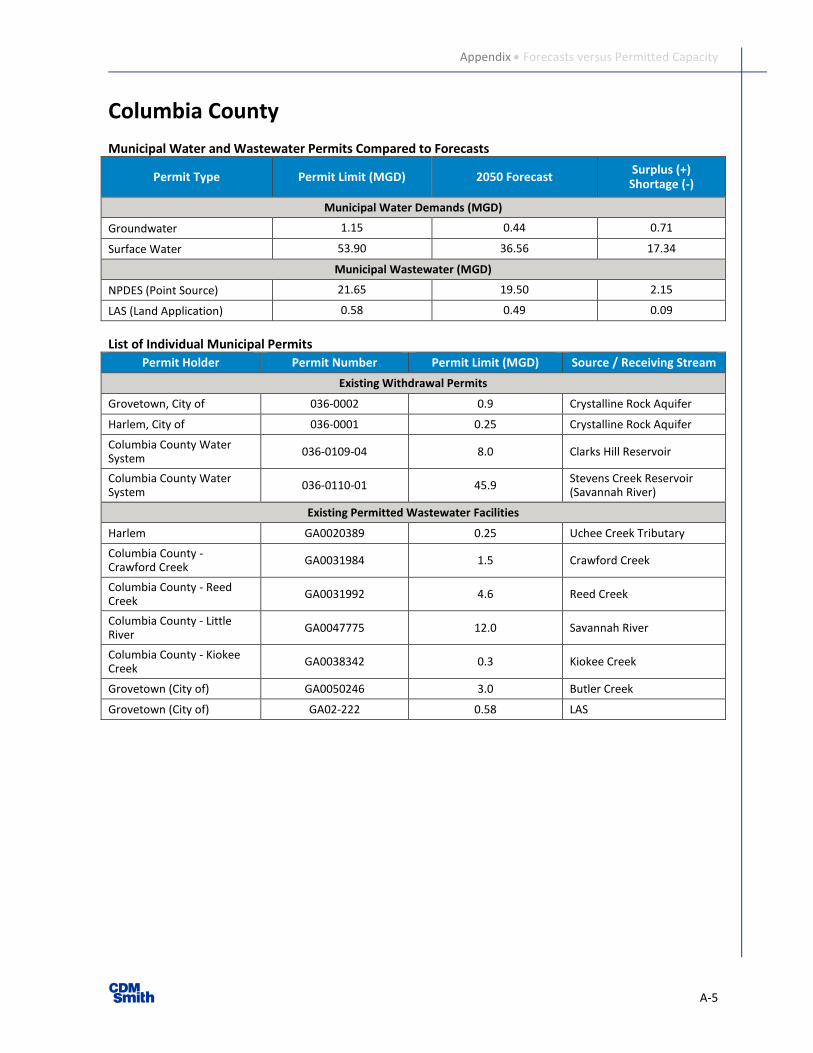
Columbia County
Municipal Water and Wastewater Permits Compared to Forecasts
Permit Type Permit Limit (MGD) 2050 Forecast Surplus (+) Shortage (-)
Municipal Water Demands (MGD)
Groundwater 1.15 0.44 0.71
Surface Water 53.90 36.56 17.34
Municipal Wastewater (MGD)
NPDES (Point Source) 21.65 19.50 2.15
LAS (Land Application) 0.58 0.49 0.09
List of Individual Municipal Permits
Permit Holder Permit Number Permit Limit (MGD) Source / Receiving Stream
Existing Withdrawal Permits
Grovetown, City of 036-0002 0.9 Crystalline Rock Aquifer
Harlem, City of 036-0001 0.25 Crystalline Rock Aquifer
Columbia County Water System
036-0109-04 8.0 Clarks Hill Reservoir
Columbia County Water System
036-0110-01 45.9 Stevens Creek Reservoir (Savannah River)
Existing Permitted Wastewater Facilities
Harlem GA0020389 0.25 Uchee Creek Tributary
Columbia County - Crawford Creek
GA0031984 1.5 Crawford Creek
Columbia County - Reed Creek
GA0031992 4.6 Reed Creek
Columbia County - Little River
GA0047775 12.0 Savannah River
Columbia County - Kiokee Creek
GA0038342 0.3 Kiokee Creek
Grovetown (City of) GA0050246 3.0 Butler Creek
Grovetown (City of) GA02-222 0.58 LAS
Appendix • Forecasts versus Permitted Capacity
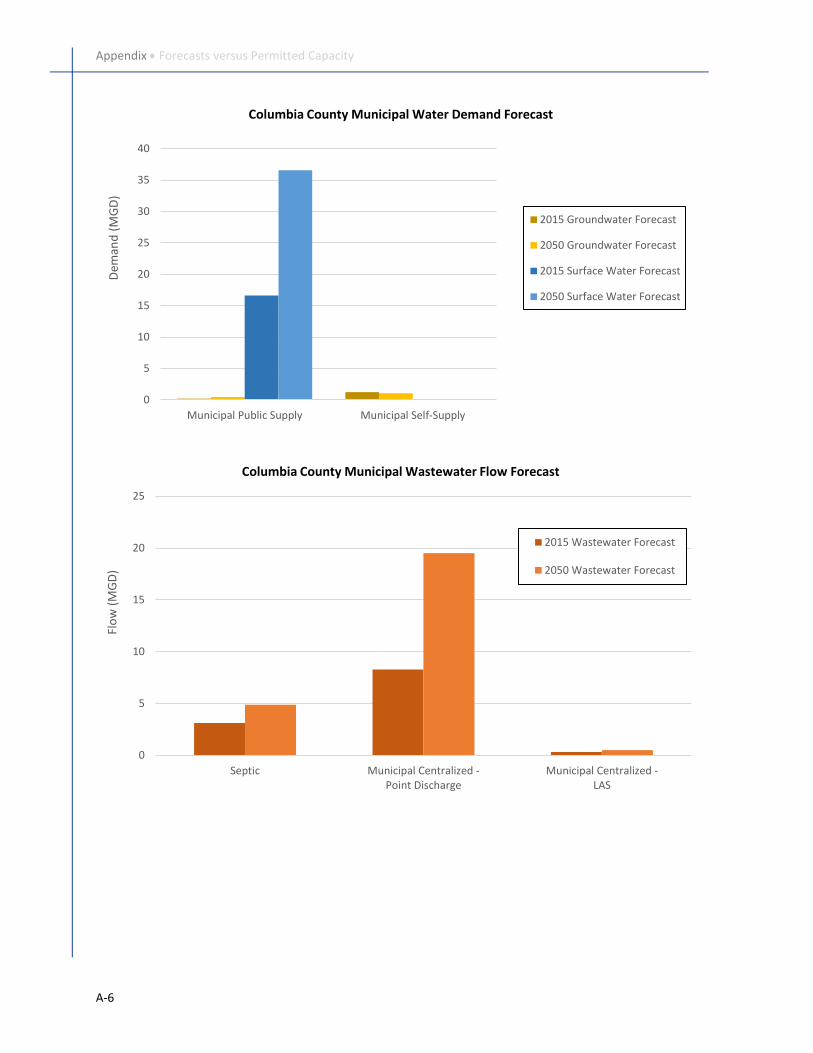
A-6
0
5
10
15
20
25
30
35
40
Municipal Public Supply Municipal Self-Supply
Dem
and
(M
GD
)Columbia County Municipal Water Demand Forecast
2015 Groundwater Forecast
2050 Groundwater Forecast
2015 Surface Water Forecast
2050 Surface Water Forecast
0
5
10
15
20
25
Septic Municipal Centralized -Point Discharge
Municipal Centralized -LAS
Flo
w (
MG
D)
Columbia County Municipal Wastewater Flow Forecast
2015 Wastewater Forecast
2050 Wastewater Forecast
Appendix • Forecasts versus Permitted Capacity
A-7
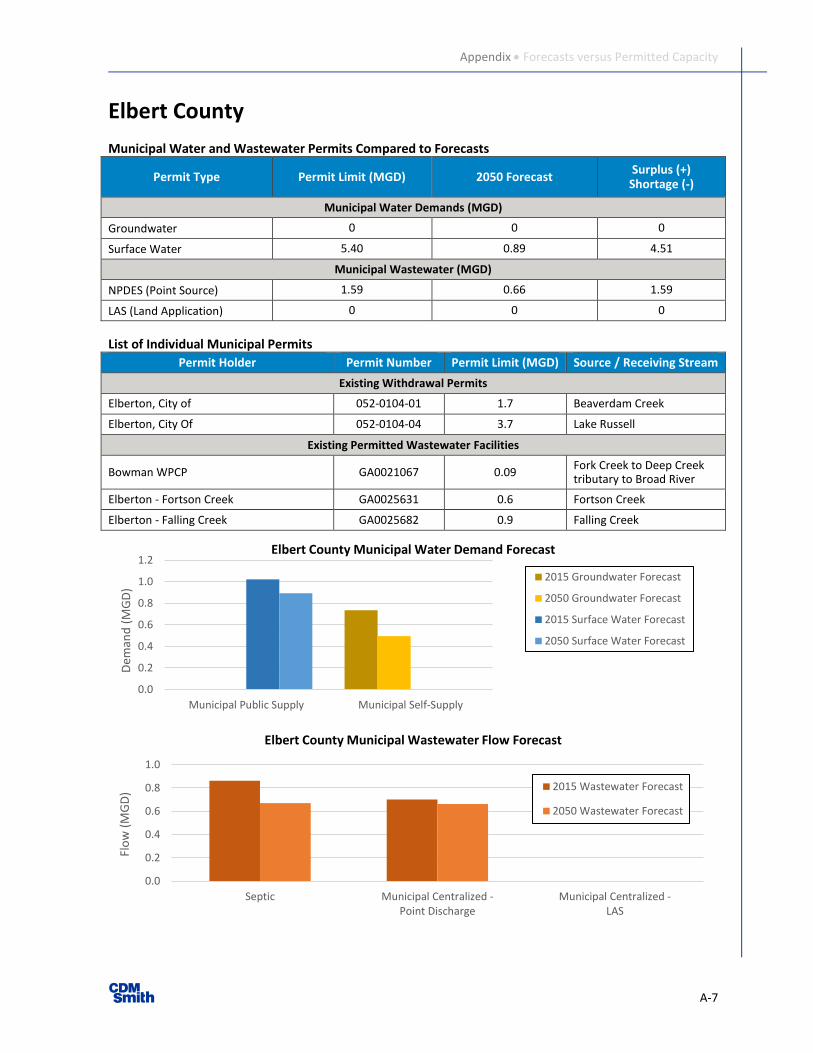
Elbert County
Municipal Water and Wastewater Permits Compared to Forecasts
Permit Type Permit Limit (MGD) 2050 Forecast Surplus (+) Shortage (-)
Municipal Water Demands (MGD)
Groundwater 0 0 0
Surface Water 5.40 0.89 4.51
Municipal Wastewater (MGD)
NPDES (Point Source) 1.59 0.66 1.59
LAS (Land Application) 0 0 0
List of Individual Municipal Permits
Permit Holder Permit Number Permit Limit (MGD) Source / Receiving Stream
Existing Withdrawal Permits
Elberton, City of 052-0104-01 1.7 Beaverdam Creek
Elberton, City Of 052-0104-04 3.7 Lake Russell
Existing Permitted Wastewater Facilities
Bowman WPCP GA0021067 0.09 Fork Creek to Deep Creek tributary to Broad River
Elberton - Fortson Creek GA0025631 0.6 Fortson Creek
Elberton - Falling Creek GA0025682 0.9 Falling Creek
0.0
0.2
0.4
0.6
0.8
1.0
1.2
Municipal Public Supply Municipal Self-Supply
Dem
and
(M
GD
)
Elbert County Municipal Water Demand Forecast
2015 Groundwater Forecast
2050 Groundwater Forecast
2015 Surface Water Forecast
2050 Surface Water Forecast
0.0
0.2
0.4
0.6
0.8
1.0
Septic Municipal Centralized -Point Discharge
Municipal Centralized -LAS
Flo
w (
MG
D)
Elbert County Municipal Wastewater Flow Forecast
2015 Wastewater Forecast
2050 Wastewater Forecast
Appendix • Forecasts versus Permitted Capacity
A-8
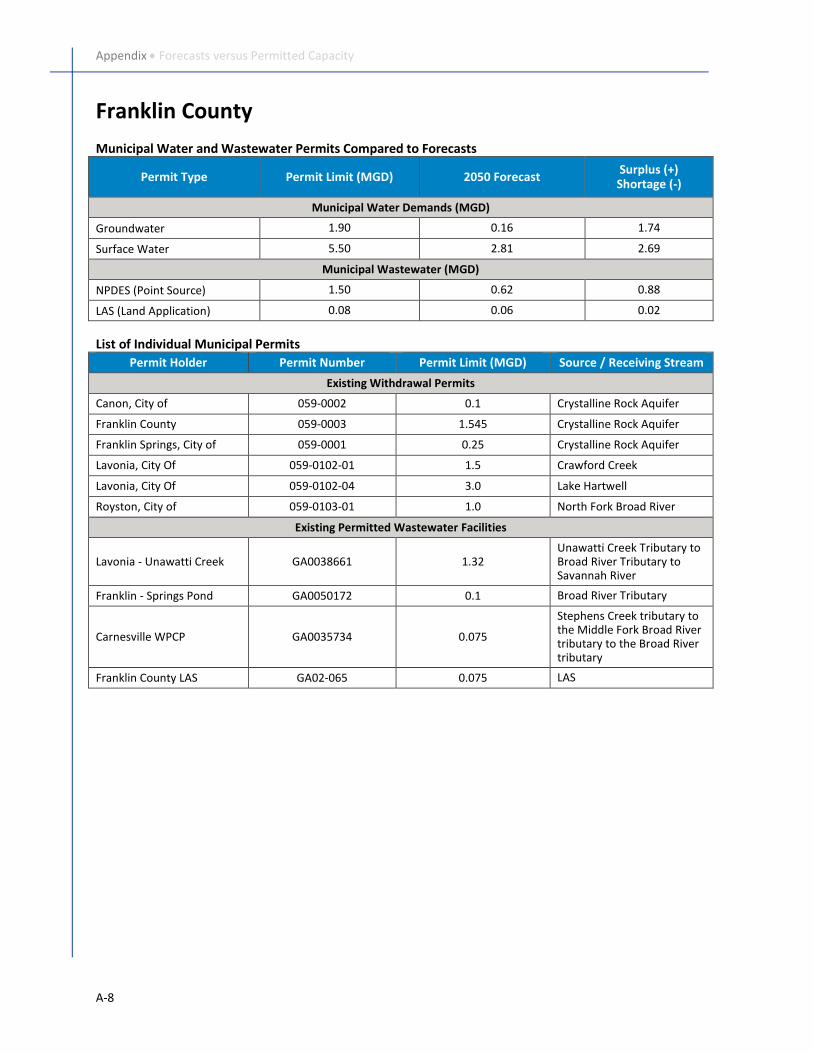
Franklin County
Municipal Water and Wastewater Permits Compared to Forecasts
Permit Type Permit Limit (MGD) 2050 Forecast Surplus (+) Shortage (-)
Municipal Water Demands (MGD)
Groundwater 1.90 0.16 1.74
Surface Water 5.50 2.81 2.69
Municipal Wastewater (MGD)
NPDES (Point Source) 1.50 0.62 0.88
LAS (Land Application) 0.08 0.06 0.02
List of Individual Municipal Permits
Permit Holder Permit Number Permit Limit (MGD) Source / Receiving Stream
Existing Withdrawal Permits
Canon, City of 059-0002 0.1 Crystalline Rock Aquifer
Franklin County 059-0003 1.545 Crystalline Rock Aquifer
Franklin Springs, City of 059-0001 0.25 Crystalline Rock Aquifer
Lavonia, City Of 059-0102-01 1.5 Crawford Creek
Lavonia, City Of 059-0102-04 3.0 Lake Hartwell
Royston, City of 059-0103-01 1.0 North Fork Broad River
Existing Permitted Wastewater Facilities
Lavonia - Unawatti Creek GA0038661 1.32 Unawatti Creek Tributary to Broad River Tributary to Savannah River
Franklin - Springs Pond GA0050172 0.1 Broad River Tributary
Carnesville WPCP GA0035734 0.075
Stephens Creek tributary to the Middle Fork Broad River tributary to the Broad River tributary
Franklin County LAS GA02-065 0.075 LAS

Appendix • Forecasts versus Permitted Capacity
A-9
0.0
0.5
1.0
1.5
2.0
2.5
3.0
Municipal Public Supply Municipal Self-Supply
Dem
and
(M
GD
)Franklin County Municipal Water Demand Forecast
2015 Groundwater Forecast
2050 Groundwater Forecast
2015 Surface Water Forecast
2050 Surface Water Forecast
0.0
0.5
1.0
1.5
2.0
2.5
3.0
Septic Municipal Centralized -Point Discharge
Municipal Centralized -LAS
Flo
w (
MG
D)
Franklin County Municipal Wastewater Flow Forecast
2015 Wastewater Forecast
2050 Wastewater Forecast

Appendix • Forecasts versus Permitted Capacity
A-10
Glascock County
Municipal Water and Wastewater Permits Compared to Forecasts
Permit Type Permit Limit (MGD) 2050 Forecast Surplus (+) Shortage (-)
Municipal Water Demands (MGD)
Groundwater 0 0.09 -0.09
Surface Water 0 0 0
Municipal Wastewater (MGD)
NPDES (Point Source) 0.21 0.02 0.19
LAS (Land Application) 0 0 0
List of Individual Municipal Permits
Permit Holder Permit Number Permit Limit (MGD) Source / Receiving Stream
Existing Withdrawal Permits
Existing Permitted Wastewater Facilities
Gibson WPCP Pond GA0021849 0.21 Rocky Comfort Creek Tributary
0.00
0.02
0.04
0.06
0.08
0.10
0.12
0.14
0.16
Municipal Public Supply Municipal Self-Supply
Dem
and
(M
GD
)
Glascock County Municipal Water Demand Forecast
2015 Groundwater Forecast
2050 Groundwater Forecast
2015 Surface Water Forecast
2050 Surface Water Forecast
0.00
0.02
0.04
0.06
0.08
0.10
0.12
0.14
Septic Municipal Centralized -Point Discharge
Municipal Centralized -LAS
Flo
w (
MG
D)
Glascock County Municipal Wastewater Flow Forecast
2015 Wastewater Forecast
2050 Wastewater Forecast

Appendix • Forecasts versus Permitted Capacity
A-11
Hart County
Municipal Water and Wastewater Permits Compared to Forecasts
Permit Type Permit Limit (MGD) 2050 Forecast Surplus (+) Shortage (-)
Municipal Water Demands (MGD)
Groundwater 0.34 0 0.34
Surface Water 3.50 2.92 0.58
Municipal Wastewater (MGD)
NPDES (Point Source) 0.50 0.20 0.30
LAS (Land Application) 1.75 0.72 1.03
List of Individual Municipal Permits
Permit Holder Permit Number Permit Limit (MGD) Source / Receiving Stream
Existing Withdrawal Permits
Royston, City of 073-0003 0.341 Crystalline Rock Aquifer
Hartwell, City Of 073-0190-01 3.5 Lake Hartwell
Existing Permitted Wastewater Facilities
Royston GA0021491 0.5 Hannah Creek
Hartwell LAS GA02-114 1.75 LAS
0.0
0.5
1.0
1.5
2.0
2.5
3.0
3.5
Municipal Public Supply Municipal Self-Supply
Dem
and
(M
GD
)
Hart County Municipal Water Demand Forecast
2015 Groundwater Forecast
2050 Groundwater Forecast
2015 Surface Water Forecast
2050 Surface Water Forecast
0.0
0.5
1.0
1.5
2.0
2.5
3.0
Septic Municipal Centralized -Point Discharge
Municipal Centralized -LAS
Flo
w (
MG
D)
Hart County Municipal Wastewater Flow Forecast
2015 Wastewater Forecast
2050 Wastewater Forecast
Appendix • Forecasts versus Permitted Capacity
A-12
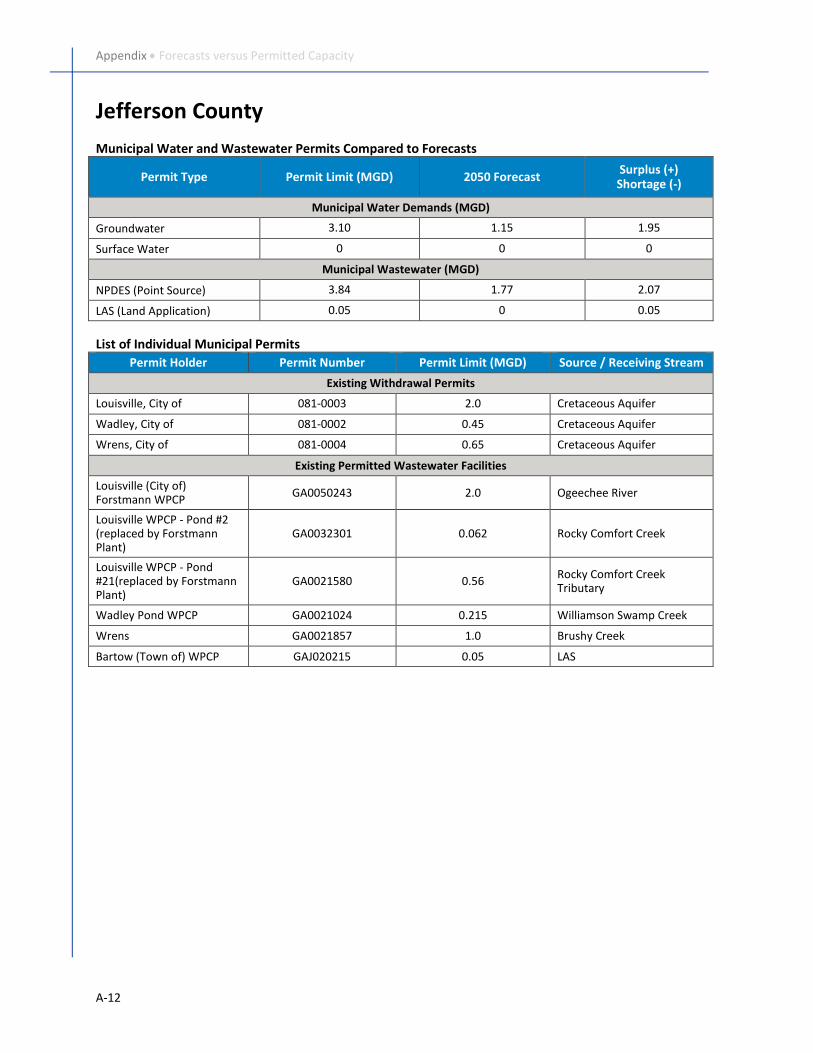
Jefferson County
Municipal Water and Wastewater Permits Compared to Forecasts
Permit Type Permit Limit (MGD) 2050 Forecast Surplus (+) Shortage (-)
Municipal Water Demands (MGD)
Groundwater 3.10 1.15 1.95
Surface Water 0 0 0
Municipal Wastewater (MGD)
NPDES (Point Source) 3.84 1.77 2.07
LAS (Land Application) 0.05 0 0.05
List of Individual Municipal Permits
Permit Holder Permit Number Permit Limit (MGD) Source / Receiving Stream
Existing Withdrawal Permits
Louisville, City of 081-0003 2.0 Cretaceous Aquifer
Wadley, City of 081-0002 0.45 Cretaceous Aquifer
Wrens, City of 081-0004 0.65 Cretaceous Aquifer
Existing Permitted Wastewater Facilities
Louisville (City of) Forstmann WPCP
GA0050243 2.0 Ogeechee River
Louisville WPCP - Pond #2 (replaced by Forstmann Plant)
GA0032301 0.062 Rocky Comfort Creek
Louisville WPCP - Pond #21(replaced by Forstmann Plant)
GA0021580 0.56 Rocky Comfort Creek Tributary
Wadley Pond WPCP GA0021024 0.215 Williamson Swamp Creek
Wrens GA0021857 1.0 Brushy Creek
Bartow (Town of) WPCP GAJ020215 0.05 LAS
Appendix • Forecasts versus Permitted Capacity
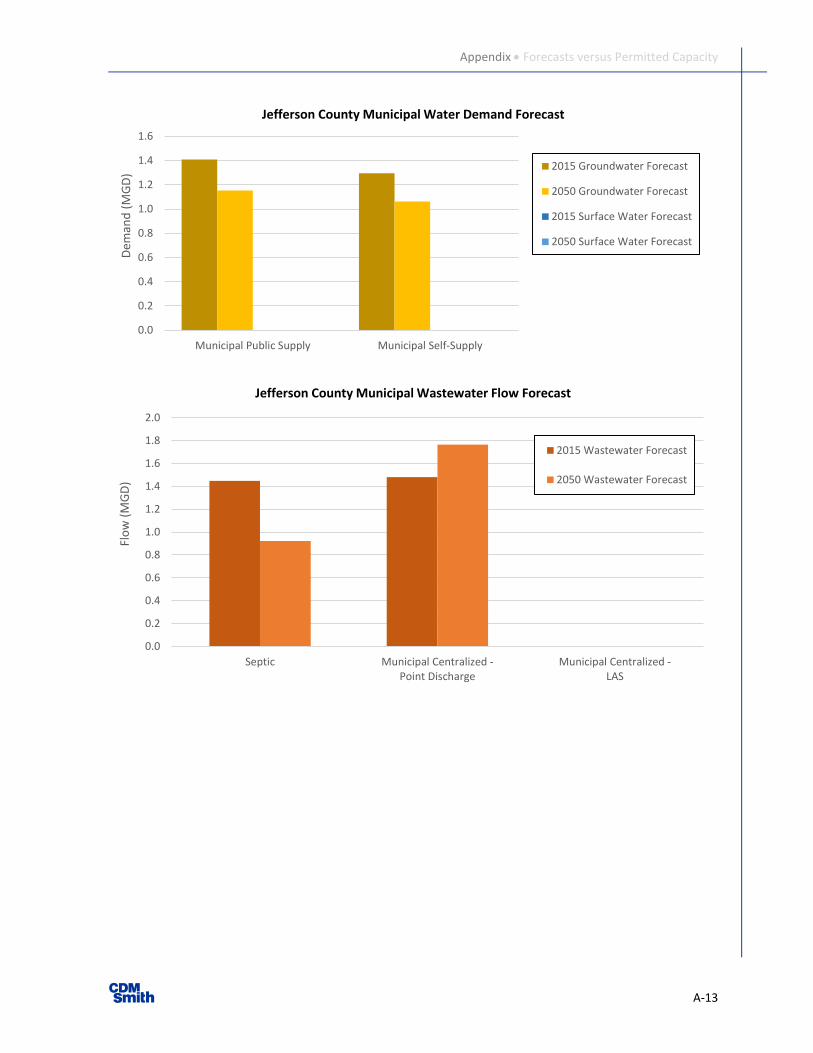
A-13
0.0
0.2
0.4
0.6
0.8
1.0
1.2
1.4
1.6
Municipal Public Supply Municipal Self-Supply
Dem
and
(M
GD
)Jefferson County Municipal Water Demand Forecast
2015 Groundwater Forecast
2050 Groundwater Forecast
2015 Surface Water Forecast
2050 Surface Water Forecast
0.0
0.2
0.4
0.6
0.8
1.0
1.2
1.4
1.6
1.8
2.0
Septic Municipal Centralized -Point Discharge
Municipal Centralized -LAS
Flo
w (
MG
D)
Jefferson County Municipal Wastewater Flow Forecast
2015 Wastewater Forecast
2050 Wastewater Forecast

Appendix • Forecasts versus Permitted Capacity
A-14
Jenkins County
Municipal Water and Wastewater Permits Compared to Forecasts
Permit Type Permit Limit (MGD) 2050 Forecast Surplus (+) Shortage (-)
Municipal Water Demands (MGD)
Groundwater 1.00 0.73 0.27
Surface Water 0 0 0
Municipal Wastewater (MGD)
NPDES (Point Source) 0.95 0.33 0.62
LAS (Land Application) 0 0 0
List of Individual Municipal Permits
Permit Holder Permit Number Permit Limit (MGD) Source / Receiving Stream
Existing Withdrawal Permits
Millen, City of 082-0002 1.00 Floridan Aquifer
Existing Permitted Wastewater Facilities
City of Millen Discharge GA0038750 0.95 Ogeechee River
0.0
0.1
0.2
0.3
0.4
0.5
0.6
0.7
0.8
0.9
Municipal Public Supply Municipal Self-Supply
Dem
and
(M
GD
)
Jenkins County Municipal Water Demand Forecast
2015 Groundwater Forecast
2050 Groundwater Forecast
2015 Surface Water Forecast
2050 Surface Water Forecast
0.00
0.05
0.10
0.15
0.20
0.25
0.30
0.35
Septic Municipal Centralized -Point Discharge
Municipal Centralized -LAS
Flo
w (
MG
D)
Jenkins County Municipal Wastewater Flow Forecast
2015 Wastewater Forecast
2050 Wastewater Forecast
Appendix • Forecasts versus Permitted Capacity
A-15
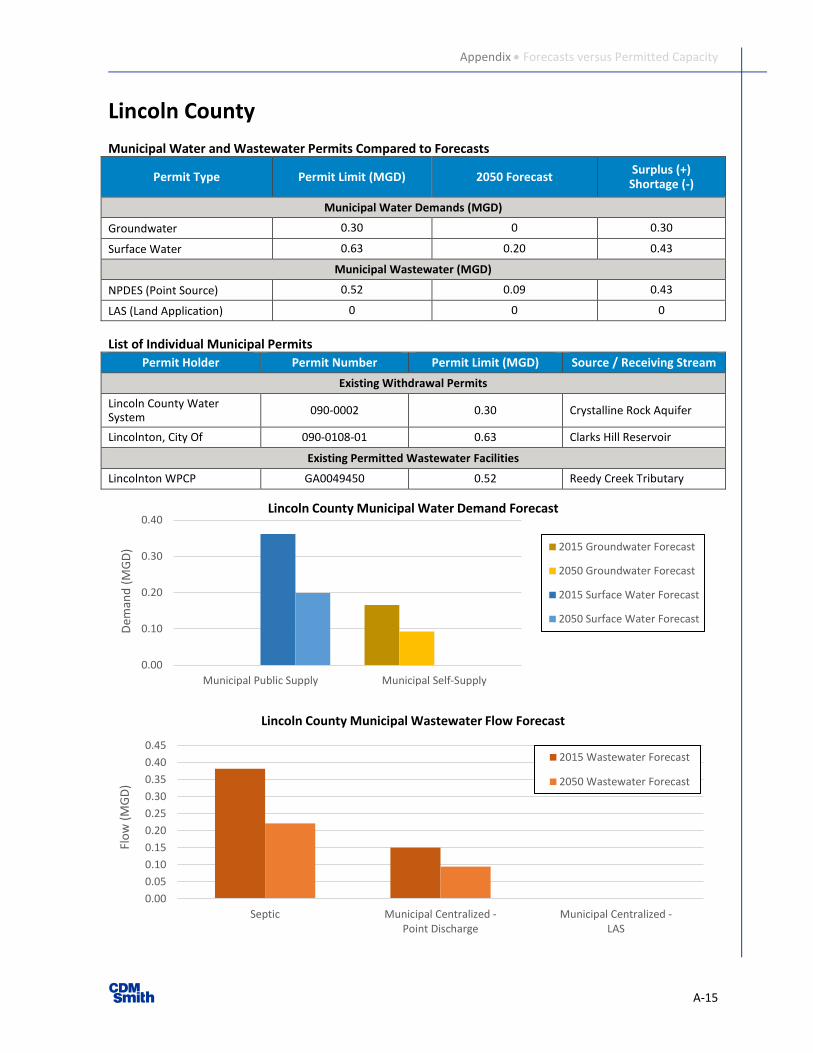
Lincoln County
Municipal Water and Wastewater Permits Compared to Forecasts
Permit Type Permit Limit (MGD) 2050 Forecast Surplus (+) Shortage (-)
Municipal Water Demands (MGD)
Groundwater 0.30 0 0.30
Surface Water 0.63 0.20 0.43
Municipal Wastewater (MGD)
NPDES (Point Source) 0.52 0.09 0.43
LAS (Land Application) 0 0 0
List of Individual Municipal Permits
Permit Holder Permit Number Permit Limit (MGD) Source / Receiving Stream
Existing Withdrawal Permits
Lincoln County Water System
090-0002 0.30 Crystalline Rock Aquifer
Lincolnton, City Of 090-0108-01 0.63 Clarks Hill Reservoir
Existing Permitted Wastewater Facilities
Lincolnton WPCP GA0049450 0.52 Reedy Creek Tributary
0.00
0.10
0.20
0.30
0.40
Municipal Public Supply Municipal Self-Supply
Dem
and
(M
GD
)
Lincoln County Municipal Water Demand Forecast
2015 Groundwater Forecast
2050 Groundwater Forecast
2015 Surface Water Forecast
2050 Surface Water Forecast
0.00
0.05
0.10
0.15
0.20
0.25
0.30
0.35
0.40
0.45
Septic Municipal Centralized -Point Discharge
Municipal Centralized -LAS
Flo
w (
MG
D)
Lincoln County Municipal Wastewater Flow Forecast
2015 Wastewater Forecast
2050 Wastewater Forecast

Appendix • Forecasts versus Permitted Capacity
A-16
Madison County
Municipal Water and Wastewater Permits Compared to Forecasts
Permit Type Permit Limit (MGD) 2050 Forecast Surplus (+) Shortage (-)
Municipal Water Demands (MGD)
Groundwater 0.60 2.46 -1.86
Surface Water 0 0 0
Municipal Wastewater (MGD)
NPDES (Point Source) 0.17 0.93 -0.76
LAS (Land Application) 0.10 0.01 0.09
List of Individual Municipal Permits
Permit Holder Permit Number Permit Limit (MGD) Source / Receiving Stream
Existing Withdrawal Permits
Comer, City of 095-0002 0.25 Crystalline Rock Aquifer
Danielsville, City of 095-0001 0.25 Crystalline Rock Aquifer
Madison County Industrial Development & Building Authority
095-0004 0.10 Crystalline Rock Aquifer
Existing Permitted Wastewater Facilities
Comer WPCP GA0021598 0.09 South Fork Broad River tributary to the Broad River
Danielsville WPCP GA0048224 0.075 South Fork broad River
Madison County IDBA GAJ020039 0.10 LAS
0.0
1.0
2.0
3.0
Municipal Public Supply Municipal Self-Supply
Dem
and
(M
GD
)
Madison County Municipal Water Demand Forecast
2015 Groundwater Forecast
2050 Groundwater Forecast
2015 Surface Water Forecast
2050 Surface Water Forecast
0.0
0.5
1.0
1.5
2.0
2.5
Septic Municipal Centralized -Point Discharge
Municipal Centralized -LAS
Flo
w (
MG
D)
Madison County Municipal Wastewater Flow Forecast
2015 Wastewater Forecast
2050 Wastewater Forecast

Appendix • Forecasts versus Permitted Capacity
A-17
McDuffie County
Municipal Water and Wastewater Permits Compared to Forecasts
Permit Type Permit Limit (MGD) 2050 Forecast Surplus (+) Shortage (-)
Municipal Water Demands (MGD)
Groundwater 0 0 0
Surface Water 4.60 2.61 1.99
Municipal Wastewater (MGD)
NPDES (Point Source) 2.50 1.77 0.73
LAS (Land Application) 0.29 0.10 0.19
List of Individual Municipal Permits
Permit Holder Permit Number Permit Limit (MGD) Source / Receiving Stream
Existing Withdrawal Permits
Thomson/ McDuffie Water & Sewer Commission
097-0109-05 3.1 Clarks Hill Reservoir
Thomson/ McDuffie Water & Sewer Commission
097-0111-03 1.5 Usry's Lake on Sweetwater Creek
Existing Permitted Wastewater Facilities
Thomson GA0020974 2.5 Whites Creek
Dearing LAS GA02-007 0.12 LAS
Thomson (City of) LAS GA02-252 0.171 LAS
0.0
0.5
1.0
1.5
2.0
2.5
3.0
Municipal Public Supply Municipal Self-Supply
Dem
and
(M
GD
)
McDuffie County Municipal Water Demand Forecast
2015 Groundwater Forecast
2050 Groundwater Forecast
2015 Surface Water Forecast
2050 Surface Water Forecast
0.0
0.5
1.0
1.5
2.0
Septic Municipal Centralized -Point Discharge
Municipal Centralized -LAS
Flo
w (
MG
D)
McDuffie County Municipal Wastewater Flow Forecast
2015 Wastewater Forecast
2050 Wastewater Forecast

Appendix • Forecasts versus Permitted Capacity
A-18
Oglethorpe County
Municipal Water and Wastewater Permits Compared to Forecasts
Permit Type Permit Limit (MGD) 2050 Forecast Surplus (+) Shortage (-)
Municipal Water Demands (MGD)
Groundwater 0 0 0
Surface Water 0.25 1.13 -0.88
Municipal Wastewater (MGD)
NPDES (Point Source) 0.25 0.53 -0.28
LAS (Land Application) 0 0 0
List of Individual Municipal Permits
Permit Holder Permit Number Permit Limit (MGD) Source / Receiving Stream
Existing Withdrawal Permits
Crawford, City Of 109-0105-01 0.25 Tributary to Long Creek
Existing Permitted Wastewater Facilities
Crawford GA0039144 0.25 Barrow Creek
0.0
0.2
0.4
0.6
0.8
1.0
1.2
1.4
Municipal Public Supply Municipal Self-Supply
Dem
and
(M
GD
)
Oglethorpe County Municipal Water Demand Forecast
2015 Groundwater Forecast
2050 Groundwater Forecast
2015 Surface Water Forecast
2050 Surface Water Forecast
0.0
0.2
0.4
0.6
0.8
1.0
1.2
Septic Municipal Centralized -Point Discharge
Municipal Centralized -LAS
Flo
w (
MG
D)
Oglethorpe County Municipal Wastewater Flow Forecast
2015 Wastewater Forecast
2050 Wastewater Forecast
Appendix • Forecasts versus Permitted Capacity
A-19
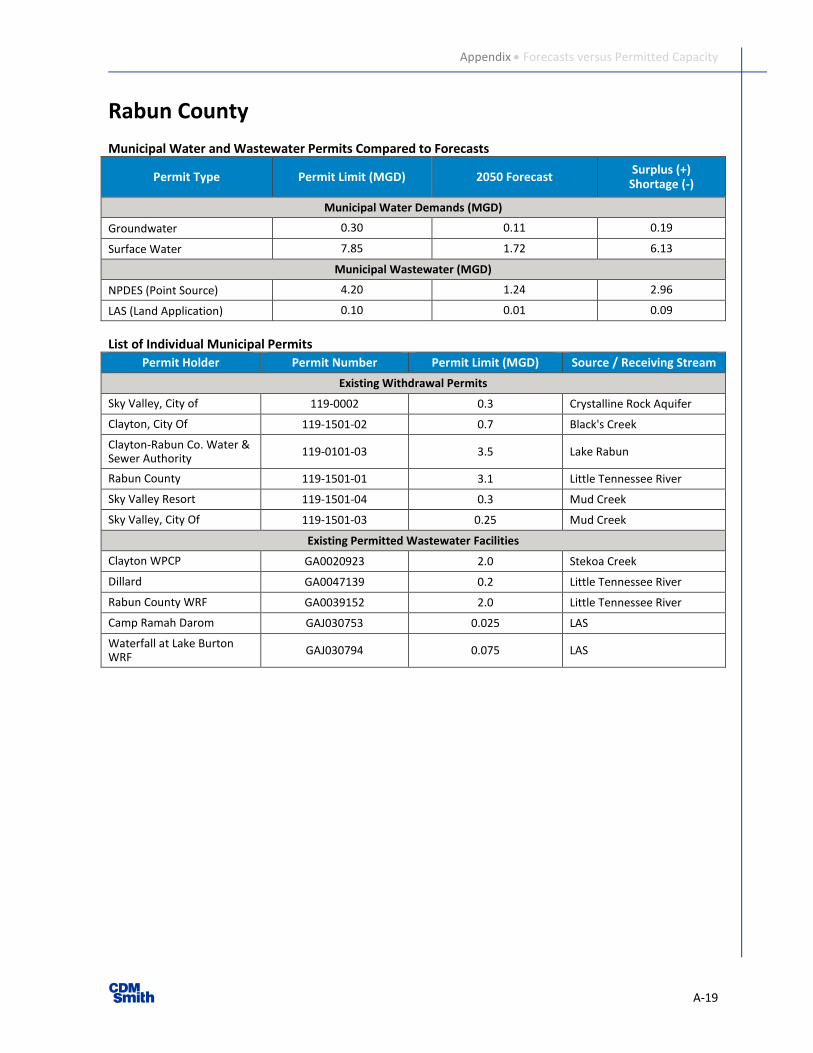
Rabun County
Municipal Water and Wastewater Permits Compared to Forecasts
Permit Type Permit Limit (MGD) 2050 Forecast Surplus (+) Shortage (-)
Municipal Water Demands (MGD)
Groundwater 0.30 0.11 0.19
Surface Water 7.85 1.72 6.13
Municipal Wastewater (MGD)
NPDES (Point Source) 4.20 1.24 2.96
LAS (Land Application) 0.10 0.01 0.09
List of Individual Municipal Permits
Permit Holder Permit Number Permit Limit (MGD) Source / Receiving Stream
Existing Withdrawal Permits
Sky Valley, City of 119-0002 0.3 Crystalline Rock Aquifer
Clayton, City Of 119-1501-02 0.7 Black's Creek
Clayton-Rabun Co. Water & Sewer Authority
119-0101-03 3.5 Lake Rabun
Rabun County 119-1501-01 3.1 Little Tennessee River
Sky Valley Resort 119-1501-04 0.3 Mud Creek
Sky Valley, City Of 119-1501-03 0.25 Mud Creek
Existing Permitted Wastewater Facilities
Clayton WPCP GA0020923 2.0 Stekoa Creek
Dillard GA0047139 0.2 Little Tennessee River
Rabun County WRF GA0039152 2.0 Little Tennessee River
Camp Ramah Darom GAJ030753 0.025 LAS
Waterfall at Lake Burton WRF
GAJ030794 0.075 LAS

Appendix • Forecasts versus Permitted Capacity
A-20
0.0
0.2
0.4
0.6
0.8
1.0
1.2
1.4
1.6
1.8
2.0
Municipal Public Supply Municipal Self-Supply
Dem
and
(M
GD
)Rabun County Municipal Water Demand Forecast
2015 Groundwater Forecast
2050 Groundwater Forecast
2015 Surface Water Forecast
2050 Surface Water Forecast
0.0
0.2
0.4
0.6
0.8
1.0
1.2
1.4
1.6
1.8
Septic Municipal Centralized -Point Discharge
Municipal Centralized -LAS
Flo
w (
MG
D)
Rabun County Municipal Wastewater Flow Forecast
2015 Wastewater Forecast
2050 Wastewater Forecast
Appendix • Forecasts versus Permitted Capacity
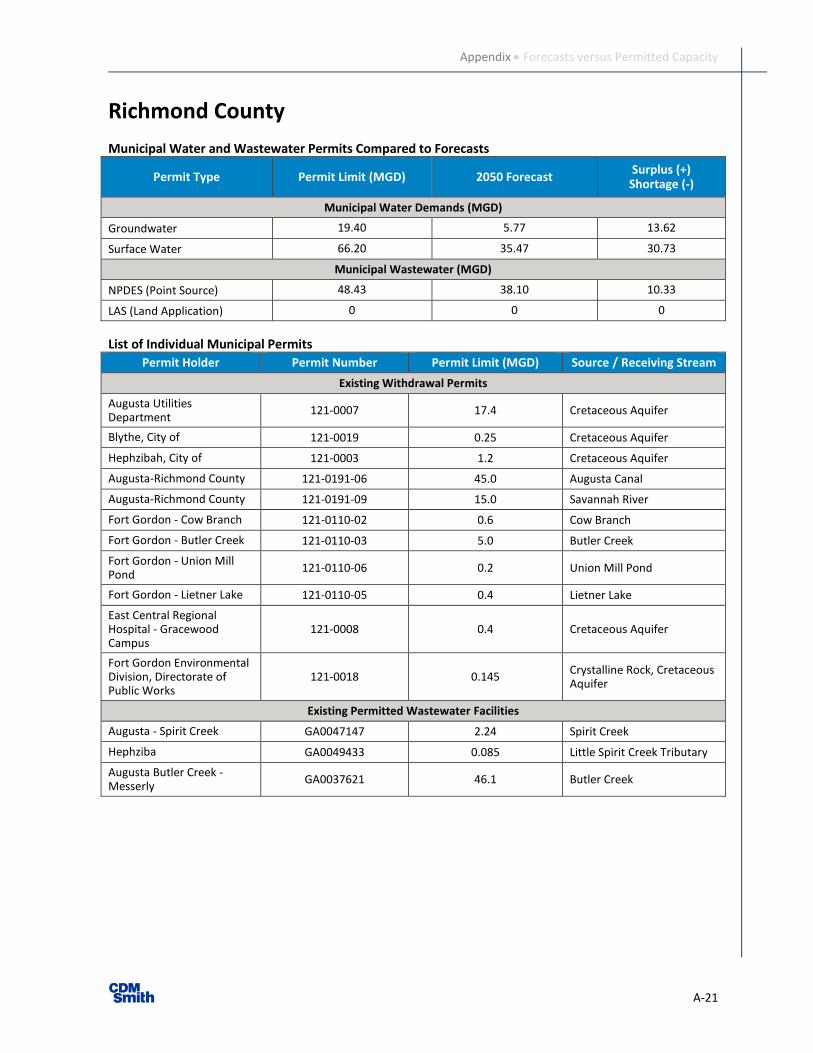
A-21
Richmond County
Municipal Water and Wastewater Permits Compared to Forecasts
Permit Type Permit Limit (MGD) 2050 Forecast Surplus (+) Shortage (-)
Municipal Water Demands (MGD)
Groundwater 19.40 5.77 13.62
Surface Water 66.20 35.47 30.73
Municipal Wastewater (MGD)
NPDES (Point Source) 48.43 38.10 10.33
LAS (Land Application) 0 0 0
List of Individual Municipal Permits
Permit Holder Permit Number Permit Limit (MGD) Source / Receiving Stream
Existing Withdrawal Permits
Augusta Utilities Department
121-0007 17.4 Cretaceous Aquifer
Blythe, City of 121-0019 0.25 Cretaceous Aquifer
Hephzibah, City of 121-0003 1.2 Cretaceous Aquifer
Augusta-Richmond County 121-0191-06 45.0 Augusta Canal
Augusta-Richmond County 121-0191-09 15.0 Savannah River
Fort Gordon - Cow Branch 121-0110-02 0.6 Cow Branch
Fort Gordon - Butler Creek 121-0110-03 5.0 Butler Creek
Fort Gordon - Union Mill Pond
121-0110-06 0.2 Union Mill Pond
Fort Gordon - Lietner Lake 121-0110-05 0.4 Lietner Lake
East Central Regional Hospital - Gracewood Campus
121-0008 0.4 Cretaceous Aquifer
Fort Gordon Environmental Division, Directorate of Public Works
121-0018 0.145 Crystalline Rock, Cretaceous Aquifer
Existing Permitted Wastewater Facilities
Augusta - Spirit Creek GA0047147 2.24 Spirit Creek
Hephziba GA0049433 0.085 Little Spirit Creek Tributary
Augusta Butler Creek - Messerly
GA0037621 46.1 Butler Creek

Appendix • Forecasts versus Permitted Capacity
A-22
0
5
10
15
20
25
30
35
40
Municipal Public Supply Municipal Self-Supply
Dem
and
(M
GD
)Richmond County Municipal Water Demand Forecast
2015 Groundwater Forecast
2050 Groundwater Forecast
2015 Surface Water Forecast
2050 Surface Water Forecast
0
5
10
15
20
25
30
35
40
45
Septic Municipal Centralized -Point Discharge
Municipal Centralized -LAS
Flo
w (
MG
D)
Richmond County Municipal Wastewater Flow Forecast
2015 Wastewater Forecast
2050 Wastewater Forecast

Appendix • Forecasts versus Permitted Capacity
A-23
Screven County
Municipal Water and Wastewater Permits Compared to Forecasts
Permit Type Permit Limit (MGD) 2050 Forecast Surplus (+) Shortage (-)
Municipal Water Demands (MGD)
Groundwater 1.30 0.80 0.50
Surface Water 0 0 0
Municipal Wastewater (MGD)
NPDES (Point Source) 1.57 0.60 0.97
LAS (Land Application) 0.044 0 0.04
List of Individual Municipal Permits
Permit Holder Permit Number Permit Limit (MGD) Source / Receiving Stream
Existing Withdrawal Permits
Sylvania, City of 124-0002 1.3 Floridan Aquifer
Existing Permitted Wastewater Facilities
Sylvania GA0021385 1.51 Buck Creek
GA Visitor Center- Sylvania GA0030287 0.015 unnamed tributary to the Savannah River
Newington Pond GA0050202 0.045 Ogeechee Creek Tributary
Hiltonia (Town of) LAS GAJ020033 0.044 LAS
0.0
0.2
0.4
0.6
0.8
1.0
Municipal Public Supply Municipal Self-Supply
Dem
and
(M
GD
)
Screven County Municipal Water Demand Forecast
2015 Groundwater Forecast
2050 Groundwater Forecast
2015 Surface Water Forecast
2050 Surface Water Forecast
0.0
0.2
0.4
0.6
0.8
1.0
Septic Municipal Centralized -Point Discharge
Municipal Centralized -LAS
Flo
w (
MG
D)
Screven County Municipal Wastewater Flow Forecast
2015 Wastewater Forecast
2050 Wastewater Forecast
Appendix • Forecasts versus Permitted Capacity
A-24
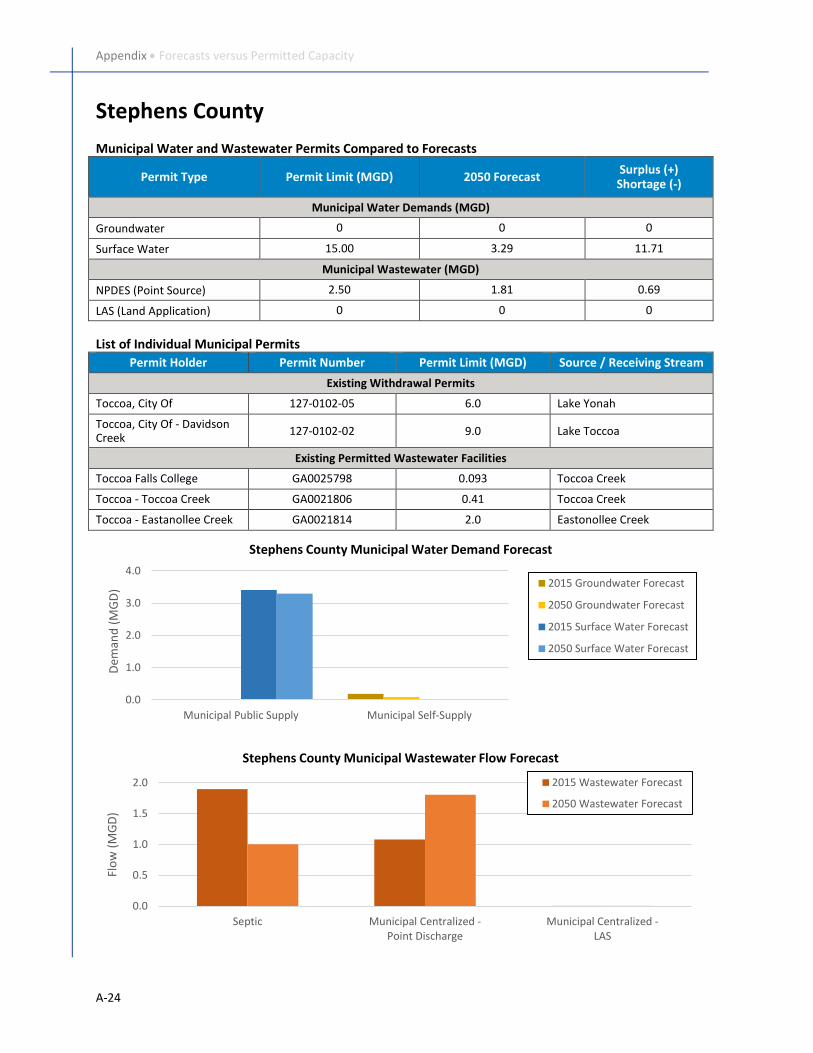
Stephens County
Municipal Water and Wastewater Permits Compared to Forecasts
Permit Type Permit Limit (MGD) 2050 Forecast Surplus (+) Shortage (-)
Municipal Water Demands (MGD)
Groundwater 0 0 0
Surface Water 15.00 3.29 11.71
Municipal Wastewater (MGD)
NPDES (Point Source) 2.50 1.81 0.69
LAS (Land Application) 0 0 0
List of Individual Municipal Permits
Permit Holder Permit Number Permit Limit (MGD) Source / Receiving Stream
Existing Withdrawal Permits
Toccoa, City Of 127-0102-05 6.0 Lake Yonah
Toccoa, City Of - Davidson Creek
127-0102-02 9.0 Lake Toccoa
Existing Permitted Wastewater Facilities
Toccoa Falls College GA0025798 0.093 Toccoa Creek
Toccoa - Toccoa Creek GA0021806 0.41 Toccoa Creek
Toccoa - Eastanollee Creek GA0021814 2.0 Eastonollee Creek
0.0
1.0
2.0
3.0
4.0
Municipal Public Supply Municipal Self-Supply
Dem
and
(M
GD
)
Stephens County Municipal Water Demand Forecast
2015 Groundwater Forecast
2050 Groundwater Forecast
2015 Surface Water Forecast
2050 Surface Water Forecast
0.0
0.5
1.0
1.5
2.0
Septic Municipal Centralized -Point Discharge
Municipal Centralized -LAS
Flo
w (
MG
D)
Stephens County Municipal Wastewater Flow Forecast
2015 Wastewater Forecast
2050 Wastewater Forecast
Appendix • Forecasts versus Permitted Capacity
A-25
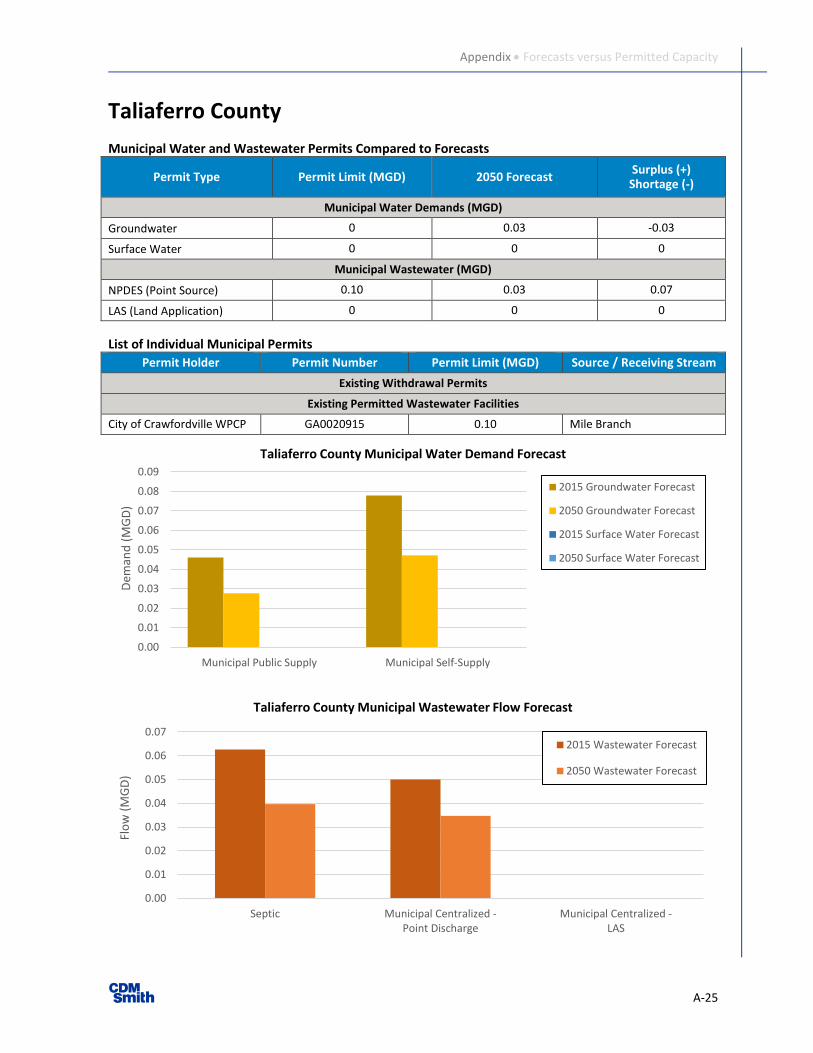
Taliaferro County
Municipal Water and Wastewater Permits Compared to Forecasts
Permit Type Permit Limit (MGD) 2050 Forecast Surplus (+) Shortage (-)
Municipal Water Demands (MGD)
Groundwater 0 0.03 -0.03
Surface Water 0 0 0
Municipal Wastewater (MGD)
NPDES (Point Source) 0.10 0.03 0.07
LAS (Land Application) 0 0 0
List of Individual Municipal Permits
Permit Holder Permit Number Permit Limit (MGD) Source / Receiving Stream
Existing Withdrawal Permits
Existing Permitted Wastewater Facilities
City of Crawfordville WPCP GA0020915 0.10 Mile Branch
0.00
0.01
0.02
0.03
0.04
0.05
0.06
0.07
0.08
0.09
Municipal Public Supply Municipal Self-Supply
Dem
and
(M
GD
)
Taliaferro County Municipal Water Demand Forecast
2015 Groundwater Forecast
2050 Groundwater Forecast
2015 Surface Water Forecast
2050 Surface Water Forecast
0.00
0.01
0.02
0.03
0.04
0.05
0.06
0.07
Septic Municipal Centralized -Point Discharge
Municipal Centralized -LAS
Flo
w (
MG
D)
Taliaferro County Municipal Wastewater Flow Forecast
2015 Wastewater Forecast
2050 Wastewater Forecast
Appendix • Forecasts versus Permitted Capacity
A-26
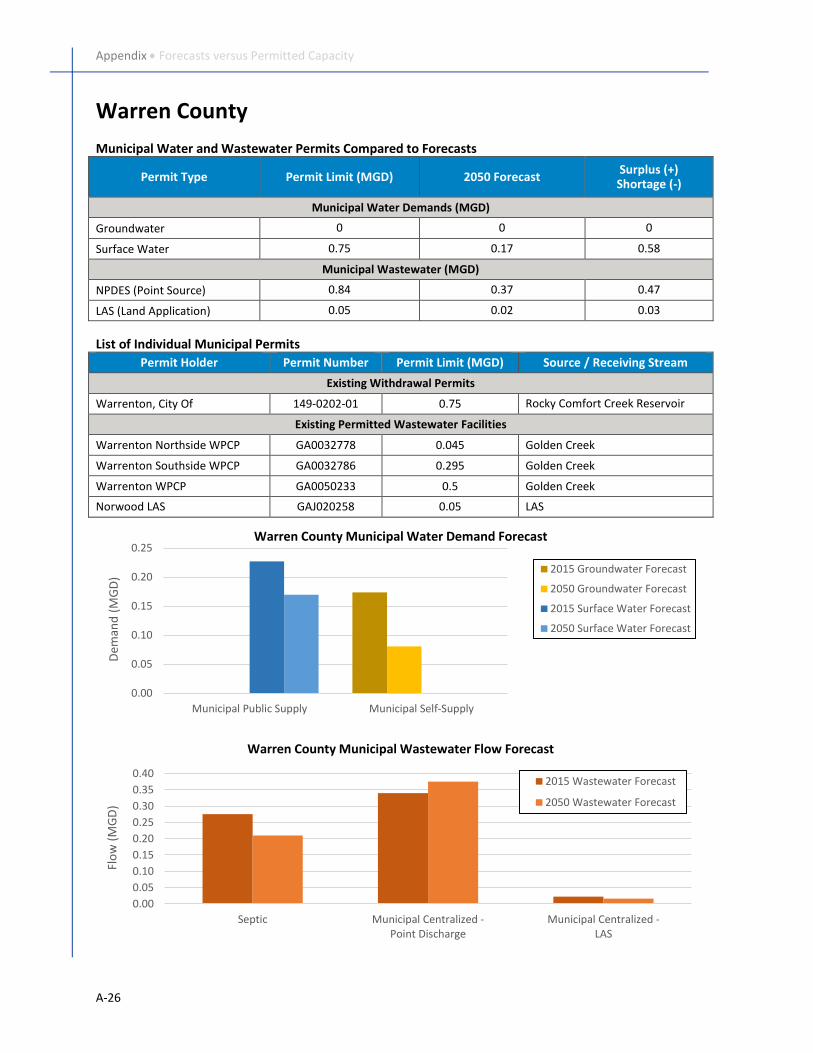
Warren County
Municipal Water and Wastewater Permits Compared to Forecasts
Permit Type Permit Limit (MGD) 2050 Forecast Surplus (+) Shortage (-)
Municipal Water Demands (MGD)
Groundwater 0 0 0
Surface Water 0.75 0.17 0.58
Municipal Wastewater (MGD)
NPDES (Point Source) 0.84 0.37 0.47
LAS (Land Application) 0.05 0.02 0.03
List of Individual Municipal Permits
Permit Holder Permit Number Permit Limit (MGD) Source / Receiving Stream
Existing Withdrawal Permits
Warrenton, City Of 149-0202-01 0.75 Rocky Comfort Creek Reservoir
Existing Permitted Wastewater Facilities
Warrenton Northside WPCP GA0032778 0.045 Golden Creek
Warrenton Southside WPCP GA0032786 0.295 Golden Creek
Warrenton WPCP GA0050233 0.5 Golden Creek
Norwood LAS GAJ020258 0.05 LAS
0.00
0.05
0.10
0.15
0.20
0.25
Municipal Public Supply Municipal Self-Supply
Dem
and
(M
GD
)
Warren County Municipal Water Demand Forecast
2015 Groundwater Forecast
2050 Groundwater Forecast
2015 Surface Water Forecast
2050 Surface Water Forecast
0.00
0.05
0.10
0.15
0.20
0.25
0.30
0.35
0.40
Septic Municipal Centralized -Point Discharge
Municipal Centralized -LAS
Flo
w (
MG
D)
Warren County Municipal Wastewater Flow Forecast
2015 Wastewater Forecast
2050 Wastewater Forecast
Appendix • Forecasts versus Permitted Capacity
A-27
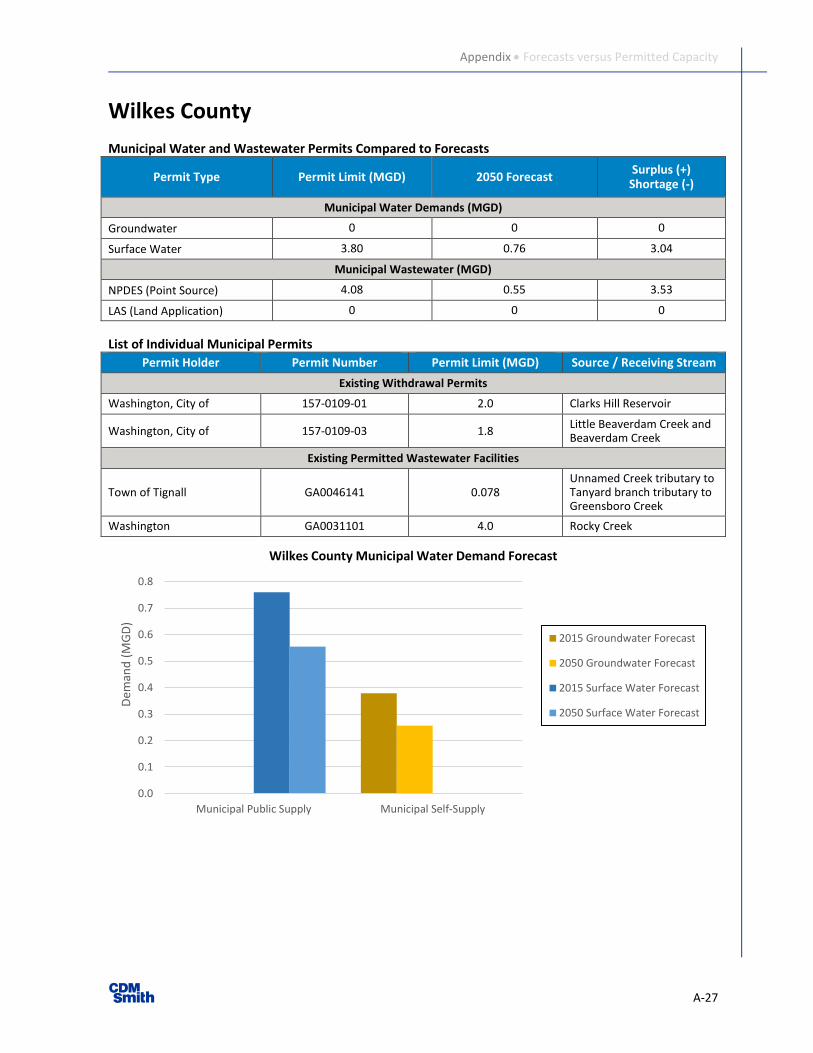
Wilkes County
Municipal Water and Wastewater Permits Compared to Forecasts
Permit Type Permit Limit (MGD) 2050 Forecast Surplus (+) Shortage (-)
Municipal Water Demands (MGD)
Groundwater 0 0 0
Surface Water 3.80 0.76 3.04
Municipal Wastewater (MGD)
NPDES (Point Source) 4.08 0.55 3.53
LAS (Land Application) 0 0 0
List of Individual Municipal Permits
Permit Holder Permit Number Permit Limit (MGD) Source / Receiving Stream
Existing Withdrawal Permits
Washington, City of 157-0109-01 2.0 Clarks Hill Reservoir
Washington, City of 157-0109-03 1.8 Little Beaverdam Creek and Beaverdam Creek
Existing Permitted Wastewater Facilities
Town of Tignall GA0046141 0.078 Unnamed Creek tributary to Tanyard branch tributary to Greensboro Creek
Washington GA0031101 4.0 Rocky Creek
0.0
0.1
0.2
0.3
0.4
0.5
0.6
0.7
0.8
Municipal Public Supply Municipal Self-Supply
Dem
and
(M
GD
)
Wilkes County Municipal Water Demand Forecast
2015 Groundwater Forecast
2050 Groundwater Forecast
2015 Surface Water Forecast
2050 Surface Water Forecast
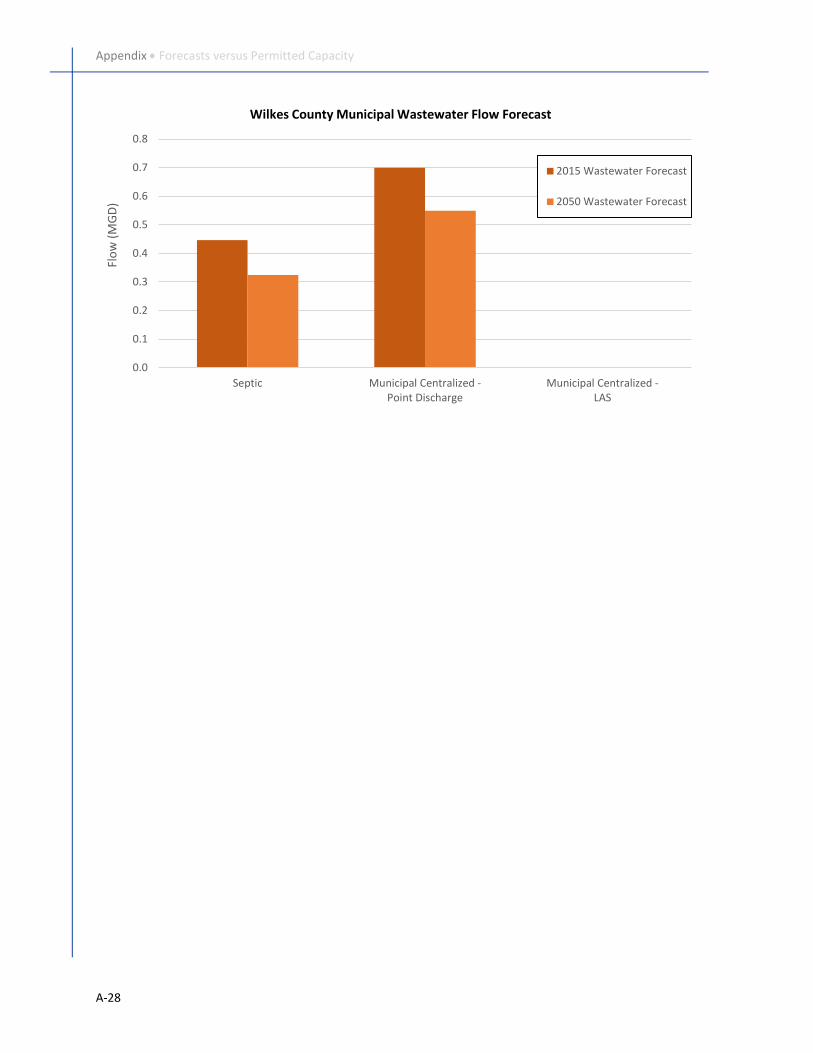
Appendix • Forecasts versus Permitted Capacity
A-28
0.0
0.1
0.2
0.3
0.4
0.5
0.6
0.7
0.8
Septic Municipal Centralized -Point Discharge
Municipal Centralized -LAS
Flo
w (
MG
D)
Wilkes County Municipal Wastewater Flow Forecast
2015 Wastewater Forecast
2050 Wastewater Forecast