Embed Size (px)
Citation preview
COVID-19 PANDEMIC
Observations on the Ongoing Recovery of the Aviation Industry
Report to Congressional Addressees
October 2021
GAO-22-104429
United States Government Accountability Office
United States Government Accountability Office
Highlights of GAO-22-104429, a report to congressional addressees
October 2021
COVID-19 PANDEMIC Observations on the Ongoing Recovery of the Aviation Industry
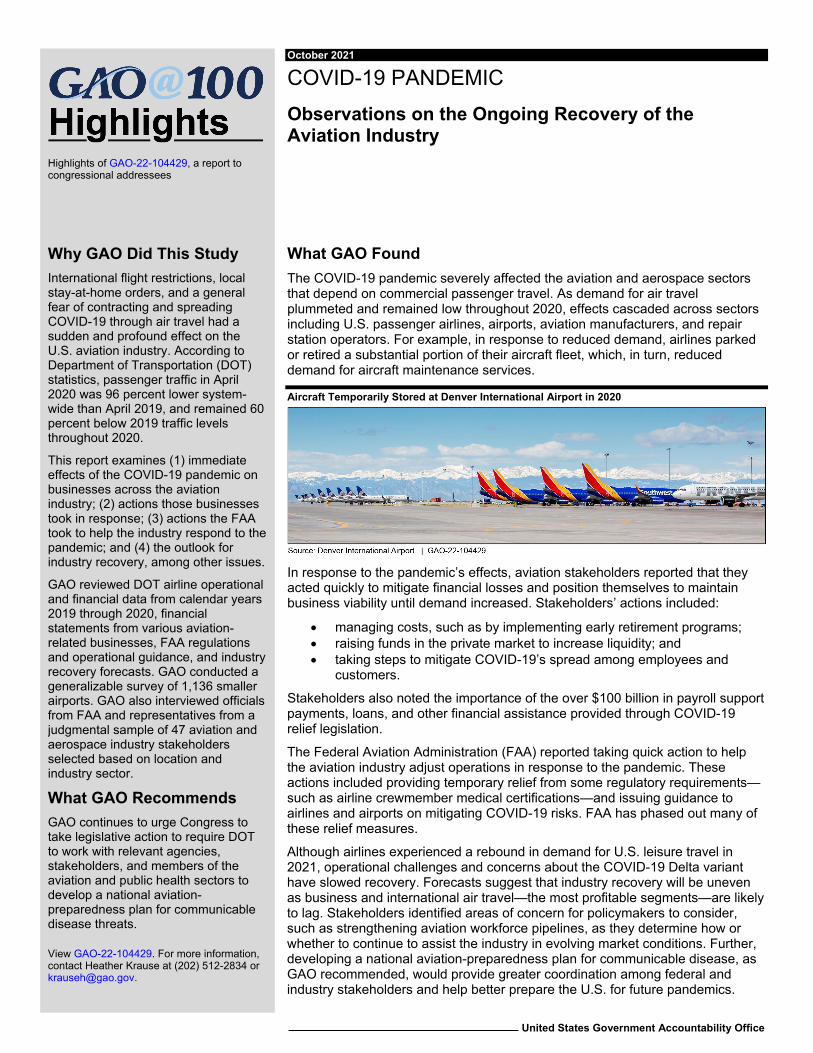
What GAO Found The COVID-19 pandemic severely affected the aviation and aerospace sectors that depend on commercial passenger travel. As demand for air travel plummeted and remained low throughout 2020, effects cascaded across sectors including U.S. passenger airlines, airports, aviation manufacturers, and repair station operators. For example, in response to reduced demand, airlines parked or retired a substantial portion of their aircraft fleet, which, in turn, reduced demand for aircraft maintenance services.
Aircraft Temporarily Stored at Denver International Airport in 2020
In response to the pandemic’s effects, aviation stakeholders reported that they acted quickly to mitigate financial losses and position themselves to maintain business viability until demand increased. Stakeholders’ actions included:
• managing costs, such as by implementing early retirement programs; • raising funds in the private market to increase liquidity; and • taking steps to mitigate COVID-19’s spread among employees and
customers.
Stakeholders also noted the importance of the over $100 billion in payroll support payments, loans, and other financial assistance provided through COVID-19 relief legislation.
The Federal Aviation Administration (FAA) reported taking quick action to help the aviation industry adjust operations in response to the pandemic. These actions included providing temporary relief from some regulatory requirements—such as airline crewmember medical certifications—and issuing guidance to airlines and airports on mitigating COVID-19 risks. FAA has phased out many of these relief measures.
Although airlines experienced a rebound in demand for U.S. leisure travel in 2021, operational challenges and concerns about the COVID-19 Delta variant have slowed recovery. Forecasts suggest that industry recovery will be uneven as business and international air travel—the most profitable segments—are likely to lag. Stakeholders identified areas of concern for policymakers to consider, such as strengthening aviation workforce pipelines, as they determine how or whether to continue to assist the industry in evolving market conditions. Further, developing a national aviation-preparedness plan for communicable disease, as GAO recommended, would provide greater coordination among federal and industry stakeholders and help better prepare the U.S. for future pandemics.
View GAO-22-104429. For more information, contact Heather Krause at (202) 512-2834 or [email protected].
Why GAO Did This Study International flight restrictions, local stay-at-home orders, and a general fear of contracting and spreading COVID-19 through air travel had a sudden and profound effect on the U.S. aviation industry. According to Department of Transportation (DOT) statistics, passenger traffic in April 2020 was 96 percent lower system-wide than April 2019, and remained 60 percent below 2019 traffic levels throughout 2020.
This report examines (1) immediate effects of the COVID-19 pandemic on businesses across the aviation industry; (2) actions those businesses took in response; (3) actions the FAA took to help the industry respond to the pandemic; and (4) the outlook for industry recovery, among other issues.
GAO reviewed DOT airline operational and financial data from calendar years 2019 through 2020, financial statements from various aviation-related businesses, FAA regulations and operational guidance, and industry recovery forecasts. GAO conducted a generalizable survey of 1,136 smaller airports. GAO also interviewed officials from FAA and representatives from a judgmental sample of 47 aviation and aerospace industry stakeholders selected based on location and industry sector.
What GAO Recommends GAO continues to urge Congress to take legislative action to require DOT to work with relevant agencies, stakeholders, and members of the aviation and public health sectors to develop a national aviation- preparedness plan for communicable disease threats.
Page i GAO-22-104429 COVID-19 Pandemic
Letter 1
Background 4 The COVID-19 Pandemic Had Disparate Effects on Selected
Aviation and Aerospace Sectors in 2020 12 Aviation and Aerospace Stakeholders Responded to the
Pandemic’s Effects by Taking a Variety of Actions to Maintain Business Viability 21
FAA Provided Airlines and Other Aviation Sectors Temporary Relief from Some Regulatory Requirements and Selected Stakeholders Said the Changes Were Helpful 36
The Extent of Industry Recovery Remains Uncertain and Stakeholders Identified Considerations for Potential Federal Support 41
Agency Comments 50
Appendix I Objectives, Scope, and Methodology 55
Appendix II Survey of Smaller Airports 63
Appendix III GAO Contact and Staff Acknowledgments 87
Tables
Table 1: Federal Aviation Administration (FAA) Pandemic Relief Actions, March 2020-July 2021 37
Table 2: Selected Aviation and Aerospace Industry Stakeholders GAO Interviewed 56
Table 3: Description of the Sample Frame, Stratification, and Sample Sizes for the Stratified Random Sample of Smaller Airports 59
Table 4. The Population Size and Distribution of Smaller Airports by Survey Strata 64
Contents
Page ii GAO-22-104429 COVID-19 Pandemic
Figures
Figure 1: Commercial Airport Categories for U.S. Airports 6 Figure 2: TSA-Screened Passengers, CDC-Reported COVID-19
Cases, and Selected Key Events during the COVID-19 Pandemic (January 2020 through March 2021) 11
Figure 3: U.S. Airline Passenger Traffic, Percentage Change 2019 versus 2020, by Type 13
Figure 4: Parked Aircraft Temporarily Stored at Denver International Airport 24
Figure 5: Sign at Hartsfield-Jackson Atlanta International Airport with COVID-19 Requirements and Reminders 35
Page iii GAO-22-104429 COVID-19 Pandemic
Abbreviations A4A Airlines for America AMTS Aviation Maintenance Technician School ARC Airlines Reporting Corporation ARSA Aeronautical Repair Station Association BLS Bureau of Labor Statistics BTS Bureau of Transportation Statistics CARES Coronavirus Aid, Relief, and Economic Security CDC Centers for Disease Control and Prevention COVID-19 Coronavirus Disease 2019 DHS Department of Homeland Security DOT Department of Transportation EAS Essential Air Service FAA Federal Aviation Administration FBO fixed base operator HHS Department of Health and Human Services NPIAS National Plan of Integrated Airport Systems OEM original equipment manufacturer PFC passenger facility charge PPP Paycheck Protection Program PSP Payroll Support Program SCASDP Small Community Air Service Development Program SEC Securities and Exchange Commission SFAR Special Federal Aviation Regulation Treasury Department of the Treasury TSA Transportation Security Administration UAS uncrewed aircraft systems
This is a work of the U.S. government and is not subject to copyright protection in the United States. The published product may be reproduced and distributed in its entirety without further permission from GAO. However, because this work may contain copyrighted images or other material, permission from the copyright holder may be necessary if you wish to reproduce this material separately.
Page 1 GAO-22-104429 COVID-19 Pandemic
441 G St. N.W. Washington, DC 20548
October 21, 2021
Congressional Addressees
The Coronavirus Disease 2019 (COVID-19) pandemic has resulted in catastrophic loss of life and substantial damage to the global economy. The global aviation industry was among those most severely affected. International flight restrictions, local stay-at-home orders, and a general fear of contracting and spreading COVID-19 through air travel had a sudden and profound effect on the global aviation industry, including passenger airlines, airports, and the entire ecosystem of businesses that supply, manufacture, and repair commercial and general aviation aircraft.
According to Bureau of Transportation Statistics (BTS) data, U.S. airline passenger traffic was down 60 percent system-wide in 2020 compared to 2019 traffic levels.1 The ripple effect from this unprecedented and sustained reduction in demand throughout 2020 has affected airline business models, employment, and the entire aviation supply chain.2 In response to the pandemic, the Coronavirus Aid, Relief, and Economic Security (CARES) Act and subsequent COVID-19 relief laws appropriated over $100 billion to provide financial assistance to the U.S. aviation industry and its workers.3
You asked us to conduct a broad review to gather input from a wide range of stakeholders, including airlines, airports, aviation labor, general aviation users, commercial space companies and others, on several key
1BTS is the Department of Transportation’s source for commercial aviation, multimodal freight activity, and transportation economics.
2For example, according to the Bureau of Labor Statistics (BLS), as of April 2021—the most recent data available—an estimated 136,400 jobs in the air transportation and support activities sectors—approximately 22 percent—have been lost since peak employment levels of 755,400 in February 2020, although employment has risen roughly 7 percent since October 2020. According to BLS, the air transportation sector includes scheduled air carriers that fly regular routes on regular schedules and operate even if flights are only partially loaded, and non-scheduled carriers that provide chartered air transportation of passengers, cargo, or specialty flying services and often operate at nonpeak time slots at busy airports. Among other things, the support activities for air transportation sector includes airport operations and air traffic control.
3CARES Act, Pub. L. No. 116-136, §§ 4003, 4112, 134 Stat. 281, 470, 498 (2020); Consolidated Appropriations Act, 2021, Pub. L. No. 116-260, div. N, tit. IV, 134 Stat. 1182, 2052-61 (2020); American Rescue Plan Act of 2021, Pub. L. No. 117-2, § 7301, 135 Stat. 4, 104-107.
Letter
Page 2 GAO-22-104429 COVID-19 Pandemic
issues related to the industry and federal response to the COVID-19 pandemic, including:
• the effects of the COVID-19 pandemic on selected aviation and aerospace industry sectors in 2020;
• actions selected aviation and aerospace stakeholders took in response to the pandemic;
• actions taken by the Federal Aviation Administration to help the aviation industry respond to the pandemic, and selected aviation stakeholders’ perspectives on those actions; and
• the outlook for aviation industry recovery, and stakeholder considerations for potential federal support in assisting the aviation industry in the future.
To identify the effects of the pandemic on selected aviation industry sectors and their respective responses to the pandemic, we analyzed the Department of Transportation’s (DOT) Form 41 financial and operational data for calendar years 2019 and 2020. We determined that these data were sufficiently reliable for the purposes of our reporting objectives by reviewing the quality control procedures used by DOT. We also analyzed financial statements reported to the Securities and Exchange Commission (SEC) by publicly-traded airlines and other aviation-related businesses from the first quarter through the fourth quarter of 2020 to obtain quantitative information on their financial performance, as well as qualitative descriptions of the impact of the pandemic on businesses and actions those businesses took in response.4 We reported on the immediate effects of the pandemic based on the expectation that other effects will be long-term. We conducted interviews with a judgmental sample of 47 aviation and aerospace industry stakeholders—including passenger airlines, cargo airlines, large and medium hub airports, and aviation manufacturers—on the effects of the COVID-19 pandemic on
4The four quarters cover the 12 months of calendar year 2020.
Page 3 GAO-22-104429 COVID-19 Pandemic
selected aviation and aerospace industry sectors and actions stakeholders took in response.5
We also conducted a generalizable, web-based survey of smaller airports— including small hub, non-hub, non-primary commercial service, general aviation, and reliever airports—to identify the effects of the pandemic on these airports and actions they took in response.6 The survey response rate was 72 percent.7 Estimates generated from these survey results are generalizable to the target population of 2,752 smaller airports in the continental U.S.8
To identify the actions the Federal Aviation Administration (FAA) took to help the aviation industry respond to the pandemic, we reviewed requests for regulatory relief submitted to FAA by aviation stakeholders and FAA’s
5We selected aviation and aerospace industry stakeholders to represent a cross-section of sectors within the aviation and aerospace industries as well as based on geographic representation. The stakeholders we selected include an analytics and engineering firm; 9 industry associations; 2 aviation labor organizations; 6 passenger airlines; 3 cargo airlines; 5 aviation manufacturers; 3 repair station operators; 11 large and medium hub airports; 2 commercial space launch providers; 3 credit rating agencies, and 2 aviation industry analysts.
6We conducted the survey from November 16 through December 11, 2020. We used a sampling frame of 2,752 airports (64 small hub, 209 non-hub, 63 non-primary commercial service, and 2,416 general aviation and reliever airports). Large and medium hub airports, non-primary airports with an unclassified role, airports outside of the continental U.S., and proposed airports were excluded from the sample frame. Small hub airports are those that account for at least 0.05 but less than 0.25 percent of annual passenger enplanements; non-hub airports are those that account for less than 0.05 percent of passenger enplanements but have more than 10,000 enplanements annually; non-primary commercial service airports have at least 2,500 and no more than 10,000 annual enplanements.
7This is the unweighted response rate. The weighted response rate was 65 percent. Following best practices in survey research and in Office of Management and Budget, Standards and Guidelines for Statistical Surveys (September 2006), we carried out a nonresponse bias analysis. The nonresponse bias analysis and subsequent weighted adjustments only included variables available on the National Plan of Integrated Airport Systems (NPIAS) sample frame and did not account for unobserved variables that could potentially be related to the likelihood of response. However, based on our knowledge of aviation operations, we did not expect survey responses or the likelihood of response to vary by other airport characteristics. Based on this nonresponse bias analysis and resulting nonresponse-adjusted analysis weights, we determined that estimates using these weights are generalizable to the population of smaller airports and are sufficiently reliable for the purposes of our reporting objectives.
8Unless otherwise noted, all estimates from this survey have a margin of error of plus or minus 10 percentage points or less, at the 95 percent confidence level.
Page 4 GAO-22-104429 COVID-19 Pandemic
related rulemakings, exemptions, and extensions, as well as operational guidance. We interviewed officials from FAA divisions responsible for implementing these actions as well as those of the 47 aviation and aerospace stakeholders selected whose operations were potentially affected by these actions.
To describe the outlook for aviation industry recovery and considerations for the federal role in assisting the aviation industry, we reviewed forecasts published by aviation industry stakeholders, including aviation-related businesses, consulting firms, and credit rating agencies, and synthesized their findings. We also interviewed the 47 aviation and aerospace industry stakeholders described above to obtain their perspectives on considerations for federal assistance, and reviewed our prior work on civil aviation and on federal assistance to the private sector.9 See appendix I for additional details on our objectives, scope, and methodology, including a list of stakeholders interviewed.
We conducted this performance audit from July 2020 to October 2021 in accordance with generally accepted government auditing standards. Those standards require that we plan and perform the audit to obtain sufficient, appropriate evidence to provide a reasonable basis for our findings and conclusions based on our audit objectives. We believe that the evidence obtained provides a reasonable basis for our findings and conclusions based on our audit objectives.
The U.S. civil aviation and aerospace industries are vital contributors to the domestic and global economies. Airlines generate billions of dollars in revenue annually and contribute to the economic health of the nation. These industries are a complex and dynamic ecosystem that includes, among many other entities, passenger airlines that provide scheduled and non-scheduled service, cargo airlines, airports, aviation
9See, for example, GAO, Sustained Federal Action is Crucial as Pandemic Enters Its Second Year, GAO-21-387 (Washington, D.C.: Mar. 31, 2021), and GAO, Financial Assistance: Lessons Learned from CARES Act Loan Program for Aviation and Other Eligible Businesses, GAO-21-198 (Washington, D.C.: Dec. 10, 2020).
Background Civil Aviation and Aerospace Sectors
Page 5 GAO-22-104429 COVID-19 Pandemic
manufacturers of airplanes and engines, businesses that provide aircraft maintenance services, and the commercial space industry.10
Passenger Airlines
Airlines that provide scheduled commercial passenger service are often grouped into categories including network, low-cost, and regional airlines. Most network airlines operate complex hub-and-spoke operations with thousands of employees and hundreds of aircraft. These airlines provide service at various levels to a wide variety of domestic and international destinations. Low-cost airlines tend to operate less costly point-to-point service mostly to domestic airports using fewer types of aircraft. Regional airlines operate smaller aircraft, turboprops, or regional jets with up to 100 seats, and generally provide service to smaller communities under capacity purchase agreements with network airlines.11 Some regional airlines are owned by a network airline, while others are independent. Airlines that provide scheduled commercial passenger service may also carry cargo—called “belly cargo”—in any excess space on the lower decks of their aircraft. Other aircraft operators provide unscheduled, charter, and on-demand passenger service and include air taxis and business jets.12
Since the airline industry was deregulated in 1978, its earnings have been volatile.13 Notably, the demand for air travel tends to fluctuate in relation to the state of the economy as well as to political, international, and health-related events. For example, in the last 20 years, global air travel demand has been disrupted by events including 9/11, the SARS outbreak of 2002-03, and the 2008 global financial crisis. However, airlines
10Other entities within the industry include businesses that supply various resources to airlines, including catering companies and fuel suppliers; airport tenants such as rental car companies, parking operators, and gift and retail concessionaires; smaller businesses in the aviation manufacturing supply chain, including parts and component suppliers; and business involved in the manufacture and operation of drones.
11Under a capacity purchase agreement, network airlines contract with regional airlines to provide air service beyond the network airline’s own route structure to increase their capacity and revenue. Agreement terms vary, but network airlines generally take on all commercial functions, such as brand marketing, flight scheduling, and ticket pricing, while the regional airlines are responsible for the aircraft and crews to operate the flights and provide ground and flight operations.
12See 14 C.F.R. pt. 135.
13Airline Deregulation Act of 1978, Pub. L. No. 95–504, 92 Stat. 1705.
Page 6 GAO-22-104429 COVID-19 Pandemic
experienced a period of sustained profitability from 2010 to 2019 based in part on the strength of the overall economy, consolidation among airlines, and industry’s greater ability to align supply with levels of demand.
Airports
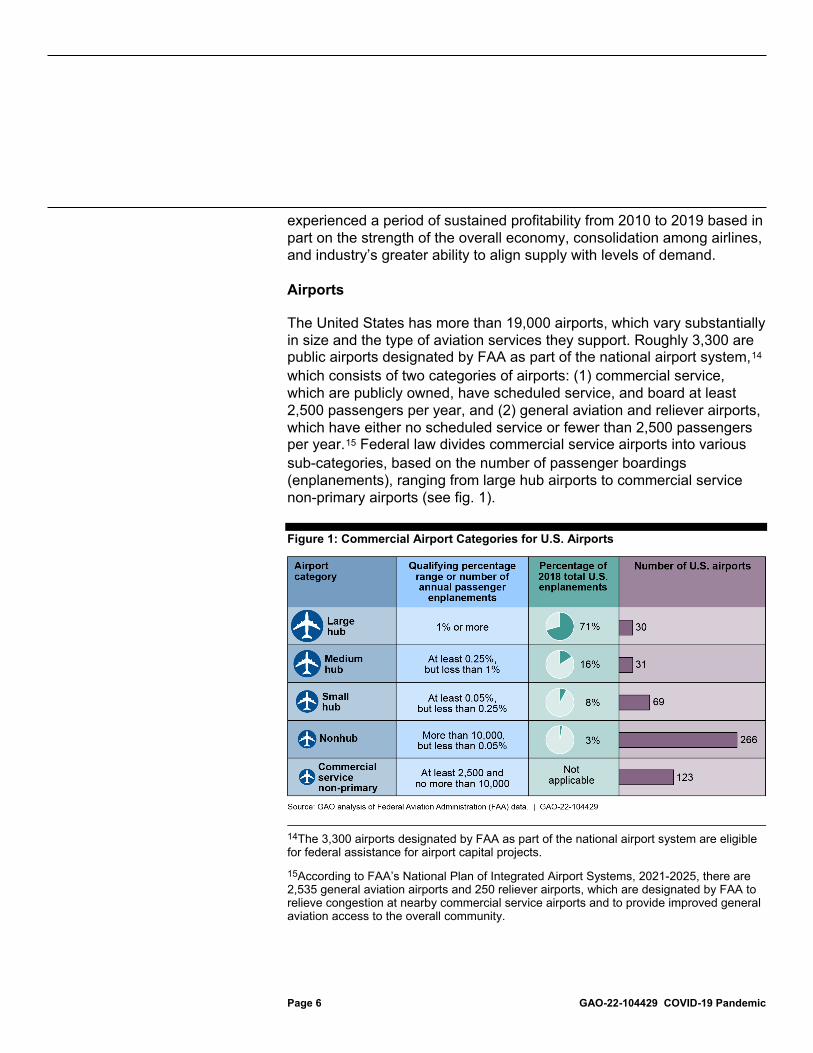
The United States has more than 19,000 airports, which vary substantially in size and the type of aviation services they support. Roughly 3,300 are public airports designated by FAA as part of the national airport system,14 which consists of two categories of airports: (1) commercial service, which are publicly owned, have scheduled service, and board at least 2,500 passengers per year, and (2) general aviation and reliever airports, which have either no scheduled service or fewer than 2,500 passengers per year.15 Federal law divides commercial service airports into various sub-categories, based on the number of passenger boardings (enplanements), ranging from large hub airports to commercial service non-primary airports (see fig. 1).
Figure 1: Commercial Airport Categories for U.S. Airports
14The 3,300 airports designated by FAA as part of the national airport system are eligible for federal assistance for airport capital projects.
15According to FAA’s National Plan of Integrated Airport Systems, 2021-2025, there are 2,535 general aviation airports and 250 reliever airports, which are designated by FAA to relieve congestion at nearby commercial service airports and to provide improved general aviation access to the overall community.
Page 7 GAO-22-104429 COVID-19 Pandemic
Note: Primary commercial service airports are grouped into four hub categories. 49 U.S.C. §§ 47102(11), (13), (14), (25).
Commercial service airports collect the bulk of their revenues from two general groups of users: aeronautical users, such as passenger airlines, and non-aeronautical concessionaires, including car rental agencies, parking lots, restaurants, gift shops, and other small vendors. The airports provide these users with a wide range of facilities and services for which they assess fees, rents, or other charges.
Other sectors within the aviation and aerospace industries include:
• Cargo airlines: This sector includes airlines that operate aircraft configured specifically for carrying cargo. Compared to passenger aircraft that carry some belly cargo, dedicated cargo aircraft can carry more varied types of cargo, such as items that are large or unusually shaped, hazardous material, and livestock and other animals.
• General aviation: According to FAA, “general aviation” describes a diverse range of aviation activities and includes all segments of the aviation industry except commercial aviation and the military.16 General aviation activities include training of new pilots and pilots interested in additional ratings or certification, sightseeing, movement of large heavy loads by helicopter, flying for personal or business/corporate reasons, and emergency medical services. General aviation aircraft range from the one-seat single-engine piston aircraft to the long-range corporate jet, and also include gliders and amateur-built aircraft.
• Manufacturers: Airlines purchase commercial aircraft, jet engines, components, and other systems for the global aviation and aerospace industry from an array of manufacturers and related suppliers.
• Repair station operators: Three basic types of organizations perform aircraft maintenance for U.S. airlines: (1) airlines’ in-house maintenance facilities; (2) original equipment manufacturers (OEMs) that offer maintenance capabilities for the aircraft parts they manufacture; and (3) independent repair stations (i.e., not owned or affiliated in whole or part by airlines or OEMs). Aircraft maintenance
16FAA, FAA Aerospace Forecasts, Fiscal Years 2003-2014.
Page 8 GAO-22-104429 COVID-19 Pandemic
services include line maintenance, airframe heavy maintenance, engine repair and overhaul, and component maintenance.17
• Uncrewed aircraft systems: Uncrewed aircraft systems (UAS), or drones, have the potential to provide significant social and economic benefits in the United States, including by delivering packages, helping to fight fires, and distributing medical supplies at hospitals, as well as through military uses, such as intelligence, surveillance, and reconnaissance.18
• Commercial space transportation: Space transportation is the movement of objects, such as satellites and vehicles carrying cargo, scientific payloads, or passengers, to or from space. In the United States, commercial space transportation is carried out by private companies using orbital and suborbital launch vehicles, which they own and operate.
In response to the public health and economic crises, COVID-19 relief laws have provided more than $100 billion in assistance for aviation businesses and airports since March 2020, and depending on the program, required recipients to temporarily maintain employment levels or
17Line maintenance entails light, regular maintenance checks carried out to ensure that an aircraft is fit for flight. Airframe heavy maintenance involves regularly scheduled inspection, maintenance, preventive maintenance, and alteration that will take aircraft out of service for a pre-determined time at specified intervals. Engine repair and overhaul includes disassembling, inspecting, repairing, or replacing engine parts, followed by reassembling and testing. Component maintenance is the repair and overhaul of components that provide the basic functionality for flight. For more information, see GAO, Aviation Safety: FAA’s Risk-Based Oversight for Repair Stations Could Benefit from Additional Airline Data and Performance Metrics, GAO-16-679 (Washington, D.C.: July 28, 2016).
18We did not include UAS in the scope of our audit work. In ongoing work, we are examining related issues including, among others, the status of FAA’s efforts to integrate UAS into the National Airspace System, federal actions to address the malicious use of UAS in the airport environment, and workforce considerations for the use of UAS in transporting passengers and cargo, or Advanced Air Mobility.
Federal Assistance to the Aviation Industry during the COVID-19 Pandemic
Page 9 GAO-22-104429 COVID-19 Pandemic
refrain from conducting involuntary furloughs, among other requirements.19 This assistance has included:
• Up to $63 billion in financial assistance to be used exclusively for the continuation of payment of employee wages, salaries, and benefits for eligible applicants including passenger airlines, cargo airlines, and certain aviation contractors;
• Up to $29 billion for loans and loan guarantees to provide liquidity to passenger airlines, cargo airlines, repair stations, and ticket agents;20
• $20 billion in airport grants to support U.S. airports of all sizes and certain tenants experiencing severe economic disruption caused by the COVID-19 pandemic;21
• $3 billion to establish an Aviation Manufacturing Jobs Protection program to provide payroll support payments to eligible businesses exclusively for the continuation of employee wages, salaries, and benefits, and to facilitate the retention, rehire, or recall of employees of the employer;22 and
19GAO, COVID-19: Opportunities to Improve Federal Response and Recover Efforts, GAO-20-625 (Washington, D.C.: June 25, 2020). Conditions of the three financial assistance programs include prohibitions against involuntary layoffs or furloughs. Some airlines took action to offer early retirement. In addition, through attrition and hiring freezes, airlines were able to reduce headcount. As authorized by the CARES Act and the Consolidated Appropriations Act, 2021, DOT required scheduled passenger airlines receiving financial assistance to maintain minimum scheduled passenger service to points in the United States served prior to the pandemic, with some exceptions. Pub. L. No. 116-136, §§ 4005, 4114(b), 134 Stat. at 477, 499; Pub. L. No. 116-260, § 407, 134 Stat. at 2058-59.
20CARES Act, § 4003, 134 Stat. at 470. Section 4003 also included up to $17 billion for businesses critical to maintaining national security.
21Under the Consolidated Appropriations Act, 2021 and the American Rescue Plan Act of 2021, certain amounts were made available to provide relief from rent and minimum annual guarantees to airport concessions. 134 Stat. at 1939-40; § 7102, 135 Stat. at 96-98. The CARES Act gives the FAA the authority to retain up to 0.1 percent of the $10 billion (equaling up to $10 million) provided for Grants-in-Aid for Airports to fund the award and oversight by FAA of grants made under the CARES Act. Pub. L. No. 116-136, 134 Stat. at 596-597.
22Under the American Rescue Plan Act of 2021, DOT may use up to 1 percent of the funds appropriated ($30 million) for implementation costs and administrative expenses. Pub. L. No. 117-2 § 7202(a), 135 Stat. at 103.
Page 10 GAO-22-104429 COVID-19 Pandemic
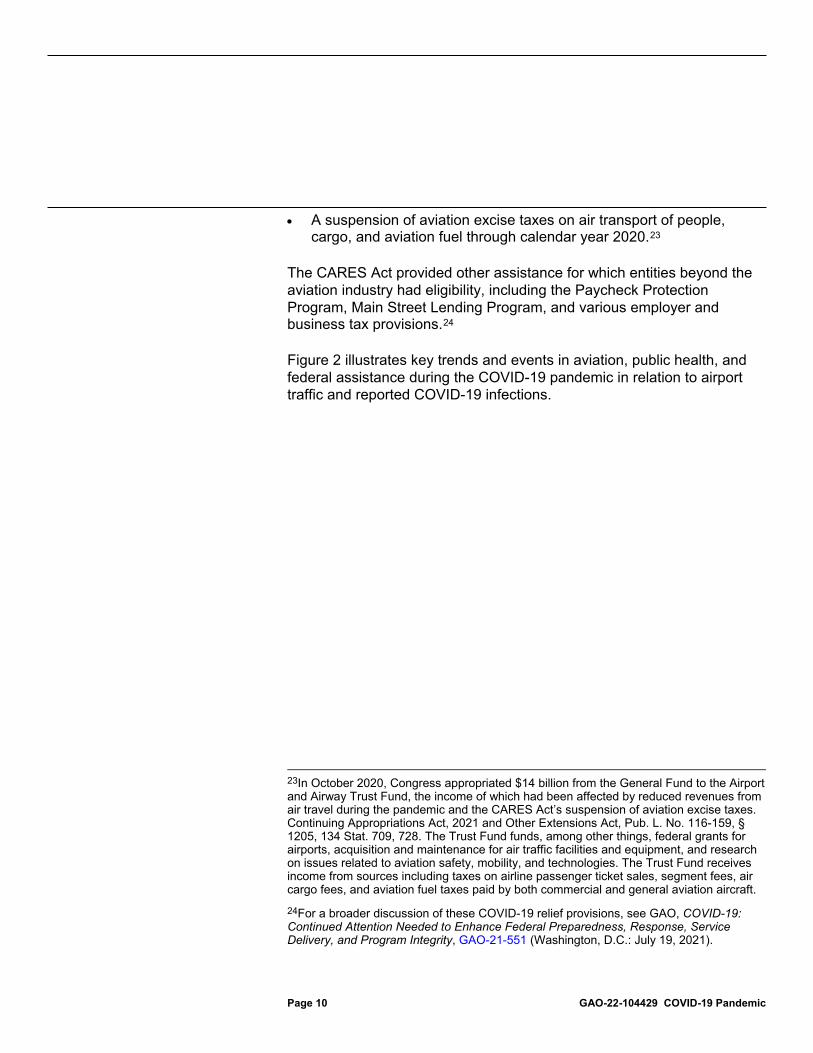
• A suspension of aviation excise taxes on air transport of people, cargo, and aviation fuel through calendar year 2020.23
The CARES Act provided other assistance for which entities beyond the aviation industry had eligibility, including the Paycheck Protection Program, Main Street Lending Program, and various employer and business tax provisions.24
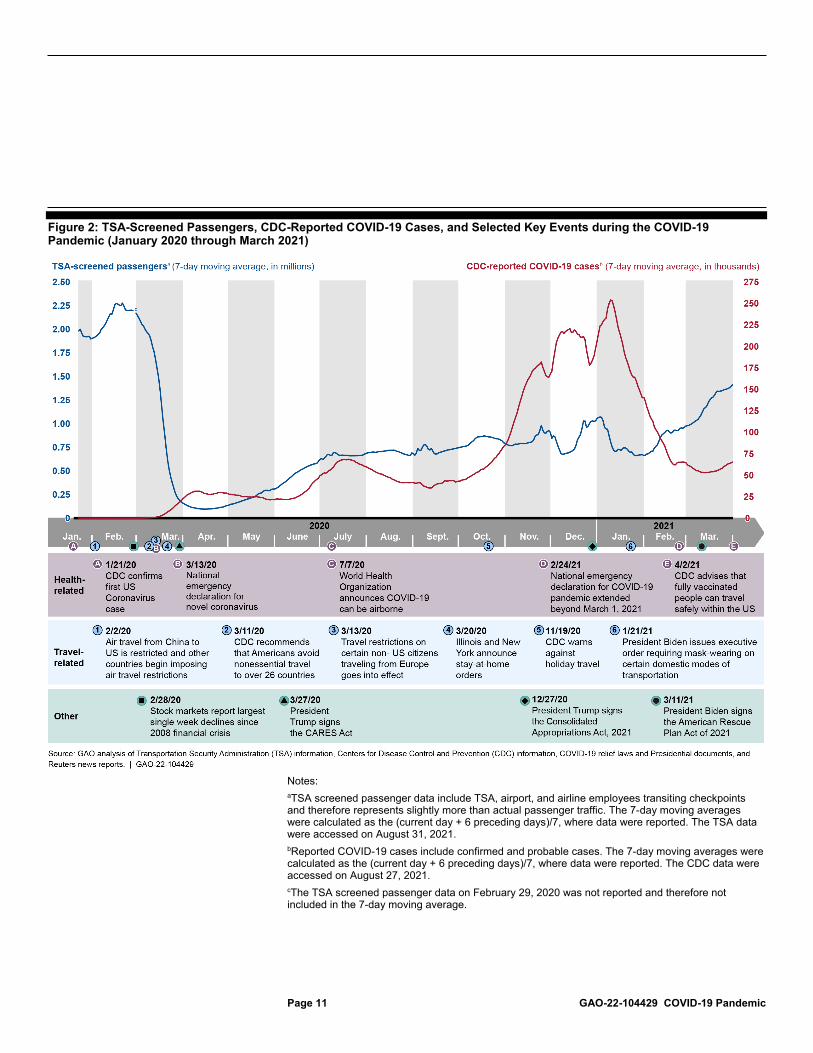
Figure 2 illustrates key trends and events in aviation, public health, and federal assistance during the COVID-19 pandemic in relation to airport traffic and reported COVID-19 infections.
23In October 2020, Congress appropriated $14 billion from the General Fund to the Airport and Airway Trust Fund, the income of which had been affected by reduced revenues from air travel during the pandemic and the CARES Act’s suspension of aviation excise taxes. Continuing Appropriations Act, 2021 and Other Extensions Act, Pub. L. No. 116-159, § 1205, 134 Stat. 709, 728. The Trust Fund funds, among other things, federal grants for airports, acquisition and maintenance for air traffic facilities and equipment, and research on issues related to aviation safety, mobility, and technologies. The Trust Fund receives income from sources including taxes on airline passenger ticket sales, segment fees, air cargo fees, and aviation fuel taxes paid by both commercial and general aviation aircraft.
24For a broader discussion of these COVID-19 relief provisions, see GAO, COVID-19: Continued Attention Needed to Enhance Federal Preparedness, Response, Service Delivery, and Program Integrity, GAO-21-551 (Washington, D.C.: July 19, 2021).
Page 11 GAO-22-104429 COVID-19 Pandemic
Figure 2: TSA-Screened Passengers, CDC-Reported COVID-19 Cases, and Selected Key Events during the COVID-19 Pandemic (January 2020 through March 2021)
Notes: aTSA screened passenger data include TSA, airport, and airline employees transiting checkpoints and therefore represents slightly more than actual passenger traffic. The 7-day moving averages were calculated as the (current day + 6 preceding days)/7, where data were reported. The TSA data were accessed on August 31, 2021. bReported COVID-19 cases include confirmed and probable cases. The 7-day moving averages were calculated as the (current day + 6 preceding days)/7, where data were reported. The CDC data were accessed on August 27, 2021. cThe TSA screened passenger data on February 29, 2020 was not reported and therefore not included in the 7-day moving average.
Page 12 GAO-22-104429 COVID-19 Pandemic
The COVID-19 pandemic had disparate effects on selected aviation and aerospace sectors in 2020, most severely affecting the sectors that are dependent on commercial passenger activity. The dramatic drop in demand for passenger air travel had a cascading effect across commercial aviation sectors, including passenger airlines, airports, aviation manufacturers, and repair station operators. However, other aviation and aerospace sectors that are less reliant on passenger activity, such as cargo airlines, business aviation, and the commercial space transportation industry, experienced less of a reduction—and in some cases an increase—in demand for their services.
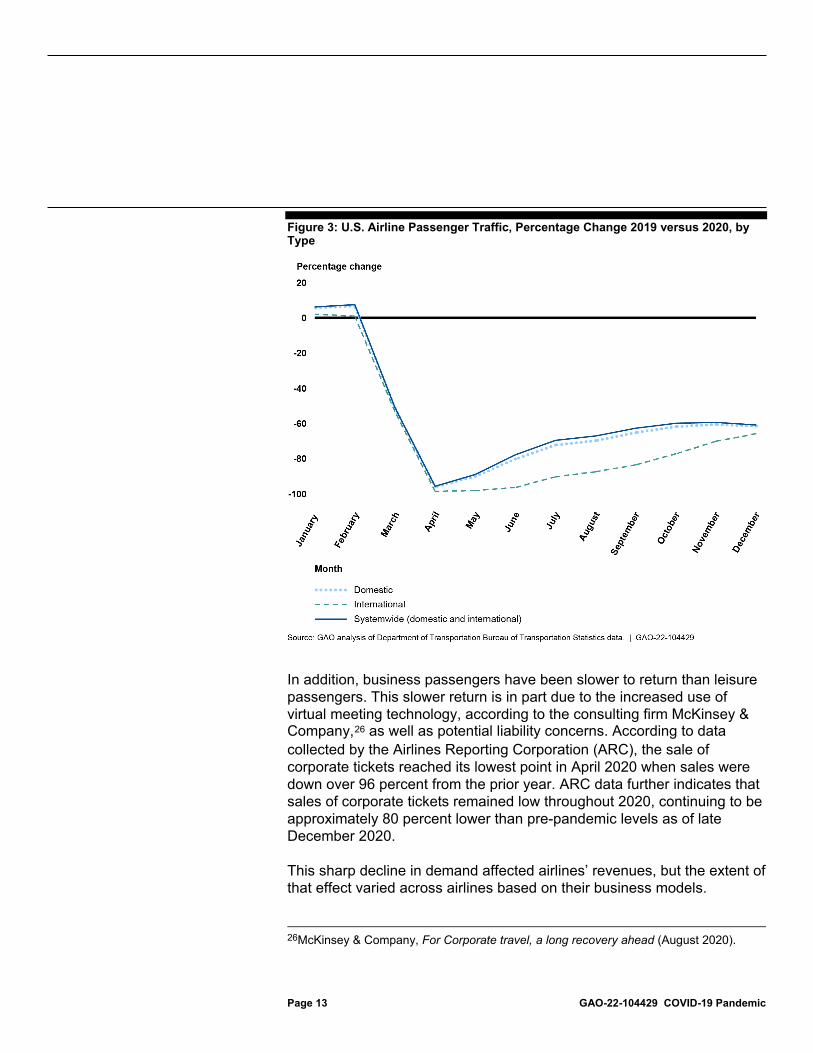
U.S. passenger airlines experienced an unprecedented reduction in the demand for air travel in 2020 as a result of the COVID-19 pandemic. According to Bureau of Transportation Statistics (BTS) data, annual airline passenger traffic was down 60 percent system-wide in 2020 compared to annual traffic levels in 2019. Passenger traffic reached the lowest levels in April 2020, when traffic fell to 3 million passengers, a 96 percent decrease compared to the previous April. As the industry group Airlines for America (A4A) testified to Congress, such low traffic levels had not been seen since the 1950s.25
Passenger traffic has slowly returned since the trough in demand in April 2020, with the return of domestic traffic outpacing the return of international traffic (see figure 3). Annual international air traffic was over 70 percent lower in 2020 compared to 2019 and accounted for 9 percent of all U.S. passenger air traffic, compared to 12 percent in 2019.
25Prepare for Takeoff: America’s Safe Return to Air Travel, Hearing on SR-253, Before the U.S. Senate Committee on Commerce, Science, and Transportation Subcommittee on Aviation Safety, Operations, and Innovation, 117th Cong. (2021) (statement of Nick Calio, President and CEO, Airlines for America).
The COVID-19 Pandemic Had Disparate Effects on Selected Aviation and Aerospace Sectors in 2020
The Dramatic Drop in Demand for Passenger Air Travel in 2020 Had Cascading Effects across Commercial Aviation Sectors
Passenger Airlines Experienced Unprecedented Reduction in Demand for Air Travel
Page 13 GAO-22-104429 COVID-19 Pandemic
Figure 3: U.S. Airline Passenger Traffic, Percentage Change 2019 versus 2020, by Type
In addition, business passengers have been slower to return than leisure passengers. This slower return is in part due to the increased use of virtual meeting technology, according to the consulting firm McKinsey & Company,26 as well as potential liability concerns. According to data collected by the Airlines Reporting Corporation (ARC), the sale of corporate tickets reached its lowest point in April 2020 when sales were down over 96 percent from the prior year. ARC data further indicates that sales of corporate tickets remained low throughout 2020, continuing to be approximately 80 percent lower than pre-pandemic levels as of late December 2020.
This sharp decline in demand affected airlines’ revenues, but the extent of that effect varied across airlines based on their business models.
26McKinsey & Company, For Corporate travel, a long recovery ahead (August 2020).
Page 14 GAO-22-104429 COVID-19 Pandemic
• Network airlines: The long period of reduced business and international passenger traffic has particularly affected the revenues of network airlines, which typically generate a large portion of their revenues from such travelers. According to the credit rating agency Moody’s, large U.S. network airlines generate at least one third of their revenue from business travelers, despite the fact that business travelers make up only about 12 percent of global passengers.27 Based on BTS data, Delta Air Lines, American Airlines, and United Airlines—the top three major U.S. network airlines based on 2019 operating revenues—experienced a 94 percent decline in passenger revenues in the second quarter of 2020 compared to the second quarter of 2019.28 By the fourth quarter of 2020, the three network airlines’ passenger revenues remained down 76 percent. While the decline in revenues was largely due to the decline in passengers, fare reductions also had an effect. For example, selected network airlines reduced their gross average fare by 19 percent in 2020 compared to 2019, in part to attract passenger traffic.29 For the majority of the year, these airlines were experiencing negative cash flow or “cash burn,” whereby they needed to use cash reserves to fund their daily operations. For example, United Airlines reported that it spent $40 million more per day than it earned in revenue in the second quarter of 2020.
• Low-cost airlines: Low-cost airlines’ business models rely largely on customers flying domestically for leisure travel at generally lower airfares than those charged by network airlines. These airlines experienced a faster return of their passenger traffic, and in turn their revenues, than network airlines. For example, according to BTS data, six selected low-cost airlines experienced an 87 percent decline in passenger revenues in the second quarter of 2020 compared to 2019.30 By the fourth quarter of 2020, the low-cost airlines’ passenger revenues were down only 67 percent compared to the same quarter in the prior year. Like network airlines, low-cost airlines’ revenues were
27Moody’s Investors Service, Business Travel Faces Higher Substitution Risk post-COVID, but Airlines will Adapt (Mar. 24, 2021).
28Passenger revenue is revenue received by the airline from the carriage of passengers in scheduled operations.
29Gross fare was calculated using U.S. DOT Origin & Destination summary data, which sources from a 10% sample of all U.S. airline tickets.
30Based on BTS 2019 airline rankings of the top 21 airlines by operating revenue, we included Allegiant Air, Frontier Airlines, JetBlue Airways, Southwest Airlines, Spirit Airlines, and Sun Country Airlines in our analysis of low-cost airlines.
Page 15 GAO-22-104429 COVID-19 Pandemic
also affected by their fare reductions. Selected low-cost airlines reduced their average gross fare by 21 percent in 2020 compared to 2019. Low-cost airlines also experienced negative cash flow, but recovered faster than the network airlines. For example, Spirit Airlines reported that it spent approximately $9.5 million more per day than it earned in revenue in April 2020, but in the fourth quarter—October through December—of 2020 it reduced that daily average negative cash flow to $1.8 million.
• Regional airlines: Regional airlines, whose business models rely on contracts with their network airline partners, experienced mixed impacts from the pandemic. Four regional airlines ceased operation in 2020; however, certain remaining regional airlines were profitable in 2020 due to the nature of their existing contracts with their network airline partners. For example, representatives from one regional airline we interviewed credited their profitability in 2020 in part to the fact that their business is based primarily on what are called “capacity purchase agreements.” Under these agreements, network airline partners contract with regional airlines to provide service on regional routes, and in exchange, the network airlines generally pay a variety of the regional airlines’ costs, including, for example, a guaranteed monthly fee and payment for the regional airlines’ hours in service and certain other flight costs such as fuel. Additionally, representatives from another regional airline told us that in some cases, they flew flights on routes on which their network airline partners previously flew larger jets, as their network airline partners responded to decreased demand by flying smaller, less expensive regional aircraft on certain routes instead of mostly empty, larger jets.
U.S. airports experienced a significant reduction in passenger traffic as a result of the pandemic, although the extent of this reduction varied depending on the type of travelers an airport typically serves. Large airports that serve business and international travelers—such as JFK International Airport and Boston Logan International Airport—experienced a greater and more sustained decline in passenger traffic compared to airports that are in leisure destinations. For example, according to data from A4A, traveler throughput in New York and Massachusetts was down more than 75 percent in November 2020 compared to November 2019, while Florida and Arizona—which are popular U.S. leisure travel destinations—experienced declines of approximately 50 percent over the same period.
Based on our interviews with large and medium hub airport representatives and our survey of smaller airports, we found that airports
Airport Revenues Declined as a Result of Reduced Demand for Air Travel
Page 16 GAO-22-104429 COVID-19 Pandemic
of all sizes experienced a decline in both aeronautical31 and non-aeronautical operating revenues as a result of the COVID-19 pandemic.32 Specifically, representatives from the large and medium hub airports we interviewed reported that their revenue losses were tied to decreases in the various forms of passenger-driven operating revenues they collect. For example, representatives at one large hub airport told us that relative to 2019 levels, aeronautical operating revenue collected from landing fees paid by airlines at their airport was down approximately 60 percent in April 2020 and down 30 percent in September 2020. Furthermore, representatives from some of these airports told us that passenger-driven sources of non-aeronautical revenues such as concessions and parking had dropped 35 percent or more in 2020 compared to 2019.
Similarly, based on the smaller airports we surveyed, we estimate that small hub and non-hub airports experienced greater percentage declines in revenues than non-primary commercial service or general aviation and reliever airports,33 a reflection of the small- and non-hub airports’ heavier
31The estimated percentage (lower bound, upper bound) of airports reporting a decline in aeronautical revenue between September 2019 and September 2020 was 85 (73, 93) percent for small hub airports, 92 (87, 96) percent for non-hub airports, 69 (56, 80) percent for non-primary commercial service airports, and 54 (50, 58) percent for general aviation and reliever airports. The margins of error between the estimates for the small hub and non-primary commercial service airports and the upper or lower bounds were greater than 10 percentage points. These estimates should be interpreted with caution.
32Airports generate both aeronautical revenues and non-aeronautical revenues. Aeronautical revenues are derived from the operation and landing of aircraft, passengers, or freight. As discussed later, airports assess fees on airlines for the use of the airport based on negotiated agreements. These agreements vary in whether the airline or the airport bears the risk if the fees paid by airlines and others do not fully cover the airport’s costs. Non-aeronautical revenues are derived from sources unrelated to the operation and landing of aircraft, passengers, or freight, such as terminal concessions and parking fees.
33The estimated percentage (lower bound, upper bound) of airports reporting a decline in aeronautical revenue of more than 50 percent between September 2019 and September 2020 was 30 (19, 44) percent for small hub airports, 38 (36, 41) percent for non-hub airports, 15 (7, 26) percent for non-primary commercial service airports, and 12 (9, 15) percent for general aviation and reliever airports. The margins of error between the estimates for the small hub and non-primary commercial service airports and the upper or lower bounds were greater than 10 percentage points. These estimates should be interpreted with caution. The estimated percentage (lower bound, upper bound) of airports reporting a decline in non-aeronautical revenue of more than 50 percent between September 2019 and September 2020 was 47 (44, 51) percent for small hub airports, 32 (30, 34) percent for non-hub airports, 13 (6, 24) percent for non-primary commercial service airports, and 7 (5, 9) percent for general aviation and reliever airports. The margins of error between the estimates for the non-primary commercial service airports and the upper or lower bounds were greater than 10 percentage points. These estimates should be interpreted with caution.
Page 17 GAO-22-104429 COVID-19 Pandemic
reliance on scheduled commercial passenger service. For example, based on our survey, we estimate that about 60 percent of all smaller airports had a decrease in aeronautical revenues in September 2020 compared to September 2019, and among those airports, about a quarter experienced a decrease in revenues of more than 50 percent. Additionally, we estimate that about half of small hub and about one-third of non-hub airports experienced a decrease in non-aeronautical revenues of more than 50 percent. At the same time, however, about 60 percent of general aviation and reliever airports and about 40 percent of non-primary commercial service airports did not see a change in their non-aeronautical revenues. For the full results of our survey of smaller airports, see appendix II.
In response to reduced passenger demand, airlines parked or retired a substantial portion of their aircraft fleet (as we discuss later in this report), which in turn reduced demand for new commercial airplanes, engines, and spare parts in the near term. According to representatives we interviewed from two aviation manufacturers and one supplier, and financial statements publicly reported by these businesses, they experienced a decline in revenues as a result of delayed delivery or deferred orders from airlines and other manufacturers. For example, one large engine manufacturer publicly reported that its aviation segment orders were down $15.1 billion—41 percent—in 2020 compared to 2019. It attributed the decrease primarily to lower commercial equipment and service orders as airline customers slowed or deferred new engine orders. For these manufacturers, the effects of the pandemic were preceded by the financial impact of the 737 MAX grounding in 2019, which affected not only Boeing but companies in the supply chain that produced components for the 737 MAX.34
Airline decisions in response to passenger demand also affected businesses that provide aircraft maintenance services. Representatives from three repair station operators told us that airline decisions to reduce capacity by flying less frequently reduced demand for maintenance services in the near term. For example, representatives from one repair station operator reported that demand from their commercial airline
34On March 13, 2019, FAA issued an emergency order prohibiting the operation of Boeing 737 MAX series aircraft by U.S. certificated operators in response to the crashes of Lion Air Flight 610 in Indonesia on October 28, 2018 and Ethiopian Airlines Flight 302 on March 10, 2019. FAA rescinded the emergency order and cleared the MAX to fly again on November 18, 2020.
Declining Passenger Travel Led to Reduced Demand for Commercial Airplanes, Engines, and Aircraft Maintenance Services
Page 18 GAO-22-104429 COVID-19 Pandemic
customers declined by 70-80 percent. Additionally, according to a June 2020 survey by the Aeronautical Repair Station Association, 87 percent of member repair station respondents reported revenue declines in January–May 2020, with an average decline of about 46 percent.35
As a result of the larger number of people staying home during the pandemic and the growth in e-commerce, domestic cargo airlines experienced an increased demand for service. According to BTS data, 2020 was a record year in the amount of cargo carried by airlines. In 2020, the top fifteen U.S. airlines based on tons of cargo transported in 2020 carried 1.46 million more tons of cargo than in 2019, an increase of 10.7 percent year-over-year.36 These airlines experienced an average 5.5 percent increase in total operating revenues in 2020 compared to 2019.
Representatives from the large cargo airline we spoke with told us that in the early stage of the pandemic, neither their company nor the broader U.S. cargo aviation system had the capacity to meet the quick increase in demand for cargo services; however, the industry was able to accommodate this increase in demand relatively quickly. The decrease in passenger airline flights reduced cargo capacity early in the pandemic because passenger flights normally carry some cargo in the belly of their aircraft. However, capacity constraints were eased as passenger airlines’ traffic picked up and as some cargo was accommodated on empty passenger planes. Additionally, representatives from the large cargo airline we spoke with told us they also met the increased demand for cargo transport in part by ramping up their hiring of 100,000 winter-
35Aeronautical Repair Station Association, “Pandemic Impacts on Aviation Markets: Employment and Revenue Losses Reported by U.S. Maintenance Companies, January 1, 2020 to June 1, 2020,” July 28, 2020.
36The largest fifteen cargo airlines were based on total freight and mail transported in 2020. These airlines generated at least 30 percent of their operating revenues from freight and mail transport.
Other Aviation and Aerospace Sectors Experienced Increased Demand or Suffered a Less Severe Reduction in Demand in 2020 Cargo Airlines
Page 19 GAO-22-104429 COVID-19 Pandemic
season employees earlier in the year than usual and maintaining those workforce levels through the winter.
Representatives from the two smaller charter cargo airlines we spoke with told us they experienced uncertainty and volatility in their operations in 2020. Representatives told us that they initially experienced large decreases in demand early in 2020 as the markets they served shut down, starting with China in January and February, followed by Europe and then the U.S. in March. As a result, representatives from both airlines told us that in the first quarter of 2020, they were losing money and under financial stress. However, they told us they experienced a return in demand as the markets they service reopened, starting in mid-to-late spring 2020.
Similar to other aviation sectors, business aviation— the use of smaller, general aviation aircraft primarily for business purposes—experienced a steep decline in activity early in the pandemic; however, demand began to recover for this sector in the second half of 2020, much faster than for passenger airlines. For example, according to FAA data, domestic and international business jet operations in April 2020 were nearly 75 percent below 2019 levels, but by June 2020 had recovered to levels 24 percent below those in June 2019, and by December 2020 were only about 12 percent lower than the prior year’s level of activity.37 According to a December 2020 report from S&P Global Ratings, demand for business aviation had rebounded in part due to increased demand from corporate executives and individuals able to pay for alternatives to commercial scheduled passenger service during the pandemic.38
Representatives from the two business jet manufacturers we interviewed reported decreased demand in spring 2020 as a result of the pandemic, but told us that demand improved in the latter half of the year. They attributed lower demand in part to customer uncertainty concerning the timing of economic recovery and managing supply chain disruptions. In particular, both manufacturers told us that domestic and global travel restrictions presented challenges in completing aircraft deliveries; however, they told us it was helpful that customers generally delayed or deferred aircraft orders rather than cancel them altogether. Both manufacturers experienced increased demand for their products in the
37Federal Aviation Administration, Business Jet Report: January 2021.
38S&P Global Ratings, Industry Top Trends 2021: Aerospace and Defense (Dec.10, 2020).
Business Aviation

Page 20 GAO-22-104429 COVID-19 Pandemic
third and fourth quarters of 2020 compared to the first half of the year. Officials from one manufacturer we spoke with attributed this improvement to a combination of increased optimism around vaccine availability and distribution, a better understanding of how the pandemic may progress, and general optimism about the direction of the economy. According to shipment data for U.S. manufactured aircraft from the General Aviation Manufacturers Association, whose membership includes business jet manufacturers, deliveries of business jets increased in the third and fourth quarters of 2020 versus the first half of the year, but overall were 12 percent lower in 2020 than in 2019.
Representatives we spoke with from the commercial space transportation industry told us that, to date, the COVID-19 pandemic has had varied effects on the industry. Some sectors of commercial space transportation experienced growth—namely the commercial space launch sector that, while largely driven by one launch provider, experienced a 50 percent increase in the number of FAA-licensed commercial launches from calendar year 2019 to 2020.39 Representatives from an industry association and an analytics and engineering firm told us that the demand for some sectors of commercial space dropped—such as demand for satellite services to commercial airlines and cruise ships. However, representatives from an industry association explained that because commercial space companies generally have longer-range business models than traditional aviation, a decrease in demand does not immediately affect the sustainability of operations.
39We have previously reported on the growth and evolution of the commercial space transportation industry and FAA’s efforts to oversee it. See, for example, GAO, Commercial Space Transportation: FAA Continues to Update Regulations and Faces Challenges to Overseeing an Evolving Industry, GAO-21-105268 (Washington, D.C.: June 16, 2021); Commercial Space Transportation: FAA Should Examine a Range of Options to Support U.S. Launch Infrastructure, GAO-21-154 (Washington, D.C.: Dec. 22, 2020); and Commercial Space Transportation: Improvements to FAA’s Workforce Planning Needed to Prepare for the Industry’s Anticipated Growth, GAO-19-437 (Washington, D.C.: May 23, 2019).
Commercial Space Transportation
Page 21 GAO-22-104429 COVID-19 Pandemic
In response to the many effects of the COVID-19 pandemic, aviation stakeholders reported that throughout 2020, they quickly implemented measures to mitigate financial losses and position themselves to maintain business viability until demand recovers.40 These actions included managing costs—which often included reducing costs; using federal assistance provided through COVID-19 relief legislation; raising funds in the private market; and taking actions to mitigate the spread of COVID-19 among employees and customers.
Passenger airlines took several actions to manage labor costs throughout 2020, such as offering employees voluntary unpaid leave or separation and early retirement programs, freezing non-essential hiring, and implementing involuntary furloughs within the limits of the COVID-19 relief laws.41 For example, Delta Air Lines reported in public SEC financial reports that 50,000 employees took voluntary unpaid leaves of absence and approximately 18,000 employees participated in the airline’s early retirement and voluntary separation programs in 2020. American Airlines reported reducing its management and support staff team by approximately 5,100 positions (30 percent) in 2020 and that more than 20,000 of its employees opted for early retirement or long-term partially paid leave as of December 2020. Furthermore, American Airlines, Delta Air Lines, and United Airlines all reported freezing non-essential hiring.
40We excluded from this discussion commercial space transportation for which the pandemic had less deleterious effects.
41Aviation stakeholders across sectors reduced labor costs. However, as discussed above, airlines and airports accepting federal assistance from the CARES Act and subsequent COVID-19 relief laws were limited in their ability to reduce employment levels or conduct involuntary furloughs.
Aviation and Aerospace Stakeholders Responded to the Pandemic’s Effects by Taking a Variety of Actions to Maintain Business Viability Aviation and Aerospace Stakeholders Took Several Actions to Manage Labor and Other Operating Costs, and Reduced Capital Investments
Labor Costs
Page 22 GAO-22-104429 COVID-19 Pandemic
Airports took similar actions to manage their labor costs throughout 2020, although only a small percentage of workers at U.S. airports are employed by the airport.42 Airports that accepted grant funds from the federal COVID-19 relief programs were also limited in their ability to reduce employment levels or conduct involuntary furloughs.43 Representatives from nearly all of the eleven large and medium hub airports we spoke with cited managing costs through suspending or slowing down hiring. For example, representatives at one large hub airport operated by a municipal government told us their airport was affected by a hiring slow-down that limited new hiring to only critical positions. In addition, representatives from four airports we spoke with told us they offered voluntary early retirement programs. Representatives from one of the eleven airports we spoke with told us they went through a reduction in force limited to 26 union and non-union employees, which reduced the airport’s payroll by about 5 percent. Based on our survey of smaller airports, we estimate that about 5 percent of smaller airports implemented staff layoffs and about 20 percent of smaller airports decreased staff hours to reduce operating costs at their airports.
Representatives from two manufacturers and two repair station operators we interviewed also reported that they reduced their workforces in 2020 through reductions to employees’ hours, layoffs, furloughs, and in some cases, closing facilities. For example, representatives from one repair station operator that did not receive COVID-19 relief funding told us they reduced their staff by 50 percent in 2020. Similarly, one large manufacturer of airplane engines permanently reduced its global workforce of 52,000 employees by approximately 25 percent in 2020, and representatives from a business jet manufacturer told us that more than
42Airport direct hires are a small number of people who work at an airport. Many people working in airports are employees of private companies, such as airlines and airport tenants. For example, gate agents are hired by airlines and concessionaire employees are hired directly by concessionaires.
43Certain airport owners—also known as airport sponsors—accepting CARES Act grant funds were required to continue to employ, through December 31, 2020, at least 90 percent of the number of individuals employed as of March 27, 2020. However, non-hub and non-primary airports were excluded from this workforce retention requirement. The Consolidated Appropriations Act, 2021 extended these workforce retention requirements through February 15, 2021. Airports that accept American Rescue Plan Act of 2021 grants will be subject to the same workforce retention requirements through September 30, 2021.
Page 23 GAO-22-104429 COVID-19 Pandemic
600 employees were affected in October 2020 when it decided to permanently close a facility in California.44
Passenger airlines also took a number of actions in 2020 to manage non-labor operating costs and certain capital investments. Early on in the pandemic, some passenger airlines took actions to better align supply with demand by quickly reducing the capacity and reach of their networks. They did this by reducing flight frequencies, the number of airports they served, and the size of aircraft flying certain routes (including shifting flights to regional airlines), which reduced operating costs; however, the extent to which they were able to reduce service was limited in some cases.45 The three selected network airlines included in our earlier analysis—Delta Air Lines, American Airlines, and United Airlines—reduced system-wide capacity, as measured in available seat miles, by 54 percent in 2020 compared to 2019 levels.46 The six selected low-cost airlines reduced system-wide capacity by 37 percent during the same time period.
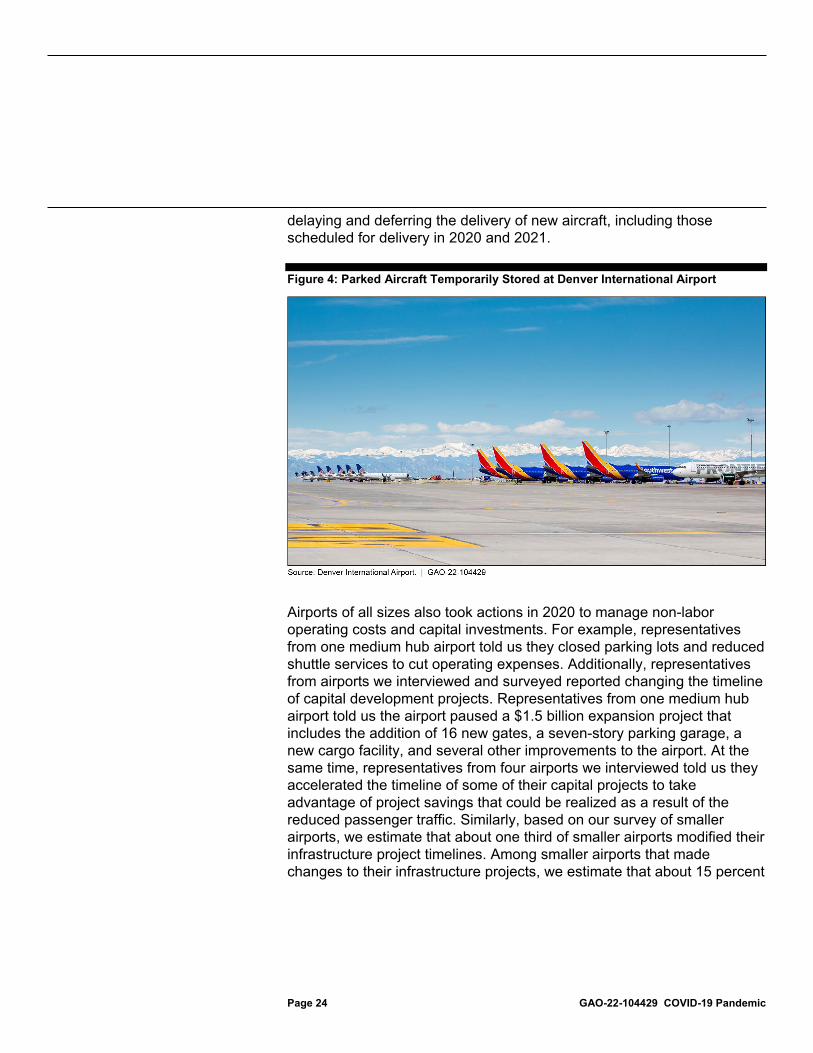
Additionally, airlines also reduced costs by retiring older aircraft, delaying the delivery of new aircraft, or both, in an effort to reduce both operating and capital costs. According to FAA data, U.S. mainline carriers reduced the number of passenger jet aircraft in their fleet by an estimated 28 percent in 2020.47 For example, American Airlines accelerated the retirement of a number of aircraft, including certain Airbus A330, Boeing 757 and Boeing 767 models, and certain regional aircraft. According to American’s SEC financial reports, the aircraft retirements provided cost savings and efficiencies associated with operating fewer aircraft types. Several airlines also placed some aircraft in temporary storage to reduce operating costs (see figure 4). Some airlines also reduced capital costs by
44Neither manufacturer received CARES Act assistance and were therefore not limited in their ability to reduce employment levels.
45As authorized by the CARES Act and the Consolidated Appropriations Act, 2021, DOT required scheduled passenger airlines receiving financial assistance to maintain minimum scheduled passenger service to points in the United States served prior to the pandemic, with some exceptions, until March 1, 2022. For example, DOT has exempted airlines in cases where it is not reasonable or practicable to serve all points or all frequencies in their service obligations. Pub. L. No. 116-136, §§ 4005, 4114(b), 134 Stat. at 477, 499; Pub. L. No. 116-260, § 407, 134 Stat. at 2058-59.
46Available seat miles are a measure of airline output that refers to one aircraft seat flown one mile, whether occupied or not.
47FAA defines mainline carriers as those providing service primarily via aircraft with 90 or more seats.
Non-labor Operating and Capital Investments
Page 24 GAO-22-104429 COVID-19 Pandemic
delaying and deferring the delivery of new aircraft, including those scheduled for delivery in 2020 and 2021.
Figure 4: Parked Aircraft Temporarily Stored at Denver International Airport
Airports of all sizes also took actions in 2020 to manage non-labor operating costs and capital investments. For example, representatives from one medium hub airport told us they closed parking lots and reduced shuttle services to cut operating expenses. Additionally, representatives from airports we interviewed and surveyed reported changing the timeline of capital development projects. Representatives from one medium hub airport told us the airport paused a $1.5 billion expansion project that includes the addition of 16 new gates, a seven-story parking garage, a new cargo facility, and several other improvements to the airport. At the same time, representatives from four airports we interviewed told us they accelerated the timeline of some of their capital projects to take advantage of project savings that could be realized as a result of the reduced passenger traffic. Similarly, based on our survey of smaller airports, we estimate that about one third of smaller airports modified their infrastructure project timelines. Among smaller airports that made changes to their infrastructure projects, we estimate that about 15 percent
Page 25 GAO-22-104429 COVID-19 Pandemic
of them cancelled projects and about 75 percent of them delayed projects, while approximately 10 percent accelerated projects.48
Representatives from manufacturers and repair station operators told us that they also took actions to manage operating and capital costs in response to reduced demand for commercial and business aircraft, engines, and other aviation components and associated maintenance services throughout 2020. Representatives from several aircraft manufacturers told us they reduced spending on things such as research and development, marketing, advertising, and capital expenditures. Representatives from three repair station operators told us they closed facilities, delayed previously planned expansions, or deferred other capital expenditures as demand for their services decreased.
To help offset losses and maintain business viability, passenger airlines leveraged federal assistance that, among other things, subsidized employee payroll, provided liquidity, and made changes to tax provisions. Up to $40 billion in financial assistance payments was made available for passenger airlines by the two rounds of the Payroll Support Program (PSP) established in COVID-19 relief legislation passed in 2020 and another $14 billion in the third round of PSP established in legislation passed in 2021.49 According to data from Department of the Treasury (Treasury), 354 first-round PSP and 302 second-round PSP agreements were signed with passenger airlines for financial assistance payments that totaled about $39.7 billion as of August 2021. The CARES Act also authorized Treasury to provide up to $29 billion for loans and loan guarantees to provide liquidity to passenger airlines, cargo airlines, repair
48These numbers are not mutually exclusive—one airport could have multiple projects, some of which were delayed or cancelled, and others of which were accelerated.
49As a condition of accepting financial assistance under the Payroll Support Program, Treasury required passenger airlines receiving more than $100 million and contractors receiving more than $37.5 million to provide warrants or notes as taxpayer protection. The American Rescue Plan Act of 2021 was enacted on March 11, 2021, and included a third round of the Payroll Support Program. As of August 2021, Treasury was continuing to sign agreements for assistance from the American Rescue Plan Act of 2021.
Aviation Stakeholders Used Federal Assistance Programs to Mitigate Financial Losses Passenger Airlines Leveraged a Variety of Assistance Programs
Page 26 GAO-22-104429 COVID-19 Pandemic
stations, and ticket agents.50 Treasury executed loans that allowed 24 aviation-related businesses to bridge revenue declines and pay for ongoing expenses, including payroll and rent; the majority of the loan funds approved—$20.8 billion of a total $21.2 billion—were for seven major passenger airlines.51 In addition, representatives from airlines reported using the tax provisions in the CARES Act52—which included, among other things, an employee retention credit and a delay in payment of employer payroll taxes—to bolster their liquidity. Furthermore, commercial aviation operators also benefited from a CARES Act provision suspending certain commercial air transportation taxes, including those on passenger tickets, cargo, and fuel.53
Representatives from passenger airlines and credit rating agencies told us that federal assistance was essential to cover airline passenger expenses, keep employees on their payrolls, and help stem cash outflows while passenger traffic levels were at historic lows. Representatives from four airlines told us that the PSP program, in particular, provided critical and timely support. For instance, representatives from two airlines emphasized that the PSP program prevented furloughs that would have resulted in employees filing unemployment claims and losing their health care benefits. Representatives from one network airline told us that the loans from Treasury also provided liquidity that was vital for them to continue to operate and maintain their infrastructure until passenger 50CARES Act, § 4003, 134 Stat. at 470. Section 4003 also included up to $17 billion for businesses critical to maintaining national security; however, no aviation businesses applied for this assistance.
51As of August 1, 2021, seven aviation-related businesses had fully repaid their loans, including six passenger airlines, as discussed later in this report. These seven loans have a total authorized value of $18.3 billion. GAO has reviewed the implementation of the loan program, including the impacts on both recipients and non-recipients, in prior work; smaller businesses did not see the same benefits from the funds as large passenger airlines. See: GAO, COVID-19: Continued Attention Needed to Enhance Federal Preparedness, Response, Service Delivery, and Program Integrity, GAO-21-551 (Washington, D.C.: July 19, 2021); COVID-19: Sustained Federal Action is Crucial as Pandemic Enters Its Second Year, GAO-21-387 (Washington, D.C.: March 31, 2021); Financial Assistance: Lessons Learned from CARES Act Loan Program for Aviation and Other Eligible Businesses, GAO-20-198 (Washington, D.C.: December 10, 2020); COVID-19: Federal Efforts Could Be Strengthened by Timely and Concerted Actions, GAO-20-701 (Washington, D.C.: September 21, 2021); and COVID-19: Opportunities to Improve Federal Response and Recovery Efforts, GAO-20-625 (Washington, D.C.: June 25, 2020).
52CARES Act, §§ 2301, 2302, 134 Stat. at 347-52.
53CARES Act, § 4007, 134 Stat. at 477.
Page 27 GAO-22-104429 COVID-19 Pandemic
demand returned. The tax-related provisions had a smaller effect on airlines than PSP assistance, but representatives from two credit rating agencies noted that the provisions helped stem airlines’ cash outflows.54 For example, according to SEC financial reports, United Airlines elected to defer the payment of $199 million in payroll taxes incurred through December 31, 2020, and will pay half in December 2021 and the remaining balance in December 2022.
According to our interviews, the results of our survey, and our previous reporting on federal COVID-19 assistance programs, airports of all sizes leveraged the flexibility of the federal grants provided for COVID-19 relief to make necessary debt and other payments and provide assistance to airlines and other airport tenants.55 These federal grants of up to $20 billion in total allowed airports to respond to the COVID-19 pandemic, including funding their operations and meeting their ongoing debt payments, although the funding allocation and allowable uses for the grants differ under the CARES Act and subsequent COVID-19 relief laws.56 FAA has begun to collect data from airports on general spending categories for the federal COVID-19 relief funding, but officials said that
54Airlines and aviation manufacturers reported using tax provisions of the CARES Act, including deferring employer payroll taxes, claiming employee retention credits, and carrying back five years net operating losses arising in tax years beginning in 2018, 2019, and 2020. Pub. L. No. 116-136, §§ 2301-2303, 134 Stat. at 347-56. The Consolidated Appropriations Act, 2021 made a number of changes to these provisions, including extending the availability of credits, among other changes. Pub. L. No. 116-260, div. N, §§ 206-207, 134 Stat. at 3059-65.
55GAO-21-551.
56The CARES Act, the Consolidated Appropriations Act, 2021, and the American Rescue Plan Act of 2021 provide a combined total of $20 billion in federal funding for U.S. airports to respond to the COVID-19 pandemic. As of May 14, 2021, of the $20 billion, about $10.6 billion has been obligated and $6.5 billion expended by FAA. Under the CARES Act, funds were available for any purpose for which airport revenues may lawfully be used. Under the Consolidated Appropriations Act, 2021 and the American Rescue Plan of 2021, funds were generally available for costs related to operations, personnel, cleaning, sanitization, janitorial services, combating the spread of pathogens at the airport, and debt service payments. According to FAA guidance, examples of eligible development to combat the spread of pathogens at the airport include replacing or upgrading a heating, ventilation, and air conditioning system, and reconfiguring the terminal to accommodate increased social distancing or health screening. Additionally, under the Consolidated Appropriations Act, 2021 and the American Rescue Plan Act of 2021, certain amounts were made available to provide relief from rent and minimum annual guarantees to airport concessions.
Airports Leveraged Flexible Federal Assistance to Make Debt and Other Payments and Provide Assistance to Airlines and Tenants
Page 28 GAO-22-104429 COVID-19 Pandemic
they will have limited information until airports draw down all funds for reimbursed costs.57
In our interviews, representatives from large and medium hub airports told us they appreciated the flexibility they had to use the CARES Act grant funding. Representatives from six large and medium hub airports told us they prioritized using the funds for routine, large expenses such as debt service payments and payroll. Representatives from one of these airports specified that they prioritized large expenses because they were among the easiest to have reimbursed by FAA. Three told us they also used the CARES Act grant funding to provide indirect relief to concessionaires such as gift shops and restaurants.58 In addition, representatives from four large and medium hub airports told us they used the funding to avoid increasing rates they charge airlines. Airports assess fees on airlines for the use of the airport based on negotiated agreements. These agreements vary in whether the airline or the airport bears the risk if the fees paid by airlines and others do not fully cover the airport’s costs. In cases where the agreement requires the airlines to make up the difference, the dramatic fall in traffic meant that fees paid by airlines would have had to rise to cover the shortfall. Representatives from large and medium hub airports with such agreements told us they applied CARES Act grant funding to certain costs to airlines to keep fees paid by airlines for landing and terminal rentals flat, when otherwise fees would have had to rise due to decreased traffic.
Based on our survey of smaller airports, we estimate that about 90 percent of smaller airports received a CARES Act Airport Grant. Of those, about half used the funds for payroll and labor expenses. When asked to describe ways in which the CARES Act worked well in providing support,
57FAA has begun to collect and consolidate data from airports on general spending categories for CARES Act funding through grant close-out reports, which are completed once all allocated airport funds have been expended. As of May 14, 2021, FAA officials said that 476 CARES Act airport grants, totaling $1.66 billion, have been closed out. For these grants, the majority of airport grant funds have been used for debt service (about 52 percent of these funds, totaling $864 million) and payroll (about 39 percent of these funds, totaling $643 million). While FAA continues to collect these data on airport grant spending, officials said airports are generally using CARES Act funds on payroll, utilities, minor maintenance, and debt service.
58The Consolidated Appropriations Act, 2021 and American Rescue Plan Act of 2021 appropriated funds for sponsors of primary airports to provide relief from rent and minimum annual guarantees to on-airport car rental, on-airport parking, and in-terminal airport concessions.
Page 29 GAO-22-104429 COVID-19 Pandemic
87 airports specifically noted that the CARES Act allowed them to avoid either layoffs, furloughs of staff, or both. Smaller airports also used the funds for utilities, equipment, and debt service. Furthermore, we estimate that about one-quarter of smaller airports, and disproportionately small hub and non-hub airports, provided rent or other relief to their tenants,59 such as deferring payments, waiving payments, and changing or adjusting lease agreements.60
Several other aviation and aerospace stakeholders leveraged federal assistance, although the assistance they received was smaller in magnitude than that provided to passenger airlines and airports. For example:
• Manufacturers: Representatives from one manufacturer told us they used tax provisions in the CARES Act to bolster the company’s liquidity, and another manufacturer reported taking similar action.61 For example, one manufacturer reported using the 5-year net operating loss carryback provision that enabled it to record tax benefits of nearly $1.2 billion. The five manufacturers we spoke to did not pursue CARES Act loans. Generally, representatives told us they preferred maintaining flexibility in their business decision-making and chose not to pursue such loans because the requirements associated
59The estimated percentage (lower bound, upper bound) of airports reporting having provided any rent or other relief to any of the tenants operating at the airport was 81 (69, 90) percent for small hub airports, 78 (76, 80) percent for non-hub airports, 44 (42, 47) percent for non-primary commercial service airports, and 16 (13, 19) percent for general aviation and reliever airports. The margins of error between the estimate for the small hub airports and the upper or lower bounds were greater than 10 percentage points. This estimate should be interpreted with caution.
60When asked to describe types of rent or other relief provided to tenants at the airport, 289 airports provided a valid written response. Of these responses, 152 airports stated they deferred payments for tenants, 117 stated they waived payments from tenants, and 77 airports stated they changed and/or adjusted leases and agreements, including reducing rates and fees. Airports may have reported taken more than one measure, so totals will not add up to 100 percent.
61As mentioned above, airlines and aviation manufacturers reported using the tax provisions in the CARES Act, including deferring employer payroll taxes, claiming employee retention credits, and carrying back five years net operating losses arising in tax years beginning in 2018, 2019, and 2020. These provisions were not limited to aviation industry businesses. Pub. L. No. 116-136, §§ 2301-2303, 134 Stat. at 347-56. The Consolidated Appropriations Act, 2021 made a number of changes to these provisions, including extending the availability of credits, among other changes. Pub. L. No. 116-260, div. N, §§ 206-207, 134 Stat. at 3059-65.
Other Aviation and Aerospace Stakeholders Also Leveraged Federal Assistance
Page 30 GAO-22-104429 COVID-19 Pandemic
with accepting assistance—which included maintaining certain employment levels–were too restrictive.62
Some aviation businesses, including smaller companies in the manufacturing supply chain, received Paycheck Protection Program (PPP) loans to help sustain them through the period of decreased demand during the pandemic.63 Representatives from one large manufacturer told us they understood that a number of the companies in their supply chain had received PPP loans, and that those loans were a significant help for businesses that had been affected by the grounding of the Boeing 737 MAX aircraft in addition to the COVID-19 pandemic.
• Repair station operators: Treasury executed CARES Act loans totaling $19 million with five of the 41 repair station operators that
62Under the Section 4003 Loan Program, recipients agreed to maintain employment levels to the extent practicable and in any case not reduce employment levels by more than 10 percent until September 30, 2020. CARES Act, § 4003(c)(2)(G), 134 Stat. at 471. Under other programs, including PSP1, PSP2, and PSP3, recipients agreed to refrain from conducting involuntary furloughs. CARES Act, § 4114(a)(1), 134 Stat. at 499; Consolidated Appropriations Act, 2021, § 404, 134 Stat.at 2055; American Rescue Plan Act of 2021, § 7301, 135 Stat. at 104-05. Additionally, the American Rescue Plan Act of 2021, passed in March 2021, included $3 billion to establish an Aviation Manufacturing Jobs Protection program. Through this program, the Department of Transportation (DOT) is to provide up to $3 billion in funding to eligible manufacturing companies to pay up to half of their compensation costs for certain categories of employees, for up to six months.
63The CARES Act and the Paycheck Protection Program and Health Care Enhancement Act appropriated a total of $670 billion for the Paycheck Protection Program (PPP) under the Small Business Administration’s (SBA) 7(a) small business lending program. PPP loans are made at 1 percent interest and will be fully forgiven if certain conditions are met. These loans can be used for payroll and certain non-payroll costs. In general, small businesses with 500 or fewer employees, including tax-exempt nonprofit organizations, veterans organizations, and tribal businesses were eligible. Businesses in certain industries with more than 500 employees were eligible for loans. We previously reviewed the characteristics of PPP loans and the trends in small business and lender participation in PPP. See Paycheck Protection Program: Program Changes Increased Lending to the Smallest Businesses and in Underserved Locations, GAO-21-601 (Washington, D.C.: Sept. 21, 2021). We also reviewed aspects of SBA’s implementation of the PPP, including safeguards that SBA put in place to prevent improper payments and fraud. See Paycheck Protection Program: SBA Added Program Safeguards, but Additional Actions Are Needed, GAO-21-577 (Washington, D.C.: July 29, 2021). Additionally, GAO previously found that SBA could take actions to improve oversight and fraud risk management of the PPP program. See, for example, COVID-19 Loans: SBA has Begun to Take Steps to Improve Oversight and Fraud Risk Management, GAO-21-498T (Washington, D.C.: Apr. 20, 2021); Small Business Administration: Actions Needed to Improve COVID-19 Loans’ Internal Controls and Reduce Their Susceptibility to Fraud, GAO-21-472T (Washington, D.C.: Mar. 24, 2021); and Small Business Administration: Steps Needed to Address COVID-19 Loan’s Susceptibility to Fraud, GAO-21-449T (Washington, D.C.: Mar. 25, 2021).
Page 31 GAO-22-104429 COVID-19 Pandemic
applied to the program.64 In addition to assistance from Treasury loans, the three rounds of PSP made up to $5 billion in financial assistance payments available to certain aviation contractors, including repair station operators. Two of the three repair station operators we interviewed received between $46 and $51 million in first-round PSP assistance payments. Representatives from one repair station operator said they used the assistance to retain their experienced workforce, perform necessary maintenance on their tooling and equipment, and perform training to keep their workforce current, among other things.
• Cargo airlines: Of the $4 billion appropriated for cargo airlines under the first round of PSP assistance to cover payroll expenses, only a fraction of the funding was used—thirty-nine cargo airlines received over $828 million in assistance.65 Two cargo airlines received over two-thirds of these funds—$568 million. The two charter cargo airlines we spoke with received $35 million and $22 million of first-round PSP assistance. Representatives from both cargo airlines emphasized the importance of the support, stating that the assistance was critical in helping them through the first few months of the pandemic when they experienced a large decrease in demand. Representatives from one of the charter cargo airlines stated that without the PSP assistance, their airline would not have been in a financial position to survive the 3 to 4 months it took for their cargo business to return. They used the assistance to keep employees in place so that they were available when demand returned.
In addition to receiving assistance from the various federal COVID-19 relief programs, many commercial aviation and aerospace stakeholders also raised funding in the financial markets to position themselves to maintain business viability until demand recovers. Representatives from several aviation industry associations and credit rating agencies told us that assistance from the CARES Act provided a degree of assurance in
64In previous work we reported that representatives from smaller businesses told us the Treasury loan program did not work or did not work as well as it could have. See GAO-21-551.
65In October 2020, Representative James E. Clyburn, Chairman of the Select Subcommittee on the Coronavirus Crisis, sent letters to four cargo airlines that received a total of more than $630 million in PSP assistance, stating that it had appeared that the airlines “had financial success” during the COVID-19 pandemic. His letters called on the airlines to return the PSP assistance or demonstrate that they needed the funds to keep workers on their payroll, as Congress intended. As of September 2021, these airlines have not returned the funds. Assistance for cargo airlines was not included in the subsequent federal COVID-19 relief programs.
Aviation and Aerospace Stakeholders Raised Funding in the Financial Markets
Page 32 GAO-22-104429 COVID-19 Pandemic
the stability of the market that enabled private lenders to invest in the aviation industry with greater confidence that they would be able to recoup their investments.
Major U.S. passenger airlines added an estimated $58 billion in private and federal long-term debt by the end of 2020, with their interest expenses expected to more than double in the next few years, according to A4A. As discussed earlier, throughout 2020, airlines were expending cash reserves at a rate faster than revenues could replenish and recognized that additional financing was needed to manage the dramatic drop in passenger revenue and cover fixed costs. According to public SEC financial reports, airlines issued or entered into new secured notes, loan facilities, and new aircraft financings, and raised cash proceeds from the issuance and sale of common stock, among other actions. For example, United Airlines reported $16 billion in proceeds from the issuance of debt and $2.1 billion in proceeds from equity issuance in 2020, with a total of $27.2 billion in debt and finance lease obligations at the end of 2020. Four passenger airlines—American Airlines, Hawaiian Airlines, Sun Country, and United Airlines—also turned to the financial markets in the first half of 2021 to raise funds that allowed them to pay back their CARES Act loans from the federal government.66
In some cases, aviation stakeholders pursued financing instead of federal COVID-19 relief assistance, citing various reasons they did not seek government financial support. Representatives from an aviation manufacturer described the provisions attached to the CARES Act loans as too restrictive and costly, stating that the company was not interested in providing the government with an equity stake or restricting its ability to reduce employment, as required by the loan program. Instead, representatives told us the manufacturer was able access the credit markets to obtain needed capital after the Federal Reserve’s willingness to backstop the credit markets opened up credit options.67 Separately, another manufacturer was able to issue $25 billion in new long-term debt
66Two additional airlines—Alaska Airlines and SkyWest—also paid back their CARES Act loans from the federal government in the first half of 2021; however, their publicly available financial statements do not indicate the specific source of the funding used to repay these loans.
67We previously reported on the lending programs the Board of Governors of the Federal Reserve System authorized to ensure the flow of credit to various parts of the economy affected by the COVID-19 pandemic. See GAO, Federal Reserve Lending Programs: Use of CARES Act-Supported Programs Has Been Limited and Flow of Credit Has Generally Improved, GAO-21-180 (Washington, D.C.: Dec. 10, 2020).
Page 33 GAO-22-104429 COVID-19 Pandemic
in April 2020 to bolster its liquidity and thus did not pursue any CARES Act loans.
Stakeholders across aviation and aerospace sectors reported taking actions to protect employee health in 2020. These include such actions as requiring and providing masks, providing other personal protective equipment, implementing social distancing, and allowing employees to work from home when possible.68 For example, representatives from a network airline reported providing on-site COVID-19 testing at its airport hubs and providing at-home testing for U.S. based employees.69 Airlines also reported implementing remote work for employees able to do so, such as support center staff. Similarly, representatives from airports told us they implemented mask and social distancing requirements for employees and allowed some staff to work remotely.70 Representatives from a cargo airline with its own repair station told us that to maintain social distancing among employees, they had to limit the number of mechanics working on a given aircraft as well as the number of mechanics working on the same part of an aircraft at the same time. Representatives from manufacturers told us they implemented temperature checks and added social distancing where possible,
68Personal protective equipment includes items such as N95 respirators, surgical and non-surgical masks, face shields and goggles, and gloves, among other items. Social distancing, also known as physical distancing, is the practice of maintaining physical distance from others and avoiding large gatherings, with the intent of reducing the rate of transmission of infectious diseases. COVID-19 brought social distancing practices to the forefront worldwide as a means of controlling local spread of the disease.
69Diagnostic testing for COVID-19 is critical to controlling and understanding the spread of the virus, according to the CDC. We previously reported on the types of COVID-19 testing in GAO, Science & Tech Spotlight: COVID-19 Testing, GAO-20-584SP (Washington, D.C.: May 20, 2020).
70Within commercial airports, the Transportation Security Administration (TSA) has responsibility for passenger screening checkpoints. For a review of measures implemented by TSA to protect its screening workforce and the traveling public, see GAO, COVID-19: TSA Could Better Monitor Its Efforts to Reduce Infectious Disease Spread at Checkpoints, GAO-21-364 (Washington, D.C.: June 14, 2021).
Aviation and Aerospace Stakeholders Took Steps to Mitigate the Spread of COVID-19 Protecting Employee Health
Page 34 GAO-22-104429 COVID-19 Pandemic
including in production areas.71 Representatives from two manufacturers also told us they developed protocols for contact tracing if employees reported positive COVID-19 infections.72
Airlines and airports also took actions in 2020 with an intent to protect passengers and increase passenger confidence in the air travel experience.73 Representatives from airlines and airports we spoke to emphasized the enhanced cleaning protocols they implemented throughout their airports and on aircraft. Some airlines also changed their onboard food and beverage services to reduce interactions between passengers and crew and blocked the sale of middle seats to allow for greater distancing between passengers. Representatives from one airline and seven airports also told us they implemented contactless technology to reduce interaction between passengers and employees, such as adding automated bag drops and biometric ID checks. Representatives from six airports also told us it was important to implement consistent messaging and expectation setting about mask and social distancing requirements throughout their airports to help passengers navigate differences in requirements at different destinations (see figure 5). While some of these measures, such as contactless technology, may be maintained in the long-term, others have been changing as public health needs have evolved with the rollout of vaccines and the beginning of pandemic recovery.74
71Centers for Disease Control and Prevention (CDC) guidance states that screening employees for symptoms of COVID-19, such as a fever, is an optional strategy employers may use to reduce the spread of COVID-19 in the workplace.
72Contact tracing is a process in which public health officials attempt to limit disease transmission by identifying infected individuals, notifying their “contacts”—all the people they may have transmitted the disease to—and asking infected individuals and their contacts to quarantine, if appropriate.
73We have not evaluated the effectiveness of these actions, but we are currently reviewing the research surrounding the transmission of communicable disease in air travel.
74Two COVID-19 vaccines using a two-dose regimen (Pfizer and Moderna) were authorized for emergency use in December 2020 and a third, one-dose vaccine (Johnson & Johnson) was authorized in February 2021. As of June 23, 2021, about 323 million vaccine doses have been administered, according to data reported to CDC, and about 53.1 percent of the U.S. population 12 and over—almost 150.7 million individuals—have been fully vaccinated. For additional information, see GAO-21-551.
Protecting Passengers and Increasing Confidence in the Air Travel Experience
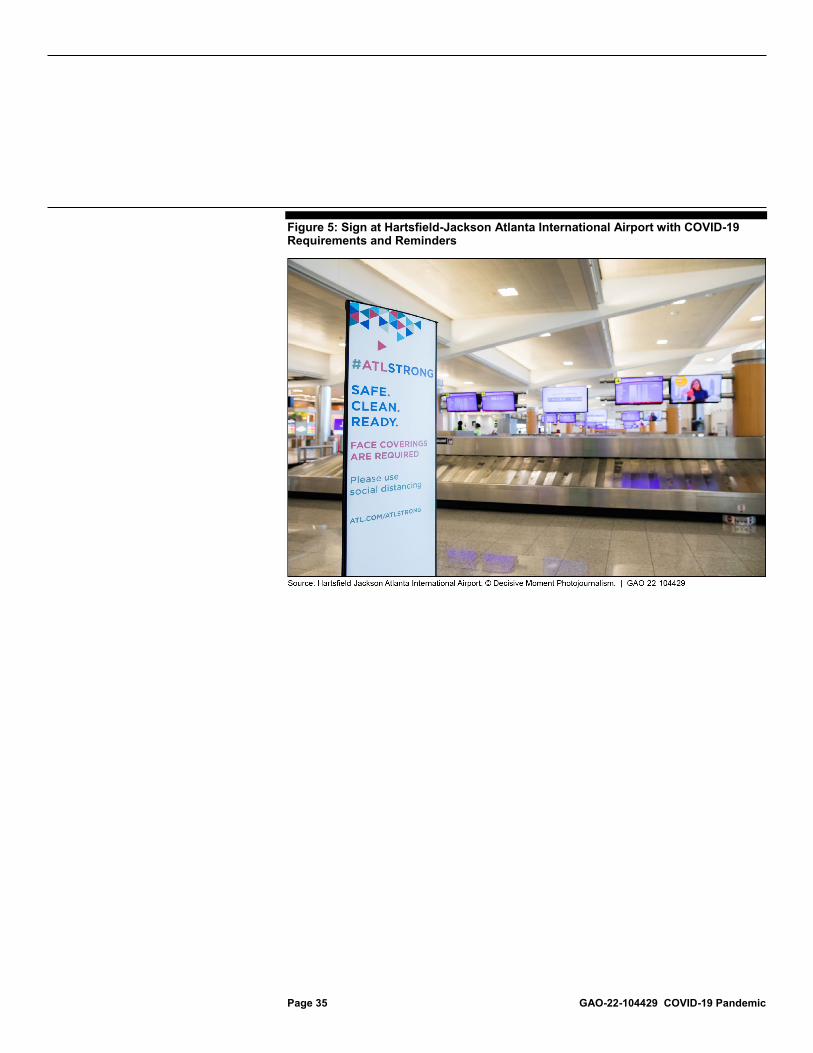
Page 35 GAO-22-104429 COVID-19 Pandemic
Figure 5: Sign at Hartsfield-Jackson Atlanta International Airport with COVID-19 Requirements and Reminders
Page 36 GAO-22-104429 COVID-19 Pandemic
In March 2020, FAA began granting specific and temporary regulatory relief, including granting regulatory waivers, approving operational adjustments, and issuing guidance, in response to requests from airlines, airports, and their industry associations (see table 1). As aviation activity declined with the start of the pandemic, airlines and aviation associations sought FAA’s assistance to ease regulatory and operational requirements that they claimed negatively affected the safety and continuity of aviation operations. For example, Airlines for America and National Air Transportation Association petitioned FAA on behalf of their members for exemptions to regulations requiring crewmembers to don emergency equipment (e.g., oxygen masks and life vests) during training.75 These associations explained that, without a temporary exemption, such procedures could lead to the transmission of COVID-19. Associations also petitioned FAA for regulatory relief that would allow them to make operational changes. For example, Airlines for America petitioned FAA for exemptions that would allow airlines to transport cargo in a plane’s passenger cabin when no passengers were present.76 Airlines for America explained that some airlines might want to use their excess capacity to carry cargo, including critical medical cargo.
7514 C.F.R. § 121.417. See Regulatory Docket No. FAA-2020-0307 and FAA-2020-0291.
76See Regulatory Docket No. FAA-2020-0492.
FAA Provided Airlines and Other Aviation Sectors Temporary Relief from Some Regulatory Requirements and Selected Stakeholders Said the Changes Were Helpful FAA Granted Airlines’ Requests for Temporary Relief from Meeting Certain Regulatory Requirements
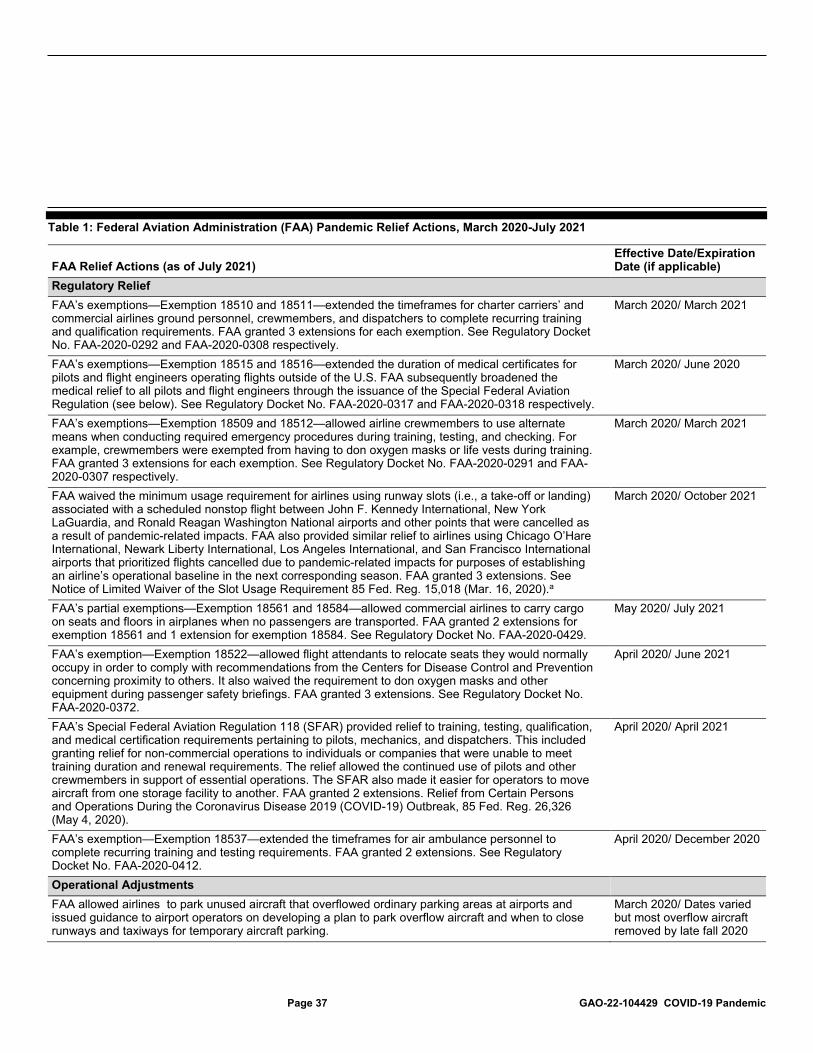
Page 37 GAO-22-104429 COVID-19 Pandemic
Table 1: Federal Aviation Administration (FAA) Pandemic Relief Actions, March 2020-July 2021
FAA Relief Actions (as of July 2021) Effective Date/Expiration Date (if applicable)
Regulatory Relief FAA’s exemptions—Exemption 18510 and 18511—extended the timeframes for charter carriers’ and commercial airlines ground personnel, crewmembers, and dispatchers to complete recurring training and qualification requirements. FAA granted 3 extensions for each exemption. See Regulatory Docket No. FAA-2020-0292 and FAA-2020-0308 respectively.
March 2020/ March 2021
FAA’s exemptions—Exemption 18515 and 18516—extended the duration of medical certificates for pilots and flight engineers operating flights outside of the U.S. FAA subsequently broadened the medical relief to all pilots and flight engineers through the issuance of the Special Federal Aviation Regulation (see below). See Regulatory Docket No. FAA-2020-0317 and FAA-2020-0318 respectively.
March 2020/ June 2020
FAA’s exemptions—Exemption 18509 and 18512—allowed airline crewmembers to use alternate means when conducting required emergency procedures during training, testing, and checking. For example, crewmembers were exempted from having to don oxygen masks or life vests during training. FAA granted 3 extensions for each exemption. See Regulatory Docket No. FAA-2020-0291 and FAA-2020-0307 respectively.
March 2020/ March 2021
FAA waived the minimum usage requirement for airlines using runway slots (i.e., a take-off or landing) associated with a scheduled nonstop flight between John F. Kennedy International, New York LaGuardia, and Ronald Reagan Washington National airports and other points that were cancelled as a result of pandemic-related impacts. FAA also provided similar relief to airlines using Chicago O’Hare International, Newark Liberty International, Los Angeles International, and San Francisco International airports that prioritized flights cancelled due to pandemic-related impacts for purposes of establishing an airline’s operational baseline in the next corresponding season. FAA granted 3 extensions. See Notice of Limited Waiver of the Slot Usage Requirement 85 Fed. Reg. 15,018 (Mar. 16, 2020).a
March 2020/ October 2021
FAA’s partial exemptions—Exemption 18561 and 18584—allowed commercial airlines to carry cargo on seats and floors in airplanes when no passengers are transported. FAA granted 2 extensions for exemption 18561 and 1 extension for exemption 18584. See Regulatory Docket No. FAA-2020-0429.
May 2020/ July 2021
FAA’s exemption—Exemption 18522—allowed flight attendants to relocate seats they would normally occupy in order to comply with recommendations from the Centers for Disease Control and Prevention concerning proximity to others. It also waived the requirement to don oxygen masks and other equipment during passenger safety briefings. FAA granted 3 extensions. See Regulatory Docket No. FAA-2020-0372.
April 2020/ June 2021
FAA’s Special Federal Aviation Regulation 118 (SFAR) provided relief to training, testing, qualification, and medical certification requirements pertaining to pilots, mechanics, and dispatchers. This included granting relief for non-commercial operations to individuals or companies that were unable to meet training duration and renewal requirements. The relief allowed the continued use of pilots and other crewmembers in support of essential operations. The SFAR also made it easier for operators to move aircraft from one storage facility to another. FAA granted 2 extensions. Relief from Certain Persons and Operations During the Coronavirus Disease 2019 (COVID-19) Outbreak, 85 Fed. Reg. 26,326 (May 4, 2020).
April 2020/ April 2021
FAA’s exemption—Exemption 18537—extended the timeframes for air ambulance personnel to complete recurring training and testing requirements. FAA granted 2 extensions. See Regulatory Docket No. FAA-2020-0412.
April 2020/ December 2020
Operational Adjustments FAA allowed airlines to park unused aircraft that overflowed ordinary parking areas at airports and issued guidance to airport operators on developing a plan to park overflow aircraft and when to close runways and taxiways for temporary aircraft parking.
March 2020/ Dates varied but most overflow aircraft removed by late fall 2020
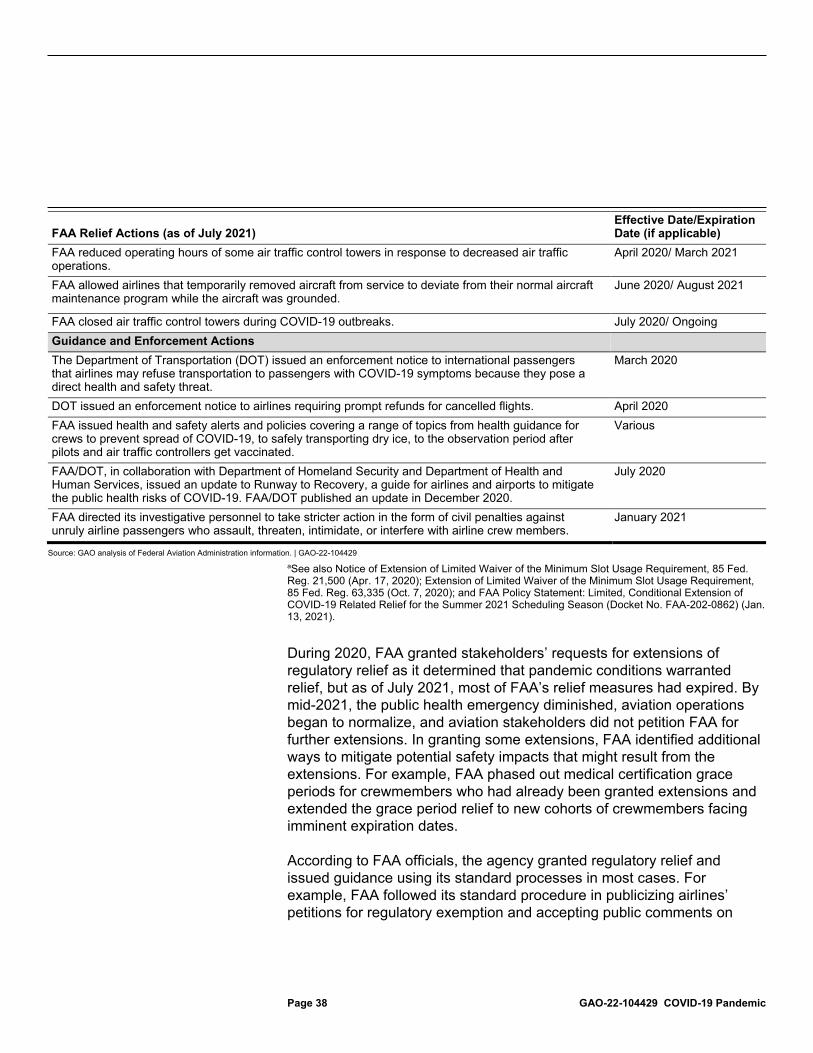
Page 38 GAO-22-104429 COVID-19 Pandemic
FAA Relief Actions (as of July 2021) Effective Date/Expiration Date (if applicable)
FAA reduced operating hours of some air traffic control towers in response to decreased air traffic operations.
April 2020/ March 2021
FAA allowed airlines that temporarily removed aircraft from service to deviate from their normal aircraft maintenance program while the aircraft was grounded.
June 2020/ August 2021
FAA closed air traffic control towers during COVID-19 outbreaks. July 2020/ Ongoing Guidance and Enforcement Actions The Department of Transportation (DOT) issued an enforcement notice to international passengers that airlines may refuse transportation to passengers with COVID-19 symptoms because they pose a direct health and safety threat.
March 2020
DOT issued an enforcement notice to airlines requiring prompt refunds for cancelled flights. April 2020 FAA issued health and safety alerts and policies covering a range of topics from health guidance for crews to prevent spread of COVID-19, to safely transporting dry ice, to the observation period after pilots and air traffic controllers get vaccinated.
Various
FAA/DOT, in collaboration with Department of Homeland Security and Department of Health and Human Services, issued an update to Runway to Recovery, a guide for airlines and airports to mitigate the public health risks of COVID-19. FAA/DOT published an update in December 2020.
July 2020
FAA directed its investigative personnel to take stricter action in the form of civil penalties against unruly airline passengers who assault, threaten, intimidate, or interfere with airline crew members.
January 2021
Source: GAO analysis of Federal Aviation Administration information. | GAO-22-104429 aSee also Notice of Extension of Limited Waiver of the Minimum Slot Usage Requirement, 85 Fed. Reg. 21,500 (Apr. 17, 2020); Extension of Limited Waiver of the Minimum Slot Usage Requirement, 85 Fed. Reg. 63,335 (Oct. 7, 2020); and FAA Policy Statement: Limited, Conditional Extension of COVID-19 Related Relief for the Summer 2021 Scheduling Season (Docket No. FAA-202-0862) (Jan. 13, 2021).
During 2020, FAA granted stakeholders’ requests for extensions of regulatory relief as it determined that pandemic conditions warranted relief, but as of July 2021, most of FAA’s relief measures had expired. By mid-2021, the public health emergency diminished, aviation operations began to normalize, and aviation stakeholders did not petition FAA for further extensions. In granting some extensions, FAA identified additional ways to mitigate potential safety impacts that might result from the extensions. For example, FAA phased out medical certification grace periods for crewmembers who had already been granted extensions and extended the grace period relief to new cohorts of crewmembers facing imminent expiration dates.
According to FAA officials, the agency granted regulatory relief and issued guidance using its standard processes in most cases. For example, FAA followed its standard procedure in publicizing airlines’ petitions for regulatory exemption and accepting public comments on
Page 39 GAO-22-104429 COVID-19 Pandemic
those petitions.77 However, FAA expedited some processes, which, according to FAA officials, helped both the airlines and FAA. For example, FAA did not require airlines to submit petitions for exemption 120 days before the desired effective date of the exemption,78 allowed industry associations to submit petitions on behalf of their members, and granted exemptions to all affected airlines that submitted a letter of intent.79 This change expedited relief because it removed the requirement that each airline must petition individually for an exemption and thus removed the need for FAA to evaluate multiple individual petitions for the same relief. FAA’s exemption letters, waivers, and Special Federal Aviation Regulation (SFAR)80 summarize the agency’s reasons for granting relief, its assessment of potential safety impacts, and any additional requirements airlines accepting relief must follow.
According to FAA officials, FAA’s foremost considerations in evaluating the stakeholder requests for regulatory relief were whether the relief measure would have an adverse effect on safety or would not be in the public interest, and would facilitate the continuity of aviation operations.
77FAA published some petitions for regulatory exemptions in a regulatory docket and other petitions in the Federal Register depending on the waiver sought. For example, in one regulatory exemption, FAA found good cause under 14 C.F.R. § 11.87 not to publish a summary of the petition in the Federal Register because “delaying action on the petition would have an adverse and potentially immediate impact on the petitioner’s ability to ensure continuity of critical air ambulance operations essential to the public interest.” In the Matter of the Petition of Air Medical Operators Association, Exemption No. 18537 (Apr. 30, 2020).
78Aviation stakeholders affected by a regulation in Title 14 of the Code of Federal Regulations may petition for an exemption from any rule issued by FAA under its statutory authority. The regulations governing this process (14 C.F.R. pt. 11) describe the steps for petitioning for exemptions. These steps include submitting the petition 120 days before it is needed to take effect, describing the relief needed, reasons it would not affect safety, and other information. FAA publishes information about petitions for exemption in the Federal Register. 14 C.F.R. § 11.85.
79FAA directed airlines that were requesting an exemption to submit a letter of intent to FAA. The letter of intent required the airline to affirm its request to use the exemption and its intentions to comply with the conditions and limitation of the exemption. Some exemptions contained other requirements, such as evaluating and describing how the airline would prevent negative safety impacts.
80According to FAA, an SFAR pertaining to airspace is typically a temporary rule to address a temporary situation. Further, FAA notes that an SFAR is generally not used to replace or enforce regulations that are to remain in effect for many years. Consequently, an SFAR has an expiration date, usually no more than 3 years from its effective date. SFARs are listed at the beginning of the most relevant Code of Federal Regulations, and may be cross-referenced to other regulations. SFARs can prohibit, restrict, or impose additional requirements to operate in the airspace to which the SFAR applies.
Page 40 GAO-22-104429 COVID-19 Pandemic
FAA officials said that focusing on aviation stakeholder requests enabled the agency to quickly address the most critical operational issues.
FAA took other actions in addition to providing regulatory relief. For example, in March 2020, FAA created a rapid response team that was a focal point for gathering and responding to airport operators’ and other stakeholders’ questions and concerns. According to FAA officials, the team’s main purpose was to create a channel of communication with industry, quickly tackle any issue brought to its attention, and elevate issues that need broader attention. For example, the team fielded questions ranging from where to obtain hand sanitizer to who needs to know about overflow aircraft parking plans. Since its inception, the team has cataloged over 750 requests for information and policy decisions.
The airlines we contacted commented that FAA’s actions demonstrated its ability to provide operational relief quickly. FAA officials stated that the agency’s efficiency was due in part to industry input because industry stakeholders—particularly airline associations—identified regulatory relief that was critical to continuing operations. According to FAA officials, some exemptions were beneficial to airlines and the public because the exemptions enabled airlines to maintain qualified crewmembers. These officials said other exemptions were beneficial because they reduced crewmembers’ potential exposure to COVID-19 during training or operations and two airlines we contacted agreed. For example, one airline said that by allowing flight attendants to sit in seats throughout the plane at a distance from crewmembers and passengers (not in their designated jump seat), FAA likely helped airlines reduce the spread of the virus. FAA officials stated that it was up to each airline whether to apply for regulatory relief and that not all airlines did so. The airlines we contacted said they chose the exemptions that fit their operations. One airline ceased training pilots on aircraft used for international flights while another allowed its flight dispatchers to work from home. One airline official stated that although exempting crewmembers from demonstrating safety equipment was likely only marginally helpful, pilots and flight attendants appreciated that their safety was being acknowledged.
Airlines Credited FAA for Quick Actions in Support of Continuing Operations
Page 41 GAO-22-104429 COVID-19 Pandemic
Passenger airlines experienced a resurgence in demand for domestic leisure travel in the spring and summer of 2021; however, their recovery has been slowed by operational challenges and concerns about the COVID-19 Delta variant. In March 2021, the credit rating agency Fitch Ratings noted that a decline in COVID-19 death rates could be sufficient to loosen pandemic restrictions, increase consumer comfort with the idea of traveling, and begin a rebound in air travel.81 Fitch cautioned that the emergence of highly transmissible variants could extend the pandemic and delay a recovery in air travel in the United States and Canada.
According to the most recent BTS data available as of September 2021, passenger airlines carried 66 million passengers within the United States in July 2021, which was more than double passenger levels in either January or February 2021, and a roughly 191 percent increase compared to July 2020. In response to increasing demand for domestic leisure travel, U.S. airlines began adapting flight operations and their workforce levels in spring 2021. For example, in April 2021, United Airlines announced plans to hire 300 new pilots, and American Airlines announced it would add 150 new routes on its network in summer 2021.
81Fitch Ratings, North American Airline and Airport Pressures to Ease, Accelerating Recovery Later This Year, Fitch Wire (Mar., 11, 2021).
The Extent of Industry Recovery Remains Uncertain and Stakeholders Identified Considerations for Potential Federal Support Uncertainty about the Ongoing Recovery Remains despite Rebound in U.S. Leisure Travel Recovery in U.S. Leisure Travel is Slowing
Page 42 GAO-22-104429 COVID-19 Pandemic
On June 11, 2021, 2 million people crossed TSA airport security checkpoints, the highest level since March 7, 2020.82
However, in certain cases, the fast rebound in demand for air travel has exceeded airlines’ ability to return capacity to service, resulting in cancelled and rescheduled flights. For example, Spirit Airlines cancelled more than 2,000 flights between late July and early August. According to airlines, the increase in cancellations are due to a combination of staffing shortages, weather, and information technology problems.83 As noted above, many airlines reduced their staffing through voluntary and involuntary measures as a cost cutting measure and are now trying to hire and train more staff. However, retraining and recertifying some staff, especially pilots, can be a lengthy process.
The emergence and spread of the COVID-19 Delta variant appears to have contributed to weakened demand for air travel in late summer 2021. On July 27, 2021, prompted by a rise in COVID-19 case and hospitalization rates around the country, the CDC released updated guidance urging an increase in vaccination coverage around the country and recommending that people in areas of substantial or high transmission wear a mask in public or indoor places, even if they are fully vaccinated. On August 11, Southwest Airlines reported that bookings have slowed and trip cancellations have increased, which the airline attributed to the recent rise in COVID-19 cases associated with the Delta variant. According to the Airlines Reporting Corporation, tickets sales for the week of August 9 were down 41 percent compared to 2019, the worst differential between 2021 and 2019 sales since mid-May. The TSA reported that it screened 1,607,238 air passengers on August 17, a 28 percent decline from the 2,238,462 passengers screened on August 1. However, this decline also coincided with the summer travel season
82In June, the Centers for Disease Control and Prevention (CDC) updated its guidance to advise that fully vaccinated travelers could safely travel within the United States and U.S. territories provided that they continue to wear a mask as required on planes, buses, trains, and other forms of public transportation traveling into, within, or out of the United States and while indoors at U.S. transportation hubs such as airports and stations. The CDC also advised that travelers follow all state and local recommendations and requirements, including for mask wearing and social distancing.
83In 2019, we reported on airline technology issues, noting that federal regulators do not have data on airline technology outages, but we noted at least 34 instances of outages and the vast majority resulted in delays and cancellations. GAO, Commercial Aviation: Information on Airline IT Outages, GAO-19-514 (Washington DC; Jun 12, 2019).
Page 43 GAO-22-104429 COVID-19 Pandemic
winding down; in August 2019, there was a 16 percent decline in passengers screened over the same period.
Although U.S. airlines experienced a rebound in demand for domestic leisure travel in 2021, demand for international and business travel has lagged and is likely to continue to do so, according to aviation industry stakeholders including credit rating agencies and consulting firms. As discussed previously, international and business travel are critical contributors to the profitability of network airlines. According to McKinsey, for example, business travelers can account for 55–75 percent of airline profits.84 Some stakeholders project that it will take until sometime in the 2023–2025 period for a return to pre-pandemic traffic levels. These stakeholders note that international and business travel recovery are also dependent on factors including the progress of vaccine dissemination outside of the U.S. and the extent to which businesses continue to use videoconferencing in lieu of in-person meetings.
Demand for international air travel remains depressed in late summer 2021, and may not recover to pre-pandemic levels for several years, according to industry observers. International air travel remains roughly 40 percent below 2019 levels in early September 2021, according to A4A, and the consulting firm Oliver Wyman has projected that, based on pandemic-related travel restrictions, the growing number of infections due to COVID-19 variants, and the lack of progress in vaccine dissemination outside of the United States, international travel will not recover until 2023 or 2024.85
Industry analysts also expect a lag in the return of demand for business air travel. Moody’s reported in March 2021 that the extent to which virtual meetings will replace business travel in the longer term is unknown, and estimated that 10–30 percent of this segment may not return after the pandemic. According to Moody’s, factors that may limit the recovery of business travel include (1) greater use and familiarity with virtual meeting technologies, (2) a desire to continue to reap savings from reduced travel that were gained during the pandemic, (3) an increased interest in reducing carbon emissions, and (4) a greater emphasis on prioritizing travel dollars where they provide the greatest benefit, such as when it helps to promote customer relationships or revenue generation. Notably, Moody’s reported that while travel to meet with customers may return 84McKinsey & Company, For corporate travel, a long recovery ahead (August 2020).
85Oliver Wyman, Airline Economic Analysis 2020-21.
International and Business Air Travel Continue to Lag
Page 44 GAO-22-104429 COVID-19 Pandemic
relatively quickly, trips related to conventions or trade shows could be slower to recover. Forecasts from several industry observers vary, but generally converge on expecting a multi-year period for a return to pre-pandemic levels of business travel. For example, Moody’s forecasted in March 2021 that business travel will not reach 2019 levels until at least 2024,86 and McKinsey estimated in April 2021 that business travel will likely recover to 80 percent of pre-pandemic levels by 2024.87 The U.S. Travel Association and research firm Tourism Economics forecast in July 2021 that business travel will return to 76 percent of 2019 levels in 2022, 92 percent in 2023, and finally exceed 2019 levels in 2024.
The recovery of the aviation industry to profitability and financial health depends on how various aviation sectors—predominantly airlines, but also airports, manufacturers, and repair station operators—are able to adapt to evolving market conditions in the coming years. How sectors adapt, in turn, may result in changes to business models and operations.
Passenger Airlines
Industry analysts suggest that based on the expected lag in recovery for international and business air travel, airlines that serve primarily domestic routes and rely on leisure travel, such as low-cost airlines, are better positioned for near-term recovery than airlines that have focused on business and international travel. For example, Delta Air Lines, United Airlines, and American Airlines generate at least a third of their revenue from business travelers, according to Moody’s.88 As a result, these airlines may face challenges in regaining their previous level of profitability if demand for business travel does not quickly return to pre-pandemic levels. Airlines may act to offset the possible effects of a slow recovery in business travel by more conservatively managing capacity dedicated to such routes, increasing their focus on leisure travel, and raising leisure fares, according to Moody’s. In particular, they may choose to reconfigure aircraft cabins to focus on serving more leisure travelers, with less business-class seating and more economy or premium seating. According to Oliver Wyman’s Airline Economic Analysis 2020–2021, a
86Moody’s Investors Service, Business Travel Faces Higher Substitution Risk Post-COVID, But Airlines Will Adapt (Mar. 24, 2021).
87McKinsey & Company, Back to the future? Airline sector poised for change post-COVID-19 (April 2021).
88Moody’s Investors Service, Business Travel Faces Higher Substitution Risk Post-COVID, But Airlines Will Adapt (Mar. 24, 2021).
The Aviation Industry’s Recovery to Financial Health Depends on How It Adapts to the Evolving Market in the Coming Years
Page 45 GAO-22-104429 COVID-19 Pandemic
near-term focus on leisure travel will alter aspects of airlines’ demand forecasting and capacity planning, as patterns of leisure demand are different than business demand.
Airports
U.S. airport operators are also likely to face several challenges resulting from reduced air travel demand caused by the pandemic. In a dynamic similar to that facing U.S. airlines, airports oriented toward domestic leisure travel are expected to rebound more quickly than international gateway airports or those with a high reliance on business travelers, according to a March 2021 Fitch Ratings report. In January 2021, S&P Global Ratings reported that airports that have traditionally relied on strong business and international travel may have more difficulty or take longer to compensate for a loss of non-aeronautical revenues from parking, concessions, and rental car operations if the travelers that patronize these businesses are slow to return.89
Airports may also face challenges in capital planning moving forward, as airports reported deferring or delaying such projects during the pandemic. According to Airports Council International–North America, airports face a backlog of $115 billion in planned capital investments. Among other capital planning considerations, some smaller airports may face challenges in accommodating increasing passenger volumes with social distancing protocols still in place. For example, one industry analyst told us that airports that are near outdoor leisure destinations like national parks are experiencing increased demand, but have comparatively small physical footprints.
Manufacturers and Repair Station Operators
Evolving market conditions are affecting the airline industry’s demand for new aircraft as well as for maintenance services, with associated effects for manufacturers, repair stations, and other businesses in the aviation supply chain.
• Manufacturing. According to S&P Global Ratings, Airbus and Boeing reduced production of most aircraft models by 30–50 percent in 2020 in response to airline decisions to defer or cancel new aircraft orders.
89S&P Global Ratings, Outlook for U.S. Not-for-Profit Transportation Infrastructure: Light at Tunnel’s End–But How Long is the Tunnel? (Jan. 13, 2021).
Page 46 GAO-22-104429 COVID-19 Pandemic
S&P forecasts that aircraft production rates are likely to remain at this level in 2021 and may not reach 2018 levels until 2024.90 Based on recovering demand for domestic leisure travel, airline demand for narrowbody aircraft will likely recover before demand for the widebodies used for long-haul, international travel.91 Boeing, for example, reported slowing production of the widebody 787 aircraft from 14 per month before the pandemic to five per month as of March 31, 2021 based on reduced customer demand. However, according to Boeing’s data on airplane gross orders, orders for aircraft have increased recently. In January and February 2021, Boeing received orders for 86 aircraft; from March through July, the manufacturer received orders for 544 aircraft, the bulk of which are for the narrowbody 737 MAX.
• Maintenance, Repair, and Overhaul. A December 2020 report from S&P Global Ratings forecasted that repair stations may recover in line with increased demand for air travel as airlines bring aircraft back into service. Similarly, officials from the Aeronautical Repair Station Association (ARSA) told us in May 2021 that they are seeing a return in demand for aircraft maintenance service as network airlines return aircraft to service. According to ARSA, as demand has increased, pre-pandemic concerns about an industry shortage in aviation maintenance technicians have resumed.
During our review, aviation industry stakeholders identified several areas of concern for policymakers to consider as they determine how or whether to continue to assist the aviation industry as COVID-19 relief funds are expended and market conditions evolve. Additionally, stakeholders noted considerations for policymakers in preparing a federal aviation response to future pandemics.
As a result of workforce reductions undertaken in response to the pandemic, a key concern moving forward will be maintaining healthy workforce pipelines for key aviation professions including airline pilots and aviation maintenance technicians, according to representatives from airlines and repair stations we spoke with. These pipelines include collegiate training programs and apprenticeships. We have previously reported on industry concerns that an insufficient supply of airline pilots
90S&P Global Ratings, Industry Top Trends 2021–Aerospace and Defense (Dec. 10, 2020).
91Narrowbody aircraft have one aisle, whereas widebody aircraft have two aisles.
Aviation Industry Stakeholders Identified Considerations for Potential Federal Support
Strengthening the Aviation Workforce Pipeline
Page 47 GAO-22-104429 COVID-19 Pandemic
and maintenance technicians could develop as a result of retirements, education and training costs, and difficulty hiring individuals with desired experience levels.92 An Oliver Wyman study forecasts that a pilot shortage—a concern before the pandemic—will reemerge quickly and may exceed 12,000 pilots by 2023.93 Although reduced demand from the pandemic temporarily alleviated these pressures, they appear to have reemerged as firms face difficulty in replacing skilled aviation workers who were encouraged to retire, were laid off, or migrated to other industries during the industry downturn in 2020. In March 2021, the American Rescue Plan Act of 2021 was enacted, establishing the Aviation Manufacturing Jobs Protection (AMJP) Program. Through this program, DOT is to provide up to $3 billion in funding to eligible aviation manufacturing companies to pay up to half of their compensation costs for certain categories of employees, for up to six months.94 As we testified in March 2021, aviation workforce retraining and efforts to strengthen the pipeline of new applicants for aviation careers, such as through apprenticeships and pathway programs, could help ensure the workforce is ready to respond to future air travel demand.95
While communities of all sizes seek access to air service as a driver for attracting investment, generating employment, and providing mobility for citizens, as we have reported, small communities were collectively losing air service prior to COVID-19, and the pandemic may exacerbate this trend.96 DOT has required airlines receiving payroll payments and loans to maintain some service levels to small communities, as authorized by COVID-19 relief laws. In addition, the Consolidated Appropriations Act, 2021 set aside up to $5 million of the $2 billion appropriated for Grants-in-
92GAO, Aviation Workforce: Current and Future Availability of Airline Pilots, GAO-14-232 (Washington, D.C.: Feb. 28, 2014), and Aviation Workforce: Current and Future Availability of Aviation Maintenance and Engineering Professionals, GAO-14-237 (Washington, D.C.: Feb. 28, 2014).
93Oliver Wyman, “After COVID-19, Aviation Faces a Pilot Shortage.” March 2021.
94§ 7202, 135 Stat. 4, 103-04.
95GAO, COVID-19 Pandemic: Preliminary Observations on Efforts toward and Factors Affecting the Aviation Industry’s Recovery, GAO-21-412T (Washington, D.C.: Mar. 2, 2021).
96GAO, Small Community Air Service Development: Process for Awarding Grants Could Be Improved, GAO-19-172 (Washington, D.C.: March 26, 2019), and Commercial Aviation: Status of Air Service to Small Communities and the Federal Programs Involved, GAO-14-454T (Washington, D.C.: April 30, 2014).
Providing Small Communities Access to the National Transportation System
Page 48 GAO-22-104429 COVID-19 Pandemic
Aid for Airports for the Small Community Air Service Development Program (SCASDP).97 In addition, the Act directed that in allocating this funding and SCASDP funding for fiscal years 2019, 2020, and 2021, DOT give priority to communities that have had airline service reduced or suspended as a result of the pandemic.
As DOT ends these air service obligations in March 2022, some small communities may face a reduction in or a complete loss of air service as airlines focus on more profitable markets during recovery. Aviation stakeholders such as the Regional Airline Association have suggested that Congress address service reductions stemming from the pandemic by providing funding for Essential Air Service (EAS) and SCASDP to maintain service to small communities.98 We and others have found that a broader set of issues is driving the longer-term decline of air service to small communities, and solutions provided through other options such as bus service or unscheduled air taxi service, or in the longer term, Advanced Air Mobility technologies, may be worth consideration.99
The airline industry received substantial financial support from several COVID-19 relief assistance programs that aided businesses and protected jobs, but some analysts noted potential downsides to that support. While this assistance helped businesses respond to the unprecedented demand shock by keeping many workers on the payroll and enabled airlines and other businesses to be better prepared to meet demand when it returned, some analysts believe that it also may have deterred market adjustments that likely would have occurred in the
97SCASDP is a grant program designed to help small communities address air service and airfare issues. For more information, see GAO-19-172.
98The Airline Deregulation Act of 1978, which established the EAS program, specifies that if DOT determines that if air service will not be provided without subsidy, DOT shall use EAS program funds to award a subsidy to an airline willing to provide service. For more information, see GAO, Commercial Aviation: Effects of Changes to the Essential Air Service Program, and Stakeholders’ Views on Benefits, Challenges, and Potential Reforms, GAO-20-74 (Washington, D.C.: Dec. 10, 2019).
99Department of Transportation, Report of the Working Group on Improving Air Service to Small Communities (Washington, D.C.: May 9, 2017), and GAO, National Transportation System: Options and Analytical Tools to Strengthen DOT’s Approach to Supporting Communities’ Access to the System (Washington, D.C.: July 17, 2009). See also The National Academies of Sciences, Engineering, and Medicine, Advancing Aerial Mobility: A National Blueprint, (Washington, D.C.: 2020).
Considering Future Financial Assistance
Page 49 GAO-22-104429 COVID-19 Pandemic
absence of substantial assistance.100 For example, economic contraction and expansion—leading in some cases to mergers, restructuring, and liquidation—have been a feature of the airline industry since its deregulation in 1978. Despite the dramatic downturn in traffic and revenues, only two small airlines filed for bankruptcy in 2020.101 Although it may be too soon to examine these issues empirically, some analysts believe that pandemic relief could have delayed industry adjustments that might have proven to be beneficial in the long run. For example, business failure and new entry can spur relatively rapid and substantive readjustments in business models at minimal cost to taxpayers. According to some analysts, financial support also rewarded management, creditors, and shareholders that were shielded from the financial consequences of risks they had assumed.102 Additionally, analysts note that the industry might suffer if, based on the recent pandemic relief, airlines expect federal financial assistance when shocks to air travel demand occur in the future.103 That expectation might limit the steps firms would otherwise take to prepare for future disruptions, and as such, could hamper the industry’s development of longer-run resilience to respond to such events.
Several aviation stakeholders we spoke with in 2020 and early 2021, including representatives from airports and airlines, told us that passenger confidence in the air travel experience could have been restored more quickly if the federal government had provided greater coordination and guidance earlier in the pandemic regarding, among other things, COVID-19 testing, masking requirements, and baseline actions—such as sanitizing and updating signage—that airports and airlines could take.104 For example, representatives from one airport told
100Veronique de Rugy and Gary Leff, The Case Against Bailing Out the Airline Industry, George Mason University Mercatus Center, March 2020.
101Ravn Air and Air Miami International filed for Chapter 11 bankruptcy in 2020.
102Veronique de Rugy and Gary Leff, The Case Against Bailing Out the Airline Industry, George Mason University Mercatus Center, March 2020. See also Veronique de Rugy and Gary Leff, The Economic Case Against a Second Airline Payroll Bailout, George Mason University Mercatus Center, October 2020, and Hubert Horan, “The Airline Industry after COVID-19: Value Extraction or Recovery?” American Affairs, Spring 2021.
103Veronique de Rugy and Gary Leff, The Case Against Bailing Out the Airline Industry, George Mason University Mercatus Center, March 2020.
104These interviews were conducted before President Biden’s January 2021 executive order requiring mask-wearing on certain domestic modes of transportation.
Preparing for the Next Pandemic
Page 50 GAO-22-104429 COVID-19 Pandemic
us that inconsistent passenger procedures between origin and destination airports were a major challenge, and that the federal government has a pivotal role to play in restoring passenger confidence in flying. Such federal coordination and guidance is consistent with our June 2020 matter urging Congress to take legislative action to require DOT to work with relevant agencies and stakeholders, such as the Department of Health and Human Services (HHS) and the Department of Homeland Security (DHS), to develop a national aviation preparedness plan for communicable disease outbreaks.105 This plan would provide a mechanism for public health and aviation sectors to coordinate to limit the spread of communicable disease threats and minimize trade and travel impacts. Without such a plan, the U.S. may not be as prepared to minimize and quickly respond to future communicable disease threats. Members of the House and Senate have introduced bills in support of this matter. In February 2021, H.R. 884, the National Aviation Preparedness Plan Act of 2021,106 was introduced in the House of Representatives, and in May 2021, the Ensuring Health Safety in the Skies Act of 2021,107 was reported favorably out of the Senate Committee on Commerce, Science, and Transportation.
We provided a copy of this report to DOT for review and comment. DOT provided technical comments, which we incorporated as appropriate.
We are sending copies of this report to the appropriate congressional committees, the Secretary of Transportation, and other interested parties. In addition, the report is available at no charge on the GAO website at http://www.gao.gov.
105In 2015, we recommended that the Secretary of Transportation work with relevant stakeholders, such as the Department of Health and Human Services (HHS), to develop a national aviation-preparedness plan for communicable diseases. DOT agreed that an aviation-preparedness plan is needed. DOT, however, maintains that those agencies that have both legal authority and expertise for emergency response and public health—namely the Department of Homeland Security (DHS) and HHS—are best positioned to take the lead role in developing such a plan. We continue to believe that DOT would be in the best position to lead the effort because FAA and DOT have stronger and deeper ties to, as well as oversight responsibility for, the relevant stakeholders that would be most involved in such a broad effort, namely airlines, airports, and other aviation stakeholders. In June 2020, we urged Congress to take legislative action to require DOT to develop a national aviation-preparedness plan. See GAO-20-625.
106H.R. 884, 117th Cong. (2021).
107S. 82, 117th Cong. (2021).
Agency Comments
Page 51 GAO-22-104429 COVID-19 Pandemic
If you or your staff have any questions about this report, please contact Heather Krause at (202) 512-2834 or [email protected]. Contact points for our Offices of Congressional Relations and Public Affairs may be found on the last page of this report. GAO staff who made key contributions to this report are listed in appendix III.
Heather Krause Director, Physical Infrastructure Issues
Page 52 GAO-22-104429 COVID-19 Pandemic
List of Addressees The Honorable Patrick Leahy Chair The Honorable Richard Shelby Vice Chairman Committee on Appropriations United States Senate
The Honorable Ron Wyden Chair The Honorable Mike Crapo Ranking Member Committee on Finance United States Senate
The Honorable Patty Murray Chair The Honorable Richard Burr Ranking Member Committee on Health, Education, Labor, and Pensions United States Senate
The Honorable Gary C. Peters Chairman The Honorable Rob Portman Ranking Member Committee on Homeland Security and Governmental Affairs United States Senate
The Honorable Kyrsten Sinema Chair The Honorable James Lankford Ranking Member Subcommittee on Government Operations and Border Management Committee on Homeland Security and Governmental Affairs United States Senate
The Honorable Rosa L. DeLauro Chair The Honorable Kay Granger Ranking Member Committee on Appropriations
Page 53 GAO-22-104429 COVID-19 Pandemic
House of Representatives
The Honorable Frank Pallone, Jr. Chair The Honorable Cathy McMorris Rodgers Republican Leader Committee on Energy and Commerce House of Representatives
The Honorable Bennie G. Thompson Chair The Honorable John Katko Ranking Member Committee on Homeland Security House of Representatives
The Honorable Carolyn B. Maloney Chairwoman The Honorable James Comer Ranking Member Committee on Oversight and Reform House of Representatives
The Honorable Peter A. DeFazio Chair The Honorable Sam Graves Ranking Member Committee on Transportation and Infrastructure House of Representatives
The Honorable Richard Neal Chair The Honorable Kevin Brady Republican Leader Committee on Ways and Means House of Representatives
Page 54 GAO-22-104429 COVID-19 Pandemic
The Honorable Garret Graves Ranking Member Subcommittee on Aviation Committee on Transportation and Infrastructure House of Representatives
Appendix I: Objectives, Scope, and Methodology
Page 55 GAO-22-104429 COVID-19 Pandemic
This report addresses (1) the effects of the COVID-19 pandemic on selected aviation and aerospace industry sectors; (2) the actions, if any, that selected stakeholders took in response; (3) actions the Federal Aviation Administration took to help the aviation industry respond to the pandemic, and selected aviation stakeholders’ perspectives on those actions; and (4) the outlook for aviation industry recovery, and stakeholder considerations for potential federal support in assisting the aviation industry in the future.
To identify the effects of the pandemic on selected aviation industry sectors, we analyzed Department of Transportation (DOT) Form 41 financial and operational data for calendar years 2019 and 2020—the most recent and complete data available. All dollar figures in this report are nominal unless otherwise noted. To assess the reliability of these data, we reviewed the quality control procedures used by DOT and subsequently determined that the data were sufficiently reliable for our purposes. We also analyzed financial statements reported to the Securities and Exchange Commission by publicly-traded airlines and other aviation businesses from the first quarter through the fourth quarter of 2020 to obtain quantitative information on their financial performance as well as qualitative descriptions of the impact of the pandemic on businesses and actions those businesses took in response.1 We reported on the immediate effects of the pandemic based on the expectation that other effects will be long-term.
We conducted interviews about the effects of the COVID-19 pandemic on selected aviation and aerospace industry sectors and actions stakeholders took in response with a judgmental sample of 47 aviation and aerospace industry stakeholders, including six passenger airlines (two network, two low-cost, and two regional airlines); three cargo airlines; 11 large and medium hub airports; five airframe, engine, or aerostructures manufacturers; three repair stations that provide aircraft maintenance, repair, and overhaul services; two commercial space launch providers; two aviation labor organizations; one engineering and analytics firm; three credit rating agencies; two aviation industry analysts; and nine industry associations. We selected stakeholders to represent a cross-section of sectors within the aviation and aerospace industries as well as based on geographic representation. Because we used a judgmental sample of industry stakeholders, findings from these interviews cannot be generalized to a broader population. However, we
1The four quarters cover the 12 months of calendar year 2020.
Appendix I: Objectives, Scope, and Methodology
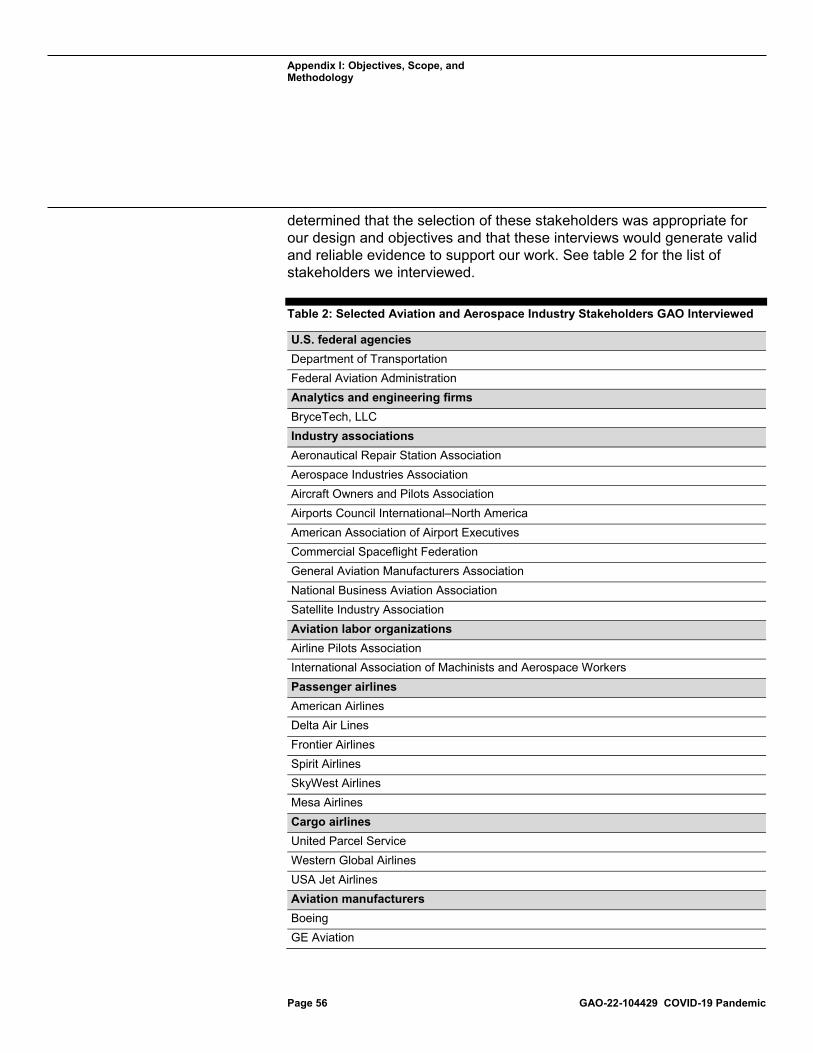
Appendix I: Objectives, Scope, and Methodology
Page 56 GAO-22-104429 COVID-19 Pandemic
determined that the selection of these stakeholders was appropriate for our design and objectives and that these interviews would generate valid and reliable evidence to support our work. See table 2 for the list of stakeholders we interviewed.
Table 2: Selected Aviation and Aerospace Industry Stakeholders GAO Interviewed
U.S. federal agencies Department of Transportation Federal Aviation Administration Analytics and engineering firms BryceTech, LLC Industry associations Aeronautical Repair Station Association Aerospace Industries Association Aircraft Owners and Pilots Association Airports Council International–North America American Association of Airport Executives Commercial Spaceflight Federation General Aviation Manufacturers Association National Business Aviation Association Satellite Industry Association Aviation labor organizations Airline Pilots Association International Association of Machinists and Aerospace Workers Passenger airlines American Airlines Delta Air Lines Frontier Airlines Spirit Airlines SkyWest Airlines Mesa Airlines Cargo airlines United Parcel Service Western Global Airlines USA Jet Airlines Aviation manufacturers Boeing GE Aviation
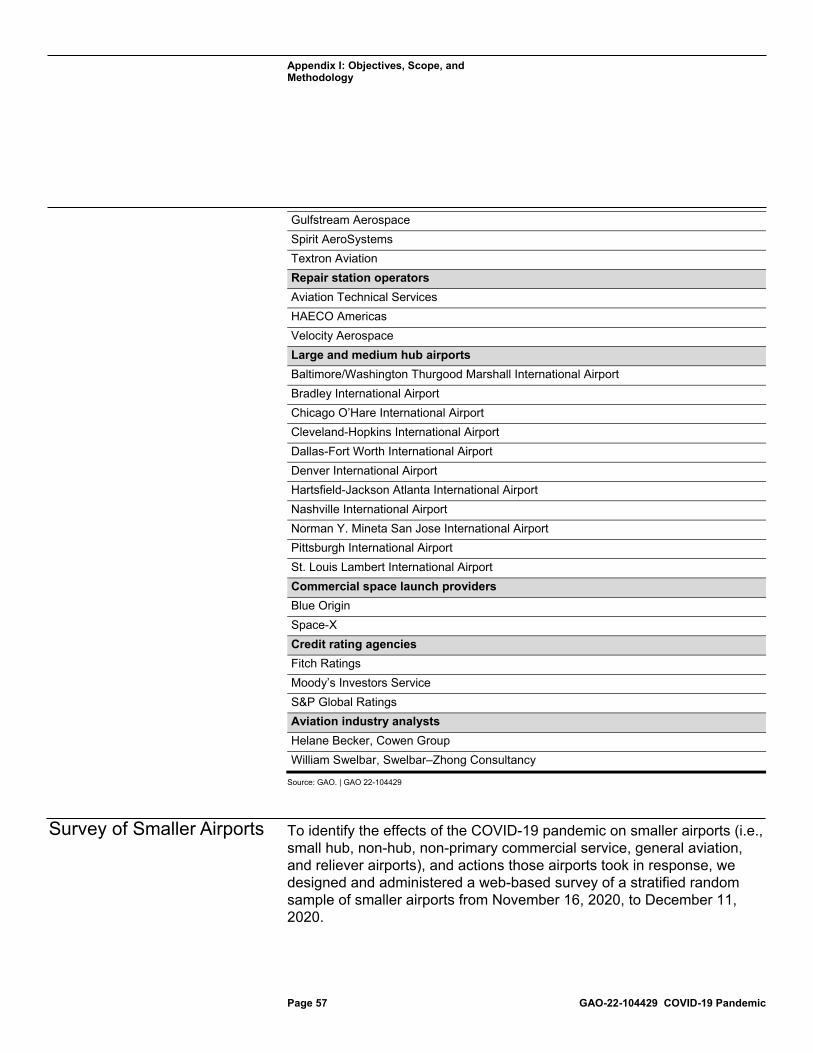
Appendix I: Objectives, Scope, and Methodology
Page 57 GAO-22-104429 COVID-19 Pandemic
Gulfstream Aerospace Spirit AeroSystems Textron Aviation Repair station operators Aviation Technical Services HAECO Americas Velocity Aerospace Large and medium hub airports Baltimore/Washington Thurgood Marshall International Airport Bradley International Airport Chicago O’Hare International Airport Cleveland-Hopkins International Airport Dallas-Fort Worth International Airport Denver International Airport Hartsfield-Jackson Atlanta International Airport Nashville International Airport Norman Y. Mineta San Jose International Airport Pittsburgh International Airport St. Louis Lambert International Airport Commercial space launch providers Blue Origin Space-X Credit rating agencies Fitch Ratings Moody’s Investors Service S&P Global Ratings Aviation industry analysts Helane Becker, Cowen Group William Swelbar, Swelbar–Zhong Consultancy
Source: GAO. | GAO 22-104429
To identify the effects of the COVID-19 pandemic on smaller airports (i.e., small hub, non-hub, non-primary commercial service, general aviation, and reliever airports), and actions those airports took in response, we designed and administered a web-based survey of a stratified random sample of smaller airports from November 16, 2020, to December 11, 2020.
Survey of Smaller Airports
Appendix I: Objectives, Scope, and Methodology
Page 58 GAO-22-104429 COVID-19 Pandemic
Survey Population and Sample Design
We constructed the population of airports for our survey sample using data on existing and proposed airports from the Federal Aviation Administration’s 2019-2023 National Plan of Integrated Airport Systems (NPIAS), the most recent version available when we began our audit work. Using NPIAS data, we determined that there were (1) 380 primary airports—including 30 large hub, 31 medium hub, 72 small hub, and 247 non-hub airports; (2) 2,941 non-primary airports—including 126 non-primary commercial service airports, 2,554 general aviation airports, and 261 reliever airports; 2 and (3) 7 proposed airports. We excluded from this population large hub and medium airports, non-primary airports with an unclassified role, airports outside of the continental U.S., and proposed airports. The outcome was a survey sample frame of 2,752 airports that included 64 small hub airports, 209 non-hub airports, 63 non-primary commercial service airports, and 2,416 general aviation and reliever airports.
We selected a stratified random sample of 1,136 airports that included 64 small hub airports, 209 non-hub airports, 63 non-primary commercial airports, and 800 general aviation and reliever airports. Small hub, non-hub, and non-primary commercial service airports were selected with certainty. To determine the appropriate sample size for the general aviation and reliever airports, we determined the minimum sample size needed to achieve precision levels of percentage estimates within plus or minus 5 percentage points. We then increased this sample size for an expected response rate of 64 percent in order to achieve the necessary number of completed surveys for our desired precision level (see table 3). We obtained completed questionnaires from 817 respondents, or about a 72 percent unweighted response rate. The weighted response rate was 65 percent. The survey results can be generalized to the target population of 2,752 smaller airports.
2Non-primary airports are categorized as either national, regional, local, basic, or unclassified.
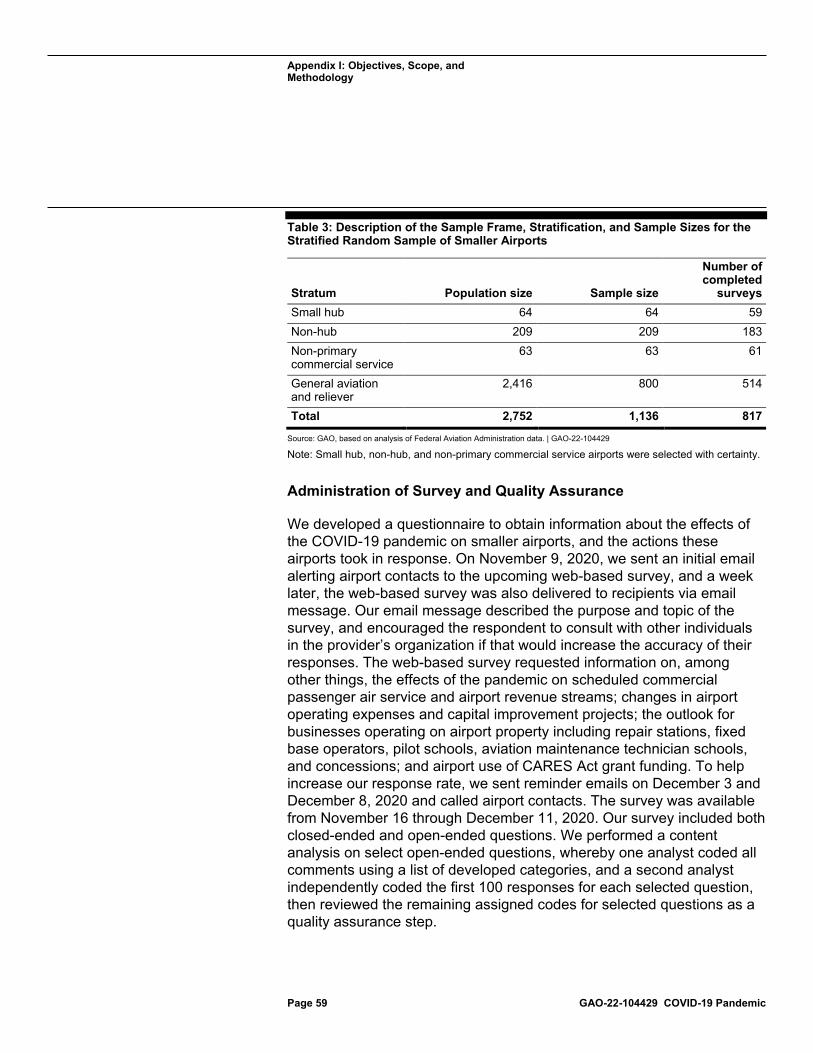
Appendix I: Objectives, Scope, and Methodology
Page 59 GAO-22-104429 COVID-19 Pandemic
Table 3: Description of the Sample Frame, Stratification, and Sample Sizes for the Stratified Random Sample of Smaller Airports
Stratum Population size Sample size
Number of completed
surveys Small hub 64 64 59 Non-hub 209 209 183 Non-primary commercial service
63 63 61
General aviation and reliever
2,416 800 514
Total 2,752 1,136 817 Source: GAO, based on analysis of Federal Aviation Administration data. | GAO-22-104429
Note: Small hub, non-hub, and non-primary commercial service airports were selected with certainty.
Administration of Survey and Quality Assurance
We developed a questionnaire to obtain information about the effects of the COVID-19 pandemic on smaller airports, and the actions these airports took in response. On November 9, 2020, we sent an initial email alerting airport contacts to the upcoming web-based survey, and a week later, the web-based survey was also delivered to recipients via email message. Our email message described the purpose and topic of the survey, and encouraged the respondent to consult with other individuals in the provider’s organization if that would increase the accuracy of their responses. The web-based survey requested information on, among other things, the effects of the pandemic on scheduled commercial passenger air service and airport revenue streams; changes in airport operating expenses and capital improvement projects; the outlook for businesses operating on airport property including repair stations, fixed base operators, pilot schools, aviation maintenance technician schools, and concessions; and airport use of CARES Act grant funding. To help increase our response rate, we sent reminder emails on December 3 and December 8, 2020 and called airport contacts. The survey was available from November 16 through December 11, 2020. Our survey included both closed-ended and open-ended questions. We performed a content analysis on select open-ended questions, whereby one analyst coded all comments using a list of developed categories, and a second analyst independently coded the first 100 responses for each selected question, then reviewed the remaining assigned codes for selected questions as a quality assurance step.
Appendix I: Objectives, Scope, and Methodology
Page 60 GAO-22-104429 COVID-19 Pandemic
To pretest the questionnaire, we conducted interviews with officials from eight airports with knowledge about their airport’s operations. Each pretest was conducted on the phone. We selected pretest respondents to represent a range of airport categories in different parts of the country. We conducted these pretests to determine if the questions were burdensome, understandable, and measured what we intended, and to ensure we could identify an appropriate individual who was knowledgeable about their airport operations to respond to the survey. On the basis of feedback from the pretests, we modified the questions as appropriate.
Sampling Error and Estimation
To produce the estimates from this survey, answers from each responding case were weighted in the analysis to generalize to the members of the population, including those who were not selected or did not respond to the survey. Estimates produced from this sample are generalizable to the target population of 2,752 smaller airports.
Because our results are based on a sample and different samples could provide different estimates, we express our confidence in the precision of our particular sample’s results as a 95 percent confidence interval. We are 95 percent confident that each of the confidence intervals in this report include the true values in the study population. Unless we note otherwise, percentage estimates based on all airports have 95 percent confidence intervals of within plus or minus 10 percentage points.
Non-Sampling Error
In addition to the reported sampling errors, the practical difficulties of conducting any survey may introduce other types of errors, commonly referred to as non-sampling errors. For example, differences in how a particular question is interpreted, the sources of information available to respondents, or the types of people who do not respond can introduce unwanted variability into the survey results. We included steps in both the data collection and data analysis stages for the purpose of minimizing such non-sampling errors.
We took the following steps to increase the response rate: pre-testing the questionnaires with airports, and conducting multiple follow-ups to identify the appropriate contact at some airports and to encourage responses to the survey.
Appendix I: Objectives, Scope, and Methodology
Page 61 GAO-22-104429 COVID-19 Pandemic
Survey Analysis
We analyzed the response status to our survey to identify potential sources of nonresponse bias, in accordance with best practices in survey research and echoed in Office of Management and Budget, Standards and Guidelines for Statistical Surveys (September 2006). We examined the response propensity of the sampled airports using both bivariate and multivariate logistic regression models. The factors we examined included airport characteristics available for respondents and non-respondents on the NPIAS sample frame: airport ownership, role, the number of revenue passengers that boarded aircraft (enplanements), the 5-year estimate of airport improvements eligible for federal development grants under the Airport Improvement Program, the number of aircraft hangered or based at the airport, and the stratification variable that combined hub and airport category. We detected significant associations between the probability of response and the stratification variable, role, enplanements, and number of based aircraft.
We adjusted for the characteristics significantly associated with response propensity using weighting class adjustments. Specifically, we grouped the predicted response propensity derived from our logistic regression model using quintiles of the predicted response propensity distribution to form five weighting adjustment groups. We applied nonresponse adjustments to the sampling weights within these groups to form nonresponse-adjusted analysis weights used in our survey analyses.
The nonresponse bias analysis and subsequent weighted adjustments only included variables available on the NPIAS sample frame and did not account for unobserved variables that could potentially be related to the likelihood of response. However, based on our knowledge of aviation operations, we did not expect survey responses or the likelihood of response to vary by other airport characteristics. Based on this nonresponse bias analysis and resulting nonresponse-adjusted analysis weights, we determined that estimates using these weights are generalizable to the population of smaller airports and are sufficiently reliable for the purposes of our reporting objectives.
We compared—as appropriate—weighted survey estimates generated by the airport strata described above. For each subgroup, we produced percentage estimates and standard errors for each level and used these results to confirm the significance of the differences between weighted survey estimates.
Appendix I: Objectives, Scope, and Methodology
Page 62 GAO-22-104429 COVID-19 Pandemic
To identify the actions the Federal Aviation Administration (FAA) took to help the aviation industry respond to the pandemic, we reviewed requests for regulatory relief submitted to FAA by aviation stakeholders and FAA’s regulatory rulemakings, exemptions, and extensions, as well as operational guidance. We interviewed officials from FAA divisions responsible for implementing these actions as well as those of the 47 aviation and aerospace stakeholders selected whose operations were potentially affected by these actions.
To describe the outlook for aviation industry recovery and stakeholder considerations for potential federal support in assisting the aviation industry in the future, we reviewed forecasts published by aviation industry stakeholders, including consulting firms, credit rating agencies, and an aviation manufacturer, and synthesized their findings. We also interviewed the 47 aviation and aerospace industry stakeholders to obtain their perspectives on considerations for federal assistance, and reviewed our prior work on civil aviation and federal assistance to the private sector.
We conducted this performance audit from July 2020 through October 2021 in accordance with generally accepted government auditing standards. Those standards require that we plan and perform the audit to obtain sufficient, appropriate evidence to provide a reasonable basis for our findings and conclusions based on our audit objectives. We believe that the evidence obtained provides a reasonable basis for our findings and conclusions based on our audit objectives.
Appendix II: Survey of Smaller Airports
Page 63 GAO-22-104429 COVID-19 Pandemic
This appendix contains selected questions from our survey of smaller airports and their responses. Our web-based survey of a stratified random sample of small hub, non-hub, non-primary commercial service, and general aviation and reliever airports was administered from November 16, 2020 to December 11, 2020. Our survey was comprised of two types of questions: those for which several possible answers were provided to choose from (closed-ended) and those that allowed respondents to provide their own answers (open-ended). We did not verify the statements of those who completed the survey. In this appendix, we include selected survey questions and aggregate results of responses to both closed-ended and open-ended questions. Using professional judgment, we excluded some survey questions from our analysis due to the timing of our survey field period and report issuance. The survey results for the closed-ended questions were weighted in our analysis to be generalizable to the members of our target population of 2,752 smaller airports, including those who were not selected or that did not respond to our survey. General aviation and reliever airports made up the majority (about 88 percent) of smaller airports (see table 4). For all questions that ask for a comparison between 2019 and 2020, the respondent was presented with a range of options, including: (1) decrease by 76-100%, 51-75%, 26-50%, 10-25%, or less than 10%; (2) about the same (roughly 0%); and (3) increase by more than 100%, 76-100%, 51-75%, 26-50%, 10-25%, or less than 10%. In our analysis, we collapsed the response categories in order to produce statistically reliable estimates. For selected open-ended questions, we performed a non-generalizable content analysis of written responses. For a detailed discussion of our survey methodologies, see appendix I.
Results for the generalizable, closed-ended questions are presented below with lower and upper bounds for 95 percent confidence intervals. We have noted where the margin of error between the estimate and the upper or lower bound is greater than 10 or 20 percentage points:
• Superscript “a”: The margin of error between the estimate and the upper or lower bound is greater than 10 percentage points, and therefore should be interpreted with caution.
• DNR (data not reliable): The margin of error between the estimate and upper or lower bound is greater than 20 percentage points and was considered unreliable; these estimates were not included in our findings.
Appendix II: Survey of Smaller Airports
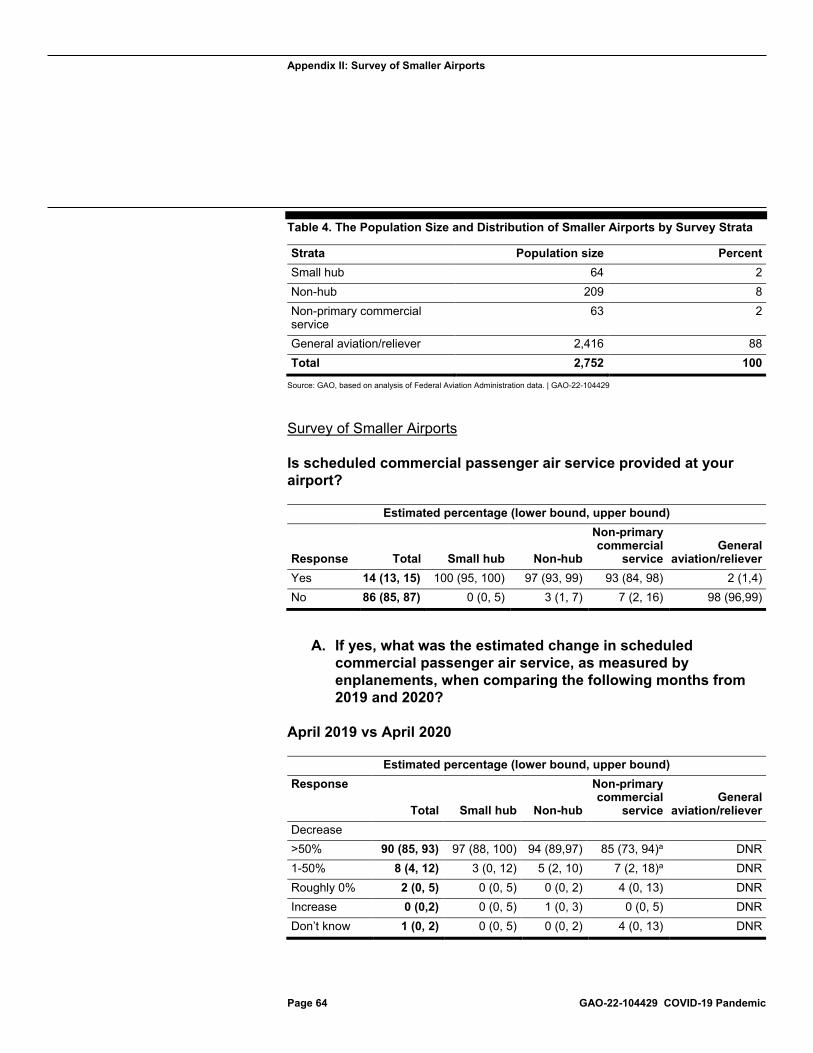
Appendix II: Survey of Smaller Airports
Page 64 GAO-22-104429 COVID-19 Pandemic
Table 4. The Population Size and Distribution of Smaller Airports by Survey Strata
Strata Population size Percent Small hub 64 2 Non-hub 209 8 Non-primary commercial service
63 2
General aviation/reliever 2,416 88 Total 2,752 100
Source: GAO, based on analysis of Federal Aviation Administration data. | GAO-22-104429
Survey of Smaller Airports
Is scheduled commercial passenger air service provided at your airport?
Estimated percentage (lower bound, upper bound)
Response Total Small hub Non-hub
Non-primary commercial
service General
aviation/reliever Yes 14 (13, 15) 100 (95, 100) 97 (93, 99) 93 (84, 98) 2 (1,4) No 86 (85, 87) 0 (0, 5) 3 (1, 7) 7 (2, 16) 98 (96,99)
A. If yes, what was the estimated change in scheduled commercial passenger air service, as measured by enplanements, when comparing the following months from 2019 and 2020?
April 2019 vs April 2020
Estimated percentage (lower bound, upper bound) Response
Total Small hub Non-hub
Non-primary commercial
service General
aviation/reliever Decrease >50% 90 (85, 93) 97 (88, 100) 94 (89,97) 85 (73, 94)a DNR 1-50% 8 (4, 12) 3 (0, 12) 5 (2, 10) 7 (2, 18)a DNR Roughly 0% 2 (0, 5) 0 (0, 5) 0 (0, 2) 4 (0, 13) DNR Increase 0 (0,2) 0 (0, 5) 1 (0, 3) 0 (0, 5) DNR Don’t know 1 (0, 2) 0 (0, 5) 0 (0, 2) 4 (0, 13) DNR
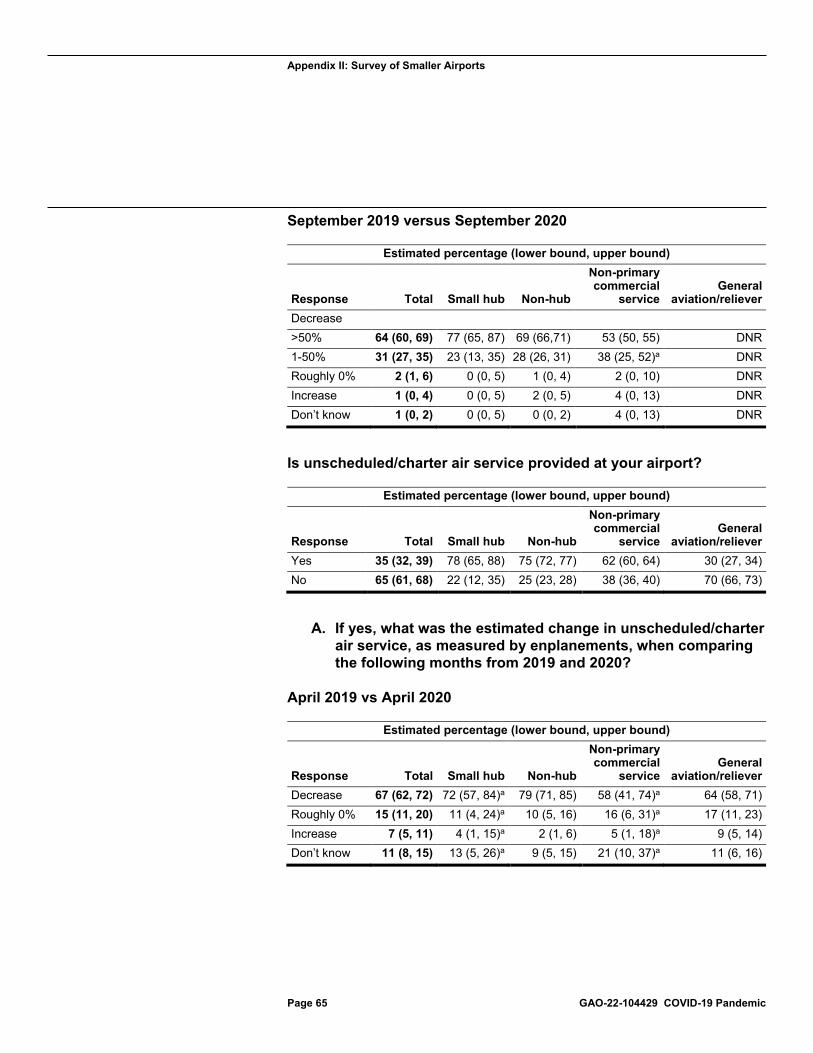
Appendix II: Survey of Smaller Airports
Page 65 GAO-22-104429 COVID-19 Pandemic
September 2019 versus September 2020
Estimated percentage (lower bound, upper bound)
Response Total Small hub Non-hub
Non-primary commercial
service General
aviation/reliever Decrease >50% 64 (60, 69) 77 (65, 87) 69 (66,71) 53 (50, 55) DNR 1-50% 31 (27, 35) 23 (13, 35) 28 (26, 31) 38 (25, 52)a DNR Roughly 0% 2 (1, 6) 0 (0, 5) 1 (0, 4) 2 (0, 10) DNR Increase 1 (0, 4) 0 (0, 5) 2 (0, 5) 4 (0, 13) DNR Don’t know 1 (0, 2) 0 (0, 5) 0 (0, 2) 4 (0, 13) DNR
Is unscheduled/charter air service provided at your airport?
Estimated percentage (lower bound, upper bound)
Response Total Small hub Non-hub
Non-primary commercial
service General
aviation/reliever Yes 35 (32, 39) 78 (65, 88) 75 (72, 77) 62 (60, 64) 30 (27, 34) No 65 (61, 68) 22 (12, 35) 25 (23, 28) 38 (36, 40) 70 (66, 73)
A. If yes, what was the estimated change in unscheduled/charter air service, as measured by enplanements, when comparing the following months from 2019 and 2020?
April 2019 vs April 2020
Estimated percentage (lower bound, upper bound)
Response Total Small hub Non-hub
Non-primary commercial
service General
aviation/reliever Decrease 67 (62, 72) 72 (57, 84)a 79 (71, 85) 58 (41, 74)a 64 (58, 71) Roughly 0% 15 (11, 20) 11 (4, 24)a 10 (5, 16) 16 (6, 31)a 17 (11, 23) Increase 7 (5, 11) 4 (1, 15)a 2 (1, 6) 5 (1, 18)a 9 (5, 14) Don’t know 11 (8, 15) 13 (5, 26)a 9 (5, 15) 21 (10, 37)a 11 (6, 16)
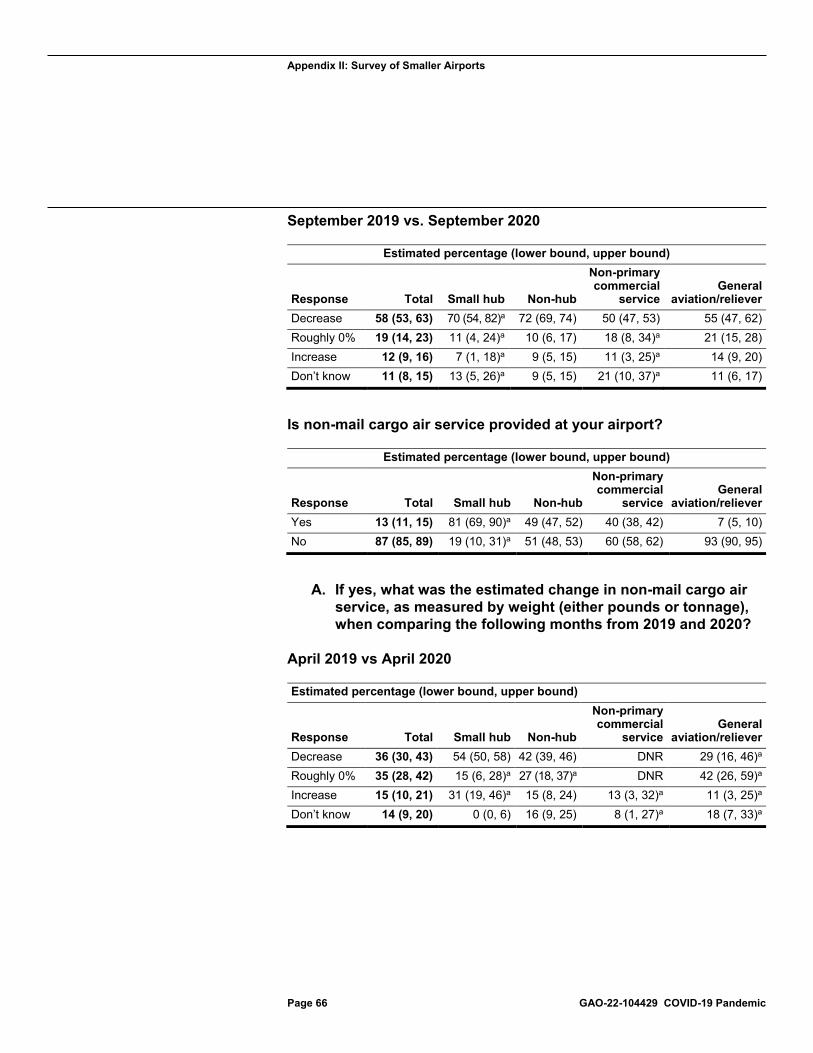
Appendix II: Survey of Smaller Airports
Page 66 GAO-22-104429 COVID-19 Pandemic
September 2019 vs. September 2020
Estimated percentage (lower bound, upper bound)
Response Total Small hub Non-hub
Non-primary commercial
service General
aviation/reliever Decrease 58 (53, 63) 70 (54, 82)a 72 (69, 74) 50 (47, 53) 55 (47, 62) Roughly 0% 19 (14, 23) 11 (4, 24)a 10 (6, 17) 18 (8, 34)a 21 (15, 28) Increase 12 (9, 16) 7 (1, 18)a 9 (5, 15) 11 (3, 25)a 14 (9, 20) Don’t know 11 (8, 15) 13 (5, 26)a 9 (5, 15) 21 (10, 37)a 11 (6, 17)
Is non-mail cargo air service provided at your airport?
Estimated percentage (lower bound, upper bound)
Response Total Small hub Non-hub
Non-primary commercial
service General
aviation/reliever Yes 13 (11, 15) 81 (69, 90)a 49 (47, 52) 40 (38, 42) 7 (5, 10) No 87 (85, 89) 19 (10, 31)a 51 (48, 53) 60 (58, 62) 93 (90, 95)
A. If yes, what was the estimated change in non-mail cargo air service, as measured by weight (either pounds or tonnage), when comparing the following months from 2019 and 2020?
April 2019 vs April 2020
Estimated percentage (lower bound, upper bound)
Response Total Small hub Non-hub
Non-primary commercial
service General
aviation/reliever Decrease 36 (30, 43) 54 (50, 58) 42 (39, 46) DNR 29 (16, 46)a Roughly 0% 35 (28, 42) 15 (6, 28)a 27 (18, 37)a DNR 42 (26, 59)a Increase 15 (10, 21) 31 (19, 46)a 15 (8, 24) 13 (3, 32)a 11 (3, 25)a Don’t know 14 (9, 20) 0 (0, 6) 16 (9, 25) 8 (1, 27)a 18 (7, 33)a
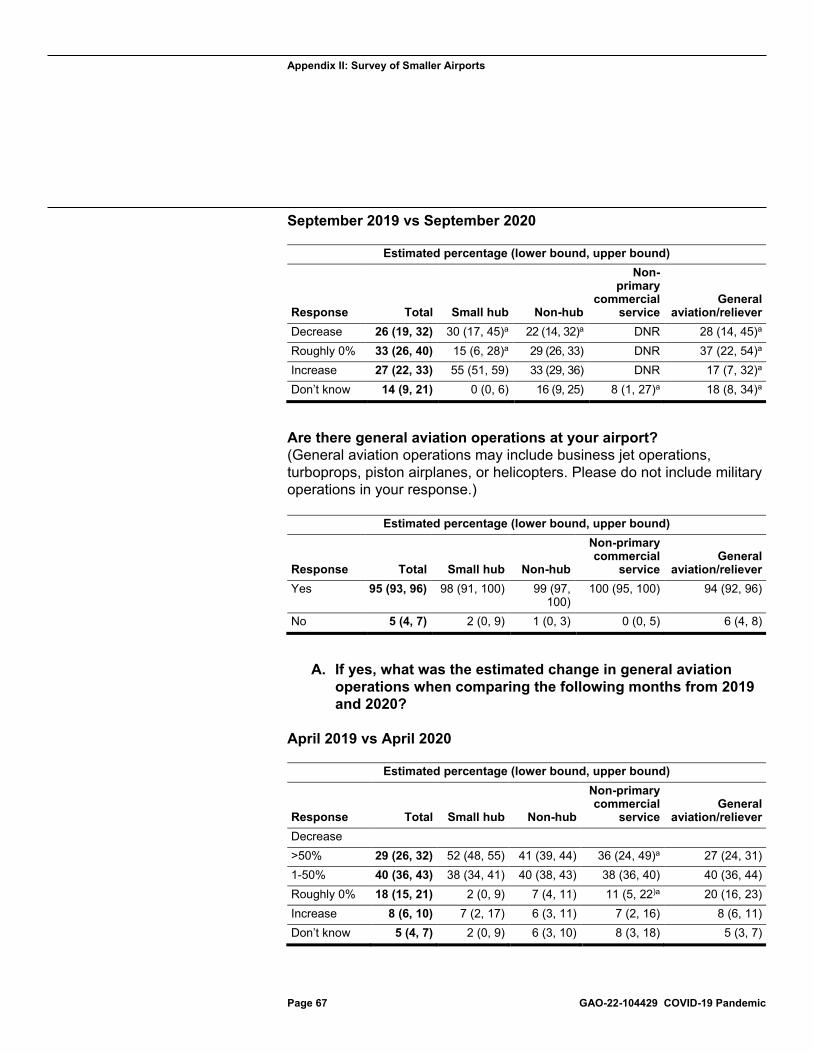
Appendix II: Survey of Smaller Airports
Page 67 GAO-22-104429 COVID-19 Pandemic
September 2019 vs September 2020
Estimated percentage (lower bound, upper bound)
Response Total Small hub Non-hub
Non-primary
commercial service
General aviation/reliever
Decrease 26 (19, 32) 30 (17, 45)a 22 (14, 32)a DNR 28 (14, 45)a Roughly 0% 33 (26, 40) 15 (6, 28)a 29 (26, 33) DNR 37 (22, 54)a Increase 27 (22, 33) 55 (51, 59) 33 (29, 36) DNR 17 (7, 32)a Don’t know 14 (9, 21) 0 (0, 6) 16 (9, 25) 8 (1, 27)a 18 (8, 34)a
Are there general aviation operations at your airport? (General aviation operations may include business jet operations, turboprops, piston airplanes, or helicopters. Please do not include military operations in your response.)
Estimated percentage (lower bound, upper bound)
Response Total Small hub Non-hub
Non-primary commercial
service General
aviation/reliever Yes 95 (93, 96) 98 (91, 100) 99 (97,
100) 100 (95, 100) 94 (92, 96)
No 5 (4, 7) 2 (0, 9) 1 (0, 3) 0 (0, 5) 6 (4, 8)
A. If yes, what was the estimated change in general aviation operations when comparing the following months from 2019 and 2020?
April 2019 vs April 2020
Estimated percentage (lower bound, upper bound)
Response Total Small hub Non-hub
Non-primary commercial
service General
aviation/reliever Decrease >50% 29 (26, 32) 52 (48, 55) 41 (39, 44) 36 (24, 49)a 27 (24, 31) 1-50% 40 (36, 43) 38 (34, 41) 40 (38, 43) 38 (36, 40) 40 (36, 44) Roughly 0% 18 (15, 21) 2 (0, 9) 7 (4, 11) 11 (5, 22)a 20 (16, 23) Increase 8 (6, 10) 7 (2, 17) 6 (3, 11) 7 (2, 16) 8 (6, 11) Don’t know 5 (4, 7) 2 (0, 9) 6 (3, 10) 8 (3, 18) 5 (3, 7)
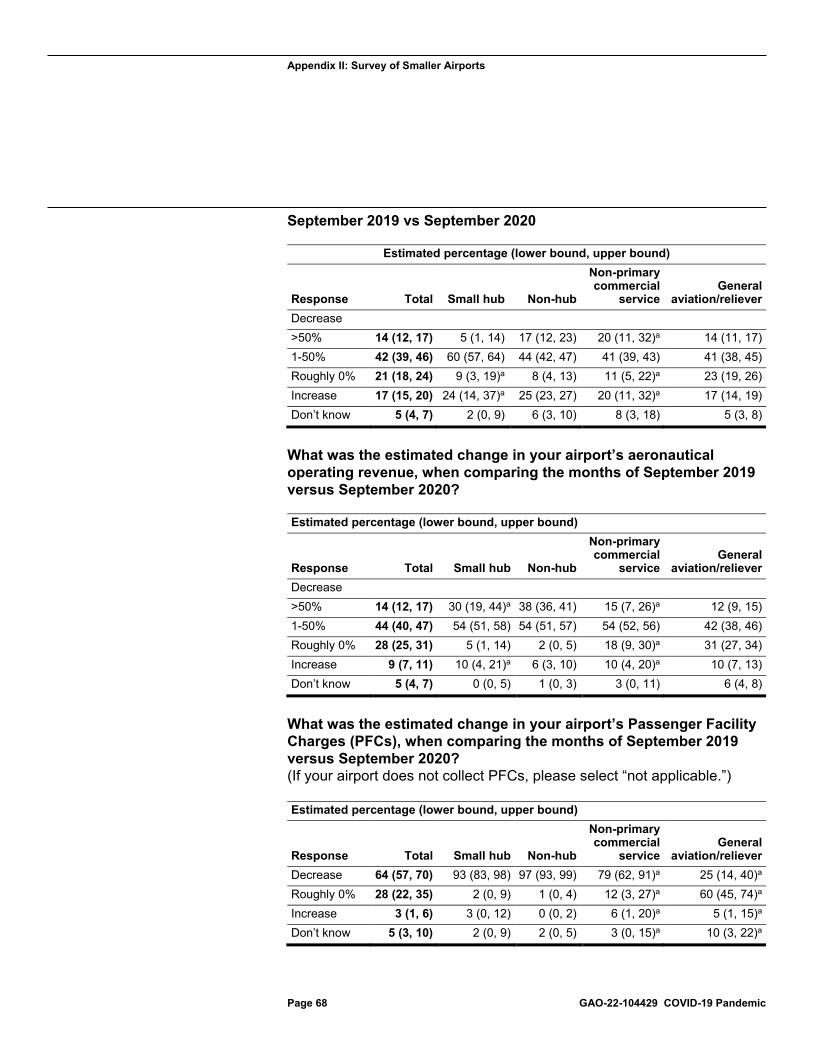
Appendix II: Survey of Smaller Airports
Page 68 GAO-22-104429 COVID-19 Pandemic
September 2019 vs September 2020
Estimated percentage (lower bound, upper bound)
Response Total Small hub Non-hub
Non-primary commercial
service General
aviation/reliever Decrease >50% 14 (12, 17) 5 (1, 14) 17 (12, 23) 20 (11, 32)a 14 (11, 17) 1-50% 42 (39, 46) 60 (57, 64) 44 (42, 47) 41 (39, 43) 41 (38, 45) Roughly 0% 21 (18, 24) 9 (3, 19)a 8 (4, 13) 11 (5, 22)a 23 (19, 26) Increase 17 (15, 20) 24 (14, 37)a 25 (23, 27) 20 (11, 32)a 17 (14, 19) Don’t know 5 (4, 7) 2 (0, 9) 6 (3, 10) 8 (3, 18) 5 (3, 8)
What was the estimated change in your airport’s aeronautical operating revenue, when comparing the months of September 2019 versus September 2020?
Estimated percentage (lower bound, upper bound)
Response Total Small hub Non-hub
Non-primary commercial
service General
aviation/reliever Decrease >50% 14 (12, 17) 30 (19, 44)a 38 (36, 41) 15 (7, 26)a 12 (9, 15) 1-50% 44 (40, 47) 54 (51, 58) 54 (51, 57) 54 (52, 56) 42 (38, 46) Roughly 0% 28 (25, 31) 5 (1, 14) 2 (0, 5) 18 (9, 30)a 31 (27, 34) Increase 9 (7, 11) 10 (4, 21)a 6 (3, 10) 10 (4, 20)a 10 (7, 13) Don’t know 5 (4, 7) 0 (0, 5) 1 (0, 3) 3 (0, 11) 6 (4, 8)
What was the estimated change in your airport’s Passenger Facility Charges (PFCs), when comparing the months of September 2019 versus September 2020? (If your airport does not collect PFCs, please select “not applicable.”)
Estimated percentage (lower bound, upper bound)
Response Total Small hub Non-hub
Non-primary commercial
service General
aviation/reliever Decrease 64 (57, 70) 93 (83, 98) 97 (93, 99) 79 (62, 91)a 25 (14, 40)a Roughly 0% 28 (22, 35) 2 (0, 9) 1 (0, 4) 12 (3, 27)a 60 (45, 74)a Increase 3 (1, 6) 3 (0, 12) 0 (0, 2) 6 (1, 20)a 5 (1, 15)a Don’t know 5 (3, 10) 2 (0, 9) 2 (0, 5) 3 (0, 15)a 10 (3, 22)a
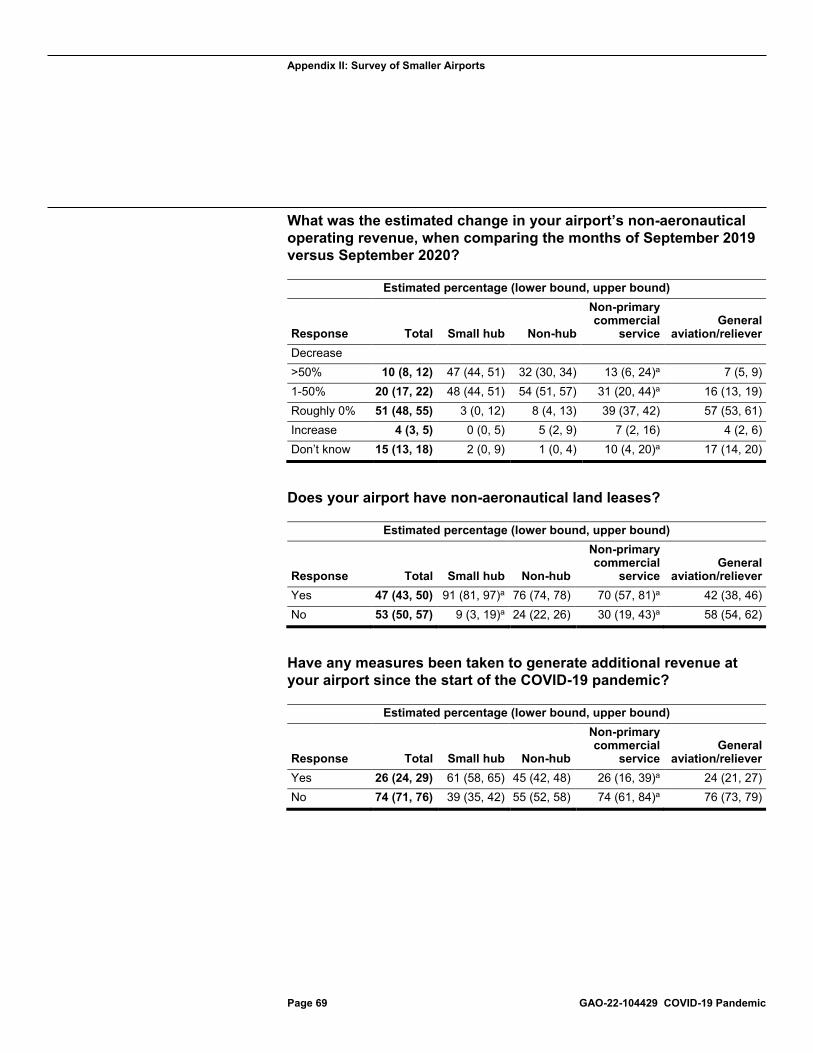
Appendix II: Survey of Smaller Airports
Page 69 GAO-22-104429 COVID-19 Pandemic
What was the estimated change in your airport’s non-aeronautical operating revenue, when comparing the months of September 2019 versus September 2020?
Estimated percentage (lower bound, upper bound)
Response Total Small hub Non-hub
Non-primary commercial
service General
aviation/reliever Decrease >50% 10 (8, 12) 47 (44, 51) 32 (30, 34) 13 (6, 24)a 7 (5, 9) 1-50% 20 (17, 22) 48 (44, 51) 54 (51, 57) 31 (20, 44)a 16 (13, 19) Roughly 0% 51 (48, 55) 3 (0, 12) 8 (4, 13) 39 (37, 42) 57 (53, 61) Increase 4 (3, 5) 0 (0, 5) 5 (2, 9) 7 (2, 16) 4 (2, 6) Don’t know 15 (13, 18) 2 (0, 9) 1 (0, 4) 10 (4, 20)a 17 (14, 20)
Does your airport have non-aeronautical land leases?
Estimated percentage (lower bound, upper bound)
Response Total Small hub Non-hub
Non-primary commercial
service General
aviation/reliever Yes 47 (43, 50) 91 (81, 97)a 76 (74, 78) 70 (57, 81)a 42 (38, 46) No 53 (50, 57) 9 (3, 19)a 24 (22, 26) 30 (19, 43)a 58 (54, 62)
Have any measures been taken to generate additional revenue at your airport since the start of the COVID-19 pandemic?
Estimated percentage (lower bound, upper bound)
Response Total Small hub Non-hub
Non-primary commercial
service General
aviation/reliever Yes 26 (24, 29) 61 (58, 65) 45 (42, 48) 26 (16, 39)a 24 (21, 27) No 74 (71, 76) 39 (35, 42) 55 (52, 58) 74 (61, 84)a 76 (73, 79)
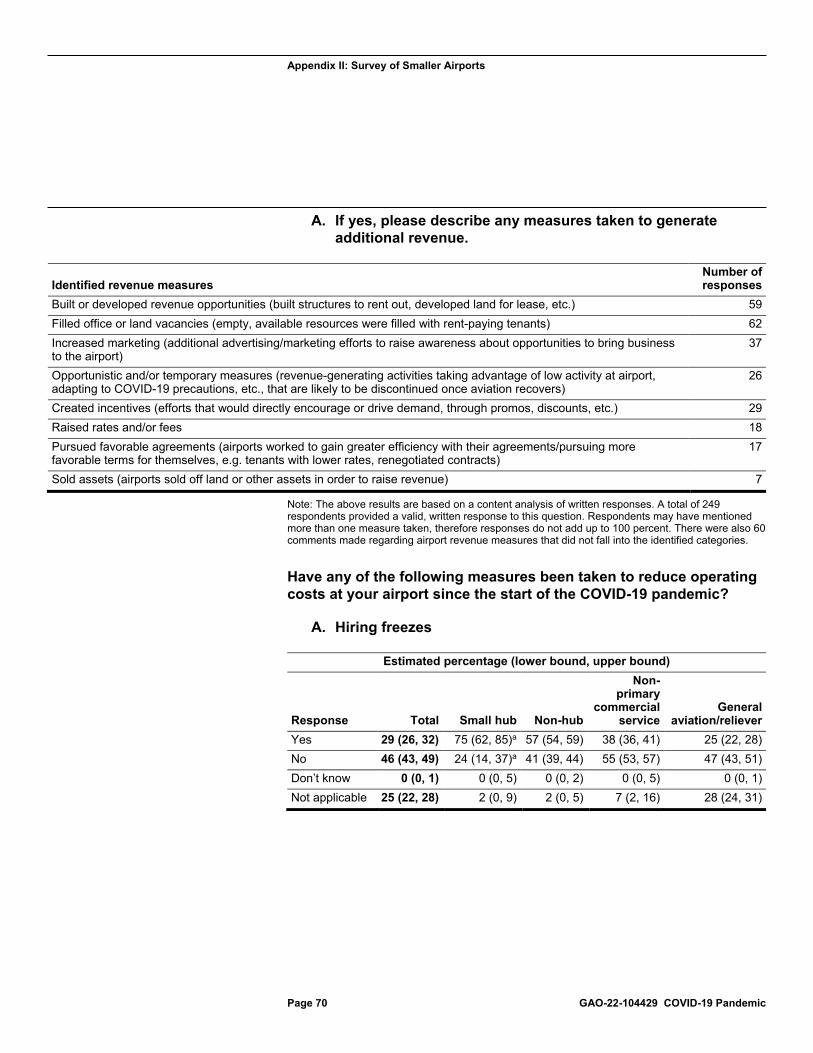
Appendix II: Survey of Smaller Airports
Page 70 GAO-22-104429 COVID-19 Pandemic
A. If yes, please describe any measures taken to generate additional revenue.
Identified revenue measures Number of responses
Built or developed revenue opportunities (built structures to rent out, developed land for lease, etc.) 59 Filled office or land vacancies (empty, available resources were filled with rent-paying tenants) 62 Increased marketing (additional advertising/marketing efforts to raise awareness about opportunities to bring business to the airport)
37
Opportunistic and/or temporary measures (revenue-generating activities taking advantage of low activity at airport, adapting to COVID-19 precautions, etc., that are likely to be discontinued once aviation recovers)
26
Created incentives (efforts that would directly encourage or drive demand, through promos, discounts, etc.) 29 Raised rates and/or fees 18 Pursued favorable agreements (airports worked to gain greater efficiency with their agreements/pursuing more favorable terms for themselves, e.g. tenants with lower rates, renegotiated contracts)
17
Sold assets (airports sold off land or other assets in order to raise revenue) 7
Note: The above results are based on a content analysis of written responses. A total of 249 respondents provided a valid, written response to this question. Respondents may have mentioned more than one measure taken, therefore responses do not add up to 100 percent. There were also 60 comments made regarding airport revenue measures that did not fall into the identified categories.
Have any of the following measures been taken to reduce operating costs at your airport since the start of the COVID-19 pandemic?
A. Hiring freezes
Estimated percentage (lower bound, upper bound)
Response Total Small hub Non-hub
Non-primary
commercial service
General aviation/reliever
Yes 29 (26, 32) 75 (62, 85)a 57 (54, 59) 38 (36, 41) 25 (22, 28) No 46 (43, 49) 24 (14, 37)a 41 (39, 44) 55 (53, 57) 47 (43, 51) Don’t know 0 (0, 1) 0 (0, 5) 0 (0, 2) 0 (0, 5) 0 (0, 1) Not applicable 25 (22, 28) 2 (0, 9) 2 (0, 5) 7 (2, 16) 28 (24, 31)
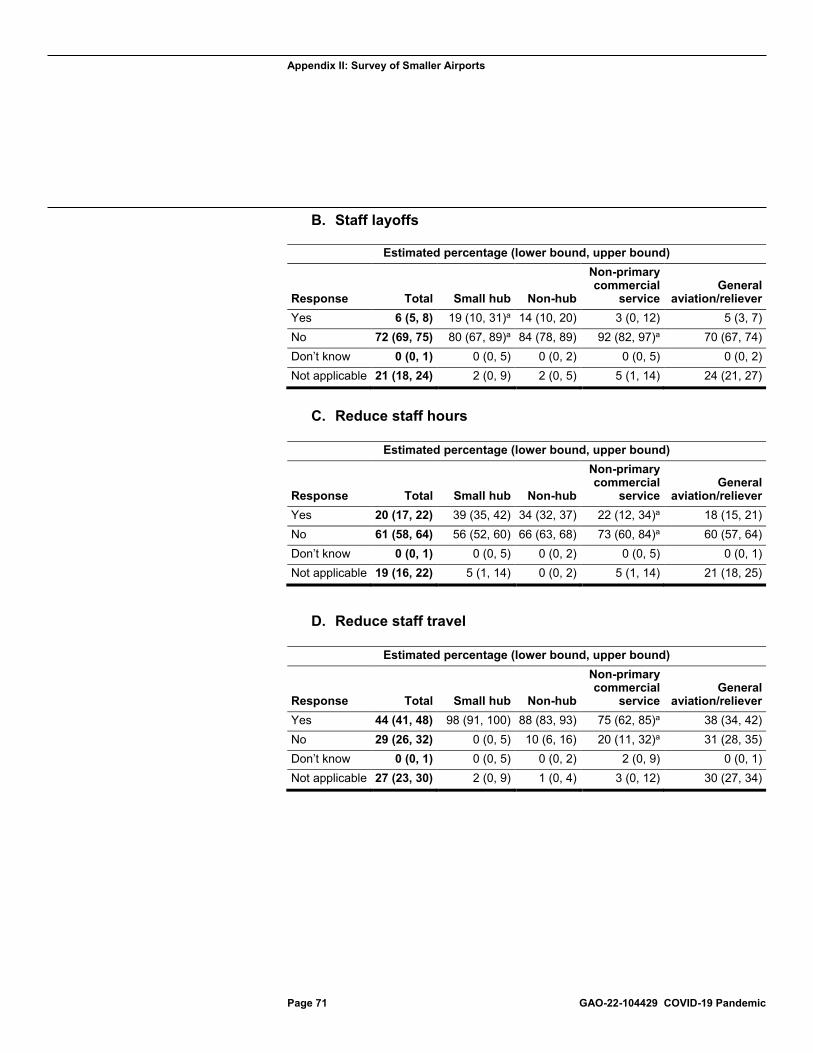
Appendix II: Survey of Smaller Airports
Page 71 GAO-22-104429 COVID-19 Pandemic
B. Staff layoffs
Estimated percentage (lower bound, upper bound)
Response Total Small hub Non-hub
Non-primary commercial
service General
aviation/reliever Yes 6 (5, 8) 19 (10, 31)a 14 (10, 20) 3 (0, 12) 5 (3, 7) No 72 (69, 75) 80 (67, 89)a 84 (78, 89) 92 (82, 97)a 70 (67, 74) Don’t know 0 (0, 1) 0 (0, 5) 0 (0, 2) 0 (0, 5) 0 (0, 2) Not applicable 21 (18, 24) 2 (0, 9) 2 (0, 5) 5 (1, 14) 24 (21, 27)
C. Reduce staff hours
Estimated percentage (lower bound, upper bound)
Response Total Small hub Non-hub
Non-primary commercial
service General
aviation/reliever Yes 20 (17, 22) 39 (35, 42) 34 (32, 37) 22 (12, 34)a 18 (15, 21) No 61 (58, 64) 56 (52, 60) 66 (63, 68) 73 (60, 84)a 60 (57, 64) Don’t know 0 (0, 1) 0 (0, 5) 0 (0, 2) 0 (0, 5) 0 (0, 1) Not applicable 19 (16, 22) 5 (1, 14) 0 (0, 2) 5 (1, 14) 21 (18, 25)
D. Reduce staff travel
Estimated percentage (lower bound, upper bound)
Response Total Small hub Non-hub
Non-primary commercial
service General
aviation/reliever Yes 44 (41, 48) 98 (91, 100) 88 (83, 93) 75 (62, 85)a 38 (34, 42) No 29 (26, 32) 0 (0, 5) 10 (6, 16) 20 (11, 32)a 31 (28, 35) Don’t know 0 (0, 1) 0 (0, 5) 0 (0, 2) 2 (0, 9) 0 (0, 1) Not applicable 27 (23, 30) 2 (0, 9) 1 (0, 4) 3 (0, 12) 30 (27, 34)
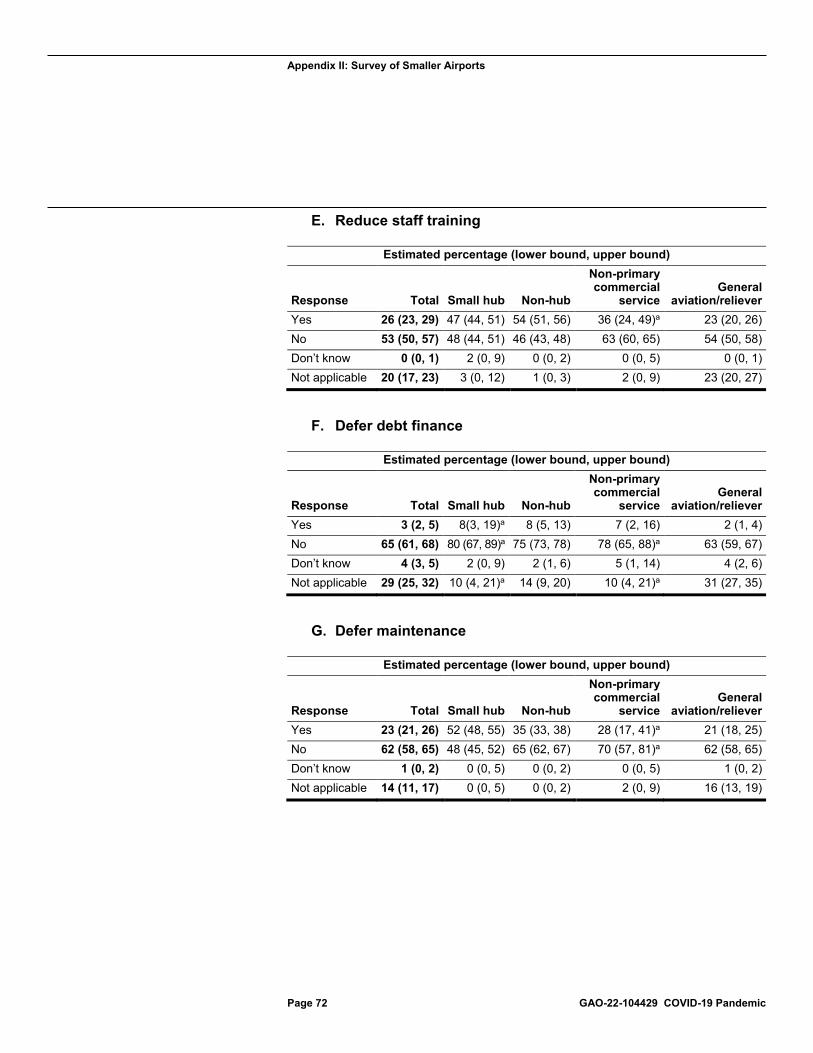
Appendix II: Survey of Smaller Airports
Page 72 GAO-22-104429 COVID-19 Pandemic
E. Reduce staff training
Estimated percentage (lower bound, upper bound)
Response Total Small hub Non-hub
Non-primary commercial
service General
aviation/reliever Yes 26 (23, 29) 47 (44, 51) 54 (51, 56) 36 (24, 49)a 23 (20, 26) No 53 (50, 57) 48 (44, 51) 46 (43, 48) 63 (60, 65) 54 (50, 58) Don’t know 0 (0, 1) 2 (0, 9) 0 (0, 2) 0 (0, 5) 0 (0, 1) Not applicable 20 (17, 23) 3 (0, 12) 1 (0, 3) 2 (0, 9) 23 (20, 27)
F. Defer debt finance
Estimated percentage (lower bound, upper bound)
Response Total Small hub Non-hub
Non-primary commercial
service General
aviation/reliever Yes 3 (2, 5) 8(3, 19)a 8 (5, 13) 7 (2, 16) 2 (1, 4) No 65 (61, 68) 80 (67, 89)a 75 (73, 78) 78 (65, 88)a 63 (59, 67) Don’t know 4 (3, 5) 2 (0, 9) 2 (1, 6) 5 (1, 14) 4 (2, 6) Not applicable 29 (25, 32) 10 (4, 21)a 14 (9, 20) 10 (4, 21)a 31 (27, 35)
G. Defer maintenance
Estimated percentage (lower bound, upper bound)
Response Total Small hub Non-hub
Non-primary commercial
service General
aviation/reliever Yes 23 (21, 26) 52 (48, 55) 35 (33, 38) 28 (17, 41)a 21 (18, 25) No 62 (58, 65) 48 (45, 52) 65 (62, 67) 70 (57, 81)a 62 (58, 65) Don’t know 1 (0, 2) 0 (0, 5) 0 (0, 2) 0 (0, 5) 1 (0, 2) Not applicable 14 (11, 17) 0 (0, 5) 0 (0, 2) 2 (0, 9) 16 (13, 19)
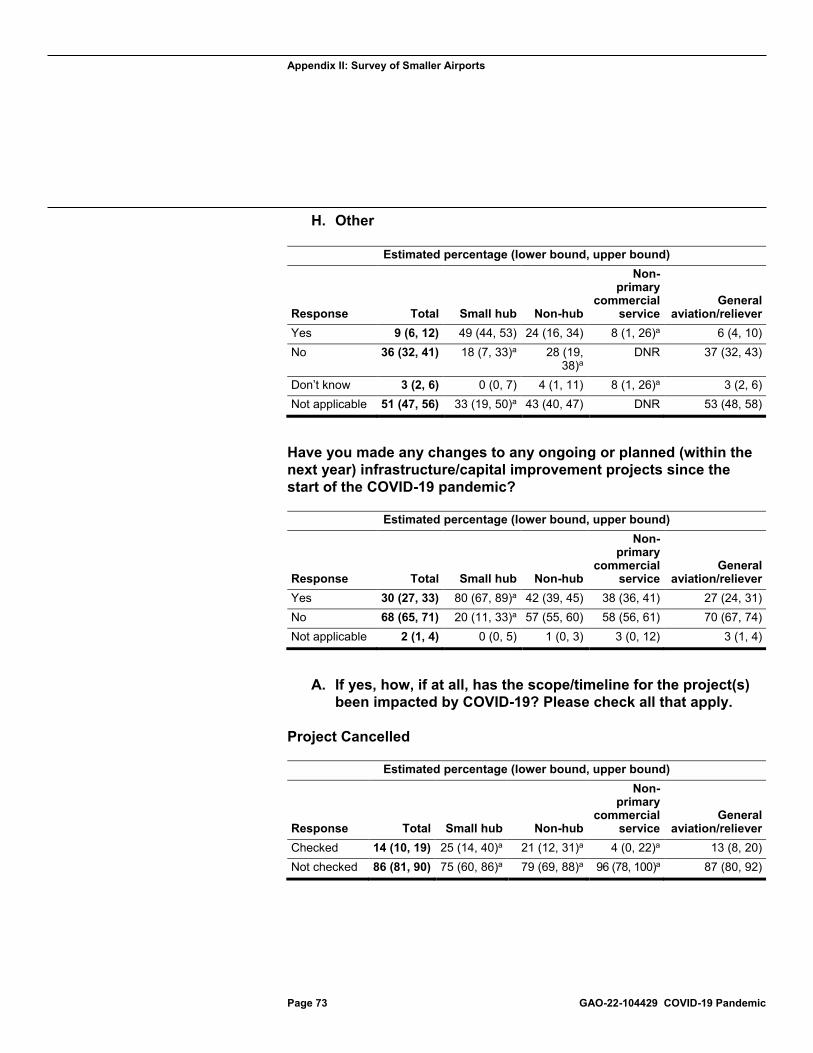
Appendix II: Survey of Smaller Airports
Page 73 GAO-22-104429 COVID-19 Pandemic
H. Other
Estimated percentage (lower bound, upper bound)
Response Total Small hub Non-hub
Non-primary
commercial service
General aviation/reliever
Yes 9 (6, 12) 49 (44, 53) 24 (16, 34) 8 (1, 26)a 6 (4, 10) No 36 (32, 41) 18 (7, 33)a 28 (19,
38)a DNR 37 (32, 43)
Don’t know 3 (2, 6) 0 (0, 7) 4 (1, 11) 8 (1, 26)a 3 (2, 6) Not applicable 51 (47, 56) 33 (19, 50)a 43 (40, 47) DNR 53 (48, 58)
Have you made any changes to any ongoing or planned (within the next year) infrastructure/capital improvement projects since the start of the COVID-19 pandemic?
Estimated percentage (lower bound, upper bound)
Response Total Small hub Non-hub
Non-primary
commercial service
General aviation/reliever
Yes 30 (27, 33) 80 (67, 89)a 42 (39, 45) 38 (36, 41) 27 (24, 31) No 68 (65, 71) 20 (11, 33)a 57 (55, 60) 58 (56, 61) 70 (67, 74) Not applicable 2 (1, 4) 0 (0, 5) 1 (0, 3) 3 (0, 12) 3 (1, 4)
A. If yes, how, if at all, has the scope/timeline for the project(s) been impacted by COVID-19? Please check all that apply.
Project Cancelled
Estimated percentage (lower bound, upper bound)
Response Total Small hub Non-hub
Non-primary
commercial service
General aviation/reliever
Checked 14 (10, 19) 25 (14, 40)a 21 (12, 31)a 4 (0, 22)a 13 (8, 20) Not checked 86 (81, 90) 75 (60, 86)a 79 (69, 88)a 96 (78, 100)a 87 (80, 92)
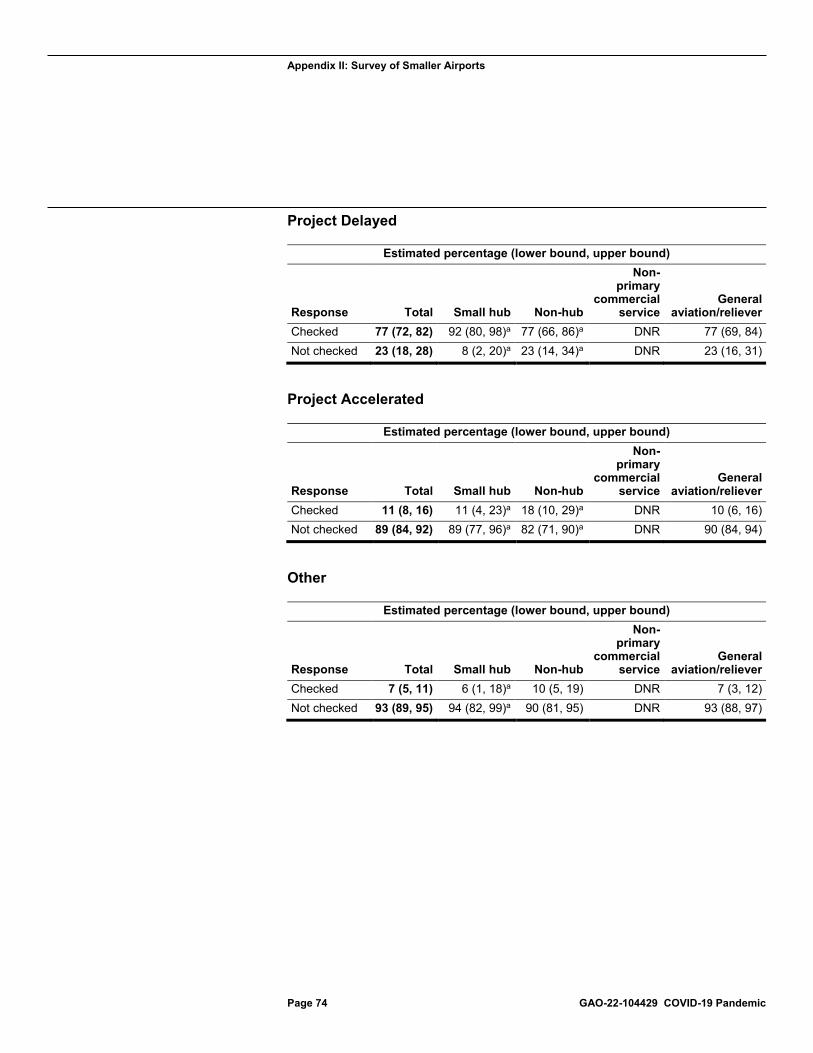
Appendix II: Survey of Smaller Airports
Page 74 GAO-22-104429 COVID-19 Pandemic
Project Delayed
Estimated percentage (lower bound, upper bound)
Response Total Small hub Non-hub
Non-primary
commercial service
General aviation/reliever
Checked 77 (72, 82) 92 (80, 98)a 77 (66, 86)a DNR 77 (69, 84) Not checked 23 (18, 28) 8 (2, 20)a 23 (14, 34)a DNR 23 (16, 31)
Project Accelerated
Estimated percentage (lower bound, upper bound)
Response Total Small hub Non-hub
Non-primary
commercial service
General aviation/reliever
Checked 11 (8, 16) 11 (4, 23)a 18 (10, 29)a DNR 10 (6, 16) Not checked 89 (84, 92) 89 (77, 96)a 82 (71, 90)a DNR 90 (84, 94)
Other
Estimated percentage (lower bound, upper bound)
Response Total Small hub Non-hub
Non-primary
commercial service
General aviation/reliever
Checked 7 (5, 11) 6 (1, 18)a 10 (5, 19) DNR 7 (3, 12) Not checked 93 (89, 95) 94 (82, 99)a 90 (81, 95) DNR 93 (88, 97)
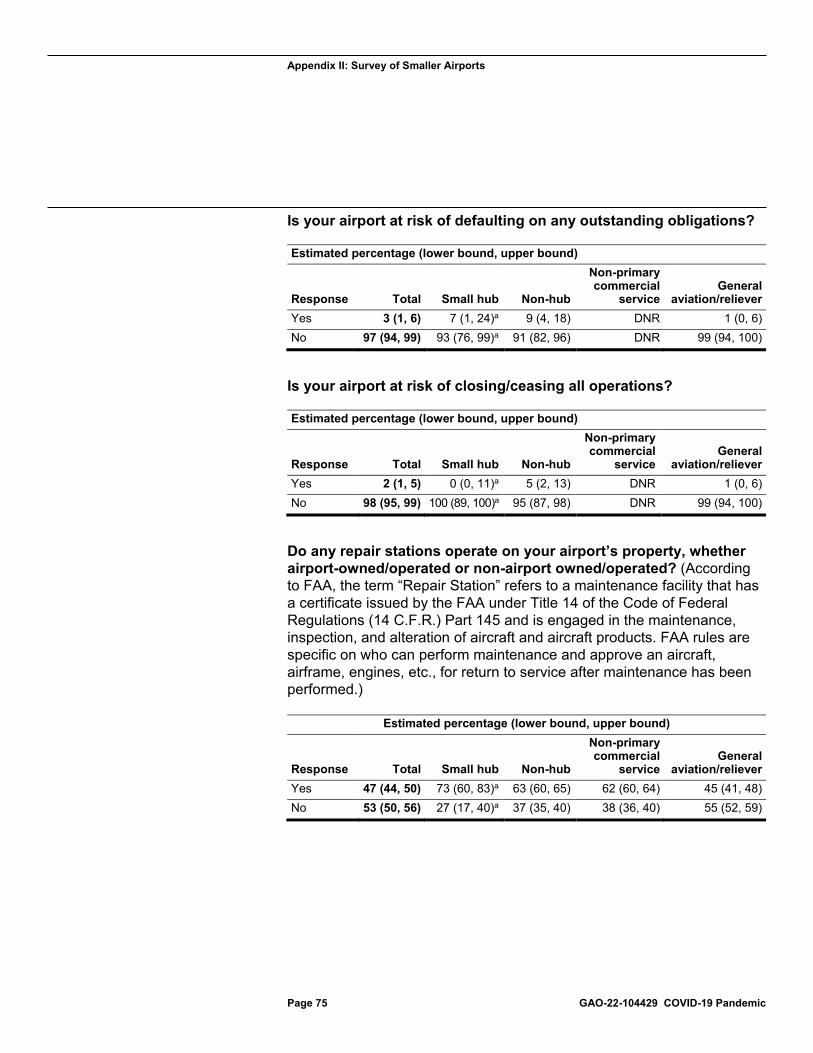
Appendix II: Survey of Smaller Airports
Page 75 GAO-22-104429 COVID-19 Pandemic
Is your airport at risk of defaulting on any outstanding obligations?
Estimated percentage (lower bound, upper bound)
Response Total Small hub Non-hub
Non-primary commercial
service General
aviation/reliever Yes 3 (1, 6) 7 (1, 24)a 9 (4, 18) DNR 1 (0, 6) No 97 (94, 99) 93 (76, 99)a 91 (82, 96) DNR 99 (94, 100)
Is your airport at risk of closing/ceasing all operations?
Estimated percentage (lower bound, upper bound)
Response Total Small hub Non-hub
Non-primary commercial
service General
aviation/reliever Yes 2 (1, 5) 0 (0, 11)a 5 (2, 13) DNR 1 (0, 6) No 98 (95, 99) 100 (89, 100)a 95 (87, 98) DNR 99 (94, 100)
Do any repair stations operate on your airport’s property, whether airport-owned/operated or non-airport owned/operated? (According to FAA, the term “Repair Station” refers to a maintenance facility that has a certificate issued by the FAA under Title 14 of the Code of Federal Regulations (14 C.F.R.) Part 145 and is engaged in the maintenance, inspection, and alteration of aircraft and aircraft products. FAA rules are specific on who can perform maintenance and approve an aircraft, airframe, engines, etc., for return to service after maintenance has been performed.)
Estimated percentage (lower bound, upper bound)
Response Total Small hub Non-hub
Non-primary commercial
service General
aviation/reliever Yes 47 (44, 50) 73 (60, 83)a 63 (60, 65) 62 (60, 64) 45 (41, 48) No 53 (50, 56) 27 (17, 40)a 37 (35, 40) 38 (36, 40) 55 (52, 59)
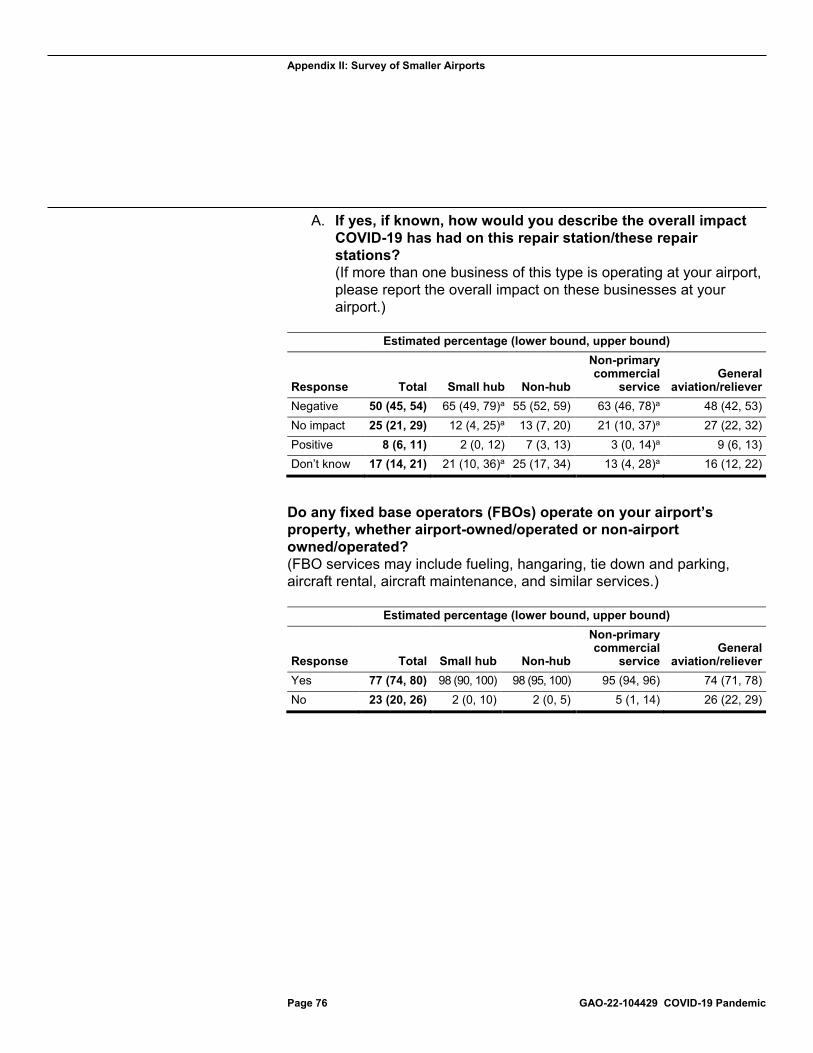
Appendix II: Survey of Smaller Airports
Page 76 GAO-22-104429 COVID-19 Pandemic
A. If yes, if known, how would you describe the overall impact COVID-19 has had on this repair station/these repair stations? (If more than one business of this type is operating at your airport, please report the overall impact on these businesses at your airport.)
Estimated percentage (lower bound, upper bound)
Response Total Small hub Non-hub
Non-primary commercial
service General
aviation/reliever Negative 50 (45, 54) 65 (49, 79)a 55 (52, 59) 63 (46, 78)a 48 (42, 53) No impact 25 (21, 29) 12 (4, 25)a 13 (7, 20) 21 (10, 37)a 27 (22, 32) Positive 8 (6, 11) 2 (0, 12) 7 (3, 13) 3 (0, 14)a 9 (6, 13) Don’t know 17 (14, 21) 21 (10, 36)a 25 (17, 34) 13 (4, 28)a 16 (12, 22)
Do any fixed base operators (FBOs) operate on your airport’s property, whether airport-owned/operated or non-airport owned/operated? (FBO services may include fueling, hangaring, tie down and parking, aircraft rental, aircraft maintenance, and similar services.)
Estimated percentage (lower bound, upper bound)
Response Total Small hub Non-hub
Non-primary commercial
service General
aviation/reliever Yes 77 (74, 80) 98 (90, 100) 98 (95, 100) 95 (94, 96) 74 (71, 78) No 23 (20, 26) 2 (0, 10) 2 (0, 5) 5 (1, 14) 26 (22, 29)
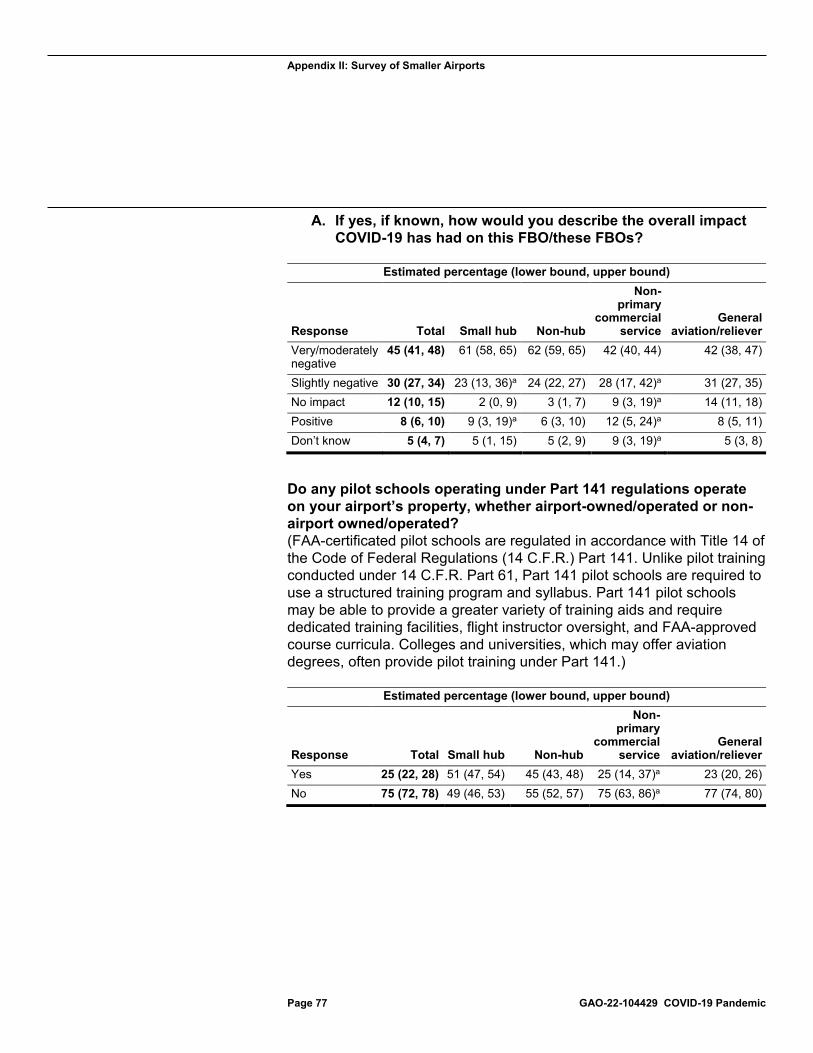
Appendix II: Survey of Smaller Airports
Page 77 GAO-22-104429 COVID-19 Pandemic
A. If yes, if known, how would you describe the overall impact COVID-19 has had on this FBO/these FBOs?
Estimated percentage (lower bound, upper bound)
Response Total Small hub Non-hub
Non-primary
commercial service
General aviation/reliever
Very/moderately negative
45 (41, 48) 61 (58, 65) 62 (59, 65) 42 (40, 44) 42 (38, 47)
Slightly negative 30 (27, 34) 23 (13, 36)a 24 (22, 27) 28 (17, 42)a 31 (27, 35) No impact 12 (10, 15) 2 (0, 9) 3 (1, 7) 9 (3, 19)a 14 (11, 18) Positive 8 (6, 10) 9 (3, 19)a 6 (3, 10) 12 (5, 24)a 8 (5, 11) Don’t know 5 (4, 7) 5 (1, 15) 5 (2, 9) 9 (3, 19)a 5 (3, 8)
Do any pilot schools operating under Part 141 regulations operate on your airport’s property, whether airport-owned/operated or non-airport owned/operated? (FAA-certificated pilot schools are regulated in accordance with Title 14 of the Code of Federal Regulations (14 C.F.R.) Part 141. Unlike pilot training conducted under 14 C.F.R. Part 61, Part 141 pilot schools are required to use a structured training program and syllabus. Part 141 pilot schools may be able to provide a greater variety of training aids and require dedicated training facilities, flight instructor oversight, and FAA-approved course curricula. Colleges and universities, which may offer aviation degrees, often provide pilot training under Part 141.)
Estimated percentage (lower bound, upper bound)
Response Total Small hub Non-hub
Non-primary
commercial service
General aviation/reliever
Yes 25 (22, 28) 51 (47, 54) 45 (43, 48) 25 (14, 37)a 23 (20, 26) No 75 (72, 78) 49 (46, 53) 55 (52, 57) 75 (63, 86)a 77 (74, 80)
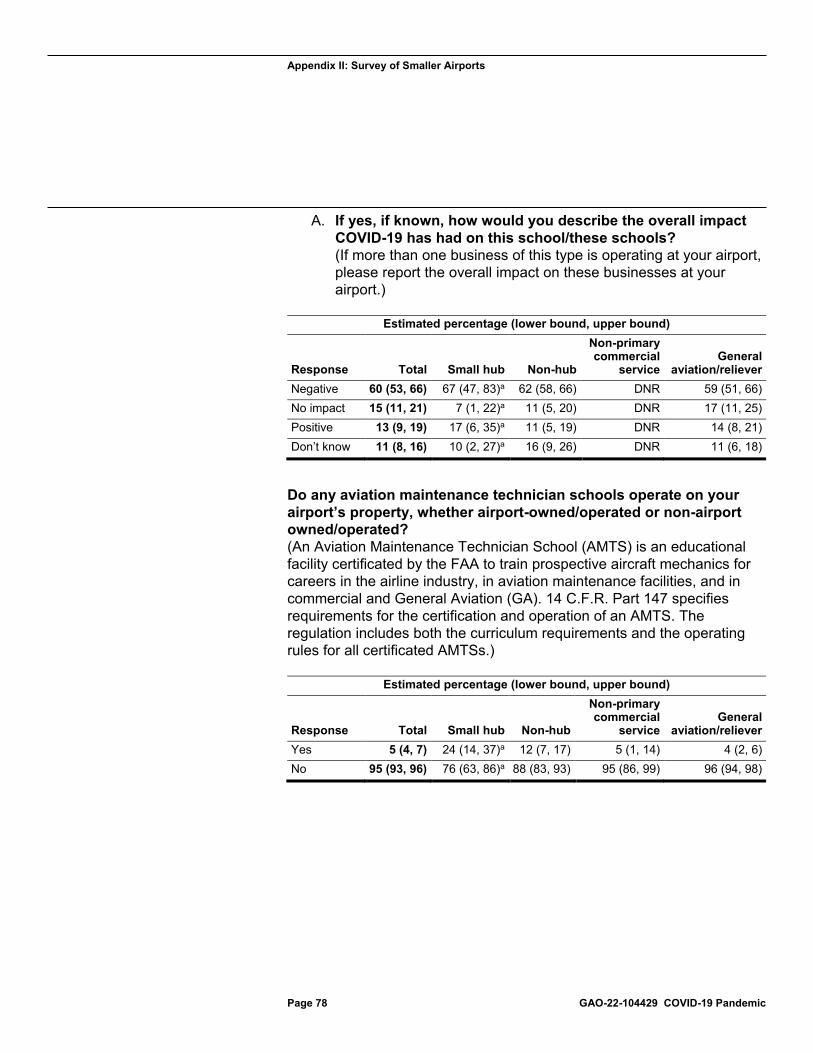
Appendix II: Survey of Smaller Airports
Page 78 GAO-22-104429 COVID-19 Pandemic
A. If yes, if known, how would you describe the overall impact COVID-19 has had on this school/these schools? (If more than one business of this type is operating at your airport, please report the overall impact on these businesses at your airport.)
Estimated percentage (lower bound, upper bound)
Response Total Small hub Non-hub
Non-primary commercial
service General
aviation/reliever Negative 60 (53, 66) 67 (47, 83)a 62 (58, 66) DNR 59 (51, 66) No impact 15 (11, 21) 7 (1, 22)a 11 (5, 20) DNR 17 (11, 25) Positive 13 (9, 19) 17 (6, 35)a 11 (5, 19) DNR 14 (8, 21) Don’t know 11 (8, 16) 10 (2, 27)a 16 (9, 26) DNR 11 (6, 18)
Do any aviation maintenance technician schools operate on your airport’s property, whether airport-owned/operated or non-airport owned/operated? (An Aviation Maintenance Technician School (AMTS) is an educational facility certificated by the FAA to train prospective aircraft mechanics for careers in the airline industry, in aviation maintenance facilities, and in commercial and General Aviation (GA). 14 C.F.R. Part 147 specifies requirements for the certification and operation of an AMTS. The regulation includes both the curriculum requirements and the operating rules for all certificated AMTSs.)
Estimated percentage (lower bound, upper bound)
Response Total Small hub Non-hub
Non-primary commercial
service General
aviation/reliever Yes 5 (4, 7) 24 (14, 37)a 12 (7, 17) 5 (1, 14) 4 (2, 6) No 95 (93, 96) 76 (63, 86)a 88 (83, 93) 95 (86, 99) 96 (94, 98)
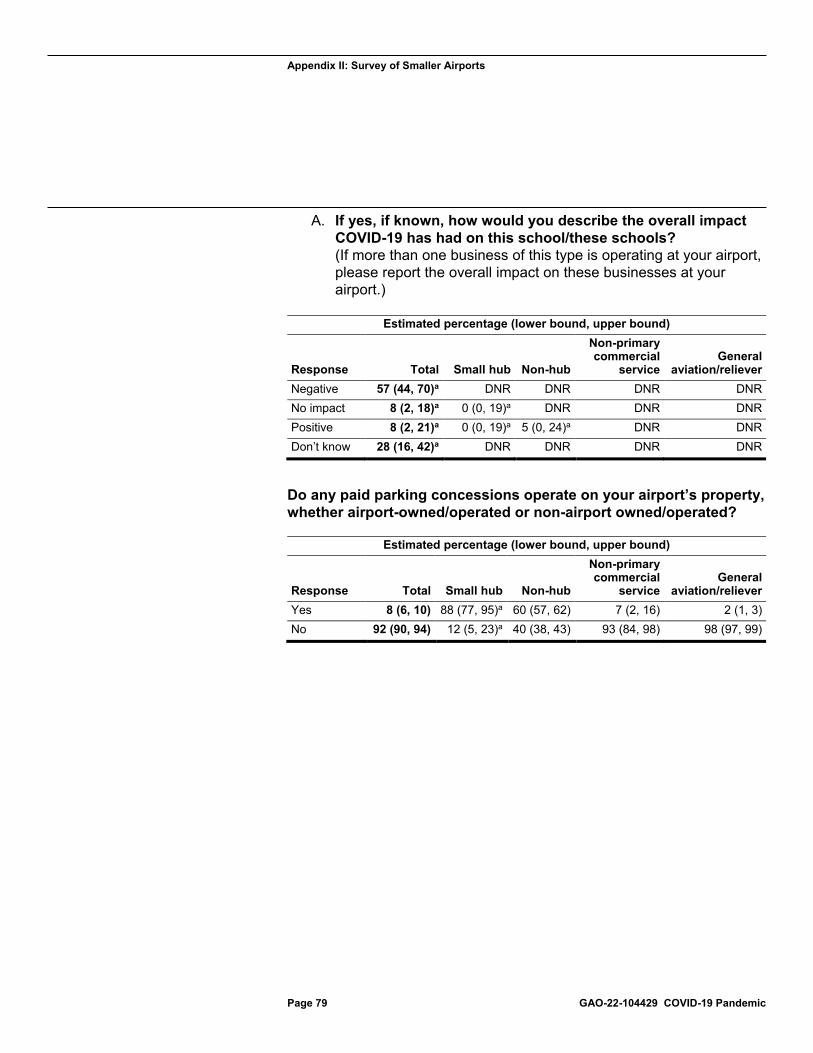
Appendix II: Survey of Smaller Airports
Page 79 GAO-22-104429 COVID-19 Pandemic
A. If yes, if known, how would you describe the overall impact COVID-19 has had on this school/these schools? (If more than one business of this type is operating at your airport, please report the overall impact on these businesses at your airport.)
Estimated percentage (lower bound, upper bound)
Response Total Small hub Non-hub
Non-primary commercial
service General
aviation/reliever Negative 57 (44, 70)a DNR DNR DNR DNR No impact 8 (2, 18)a 0 (0, 19)a DNR DNR DNR Positive 8 (2, 21)a 0 (0, 19)a 5 (0, 24)a DNR DNR Don’t know 28 (16, 42)a DNR DNR DNR DNR
Do any paid parking concessions operate on your airport’s property, whether airport-owned/operated or non-airport owned/operated?
Estimated percentage (lower bound, upper bound)
Response Total Small hub Non-hub
Non-primary commercial
service General
aviation/reliever Yes 8 (6, 10) 88 (77, 95)a 60 (57, 62) 7 (2, 16) 2 (1, 3) No 92 (90, 94) 12 (5, 23)a 40 (38, 43) 93 (84, 98) 98 (97, 99)

Appendix II: Survey of Smaller Airports
Page 80 GAO-22-104429 COVID-19 Pandemic
A. If yes, if known, how would you describe the overall impact COVID-19 has had on this business? (If more than one business of this type is operating at your airport, please report the overall impact on these businesses at your airport.)
Estimated percentage (lower bound, upper bound)
Response Total Small hub Non-hub
Non-primary
commercial service
General aviation/reliever
Negative 91 (82, 96) 98 (90, 100) 99 (95, 100) DNR DNR No impact 8 (3, 17) 0 (0, 6) 0 (0, 3) DNR DNR Positive 0 (0, 3) 0 (0, 6) 1 (0, 5) DNR DNR Don’t know 0 (0, 3) 2 (0, 10) 0 (0, 3) DNR DNR
Do any car rental or ground transportation concessions operate on your airport’s property, whether airport-owned/operated or non-airport owned/operated?
Estimated percentage (lower bound, upper bound)
Response Total Small hub Non-hub
Non-primary
commercial service
General aviation/reliever
Yes 26 (24, 29) 100 (95, 100) 98 (94, 99) 79 (66, 88)a 17 (14, 19) No 74 (71, 76) 0 (0, 5) 2 (1, 6) 21 (12, 34)a 83 (81, 86)
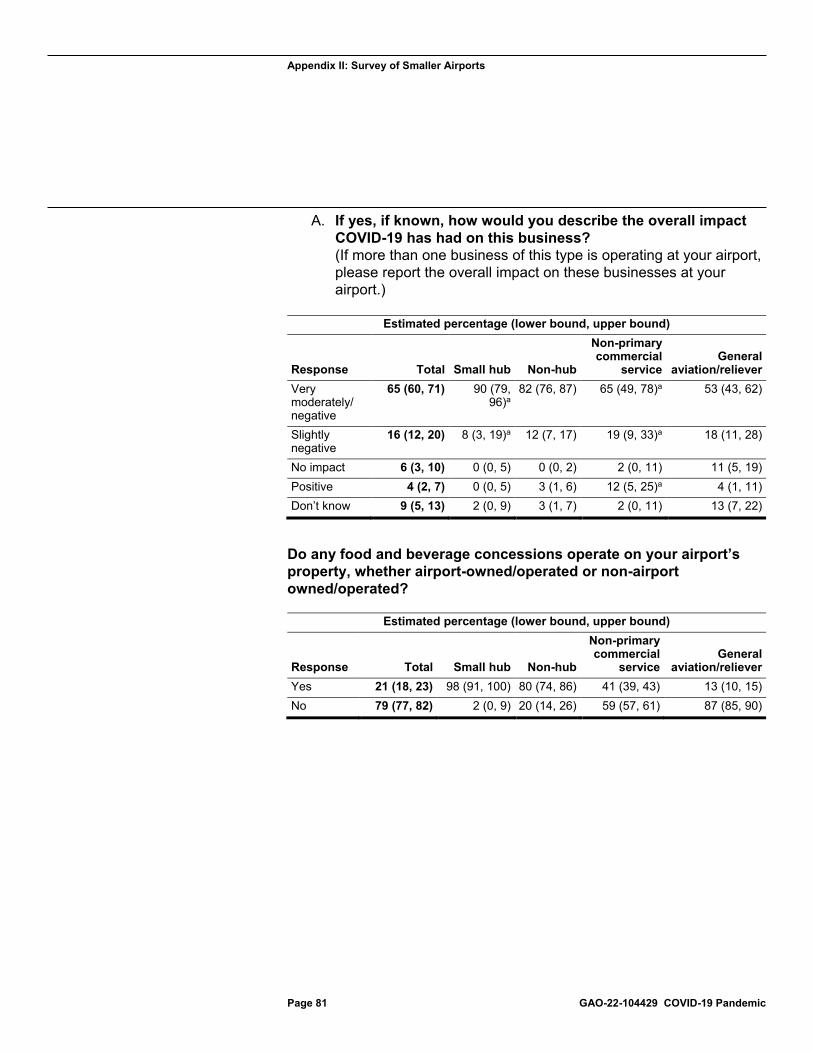
Appendix II: Survey of Smaller Airports
Page 81 GAO-22-104429 COVID-19 Pandemic
A. If yes, if known, how would you describe the overall impact COVID-19 has had on this business? (If more than one business of this type is operating at your airport, please report the overall impact on these businesses at your airport.)
Estimated percentage (lower bound, upper bound)
Response Total Small hub Non-hub
Non-primary commercial
service General
aviation/reliever Very moderately/ negative
65 (60, 71) 90 (79, 96)a
82 (76, 87) 65 (49, 78)a 53 (43, 62)
Slightly negative
16 (12, 20) 8 (3, 19)a 12 (7, 17) 19 (9, 33)a 18 (11, 28)
No impact 6 (3, 10) 0 (0, 5) 0 (0, 2) 2 (0, 11) 11 (5, 19) Positive 4 (2, 7) 0 (0, 5) 3 (1, 6) 12 (5, 25)a 4 (1, 11) Don’t know 9 (5, 13) 2 (0, 9) 3 (1, 7) 2 (0, 11) 13 (7, 22)
Do any food and beverage concessions operate on your airport’s property, whether airport-owned/operated or non-airport owned/operated?
Estimated percentage (lower bound, upper bound)
Response Total Small hub Non-hub
Non-primary commercial
service General
aviation/reliever Yes 21 (18, 23) 98 (91, 100) 80 (74, 86) 41 (39, 43) 13 (10, 15) No 79 (77, 82) 2 (0, 9) 20 (14, 26) 59 (57, 61) 87 (85, 90)
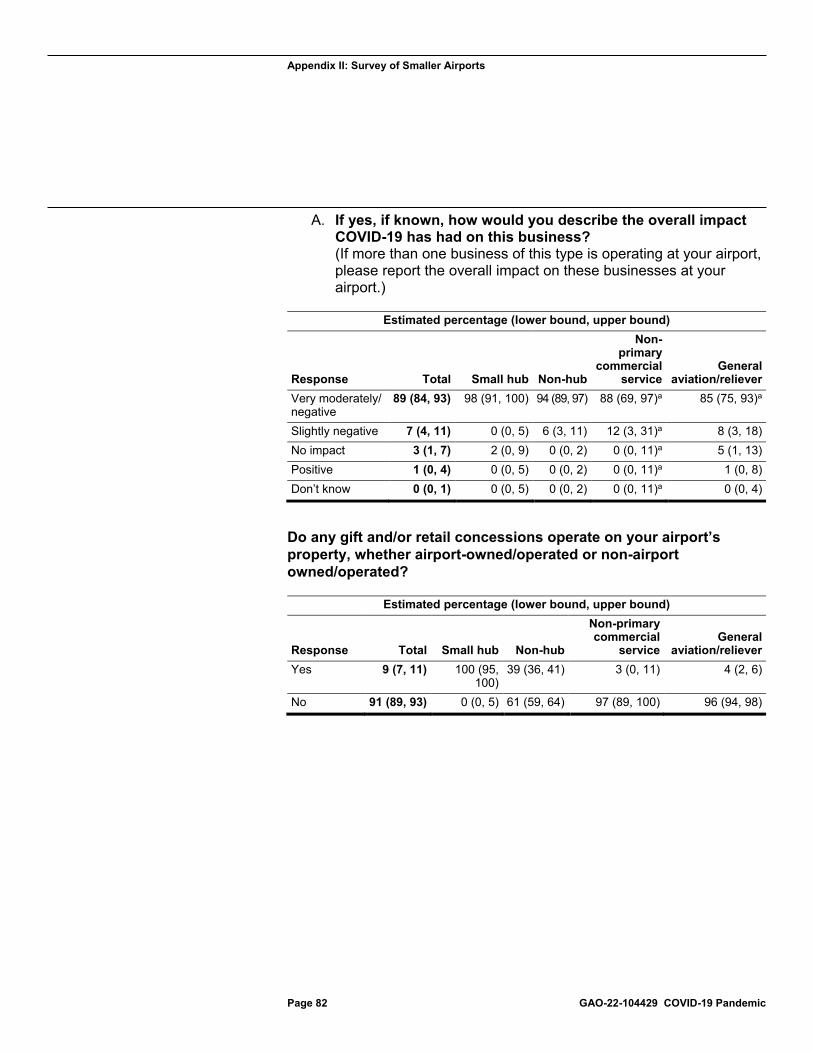
Appendix II: Survey of Smaller Airports
Page 82 GAO-22-104429 COVID-19 Pandemic
A. If yes, if known, how would you describe the overall impact COVID-19 has had on this business? (If more than one business of this type is operating at your airport, please report the overall impact on these businesses at your airport.)
Estimated percentage (lower bound, upper bound)
Response Total Small hub Non-hub
Non-primary
commercial service
General aviation/reliever
Very moderately/ negative
89 (84, 93) 98 (91, 100) 94 (89, 97) 88 (69, 97)a 85 (75, 93)a
Slightly negative 7 (4, 11) 0 (0, 5) 6 (3, 11) 12 (3, 31)a 8 (3, 18) No impact 3 (1, 7) 2 (0, 9) 0 (0, 2) 0 (0, 11)a 5 (1, 13) Positive 1 (0, 4) 0 (0, 5) 0 (0, 2) 0 (0, 11)a 1 (0, 8) Don’t know 0 (0, 1) 0 (0, 5) 0 (0, 2) 0 (0, 11)a 0 (0, 4)
Do any gift and/or retail concessions operate on your airport’s property, whether airport-owned/operated or non-airport owned/operated?
Estimated percentage (lower bound, upper bound)
Response Total Small hub Non-hub
Non-primary commercial
service General
aviation/reliever Yes 9 (7, 11) 100 (95,
100) 39 (36, 41) 3 (0, 11) 4 (2, 6)
No 91 (89, 93) 0 (0, 5) 61 (59, 64) 97 (89, 100) 96 (94, 98)
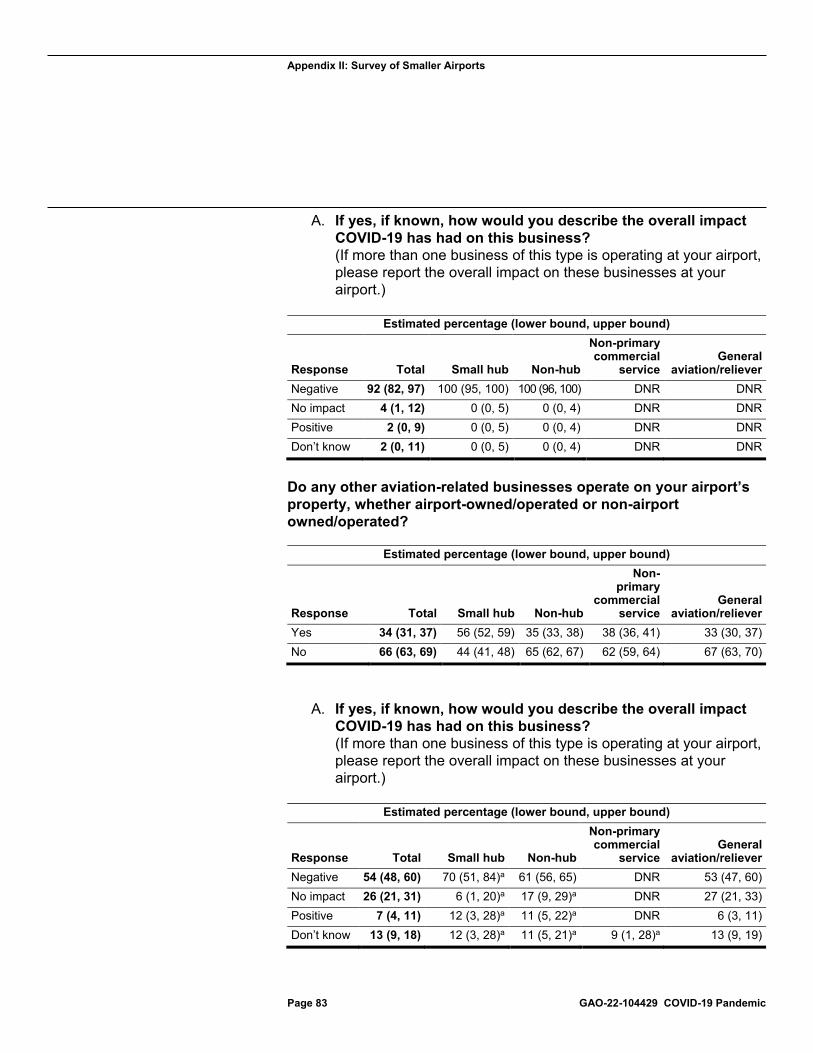
Appendix II: Survey of Smaller Airports
Page 83 GAO-22-104429 COVID-19 Pandemic
A. If yes, if known, how would you describe the overall impact COVID-19 has had on this business? (If more than one business of this type is operating at your airport, please report the overall impact on these businesses at your airport.)
Estimated percentage (lower bound, upper bound)
Response Total Small hub Non-hub
Non-primary commercial
service General
aviation/reliever Negative 92 (82, 97) 100 (95, 100) 100 (96, 100) DNR DNR No impact 4 (1, 12) 0 (0, 5) 0 (0, 4) DNR DNR Positive 2 (0, 9) 0 (0, 5) 0 (0, 4) DNR DNR Don’t know 2 (0, 11) 0 (0, 5) 0 (0, 4) DNR DNR
Do any other aviation-related businesses operate on your airport’s property, whether airport-owned/operated or non-airport owned/operated?
Estimated percentage (lower bound, upper bound)
Response Total Small hub Non-hub
Non-primary
commercial service
General aviation/reliever
Yes 34 (31, 37) 56 (52, 59) 35 (33, 38) 38 (36, 41) 33 (30, 37) No 66 (63, 69) 44 (41, 48) 65 (62, 67) 62 (59, 64) 67 (63, 70)
A. If yes, if known, how would you describe the overall impact COVID-19 has had on this business? (If more than one business of this type is operating at your airport, please report the overall impact on these businesses at your airport.)
Estimated percentage (lower bound, upper bound)
Response Total Small hub Non-hub
Non-primary commercial
service General
aviation/reliever Negative 54 (48, 60) 70 (51, 84)a 61 (56, 65) DNR 53 (47, 60) No impact 26 (21, 31) 6 (1, 20)a 17 (9, 29)a DNR 27 (21, 33) Positive 7 (4, 11) 12 (3, 28)a 11 (5, 22)a DNR 6 (3, 11) Don’t know 13 (9, 18) 12 (3, 28)a 11 (5, 21)a 9 (1, 28)a 13 (9, 19)
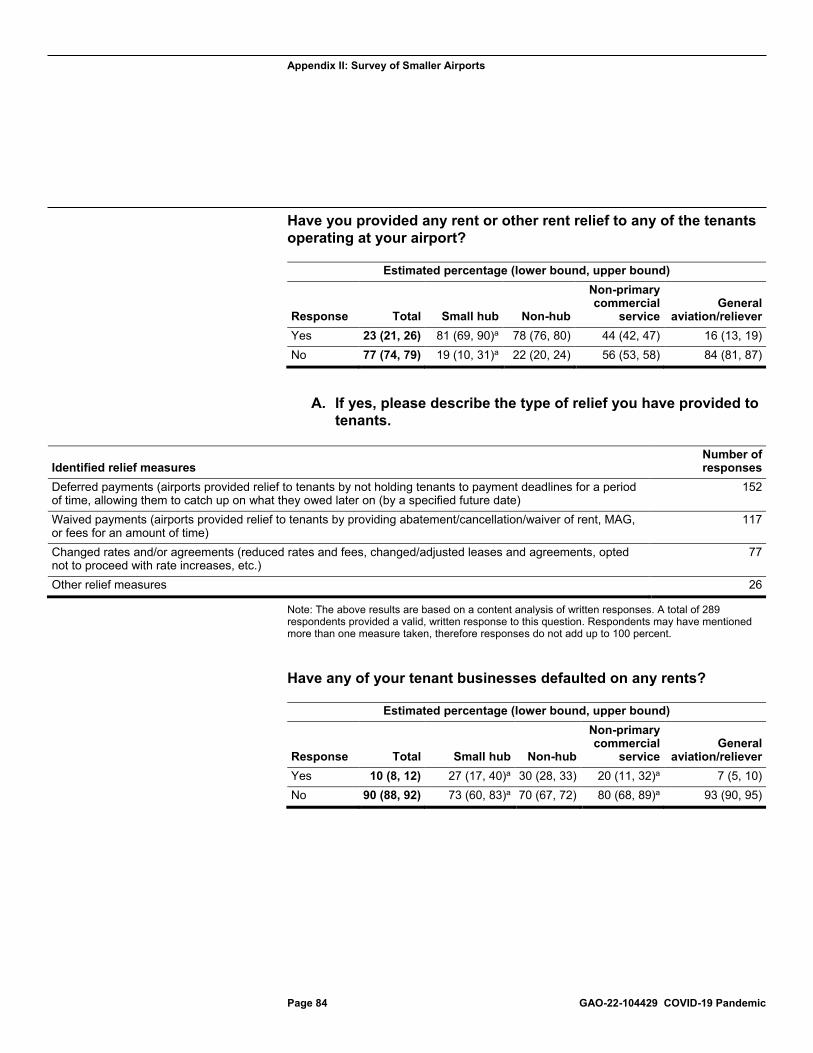
Appendix II: Survey of Smaller Airports
Page 84 GAO-22-104429 COVID-19 Pandemic
Have you provided any rent or other rent relief to any of the tenants operating at your airport?
Estimated percentage (lower bound, upper bound)
Response Total Small hub Non-hub
Non-primary commercial
service General
aviation/reliever Yes 23 (21, 26) 81 (69, 90)a 78 (76, 80) 44 (42, 47) 16 (13, 19) No 77 (74, 79) 19 (10, 31)a 22 (20, 24) 56 (53, 58) 84 (81, 87)
A. If yes, please describe the type of relief you have provided to tenants.
Identified relief measures Number of responses
Deferred payments (airports provided relief to tenants by not holding tenants to payment deadlines for a period of time, allowing them to catch up on what they owed later on (by a specified future date)
152
Waived payments (airports provided relief to tenants by providing abatement/cancellation/waiver of rent, MAG, or fees for an amount of time)
117
Changed rates and/or agreements (reduced rates and fees, changed/adjusted leases and agreements, opted not to proceed with rate increases, etc.)
77
Other relief measures 26
Note: The above results are based on a content analysis of written responses. A total of 289 respondents provided a valid, written response to this question. Respondents may have mentioned more than one measure taken, therefore responses do not add up to 100 percent.
Have any of your tenant businesses defaulted on any rents?
Estimated percentage (lower bound, upper bound)
Response Total Small hub Non-hub
Non-primary commercial
service General
aviation/reliever Yes 10 (8, 12) 27 (17, 40)a 30 (28, 33) 20 (11, 32)a 7 (5, 10) No 90 (88, 92) 73 (60, 83)a 70 (67, 72) 80 (68, 89)a 93 (90, 95)

Appendix II: Survey of Smaller Airports
Page 85 GAO-22-104429 COVID-19 Pandemic
Has your airport received a CARES Act Airport Grant?
Estimated percentage (lower bound, upper bound)
Response Total Small hub Non-hub
Non-primary commercial
service General
aviation/reliever Yes 91 (88, 93) 100 (95, 100) 100 (98,
100) 100 (95, 100) 89 (86, 92)
No 9 (7, 12) 0 (0, 5) 0 (0, 2) 0 (0, 5) 11 (8, 14)
A. If yes, as of October 2020, for what purposes have you used or do you intend to use the grant award?
Payroll/labor costs
Estimated percentage (lower bound, upper bound)
Response Total Small hub Non-hub
Non-primary commercial
service General
aviation/reliever Checked 47 (43, 50) 85 (73, 93)a 82 (76, 87) 69 (56, 80)a 42 (37, 46) Not checked 53 (50, 57) 15 (7, 27)a 18 (13, 24) 31 (20, 44)a 58 (54, 63)
Utilities
Estimated percentage (lower bound, upper bound)
Response Total Small hub Non-hub
Non-primary commercial
service General
aviation/reliever Checked 35 (31, 38) 46 (42, 49) 60 (57, 62) 46 (44, 48) 32 (28, 35) Not checked 65 (62, 69) 54 (51, 58) 40 (38, 43) 54 (52, 56) 68 (65, 72)
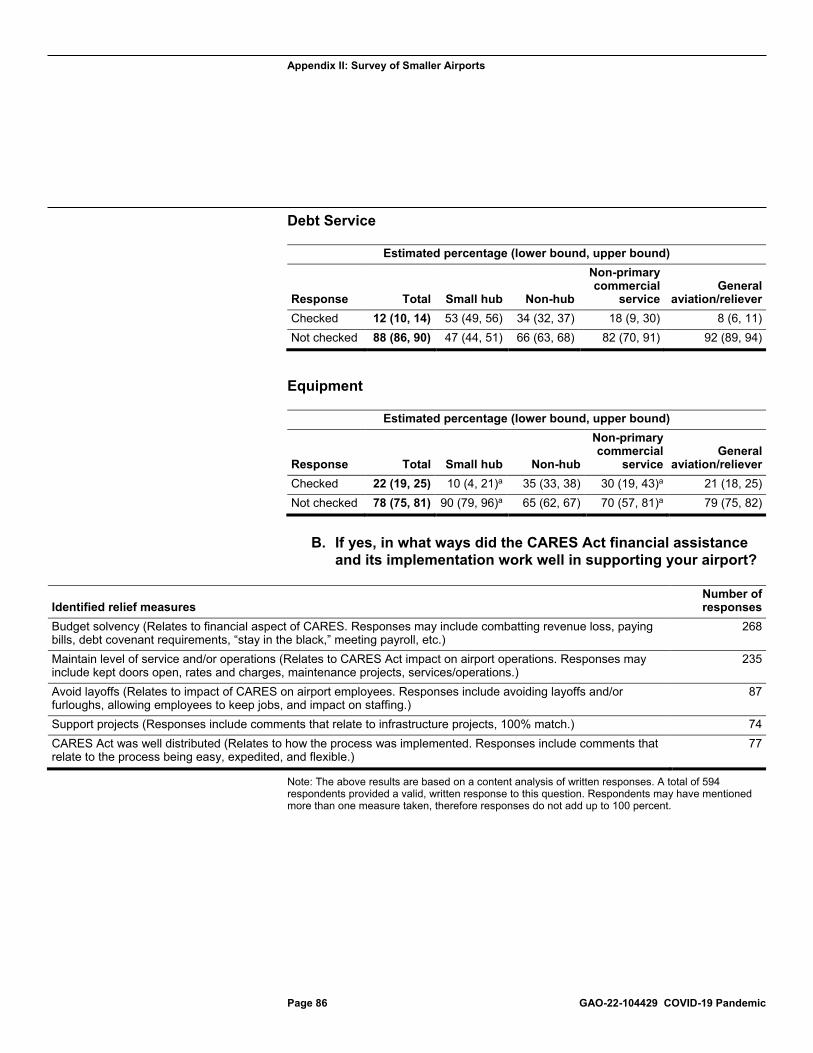
Appendix II: Survey of Smaller Airports
Page 86 GAO-22-104429 COVID-19 Pandemic
Debt Service
Estimated percentage (lower bound, upper bound)
Response Total Small hub Non-hub
Non-primary commercial
service General
aviation/reliever Checked 12 (10, 14) 53 (49, 56) 34 (32, 37) 18 (9, 30) 8 (6, 11) Not checked 88 (86, 90) 47 (44, 51) 66 (63, 68) 82 (70, 91) 92 (89, 94)
Equipment
Estimated percentage (lower bound, upper bound)
Response Total Small hub Non-hub
Non-primary commercial
service General
aviation/reliever Checked 22 (19, 25) 10 (4, 21)a 35 (33, 38) 30 (19, 43)a 21 (18, 25) Not checked 78 (75, 81) 90 (79, 96)a 65 (62, 67) 70 (57, 81)a 79 (75, 82)
B. If yes, in what ways did the CARES Act financial assistance
and its implementation work well in supporting your airport?
Identified relief measures Number of responses
Budget solvency (Relates to financial aspect of CARES. Responses may include combatting revenue loss, paying bills, debt covenant requirements, “stay in the black,” meeting payroll, etc.)
268
Maintain level of service and/or operations (Relates to CARES Act impact on airport operations. Responses may include kept doors open, rates and charges, maintenance projects, services/operations.)
235
Avoid layoffs (Relates to impact of CARES on airport employees. Responses include avoiding layoffs and/or furloughs, allowing employees to keep jobs, and impact on staffing.)
87
Support projects (Responses include comments that relate to infrastructure projects, 100% match.) 74 CARES Act was well distributed (Relates to how the process was implemented. Responses include comments that relate to the process being easy, expedited, and flexible.)
77
Note: The above results are based on a content analysis of written responses. A total of 594 respondents provided a valid, written response to this question. Respondents may have mentioned more than one measure taken, therefore responses do not add up to 100 percent.
Appendix III: GAO Contact and Staff Acknowledgments
Page 87 GAO-22-104429 COVID-19 Pandemic
Heather Krause, (202) 512-2834 or [email protected]
In addition to the contact named above, Amy Abramowitz, Paul Aussendorf, Melissa Bodeau, Kim Bohnet, Jon Carver (Assistant Director), Gail Marnik, Josh Ormond, Justin Reed (Analyst-in-Charge), Gretchen Snoey, Larry Thomas, Elizabeth Wood, Sirin Yaemsiri, and April Yeaney made key contributions to this report.
Appendix III: GAO Contact and Staff Acknowledgments
GAO Contact Staff Acknowledgments
(104429)
The Government Accountability Office, the audit, evaluation, and investigative arm of Congress, exists to support Congress in meeting its constitutional responsibilities and to help improve the performance and accountability of the federal government for the American people. GAO examines the use of public funds; evaluates federal programs and policies; and provides analyses, recommendations, and other assistance to help Congress make informed oversight, policy, and funding decisions. GAO’s commitment to good government is reflected in its core values of accountability, integrity, and reliability.
The fastest and easiest way to obtain copies of GAO documents at no cost is through our website. Each weekday afternoon, GAO posts on its website newly released reports, testimony, and correspondence. You can also subscribe to GAO’s email updates to receive notification of newly posted products.
The price of each GAO publication reflects GAO’s actual cost of production and distribution and depends on the number of pages in the publication and whether the publication is printed in color or black and white. Pricing and ordering information is posted on GAO’s website, https://www.gao.gov/ordering.htm.
Place orders by calling (202) 512-6000, toll free (866) 801-7077, or TDD (202) 512-2537.
Orders may be paid for using American Express, Discover Card, MasterCard, Visa, check, or money order. Call for additional information.
Connect with GAO on Facebook, Flickr, Twitter, and YouTube. Subscribe to our RSS Feeds or Email Updates. Listen to our Podcasts. Visit GAO on the web at https://www.gao.gov.
Contact FraudNet:
Website: https://www.gao.gov/about/what-gao-does/fraudnet
Automated answering system: (800) 424-5454 or (202) 512-7700
A. Nicole Clowers, Managing Director, [email protected], (202) 512-4400, U.S. Government Accountability Office, 441 G Street NW, Room 7125, Washington, DC 20548
Chuck Young, Managing Director, [email protected], (202) 512-4800 U.S. Government Accountability Office, 441 G Street NW, Room 7149 Washington, DC 20548
Stephen J. Sanford, Managing Director, [email protected], (202) 512-4707 U.S. Government Accountability Office, 441 G Street NW, Room 7814, Washington, DC 20548
GAO’s Mission
Obtaining Copies of GAO Reports and Testimony Order by Phone
Connect with GAO
To Report Fraud, Waste, and Abuse in Federal Programs
Congressional Relations
Public Affairs
Strategic Planning and External Liaison
Please Print on Recycled Paper.