Embed Size (px)
Citation preview
NATIONAL HEALTH SERVICE CORPS
Program Directs Funding to Areas with Greatest Provider Shortages Accessible Version
Report to Congressional Requesters
April 2021
GAO-21-323
United States Government Accountability Office
United States Government Accountability Office
GAO Highlights Highlights of GAO-21-323, a report to congressional requesters
April 2021
NATIONAL HEALTH SERVICE CORPS Program Directs Funding to Areas with Greatest Provider Shortages
What GAO Found In fiscal year 2020, approximately 14,000 providers of primary, dental, and mental health care served as part of National Health Service Corps (NHSC) programs, receiving federal funding in exchange for providing care in a health professional shortage area (HPSA). Successful NHSC applicants can either receive loan repayment funding while working at a HPSA site or receive funding while in school in exchange for service in a HPSA after their graduation, depending on the NHSC program. Sites are given HPSA scores, with a higher score indicating a more severe provider shortage. The majority of NHSC funding (80 percent) is directed to providers already working at a HPSA, rather than to funding scholarships, according to Health Resources and Services Administration (HRSA) officials. In fiscal year 2020, the most common types of NHSC providers who received funding to work at a NHSC site were nurse practitioners (26 percent), physicians (15 percent), and licensed clinical social workers (12 percent). The majority of providers served in a federally qualified health center (60 percent), and providers served in all 50 states, the District of Columbia, and five U.S. territories.
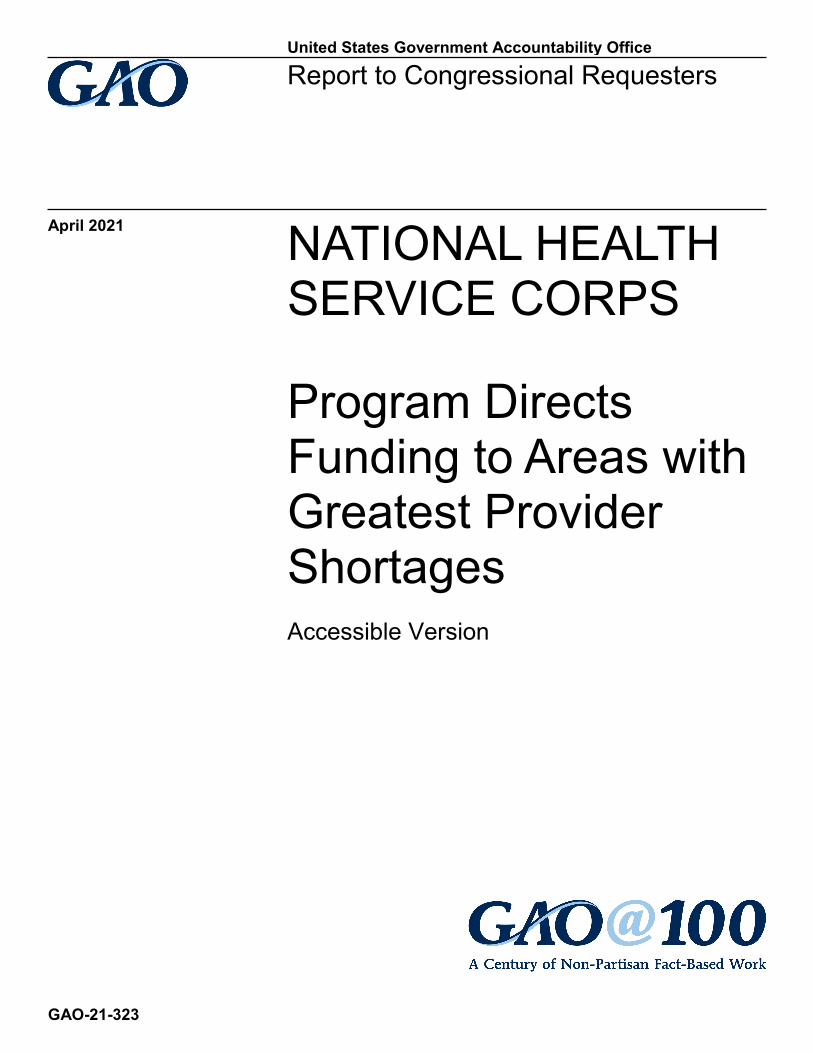
In fiscal year 2020, 43 percent of the 11,102 providers who newly applied to NHSC programs did not receive funding. The Scholarship Program and the Substance Use Disorder Workforce Loan Repayment Program had the lowest and highest percentages of applicants who received funding, respectively. Physicians, physician assistants, and dentists had the highest proportions of applicants who did not receive funding. HRSA prioritizes funding to providers serving in HPSAs with more severe provider shortages, and in NHSC’s largest program, the General Loan Repayment Program, 959 applicants who did not receive funding were denied because they worked in a relatively less severe shortage area with a lower HPSA score, rather than because their application was incomplete or ineligible. Although these shortage areas were relatively less severe, 40 percent of these applicants were nonetheless providing care at sites with HPSA scores that were in the upper half of possible scores. If additional NHSC funding was available, these applications would be the next to receive reviews by HRSA and potentially receive funding, according to HRSA’s guidance.
Number of Applicants to the National Health Service Corps General Loan Repayment Program, by Funding Status, Fiscal Year 2020
View GAO-21-323. For more information, contact A. Nicole Clowers at (202) 512-7114 or [email protected].
Why GAO Did This Study HRSA—an agency within the Department of Health and Human Services—estimated that, as of December 2020, about 25 percent of the U.S. population lives in an area with a shortage of providers. HRSA’s NHSC programs offer scholarships and loan repayment to providers in exchange for providing primary, dental, or mental health care at certain clinical sites located in HPSAs, which are areas, populations, or facilities that have a shortage of physicians and other health professionals. HRSA ranks HPSAs by level of severity using several measures, including how many providers need to be added to serve the population.
GAO was asked to review the NHSC programs. This report describes (1) how many providers served in NHSC and where they served, and (2) how many applicants did not receive funding, among other objectives.
GAO analyzed data from HRSA, including data on NHSC providers and the sites at which they served in fiscal year 2020 and the applications approved and denied funding for fiscal year 2020.
The Department of Health and Human Services provided technical comments on this report, which GAO incorporated as appropriate.
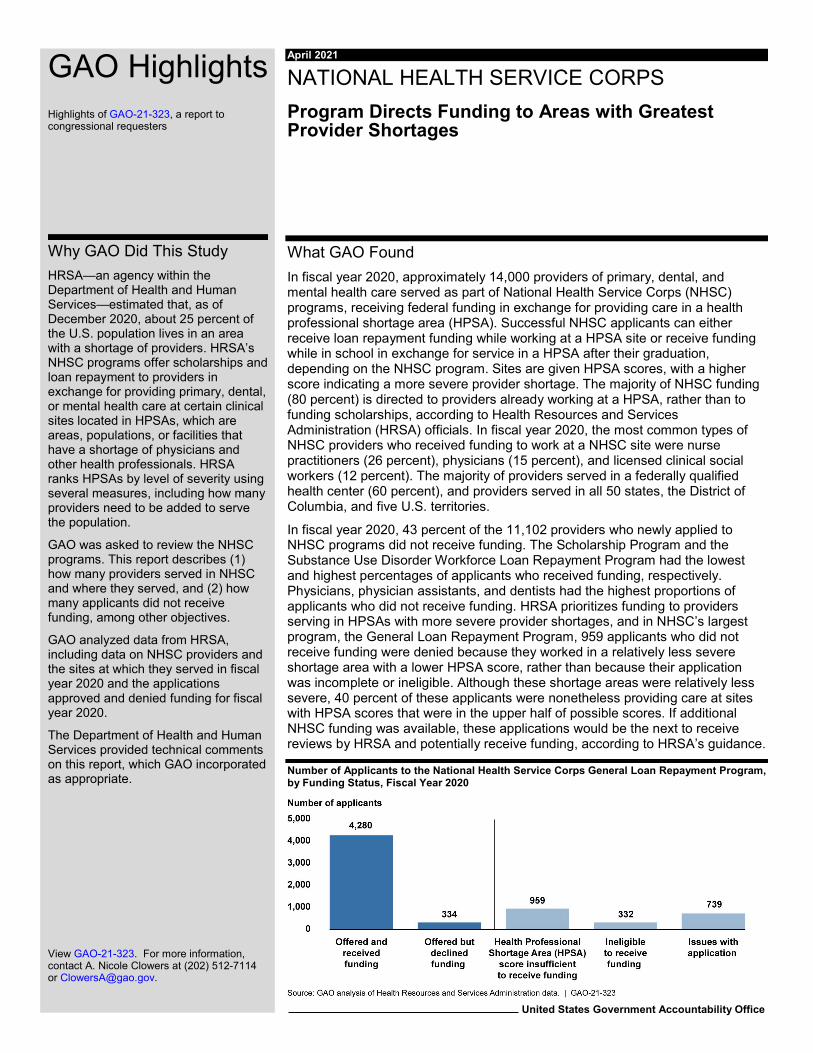
Data table for Number of Applicants to the National Health Service Corps General Loan Repayment Program, by Funding Status, Fiscal Year 2020
Offered funding by HRSA
Not offered funding by HRSA
Offered and received funding 4280 0 Offered but declined funding 334 0 Health Professional Shortage Area (HPSA) score insufficient to receive funding
0 959
Ineligible to receive funding 0 332 Issues with application 0 739
Page i GAO-21-323 National Health Service Corps
Contents GAO Highlights 2
Why GAO Did This Study 2 What GAO Found 2
Letter 1
Background 3 Most of the Approximately 14,000 NHSC Providers in Fiscal Year
2020 Served in Areas with the Most Severe Shortages 7 About 40 Percent of NHSC Applicants Did Not Receive Funding—
Often Those Working in Less Severe Shortage Areas 14 Approximately 5 Percent of Participating NHSC Sites Had
Vacancies—Most Commonly in Federally Qualified Health Centers and for Primary Care Physicians 24
HRSA Has Supported Studies on Retention of NHSC Providers in HPSAs 27
Agency Comments 29 Appendix I: National Health Service Corps Providers in Fiscal Year 2020 and Site Vacancies as of October 15, 2020 30
Appendix II: GAO Contact and Staff Acknowledgments 32
Tables
Data table for Number of Applicants to the National Health Service Corps General Loan Repayment Program, by Funding Status, Fiscal Year 2020 3
Table 1: Requirements of National Health Service Corps (NHSC) Programs, Fiscal Year 2020 6
Data table for Figure 1: National Health Service Corps (NHSC) Providers and Program Funding, Fiscal Years (FY) 2015–2020 8
Table 2: National Health Service Corps (NHSC) Providers, by Program, Fiscal Year 2020 9
Data table for Figure 2: National Health Service Corps (NHSC) Providers, by Health Professional Shortage Area (HPSA) Score and Type, Fiscal Year 2020 11
Data table for Figure 3: Number and Percentage of National Health Service Corps (NHSC) Primary Care, Dental, and
Page ii GAO-21-323 National Health Service Corps
Mental Health Care Providers, by Site Type, Fiscal Year 202013
Table 3: National Health Service Corps (NHSC) Applicants and Funding Decisions, Fiscal Year 2020 15
Data table for Figure 4: Reasons National Health Service Corps (NHSC) Applicants Did Not Receive Funding, by Program Type, Fiscal Year 2020 16
Data table for Figure 5: National Health Service Corps (NHSC) Applicants Who Received or Did Not Receive Funding, by Provider Discipline, Fiscal Year 2020 18
Data table for Figure 6: Percentage of Applicants to the National Health Service Corps General Loan Repayment Program Who Received or Did Not Receive Funding, by Health Professional Shortage Area (HPSA) Score, Fiscal Year 202021
Data table for Figure 8: Primary Care Provider Vacancies at National Health Service Corps (NHSC) Sites on October 15, 2020, by Primary Care Health Provider Shortage Area (HPSA) Score 26
Table 4: National Health Service Corps (NHSC) Providers in Fiscal Year 2020 and Site Vacancies as of October 15, 2020, by State and U.S. Territory 30
Figures
Figure 1: National Health Service Corps (NHSC) Providers and Program Funding, Fiscal Years (FY) 2015–2020 8
Figure 2: National Health Service Corps (NHSC) Providers, by Health Professional Shortage Area (HPSA) Score and Type, Fiscal Year 2020 10
Figure 3: Number and Percentage of National Health Service Corps (NHSC) Primary Care, Dental, and Mental Health Care Providers, by Site Type, Fiscal Year 2020 12
Figure 4: Reasons National Health Service Corps (NHSC) Applicants Did Not Receive Funding, by Program Type, Fiscal Year 2020 16
Figure 5: National Health Service Corps (NHSC) Applicants Who Received or Did Not Receive Funding, by Provider Discipline, Fiscal Year 2020 17
Figure 6: Percentage of Applicants to the National Health Service Corps General Loan Repayment Program Who Received or Did Not Receive Funding, by Health Professional Shortage Area (HPSA) Score, Fiscal Year 2020 21
Page iii GAO-21-323 National Health Service Corps
Figure 7: National Health Service Corps (NHSC) Applications That Did Not Rank Highly Enough to Receive an Award (HPSA scores 14-16), by County, Fiscal Year 2020 24
Figure 8: Primary Care Provider Vacancies at National Health Service Corps (NHSC) Sites on October 15, 2020, by Primary Care Health Provider Shortage Area (HPSA) Score 26
Page iv GAO-21-323 National Health Service Corps
Abbreviations HPSA Health Professional Shortage Area HRSA Health Resources and Services Administration NHSC National Health Service Corps
This is a work of the U.S. government and is not subject to copyright protection in the United States. The published product may be reproduced and distributed in its entirety without further permission from GAO. However, because this work may contain copyrighted images or other material, permission from the copyright holder may be necessary if you wish to reproduce this material separately.
Page 1 GAO-21-323 National Health Service Corps
441 G St. N.W.Washington, DC 20548
Letter April 30, 2021
The Honorable Gary C. Peters Chairman Committee on Homeland Security and Governmental Affairs United States Senate
The Honorable Jacky Rosen United States Senate
Many Americans live in an area with a shortage of health care providers to care for the population—known as a Health Professional Shortage Area (HPSA). For example, the Health Resources and Services Administration (HRSA) within the Department of Health and Human Services estimated that, as of December 2020, primary care physician shortages affected almost 83 million Americans, or approximately 25 percent of the country. It estimated that an additional 15,193 primary care physicians would need to work in HPSAs to address these shortages.1
To help increase the number of health care providers working in HPSAs, HRSA’s National Health Service Corps (NHSC) programs offer loan repayment and scholarships to providers in exchange for providing primary, dental, or mental health care at certain clinical sites designated as HPSAs or located in a HPSA. These participating sites must meet certain requirements, such as offering care to patients regardless of their ability to pay. Although funding for NHSC has increased over time, HRSA has reported that providers’ interest in NHSC has consistently exceeded its available funding.
You asked us to describe current NHSC providers, applicants to the programs, and NHSC’s role in addressing provider shortage areas. This report describes
1. how many providers served in NHSC and where they served, 2. how many applicants to NHSC programs did not receive funding and
the characteristics of their applications,
1HRSA’s calculation of the number of additional primary care physicians needed is based on achieving a ratio of population to primary care physicians below 3,500:1 for a given area, or 1,000:1 for correctional facilities. This calculation does not consider primary care services provided by nurse practitioners and physician assistants.
Letter
Page 2 GAO-21-323 National Health Service Corps
3. how many participating NHSC sites had provider vacancies and the characteristics of these sites, and
4. what is known about the effectiveness of NHSC programs at alleviating provider shortages in underserved areas.
To describe how many providers served in NHSC and where they served, we analyzed HRSA’s field strength data as of September 30, 2020, which includes information about every provider serving in NHSC, including the NHSC program in which they were serving, their discipline, and the site or sites where they provided care. To describe how many applicants to NHSC programs did not receive funding and the characteristics of their applications, we analyzed data from HRSA on the applications providers submitted to NHSC programs in fiscal year 2020.
To describe how many participating NHSC sites had provider vacancies and the characteristics of these sites, we analyzed HRSA’s publicly available job opportunities data on the NHSC Health Workforce Connector, which reflects current vacancies at NHSC sites.2 We report data as of October 15, 2020, but we also compared data from this date with several other dates to verify consistency across several different points of time.3 For each of these data sets, we conducted data reliability tests, such as comparing the data for consistency across data sets and searching for any missing values or duplicate records. We determined that the data were sufficiently reliable for our use. We also interviewed knowledgeable HRSA officials to clarify questions and understand additional context and any changes made to NHSC programs.
To describe what is known about the effectiveness of NHSC at alleviating provider shortages in underserved areas, we conducted a literature review. Specifically, we performed a structured search for the term “National Health Service Corps” in research databases—such as Scopus, and ProQuest—to identify literature published from October 2010 through July 2020. We identified 41 studies for further review based on their relevance. From these studies, we selected the four studies that met the
2The job opportunities data includes vacancies that sites with provider shortages choose to list, according to HRSA officials. These data include positions for almost all of the provider disciplines eligible for NHSC, although HRSA officials noted that the job opportunity data do not include the positions specifically eligible for the substance use disorder programs. 3We also reviewed vacancy data from July 1, 2020; August 1, 2020; and September 1, 2020. We verified that the vacancies reflected similar characteristics, including in terms of provider types, site HPSA scores, and locations.
Letter
Page 3 GAO-21-323 National Health Service Corps
following criteria: (1) represented original research, (2) reported data collected in 2010 or later, and (3) assessed the effectiveness of NHSC programs.
We conducted this performance audit from March 2020 to April 2021 in accordance with generally accepted government auditing standards. Those standards require that we plan and perform the audit to obtain sufficient, appropriate evidence to provide a reasonable basis for our findings and conclusions based on our audit objectives. We believe that the evidence obtained provides a reasonable basis for our findings and conclusions based on our audit objectives.
Background Congress first authorized NHSC as part of the Emergency Health Personnel Act of 1970. Since that time, the program has received a combination of discretionary and mandatory appropriations. For example, since the enactment of the Patient Protection and Affordable Care Act, NHSC has received mandatory appropriations, and since fiscal year 2018, appropriations have been made to specifically address shortages for substance use disorder providers, among other things.4 NHSC’s available budget authority was $430 million for fiscal year 2020.
HPSAs
The HPSA designation system was established in 1978 to identify areas, populations, and facilities that have a shortage in primary, dental, or mental health care providers and that could be served by health care
4Pub. L. No. 111-148, § 10503(b)(2), 124 Stat. 119, 1004 (2010) (codified, as amended, at 42 U.S.C. § 254b-2(b)(2)). Under this provision, as amended, appropriations are made through fiscal year 2023 and remain available until expended. See, for example, Consolidated Appropriations Act, 2021, Pub. L. No. 116-260, div, H, title II, 134 Stat. 1182, 1568 (2020). These funds also remain available until expended.
Letter
Page 4 GAO-21-323 National Health Service Corps
providers from NHSC programs.5 State primary care offices may submit a potential HPSA to HRSA for consideration. HRSA reviews whether the submission meets the relevant eligibility criteria for a HPSA, and if the agency determines that the criteria are met, it will issue a HPSA designation. A HPSA designation may be identified for a geographic area, population, or facility.
HRSA, in coordination with state primary care offices, assigns each HPSA a score ranging from 1 to 25 for primary care or mental health care and 1 to 26 for dental health care, with a higher score indicating a more severe shortage in that area. HPSA scores are determined based on a combination of factors. For example, for HPSAs that have primary care provider shortages, the most heavily weighted factor is the population-to-provider ratio, representing 0-10 possible points. Other factors are related to poverty, infant health, and the travel time or travel distance to the nearest source of care outside the HPSA. One site may have multiple HPSA scores, with each representing the shortage of primary care, dental, or mental health providers.
NHSC Participating Sites
NHSC recipients fulfill their service commitment by providing care at a participating site, and for most NHSC programs, applicants are required to have accepted a position at a participating site before applying for NHSC funding. HRSA maintains a list of participating clinical sites that NHSC providers may work at during their obligated service, as well as job opportunities at these sites. Sites must be located in HPSAs and meet other criteria, such as offering care to patients regardless of their ability to pay. Specific additional site requirements vary across NHSC programs. The most common participating NHSC sites are federally qualified health centers—facilities that provide care to underserved populations.
5According to HRSA, facility HPSAs include two categories: (1) facilities that have an application process that follows the designation methodology established in federal regulation, including state and federal correctional facilities, state mental health hospitals, and public or non-profit clinics that serve the population of an existing geographic or population HPSA; and (2) facilities that HRSA automatically designates as HPSAs based on statute and regulations, referred to as “automatic HPSAs.” These include federally qualified health centers; federally qualified health center look-alike clinics; certain Medicare-certified rural health clinics that meet NHSC site criteria; and Indian Health Service, Tribal, and Urban Indian Health facilities.
Letter
Page 5 GAO-21-323 National Health Service Corps
NHSC Providers
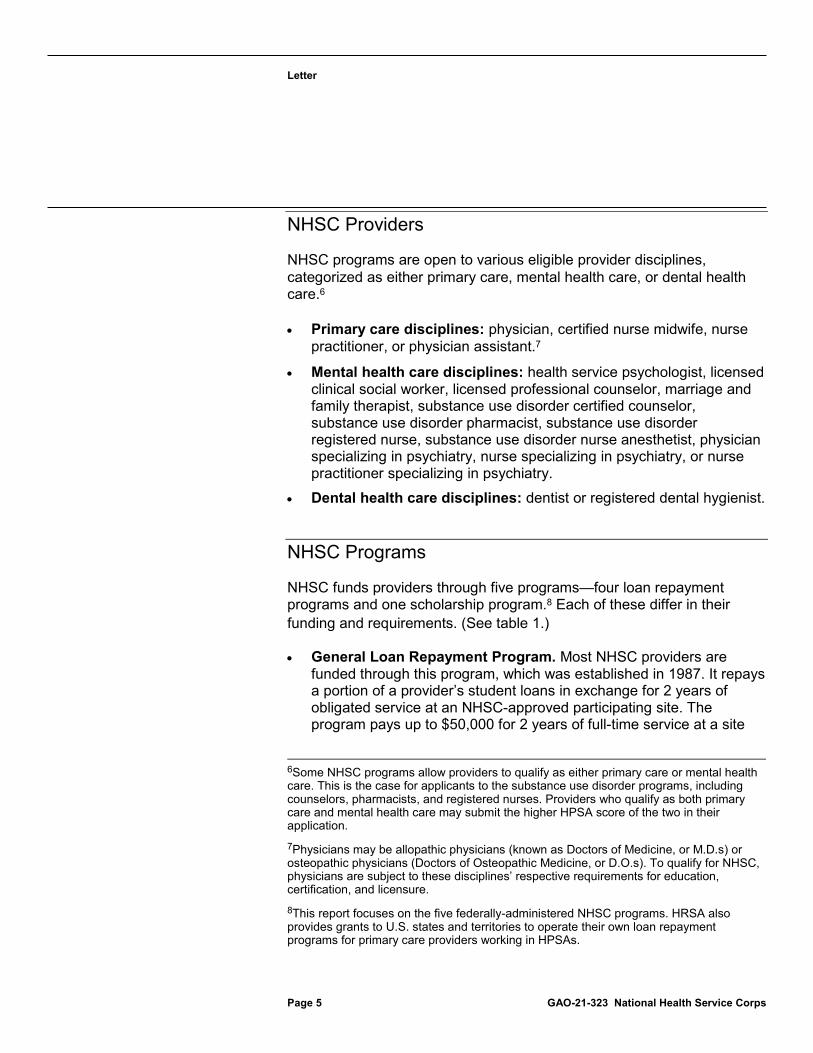
NHSC programs are open to various eligible provider disciplines, categorized as either primary care, mental health care, or dental health care.6
· Primary care disciplines: physician, certified nurse midwife, nurse practitioner, or physician assistant.7
· Mental health care disciplines: health service psychologist, licensed clinical social worker, licensed professional counselor, marriage and family therapist, substance use disorder certified counselor, substance use disorder pharmacist, substance use disorder registered nurse, substance use disorder nurse anesthetist, physician specializing in psychiatry, nurse specializing in psychiatry, or nurse practitioner specializing in psychiatry.
· Dental health care disciplines: dentist or registered dental hygienist.
NHSC Programs
NHSC funds providers through five programs—four loan repayment programs and one scholarship program.8 Each of these differ in their funding and requirements. (See table 1.)
· General Loan Repayment Program. Most NHSC providers are funded through this program, which was established in 1987. It repays a portion of a provider’s student loans in exchange for 2 years of obligated service at an NHSC-approved participating site. The program pays up to $50,000 for 2 years of full-time service at a site
6Some NHSC programs allow providers to qualify as either primary care or mental health care. This is the case for applicants to the substance use disorder programs, including counselors, pharmacists, and registered nurses. Providers who qualify as both primary care and mental health care may submit the higher HPSA score of the two in their application. 7Physicians may be allopathic physicians (known as Doctors of Medicine, or M.D.s) or osteopathic physicians (Doctors of Osteopathic Medicine, or D.O.s). To qualify for NHSC, physicians are subject to these disciplines’ respective requirements for education, certification, and licensure. 8This report focuses on the five federally-administered NHSC programs. HRSA also provides grants to U.S. states and territories to operate their own loan repayment programs for primary care providers working in HPSAs.
Letter
Page 6 GAO-21-323 National Health Service Corps
with a HPSA score of 14 or higher, and it offers up to $25,000 in exchange for part-time service. Providers have the option to apply to receive additional funding if they continue to serve in a participating site, continue to have outstanding educational debt, and meet other eligibility requirements.
· Substance Use Disorder Workforce Loan Repayment Program. This program is open to substance use disorder providers serving at a participating NHSC site, including some site types that are only eligible for NHSC funding through this program. Substance use disorder counselors, pharmacists, and registered nurses are eligible for the program. The program was established in 2018 in response to the opioid crisis, and it provides a higher level of funding to recipients than the General Loan Repayment Program.
· Rural Community Loan Repayment Program. This program, also established in 2018, specifically funds substance use disorder providers serving in rural communities.
· Students to Service Loan Repayment Program. This program provides loan repayments to recipients in their last year of medical, nursing, or dental school in exchange for NHSC service after completing their training. Recipients must agree to serve at a site that meets a minimum HPSA score of 14.
· Scholarship Program. NHSC offers scholarships to students pursuing primary care training. The scholarship recipients must agree to serve at a participating NHSC site after they complete their training. Their length of service is calculated as 1 year for each year of scholarship support they received, with a minimum of 2 years of obligated full-time service. For example, if recipients receive 1 or 2 years of scholarship support, they serve 2 years after completing their training; for 3 or 4 years of support they serve 3 or 4 years, respectively. Recipients must agree to serve at a site that meets a minimum HPSA score, which HRSA sets each year. This minimum HPSA score may vary for different provider types. This program was established in 1972.
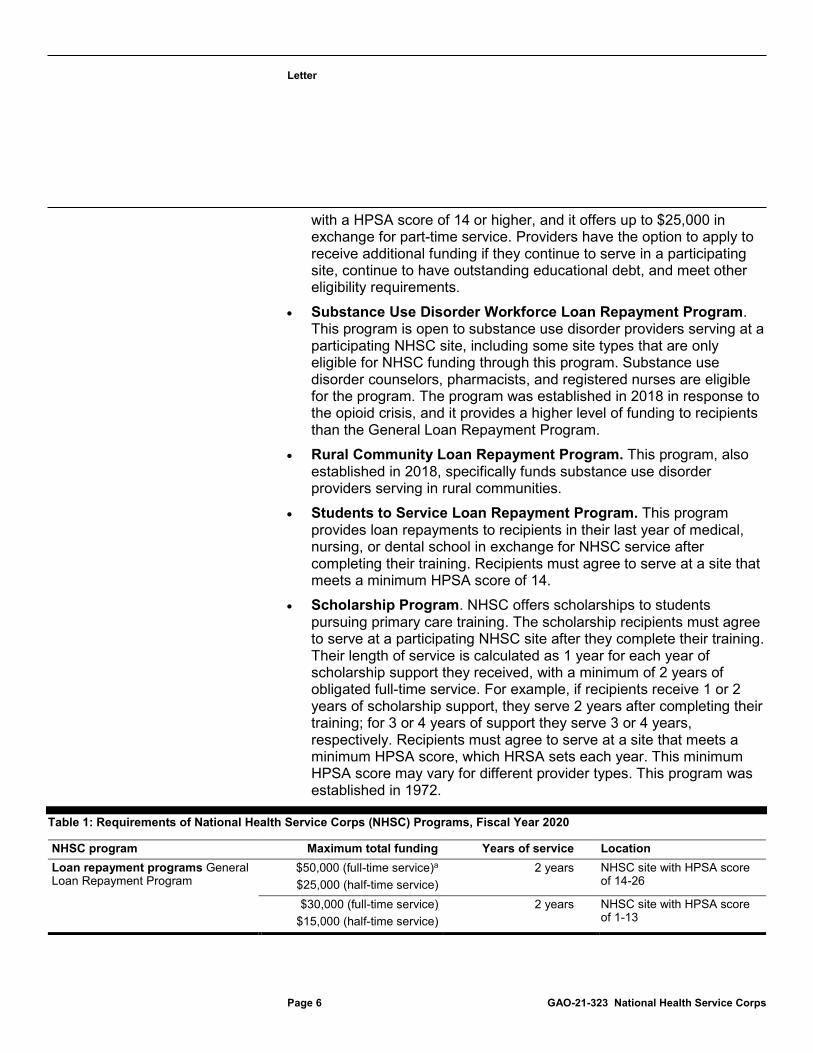
Table 1: Requirements of National Health Service Corps (NHSC) Programs, Fiscal Year 2020
NHSC program Maximum total funding Years of service Location Loan repayment programs General Loan Repayment Program
$50,000 (full-time service)a $25,000 (half-time service)
2 years NHSC site with HPSA score of 14-26
$30,000 (full-time service) $15,000 (half-time service)
2 years NHSC site with HPSA score of 1-13
Letter
Page 7 GAO-21-323 National Health Service Corps
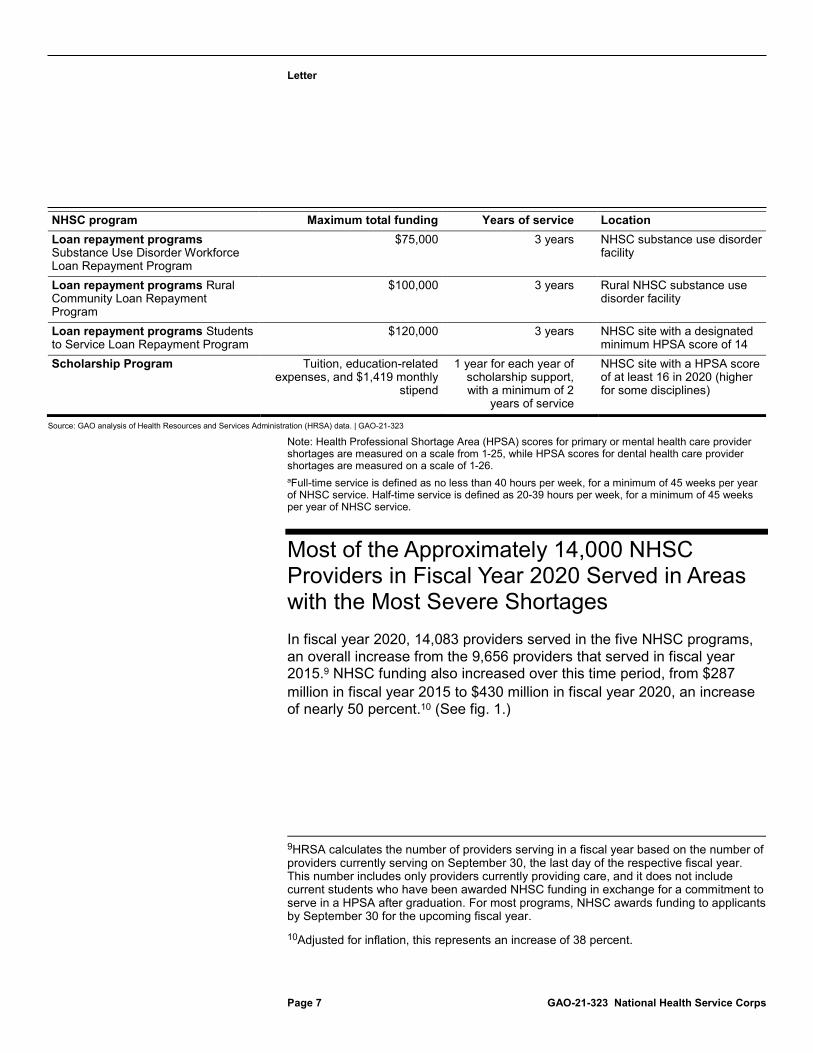
NHSC program Maximum total funding Years of service Location Loan repayment programs Substance Use Disorder Workforce Loan Repayment Program
$75,000 3 years NHSC substance use disorder facility
Loan repayment programs Rural Community Loan Repayment Program
$100,000 3 years Rural NHSC substance use disorder facility
Loan repayment programs Students to Service Loan Repayment Program
$120,000 3 years NHSC site with a designated minimum HPSA score of 14
Scholarship Program Tuition, education-related expenses, and $1,419 monthly
stipend
1 year for each year of scholarship support, with a minimum of 2
years of service
NHSC site with a HPSA score of at least 16 in 2020 (higher for some disciplines)
Source: GAO analysis of Health Resources and Services Administration (HRSA) data. | GAO-21-323
Note: Health Professional Shortage Area (HPSA) scores for primary or mental health care provider shortages are measured on a scale from 1-25, while HPSA scores for dental health care provider shortages are measured on a scale of 1-26.aFull-time service is defined as no less than 40 hours per week, for a minimum of 45 weeks per year of NHSC service. Half-time service is defined as 20-39 hours per week, for a minimum of 45 weeks per year of NHSC service.
Most of the Approximately 14,000 NHSC Providers in Fiscal Year 2020 Served in Areas with the Most Severe ShortagesIn fiscal year 2020, 14,083 providers served in the five NHSC programs, an overall increase from the 9,656 providers that served in fiscal year 2015.9 NHSC funding also increased over this time period, from $287 million in fiscal year 2015 to $430 million in fiscal year 2020, an increase of nearly 50 percent.10 (See fig. 1.)
9HRSA calculates the number of providers serving in a fiscal year based on the number of providers currently serving on September 30, the last day of the respective fiscal year. This number includes only providers currently providing care, and it does not include current students who have been awarded NHSC funding in exchange for a commitment to serve in a HPSA after graduation. For most programs, NHSC awards funding to applicants by September 30 for the upcoming fiscal year. 10Adjusted for inflation, this represents an increase of 38 percent.
Letter
Page 8 GAO-21-323 National Health Service Corps
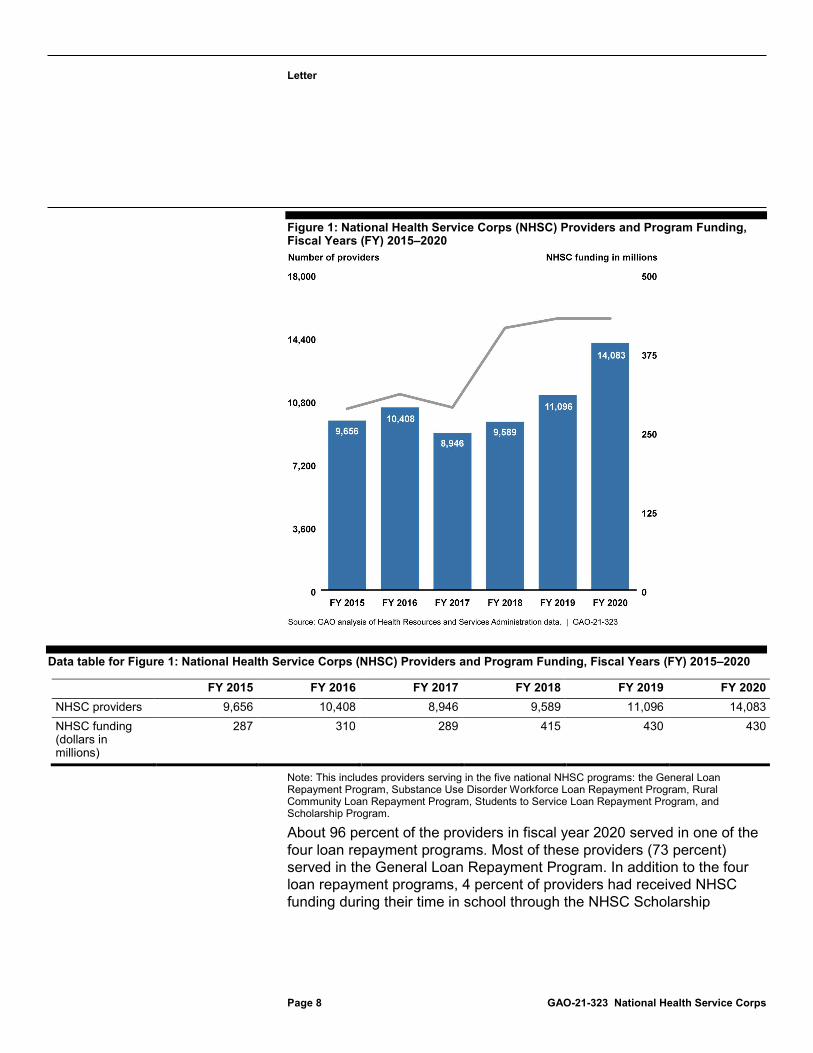
Figure 1: National Health Service Corps (NHSC) Providers and Program Funding, Fiscal Years (FY) 2015–2020
Data table for Figure 1: National Health Service Corps (NHSC) Providers and Program Funding, Fiscal Years (FY) 2015–2020
FY 2015 FY 2016 FY 2017 FY 2018 FY 2019 FY 2020 NHSC providers 9,656 10,408 8,946 9,589 11,096 14,083 NHSC funding (dollars in millions)
287 310 289 415 430 430
Note: This includes providers serving in the five national NHSC programs: the General Loan Repayment Program, Substance Use Disorder Workforce Loan Repayment Program, Rural Community Loan Repayment Program, Students to Service Loan Repayment Program, and Scholarship Program.
About 96 percent of the providers in fiscal year 2020 served in one of the four loan repayment programs. Most of these providers (73 percent) served in the General Loan Repayment Program. In addition to the four loan repayment programs, 4 percent of providers had received NHSC funding during their time in school through the NHSC Scholarship
Letter
Page 9 GAO-21-323 National Health Service Corps
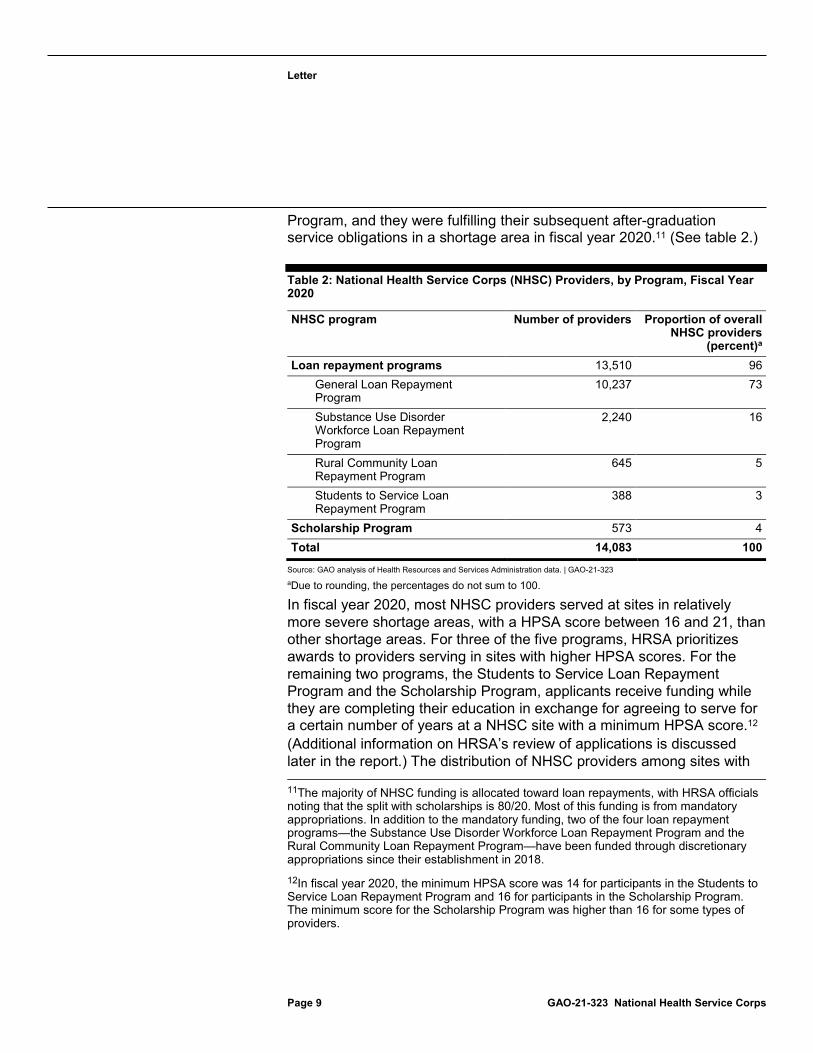
Program, and they were fulfilling their subsequent after-graduation service obligations in a shortage area in fiscal year 2020.11 (See table 2.)
Table 2: National Health Service Corps (NHSC) Providers, by Program, Fiscal Year 2020
NHSC program Number of providers Proportion of overall NHSC providers
(percent)a Loan repayment programs 13,510 96
General Loan Repayment Program
10,237 73
Substance Use Disorder Workforce Loan Repayment Program
2,240 16
Rural Community Loan Repayment Program
645 5
Students to Service Loan Repayment Program
388 3
Scholarship Program 573 4 Total 14,083 100
Source: GAO analysis of Health Resources and Services Administration data. | GAO-21-323aDue to rounding, the percentages do not sum to 100.
In fiscal year 2020, most NHSC providers served at sites in relatively more severe shortage areas, with a HPSA score between 16 and 21, than other shortage areas. For three of the five programs, HRSA prioritizes awards to providers serving in sites with higher HPSA scores. For the remaining two programs, the Students to Service Loan Repayment Program and the Scholarship Program, applicants receive funding while they are completing their education in exchange for agreeing to serve for a certain number of years at a NHSC site with a minimum HPSA score.12
(Additional information on HRSA’s review of applications is discussed later in the report.) The distribution of NHSC providers among sites with 11The majority of NHSC funding is allocated toward loan repayments, with HRSA officials noting that the split with scholarships is 80/20. Most of this funding is from mandatory appropriations. In addition to the mandatory funding, two of the four loan repayment programs—the Substance Use Disorder Workforce Loan Repayment Program and the Rural Community Loan Repayment Program—have been funded through discretionary appropriations since their establishment in 2018. 12In fiscal year 2020, the minimum HPSA score was 14 for participants in the Students to Service Loan Repayment Program and 16 for participants in the Scholarship Program. The minimum score for the Scholarship Program was higher than 16 for some types of providers.
Letter
Page 10 GAO-21-323 National Health Service Corps
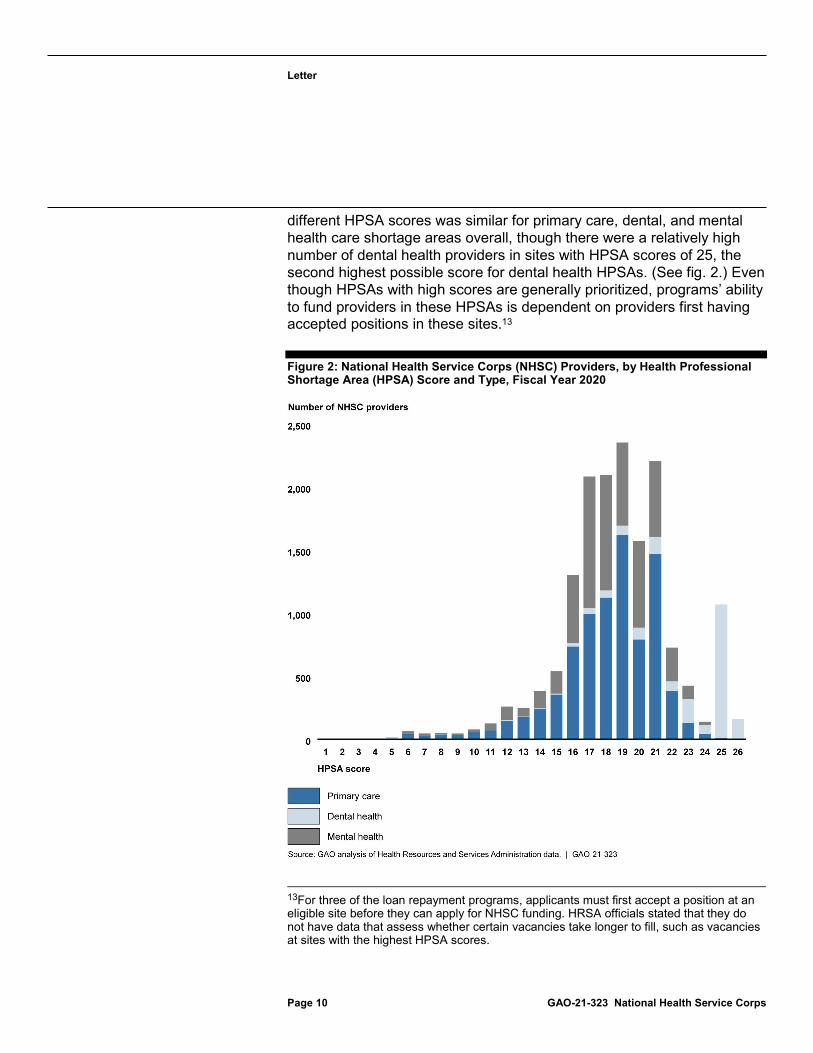
different HPSA scores was similar for primary care, dental, and mental health care shortage areas overall, though there were a relatively high number of dental health providers in sites with HPSA scores of 25, the second highest possible score for dental health HPSAs. (See fig. 2.) Even though HPSAs with high scores are generally prioritized, programs’ ability to fund providers in these HPSAs is dependent on providers first having accepted positions in these sites.13
Figure 2: National Health Service Corps (NHSC) Providers, by Health Professional Shortage Area (HPSA) Score and Type, Fiscal Year 2020
13For three of the loan repayment programs, applicants must first accept a position at an eligible site before they can apply for NHSC funding. HRSA officials stated that they do not have data that assess whether certain vacancies take longer to fill, such as vacancies at sites with the highest HPSA scores.
Letter
Page 11 GAO-21-323 National Health Service Corps
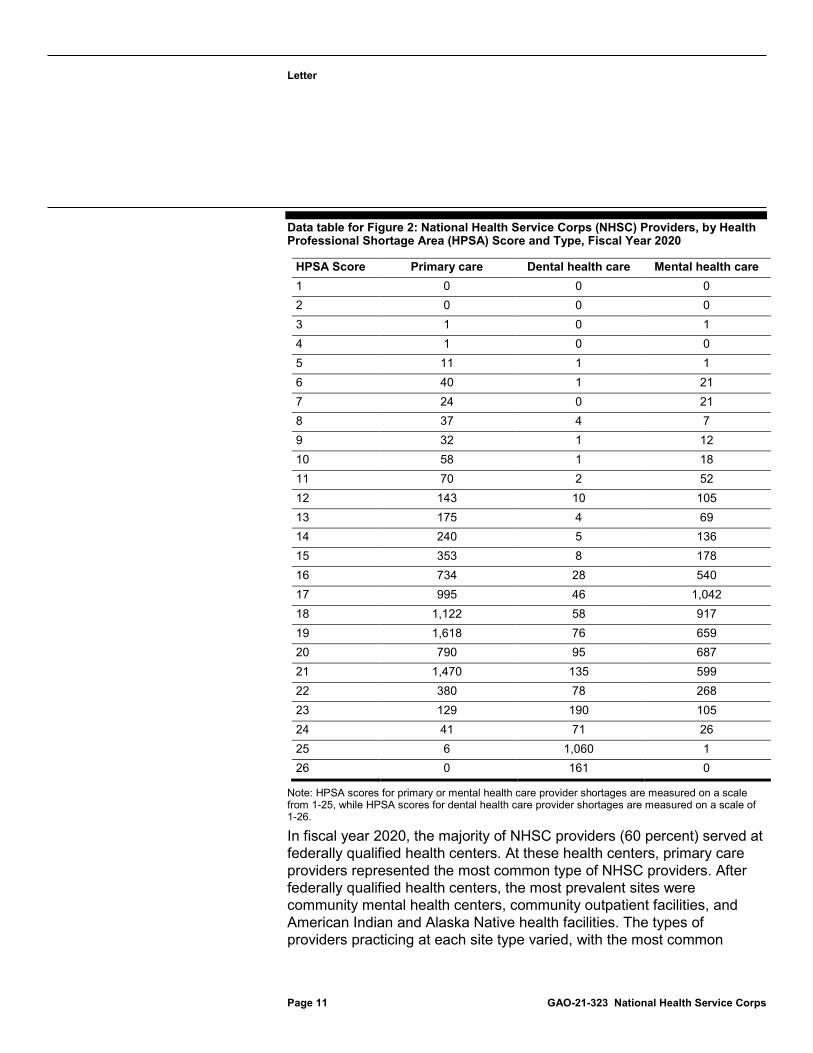
Data table for Figure 2: National Health Service Corps (NHSC) Providers, by Health Professional Shortage Area (HPSA) Score and Type, Fiscal Year 2020
HPSA Score Primary care Dental health care Mental health care 1 0 0 0 2 0 0 0 3 1 0 1 4 1 0 0 5 11 1 1 6 40 1 21 7 24 0 21 8 37 4 7 9 32 1 12 10 58 1 18 11 70 2 52 12 143 10 105 13 175 4 69 14 240 5 136 15 353 8 178 16 734 28 540 17 995 46 1,042 18 1,122 58 917 19 1,618 76 659 20 790 95 687 21 1,470 135 599 22 380 78 268 23 129 190 105 24 41 71 26 25 6 1,060 1 26 0 161 0
Note: HPSA scores for primary or mental health care provider shortages are measured on a scale from 1-25, while HPSA scores for dental health care provider shortages are measured on a scale of 1-26.
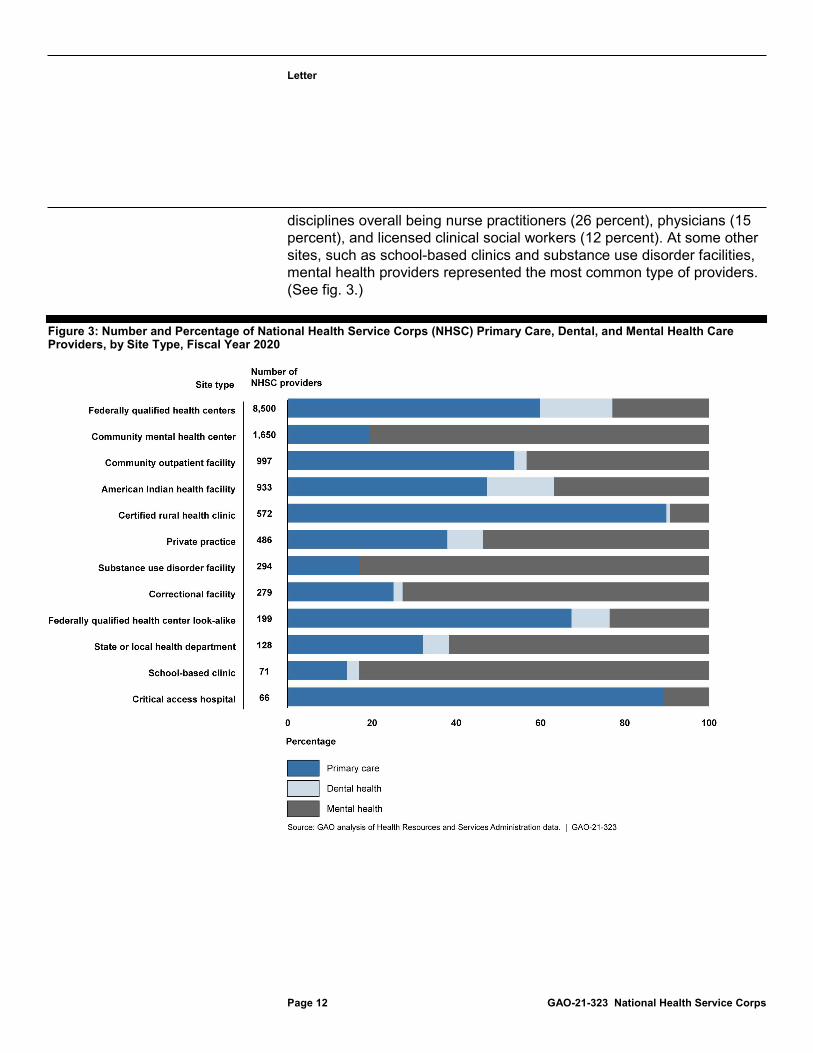
In fiscal year 2020, the majority of NHSC providers (60 percent) served at federally qualified health centers. At these health centers, primary care providers represented the most common type of NHSC providers. After federally qualified health centers, the most prevalent sites were community mental health centers, community outpatient facilities, and American Indian and Alaska Native health facilities. The types of providers practicing at each site type varied, with the most common
Letter
Page 12 GAO-21-323 National Health Service Corps
disciplines overall being nurse practitioners (26 percent), physicians (15 percent), and licensed clinical social workers (12 percent). At some other sites, such as school-based clinics and substance use disorder facilities, mental health providers represented the most common type of providers. (See fig. 3.)
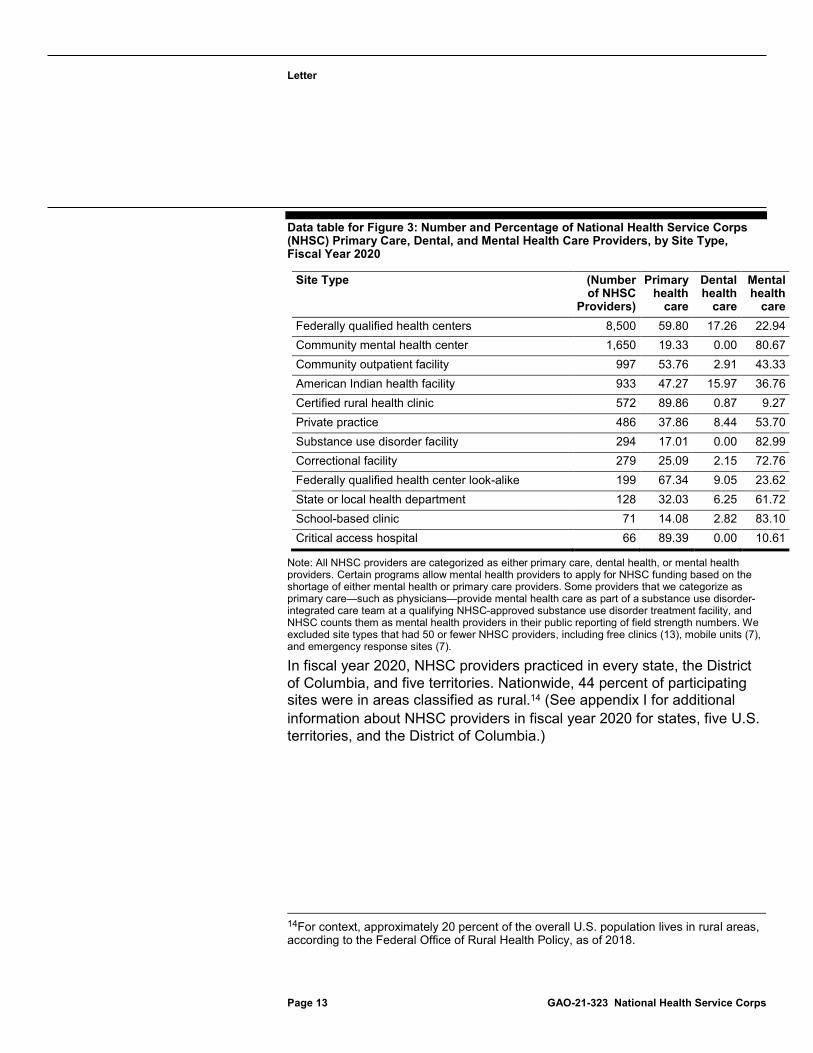
Figure 3: Number and Percentage of National Health Service Corps (NHSC) Primary Care, Dental, and Mental Health Care Providers, by Site Type, Fiscal Year 2020
Letter
Page 13 GAO-21-323 National Health Service Corps
Data table for Figure 3: Number and Percentage of National Health Service Corps (NHSC) Primary Care, Dental, and Mental Health Care Providers, by Site Type, Fiscal Year 2020
Site Type (Number of NHSC
Providers)
Primary health
care
Dental health
care
Mental health
care Federally qualified health centers 8,500 59.80 17.26 22.94 Community mental health center 1,650 19.33 0.00 80.67 Community outpatient facility 997 53.76 2.91 43.33 American Indian health facility 933 47.27 15.97 36.76 Certified rural health clinic 572 89.86 0.87 9.27 Private practice 486 37.86 8.44 53.70 Substance use disorder facility 294 17.01 0.00 82.99 Correctional facility 279 25.09 2.15 72.76 Federally qualified health center look-alike 199 67.34 9.05 23.62 State or local health department 128 32.03 6.25 61.72 School-based clinic 71 14.08 2.82 83.10 Critical access hospital 66 89.39 0.00 10.61
Note: All NHSC providers are categorized as either primary care, dental health, or mental health providers. Certain programs allow mental health providers to apply for NHSC funding based on the shortage of either mental health or primary care providers. Some providers that we categorize as primary care—such as physicians—provide mental health care as part of a substance use disorder-integrated care team at a qualifying NHSC-approved substance use disorder treatment facility, and NHSC counts them as mental health providers in their public reporting of field strength numbers. We excluded site types that had 50 or fewer NHSC providers, including free clinics (13), mobile units (7), and emergency response sites (7).
In fiscal year 2020, NHSC providers practiced in every state, the District of Columbia, and five territories. Nationwide, 44 percent of participating sites were in areas classified as rural.14 (See appendix I for additional information about NHSC providers in fiscal year 2020 for states, five U.S. territories, and the District of Columbia.)
14For context, approximately 20 percent of the overall U.S. population lives in rural areas, according to the Federal Office of Rural Health Policy, as of 2018.
Letter
Page 14 GAO-21-323 National Health Service Corps
About 40 Percent of NHSC Applicants Did Not Receive Funding—Often Those Working in Less Severe Shortage Areas
About 40 Percent of NHSC Applicants Did Not Receive Funding, and the Rate of Funding Varied for Different Programs
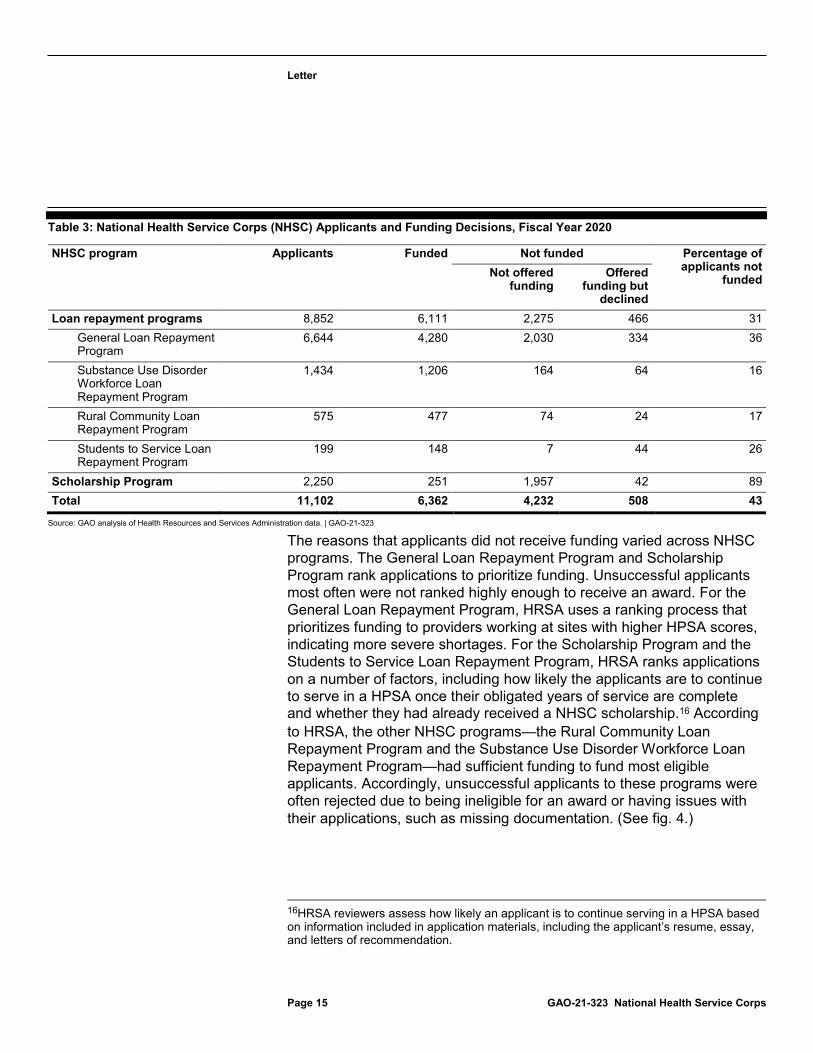
For fiscal year 2020, 11,102 applicants submitted applications to NHSC programs, and 43 percent of these applicants did not receive funding.15
The proportion of applicants who did not receive funding varied across the NHSC programs. The Scholarship Program had the highest proportion (89 percent) of applicants who did not receive funding, while the Substance Use Disorder Workforce Loan Repayment Program had the lowest proportion (16 percent) of applicants who did not receive funding. (See table 3.)
15HRSA officials stated that in fiscal year 2020, a higher percentage of new applicants were funded than in recent years due to having carryover funds while establishing the Substance Use Disorder Workforce Loan Repayment Program and Rural Community Loan Repayment Program. Officials said that in previous years, approximately 60 percent of applications for new awards to the General Loan Repayment Program were not funded.
Letter
Page 15 GAO-21-323 National Health Service Corps
Table 3: National Health Service Corps (NHSC) Applicants and Funding Decisions, Fiscal Year 2020
NHSC program Applicants Funded Not funded Percentage of applicants not
funded Not offered funding
Offered funding but
declined Loan repayment programs 8,852 6,111 2,275 466 31
General Loan Repayment Program
6,644 4,280 2,030 334 36
Substance Use Disorder Workforce Loan Repayment Program
1,434 1,206 164 64 16
Rural Community Loan Repayment Program
575 477 74 24 17
Students to Service Loan Repayment Program
199 148 7 44 26
Scholarship Program 2,250 251 1,957 42 89 Total 11,102 6,362 4,232 508 43
Source: GAO analysis of Health Resources and Services Administration data. | GAO-21-323
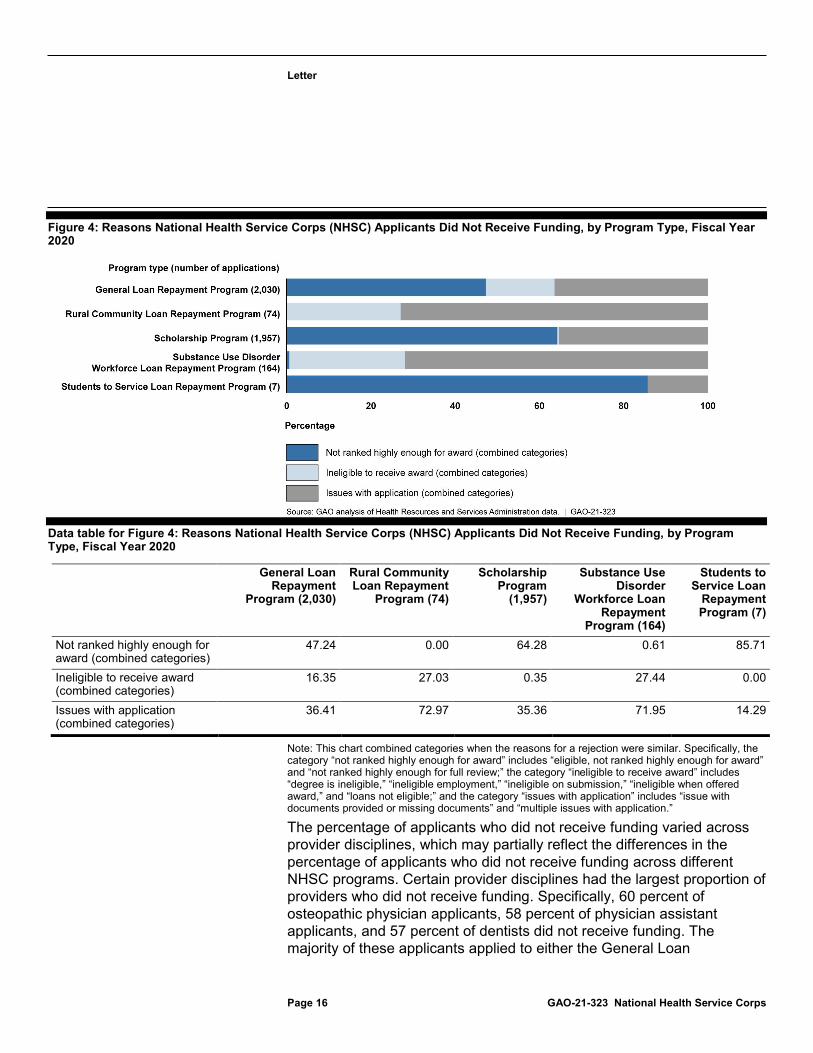
The reasons that applicants did not receive funding varied across NHSC programs. The General Loan Repayment Program and Scholarship Program rank applications to prioritize funding. Unsuccessful applicants most often were not ranked highly enough to receive an award. For the General Loan Repayment Program, HRSA uses a ranking process that prioritizes funding to providers working at sites with higher HPSA scores, indicating more severe shortages. For the Scholarship Program and the Students to Service Loan Repayment Program, HRSA ranks applications on a number of factors, including how likely the applicants are to continueto serve in a HPSA once their obligated years of service are complete and whether they had already received a NHSC scholarship.16 According to HRSA, the other NHSC programs—the Rural Community Loan Repayment Program and the Substance Use Disorder Workforce Loan Repayment Program—had sufficient funding to fund most eligible applicants. Accordingly, unsuccessful applicants to these programs were often rejected due to being ineligible for an award or having issues with their applications, such as missing documentation. (See fig. 4.)
16HRSA reviewers assess how likely an applicant is to continue serving in a HPSA based on information included in application materials, including the applicant’s resume, essay, and letters of recommendation.
Letter
Page 16 GAO-21-323 National Health Service Corps
Figure 4: Reasons National Health Service Corps (NHSC) Applicants Did Not Receive Funding, by Program Type, Fiscal Year 2020
Data table for Figure 4: Reasons National Health Service Corps (NHSC) Applicants Did Not Receive Funding, by Program Type, Fiscal Year 2020
General Loan Repayment
Program (2,030)
Rural Community Loan Repayment
Program (74)
Scholarship Program
(1,957)
Substance Use Disorder
Workforce Loan Repayment
Program (164)
Students to Service Loan
Repayment Program (7)
Not ranked highly enough for award (combined categories)
47.24 0.00 64.28 0.61 85.71
Ineligible to receive award (combined categories)
16.35 27.03 0.35 27.44 0.00
Issues with application (combined categories)
36.41 72.97 35.36 71.95 14.29
Note: This chart combined categories when the reasons for a rejection were similar. Specifically, the category “not ranked highly enough for award” includes “eligible, not ranked highly enough for award” and “not ranked highly enough for full review;” the category “ineligible to receive award” includes “degree is ineligible,” “ineligible employment,” “ineligible on submission,” “ineligible when offered award,” and “loans not eligible;” and the category “issues with application” includes “issue with documents provided or missing documents” and “multiple issues with application.”
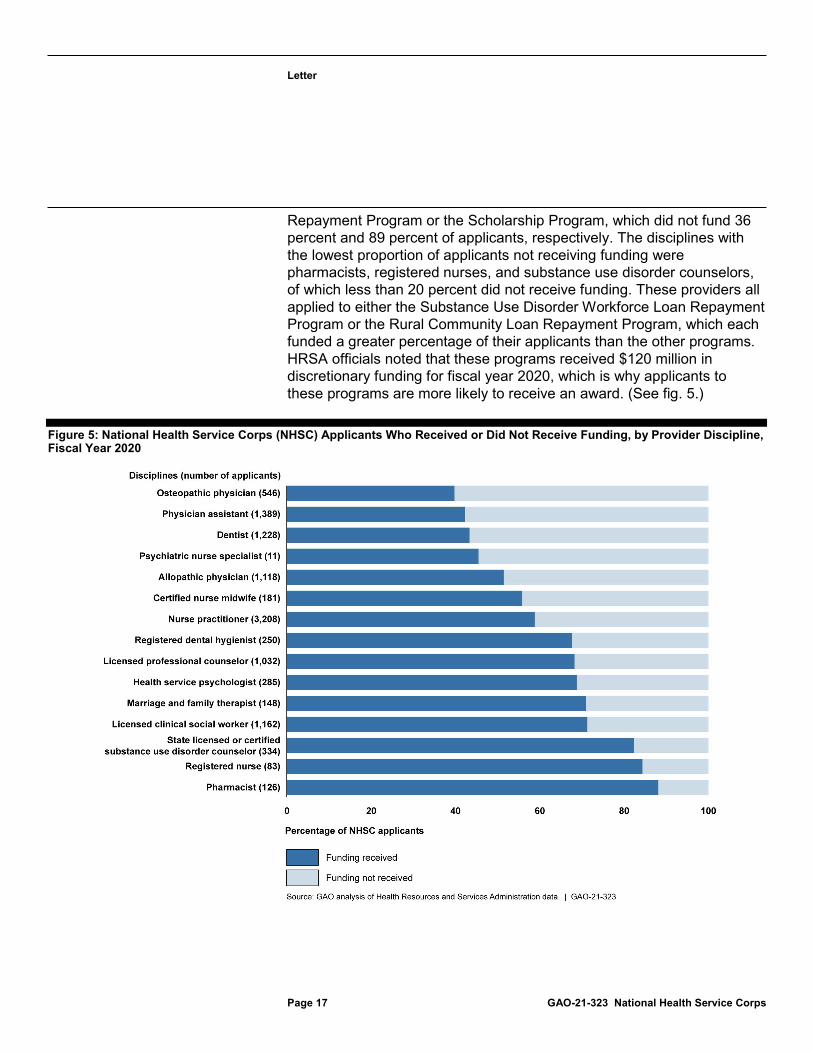
The percentage of applicants who did not receive funding varied across provider disciplines, which may partially reflect the differences in the percentage of applicants who did not receive funding across different NHSC programs. Certain provider disciplines had the largest proportion of providers who did not receive funding. Specifically, 60 percent of osteopathic physician applicants, 58 percent of physician assistant applicants, and 57 percent of dentists did not receive funding. The majority of these applicants applied to either the General Loan
Letter
Page 17 GAO-21-323 National Health Service Corps
Repayment Program or the Scholarship Program, which did not fund 36 percent and 89 percent of applicants, respectively. The disciplines with the lowest proportion of applicants not receiving funding were pharmacists, registered nurses, and substance use disorder counselors, of which less than 20 percent did not receive funding. These providers all applied to either the Substance Use Disorder Workforce Loan Repayment Program or the Rural Community Loan Repayment Program, which each funded a greater percentage of their applicants than the other programs. HRSA officials noted that these programs received $120 million in discretionary funding for fiscal year 2020, which is why applicants to these programs are more likely to receive an award. (See fig. 5.)
Figure 5: National Health Service Corps (NHSC) Applicants Who Received or Did Not Receive Funding, by Provider Discipline, Fiscal Year 2020
Letter
Page 18 GAO-21-323 National Health Service Corps
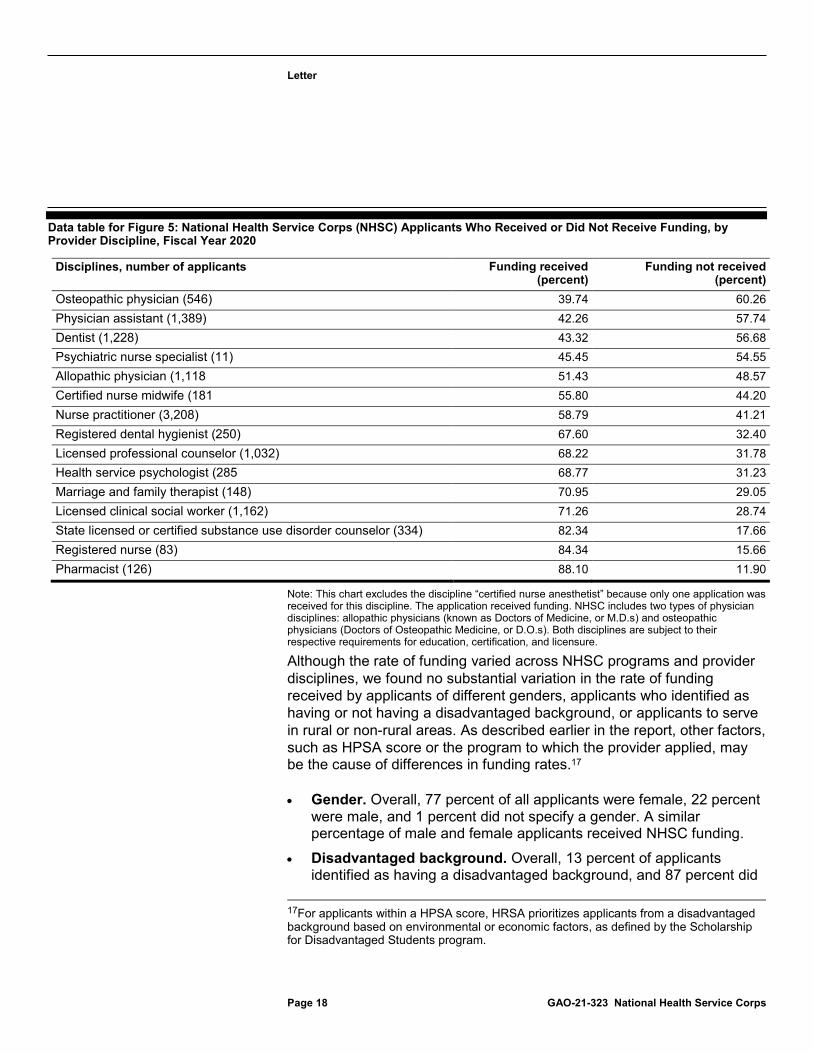
Data table for Figure 5: National Health Service Corps (NHSC) Applicants Who Received or Did Not Receive Funding, by Provider Discipline, Fiscal Year 2020
Disciplines, number of applicants Funding received (percent)
Funding not received (percent)
Osteopathic physician (546) 39.74 60.26 Physician assistant (1,389) 42.26 57.74 Dentist (1,228) 43.32 56.68 Psychiatric nurse specialist (11) 45.45 54.55 Allopathic physician (1,118 51.43 48.57 Certified nurse midwife (181 55.80 44.20 Nurse practitioner (3,208) 58.79 41.21 Registered dental hygienist (250) 67.60 32.40 Licensed professional counselor (1,032) 68.22 31.78 Health service psychologist (285 68.77 31.23 Marriage and family therapist (148) 70.95 29.05 Licensed clinical social worker (1,162) 71.26 28.74 State licensed or certified substance use disorder counselor (334) 82.34 17.66 Registered nurse (83) 84.34 15.66 Pharmacist (126) 88.10 11.90
Note: This chart excludes the discipline “certified nurse anesthetist” because only one application was received for this discipline. The application received funding. NHSC includes two types of physician disciplines: allopathic physicians (known as Doctors of Medicine, or M.D.s) and osteopathic physicians (Doctors of Osteopathic Medicine, or D.O.s). Both disciplines are subject to their respective requirements for education, certification, and licensure.
Although the rate of funding varied across NHSC programs and provider disciplines, we found no substantial variation in the rate of funding received by applicants of different genders, applicants who identified as having or not having a disadvantaged background, or applicants to serve in rural or non-rural areas. As described earlier in the report, other factors, such as HPSA score or the program to which the provider applied, may be the cause of differences in funding rates.17
· Gender. Overall, 77 percent of all applicants were female, 22 percent were male, and 1 percent did not specify a gender. A similar percentage of male and female applicants received NHSC funding.
· Disadvantaged background. Overall, 13 percent of applicants identified as having a disadvantaged background, and 87 percent did
17For applicants within a HPSA score, HRSA prioritizes applicants from a disadvantaged background based on environmental or economic factors, as defined by the Scholarship for Disadvantaged Students program.
Letter
Page 19 GAO-21-323 National Health Service Corps
not, with similar rates of funding for both groups. Whether applicants identify as having a disadvantaged background is a factor that HRSA considers when reviewing and ranking applicants within the same HPSA score.
· Service at rural and non-rural sites. A similar proportion of applicants for the loan repayment programs who applied to serve at sites in rural areas received funding (66 percent), as compared to applicants who applied to serve at non-rural sites (70 percent).18
· Race. Overall, 66 percent of applicants identified as Caucasian, 15 percent identified as African American, 6 percent identified as Asian, and the remaining 13 percent identified as another race or more than one race. Rates of funding varied across racial groups. The 0.6 percent of applicants who identified as Native Hawaiian or Other Pacific Islander received funding at lower rates than other races, and the 2.4 percent of applicants who identified as American Indian or Alaska Native received funding at higher rates.19
For the General Loan Repayment Program, Most Applicants Who Did Not Receive Funding Were Serving in Less Severe Shortage Areas
A greater proportion of applicants to the General Loan Repayment Program who were at sites with higher HPSA scores (representing more severe shortage areas) received funding than those who were at sites
18This excludes applications to the Scholarship Program and Students to Service Program. These applicants are not applying for a position at a specific site, so site characteristics are not applicable. 19HRSA officials noted that NHSC receives dedicated funding for Indian Health Service, Tribal, and Urban Indian facilities, which increases the likelihood that providers at these sites will be funded. They also said these types of sites typically have a higher proportion of American Indian or Alaska Native providers than other facilities.
Letter
Page 20 GAO-21-323 National Health Service Corps
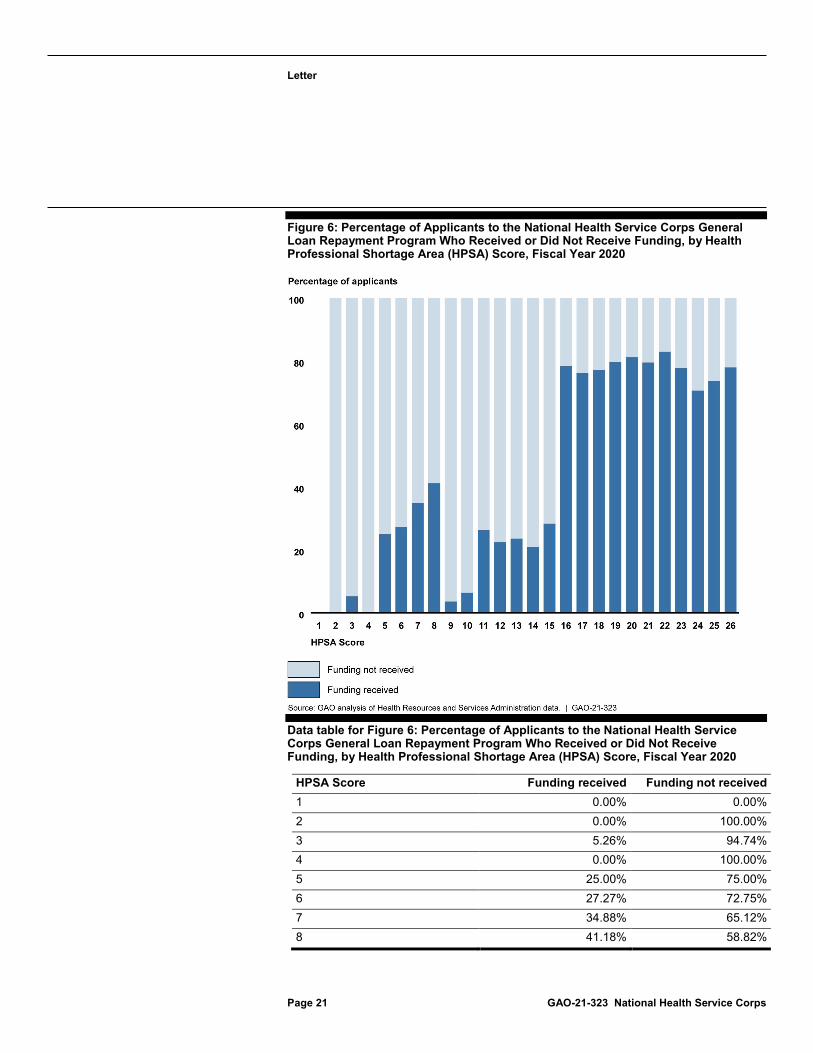
with lower HPSA scores.20 For this program, HRSA prioritizes awarding funding to applicants at sites with higher HPSA scores, which indicate a more severe provider shortage.21 Specifically, HRSA reviews applications in order starting with the highest HPSA scores. It awards funding to all applicants who submitted complete and eligible applications for sites with the same HPSA score before moving to sites with a lower HPSA score. As a result, more than 70 percent of applicants working at sites with a HPSA score of 15 or lower did not receive funding, while less than 30 percent of those at sites with a HPSA score of 16 or higher did not receive funding. (See fig. 6.)
20Due to the variation among NHSC programs in the program requirements, we focused this analysis on the largest program: the General Loan Repayment Program. Although the Scholarship Program also most commonly denied applicants because they were not ranked highly enough for funding, the Scholarship Program uses different criteria to rank applications, which makes comparison with the loan repayment program difficult. For example, a site’s HPSA score is not a factor because scholarship applicants are currently in school and are not applying for a specific site. There was also one applicant to the Substance Use Disorder Workforce Loan Repayment Program that was not ranked highly enough to receive funding. Applicants to other NHSC programs were rejected for other reasons, often related to incomplete or ineligible applications. 21HRSA officials noted that if a provider applies for NHSC funding while working at more than one NHSC participating site, HRSA uses the lowest HPSA score of the sites for the type of provider when determining which score is used to rank the application.
Letter
Page 21 GAO-21-323 National Health Service Corps
Figure 6: Percentage of Applicants to the National Health Service Corps General Loan Repayment Program Who Received or Did Not Receive Funding, by Health Professional Shortage Area (HPSA) Score, Fiscal Year 2020
Data table for Figure 6: Percentage of Applicants to the National Health Service Corps General Loan Repayment Program Who Received or Did Not Receive Funding, by Health Professional Shortage Area (HPSA) Score, Fiscal Year 2020
HPSA Score Funding received Funding not received 1 0.00% 0.00% 2 0.00% 100.00% 3 5.26% 94.74% 4 0.00% 100.00% 5 25.00% 75.00% 6 27.27% 72.75% 7 34.88% 65.12% 8 41.18% 58.82%
Letter
Page 22 GAO-21-323 National Health Service Corps
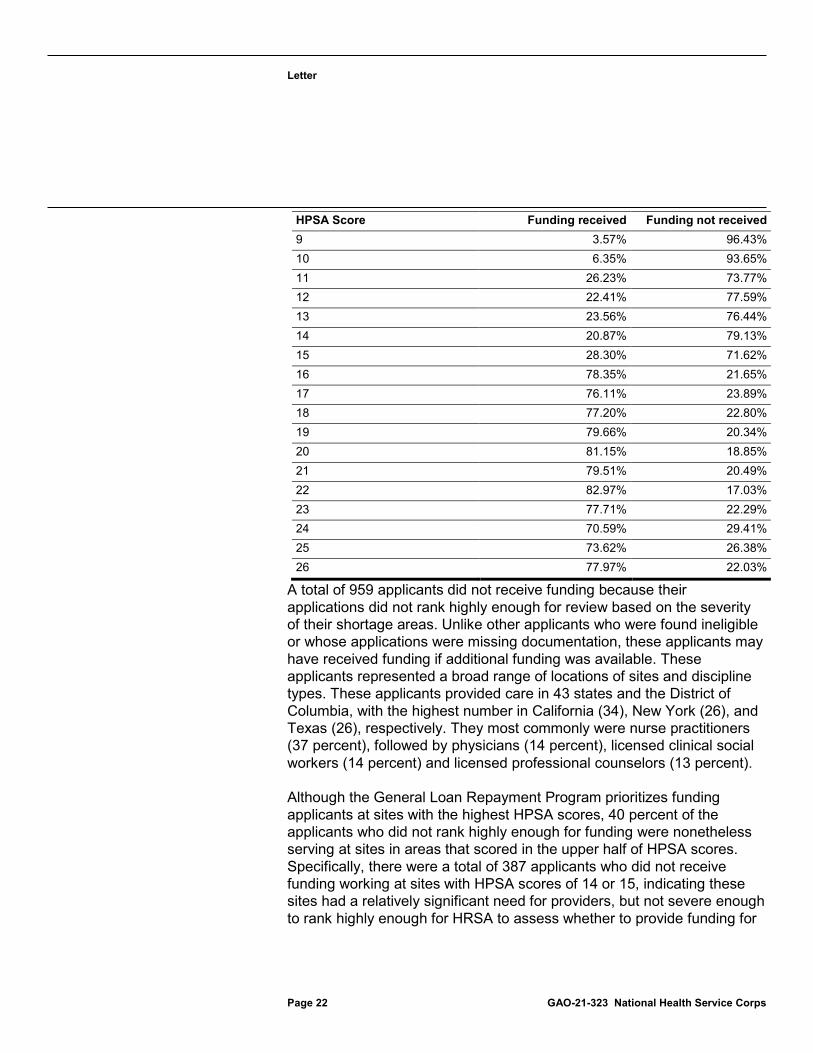
HPSA Score Funding received Funding not received 9 3.57% 96.43% 10 6.35% 93.65% 11 26.23% 73.77% 12 22.41% 77.59% 13 23.56% 76.44% 14 20.87% 79.13% 15 28.30% 71.62% 16 78.35% 21.65% 17 76.11% 23.89% 18 77.20% 22.80% 19 79.66% 20.34% 20 81.15% 18.85% 21 79.51% 20.49% 22 82.97% 17.03% 23 77.71% 22.29% 24 70.59% 29.41% 25 73.62% 26.38% 26 77.97% 22.03%
A total of 959 applicants did not receive funding because their applications did not rank highly enough for review based on the severity of their shortage areas. Unlike other applicants who were found ineligible or whose applications were missing documentation, these applicants may have received funding if additional funding was available. These applicants represented a broad range of locations of sites and discipline types. These applicants provided care in 43 states and the District of Columbia, with the highest number in California (34), New York (26), and Texas (26), respectively. They most commonly were nurse practitioners (37 percent), followed by physicians (14 percent), licensed clinical social workers (14 percent) and licensed professional counselors (13 percent).
Although the General Loan Repayment Program prioritizes funding applicants at sites with the highest HPSA scores, 40 percent of the applicants who did not rank highly enough for funding were nonetheless serving at sites in areas that scored in the upper half of HPSA scores. Specifically, there were a total of 387 applicants who did not receive funding working at sites with HPSA scores of 14 or 15, indicating these sites had a relatively significant need for providers, but not severe enough to rank highly enough for HRSA to assess whether to provide funding for
Letter
Page 23 GAO-21-323 National Health Service Corps
these applicants.22 Due to the relatively high HPSA scores of these sites, these applications would likely be the next to receive reviews by HRSA for eligibility if there was additional NHSC funding available, according to HRSA’s guidance for prioritizing applications. (See fig. 7 for the location of these applicants’ sites in fiscal year 2020.)
22As noted, HRSA awards the full loan repayment amount of $50,000 for full-time NHSC providers at sites with a HPSA score of 14 or higher, representing the upper half of possible scores, and it awards lesser amounts to providers at sites with a lower HPSA score.
Letter
Page 24 GAO-21-323 National Health Service Corps
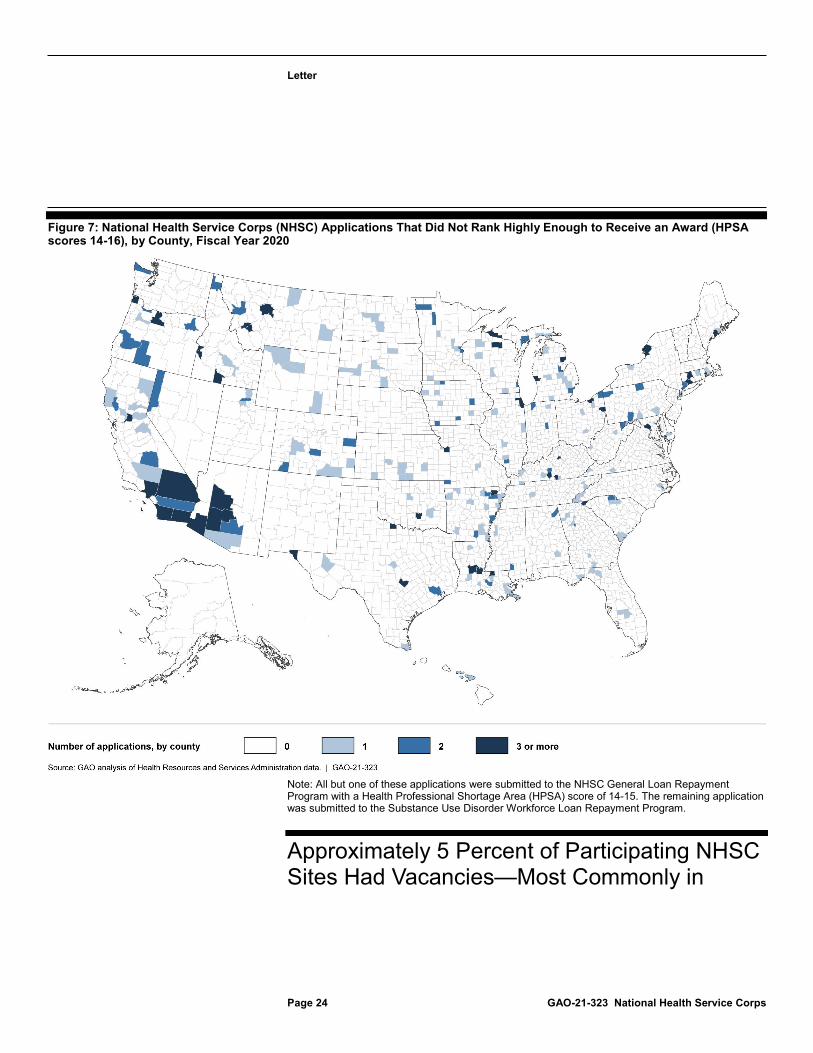
Figure 7: National Health Service Corps (NHSC) Applications That Did Not Rank Highly Enough to Receive an Award (HPSA scores 14-16), by County, Fiscal Year 2020
Note: All but one of these applications were submitted to the NHSC General Loan Repayment Program with a Health Professional Shortage Area (HPSA) score of 14-15. The remaining application was submitted to the Substance Use Disorder Workforce Loan Repayment Program.
Approximately 5 Percent of Participating NHSC Sites Had Vacancies—Most Commonly in
Letter
Page 25 GAO-21-323 National Health Service Corps
Federally Qualified Health Centers and for Primary Care Physicians Of the 18,747 sites participating in NHSC, 926 sites (5 percent) had a total of 1,482 provider vacancies as of October 15, 2020.23 Of the sites with vacancies,
· 65 percent occurred at a federally qualified health center; · 40 percent were rural, a similar proportion to participating NHSC sites
overall that are rural; and · 66 percent had one vacancy (the highest number of vacancies at a
site was 11, at two sites).
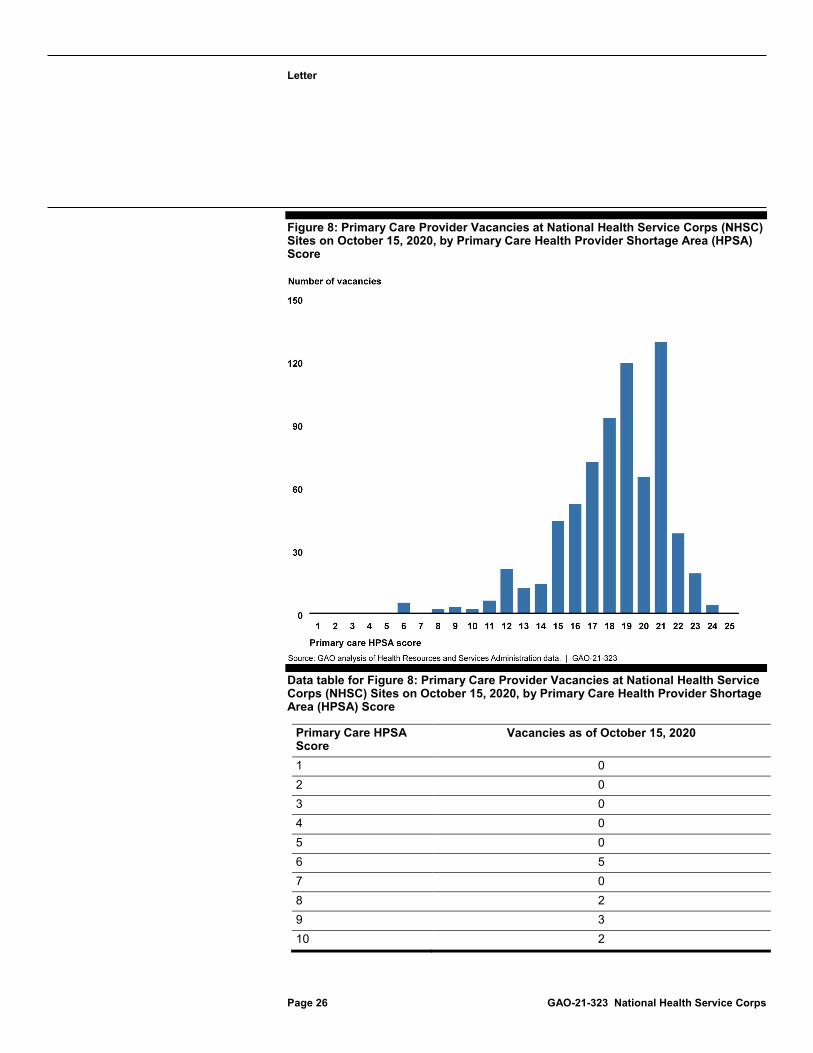
Although sites with vacancies had a wide range of HPSA scores, the largest proportion of vacancies were among sites with the highest HPSA scores. Overall, most vacancies were at sites with a HPSA score from 16 to 21 and vacancies were most commonly for primary care providers, similar to our data analysis of sites with NHSC providers. (See fig. 8.) Primary care providers were the most common type of providers in both the vacancy and provider data, and primary care provider vacancies occurred across sites with different HPSA scores.
23We assessed the vacancies listed in HRSA’s publicly available job opportunity data for the NHSC and the Nurse Corps, a program that offers loan repayment to nursing providers working in eligible nursing schools or certain shortage facilities. HRSA officials stated that the job opportunity listings are used by NHSC participating sites as a tool for connecting skilled professionals to communities in need, but these data are not directly tied to the NHSC programs. We reviewed vacancy data from July 1, 2020; August 1, 2020; and September 1, 2020. We verified that the vacancies reflected similar characteristics, including in terms of provider types, site HPSA scores, and locations.
Letter
Page 26 GAO-21-323 National Health Service Corps
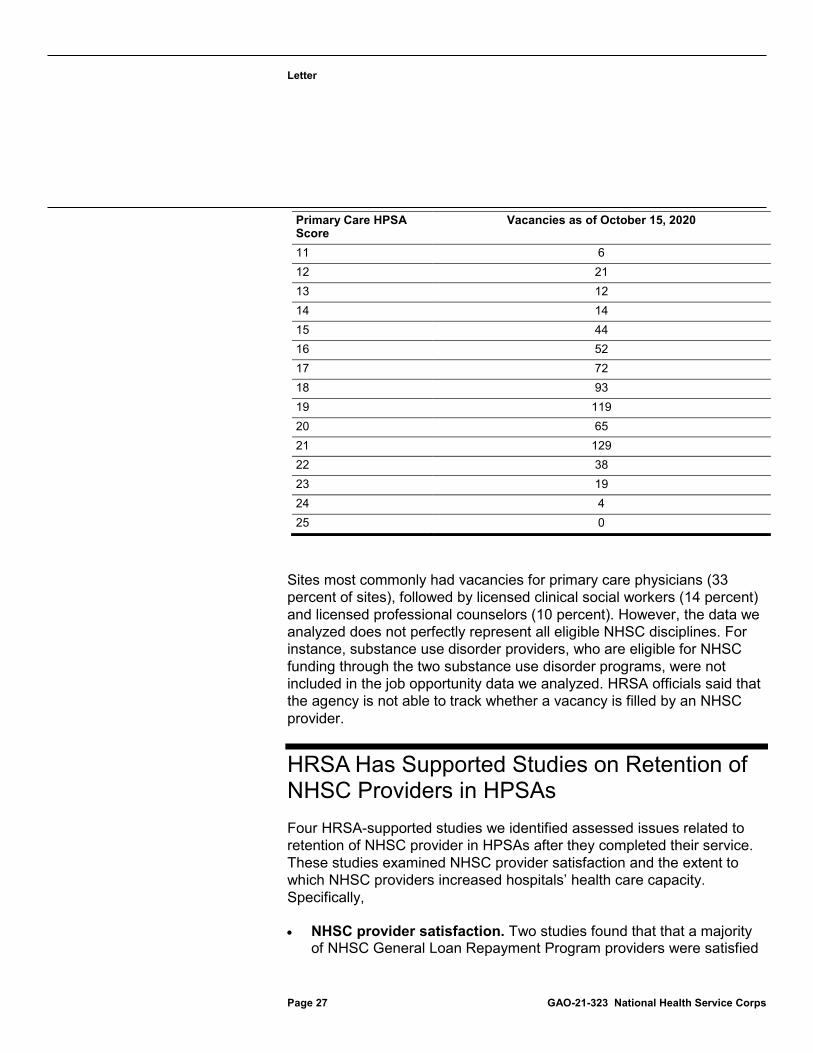
Figure 8: Primary Care Provider Vacancies at National Health Service Corps (NHSC) Sites on October 15, 2020, by Primary Care Health Provider Shortage Area (HPSA) Score
Data table for Figure 8: Primary Care Provider Vacancies at National Health Service Corps (NHSC) Sites on October 15, 2020, by Primary Care Health Provider Shortage Area (HPSA) Score
Primary Care HPSA Score
Vacancies as of October 15, 2020
1 0 2 0 3 0 4 0 5 0 6 5 7 0 8 2 9 3 10 2
Letter
Page 27 GAO-21-323 National Health Service Corps
Primary Care HPSA Score
Vacancies as of October 15, 2020
11 6 12 21 13 12 14 14 15 44 16 52 17 72 18 93 19 119 20 65 21 129 22 38 23 19 24 4 25 0
Sites most commonly had vacancies for primary care physicians (33 percent of sites), followed by licensed clinical social workers (14 percent) and licensed professional counselors (10 percent). However, the data we analyzed does not perfectly represent all eligible NHSC disciplines. For instance, substance use disorder providers, who are eligible for NHSC funding through the two substance use disorder programs, were not included in the job opportunity data we analyzed. HRSA officials said that the agency is not able to track whether a vacancy is filled by an NHSC provider.
HRSA Has Supported Studies on Retention of NHSC Providers in HPSAs Four HRSA-supported studies we identified assessed issues related to retention of NHSC provider in HPSAs after they completed their service. These studies examined NHSC provider satisfaction and the extent to which NHSC providers increased hospitals’ health care capacity. Specifically,
· NHSC provider satisfaction. Two studies found that that a majority of NHSC General Loan Repayment Program providers were satisfied
Letter
Page 28 GAO-21-323 National Health Service Corps
with their work. For example, about three-quarters of nurse practitioners and physician assistants surveyed in 2011 were satisfied with the mission and goals of their practice and support from their colleagues.24 Almost all respondents reported feeling like they were doing important work in their practice. Similarly, 81 percent of providers who completed their service in July 2015 through December 2016 expressed overall satisfaction with their work and practices while serving in the NHSC.25 The authors speculate that this satisfaction contributed to NHSC providers continuing to work in HPSAs after they completed their obligated service.
· NHSC providers increased community health centers’ health care capacity. Two studies found that NHSC providers helped alleviate shortages in mental health professional shortage areas by attracting other staff and increasing capacity for mental health care, particularly in rural areas.26 The authors conclude that NHSC programs have been effective in increasing capacity in community health centers and underserved areas. From 2013 to 2016, researchers associated every four NHSC mental health care providers working at a community health center with an increase of about three non-NHSC mental health care providers at the same location. The authors attributed some of this increase to NHSC providers who continued to work at the community health center after completing their service. Similarly, researchers found that each additional NHSC mental health care provider practicing at rural community health centers resulted in 1,037 more visits for depression and 1,005 more visits for anxiety annually from 2013 to 2017. These rural NHSC providers increased mental health care capacity at these sites by roughly twice as much as non-NHSC providers in rural areas or NHSC providers in urban areas. The authors attribute this difference to a higher need for NHSC providers in rural areas to address staffing gaps than in urban areas, and they also attribute this to requirements that NHSC providers spend 80 percent of their time in clinical tasks
24See D. E. Pathman et al., “Physician assistants and nurse practitioners in the National Health Service Corps,” Journal of the American Academy of Physician Assistants, vol. 27, no. 12 (2014): p. 35. 25See D. E. Pathman et al., “Satisfaction of the Primary Care, Mental Health, and Dental Health Clinicians of the National Health Service Corps Loan Repayment Program,” Journal of Health Care for the Poor and Underserved, vol. 30, no. 3 (2019): p. 1197. 26See X. Han et al., “The Role of the National Health Service Corps Clinicians in Enhancing Staffing and Patient Care Capacity in Community Health Centers,” Medical Care, vol. 57, no. 12 (2019): p. 1002; and X. Han and L. Ku, “Enhancing Staffing In Rural Community Health Centers Can Help Improve Behavioral Health Care,” Health Affairs, vol. 38, no. 12 (2019): p. 2061.
Letter
Page 29 GAO-21-323 National Health Service Corps
and direct patient care.
HRSA has reported high NHSC provider retention in HPSAs after they complete their service and funded an evaluation of the effectiveness of NHSC programs at alleviating provider shortages. Of 19,085 providers who completed their service between 2012 and 2019, 80 percent still worked in a HPSA as of October 2020. HRSA officials also said that that the agency has ongoing efforts to determine if applicants who received NHSC funding are more likely to continue to practice in HPSAs than applicants who did not receive funding, which may indicate the effect of receiving NHSC funding on providers’ choice of practice location. Officials estimated that results from this analysis will be available in fiscal year 2022 or later.
Agency Comments We provided a draft of this report to the Department of Health and Human Services for review and comment. The department provided technical comments, which we incorporated as appropriate.
As agreed with your offices, unless you publicly announce the contents of this report earlier, we plan no further distribution until 30 days from the report date. At that time, we will send copies of this report to the Secretary of Health and Human Services, appropriate congressional committees, and other interested parties. In addition, the report will be available at no charge on the GAO Web site at http://www.gao.gov.
If you or your staff have any questions about this report, please contact me at (202) 512-7114 or [email protected]. Contact points for our Offices of Congressional Relations and Public Affairs are on the last page of this report. GAO staff who made major contributions to this report are listed in appendix II.
A. Nicole Clowers Managing Director, Health Care
Appendix I: National Health Service Corps Providers in Fiscal Year 2020 and Site Vacancies as of October 15, 2020
Page 30 GAO-21-323 National Health Service Corps
Appendix I: National Health Service Corps Providers in Fiscal Year 2020 and Site Vacancies as of October 15, 2020
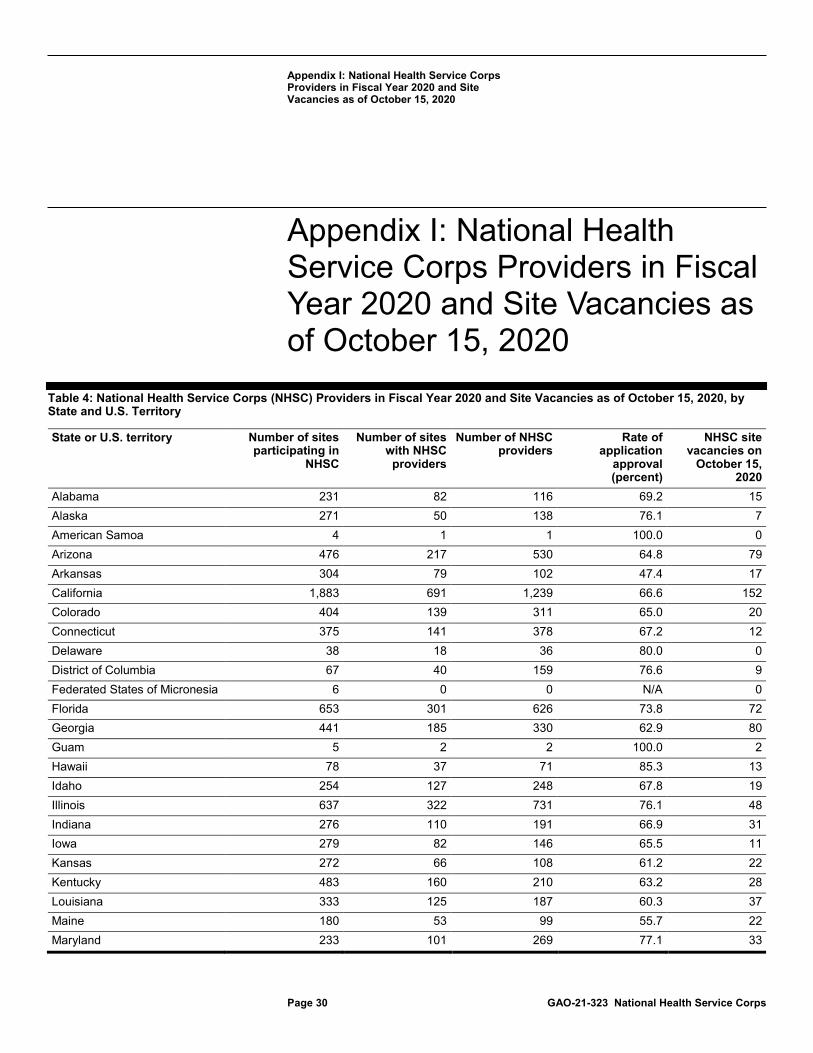
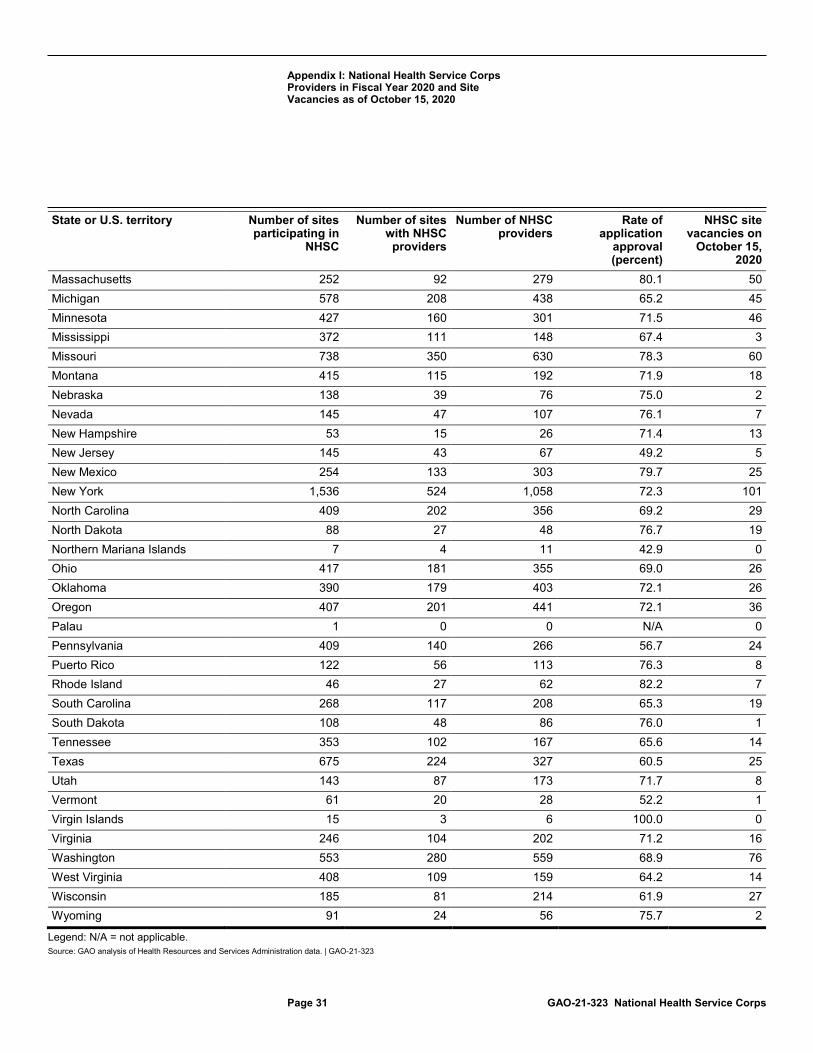
Table 4: National Health Service Corps (NHSC) Providers in Fiscal Year 2020 and Site Vacancies as of October 15, 2020, by State and U.S. Territory
State or U.S. territory Number of sites participating in
NHSC
Number of sites with NHSC
providers
Number of NHSC providers
Rate of application
approval (percent)
NHSC site vacancies on
October 15, 2020
Alabama 231 82 116 69.2 15 Alaska 271 50 138 76.1 7 American Samoa 4 1 1 100.0 0 Arizona 476 217 530 64.8 79 Arkansas 304 79 102 47.4 17 California 1,883 691 1,239 66.6 152 Colorado 404 139 311 65.0 20 Connecticut 375 141 378 67.2 12 Delaware 38 18 36 80.0 0 District of Columbia 67 40 159 76.6 9 Federated States of Micronesia 6 0 0 N/A 0 Florida 653 301 626 73.8 72 Georgia 441 185 330 62.9 80 Guam 5 2 2 100.0 2 Hawaii 78 37 71 85.3 13 Idaho 254 127 248 67.8 19 Illinois 637 322 731 76.1 48 Indiana 276 110 191 66.9 31 Iowa 279 82 146 65.5 11 Kansas 272 66 108 61.2 22 Kentucky 483 160 210 63.2 28 Louisiana 333 125 187 60.3 37 Maine 180 53 99 55.7 22 Maryland 233 101 269 77.1 33
Appendix I: National Health Service Corps Providers in Fiscal Year 2020 and Site Vacancies as of October 15, 2020
Page 31 GAO-21-323 National Health Service Corps
State or U.S. territory Number of sites participating in
NHSC
Number of sites with NHSC
providers
Number of NHSC providers
Rate of application
approval (percent)
NHSC site vacancies on
October 15, 2020
Massachusetts 252 92 279 80.1 50 Michigan 578 208 438 65.2 45 Minnesota 427 160 301 71.5 46 Mississippi 372 111 148 67.4 3 Missouri 738 350 630 78.3 60 Montana 415 115 192 71.9 18 Nebraska 138 39 76 75.0 2 Nevada 145 47 107 76.1 7 New Hampshire 53 15 26 71.4 13 New Jersey 145 43 67 49.2 5 New Mexico 254 133 303 79.7 25 New York 1,536 524 1,058 72.3 101 North Carolina 409 202 356 69.2 29 North Dakota 88 27 48 76.7 19 Northern Mariana Islands 7 4 11 42.9 0 Ohio 417 181 355 69.0 26 Oklahoma 390 179 403 72.1 26 Oregon 407 201 441 72.1 36 Palau 1 0 0 N/A 0 Pennsylvania 409 140 266 56.7 24 Puerto Rico 122 56 113 76.3 8 Rhode Island 46 27 62 82.2 7 South Carolina 268 117 208 65.3 19 South Dakota 108 48 86 76.0 1 Tennessee 353 102 167 65.6 14 Texas 675 224 327 60.5 25 Utah 143 87 173 71.7 8 Vermont 61 20 28 52.2 1 Virgin Islands 15 3 6 100.0 0 Virginia 246 104 202 71.2 16 Washington 553 280 559 68.9 76 West Virginia 408 109 159 64.2 14 Wisconsin 185 81 214 61.9 27 Wyoming 91 24 56 75.7 2
Legend: N/A = not applicable. Source: GAO analysis of Health Resources and Services Administration data. | GAO-21-323
Appendix II: GAO Contact and Staff Acknowledgments
Page 32 GAO-21-323 National Health Service Corps
Appendix II: GAO Contact and Staff Acknowledgments
GAO Contact A. Nicole Clowers, (202) 512-7114 or [email protected]
Staff Acknowledgments In addition to the contact named above, James Cosgrove (Director), William Hadley (Assistant Director), A. Elizabeth Dobrenz, and Caroline Hale made key contributions to this report. Also contributing were Sarah Gilliland, Giselle Hicks, Ethiene Salgado-Rodriguez, Caitlin Scoville, Yesook Merrill, and Jennifer Whitworth.
(104175)
GAO’s Mission The Government Accountability Office, the audit, evaluation, and investigative arm of Congress, exists to support Congress in meeting its constitutional responsibilities and to help improve the performance and accountability of the federal government for the American people. GAO examines the use of public funds; evaluates federal programs and policies; and provides analyses, recommendations, and other assistance to help Congress make informed oversight, policy, and funding decisions. GAO’s commitment to good government is reflected in its core values of accountability, integrity, and reliability.
Obtaining Copies of GAO Reports and Testimony The fastest and easiest way to obtain copies of GAO documents at no cost is through our website. Each weekday afternoon, GAO posts on its website newly released reports, testimony, and correspondence. You can also subscribe to GAO’s email updates to receive notification of newly posted products.
Order by Phone
The price of each GAO publication reflects GAO’s actual cost of production and distribution and depends on the number of pages in the publication and whether the publication is printed in color or black and white. Pricing and ordering information is posted on GAO’s website, https://www.gao.gov/ordering.htm.
Place orders by calling (202) 512-6000, toll free (866) 801-7077, or TDD (202) 512-2537.
Orders may be paid for using American Express, Discover Card, MasterCard, Visa, check, or money order. Call for additional information.
Connect with GAO Connect with GAO on Facebook, Flickr, Twitter, and YouTube. Subscribe to our RSS Feeds or Email Updates. Listen to our Podcasts. Visit GAO on the web at https://www.gao.gov.
To Report Fraud, Waste, and Abuse in Federal Programs Contact FraudNet:
Website: https://www.gao.gov/fraudnet/fraudnet.htm
Automated answering system: (800) 424-5454 or (202) 512-7700
Congressional Relations Orice Williams Brown, Managing Director, [email protected], (202) 512-4400, U.S. Government Accountability Office, 441 G Street NW, Room 7125, Washington, DC 20548
Public Affairs Chuck Young, Managing Director, [email protected], (202) 512-4800 U.S. Government Accountability Office, 441 G Street NW, Room 7149 Washington, DC 20548
Strategic Planning and External Liaison Stephen J. Sanford, Acting Managing Director, [email protected], (202) 512-4707 U.S. Government Accountability Office, 441 G Street NW, Room 7814, Washington, DC 20548