Embed Size (px)
Citation preview

Page 1 GAO-20-700R 2019 Market Facilitation Program
441 G St. N.W. Washington, DC 20548
Accessible Version
August 21, 2020
The Honorable Debbie Stabenow Ranking Member Committee on Agriculture, Nutrition, and Forestry United States Senate
USDA Market Facilitation Program: Information on Payments for 2019
Dear Senator Stabenow:
In May 2019, the U.S. Department of Agriculture (USDA) announced its plans to assist farmers directly affected by trade disruptions and tariffs targeting a variety of U.S. agricultural products. USDA announced it would distribute up to $14.5 billion in direct payments to farming operations that produced three types of commodities in 2019: (1) nonspecialty crops (including grains and oilseeds, such as corn and soybeans); (2) specialty crops (including nuts and fruits, such as pecans and cranberries); and (3) dairy and hogs.
The 2019 payments were in addition to the approximately $8.6 billion USDA announced it had distributed for 2018. USDA’s Farm Service Agency (FSA) administered these 2018 and 2019 payments, which USDA refers to as the Market Facilitation Program (MFP). In comparison with 2018, in 2019, USDA changed the payment structure for the three types of commodities, including by establishing county-specific payment rates for nonspecialty crops and increasing the payment limit—the cap on payments members of farming operations can receive—from $125,000 to $250,000 for each type, not to exceed $500,000 per person or legal entity.1
To receive the 2019 MFP payments, individuals and legal entities that are members of farming operations had to meet certain eligibility requirements. For example, individuals—including members of legal entities—who received payments for most types of nonspecialty crops, had to have been determined to be actively engaged in farming.2 USDA also issues projections each month that forecast the market price of various agricultural commodities, including eight commodities that were eligible for 2019 MFP payments.
You requested that we review the distribution of MFP payments for 2019. This report examines: (1) MFP payment rates for selected commodities and USDA’s price projections for these commodities in 2019; (2) MFP payments for 2019 and how the payments varied by location, farming operation, and type of commodity; and (3) additional MFP payments for 2019 compared
1A farming operation is a business enterprise engaged in the production of agricultural products, commodities, or livestock that is operated by an individual, legal entity (e.g., limited liability company), or joint operation (e.g., a general partnership). A member of a farming operation can be either an individual or an entity. 2Specifically, an individual or entity must provide the farming operation with a significant contribution of capital, land, or equipment, as well as a significant contribution of personal labor or active personal management. Those contributions must be in proportion to the share of the operation’s profits and losses, and the contributions must be at risk.

Page 2 GAO-20-700R 2019 Market Facilitation Program
with 2018 that resulted from increased payment limits. On May 28, 2020, we briefed members of your staff on the results of our review. This report formally transmits the briefing slides (see enc. 1).
To provide information on MFP payment rates for selected commodities in 2019, we relied on data from FSA. To provide information on USDA’s price projections for these selected commodities, we relied on USDA’s World Agricultural Supply and Demand Estimates (WASDE) data from May 2019. Specifically, we obtained information on the eight major commodities for which WASDE had price projections.3 We calculated MFP payment rates in 2019 for those commodities as a percentage of the WASDE price projections. We assessed the reliability of USDA’s data, including by reviewing related documentation and internal controls. We determined that the data were sufficiently reliable for the purposes of this report.
To determine the total MFP payments for 2019 and how these payments varied by location, farming operation, and type of commodities, we analyzed FSA data on 2019 MFP payments.4 FSA distributed MFP payments for 2019 in three installments, the last of which it distributed in February 2020.5
We assessed the reliability of FSA’s data by, among other steps, (1) reviewing information about the data and the system that produced them and (2) interviewing agency officials knowledgeable about the data. We determined that the data were sufficiently reliable for the purposes of this report.
We selected the 25 farming operations that received the highest 2019 MFP payments for additional review.6 We obtained information on the number of members who contributed active personal management or labor from the 13 FSA state offices responsible for administering payment eligibility requirements for these farming operations. We also obtained information from FSA state officials on the primary (i.e., those with the highest number of acres) nonspecialty crops that these operations produced.7 To assess the accuracy of the information on the number of managers at these operations—individuals who claimed active personal management or a combination of active personal management and labor—that we obtained from FSA state offices, we compared this information with our analysis of FSA data on farming operations. To assess the accuracy of the FSA information on the primary crops that the farming operations produced, we compared this information with publicly available information and found it to be consistent with that information.
To determine the additional MFP payments that FSA distributed for 2019 because of the increased payment limits, we analyzed FSA data to identify payments for 2019 above the
3USDA issues the WASDE monthly reports on certain grains and oilseeds as well as cotton, sugar, meat, poultry, eggs, and milk. We used the WASDE price projections of May 10, 2019, for eight commodities that were eligible for 2019 MFP payments: corn, cotton, dairy (milk), hogs, rice, sorghum, soybeans, and wheat. 4We excluded payments made to Indian tribes from our analysis because, according to an FSA handbook, such payments are not subject to payment limits. Because we did not include payments to Indian tribes, our totals may be lower than other publicly reported figures. 5The data we reviewed were from March 2020, the latest available at the time of our review. 6The results of this review are not generalizable to other farming operations that received MFP payments for 2019. 7Eligible nonspecialty crops for 2019 MFP include alfalfa hay, barley, canola, corn, crambe, dried beans, dry peas, extra-long staple cotton, flaxseed, lentils, long- and medium-grain rice, millet, mustard seed, oats, peanuts, rapeseed, rye, safflower, sesame seed, small and large chickpeas, sorghum, soybeans, sunflower seed, temperate japonica rice, triticale, upland cotton, and wheat.
Page 3 GAO-20-700R 2019 Market Facilitation Program
payment limits for the 2018 MFP. The additional payments were the sum of those that individuals received above the 2018 limit for each commodity type.
We conducted this performance audit from March 2020 to August 2020 in accordance with generally accepted government auditing standards. Those standards require that we plan and perform the audit to obtain sufficient, appropriate evidence to provide a reasonable basis for our findings and conclusions based on our audit objectives. We believe that the evidence obtained provides a reasonable basis for our findings and conclusions based on our audit objectives.
In summary, we found that MFP payment rates for the eight selected commodities in 2019 varied as a percentage of the projected prices of these commodities, ranging from a high of 56.3 percent (sorghum) to a low of 1.1 percent (dairy). MFP payments for 2019 were about $14.4 billion, and payments varied by location, farming operation, and type of commodity. Moreover, USDA distributed approximately $519 million in additional MFP payments for 2019 compared with 2018 because of increased payment limits.
Background
USDA categorized the 2019 MFP payments by three commodity types and calculated payment rates for each type differently.
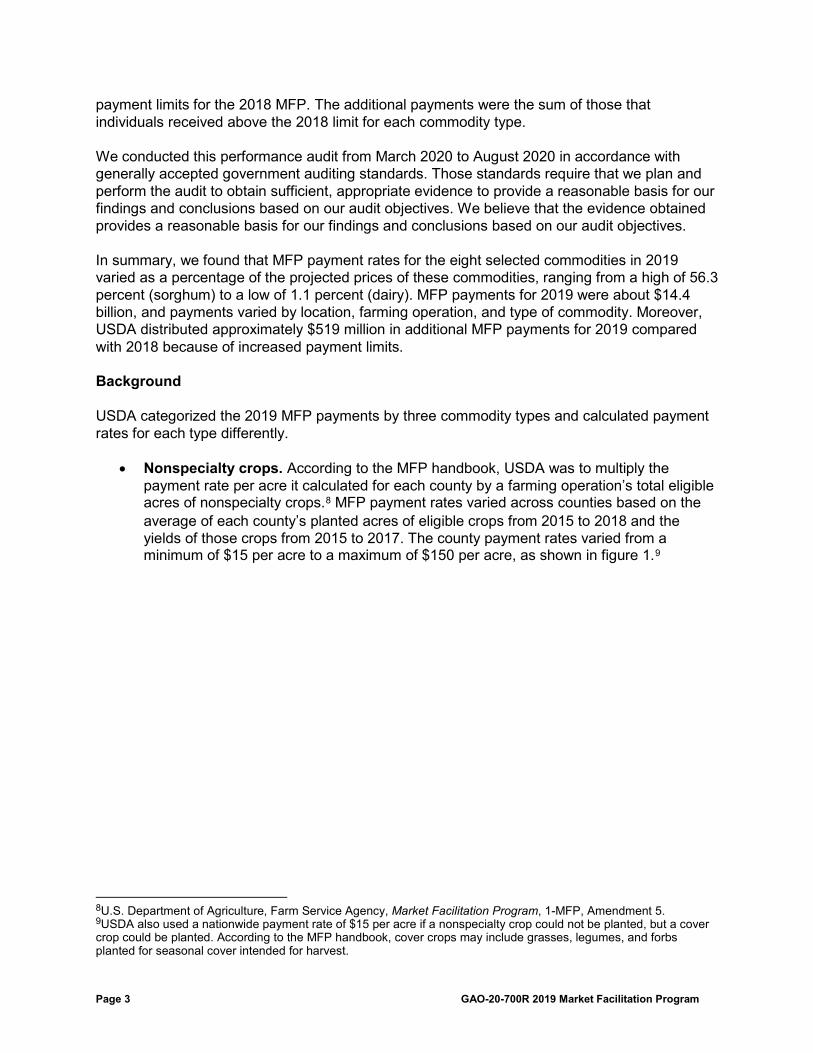
• Nonspecialty crops. According to the MFP handbook, USDA was to multiply the payment rate per acre it calculated for each county by a farming operation’s total eligible acres of nonspecialty crops.8 MFP payment rates varied across counties based on the average of each county’s planted acres of eligible crops from 2015 to 2018 and the yields of those crops from 2015 to 2017. The county payment rates varied from a minimum of $15 per acre to a maximum of $150 per acre, as shown in figure 1.9
8U.S. Department of Agriculture, Farm Service Agency, Market Facilitation Program, 1-MFP, Amendment 5. 9USDA also used a nationwide payment rate of $15 per acre if a nonspecialty crop could not be planted, but a cover crop could be planted. According to the MFP handbook, cover crops may include grasses, legumes, and forbs planted for seasonal cover intended for harvest.
Page 4 GAO-20-700R 2019 Market Facilitation Program
Figure 1: MFP Payment Rates in 2019 for Nonspecialty Crops, by County
• Specialty crops. USDA used a national payment rate per acre for each type of eligible specialty crop. Eligible specialty crops for 2019 include almonds, cranberries, cultivated ginseng, fresh grapes, fresh sweet cherries, hazelnuts, macadamia nuts, pecans, pistachios, and walnuts. The payment rates varied from $146 to about $1,500 per acre depending on the type of crop.
• Dairy and hogs. USDA used a national payment rate for milk ($0.20 per hundred pounds) and hogs ($11 per head).
Agency Comments
We provided a draft of this report to USDA for comment. USDA provided technical comments, which we incorporated as appropriate.
As agreed with your office, unless you publicly announce the contents of this report earlier, we plan no further distribution until 30 days from the report date. At that time, we will send copies of this report to the appropriate congressional committees, the Secretary of Agriculture, and other interested parties. In addition, the report is available at no charge on the GAO website at http://www.gao.gov.

Page 5 GAO-20-700R 2019 Market Facilitation Program
If you or your staff have any questions about this report, please contact me at (202) 512-3841 or [email protected]. Contact points for our Offices of Congressional Relations and Public Affairs may be found on the last page of this report. GAO staff who made key contributions to this report include Thomas M. Cook (Assistant Director), Ruth Solomon (Analyst in Charge), Sahar Angadjivand, Josey Ballenger, Meghan Kubit, Donna Morgan, Cynthia Norris, Kevin S. Bray, John Mingus, and Sara Sullivan.
Sincerely yours,
Steve D. Morris Director, Natural Resources and Environment Enclosure(s) – 1
Page 6 GAO-20-700R 2019 Market Facilitation Program
Enclosure I: Briefing to Senate Committee on Agriculture, Nutrition, and Forestry, May 28, 2020
USDA Market Facilitation Program: Information on Payments for 2019
Briefing to Senate Committee on Agriculture, Nutrition, and Forestry
May 28, 2020
Page 7 GAO-20-700R 2019 Market Facilitation Program
MFP Payment Rates and USDA’s Price Projections in 2019
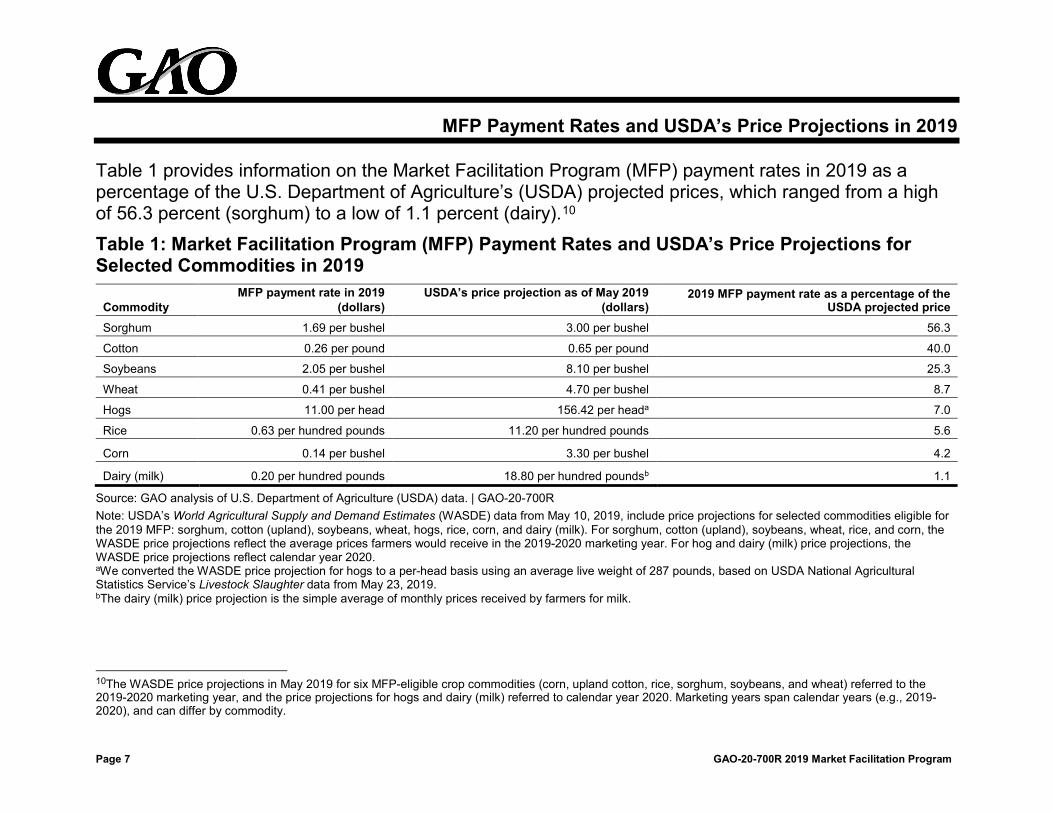
Table 1 provides information on the Market Facilitation Program (MFP) payment rates in 2019 as a percentage of the U.S. Department of Agriculture’s (USDA) projected prices, which ranged from a high of 56.3 percent (sorghum) to a low of 1.1 percent (dairy).10 Table 1: Market Facilitation Program (MFP) Payment Rates and USDA’s Price Projections for Selected Commodities in 2019
Commodity MFP payment rate in 2019
(dollars) USDA’s price projection as of May 2019
(dollars) 2019 MFP payment rate as a percentage of the
USDA projected price Sorghum 1.69 per bushel 3.00 per bushel 56.3
Cotton 0.26 per pound 0.65 per pound 40.0
Soybeans 2.05 per bushel 8.10 per bushel 25.3
Wheat 0.41 per bushel 4.70 per bushel 8.7
Hogs 11.00 per head 156.42 per heada 7.0
Rice 0.63 per hundred pounds 11.20 per hundred pounds 5.6
Corn 0.14 per bushel 3.30 per bushel 4.2
Dairy (milk) 0.20 per hundred pounds 18.80 per hundred poundsb 1.1
Source: GAO analysis of U.S. Department of Agriculture (USDA) data. | GAO-20-700R Note: USDA’s World Agricultural Supply and Demand Estimates (WASDE) data from May 10, 2019, include price projections for selected commodities eligible for the 2019 MFP: sorghum, cotton (upland), soybeans, wheat, hogs, rice, corn, and dairy (milk). For sorghum, cotton (upland), soybeans, wheat, rice, and corn, the WASDE price projections reflect the average prices farmers would receive in the 2019-2020 marketing year. For hog and dairy (milk) price projections, the WASDE price projections reflect calendar year 2020. aWe converted the WASDE price projection for hogs to a per-head basis using an average live weight of 287 pounds, based on USDA National Agricultural Statistics Service’s Livestock Slaughter data from May 23, 2019. bThe dairy (milk) price projection is the simple average of monthly prices received by farmers for milk.
10The WASDE price projections in May 2019 for six MFP-eligible crop commodities (corn, upland cotton, rice, sorghum, soybeans, and wheat) referred to the 2019-2020 marketing year, and the price projections for hogs and dairy (milk) referred to calendar year 2020. Marketing years span calendar years (e.g., 2019-2020), and can differ by commodity.

Page 8 GAO-20-700R 2019 Market Facilitation Program
MFP Payments Were about $14.4 Billion for 2019
For 2019, USDA’s Farm Service Agency (FSA) distributed about $14.4 billion in MFP payments in all 50 states and Puerto Rico to 643,965 farming operations comprised of 870,427 individual members. As shown in table 2, average payments by state per individual ranged from a high of about $42,500 in Georgia to less than $2,000 in Rhode Island. Table 2: 2019 Market Facilitation Program (MFP) Payments by State and Number of Farming Operations and Individuals Receiving Payments
Statea
MFP payments Farming operations Individuals Average payment per
farming operation (dollars)
Average payment per
individual (dollars) Dollars Percentage Number Percentage Number Percentage
Georgia 310,832,608 2.2 5,479 0.9 7,306 0.8 56,732 42,545 Mississippi 323,593,329 2.3 4,690 0.7 9,107 1.0 68,996 35,532 North Dakota 693,157,967 4.8 18,953 2.9 21,750 2.5 36,572 31,869 Arizona 49,709,777 0.3 596 0.1 1,586 0.2 83,406 31,343 South Carolina 60,098,839 0.4 1,796 0.3 2,287 0.3 33,463 26,278 Alabama 121,995,760 0.8 3,399 0.5 4,682 0.5 35,892 26,056 Florida 24,095,215 0.2 718 0.1 986 0.1 33,559 24,437 Minnesota 1,066,556,872 7.4 36,532 5.7 43,883 5.0 29,195 24,305 North Carolina 194,690,509 1.4 7,269 1.1 9,026 1.0 26,784 21,570 Texas 1,075,174,517 7.5 36,639 5.7 51,117 5.9 29,345 21,034 Iowa 1,581,719,579 11.0 61,433 9.5 79,464 9.1 25,747 19,905 Arkansas 441,658,607 3.1 12,975 2.0 22,820 2.6 34,039 19,354 New Mexico 36,940,198 0.3 1,255 0.2 2,002 0.2 29,434 18,452 Virginia 72,526,934 0.5 2,956 0.5 4,037 0.5 24,535 17,966 California 317,077,273 2.2 9,992 1.6 18,133 2.1 31,733 17,486 Nebraska 960,181,906 6.7 42,340 6.6 56,131 6.4 22,678 17,106 Tennessee 231,581,245 1.6 11,717 1.8 13,733 1.6 19,765 16,863

Page 9 GAO-20-700R 2019 Market Facilitation Program
Statea
MFP payments Farming operations Individuals Average payment per
farming operation (dollars)
Average payment per
individual (dollars) Dollars Percentage Number Percentage Number Percentage
Louisiana 162,263,358 1.1 6,717 1.0 9,957 1.1 24,157 16,296 Delaware 18,152,902 0.1 726 0.1 1,124 0.1 25,004 16,150 South Dakota 523,467,014 3.6 20,991 3.3 32,433 3.7 24,938 16,140 Indiana 725,298,539 5.0 34,660 5.4 45,050 5.2 20,926 16,100 Michigan 260,601,255 1.8 13,844 2.1 16,959 1.9 18,824 15,367 Maryland 55,536,024 0.4 2,607 0.4 3,656 0.4 21,303 15,190 Missouri 632,689,068 4.4 31,901 5.0 42,055 4.8 19,833 15,044 Illinois 1,452,547,648 10.1 76,129 11.8 98,380 11.3 19,080 14,765 Ohio 523,892,947 3.6 29,513 4.6 37,350 4.3 17,751 14,027 Kentucky 229,938,635 1.6 14,407 2.2 16,992 2.0 15,960 13,532 Kansas 1,010,635,043 7.0 58,599 9.1 76,545 8.8 17,247 13,203 New Jersey 9,932,766 0.1 609 0.1 825 0.1 16,310 12,040 Wisconsin 347,868,224 2.4 23,259 3.6 29,409 3.4 14,956 11,829 Oklahoma 206,404,611 1.4 16,662 2.6 19,971 2.3 12,388 10,335 Massachusetts 6,812,715 0.0 458 0.1 748 0.1 14,875 9,108 New York 65,399,722 0.5 4,848 0.8 7,506 0.9 13,490 8,713 Pennsylvania 79,416,392 0.6 7,009 1.1 9,169 1.1 11,331 8,661 Colorado 105,337,276 0.7 8,212 1.3 12,190 1.4 12,827 8,641 Idaho 74,319,215 0.5 5,851 0.9 9,240 1.1 12,702 8,043 Oregon 42,475,903 0.3 3,782 0.6 6,365 0.7 11,231 6,673 Washington 107,378,042 0.7 8,460 1.3 16,705 1.9 12,692 6,428 Montana 128,406,508 0.9 9,958 1.5 20,440 2.3 12,895 6,282 West Virginia 3,520,806 0.0 435 0.1 567 0.1 8,094 6,210 Nevada 4,120,435 0.0 380 0.1 665 0.1 10,843 6,196 Vermont 6,049,146 0.0 644 0.1 1,064 0.1 9,393 5,685 Hawaii 179,349 0.0 29 0.0 36 0.0 6,184 4,982

Page 10 GAO-20-700R 2019 Market Facilitation Program
Statea
MFP payments Farming operations Individuals Average payment per
farming operation (dollars)
Average payment per
individual (dollars) Dollars Percentage Number Percentage Number Percentage
Alaska 95,278 0.0 12 0.0 21 0.0 7,940 4,537 Puerto Rico 1,343,339 0.0 248 0.0 331 0.0 5,417 4,058 Connecticut 1,072,357 0.0 115 0.0 269 0.0 9,325 3,986 Utah 10,926,775 0.1 1,907 0.3 2,869 0.3 5,730 3,809 Maine 2,312,500 0.0 405 0.1 625 0.1 5,710 3,700 New Hampshire 610,166 0.0 104 0.0 190 0.0 5,867 3,211 Wyoming 7,689,807 0.1 1,704 0.3 2,599 0.3 4,513 2,959 Rhode Island 121,410 0.0 41 0.0 72 0.0 2,961 1,686
Total 14,368,406,309 100.0 643,965 100.0 870,427 100.0 22,312 16,507
Source: GAO analysis of Farm Service Agency data. | GAO-20-700R Note: Percentages may not sum to 100 because of rounding. aAlso includes Puerto Rico.

Page 11 GAO-20-700R 2019 Market Facilitation Program
Payments for nonspecialty crops accounted for about $13.5 billion or about 94 percent of total MFP payments for 2019. As shown in table 3, average 2019 MFP payments ranged from a high of $119 per acre in Georgia to a low of $15 per acre in Maine, Utah, Montana, Wyoming, and Alaska.11 Table 3: 2019 Market Facilitation Program (MFP) Payments for Acres of Nonspecialty Crops, by State
Statea MFP payments Acres Average MFP payment per
acre (dollars) Dollars Percentage Number Percentage
Georgia 292,934,291 2.2 2,456,729 1.0 119
Mississippi 322,415,680 2.4 2,991,630 1.3 108
Puerto Rico 22,139 0.0 218 0.0 102
Alabama 121,222,526 0.9 1,248,091 0.5 97
Arizona 43,075,521 0.3 460,654 0.2 94
Arkansas 439,660,174 3.2 5,001,091 2.1 88
Tennessee 229,971,611 1.7 2,708,883 1.1 85
Louisiana 160,880,127 1.2 1,995,006 0.8 81
Texas 1,050,030,036 7.8 13,670,948 5.7 77
Florida 21,065,088 0.2 275,141 0.1 77
Illinois 1,422,433,078 10.5 20,083,275 8.4 71
Missouri 623,615,714 4.6 8,866,470 3.7 70
Ohio 504,870,729 3.7 7,378,108 3.1 68
Indiana 705,497,094 5.2 10,415,302 4.4 68
Iowa 1,496,136,773 11.1 22,467,111 9.4 67
Kentucky 226,233,993 1.7 3,446,413 1.4 66
North Carolina 190,154,095 1.4 3,138,649 1.3 61
South Carolina 59,377,524 0.4 988,012 0.4 60
Minnesota 995,859,597 7.4 16,690,206 7.0 60
Virginia 69,967,443 0.5 1,192,519 0.5 59 11We included payments for cover crops with those for nonspecialty crops. USDA used a nationwide payment rate of $15 per acre if a nonspecialty crop could not be planted, but a cover crop was planted.

Page 12 GAO-20-700R 2019 Market Facilitation Program
Statea MFP payments Acres Average MFP payment per
acre (dollars) Dollars Percentage Number Percentage
California 95,542,599 0.7 1,664,335 0.7 57
Nebraska 943,314,968 7.0 16,919,254 7.1 56
Michigan 240,722,159 1.8 4,482,073 1.9 54
Maryland 53,977,881 0.4 1,011,197 0.4 53
Delaware 18,011,662 0.1 356,019 0.1 51
Kansas 1,001,433,931 7.4 19,890,942 8.3 50
New Jersey 8,623,235 0.1 175,716 0.1 49
South Dakota 505,028,416 3.7 10,981,989 4.6 46
West Virginia 3,348,624 0.0 76,082 0.0 44
Wisconsin 286,112,783 2.1 6,658,121 2.8 43
Pennsylvania 63,485,277 0.5 1,574,523 0.7 40
New Mexico 20,969,938 0.2 629,277 0.3 33
North Dakota 691,468,149 5.1 20,974,450 8.8 33
Oklahoma 195,737,697 1.4 5,978,036 2.5 33
New York 42,142,965 0.3 1,365,628 0.6 31
Washington 64,510,625 0.5 2,775,345 1.2 23
Colorado 98,411,437 0.7 4,532,840 1.9 22
Oregon 19,966,933 0.1 951,731 0.4 21
Idaho 54,459,817 0.4 2,721,216 1.1 20
Massachusetts 235,341 0.0 12,301 0.0 19
Rhode Island 15,022 0.0 842 0.0 18
Vermont 1,344,331 0.0 76,492 0.0 18
Nevada 2,943,191 0.0 183,834 0.1 16
Connecticut 362,685 0.0 22,808 0.0 16
New Hampshire 148,253 0.0 9,418 0.0 16
Maine 1,105,210 0.0 71,409 0.0 15
Utah 7,157,297 0.1 464,496 0.2 15

Page 13 GAO-20-700R 2019 Market Facilitation Program
Statea MFP payments Acres Average MFP payment per
acre (dollars) Dollars Percentage Number Percentage
Montana 125,117,133 0.9 8,124,958 3.4 15
Wyoming 7,449,042 0.1 496,603 0.2 15 Alaska 82,026 0.0 5,468 0.0 15 Total 13,528,651,862 100.0 238,661,858 100.0 57
Source: GAO analysis of Farm Service Agency data. | GAO-20-700R Notes: Total MFP payments and number of acres include cover crops. To calculate the number of acres, we divided the payments for each county by the applicable nonspecialty crop payment rate and summarized across each state. This may result in an undercount of the acres and an overestimate of the average MFP payment per acre in some counties. Percentages may not sum to 100 because of rounding. aAlso includes Puerto Rico.
Page 14 GAO-20-700R 2019 Market Facilitation Program
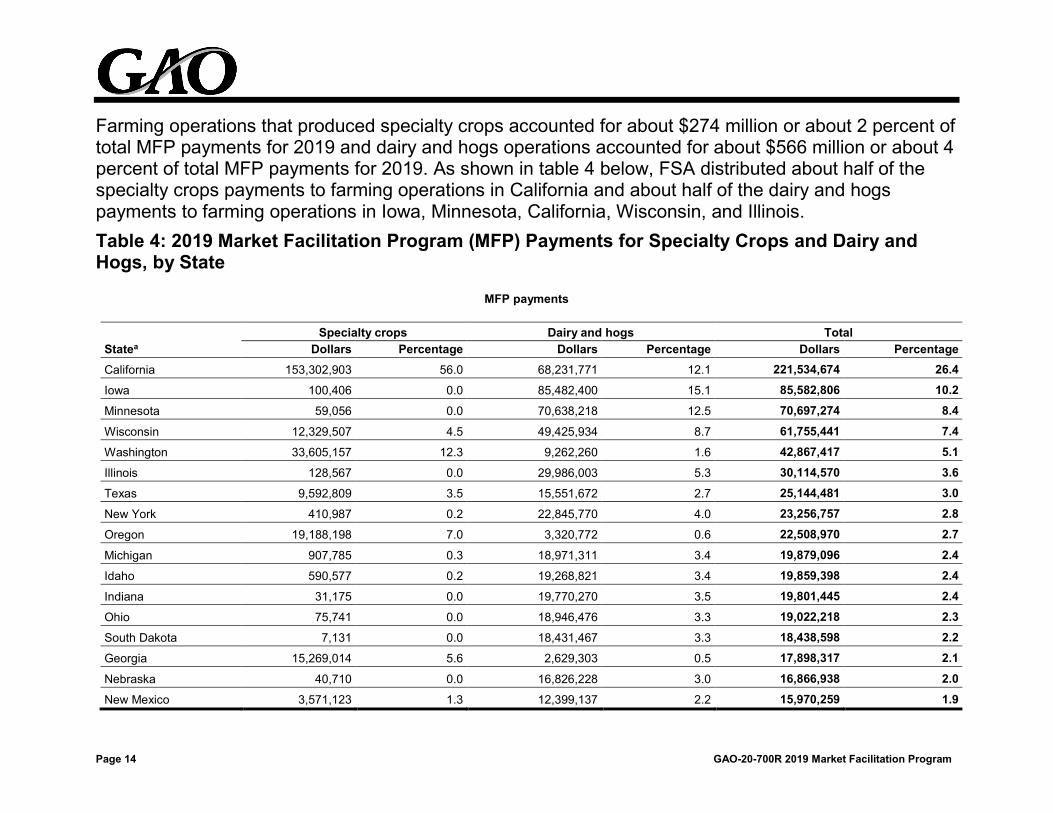
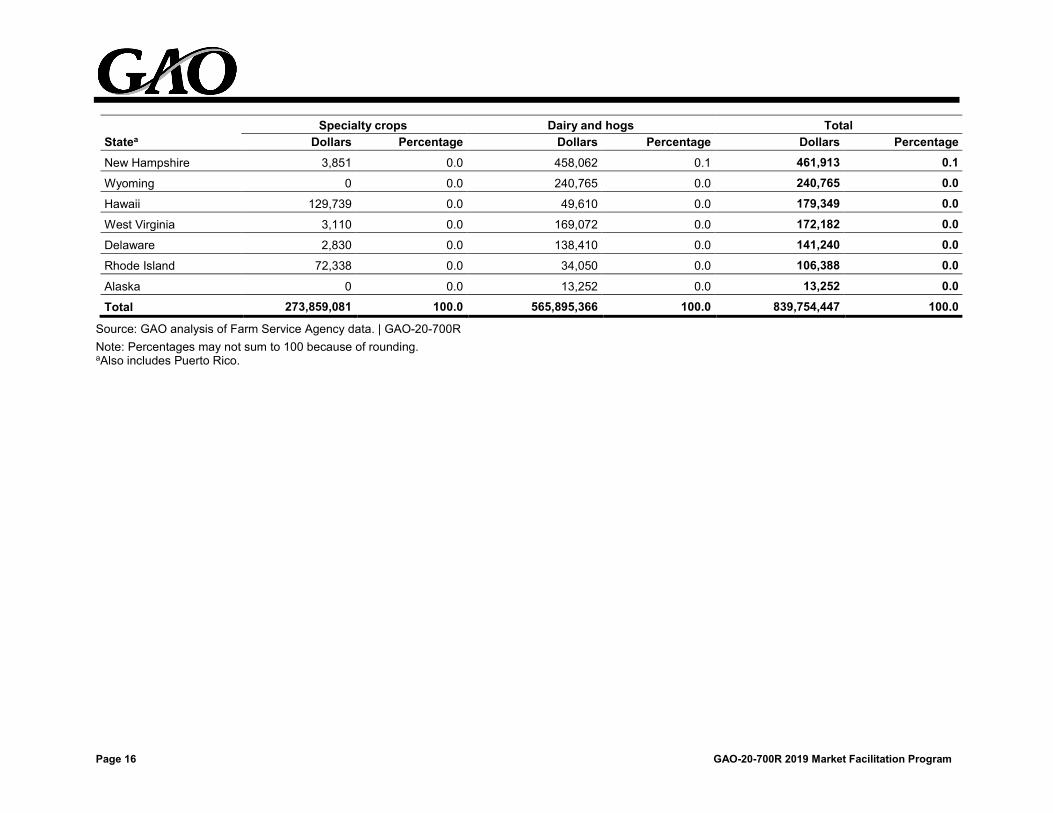
Farming operations that produced specialty crops accounted for about $274 million or about 2 percent of total MFP payments for 2019 and dairy and hogs operations accounted for about $566 million or about 4 percent of total MFP payments for 2019. As shown in table 4 below, FSA distributed about half of the specialty crops payments to farming operations in California and about half of the dairy and hogs payments to farming operations in Iowa, Minnesota, California, Wisconsin, and Illinois. Table 4: 2019 Market Facilitation Program (MFP) Payments for Specialty Crops and Dairy and Hogs, by State
MFP payments
Statea Specialty crops Dairy and hogs Total
Dollars Percentage Dollars Percentage Dollars Percentage California 153,302,903 56.0 68,231,771 12.1 221,534,674 26.4 Iowa 100,406 0.0 85,482,400 15.1 85,582,806 10.2 Minnesota 59,056 0.0 70,638,218 12.5 70,697,274 8.4 Wisconsin 12,329,507 4.5 49,425,934 8.7 61,755,441 7.4 Washington 33,605,157 12.3 9,262,260 1.6 42,867,417 5.1 Illinois 128,567 0.0 29,986,003 5.3 30,114,570 3.6 Texas 9,592,809 3.5 15,551,672 2.7 25,144,481 3.0 New York 410,987 0.2 22,845,770 4.0 23,256,757 2.8 Oregon 19,188,198 7.0 3,320,772 0.6 22,508,970 2.7 Michigan 907,785 0.3 18,971,311 3.4 19,879,096 2.4 Idaho 590,577 0.2 19,268,821 3.4 19,859,398 2.4 Indiana 31,175 0.0 19,770,270 3.5 19,801,445 2.4 Ohio 75,741 0.0 18,946,476 3.3 19,022,218 2.3 South Dakota 7,131 0.0 18,431,467 3.3 18,438,598 2.2 Georgia 15,269,014 5.6 2,629,303 0.5 17,898,317 2.1 Nebraska 40,710 0.0 16,826,228 3.0 16,866,938 2.0 New Mexico 3,571,123 1.3 12,399,137 2.2 15,970,259 1.9

Page 15 GAO-20-700R 2019 Market Facilitation Program
Statea Specialty crops Dairy and hogs Total
Dollars Percentage Dollars Percentage Dollars Percentage Pennsylvania 166,795 0.1 15,764,320 2.8 15,931,115 1.9 Oklahoma 9,596,137 3.5 1,070,778 0.2 10,666,915 1.3 Kansas 687,097 0.3 8,514,015 1.5 9,201,112 1.1 Missouri 1,041,042 0.4 8,032,312 1.4 9,073,354 1.1 Colorado 317,183 0.1 6,608,656 1.2 6,925,839 0.8 Arizona 598,895 0.2 6,035,362 1.1 6,634,256 0.8 Massachusetts 6,107,392 2.2 469,983 0.1 6,577,374 0.8 Vermont 0 0.0 4,704,816 0.8 4,704,816 0.6 North Carolina 294,442 0.1 4,241,971 0.7 4,536,413 0.5 Utah 232,565 0.1 3,536,912 0.6 3,769,478 0.4 Kentucky 21,760 0.0 3,682,881 0.7 3,704,641 0.4 Montana 416,538 0.2 2,872,837 0.5 3,289,375 0.4 Florida 166,984 0.1 2,863,144 0.5 3,030,128 0.4 Virginia 47,910 0.0 2,511,582 0.4 2,559,492 0.3 Arkansas 997,979 0.4 1,000,455 0.2 1,998,434 0.2 North Dakota 5,360 0.0 1,684,457 0.3 1,689,818 0.2 Tennessee 56,328 0.0 1,553,306 0.3 1,609,635 0.2 Maryland 42,006 0.0 1,516,137 0.3 1,558,143 0.2 Louisiana 1,064,486 0.4 318,745 0.1 1,383,231 0.2 Puerto Rico 0 0.0 1,321,200 0.2 1,321,200 0.2 New Jersey 1,053,071 0.4 256,461 0.0 1,309,531 0.2 Maine 43,832 0.0 1,163,458 0.2 1,207,290 0.1 Mississippi 685,719 0.3 491,930 0.1 1,177,649 0.1 Nevada 35,040 0.0 1,142,203 0.2 1,177,243 0.1 Alabama 564,618 0.2 208,616 0.0 773,234 0.1 South Carolina 186,183 0.1 535,132 0.1 721,315 0.1 Connecticut 7,006 0.0 702,665 0.1 709,672 0.1
Page 16 GAO-20-700R 2019 Market Facilitation Program
Statea Specialty crops Dairy and hogs Total
Dollars Percentage Dollars Percentage Dollars Percentage New Hampshire 3,851 0.0 458,062 0.1 461,913 0.1 Wyoming 0 0.0 240,765 0.0 240,765 0.0 Hawaii 129,739 0.0 49,610 0.0 179,349 0.0 West Virginia 3,110 0.0 169,072 0.0 172,182 0.0 Delaware 2,830 0.0 138,410 0.0 141,240 0.0 Rhode Island 72,338 0.0 34,050 0.0 106,388 0.0 Alaska 0 0.0 13,252 0.0 13,252 0.0 Total 273,859,081 100.0 565,895,366 100.0 839,754,447 100.0
Source: GAO analysis of Farm Service Agency data. | GAO-20-700R Note: Percentages may not sum to 100 because of rounding. aAlso includes Puerto Rico.

Page 17 GAO-20-700R 2019 Market Facilitation Program
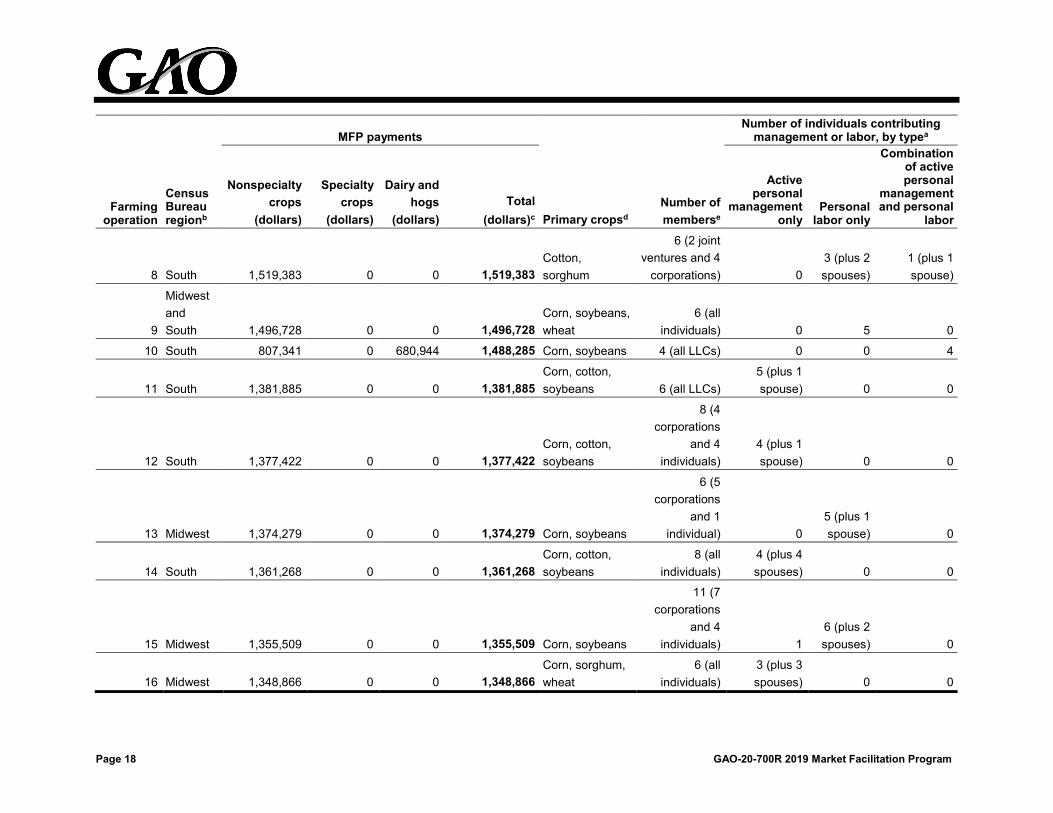
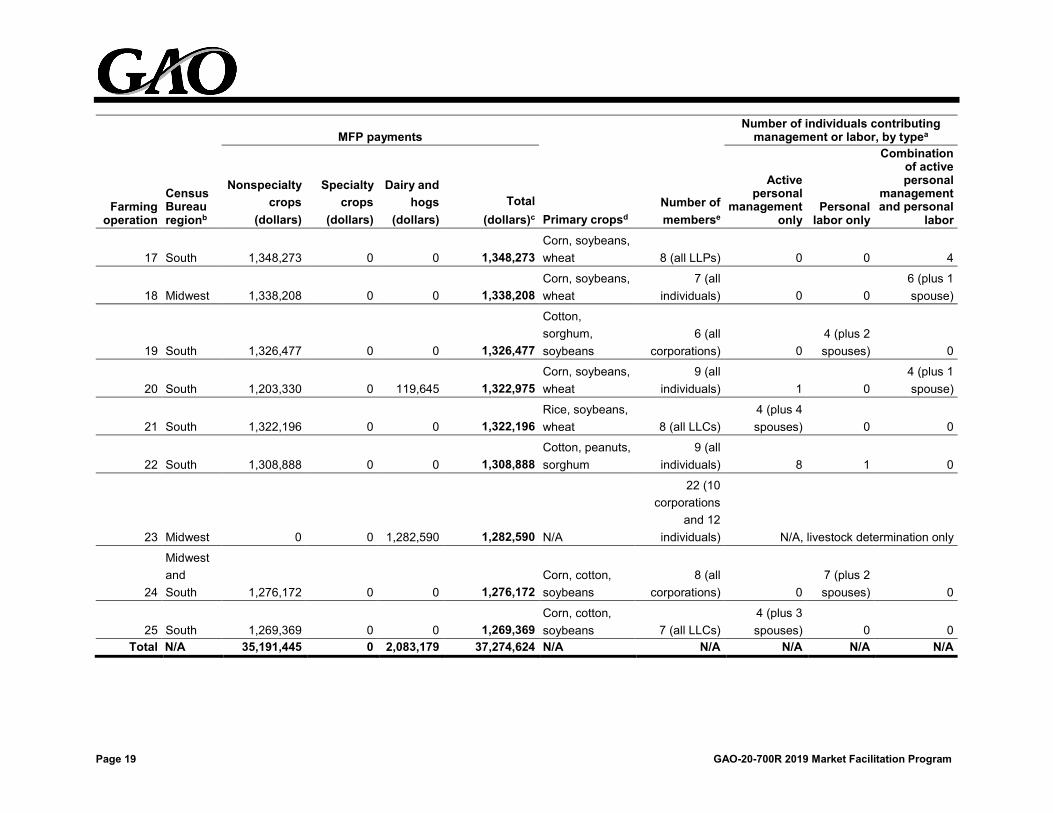
FSA paid the 25 farming operations that received the highest MFP payments for 2019 about $37 million. As shown in table 5, FSA made all but three of these payments to operations that produced only nonspecialty crops. Table 5: Payments, Number of Members, and Contributions of Management and Labor for the 25 Farming Operations Receiving the Highest Market Facilitation Program (MFP) Payments for 2019
Farming operation
Census Bureau regionb
MFP payments Number of individuals contributing
management or labor, by typea
Nonspecialty crops
(dollars)
Specialty crops
(dollars)
Dairy and hogs
(dollars) Total
(dollars)c Primary cropsd Number of memberse
Active personal
management only
Personal labor only
Combination of active personal
management and personal
labor
1 South 2,077,999 0 0 2,077,999 Corn, cotton, sorghum
10 (all individuals) 0 0
6 (plus 4 spouses)
2
Midwest and South 1,980,118 0 0 1,980,118
Corn, rice, soybeans
8 (6 corporations
and 2 individuals)
4 (plus 4 spouses) 0 0
3 South 1,940,323 0 0 1,940,323 Cotton, sorghum, wheat
8 (all individuals) 0 0
5 (plus 3 spouses)
4 South 1,886,334 0 0 1,886,334 Corn, cotton, soybeans
9 (all corporations) 0
7 (plus 3 spouses) 0
5 Midwest 1,740,248 0 0 1,740,248 Corn, soybeans
8 (2 individuals and 6
corporations) 0 5 (plus 3 spouses) 0
6 South 1,622,520 0 0 1,622,520 Corn, cotton, soybeans
8 (all corporations)
5 (plus 3 spouses) 0 0
7 Midwest 1,528,311 0 0 1,528,311 Corn, soybeans 7 (all
individuals) 1 0 3 (plus 3 spouses)
Page 18 GAO-20-700R 2019 Market Facilitation Program
Farming operation
Census Bureau regionb
MFP payments Number of individuals contributing
management or labor, by typea
Nonspecialty crops
(dollars)
Specialty crops
(dollars)
Dairy and hogs
(dollars) Total
(dollars)c Primary cropsd Number of memberse
Active personal
management only
Personal labor only
Combination of active personal
management and personal
labor
8 South 1,519,383 0 0 1,519,383 Cotton, sorghum
6 (2 joint ventures and 4
corporations) 0 3 (plus 2 spouses)
1 (plus 1 spouse)
9
Midwest and South 1,496,728 0 0 1,496,728
Corn, soybeans, wheat
6 (all individuals) 0 5 0
10 South 807,341 0 680,944 1,488,285 Corn, soybeans 4 (all LLCs) 0 0 4
11 South 1,381,885 0 0 1,381,885 Corn, cotton, soybeans 6 (all LLCs)
5 (plus 1 spouse) 0 0
12 South 1,377,422 0 0 1,377,422 Corn, cotton, soybeans
8 (4 corporations
and 4 individuals)
4 (plus 1 spouse) 0 0
13 Midwest 1,374,279 0 0 1,374,279 Corn, soybeans
6 (5 corporations
and 1 individual) 0
5 (plus 1 spouse) 0
14 South 1,361,268 0 0 1,361,268 Corn, cotton, soybeans
8 (all individuals)
4 (plus 4 spouses) 0 0
15 Midwest 1,355,509 0 0 1,355,509 Corn, soybeans
11 (7 corporations
and 4 individuals) 1
6 (plus 2 spouses) 0
16 Midwest 1,348,866 0 0 1,348,866 Corn, sorghum, wheat
6 (all individuals)
3 (plus 3 spouses) 0 0
Page 19 GAO-20-700R 2019 Market Facilitation Program
Farming operation
Census Bureau regionb
MFP payments Number of individuals contributing
management or labor, by typea
Nonspecialty crops
(dollars)
Specialty crops
(dollars)
Dairy and hogs
(dollars) Total
(dollars)c Primary cropsd Number of memberse
Active personal
management only
Personal labor only
Combination of active personal
management and personal
labor
17 South 1,348,273 0 0 1,348,273 Corn, soybeans, wheat 8 (all LLPs) 0 0 4
18 Midwest 1,338,208 0 0 1,338,208 Corn, soybeans, wheat
7 (all individuals) 0 0
6 (plus 1 spouse)
19 South 1,326,477 0 0 1,326,477
Cotton, sorghum, soybeans
6 (all corporations) 0
4 (plus 2 spouses) 0
20 South 1,203,330 0 119,645 1,322,975 Corn, soybeans, wheat
9 (all individuals) 1 0
4 (plus 1 spouse)
21 South 1,322,196 0 0 1,322,196 Rice, soybeans, wheat 8 (all LLCs)
4 (plus 4 spouses) 0 0
22 South 1,308,888 0 0 1,308,888 Cotton, peanuts, sorghum
9 (all individuals) 8 1 0
23 Midwest 0 0 1,282,590 1,282,590 N/A
22 (10 corporations
and 12 individuals) N/A, livestock determination only
24
Midwest and South 1,276,172 0 0 1,276,172
Corn, cotton, soybeans
8 (all corporations) 0
7 (plus 2 spouses) 0
25 South 1,269,369 0 0 1,269,369 Corn, cotton, soybeans 7 (all LLCs)
4 (plus 3 spouses) 0 0
Total N/A 35,191,445 0 2,083,179 37,274,624 N/A N/A N/A N/A N/A

Page 20 GAO-20-700R 2019 Market Facilitation Program
Legend: LLC = limited liability company LLP = limited liability partnership N/A = not applicable Sources: Farm Service Agency (FSA) state officials and GAO analysis of FSA data. | GAO-20-700R Notes: We analyzed FSA data to identify the 25 farming operations—general partnerships and joint ventures—that received the highest MFP payments for 2019. A joint venture is a short-term association of individuals or entities, where the association exists without an actual partnership. We provide the Census Bureau region where each farming operation is located to provide a general, rather than a specific location (e.g., state or county). aType of individual contribution is based on information provided by FSA state officials. Individuals may contribute active personal management or personal labor (or a combination of the two) and can provide these contributions on behalf of entities within a general partnership or joint venture. Both spouses may be considered “actively engaged in farming” and qualify for farm program payments if one spouse makes the requisite contributions to meet the actively engaged in farming requirements. bThe U.S. Census Bureau divides the 50 states among 4 regions—Northeast, South, Midwest, and West. The Northeast region includes Connecticut, Maine, Massachusetts, New Hampshire, New Jersey, New York, Pennsylvania, Rhode Island, and Vermont. The South region includes Alabama, Arkansas, Delaware, District of Columbia, Florida, Georgia, Kentucky, Louisiana, Maryland, Mississippi, North Carolina, Oklahoma, South Carolina, Tennessee, Texas, Virginia, and West Virginia. The Midwest region includes Indiana, Illinois, Iowa, Kansas, Michigan, Minnesota, Missouri, Nebraska, North Dakota, Ohio, South Dakota, and Wisconsin. The West region includes Alaska, Arizona, California, Colorado, Hawaii, Idaho, Nevada, New Mexico, Montana, Oregon, Utah, Washington, and Wyoming. cTotal reflects the MFP payments each farming operation received for 2019. The national average MFP payment per farming operation for 2019 was $22,312. dPrimary crops are those with the most acreage, according to FSA officials. They are listed in alphabetical order. eMembers of a general partnership or joint venture can be individuals or entities (e.g., corporations or limited liability companies). The number of members consists of the number of entities and individuals who are members of the general partnership or joint venture.
Page 21 GAO-20-700R 2019 Market Facilitation Program
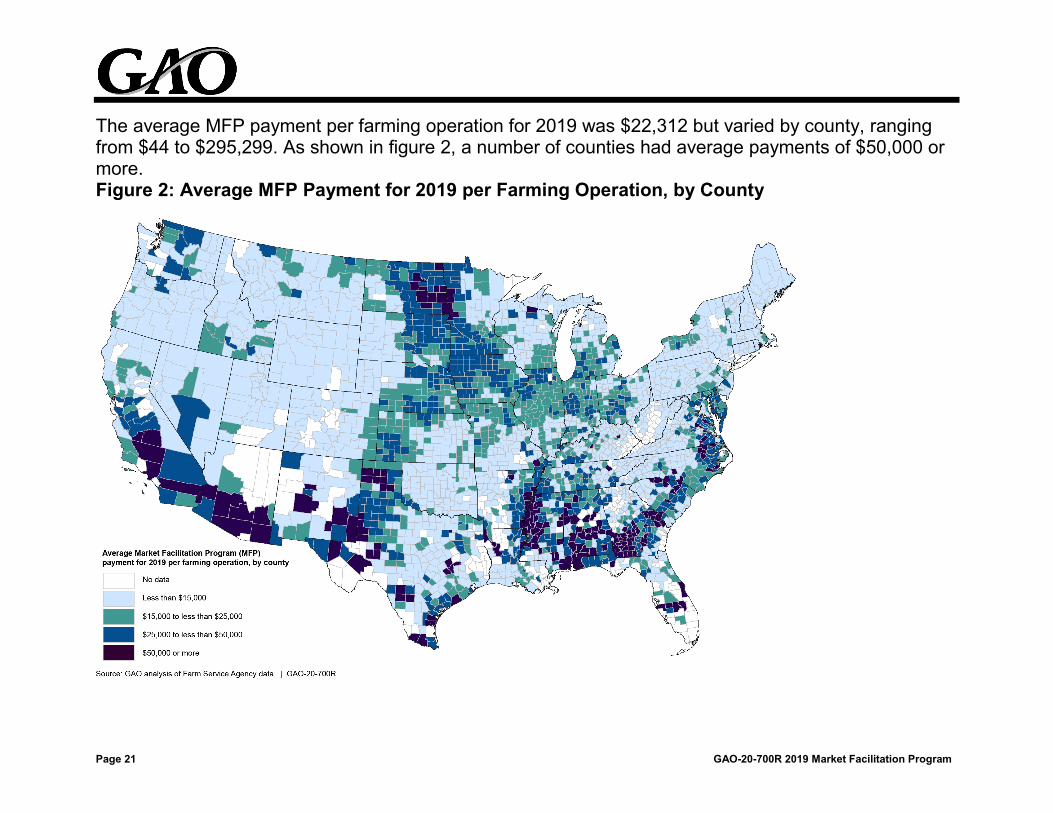
The average MFP payment per farming operation for 2019 was $22,312 but varied by county, ranging from $44 to $295,299. As shown in figure 2, a number of counties had average payments of $50,000 or more. Figure 2: Average MFP Payment for 2019 per Farming Operation, by County
Page 22 GAO-20-700R 2019 Market Facilitation Program
USDA Distributed Approximately $519 Million in Additional MFP Payments for 2019
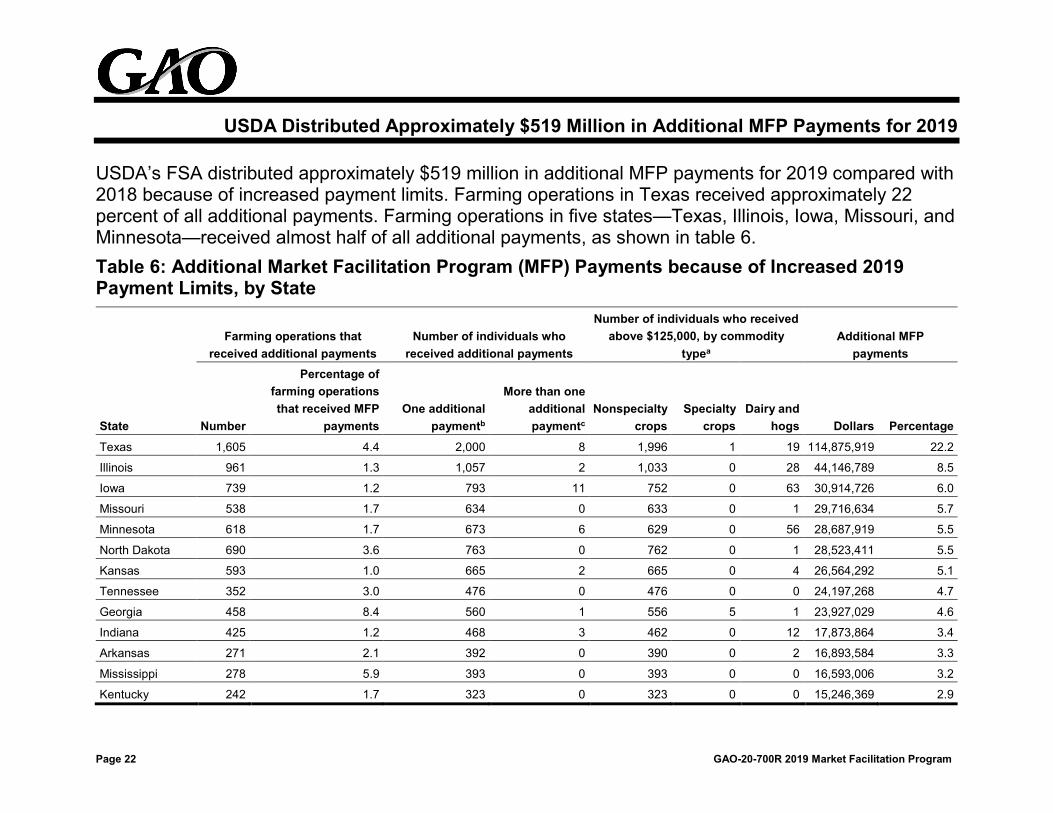
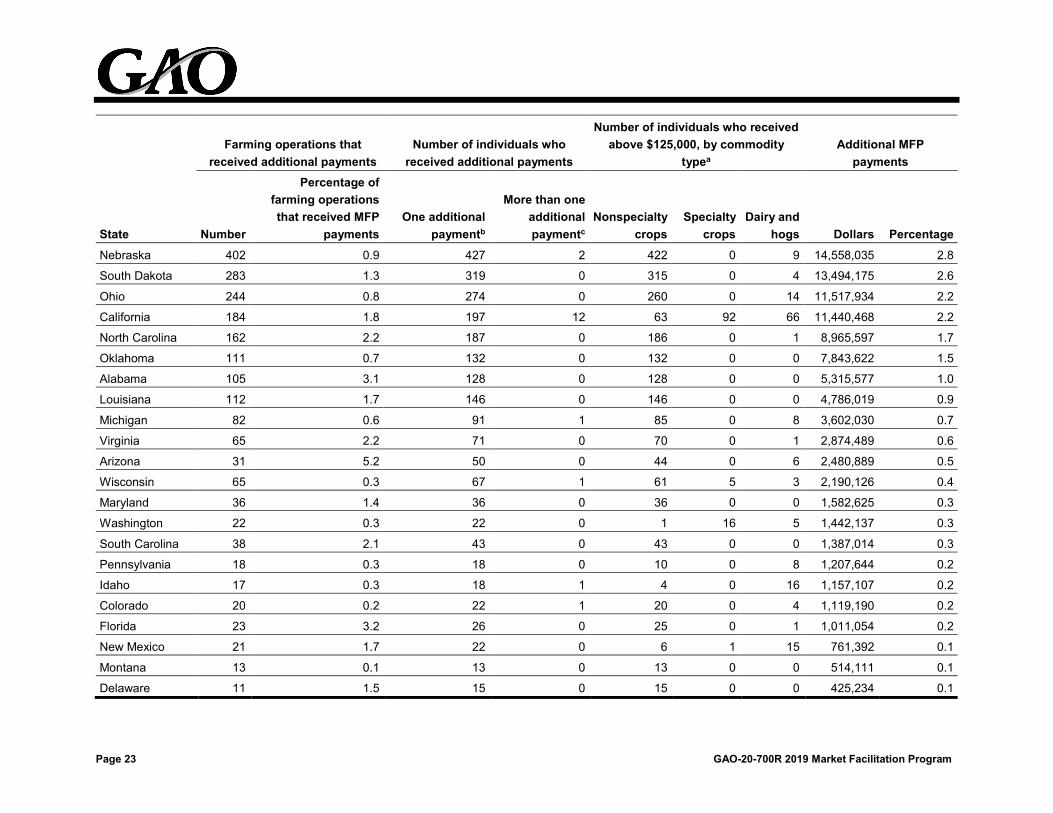
USDA’s FSA distributed approximately $519 million in additional MFP payments for 2019 compared with 2018 because of increased payment limits. Farming operations in Texas received approximately 22 percent of all additional payments. Farming operations in five states—Texas, Illinois, Iowa, Missouri, and Minnesota—received almost half of all additional payments, as shown in table 6. Table 6: Additional Market Facilitation Program (MFP) Payments because of Increased 2019 Payment Limits, by State
State
Farming operations that received additional payments
Number of individuals who received additional payments
Number of individuals who received above $125,000, by commodity
typea Additional MFP
payments
Number
Percentage of farming operations that received MFP
payments One additional
paymentb
More than one additional paymentc
Nonspecialty crops
Specialty crops
Dairy and hogs Dollars Percentage
Texas 1,605 4.4 2,000 8 1,996 1 19 114,875,919 22.2
Illinois 961 1.3 1,057 2 1,033 0 28 44,146,789 8.5
Iowa 739 1.2 793 11 752 0 63 30,914,726 6.0
Missouri 538 1.7 634 0 633 0 1 29,716,634 5.7
Minnesota 618 1.7 673 6 629 0 56 28,687,919 5.5
North Dakota 690 3.6 763 0 762 0 1 28,523,411 5.5
Kansas 593 1.0 665 2 665 0 4 26,564,292 5.1
Tennessee 352 3.0 476 0 476 0 0 24,197,268 4.7
Georgia 458 8.4 560 1 556 5 1 23,927,029 4.6
Indiana 425 1.2 468 3 462 0 12 17,873,864 3.4
Arkansas 271 2.1 392 0 390 0 2 16,893,584 3.3
Mississippi 278 5.9 393 0 393 0 0 16,593,006 3.2
Kentucky 242 1.7 323 0 323 0 0 15,246,369 2.9
Page 23 GAO-20-700R 2019 Market Facilitation Program
State
Farming operations that received additional payments
Number of individuals who received additional payments
Number of individuals who received above $125,000, by commodity
typea Additional MFP
payments
Number
Percentage of farming operations that received MFP
payments One additional
paymentb
More than one additional paymentc
Nonspecialty crops
Specialty crops
Dairy and hogs Dollars Percentage
Nebraska 402 0.9 427 2 422 0 9 14,558,035 2.8
South Dakota 283 1.3 319 0 315 0 4 13,494,175 2.6
Ohio 244 0.8 274 0 260 0 14 11,517,934 2.2
California 184 1.8 197 12 63 92 66 11,440,468 2.2
North Carolina 162 2.2 187 0 186 0 1 8,965,597 1.7
Oklahoma 111 0.7 132 0 132 0 0 7,843,622 1.5
Alabama 105 3.1 128 0 128 0 0 5,315,577 1.0
Louisiana 112 1.7 146 0 146 0 0 4,786,019 0.9
Michigan 82 0.6 91 1 85 0 8 3,602,030 0.7
Virginia 65 2.2 71 0 70 0 1 2,874,489 0.6
Arizona 31 5.2 50 0 44 0 6 2,480,889 0.5
Wisconsin 65 0.3 67 1 61 5 3 2,190,126 0.4
Maryland 36 1.4 36 0 36 0 0 1,582,625 0.3
Washington 22 0.3 22 0 1 16 5 1,442,137 0.3
South Carolina 38 2.1 43 0 43 0 0 1,387,014 0.3
Pennsylvania 18 0.3 18 0 10 0 8 1,207,644 0.2
Idaho 17 0.3 18 1 4 0 16 1,157,107 0.2
Colorado 20 0.2 22 1 20 0 4 1,119,190 0.2
Florida 23 3.2 26 0 25 0 1 1,011,054 0.2
New Mexico 21 1.7 22 0 6 1 15 761,392 0.1
Montana 13 0.1 13 0 13 0 0 514,111 0.1
Delaware 11 1.5 15 0 15 0 0 425,234 0.1

Page 24 GAO-20-700R 2019 Market Facilitation Program
State
Farming operations that received additional payments
Number of individuals who received additional payments
Number of individuals who received above $125,000, by commodity
typea Additional MFP
payments
Number
Percentage of farming operations that received MFP
payments One additional
paymentb
More than one additional paymentc
Nonspecialty crops
Specialty crops
Dairy and hogs Dollars Percentage
Oregon 7 0.2 7 0 0 7 0 365,844 0.1
New Jersey 5 0.8 5 0 3 2 0 283,029 0.1
New York 4 0.1 4 0 4 0 0 143,989 0.0
West Virginia 1 0.2 1 0 1 0 0 65,000 0.0
Total 9,852 1.5 11,538 51 11,163 129 348 518,695,139 100.0
Source: GAO analysis of Farm Service Agency (FSA) data. | GAO-20-700R Notes: There may have been additional MFP payments for 2019 compared with 2018 because of the increase in the types of eligible specialty and nonspecialty crops; we were not able to determine what these additional payments may have been because FSA did not report payment data for individual crops. Percentages may not sum to 100 because of rounding. aBecause individuals could have had additional payments for multiple commodity types, the sum of these payments across commodity types may not equal the number of individuals who received one and more than one additional payments in each state. bOne additional payment means an individual received a payment above the payment limit for the 2018 MFP for one type of commodity. cMore than one additional payment means an individual received payments above the payment limits for the 2018 MFP for two or three types of commodities.
Page 25 GAO-20-700R 2019 Market Facilitation Program
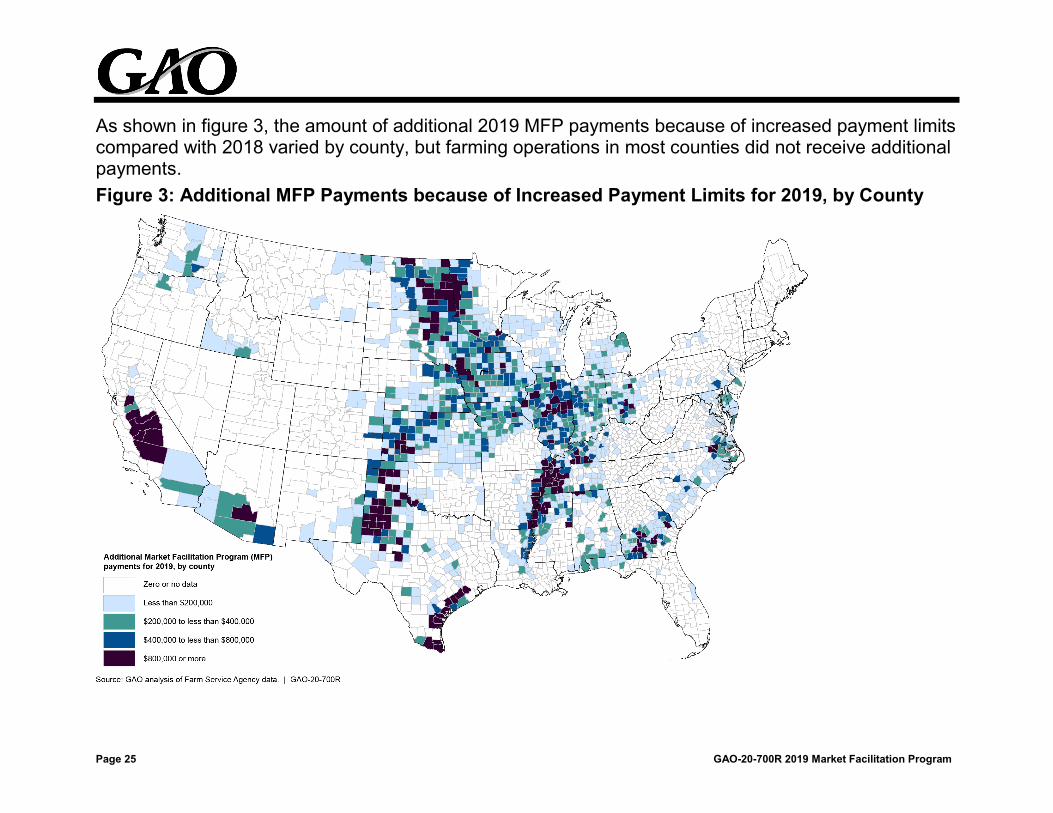
As shown in figure 3, the amount of additional 2019 MFP payments because of increased payment limits compared with 2018 varied by county, but farming operations in most counties did not receive additional payments. Figure 3: Additional MFP Payments because of Increased Payment Limits for 2019, by County
Page 26 GAO-20-700R 2019 Market Facilitation Program
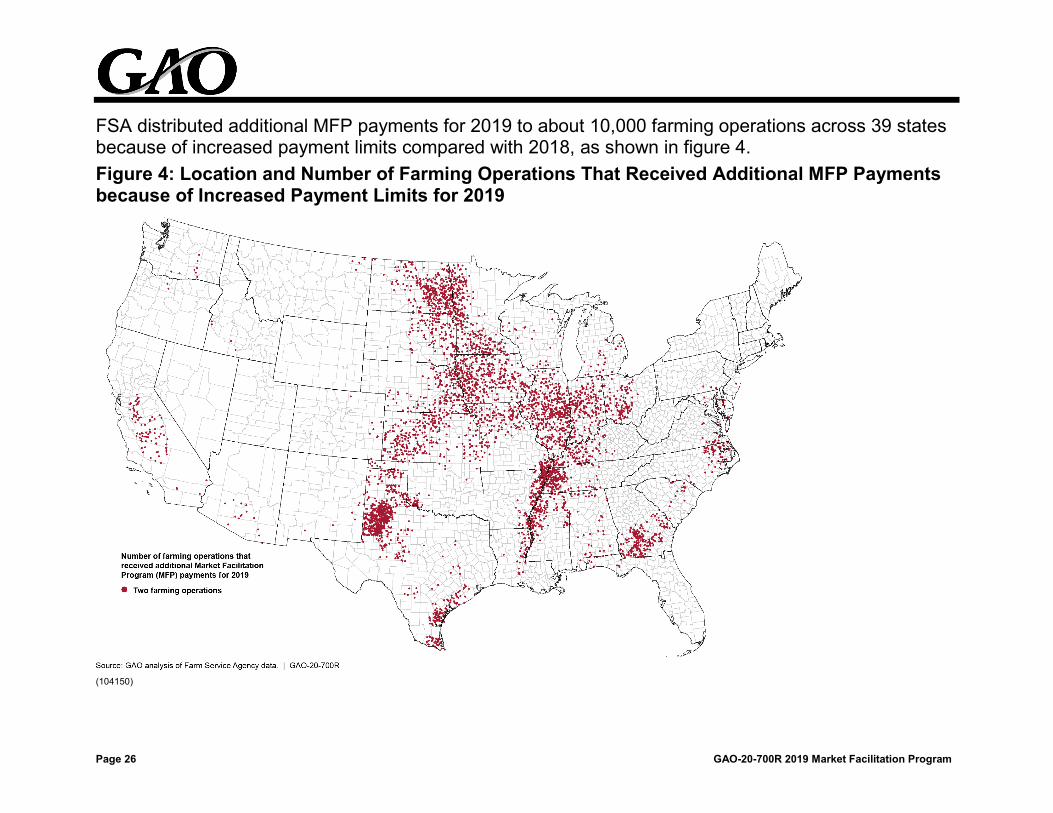
FSA distributed additional MFP payments for 2019 to about 10,000 farming operations across 39 states because of increased payment limits compared with 2018, as shown in figure 4. Figure 4: Location and Number of Farming Operations That Received Additional MFP Payments because of Increased Payment Limits for 2019
(104150)