Embed Size (px)
Citation preview
DIVERSITY IN THE TECHNOLOGY SECTOR
Federal Agencies Could Improve Oversight of Equal Employment Opportunity Requirements
Report to the Ranking Member, Committee on Education and the Workforce, House of Representatives
November 2017
GAO-18-69
United States Government Accountability Office
United States Government Accountability Office
Highlights of GAO-18-69, a report to the Ranking Member, Committee on Education and the Workforce, House of Representatives
November 2017
DIVERSITY IN THE TECHNOLOGY SECTOR
Federal Agencies Could Improve Oversight of Equal Employment Opportunity Requirements
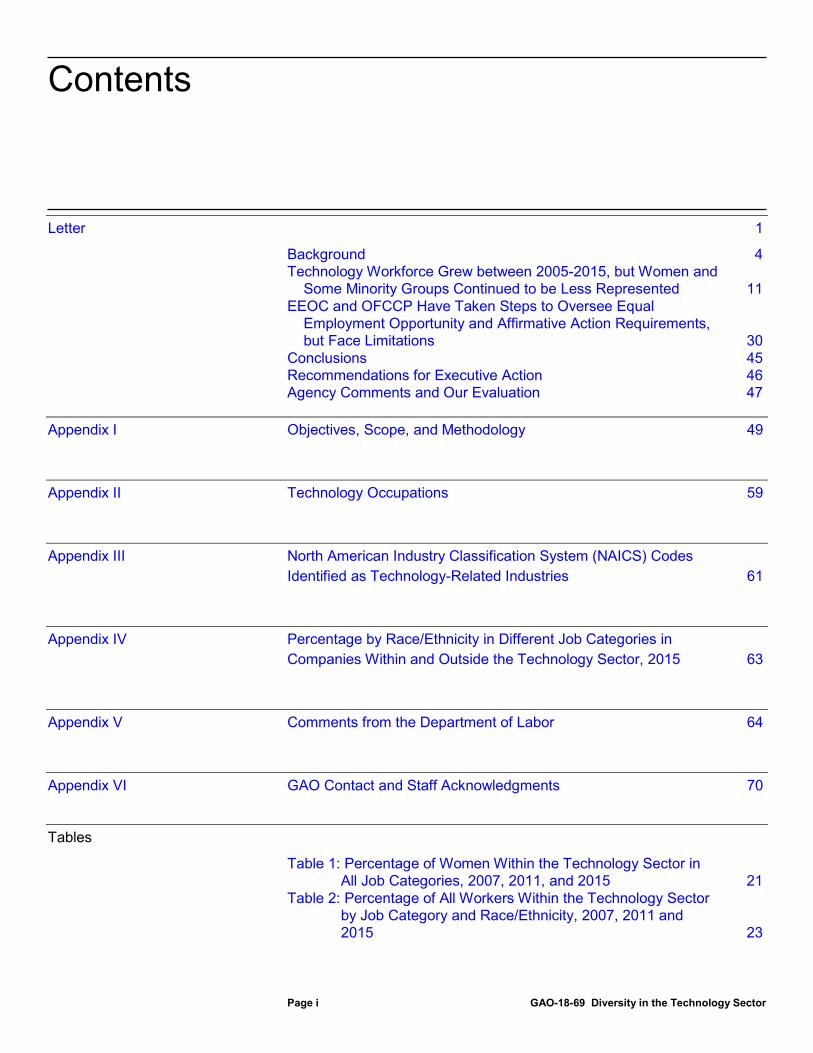
What GAO Found The estimated percentage of minority technology workers increased from 2005 to 2015, but GAO found that no growth occurred for female and Black workers, whereas Asian and Hispanic workers made statistically significant increases (see figure). Further, female, Black, and Hispanic workers remain a smaller proportion of the technology workforce—mathematics, computing, and engineering occupations—compared to their representation in the general workforce. These groups have also been less represented among technology workers inside the technology sector than outside it. In contrast, Asian workers were more represented in these occupations than in the general workforce. Stakeholders and researchers GAO interviewed identified several factors that may have contributed to the lower representation of certain groups, such as fewer women and minorities graduating with technical degrees and company hiring and retention practices.
Estimated Percentage of Technology Workers by Gender and Race/Ethnicity, 2005-2015
Note: Changes from 2005 to 2015 were statistically significant at p-value <0.05 except for changes for female, male, and Black workers. All population estimates have Relative Standard Errors of less than 7 percent. “Other” includes American Indian or Alaskan Native, and “Two or More Races”. White, Black, Asian, and “Other” categories include only non-Hispanic members.
Both the U.S. Equal Employment Opportunity Commission (EEOC) and the Department of Labor’s Office of Federal Contract Compliance Programs (OFCCP) have taken steps to enforce equal employment and affirmative action requirements in the technology sector, but face limitations. While EEOC has identified barriers to recruitment and hiring in the technology sector as a strategic priority, when EEOC conducts investigations, it does not systematically record the type of industry, therefore limiting sector-related analyses to help focus its efforts. EEOC has plans to determine how to add missing industry codes but has not set a timeframe to do this. In addition, OFCCP’s regulations may hinder its ability to enforce contractors’ compliance because OFCCP directs contractors to set placement goals for all minorities as a group rather than for specific racial/ethnic groups. OFCCP also has not made changes to its establishment-based approach to selecting entities for review in decades, even though changes have occurred in how workplaces are structured. Without taking steps to address these issues, OFCCP may miss opportunities to hold contractors responsible for complying with affirmative action and nondiscrimination requirements.
View GAO-18-69. For more information, contact Cindy Brown Barnes at (202) 512-7215 or [email protected].
Why GAO Did This Study Technology companies are a major source of high-paying U.S. jobs, but some have questioned the sector’s commitment to equal employment opportunity. EEOC provides federal oversight of nondiscrimination requirements by investigating charges of discrimination, and OFCCP enforces federal contractors’ compliance with affirmative action requirements. GAO was asked to review workforce trends in the technology sector and federal oversight.
This report examines (1) trends in the gender, racial, and ethnic composition of the technology sector workforce; and (2) EEOC and OFCCP oversight of technology companies’ compliance with equal employment and affirmative action requirements. GAO analyzed workforce data from the American Community Survey for 2005-2015 and EEOC Employer Information Reports for 2007-2015, the latest data available during our analysis. GAO analyzed OFCCP data on compliance evaluations for fiscal years 2011-2016. GAO interviewed agency officials, researchers, and workforce, industry, and company representatives.
What GAO Recommends GAO makes 6 recommendations, including that EEOC develop a timeline to improve industry data collection and OFCCP take steps toward requiring more specific minority placement goals by contractors and assess key aspects of its selection approach. EEOC neither agreed nor disagreed with its recommendation, and OFCCP stated the need for regulatory change to alter placement goal requirements. GAO continues to believe actions are needed, as discussed in the report.
Page i GAO-18-69 Diversity in the Technology Sector
Letter 1
Background 4 Technology Workforce Grew between 2005-2015, but Women and
Some Minority Groups Continued to be Less Represented 11 EEOC and OFCCP Have Taken Steps to Oversee Equal
Employment Opportunity and Affirmative Action Requirements, but Face Limitations 30
Conclusions 45 Recommendations for Executive Action 46 Agency Comments and Our Evaluation 47
Appendix I Objectives, Scope, and Methodology 49
Appendix II Technology Occupations 59
Appendix III North American Industry Classification System (NAICS) Codes Identified as Technology-Related Industries 61
Appendix IV Percentage by Race/Ethnicity in Different Job Categories in Companies Within and Outside the Technology Sector, 2015 63
Appendix V Comments from the Department of Labor 64
Appendix VI GAO Contact and Staff Acknowledgments 70
Tables
Table 1: Percentage of Women Within the Technology Sector in All Job Categories, 2007, 2011, and 2015 21
Table 2: Percentage of All Workers Within the Technology Sector by Job Category and Race/Ethnicity, 2007, 2011 and 2015 23
Contents
Page ii GAO-18-69 Diversity in the Technology Sector
Table 3: Top Industries Employing the Highest Concentration of Technology Workers, American Community Survey, 2014 51
Table 4: Cross-walk of Bureau of Labor Statistics (BLS) Standard Occupational Classification (SOC) System Codes to U.S. Census Bureau Occupation Codes 59
Table 5: List of North American Industry Classification System (NAICS) Codes Identified as Technology-related Industries 61
Table 6: Percentage by Race/Ethnicity in Different Job Categories in Companies Within and Outside the Technology Sector, 2015 63
Figures
Figure 1: Top 10 Geographic Areas for Technology Sector Employment in the United States, 2014 5
Figure 2: Estimated Percentage of Workers in Technology Workforce and General Workforce by Gender, 2005-2015 13
Figure 3: Estimated Percentage of Workers in the Technology Workforce and General Workforce by Race/Ethnicity, 2005-2015 14
Figure 4: Estimated Percentage of Technology Workforce and General Workforce by Race/Ethnicity and Gender, 2015 15
Figure 5: Estimated Percent of Technology Workers Within and Outside the Technology Sector by Race/Ethnicity and Gender, 2015 17
Figure 6: Percentage of Workers by Gender in Different Job Categories in Companies Within and Outside the Technology Sector, 2015 19
Figure 7: Percentage by Minority Status and Race/Ethnicity in Different Job Categories in Companies Within and Outside the Technology Sector, 2015 22
Figure 8: Proportion of Bachelor’s and Master’s Degrees Awarded by Field and Gender of Recipient, 2014 25
Figure 9: Proportion of Bachelor’s and Master’s Degree’s Awarded by Field and Race/Ethnicity, 2014 27
Page iii GAO-18-69 Diversity in the Technology Sector
Abbreviations AAP affirmative action program ACS American Community Survey BLS Bureau of Labor Statistics DOL U.S. Department of Labor DUNS Data Universal Numbering System EEO-1 Employer Information Report EEOC U.S. Equal Employment Opportunity Commission FAAP Functional Affirmative Action Program FPDS-NG Federal Procurement Data System-Next Generation IMS Integrated Mission System IPEDS Integrated Postsecondary Education Data System MOU memorandum of understanding NAICS North American Industry Classification System OFCCP Office of Federal Contract Compliance Programs S&P Standard & Poor’s SOC Standard Occupational Classification STEM Science, technology, engineering, and mathematics
This is a work of the U.S. government and is not subject to copyright protection in the United States. The published product may be reproduced and distributed in its entirety without further permission from GAO. However, because this work may contain copyrighted images or other material, permission from the copyright holder may be necessary if you wish to reproduce this material separately.
Page 1 GAO-18-69 Diversity in the Technology Sector
441 G St. N.W. Washington, DC 20548
November 16, 2017 The Honorable Robert C. “Bobby” Scott Ranking Member Committee on Education and the Workforce House of Representatives
Dear Mr. Scott:
Since the 1990s, the technology sector has become a major source of employment in the United States, and the sector is projected to continue to grow and produce high-paying jobs. As the technology sector has grown, the nation’s overall workforce has become more diverse and this trend is expected to continue into the future. Recently, media reports, technology workforce organizations, and policymakers have raised questions about diversity in the technology sector workforce and the extent to which companies are making changes to improve diversity and prevent discrimination. Diversity has been a focus not only because of concerns about equal access to these growing and high paying jobs, but because studies have associated a diversity of perspectives with enhanced innovation and other business advantages. Federal law promotes equal employment opportunity by prohibiting companies from discriminating in employment on the basis of race and gender, among other things, and generally requires companies contracting with the federal government to comply with affirmative action and other equal employment opportunity provisions. The U.S. Equal Employment Opportunity Commission (EEOC) and the U.S. Department of Labor’s Office of Federal Contract Compliance Programs (OFCCP) are the primary federal agencies that enforce these requirements.
You asked us to review gender, ethnic, and racial diversity trends in technology companies and federal oversight of antidiscrimination laws in this sector. This report examines (1) the demographic trends in the representation of women and racial and ethnic groups in the technology sector for the last 10 years, and (2) the efforts by EEOC and OFCCP to oversee technology companies’ and technology contractors’ compliance with equal employment opportunity and affirmative action requirements.
There is no common definition of technology workers or which industries comprise the technology sector. Therefore for this report, we defined technology workers as people who work in occupations in the fields of computing, engineering, and mathematics. We defined the technology sector as a group of industries with the highest concentration of
Letter
Page 2 GAO-18-69 Diversity in the Technology Sector
technology workers, such as computer systems design and software publishing, which is an approach similar to what other federal agencies have used recently to analyze trends within this sector.1 To describe the demographic trends within the technology workforce from 2005 through 2015, we analyzed workforce data from the American Community Survey (ACS) administered by the U.S. Census Bureau and from the EEOC’s Employer Information Reports (EEO-1). For this report, we used ACS data to estimate populations in technology occupations which we refer to as technology workers, or the technology workforce. We compared the technology workforce to the general workforce, which we defined as workers in all other occupations, excluding workers in technology occupations, as a benchmark to understand trends for the technology workforce in the context of overall workforce trends.2 In addition, we conducted further analysis of ACS data to compare technology workers within and outside the technology sector. Using EEO-1 data, we also analyzed workforce trends among similar occupations in the workforces of companies within and outside the technology sector. Our analysis was not designed to determine the presence or absence of discrimination. To understand diversity in academic preparation for technology occupations, we reviewed 2014 degree completion data from the National Center for Educational Statistics’ Integrated Postsecondary Education Data System (IPEDS) as tabulated by the National Science Foundation.3 Using a variety of sources, such as academic research and interviews with representatives from academia, we defined technology-related fields
1We identified 15 industries with the highest concentration of technology workers using Census industry codes. The concentration of technology workers in these industries ranged from a high of 62.2 percent in the computer systems design and related services industry to a low of 19.33 percent in the wired telecommunications carriers industry. See appendix I for more information regarding our industry selection, including the specific industries we included. Appendix II provides a list of the specific occupations we included in our analysis as technology occupations to identify the technology workforce. Appendix III provides the North American Industry Classification System codes for the industries we identified with the highest concentration of technology workers. 2For this analysis, we excluded individuals in the Armed Forces and those not in the labor force. We included individuals identified as 1) civilian employed, at work, 2) civilian employed, with a job but not at work, and 3) unemployed. 3National Science Foundation, National Center for Science and Engineering Statistics. Women, Minorities, and Persons with Disabilities in Science and Engineering: 2015. Special Report NSF 15-311. Arlington, VA.
Page 3 GAO-18-69 Diversity in the Technology Sector
as degree programs in computer science, engineering, and mathematics. Through a review of documentation, electronic testing, and/or interviews with agency officials knowledgeable about the data, we found these data sufficiently reliable for our purposes. To review EEOC and OFCCP’s oversight efforts related to technology companies’ and federal technology contractors’ compliance with federal equal employment opportunity and affirmative action requirements, we reviewed relevant federal statutes, regulations, and agency policies and conducted interviews with agency officials. We analyzed OFCCP data on affirmative action compliance evaluations from fiscal year 2011 through 2016. We assessed the reliability of the data by reviewing agency documentation and interviewing agency officials, and we determined that the OFCCP data were sufficiently reliable for our purposes.4
Additionally, we interviewed academics and representatives from workforce and industry organizations that either promote diversity or advocate for the technology sector, as well as representatives of eight information technology companies who work on diversity and inclusion and compliance issues, to obtain information about challenges and opportunities for diversity in the sector, and perspectives on federal oversight of antidiscrimination laws.5 The views expressed by the companies’ representatives may not be representative of all technology companies on these issues. See appendix I for more information on our methodology.
4We did not evaluate the agencies’ specific procedures for handling complaints or investigations. Also, our review was focused only on their activities with respect to race/ethnicity and gender. We previously reported on OFCCP’s oversight procedures in September 2016. See GAO, Equal Employment Opportunity: Strengthening Oversight Could Improve Federal Contractor Nondiscrimination Compliance, GAO-16-750 (Washington, D.C.: September 22, 2016). We have also previously reported on EEOC’s private sector enforcement program. See GAO, Equal Employment Opportunity Commission: Sharing Promising Practices and Fully Implementing Strategic Human Capital Planning Can Improve Management of Growing Workload, GAO-08-589 (Washington, D.C.: June 23, 2008) and EEOC: Burgeoning Workload Calls for New Approaches, GAO/T-HEHS-95-170 (Washington, D.C.: May 23, 1995). 5The eight companies were among the top 67 information technology companies identified on the Standard & Poor’s 500 list of the nation’s leading companies. We refer to these 67 companies as “leading technology companies” in this report. We identified for interviews the top companies from this list of information technology companies that were located in the San Francisco Bay area and were also federal contractors at some point between fiscal year 2011 and 2016.
Page 4 GAO-18-69 Diversity in the Technology Sector
We conducted this performance audit from May 2016 to November 2017 in accordance with generally accepted government auditing standards. Those standards require that we plan and perform the audit to obtain sufficient, appropriate evidence to provide a reasonable basis for our findings and conclusions based on our audit objectives. We believe that the evidence obtained provides a reasonable basis for our findings and conclusions based on our audit objectives.
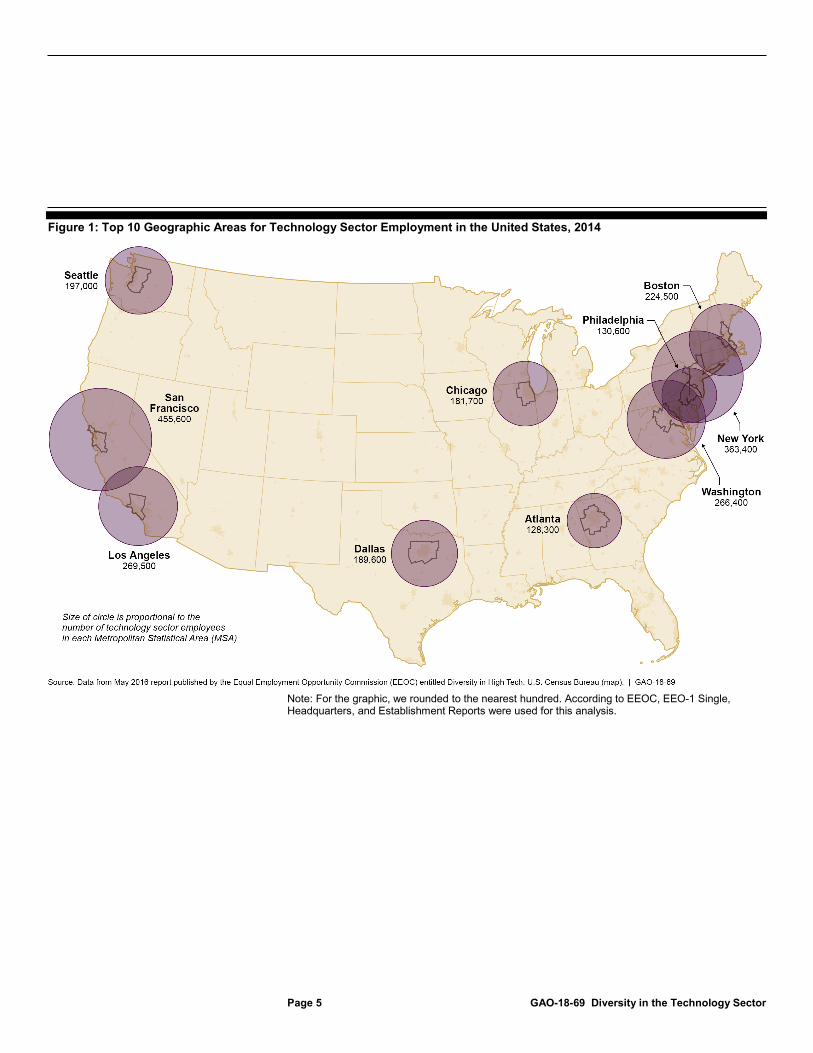
The technology sector has major employment hubs across the country, including the San Francisco Bay area, the greater New York City region, and the Washington-Arlington-Alexandria region (see fig. 1). In addition, technology workers are employed at companies outside the technology sector, such as in the retail or financial services industries.6 For example, a large retail company may require technology workers to create and manage their online sales activities, but the company itself would be considered part of the retail industry.
6Technology companies also include workers in occupations beyond those related to mathematics, computing, or engineering such as attorneys, human resource professionals and sales support staff.
Background
Technology Sector
Page 5 GAO-18-69 Diversity in the Technology Sector
Figure 1: Top 10 Geographic Areas for Technology Sector Employment in the United States, 2014
Note: For the graphic, we rounded to the nearest hundred. According to EEOC, EEO-1 Single, Headquarters, and Establishment Reports were used for this analysis.
Page 6 GAO-18-69 Diversity in the Technology Sector
Private companies are generally prohibited by federal law from discriminating in employment on the basis of race, color, religion, sex, national origin, age, and disability status.7 Additionally, federal contractors and subcontractors are generally required to take affirmative action to ensure that all applicants and employees are treated without regard to race, sex, color, religion, national origin, sexual orientation, and gender identity, and to employ or advance in employment qualified individuals with disabilities and qualified covered veterans.8 EEOC is responsible for enforcement of federal antidiscrimination laws, and OFCCP enforces affirmative action and nondiscrimination requirements for federal contractors. EEOC and OFCCP have some shared activities and have established a memorandum of understanding (MOU) to minimize any duplication of effort. For example, under the MOU, individual complaints filed with OFCCP alleging discrimination under Title VII are generally
7Title VII of the Civil Rights Act of 1964 (Title VII) prohibits employers with 15 or more employees from discriminating in employment on the basis of race, color, religion, sex, or national origin. 42 U.S.C. §§ 2000e(b), 2000e-2(a). The Age Discrimination in Employment Act of 1967 prohibits employers from discriminating in employment on the basis of age, defined as being age 40 and over. 29 U.S.C. §§ 623, 631(a). The Americans with Disabilities Act of 1990 prohibits employers with 15 or more employees from discriminating in employment on the basis of disability, among other things. 42 U.S.C. §§ 12111(5), 12112. Whether a specific employer would be a covered entity under these statutes would depend on meeting requirements unique to each statute, as well as agency regulations and legal precedent. 8Executive Order 11246 prohibits covered federal contractors—generally, holders of federal contracts and subcontracts of over $10,000—from discriminating in employment decisions on the basis of race, color, religion, sex, sexual orientation, gender identity, or national origin. It also requires these contractors to take affirmative action to ensure that equal employment opportunity is provided in employment without regard to these protected characteristics. Under OFCCP’s implementing regulations, non-construction contractors with contracts of $50,000 or more and 50 or more employees must develop and maintain a written affirmative action program, including an affirmative action plan. Section 503 of the Rehabilitation Act of 1973 requires covered federal contractors and subcontractors to take affirmative action to employ and advance in employment qualified individuals with disabilities. 29 U.S.C. § 793. The Vietnam Era Veterans’ Readjustment Assistance Act of 1974 requires covered contractors to take affirmative action to employ and advance in employment qualified covered veterans. 38 U.S.C. § 4212(a).
Federal Requirements Related to Equal Employment Opportunity and Affirmative Action
Page 7 GAO-18-69 Diversity in the Technology Sector
referred to EEOC.9 In addition, on occasions when EEOC receives a complaint not within its purview, such as cases that involve veteran status, but over which it believes OFCCP has jurisdiction, it will refer the complaint to OFCCP.
The EEOC, created by Title VII of the Civil Rights Act of 1964, enforces federal laws that prohibit employment discrimination on the basis of race, sex, color, religion, national origin, age, and disability.10 As the nation’s primary enforcer of antidiscrimination laws, EEOC investigates charges of employment discrimination from the public, litigates major cases, and conducts outreach to prevent discrimination by educating employers and workers. In fiscal year 2016, EEOC received about 91,500 charges, secured more than $482 million for victims of discrimination, and filed 114 lawsuits.11
According to EEOC, many states, counties, cities, and towns have their own laws prohibiting discrimination, usually similar to those EEOC enforces, as well as agencies responsible for enforcing those laws, called Fair Employment Practices Agencies. However, in some cases, these agencies enforce laws that offer greater protection to workers. An individual can file a charge with either the EEOC or with a Fair Employment Practices Agency. When an individual initially files with a Fair Employment Practices Agency that has a worksharing agreement with the EEOC, and the allegation is covered by a law enforced by the EEOC, the Fair Employment Practices Agency will dual file the charge with EEOC (meaning EEOC will receive a copy of the charge), but will usually retain the charge for processing. If the charge is initially filed with
9Under the MOU, all complaints of employment discrimination filed with OFCCP alleging a Title VII basis (race, color, religion, sex, national origin, or retaliation) shall be received as complaints simultaneously dual-filed under Title VII. OFCCP acts as EEOC’s agent for the purposes of receiving the Title VII component of these complaints. When OFCCP receives such a complaint and determines that the employer is not a federal contractor subject to Executive Order 11246, it shall transfer the complaint to EEOC. OFCCP will retain, investigate, process, and resolve complaints alleging discrimination of a systemic or class nature on a Title VII basis in dual-filed complaints. Under the MOU, OFCCP can also retain certain individual complaints so as to avoid duplication and ensure effective law enforcement. See Coordination of Functions; Memorandum of Understanding, 76 Fed. Reg. 71,029 (Nov. 16, 2011). 10EEOC enforces Title VII of the Civil Rights Act of 1964, the Age Discrimination in Employment Act of 1967, and Titles I and V of the Americans with Disabilities Act of 1990, among others. 11EEOC reported it resolved 97,443 charges and 139 lawsuits in fiscal year 2016.
U.S. Equal Employment Opportunity Commission
Page 8 GAO-18-69 Diversity in the Technology Sector
EEOC and the charge is also covered by state or local law, EEOC dual files the charge with the state or local Fair Employment Practices Agency (meaning the Fair Employment Practices Agency will receive a copy of the charge), but EEOC ordinarily retains the charge for processing.
EEOC also pursues a limited number of cases each year designed to combat systemic discrimination, defined by the agency as patterns or practices where the alleged discrimination presented by a complainant has a broad impact on an industry, profession, company, or geographic location. EEOC can also initiate a systemic investigation under Title VII with the approval of an EEOC commissioner, called a “commissioner charge”, provided the commissioner finds there is a reasonable basis for the investigation.12 In addition, EEOC district directors can approve systemic investigations, called “directed investigations” which are initiated by EEOC field office directors under the Age Discrimination in Employment Act and the Equal Pay Act.13
Under Title VII, EEOC generally requires that large employers and non-exempt federal contractors file Employer Information Reports (EEO-1 reports) annually,14 which collect employees’ demographic data by business location on sex, race, and ethnic group for 10 occupational job categories.15 According to EEOC documentation, EEO-1 data are used in investigations of Title VII violations, litigation, research, comparative analyses, class action suits, and affirmative action plans.
The OFCCP is responsible for ensuring that the nearly 200,000 federal contractor establishments comply with federal nondiscrimination and affirmative action requirements. Under Executive Order 11246 and other federal laws and regulations, covered federal contractors and 1242 U.S.C. § 2000e- 5(b), 29 C.F.R. § 1601.11. 1329 U.S.C. § 621 et seq., 29 U.S.C. § 206(d). 14Private employers with 100 or more employees and all non-exempt federal prime contractors or first-tier subcontractors who have 50 or more employees and have a federal contract, subcontract or purchase order of $50,000 or more are required to file an EEO-1 report for each applicable establishment. EEOC collects these data under the authority of Title VII of the Civil Rights Act of 1964, as amended, and its implementing regulations. 42 U.S.C. § 2000e-8(c); 29 C.F.R. pt. 1602. 15The 10 different job categories include (1) Executive/Senior Level Officials and Managers, (2) First/Mid Level Officials and Managers, (3) Professionals, (4) Technicians, (5) Sales Workers, (6) Administrative Support Workers, (7) Craft Workers, (8) Operatives, (9) Laborers and Helpers, and (10) Service Workers.
Office of Federal Contract Compliance Programs
Page 9 GAO-18-69 Diversity in the Technology Sector
subcontractors are prohibited from discriminating in employment on the basis of race, color, religion, sex, sexual orientation, gender identity, or national origin and are required to take affirmative action to help ensure that all applicants and employees are treated without regard to these factors.16 In general, OFCCP’s regulations require covered contractors to comply with certain recordkeeping and reporting requirements, and provide for enforcement procedures such as compliance evaluations and complaint investigations to assist OFCCP in ensuring federal contractor compliance with these regulations.
Among other provisions, OFCCP’s regulations generally require that covered contractors prepare and maintain an affirmative action program (AAP).17 Under OFCCP’s regulations, an AAP is a management tool that is designed to ensure equal employment opportunity, with an underlying premise that the gender, racial, and ethnic makeup of a contractor’s workforce should be representative of the labor pools from which the contractor recruits and selects.18 Companies must create an AAP for each business establishment—generally, a physical facility or unit that produces the goods or services, such as a factory, office, or store for the federal contractor.19 An AAP will also include any practical steps to address underrepresentation of women and minorities, such as expanding employment opportunities to underrepresented groups. Covered contractors must also comply with certain recordkeeping
16In 1965, President Johnson issued Executive Order 11246, which initially prohibited contractors from discriminating in employment on the basis of race, color, religion, or national origin, and has since been amended to also cover sex, sexual orientation, and gender identity. OFCCP was established in 1965. OFCCP also enforces Section 503 of the Rehabilitation Act of 1973 and the Vietnam Era Veterans’ Readjustment Assistance Act of 1974, all as amended, which apply to federal contractors and subcontractors if they meet specific criteria, including contract dollar amount and employee count thresholds. However, OFCCP’s enforcement of these statutes regarding disabilities and veterans is outside the scope of this review. 17Generally, non-construction contractors that have 50 or more employees and a contract above $50,000 amount are required to prepare an AAP within 120 days of the commencement of the contract, and annually update the AAP. See generally 41 C.F.R. §§ 60-2.1 to 60-2.35. 1841 C.F.R. § 60-2.10(a)(1). 1941 C.F.R. § 60-2.1(b). A contractor must develop and maintain a written AAP for each of its establishments if it has 50 or more employees.
Page 10 GAO-18-69 Diversity in the Technology Sector
requirements, including records pertaining to hiring, promotion, lay off or termination, rates of pay, and applications, among other records.20
OFCCP’s enforcement program represents the majority of the agency’s activity and is carried out primarily by using compliance officers, who evaluate contractors’ compliance with various requirements, according to agency officials. In addition to conducting compliance evaluations, OFCCP also conducts investigations in response to complaints. In 2016, we reported that according to OFCCP officials, responding to complaints accounted for close to 16 percent of OFCCP’s enforcement activities.21 OFCCP selects contractor establishments for evaluations based on a number of neutrally applied factors, such as employee count at the establishment, contract value, or contract expiration date.22 We previously found that OFCCP reviews, on average, 2 percent of federal contractor establishments annually.23
As we previously reported, as part of its compliance evaluations, OFCCP is to review the selected contractor’s hiring, promotion, compensation, termination, and other employment practices to determine whether contractors are maintaining nondiscriminatory hiring and employment practices.24 OFCCP conducts evaluations at the establishment level.25 When a contractor establishment is selected for evaluation, OFCCP sends the contractor a “scheduling letter” requesting the AAP and 2041 C.F.R. § 60-1.12. 21The agency also carries out compliance assistance efforts, which generally include conducting outreach to contractors and issuing guidance. See GAO-16-750. 22OFCCP’s process for identifying establishments under its jurisdiction requires pulling information from multiple information sources, such as federal acquisition and procurement databases, EEO-1 reports, Dun & Bradstreet data, and U.S. Census Bureau data. 23GAO-16-750. 24GAO-16-750. 25If OFCCP determines that a business is subject to OFCCP’s jurisdiction because of a federal contract, it may determine that all of the business’s establishments or facilities, including subsidiaries, are subject to the federal nondiscrimination and affirmative action requirements, regardless of where the federal contract is held. Executive Order 11246 requires every government contract, except those exempted by the U.S. Department of Labor (DOL), to include nondiscrimination and affirmative action provisions, but allows DOL to provide, by rule, regulation, or order, for the exemption of facilities of a contractor that are “in all respects separate and distinct from activities of the contractor related to the performance of the contract.” See 41 C.F.R. § 60-1.5(b)(2).
Page 11 GAO-18-69 Diversity in the Technology Sector
supporting data, such as the percentage of women and minority staff at the workplace by job group. Then, a compliance officer is to conduct a desk audit, which is an off-site review of the submitted materials. If necessary, the compliance officer may also conduct an on-site review or further off-site analysis to make a final determination as to whether the contractor is in compliance. In addition to looking at whether federal contractors maintain nondiscriminatory hiring and employment practices, which can result in finding discrimination violations, OFCCP also frequently finds other types of violations, such as failure to keep necessary records or conduct annual reviews of equal employment and affirmative action efforts. These findings by the agency often require administrative changes on the part of the contractor, such as improved record-keeping. There are many different forms of remedies for discrimination violations, including financial, employment, and organizational change remedies.26 Although rare, under some circumstances, OFCCP may bar a contractor from doing business with the government.
26OFCCP resolves most violations with conciliation agreements—agreements between OFCCP and the contractor—that outline remedial action that contractors agree to take to correct violations. These agreements may require the contractor to use a range of remedies depending on the facts of the case, including corrective remedies and make-whole relief.
Technology Workforce Grew between 2005-2015, but Women and Some Minority Groups Continued to be Less Represented
Page 12 GAO-18-69 Diversity in the Technology Sector
From 2005 to 2015, the estimated number of workers in the technology workforce—people who worked in mathematics, computing, or engineering occupations—increased at a higher rate (24 percent) than the estimated number of workers in the general workforce (9 percent), according to ACS data.27 In 2015, the technology workforce comprised an estimated 7.5 million workers, an increase of slightly over 1.4 million workers since 2005.28 (For a complete list of the occupations we include as technology occupations, see appendix II).
Most technology workers have a college degree and have a higher median income than workers in the general workforce. Specifically, in 2015, an estimated 69 percent of technology workers held at least a bachelor’s degree, compared to 31 percent of workers in the general workforce.29 In 2015, the estimated median income for technology workers was $81,000 compared to $42,000 for the general workforce.
27In this report, the general workforce refers to workers in all other occupations, excluding workers in technology occupations. While this comparison includes workers who do not have qualifications similar to technology workers, it illustrates how changes in worker demography contrast with trends among highly paid technology workers. Later in our report, we provide specific comparisons between technology workers inside and outside the technology sector. For comparisons of ACS data over time, we tested all changes for technology workers and the general workforce from 2005 to 2015 for statistical significance at the p-value<.0.05 and all findings were significant unless otherwise noted in the text. All population estimates used in this report have less than 7 percent of Relative Standard Errors. 28Technology workers made up an estimated 4.6 percent of all workers in the overall workforce. 29This includes bachelor’s, master’s, professional, and doctorate degrees.
Compared to General Workforce, the Technology Workforce Grew at a Higher Rate and Continued to be More Educated and Better Paid
Women and Certain Minority Groups Continued to be Less Represented in the Technology Workforce and Sector
Page 13 GAO-18-69 Diversity in the Technology Sector
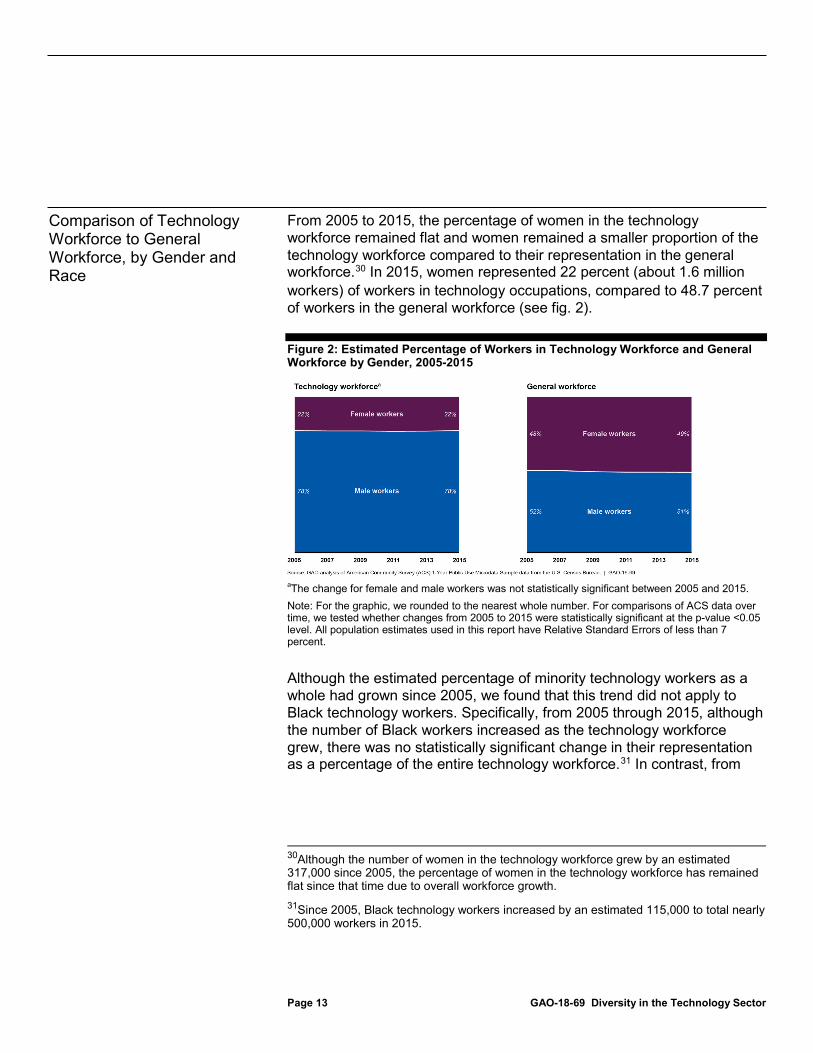
From 2005 to 2015, the percentage of women in the technology workforce remained flat and women remained a smaller proportion of the technology workforce compared to their representation in the general workforce.30 In 2015, women represented 22 percent (about 1.6 million workers) of workers in technology occupations, compared to 48.7 percent of workers in the general workforce (see fig. 2).
Figure 2: Estimated Percentage of Workers in Technology Workforce and General Workforce by Gender, 2005-2015
aThe change for female and male workers was not statistically significant between 2005 and 2015. Note: For the graphic, we rounded to the nearest whole number. For comparisons of ACS data over time, we tested whether changes from 2005 to 2015 were statistically significant at the p-value <0.05 level. All population estimates used in this report have Relative Standard Errors of less than 7 percent.
Although the estimated percentage of minority technology workers as a whole had grown since 2005, we found that this trend did not apply to Black technology workers. Specifically, from 2005 through 2015, although the number of Black workers increased as the technology workforce grew, there was no statistically significant change in their representation as a percentage of the entire technology workforce.31 In contrast, from
30Although the number of women in the technology workforce grew by an estimated 317,000 since 2005, the percentage of women in the technology workforce has remained flat since that time due to overall workforce growth. 31Since 2005, Black technology workers increased by an estimated 115,000 to total nearly 500,000 workers in 2015.
Comparison of Technology Workforce to General Workforce, by Gender and Race
Page 14 GAO-18-69 Diversity in the Technology Sector
2005 to 2015, Hispanic and Asian technology workers had statistically significant increases in their representation in the technology workforce.32
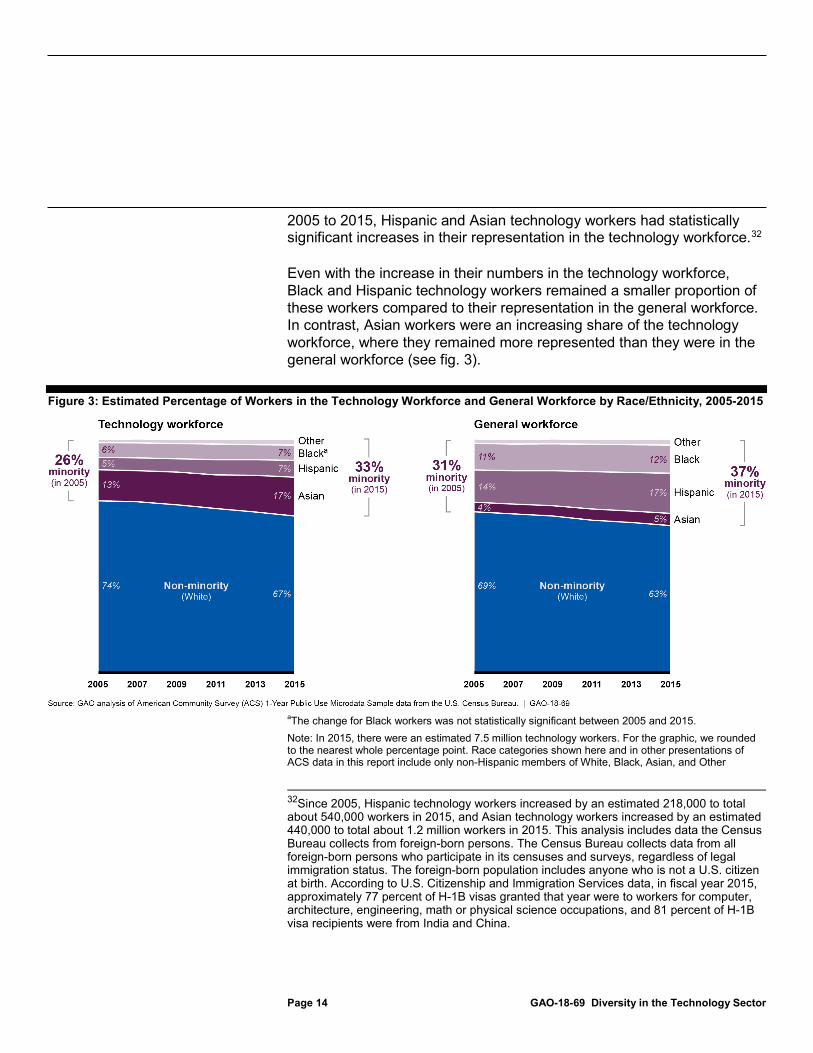
Even with the increase in their numbers in the technology workforce, Black and Hispanic technology workers remained a smaller proportion of these workers compared to their representation in the general workforce. In contrast, Asian workers were an increasing share of the technology workforce, where they remained more represented than they were in the general workforce (see fig. 3).
Figure 3: Estimated Percentage of Workers in the Technology Workforce and General Workforce by Race/Ethnicity, 2005-2015
aThe change for Black workers was not statistically significant between 2005 and 2015. Note: In 2015, there were an estimated 7.5 million technology workers. For the graphic, we rounded to the nearest whole percentage point. Race categories shown here and in other presentations of ACS data in this report include only non-Hispanic members of White, Black, Asian, and Other
32Since 2005, Hispanic technology workers increased by an estimated 218,000 to total about 540,000 workers in 2015, and Asian technology workers increased by an estimated 440,000 to total about 1.2 million workers in 2015. This analysis includes data the Census Bureau collects from foreign-born persons. The Census Bureau collects data from all foreign-born persons who participate in its censuses and surveys, regardless of legal immigration status. The foreign-born population includes anyone who is not a U.S. citizen at birth. According to U.S. Citizenship and Immigration Services data, in fiscal year 2015, approximately 77 percent of H-1B visas granted that year were to workers for computer, architecture, engineering, math or physical science occupations, and 81 percent of H-1B visa recipients were from India and China.
Page 15 GAO-18-69 Diversity in the Technology Sector
categories. For the Asian category, we include Asian American, Native Hawaiian or Other Pacific Islander. The Hispanic category incorporates Hispanics of all races. Our analysis included American Indian or Alaskan Native, and “Two or More Races,” in the category reported as “Other.” All population estimates used in this report have Relative Standard Errors of less than 7 percent. For comparisons of ACS data over time, we tested the statistical significance of changes from 2005 to 2015 for each race and all changes were significant at the p-value < 0.05 level unless otherwise noted.
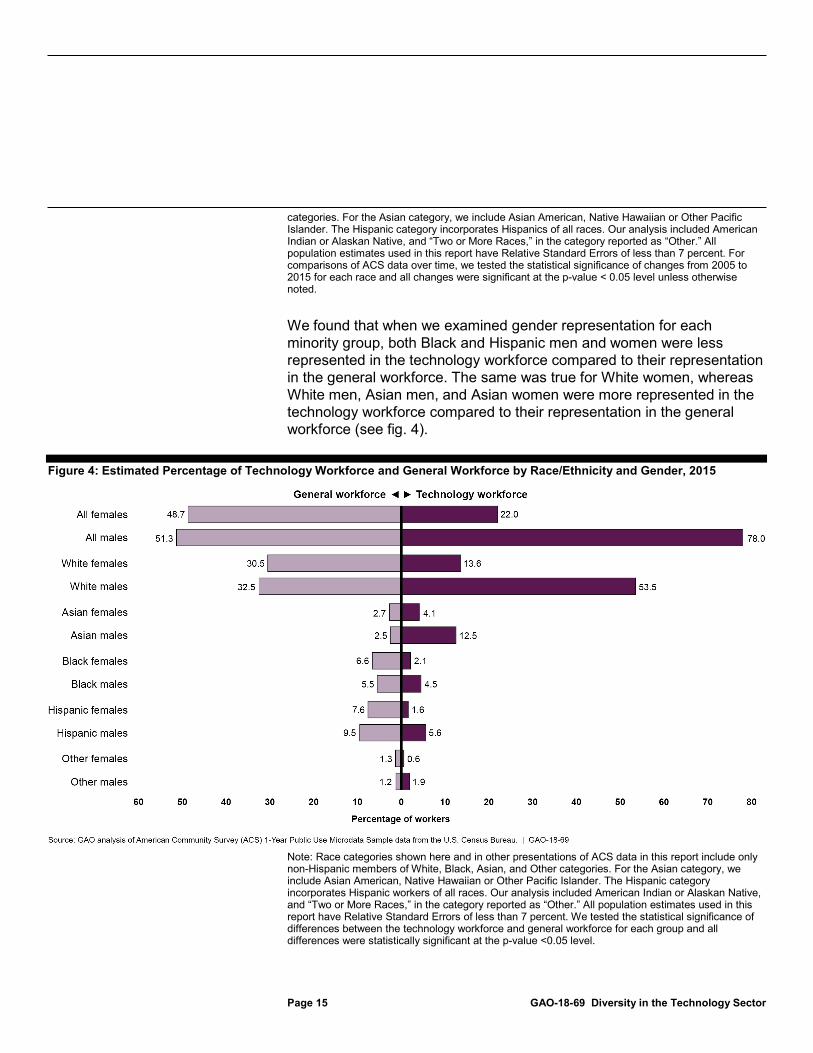
We found that when we examined gender representation for each minority group, both Black and Hispanic men and women were less represented in the technology workforce compared to their representation in the general workforce. The same was true for White women, whereas White men, Asian men, and Asian women were more represented in the technology workforce compared to their representation in the general workforce (see fig. 4).
Figure 4: Estimated Percentage of Technology Workforce and General Workforce by Race/Ethnicity and Gender, 2015
Note: Race categories shown here and in other presentations of ACS data in this report include only non-Hispanic members of White, Black, Asian, and Other categories. For the Asian category, we include Asian American, Native Hawaiian or Other Pacific Islander. The Hispanic category incorporates Hispanic workers of all races. Our analysis included American Indian or Alaskan Native, and “Two or More Races,” in the category reported as “Other.” All population estimates used in this report have Relative Standard Errors of less than 7 percent. We tested the statistical significance of differences between the technology workforce and general workforce for each group and all differences were statistically significant at the p-value <0.05 level.
Page 16 GAO-18-69 Diversity in the Technology Sector
We defined the technology sector as those companies that have the highest concentration of technology workers and are in such industries as computer systems design and software publishing. Companies categorized as outside the technology sector, for example, retail or finance companies, may still employ some technology workers.33 However, we found differences in median incomes for technology workers within and outside the technology sector. In 2015, technology workers employed in the technology sector earned an estimated median income of $89,000 compared to median incomes of $78,000 for those working outside the technology sector.
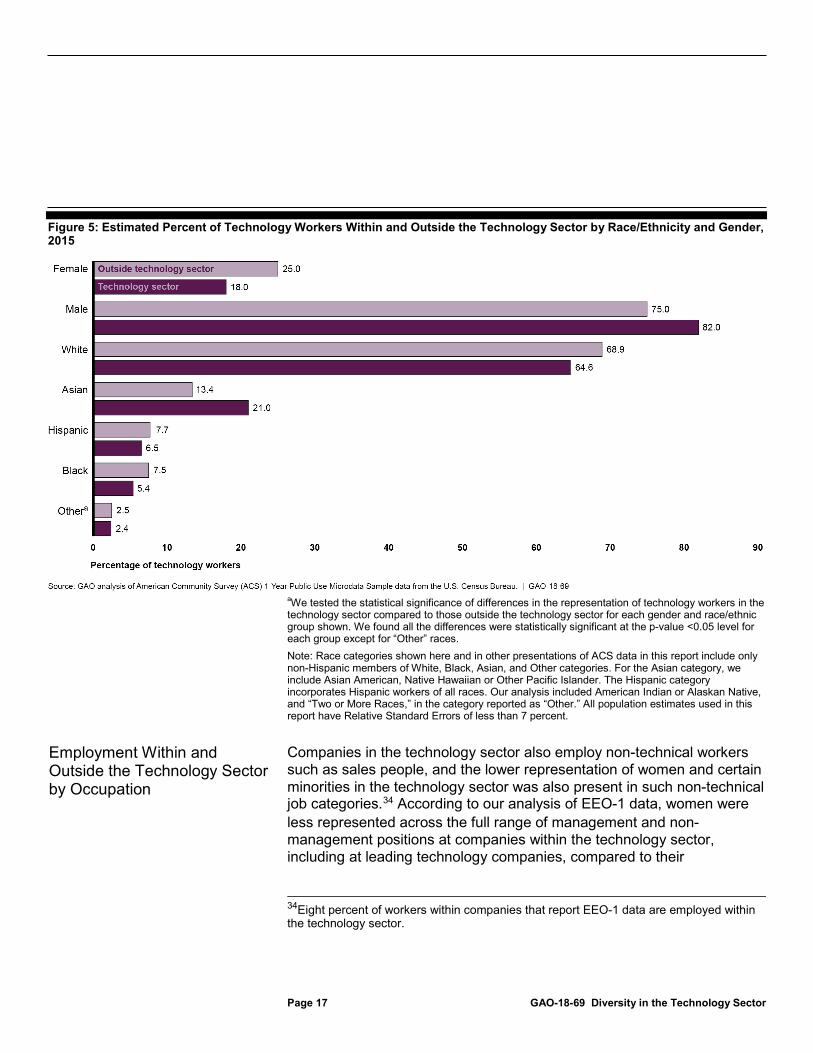
We also compared the characteristics of technology workers within the technology sector and outside the technology sector, and found male and Asian technology workers were relatively more represented in the technology sector than outside the technology sector. Similar to the lower representation of female, Black, and Hispanic technology workers in technology occupations, we found technology workers from these groups were also more likely to work outside the technology sector than in the technology sector. For example, according to our analysis of 2015 ACS data, women represented an estimated 18 percent of all technology workers employed in the technology sector, compared to 25 percent of all technology workers employed outside the technology sector (see fig. 5). White technology workers were also more represented outside the technology sector than within the technology sector.
33For example, technology workers comprised about 62 percent of workers in industries such as computer systems design and related services and 44 percent of workers in software publishing. Technology workers outside the technology sector may include, for example, in-house help desk or systems engineers who work for non-technology companies (like retail or finance). For a list of industries with the highest concentrations of technology workers, which we included in our definition of the technology sector, see table 3 in appendix I.
Comparison of Technology Workers Within and Outside the Technology Sector
Page 17 GAO-18-69 Diversity in the Technology Sector
Figure 5: Estimated Percent of Technology Workers Within and Outside the Technology Sector by Race/Ethnicity and Gender, 2015
aWe tested the statistical significance of differences in the representation of technology workers in the technology sector compared to those outside the technology sector for each gender and race/ethnic group shown. We found all the differences were statistically significant at the p-value <0.05 level for each group except for “Other” races. Note: Race categories shown here and in other presentations of ACS data in this report include only non-Hispanic members of White, Black, Asian, and Other categories. For the Asian category, we include Asian American, Native Hawaiian or Other Pacific Islander. The Hispanic category incorporates Hispanic workers of all races. Our analysis included American Indian or Alaskan Native, and “Two or More Races,” in the category reported as “Other.” All population estimates used in this report have Relative Standard Errors of less than 7 percent.
Companies in the technology sector also employ non-technical workers such as sales people, and the lower representation of women and certain minorities in the technology sector was also present in such non-technical job categories.34 According to our analysis of EEO-1 data, women were less represented across the full range of management and non-management positions at companies within the technology sector, including at leading technology companies, compared to their
34Eight percent of workers within companies that report EEO-1 data are employed within the technology sector.
Employment Within and Outside the Technology Sector by Occupation
Page 18 GAO-18-69 Diversity in the Technology Sector
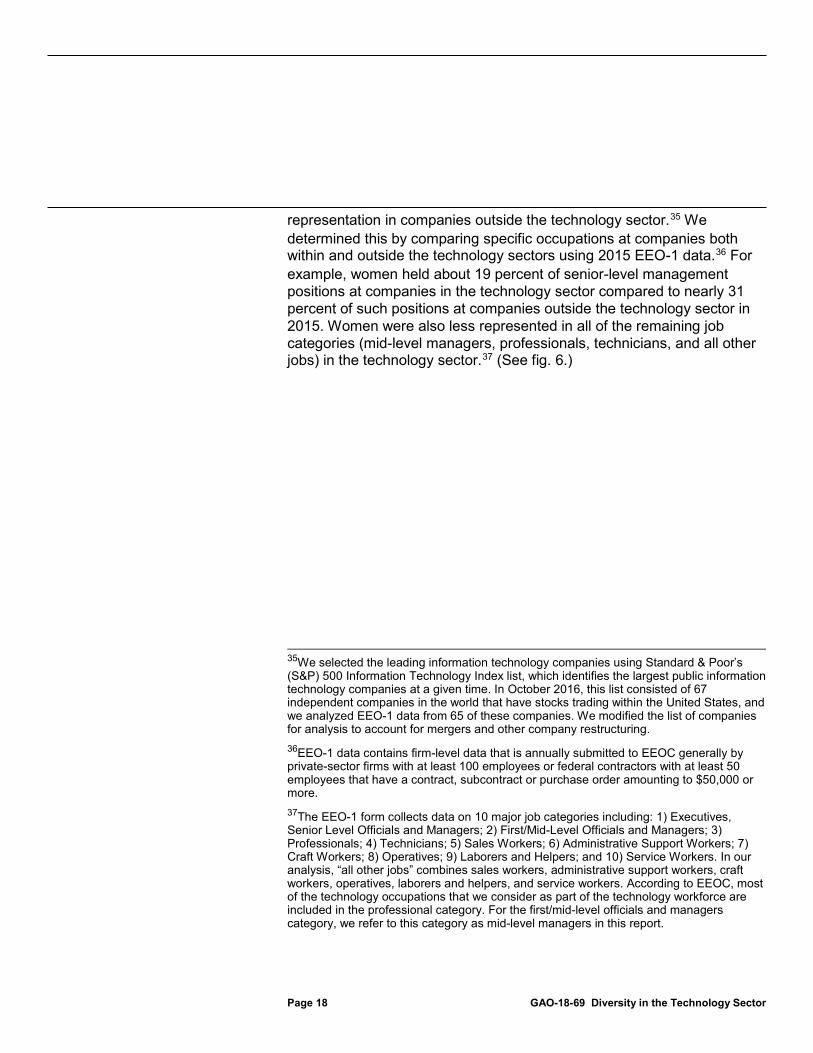
representation in companies outside the technology sector.35 We determined this by comparing specific occupations at companies both within and outside the technology sectors using 2015 EEO-1 data.36 For example, women held about 19 percent of senior-level management positions at companies in the technology sector compared to nearly 31 percent of such positions at companies outside the technology sector in 2015. Women were also less represented in all of the remaining job categories (mid-level managers, professionals, technicians, and all other jobs) in the technology sector.37 (See fig. 6.)
35We selected the leading information technology companies using Standard & Poor’s (S&P) 500 Information Technology Index list, which identifies the largest public information technology companies at a given time. In October 2016, this list consisted of 67 independent companies in the world that have stocks trading within the United States, and we analyzed EEO-1 data from 65 of these companies. We modified the list of companies for analysis to account for mergers and other company restructuring. 36EEO-1 data contains firm-level data that is annually submitted to EEOC generally by private-sector firms with at least 100 employees or federal contractors with at least 50 employees that have a contract, subcontract or purchase order amounting to $50,000 or more. 37The EEO-1 form collects data on 10 major job categories including: 1) Executives, Senior Level Officials and Managers; 2) First/Mid-Level Officials and Managers; 3) Professionals; 4) Technicians; 5) Sales Workers; 6) Administrative Support Workers; 7) Craft Workers; 8) Operatives; 9) Laborers and Helpers; and 10) Service Workers. In our analysis, “all other jobs” combines sales workers, administrative support workers, craft workers, operatives, laborers and helpers, and service workers. According to EEOC, most of the technology occupations that we consider as part of the technology workforce are included in the professional category. For the first/mid-level officials and managers category, we refer to this category as mid-level managers in this report.
Page 19 GAO-18-69 Diversity in the Technology Sector
Figure 6: Percentage of Workers by Gender in Different Job Categories in Companies Within and Outside the Technology Sector, 2015
Note: These percentages were rounded to the nearest whole number. In our analysis, “all other jobs” combines sales workers, administrative support workers, craft workers, operatives, laborers and helpers, and service workers. We selected the leading information technology companies using Standard & Poor’s (S&P) 500 Information Technology Index, which identifies the largest public information technology companies at a given time. In October 2016, this list consisted of 67 independent companies in the world that have stocks trading within the United States, and we analyzed EEO-1 data from 65 of these companies. We modified the list of companies for analysis to account for mergers and other company restructuring. In our analyses, there is overlap between workers in leading technology companies and in the technology sector. However, the leading companies represent multiple lines of business across additional industry codes; therefore the analysis of leading companies includes additional workers outside of the technology industries we identified. See appendix I for more information. There were about 800,000 workers in the analysis for the leading technology companies, and 4.7 million workers in the technology sector analysis.
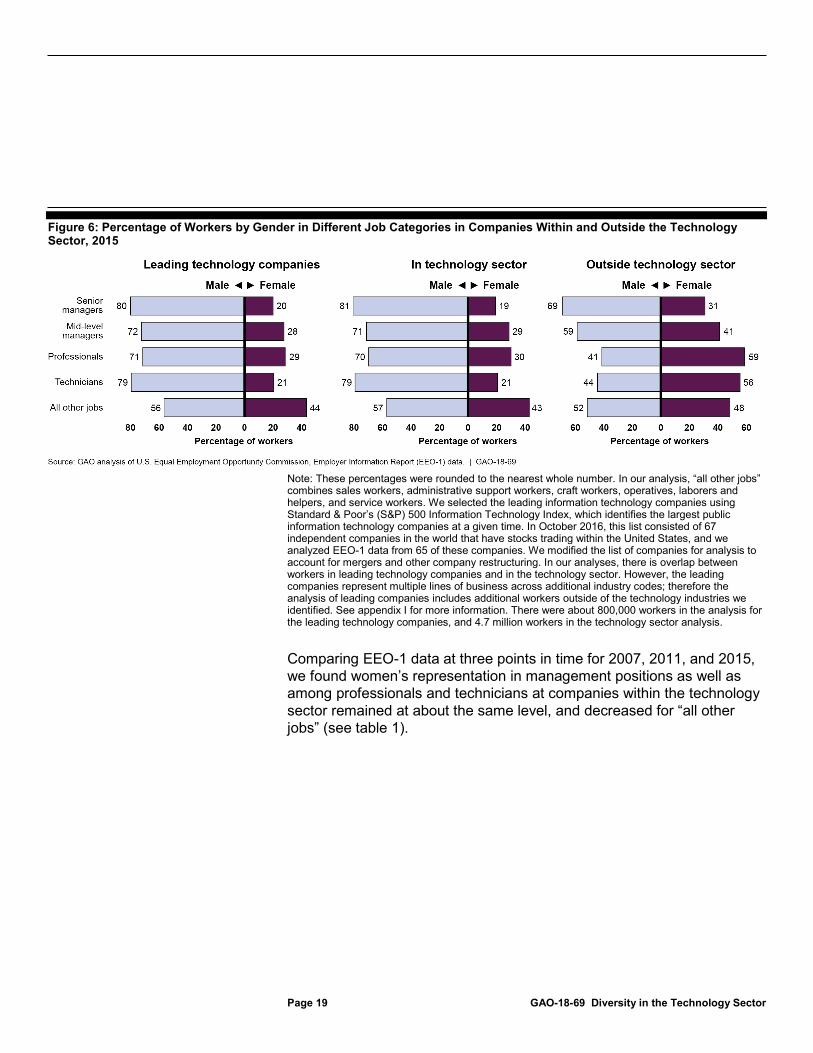
Comparing EEO-1 data at three points in time for 2007, 2011, and 2015, we found women’s representation in management positions as well as among professionals and technicians at companies within the technology sector remained at about the same level, and decreased for “all other jobs” (see table 1).

Page 20 GAO-18-69 Diversity in the Technology Sector
Page 21 GAO-18-69 Diversity in the Technology Sector
Table 1: Percentage of Women Within the Technology Sector in All Job Categories, 2007, 2011, and 2015
Percentage of Women in Job Positions Within the Technology Sector 2007 2011 2015 Senior Officers and Managers 18.0 18.5 19.4 Mid-level Officers and Managers 28.3 27.8 28.8 Professionals 29.8 29.7 30.2 Technicians 21.0 21.9 20.7 All Other Jobs 48.2 44.9 43.0
Source: GAO analysis of U.S. Equal Employment Opportunity Commission, Employer Information Report (EEO-1) data. | GAO-18-69
Note: The percentages were rounded to the first decimal. This analysis includes data from leading technology companies. In our analysis, “all other jobs” combines sales workers, administrative support workers, craft workers, operatives, laborers and helpers, and service workers.
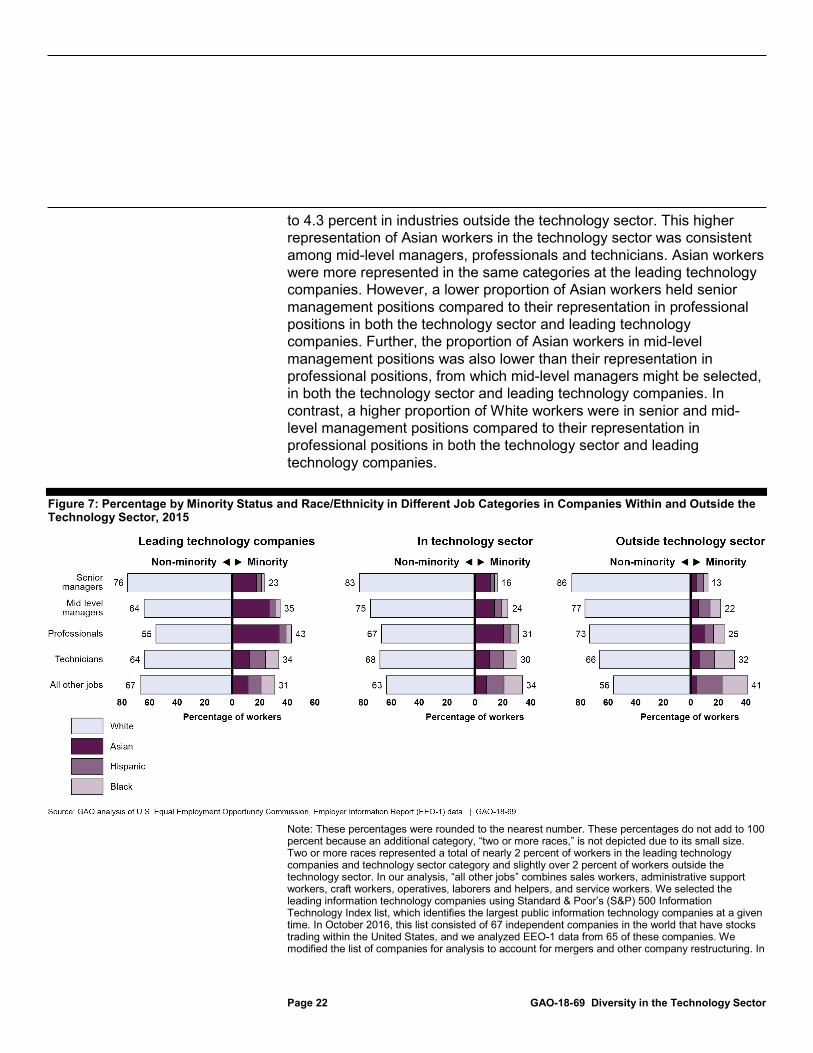
Similar to women, Black and Hispanic workers were less represented across multiple job categories in companies within the technology sector compared to those outside the technology sector (see fig.7).38 For example, 1.8 percent of senior level managers in the technology sector were Black compared to 3.4 percent of senior level managers in all other sectors. Appendix IV provides percentages for each minority group in different job categories within and outside the technology sector. The lower representation of Black workers in the technology sector relative to their representation in other sectors was consistent across all job categories (mid-level managers, professionals, technicians, and “all other jobs”). Hispanic workers were less represented in the technology sector compared to outside the technology sector across all job categories (senior and mid-level managers, professionals, technicians, and “all other jobs”). Compared to their representation across job categories within the technology sector in general, Black and Hispanic workers had slightly greater representation at the leading technology companies in senior management and technician categories, and lower representation among mid-level managers, professionals, and holders of “all other jobs.”
Asian workers comprised a greater proportion of managerial and professional roles in the technology sector than in other sectors, according to our analysis of 2015 EEO-1 data. Asian workers represented 11.0 percent of senior level managers in the technology sector compared
38On the EEO-1 form, employers are directed to report on the number of employees that are Hispanic separately from race categories. For example, an employee may be reported as Hispanic or Black, but not both.
Page 22 GAO-18-69 Diversity in the Technology Sector
to 4.3 percent in industries outside the technology sector. This higher representation of Asian workers in the technology sector was consistent among mid-level managers, professionals and technicians. Asian workers were more represented in the same categories at the leading technology companies. However, a lower proportion of Asian workers held senior management positions compared to their representation in professional positions in both the technology sector and leading technology companies. Further, the proportion of Asian workers in mid-level management positions was also lower than their representation in professional positions, from which mid-level managers might be selected, in both the technology sector and leading technology companies. In contrast, a higher proportion of White workers were in senior and mid-level management positions compared to their representation in professional positions in both the technology sector and leading technology companies.
Figure 7: Percentage by Minority Status and Race/Ethnicity in Different Job Categories in Companies Within and Outside the Technology Sector, 2015
Note: These percentages were rounded to the nearest number. These percentages do not add to 100 percent because an additional category, “two or more races,” is not depicted due to its small size. Two or more races represented a total of nearly 2 percent of workers in the leading technology companies and technology sector category and slightly over 2 percent of workers outside the technology sector. In our analysis, “all other jobs” combines sales workers, administrative support workers, craft workers, operatives, laborers and helpers, and service workers. We selected the leading information technology companies using Standard & Poor’s (S&P) 500 Information Technology Index list, which identifies the largest public information technology companies at a given time. In October 2016, this list consisted of 67 independent companies in the world that have stocks trading within the United States, and we analyzed EEO-1 data from 65 of these companies. We modified the list of companies for analysis to account for mergers and other company restructuring. In
Page 23 GAO-18-69 Diversity in the Technology Sector
our analyses, there is overlap between workers in leading technology companies and in the technology sector. However, the leading companies represent multiple lines of business across additional industry codes; therefore the analysis of leading companies includes additional workers outside of the technology industries we identified. See appendix I for more information. There were about 800,000 workers in the analysis for the leading technology companies, and 4.7 million workers in the technology sector analysis.
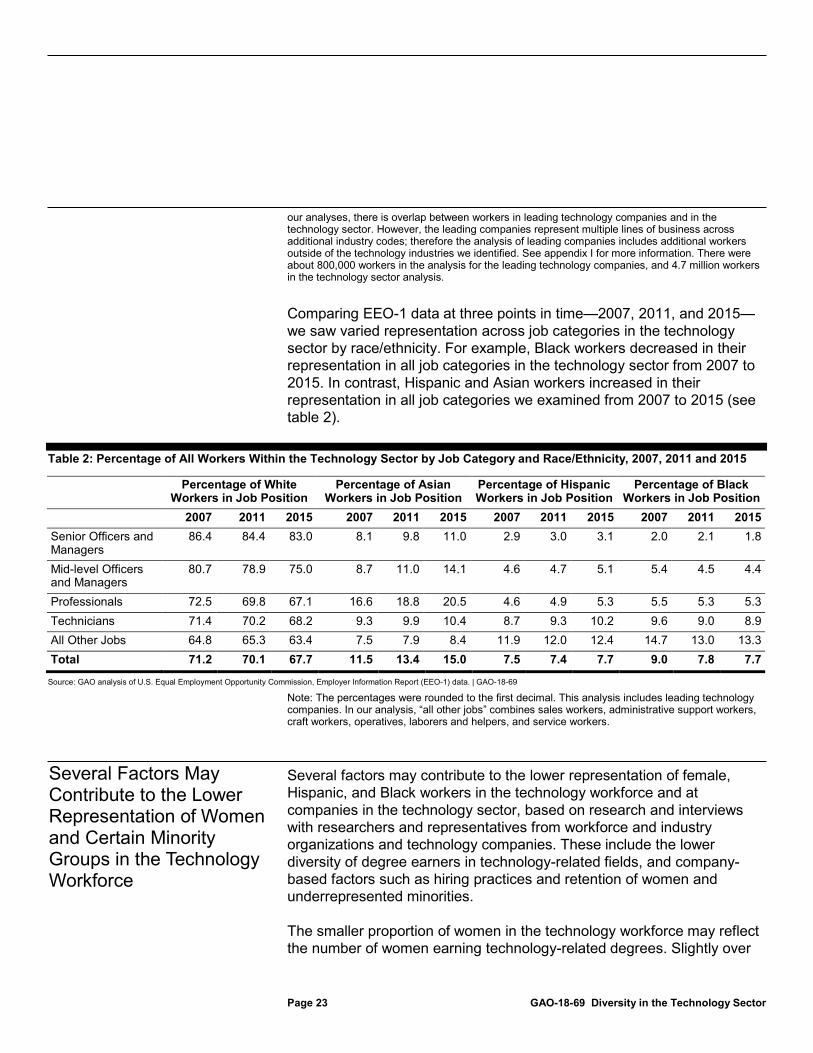
Comparing EEO-1 data at three points in time—2007, 2011, and 2015—we saw varied representation across job categories in the technology sector by race/ethnicity. For example, Black workers decreased in their representation in all job categories in the technology sector from 2007 to 2015. In contrast, Hispanic and Asian workers increased in their representation in all job categories we examined from 2007 to 2015 (see table 2).
Table 2: Percentage of All Workers Within the Technology Sector by Job Category and Race/Ethnicity, 2007, 2011 and 2015
Percentage of White Workers in Job Position
Percentage of Asian Workers in Job Position
Percentage of Hispanic Workers in Job Position
Percentage of Black Workers in Job Position
2007 2011 2015 2007 2011 2015 2007 2011 2015 2007 2011 2015 Senior Officers and Managers
86.4 84.4 83.0 8.1 9.8 11.0 2.9 3.0 3.1 2.0 2.1 1.8
Mid-level Officers and Managers
80.7 78.9 75.0 8.7 11.0 14.1 4.6 4.7 5.1 5.4 4.5 4.4
Professionals 72.5 69.8 67.1 16.6 18.8 20.5 4.6 4.9 5.3 5.5 5.3 5.3 Technicians 71.4 70.2 68.2 9.3 9.9 10.4 8.7 9.3 10.2 9.6 9.0 8.9 All Other Jobs 64.8 65.3 63.4 7.5 7.9 8.4 11.9 12.0 12.4 14.7 13.0 13.3 Total 71.2 70.1 67.7 11.5 13.4 15.0 7.5 7.4 7.7 9.0 7.8 7.7
Source: GAO analysis of U.S. Equal Employment Opportunity Commission, Employer Information Report (EEO-1) data. | GAO-18-69
Note: The percentages were rounded to the first decimal. This analysis includes leading technology companies. In our analysis, “all other jobs” combines sales workers, administrative support workers, craft workers, operatives, laborers and helpers, and service workers.
Several factors may contribute to the lower representation of female, Hispanic, and Black workers in the technology workforce and at companies in the technology sector, based on research and interviews with researchers and representatives from workforce and industry organizations and technology companies. These include the lower diversity of degree earners in technology-related fields, and company-based factors such as hiring practices and retention of women and underrepresented minorities.
The smaller proportion of women in the technology workforce may reflect the number of women earning technology-related degrees. Slightly over
Several Factors May Contribute to the Lower Representation of Women and Certain Minority Groups in the Technology Workforce
Page 24 GAO-18-69 Diversity in the Technology Sector
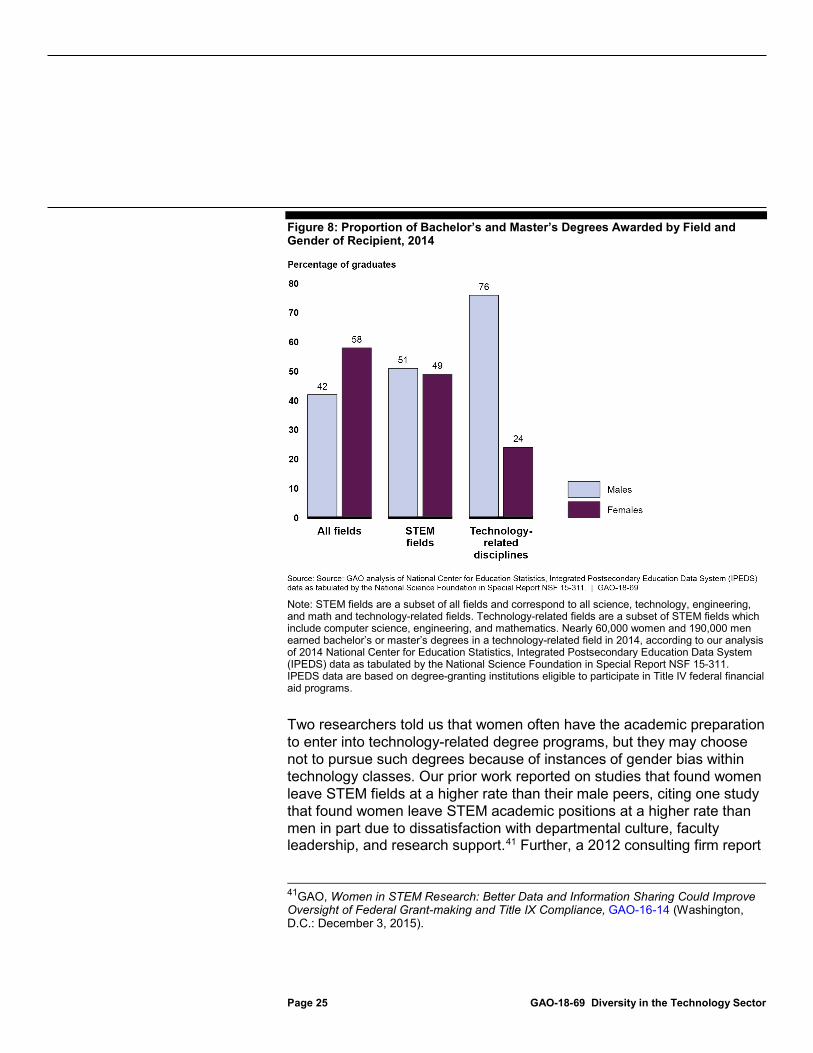
two-thirds of technology workers report having earned their bachelor’s degree in a computer, engineering, mathematics, or technology field.39 However, according to our analysis of 2014 IPEDS data, the percentage of technology-related bachelor’s and master’s degrees earned by women is far less than for men, although women were comparable to men in their receipt of science, technology, engineering, and math (STEM) degrees, and surpassed men in obtaining degrees in all other fields.40 In 2014, about 60,000 women were awarded technology-related bachelor’s or master’s degrees (compared to about 50,000 in 2004) and about 190,000 men were awarded such degrees (compared to about 147,000 in 2004). (See fig. 8.) An estimated 218,000 technology workers were added to the technology workforce in 2015, according to our analysis of 2015 American Community Survey data from the U.S. Census Bureau. In addition, technology degrees are also issued at the associate’s level.
39To conduct this analysis, we analyzed data from the 2014 ACS 1-Year Public Use Microdata Sample on field of degree for bachelor’s degree. We identified bachelor’s degrees that are technology-oriented as those within the following four fields: computing, engineering, mathematics, and technology. 40We relied on analysis of IPEDS data tabulated by the National Science Foundation, which published a report in 2015 using these data on the representation of different groups in science and engineering education and employment. See National Science Foundation, National Center for Science and Engineering Statistics, Women, Minorities, and Persons with Disabilities in Science and Engineering: 2015. Special Report NSF 15-311. Arlington, VA. Available at www.nsf.gov/statistics/wmpd/.
Page 25 GAO-18-69 Diversity in the Technology Sector
Figure 8: Proportion of Bachelor’s and Master’s Degrees Awarded by Field and Gender of Recipient, 2014
Note: STEM fields are a subset of all fields and correspond to all science, technology, engineering, and math and technology-related fields. Technology-related fields are a subset of STEM fields which include computer science, engineering, and mathematics. Nearly 60,000 women and 190,000 men earned bachelor’s or master’s degrees in a technology-related field in 2014, according to our analysis of 2014 National Center for Education Statistics, Integrated Postsecondary Education Data System (IPEDS) data as tabulated by the National Science Foundation in Special Report NSF 15-311. IPEDS data are based on degree-granting institutions eligible to participate in Title IV federal financial aid programs.
Two researchers told us that women often have the academic preparation to enter into technology-related degree programs, but they may choose not to pursue such degrees because of instances of gender bias within technology classes. Our prior work reported on studies that found women leave STEM fields at a higher rate than their male peers, citing one study that found women leave STEM academic positions at a higher rate than men in part due to dissatisfaction with departmental culture, faculty leadership, and research support.41 Further, a 2012 consulting firm report
41GAO, Women in STEM Research: Better Data and Information Sharing Could Improve Oversight of Federal Grant-making and Title IX Compliance, GAO-16-14 (Washington, D.C.: December 3, 2015).
Page 26 GAO-18-69 Diversity in the Technology Sector
found that businesses viewed as male-dominated tended to attract fewer women at the entry level.42
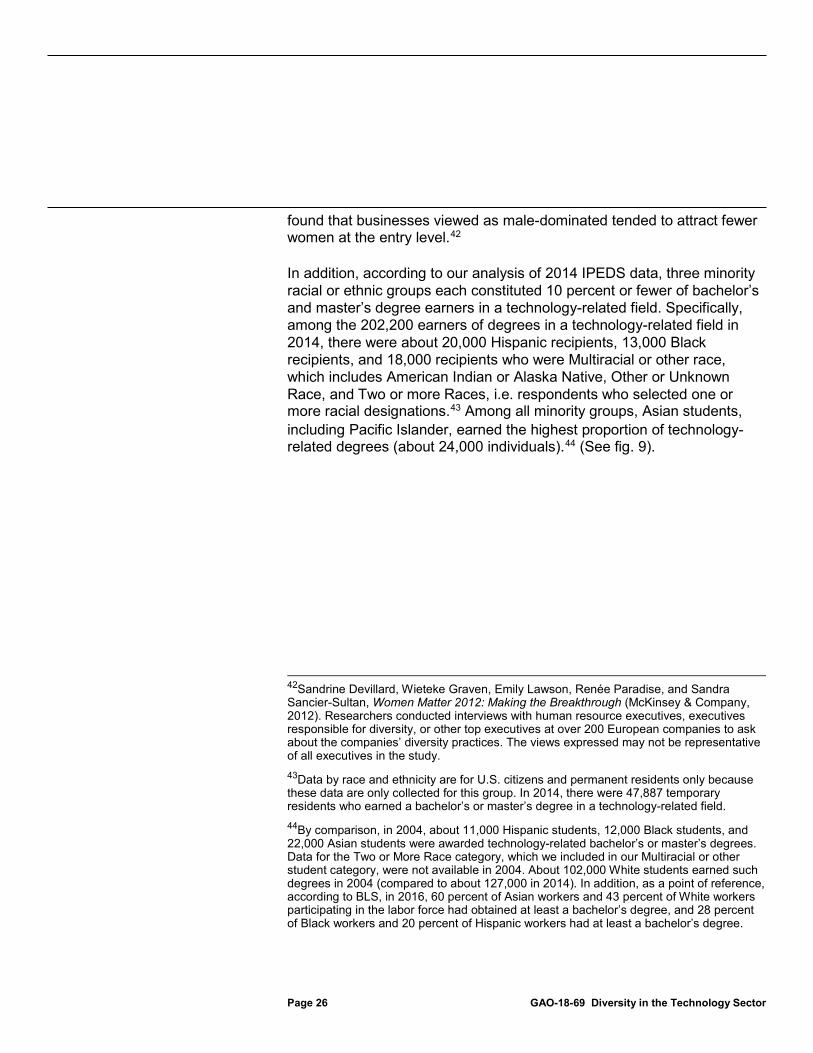
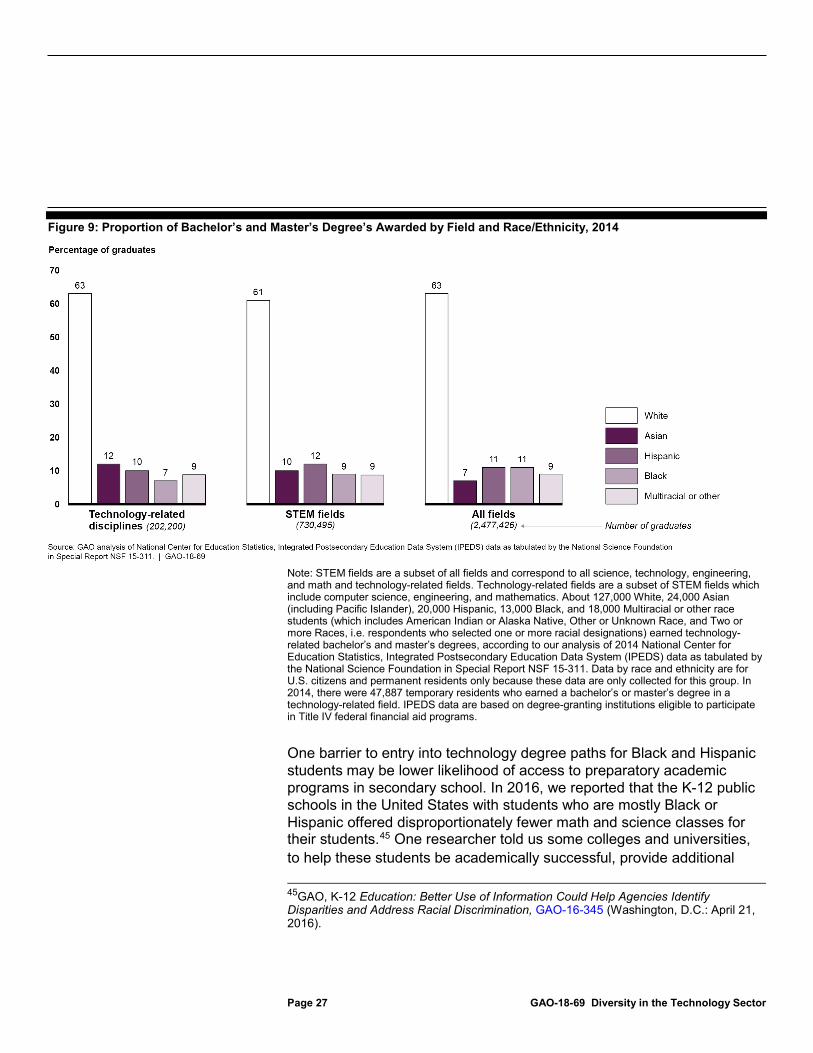
In addition, according to our analysis of 2014 IPEDS data, three minority racial or ethnic groups each constituted 10 percent or fewer of bachelor’s and master’s degree earners in a technology-related field. Specifically, among the 202,200 earners of degrees in a technology-related field in 2014, there were about 20,000 Hispanic recipients, 13,000 Black recipients, and 18,000 recipients who were Multiracial or other race, which includes American Indian or Alaska Native, Other or Unknown Race, and Two or more Races, i.e. respondents who selected one or more racial designations.43 Among all minority groups, Asian students, including Pacific Islander, earned the highest proportion of technology-related degrees (about 24,000 individuals).44 (See fig. 9).
42Sandrine Devillard, Wieteke Graven, Emily Lawson, Renée Paradise, and Sandra Sancier-Sultan, Women Matter 2012: Making the Breakthrough (McKinsey & Company, 2012). Researchers conducted interviews with human resource executives, executives responsible for diversity, or other top executives at over 200 European companies to ask about the companies’ diversity practices. The views expressed may not be representative of all executives in the study. 43Data by race and ethnicity are for U.S. citizens and permanent residents only because these data are only collected for this group. In 2014, there were 47,887 temporary residents who earned a bachelor’s or master’s degree in a technology-related field. 44By comparison, in 2004, about 11,000 Hispanic students, 12,000 Black students, and 22,000 Asian students were awarded technology-related bachelor’s or master’s degrees. Data for the Two or More Race category, which we included in our Multiracial or other student category, were not available in 2004. About 102,000 White students earned such degrees in 2004 (compared to about 127,000 in 2014). In addition, as a point of reference, according to BLS, in 2016, 60 percent of Asian workers and 43 percent of White workers participating in the labor force had obtained at least a bachelor’s degree, and 28 percent of Black workers and 20 percent of Hispanic workers had at least a bachelor’s degree.
Page 27 GAO-18-69 Diversity in the Technology Sector
Figure 9: Proportion of Bachelor’s and Master’s Degree’s Awarded by Field and Race/Ethnicity, 2014
Note: STEM fields are a subset of all fields and correspond to all science, technology, engineering, and math and technology-related fields. Technology-related fields are a subset of STEM fields which include computer science, engineering, and mathematics. About 127,000 White, 24,000 Asian (including Pacific Islander), 20,000 Hispanic, 13,000 Black, and 18,000 Multiracial or other race students (which includes American Indian or Alaska Native, Other or Unknown Race, and Two or more Races, i.e. respondents who selected one or more racial designations) earned technology-related bachelor’s and master’s degrees, according to our analysis of 2014 National Center for Education Statistics, Integrated Postsecondary Education Data System (IPEDS) data as tabulated by the National Science Foundation in Special Report NSF 15-311. Data by race and ethnicity are for U.S. citizens and permanent residents only because these data are only collected for this group. In 2014, there were 47,887 temporary residents who earned a bachelor’s or master’s degree in a technology-related field. IPEDS data are based on degree-granting institutions eligible to participate in Title IV federal financial aid programs.
One barrier to entry into technology degree paths for Black and Hispanic students may be lower likelihood of access to preparatory academic programs in secondary school. In 2016, we reported that the K-12 public schools in the United States with students who are mostly Black or Hispanic offered disproportionately fewer math and science classes for their students.45 One researcher told us some colleges and universities, to help these students be academically successful, provide additional 45GAO, K-12 Education: Better Use of Information Could Help Agencies Identify Disparities and Address Racial Discrimination, GAO-16-345 (Washington, D.C.: April 21, 2016).
Page 28 GAO-18-69 Diversity in the Technology Sector
academic support such as tutoring to help bridge knowledge gaps. To address the uneven access to preparatory math and science classes, representatives from five technology companies told us they have started to invest in exposing Black and Hispanic children to technology occupations by, for example, developing online resources targeted to them and their parents and creating partnerships with secondary schools to improve their academic preparation in computer science.
However, we have previously also reported that the number of students graduating with STEM degrees may not be a good measure of the supply of STEM workers because students often pursue careers in fields different from the ones they studied.46 For example, a lower percentage of women who obtained technology-related degrees became technology workers compared to men who earned the same degrees, according to our analysis of 2015 ACS data. Specifically, among women who earned technology degrees, an estimated 33 percent worked as a technology worker compared to 45 percent of men who earned technology degrees.
Several representatives we interviewed from workforce and industry organizations and technology companies told us that recruitment practices may also have affected diversity in the technology workforce. For example, representatives from three workforce and industry organizations said technology companies tend to recruit from a select number of universities and colleges, thereby limiting their pool of potential applicants. To address this, representatives from several of the technology companies we interviewed told us they had changed recruitment practices and offered internships targeted to underrepresented groups. For example, representatives of four technology companies told us that their companies had expanded recruitment to include more schools. Representatives from two companies told us they offer programs such as summer and semester internships for which the company actively recruits from Historically Black Colleges and Universities and other specific schools to increase its pool of diverse candidates.
In addition, representatives from workforce organizations and technology companies discussed concerns and strategies to address companies’ hiring practices and internal cultures that may limit workforce diversity. 46GAO, Science, Technology, Engineering, and Mathematics Education: Assessing the Relationship between Education and the Workforce, GAO-14-374 (Washington, D.C.: May 8, 2014).
Page 29 GAO-18-69 Diversity in the Technology Sector
For example, one of these representatives said that technology companies often offer financial incentives to current employees to make referrals for new hires, which can result in reliance on social networks. These networks may be largely comprised of the same race and this practice therefore makes it harder for potential candidates from demographically different groups to have their resumes reviewed. Another workforce organization representative reported that some hiring managers filter out eligible candidates if their background and qualifications are not the same as those of previously successful employees. To address these concerns, representatives from one technology company told us that they had moved away from depending on referrals since this practice may result in leaders hiring people within their own networks, which generally does not increase diversity of gender or race/ethnicity. In addition, representatives from another company said they plan to begin reviewing resumes with names removed to limit bias by the reviewer. Further, representatives we interviewed from three technology companies told us they offer training to employees to help employees identify their own, unconscious biases. Other factors may affect retention of women and underrepresented minorities. For example, a representative from a workforce organization said that women leave technology occupations at a higher rate than men because they feel as if they have not been given the same opportunities for promotion and advancement within the company. A 2016 study that examined women in engineering and science found that women’s concerns about pay and promotion are often an issue in male-dominated fields regardless of the industry. Further, this study found that retention difficulties become more severe as the share of men in the workforce increased and that affected women’s pay and promotion.47 Representatives from one company told us another challenge is the lack of Black workers at the top levels, which might make it more difficult for Black employees in particular to see a leadership path. Representatives we interviewed from five technology companies told us they had implemented efforts to increase retention and promotion rates among minority and female workers, for example, by developing a diversity and inclusion newsletter, employee resource groups with executive
47Jennifer Hunt, “Why do Women Leave Science and Engineering?” ILR Review,69(1)(2016).
Page 30 GAO-18-69 Diversity in the Technology Sector
sponsors,48 and internal training and classes for employees to improve their readiness to be promoted. Representatives from five technology companies told us that commitment of top leadership is an important factor that can help women and underrepresented minorities in the technology sector. For example, representatives from one company told us that top management support for diversity efforts, such as setting hiring goals, can help move a company in the direction of achieving representation goals and that leadership is very important to this effort. Representatives from several companies told us that there is often a business case for such changes: These companies work in a diverse, global environment and strive to make better products for diverse users. However, our prior work on workforce diversity in the financial services sector found that some diversity initiatives faced challenges gaining the "buy-in" of key employees, such as the middle managers who are often responsible for implementing such programs.49
48Employee resource groups are employee-led groups formed around common interests, issues and/or a common bond or background. 49GAO, Financial Services Industry: Overall Trends in Management-Level Diversity and Diversity Initiatives, 1993-2008, GAO-10-736T (Washington, D.C.: May 2010).
EEOC and OFCCP Have Taken Steps to Oversee Equal Employment Opportunity and Affirmative Action Requirements, but Face Limitations
Page 31 GAO-18-69 Diversity in the Technology Sector
According to EEOC officials, EEOC primarily oversees compliance with equal employment opportunity requirements by investigating workers’ individual charges of employment discrimination filed against companies. EEOC has publicly acknowledged the low levels of diversity in the technology sector.50 However, we were unable to identify a specific number of charges received by EEOC against companies in industries that are part of this sector because EEOC does not require investigators to record the industry of the charged company. EEOC’s database of charges and enforcement actions—the Integrated Mission System (IMS)—has a data field for the North American Industry Classification System (NAICS) industry code, the standard used by federal statistical agencies in classifying business establishments. However, we found that it is completed for only about half the entries in the system.51 EEOC officials in both the San Francisco and New York district offices told us that, while they cannot readily identify individual charges against technology companies, they believe they have received far fewer charges against technology companies than they would have expected given the public attention to the issue of diversity in the technology sector.52 In terms of systemic cases, according to EEOC, as of June 2017, the commission had 255 systemic cases pending since fiscal year 2011 50Transcript of Chair Jenny Yang’s remarks, EEOC Meeting, May 18, 2016. 51Industry is not a mandatory field for investigators to complete in the investigations data system. We attempted to assess the number of charges against technology companies that EEOC had received by matching charges recorded by EEOC with a list of about 43,500 federal technology contractor establishments on the basis of company name, address, and Zip code. This analysis found 2,835 matching charges for fiscal years 2011-2016 (compared to about 567,000 charges filed against companies in total during this timeframe). Among other limitations, this approach to estimating charges submitted to EEOC against federal technology contractors likely excludes charges citing contractor facility addresses other than that of the contracting office. To address this limitation, we conducted an additional match of these two sets of records using only company name. This match identified over 5 times the number of charges. Neither method would have captured charges against technology companies that are not federal contractors. 52In the past few years, a number of news articles have cited concerns with diversity in the technology sector. See, for example, The Atlantic “Why is Silicon Valley So Awful to Women?” April 2017, and Bloomberg.com “Why Doesn’t Silicon Valley Hire Black Coders?” January 21, 2016.
EEOC and OFCCP Have Taken Steps to Oversee Compliance in the Technology Sector
EEOC
Page 32 GAO-18-69 Diversity in the Technology Sector
involving technology companies (13 of these were initiated as commissioner charges and 8 were directed investigations involving age discrimination or pay parity issues).53 Officials from the New York region reported that they had seen an increase in systemic cases against technology companies in the past 3 years, largely involving practices of information technology staffing firms.
Several EEOC officials we interviewed noted that technology workers may be initiating few complaints at the federal level due to factors such as fear of retaliation from employers or the availability of other employment or legal options. According to EEOC officials, fear of retaliation can affect charges across sectors and, given the growth in the technology workforce, an individual who feels discriminated against may simply leave the company because there are many other opportunities for individuals with technical skills. They also said that technology workers may generally have greater wealth and can afford to hire private attorneys to sue in state court rather than go through the EEOC. Moreover, they said that some states, including California, have stronger employment discrimination laws that allow for better remedies than federal laws, which could lead employees to file charges at the state level rather than with the EEOC.
In addition, EEOC has acknowledged in a 2016 report that binding arbitration policies, which require individuals to submit their claims to private arbiters rather than courts, can also deter workers from bringing discrimination claims to the agency, leaving significant violations in entire segments of the workforce unreported.54 The report stated that an
53Given the smaller number of systemic cases compared to individual charges, EEOC was able to identify systemic cases against technology companies. To identify these cases, EEOC defined “technology company” using the same NAICS codes that were used in their report on diversity in the high technology sector. See U.S. Equal Employment Opportunity Commission, Diversity in High Tech, May 2016. For charges without a NAICS code, the officials looked for another charge on the list against the same company which listed a NAICS code. If an employer was on the list and no NAICS code was associated with any charge against it, the officials conducted a web search of the company to determine if it appeared to be similar to technology companies included on the list based on the associated NAICS code. The commission also reported 246 resolved systemic cases that were filed since fiscal year 2011 involving technology companies. Six of these were initiated as Commissioner Charges and 13 were directed charges involving age discrimination or pay parity issues. 54U.S. Equal Employment Opportunity Commission, Advancing Opportunity: A Review of the Systemic Program of the US Equal Employment Opportunity Commission (Washington, D.C.: July 7, 2016).
Page 33 GAO-18-69 Diversity in the Technology Sector
increasing number of arbitration policies have added bans on class actions that prevent individuals from joining together to challenge practices in any forum. The report concluded that the use of arbitration policies hinders EEOC’s ability to detect and remedy potential systemic violations. Researchers report that the use of such clauses has grown and data on federal civil filings for civil rights employment cases reflect a marked reduction in the number of such filings.55
Beyond pursuing charges, EEOC has taken some steps to address diversity in the technology sector including research and outreach efforts. In May 2016, citing the technology sector as a source for an increasing number of U.S. jobs, EEOC released a report analyzing EEO-1 data on diversity in the technology sector in tandem with a commission meeting raising awareness on the topic.56 In addition, EEOC’s fiscal year 2017-2021 Strategic Enforcement Plan identified barriers to hiring and recruiting in the technology sector as a strategic priority. EEOC has also been involved in outreach efforts with the technology sector. For example, the EEOC Pacific Region described more than 15 in-person or webinar events since 2014 in collaboration with OFCCP and local organizations focused on diversity in the technology sector. The topics of these events included equity in pay and the activities of these two agencies in enforcing nondiscrimination laws. Finally, in fall 2016, EEOC initiated an internal working group to identify practices to help improve gender and racial diversity in technology, but as of June 2017 had no progress to report.
OFCCP’s regulations require covered federal contractors to take proactive steps to ensure equal employment opportunity. OFCCP annually conducts routine evaluations of selected federal contractors, which includes those in the technology sector, for compliance with federal
55Consistent with this trend, data from the Administrative Office of the U.S. Courts on civil filings in U.S. District Courts indicate that lawsuits filed related to “Civil Rights – Employment” decreased 45 percent moving from 21,152 to 11,687 cases between 2001 and 2016, even as the overall number of civil filings for all purposes increased by about 8 percent, moving from 254,523 to 274,552. 56EEOC, Diversity in High Tech (Washington, D.C.: May 2016).
OFCCP
Page 34 GAO-18-69 Diversity in the Technology Sector
nondiscrimination and affirmative action requirements.57 To the extent that technology contractors are selected for evaluation through OFCCP’s normal selection process, these contractors are assessed for compliance with nondiscrimination and affirmative action laws as are other selected contractors. While evaluation of technology contractors occurs in the course of OFCCP’s routine activities, OFCCP does not currently use type of industry as a selection factor, according to officials. We also found that few (less than 1 percent) of OFCCP’s 2,911 closed technology contractor evaluations from fiscal years 2011 through 2016 resulted in discrimination violations, though 13 percent resulted in other violations, such as record-keeping violations and failure to establish an affirmative action program (AAP). An AAP is a key tool OFCCP requires contractors to complete to ensure equal employment opportunity. The remaining 86 percent of evaluations either found no violations or ended in administrative closure.58 Technology contractor evaluations that had discrimination violations resulted in back pay, salary adjustments, or other benefits totaling more than $4.5 million for 15,316 individuals (averaging about $300 per award) for fiscal years 2011 through 2016.59 The vast majority of discrimination violations were on the basis of gender or race/ethnicity rather than disability or veteran status. Corrective actions OFCCP identified for federal technology contractors over this timeframe also included requiring contractors to fill a total of 410 job vacancies as they arise with applicants who had been denied employment on the basis of discrimination. In
57According to our prior report, OFCCP evaluations include, among other things, a determination of whether there are indicators of potential discrimination or violations that will require an onsite evaluation. In addition to statistical and anecdotal evidence of discrimination, indicators of potential discrimination or other violations also include, but are not limited to: patterns of individual discrimination, patterns of systemic discrimination, and patterns of major technical violations such as recordkeeping deficiencies or failure to maintain an AAP. The final determination of discrimination is made on a case-by-case basis, based on multiple factors. To look for indicators of potential discrimination, OFCCP conducts common statistical tests. GAO-16-750. 58Administrative closure means OFCCP must administratively close the complaint investigation for a variety of reasons, such as lack of jurisdiction or issues with the complainant filing timely or providing requested information. According to GAO’s prior work on OFCCP, in fiscal years 2010 through 2015, about 78 percent of all evaluations found no violations and about 2 percent had discrimination findings. GAO-16-750. 59According to OFCCP, in 2009-2016 the agency obtained over $85.9 million in monetary relief for nearly 147,000 employees and job seekers (an average of $584 per award).
Page 35 GAO-18-69 Diversity in the Technology Sector
addition, OFCCP recently filed three complaints against technology companies.60
According to our analysis, OFCCP conducted evaluations on 36 of the 65 leading technology companies from fiscal year 2011 through fiscal year 2016. During this timeframe there were 272 reviews of establishments—physical business locations—affiliated with these 36 companies. Based on these evaluations, 15 of the 36 companies had administrative violations, and 2 of the 36 also had discrimination violations. As a result of the discrimination findings against these leading technology companies, 541 individuals received monetary benefits totaling $783,387 (an average of $1,448 per award).
In terms of other steps to conduct oversight of the technology sector, OFCCP officials in the Pacific Region said they are hiring compliance officers with legal training to be better able to address needs for reviews in the technology sector, such as responding to lawyers representing technology contractors. Officials in both the Pacific and Northeast regions work closely with statisticians and labor economists on their cases, an effort officials said has increased over the past few years. OFCCP has also requested funding in its fiscal year 2018 congressional budget justification to establish centers in San Francisco and New York that would develop expertise to handle large, complex compliance evaluations in specific industries, including information technology.
60These complaints were filed with the Department of Labor’s Office of Administrative Law Judges. OFCCP filed a complaint against Palantir Technologies in September 2016 alleging that the company discriminated against Asian applicants in the hiring and selection process for engineering positions. OFCCP entered into a consent decree in 2017 to settle its complaint against Palantir, which resulted in nearly $1.7 million in back wages and other monetary relief for the affected individuals. OFCCP filed another complaint against Oracle America Inc. in January 2017 to resolve allegations of systemic compensation discrimination, among other issues. As of July 2017, this complaint was ongoing. Finally, OFCCP filed a complaint against Google in December 2016 alleging that the company was denying access to compensation records that OFCCP had requested as part of its compliance evaluation. In July 2017, an administrative law judge ruled that Google must provide OFCCP with some records, but denied requests for other records as being overly broad and unduly burdensome. OFCCP filed exceptions to the decision with the Administrative Review Board in August 2017 and the matter is currently pending there.
Page 36 GAO-18-69 Diversity in the Technology Sector
We found that by not requiring an industry code in its investigations data, EEOC cannot analyze charge data by industry to help identify investigation and outreach priorities, in contradiction to EEOC strategic planning documents and EEOC Inspector General reports, which have emphasized the importance of doing so. By not requiring the use of the NAICS code for each entry in IMS, EEOC is limited in its ability to use these data for the purposes of identifying charges by industry sector and conducting sector-related analyses. Officials were aware of substantial gaps in coding of charges by industry and acknowledged limitations in the commission’s ability to analyze its investigations data by industry. However, officials expressed concern that routinely creating more complete records of the companies against which charges had been filed would require investigators to divert attention from their efforts to investigate charges. EEOC officials explained that the charging party provides initial information on the respondent company and requiring EEOC personnel to generate this information would slow down the process. They said their priority is to investigate individual charges, not to address larger trends or target specific industries.
In contrast, a number of EEOC reports have documented the value of analyzing charge data by industry to focus the agency’s outreach efforts and resource use. For example, EEOC’s Research and Data Plan for 2016-2019 notes:
“The Strategic Enforcement Plan recommends using EEOC data to allow our enforcement and outreach efforts to focus on areas of significant concern. This might include tailoring outreach efforts for industries that experience greater likelihood of certain charges or informing enforcement decisions based on knowledge that certain industries have persistent problems, such as harassment. The data maintained in IMS provide a rich resource of information that can be used to explore the characteristics of industries that appear to have higher levels of certain allegations than comparative industries.”
EEOC Cannot Analyze Charge Data by Industry to Identify Priorities and OFCCP Faces Challenges to Oversight of Technology Companies
EEOC
Page 37 GAO-18-69 Diversity in the Technology Sector
In addition, reports completed by the Urban Institute for the EEOC Office of Inspector General in 2013 and 2015 similarly recommended analysis of charge data, including by industry, to help identify priorities and measure performance.61
While EEOC has plans to review a year of IMS data to clean it and determine how best to add missing industry codes, among other objectives, officials could not provide a specific timeframe for when this review would begin and end. Standards for internal control in the federal government state that management should use quality information to achieve the agency’s objectives and objectives should be defined in specific terms so they are understood at all levels of the entity. This involves clearly defining what is to be achieved, who is to achieve it, how it will be achieved, and the time frames for achievement.62 Efforts to scrub these data and identify missing codes could help EEOC determine how to collect industry information on an ongoing basis for all entries. Doing so would also help EEOC determine the level of NAICS code that would be feasible and useful for investigators to identify and input into IMS.63 Without analyzing its data on charges across industries, EEOC’s ability to proactively identify priorities for its outreach and enforcement resource use is limited.
We found that OFCCP also faces challenges that may hinder the agency’s oversight of technology companies. Specifically, OFCCP reported facing delays in receiving information from federal contractors, including technology companies, but has not yet evaluated whether its
61Evaluation of EEOC’s Outreach and Education, Urban Institute (Washington, D.C.: May 2015) found that district staff reported they did not look at charge data in a systematic way to help develop their priority areas for outreach and education activities. The report recommended EEOC provide support to districts to analyze charge data among various categories, including industry, to help districts identify potential trends, opportunities, and priorities. Evaluation of EEOC’s Performance Measures, Urban Institute (Washington, D.C.: March 2013) recommended that EEOC should provide information on outcome measures to managers and district offices by key breakout categories, including industry code, to ensure accountability, better allocate resources, and optimize effectiveness. 62GAO, Standards for Internal Control in the Federal Government, GAO-14-704G (Washington, D.C.: September 2014). 63The North American Industry Classification System (NAICS) is the standard used by federal statistical agencies in classifying business establishments. The NAICS system has six levels of industry classification, with the smallest level (2-digit code) providing the most general industry classification, and the largest level (6-digit) providing the most specific classification.
OFCCP
Page 38 GAO-18-69 Diversity in the Technology Sector
own policies and practices also impede its efforts to hold federal technology contractors responsible for the legal requirements to take affirmative action and not discriminate against protected groups. In addition, OFCCP regulations do not require federal contractors to disaggregate data for the purpose of determining placement goals for hiring, which may hinder contractors’ efforts to implement effective affirmative action programs.
OFCCP has not analyzed delays in obtaining information from contractors
OFCCP officials told us that they face delays in obtaining complete, accurate, and timely documentation from federal contractors, including technology companies, as part of the compliance review process. They said this limited their access to critical information and hindered OFCCP’s ability to determine whether discrimination had occurred. Officials in the Pacific Region reported that when issues are identified during OFCCP’s initial review that will require additional data, the data requests can be extensive. Consequently, technology contractors are taking longer to submit complete and accurate data that are needed to conduct analyses of the contractor’s workforce. In addition, officials in both the Pacific and Northeast regions reported that companies may not provide raw data as requested, or provide access to employees for OFCCP to interview, which is part of the compliance review process. Using 2015 OFCCP compliance evaluation data, we previously reported that close to 85 percent of contractor establishments across all sectors did not submit an AAP within 30 days of being scheduled for an OFCCP compliance evaluation, as required by OFCCP policy.64 Officials told us of the potential need for a more flexible set of investigatory tools or sanctions, such as subpoena power to speed up data-gathering or penalties for delays in providing information, in order to obtain accurate and timely information. In the case of incomplete data, OFCCP officials said one option is to enter into an agreement with the contractor whereby the contractor will gather the missing data, and OFCCP will monitor the contractor’s efforts and review detailed records at a later date. However, they said that such an agreement could give the contractor an opportunity to modify the data in the contractor’s favor. Currently, OFCCP’s primary
64GAO-16-750.
Page 39 GAO-18-69 Diversity in the Technology Sector
sanction is the threat of debarment, which makes a company ineligible to receive future federal contracts.65
At the same time, OFCCP officials acknowledged there may additionally be delays in their own review processes. In prior work, we’ve reported concerns by contractors and industry groups about lengthy and expansive OFCCP evaluations.66 However, OFCCP has not analyzed its data on closed evaluations to assess the cause of delays, which would help determine whether changes should be made to its internal processes or if stronger sanctions to obtain information from contractors are needed. Internal control standards state that management should identify, analyze, and respond to risks related to achieving its objectives. Further, it states that management should design appropriate mechanisms to enforce its directives to achieve those objectives and address related risks.67 Without more information on the root cause of the delays, these delays may continue, straining resources and inhibiting OFCCP’s efforts to identify potential discrimination.
OFCCP guidance for placement goals does not address specific minority groups
OFCCP regulations do not require federal contractors to disaggregate data for the purpose of determining placement goals for hiring, which may hinder contractors’ efforts to implement effective affirmative action programs. Federal contractors are required to prepare an AAP which is described as follows in OFCCP regulations:
“An affirmative action program is a management tool designed to ensure equal employment opportunity. A central premise underlying affirmative action is that, absent discrimination, over time a contractor’s workforce, generally, will reflect the gender, racial and ethnic profile of the labor pools from which the contractor recruits and selects. Affirmative action programs contain a diagnostic component which includes a number of quantitative analyses designed to evaluate the composition of the workforce of the contractor and compare it to the composition of the relevant labor pools. Affirmative action programs also include action-
6541 C.F.R. § 60-1.27(b). According to OFCCP officials, debarments are infrequent because they are a last resort. Our prior work found there was on average, fewer than one debarment per year since fiscal year 2010. GAO-16-750. 66GAO-16-750. 67GAO-14-704G.
Page 40 GAO-18-69 Diversity in the Technology Sector
oriented programs. If women and minorities are not being employed at a rate to be expected given their availability in the relevant labor pool, the contractor’s affirmative action program includes specific practical steps designed to address this underutilization.” 68
OFCCP’s regulations also specify the contents of AAPs, which help the contractor to ultimately determine whether the percentage of minorities and women in each job group is consistent with the availability of minorities and women for those job groups.69 If not, then the contractor must create a placement goal for underrepresented groups. The regulations require contractors to provide disaggregated race and ethnicity data for some of the contents of the AAP, such as identifying the demographic breakdown of employees in order to create an organizational profile.70 The organizational profile shows the total number of male and female employees by specific group and depicts the staffing pattern within the establishment, which can help identify organizational units in which women or minorities are underrepresented or concentrated.71 However, for other requirements, such as creating placement goals, which are reasonably attainable objectives or targets to make the affirmative action program work, the regulations direct contractors to establish a single goal for all minorities.72 Specifically, with regard to identifying a need for a placement goal, the regulations state:
“The placement goal-setting process . . . contemplates that contractors will, where required, establish a single goal for all minorities. In the event of a substantial disparity in the utilization of a particular minority group or in the utilization of women or women of a particular minority group, a contractor may be required to establish separate goals for those groups.”
According to OFCCP officials, a contractor may be required to establish separate goals for particular minority groups as part of a compliance 6841 C.F.R. § 60-2.10. 6941 C.F.R. § 60-2.15(a). 7041 C.F.R. § 60-2.11. 71When compiling an organizational profile, companies must list employees by gender in each of the following groups: Blacks, Hispanics, Asians/Pacific Islanders, and American Indians/Alaskan Natives. 7241 C.F.R. § 60-2.16(d). The regulations require contractors to conduct a job group analysis and to compare the percentage of minorities and women in each job group with the availability for those job groups. 41 C.F.R. §§ 60-2.12 – 60-2.15.
Page 41 GAO-18-69 Diversity in the Technology Sector
review. We found, however, that OFCCP’s regulations do not require federal contractors to disaggregate demographic data for the purpose of establishing placement goals in their AAP. This may hinder their efforts to implement effective AAPs, which are designed to assist the company in achieving a workforce that reflects the gender, racial, and ethnic profile of the labor pools from which the contractor recruits and selects. OFCCP officials in headquarters and in the field said, based on their experience evaluating companies’ compliance, it was not common for companies to have placement goals disaggregated by race and ethnicity in their AAPs. A diversity and inclusion officer we interviewed from one large technology contractor noted that the requirement in the AAP to identify the need for placement goals for minorities as a whole does not address underrepresentation in certain minority groups. According to the officer, the company does not count Asian workers in setting the company’s diversity goals because Asians are well represented and the company believes it should set a placement goal for groups for which the company knows it needs to make progress. Citing comments received during development of other regulations, OFCCP officials cautioned that an analysis of utilization disaggregated by race/ethnicity may be more challenging for smaller companies with fewer employees.
Further, looking at trends in diversity for minorities as a whole may not assist a company’s affirmative action efforts to identify groups that need particular outreach or support. Specifically, our analysis of workforce data found differences in representation for Black and Hispanic workers in the technology workforce compared to Asian workers. Under the current AAP regulations, companies may opt not to detect and address underrepresentation of particular minority groups since OFCCP does not require placement goals disaggregated by race/ethnicity. While OFCCP may be able to detect underrepresentation of particular minority groups during its reviews, the office reviews only 2 percent of federal contractor establishments each year. OFCCP officials said that they would need to amend their regulations in order to require disaggregated race/ethnicity information for placement goals on AAPs. The officials said disaggregating race in placement goals could help an establishment determine how to tailor outreach accordingly or better identify impediments to its equal employment opportunity efforts. However, they have not pursued this regulatory change because of competing priorities on their regulatory agenda. OFCCP’s mission includes holding federal contractors responsible for the legal requirements to take affirmative action and not discriminate against protected groups. However, not requiring contractors to set placement goals for each minority group may hinder OFCCP’s ability to effectively achieve this mission.
Page 42 GAO-18-69 Diversity in the Technology Sector
OFCCP has not reviewed key aspects of its current approach to evaluations
OFCCP officials report the agency intends to incorporate additional information on gender, racial, and ethnic disparities by industry into its compliance evaluation selection process, but we found the methodology to determine the disparities may have weaknesses. We have previously reported on the challenges OFCCP faces with its enforcement efforts, and identified additional areas that may limit OFCCP’s enforcement of federal contractors’ equal employment and affirmative action efforts. For example, our 2016 report found that OFCCP’s weak compliance evaluation selection process, reliance on voluntary compliance, and lack of staff training create several challenges to its enforcement efforts.73 This report found that because OFCCP was not able to identify which factors are associated with risk of noncompliance, the agency does not have reasonable assurance that it is focusing its efforts on those contractors at greatest risk of not following nondiscrimination or affirmative action requirements. OFCCP agreed with recommendations we made to address these areas and detailed steps the agency would take. In particular, to strengthen its compliance evaluation process to select contractors at greatest risk of potential discrimination, the agency stated that it planned to incorporate information on pay disparities and employment disparities.74 OFCCP officials indicated this information would be based on analysis of gender and race/ethnicity by industry using ACS data and EEO-1 compensation data that was to be collected beginning March 2018. However, in August 2017, the Office of Management and Budget issued a memo suspending the pay-related data collection aspects of the EEO-1 form. Despite this change, OFCCP officials said they are exploring other options for focusing on compensation disparities by industry, including through the use of ACS data, administrative data, a previous study conducted by the Department of Labor, as well as options proposed by contractors.
We also found OFCCP’s current methodology for identifying disparities by industry with the ACS data may have some weaknesses that could affect the accuracy of the outcomes. For example, its reliance on the broadest
73GAO-16-750. 74To address the reliance on voluntary compliance and lack of staff training, OFCCP is exploring annual certification of AAP updates and electronic submission of AAPs, as well as the establishment of a framework for future compliance officer training.
Page 43 GAO-18-69 Diversity in the Technology Sector
industry level available may not sufficiently identify specific industries at elevated risk. Further, the methodology includes future plans to conduct the analysis for metropolitan areas. Given the importance of regional and local labor markets for assessing affirmative action efforts, regional and local analysis should also be completed before OFCCP incorporates this analysis into its selection process. It is important that OFCCP use reliable information in modifying its basic processes and setting priorities. For the reasons cited earlier regarding the importance of using quality information to make management decisions, it is important that OFCCP assess the quality of the methods for its analysis of employment disparities among industries. Without doing so, OFCCP may not accurately identify industries at greatest risk of potential noncompliance with nondiscrimination and affirmative action requirements so it can focus its limited investigation resources most effectively.
Further, according to OFCCP officials, although the agency has made slight changes to various thresholds and factors for its selection process, the agency has not made any significant changes to the selection process for about 10 years, and has made no changes to its establishment-based approach since OFCCP was founded in 1965. While OFCCP currently grounds its review of a contractor in a particular physical establishment, OFCCP officials acknowledged the changing nature of a company’s work can involve multiple locations and corresponding changes in the scope of hiring and recruitment. Officials we interviewed from five of our eight selected technology companies discussed their work spread across locations, including the United States or overseas, and the related challenges they face with OFCCP’s establishment-based approach to reviews. One company representative said the AAP is not useful because site specific plans do not connect to business decisions. However, OFCCP has not reviewed the implications for the effectiveness of its mission of continuing with its establishment-based approach to conducting compliance evaluations.
In addition, OFCCP officials acknowledged their inability, in identifying establishments for review, to consistently identify and include all subcontractors to which OFCCP rules should apply. They said the agency has not assessed the potential significance of any omissions of subcontractors from the oversight process. Internal control standards state that management should identify risks throughout the entity related to achieving its defined objectives to form a basis for designing risk responses, as well as the importance of periodically reviewing policies,
Page 44 GAO-18-69 Diversity in the Technology Sector
procedures and related control activities for continued relevance and effectiveness in achieving the agency’s objectives.75 OFCCP officials said they have informally discussed how to adjust their work based on how work is performed in today’s economy—with virtual sites, workplace flexibilities, and nontraditional forms of employment. However, due to competing priorities, they have not conducted a formal review of these key aspects of its current approach to selecting entities for review. They acknowledged such a review would be useful. Without assessing its current approach to its establishment-based reviews and identification of all relevant subcontractors, OFCCP does not have reasonable assurance that its approach can identify discrimination occurring within the companies it oversees and may be missing opportunities to identify more effective practices or adjust its methods to external changes.
While OFCCP has offered an option—the Functional Affirmative Action Program (FAAP)—for companies to move away from establishment-based reviews and which may be more appropriate for some multi–establishment contractors, uptake has been low and the agency has not conducted an evaluation of this program.76 Since 2002, OFCCP has allowed companies to create FAAPs, with OFCCP approval, which are based on a business function or unit that may exist at multiple establishments. As of May 2017, 73 companies across all industries had FAAPs in place. Further, some of the companies we interviewed were unaware that the FAAP was an option or believed it was cumbersome to establish given the complexity of their workforce. Asked why the FAAP has not been more broadly adopted, OFCCP officials hypothesized it could have to do with a requirement intended to ensure that companies with FAAPs would be reviewed at least as often as others, but that may result in these companies being reviewed more often than most. Standards for internal control for government agencies state that management should periodically review policies, procedures, and related control activities for continued relevance and effectiveness in achieving
75GAO-14-704G. 76In addition, OFCCP conducts a small number of corporate management compliance evaluations each year, which focus on personnel activity at the corporate headquarters as well as affirmative action policies and procedures that ensure equal employment opportunity leading to advancement throughout the organization. OFCCP also reports conducting directed multi-establishment reviews which may be scheduled by OFCCP when it receives credible information of an alleged violation of a law or regulations the agency enforces.
Page 45 GAO-18-69 Diversity in the Technology Sector
the entity’s objectives.77 Reviewing and refining the FAAP program could help OFCCP improve its ability to achieve its objectives and may provide broader insight for OFCCP’s overall enforcement approach.
Jobs in the high paying technology sector are projected to grow in coming years. Female, Black, and Hispanic workers, however, comprised a smaller proportion of technology workers compared to their representation in the general workforce from 2005 through 2015, and have also been less represented among technology workers inside the technology sector than outside it. Both EEOC’s and OFCCP’s mission is to combat discrimination and support equal employment opportunity for U.S. workers; however, weaknesses in their processes impact the effectiveness of their efforts. When conducting investigations, EEOC has not been consistently capturing information on industry codes. This impedes its ability to conduct industry sector analysis that could be used to more effectively focus its limited enforcement resources and outreach activities. Similarly, OFCCP faces delays in its compliance review process but it has not analyzed its closed evaluations to understand the causes of these delays and whether its processes need to be modified to reduce them. In addition, as part of their affirmative action programs federal contractors are only required to set placement goals for all minorities in general. By not requiring contractors to disaggregate demographic data for the purpose of establishing placement goals, OFCCP has limited assurance that these contractors are setting goals that will address potential underrepresentation in certain minority groups.
Further, OFCCP plans to incorporate information on disparities by industry into its process for selecting establishments for compliance evaluations, but has not fully assessed its planned methods. Without such assessment, OFCCP may use a process that does not effectively identify the industries at greatest risk of potential noncompliance with nondiscrimination and affirmative action requirements. In addition, key aspects of OFCCP’s approach to compliance reviews of contractors’ affirmative action efforts have not changed in over 50 years, whereas the structure and locations of these companies’ work have changed. Finally, although OFCCP has developed an alternative affirmative action program for multi-establishment contractors, few contractors participate in this program. Because OFCCP has not evaluated the program, it does not
77GAO-14-704G.
Conclusions
Page 46 GAO-18-69 Diversity in the Technology Sector
have information to determine why there has not been greater uptake and whether it provides a more effective alternative to an establishment-based AAP.
We are making a total of six recommendations, including one to EEOC and five to OFCCP. Specifically:
• The Chair of the EEOC should develop a timeline to complete the planned effort to clean IMS data for a one-year period and add missing industry code data. (Recommendation 1)
• The Director of OFCCP should analyze internal process data from closed evaluations to better understand the cause of delays that occur during compliance evaluations and make changes accordingly. (Recommendation 2)
• The Director of OFCCP should take steps toward requiring contractors to disaggregate demographic data for the purpose of setting placement goals in the AAP rather than setting a single goal for all minorities, incorporating any appropriate accommodation for company size. For example, OFCCP could provide guidance to contractors to include more specific goals in their AAP or assess the feasibility of amending their regulations to require them to do so. (Recommendation 3)
• The Director of OFCCP should assess the quality of the methods used by OFCCP to incorporate consideration of disparities by industry into its process for selecting contractor establishments for compliance evaluation. It should use the results of this assessment in finalizing its procedures for identifying contractor establishments at greatest risk of noncompliance. (Recommendation 4)
• The Director of OFCCP should evaluate the current approach used for identifying entities for compliance review and determine whether modifications are needed to reflect current workplace structures and locations or to ensure that subcontractors are included. (Recommendation 5)
• The Director of OFCCP should evaluate the Functional Affirmative Action Program to assess its usefulness as an effective alternative to an establishment-based program, and determine what improvements, if any, could be made to better encourage contractor participation. (Recommendation 6)
Recommendations for Executive Action
Page 47 GAO-18-69 Diversity in the Technology Sector
We provided a draft of this report to the Departments of Labor (DOL), Commerce, the Equal Employment Opportunity Commission (EEOC) and the National Science Foundation (NSF).
We received written comments from DOL that are reproduced in appendix V. In addition, DOL, Commerce, EEOC, and NSF provided technical comments which we incorporated into the report as appropriate.
DOL agreed with 4 of the 5 recommendations we made to improve oversight of federal contractors, and identified some steps it plans to take to implement them. Specifically, the department agreed with our recommendations to analyze internal process data to better understand the cause of delays that occur during compliance evaluations, assess the quality of methods used to incorporate consideration of disparities by industry into the process to select contractors for review, and to evaluate its current approach to identifying entities for review in light of changes in workplace structures, as well as its Functional Affirmative Action Program.
DOL stated that it appreciated, but neither agreed nor disagreed, with our recommendation to take steps toward requiring contractors to disaggregate demographic data for the purpose of setting placement goals in the AAP rather than setting a single goal for all minorities. The department said this would require a regulatory change with little immediate benefit as contractors are already required to collect demographic data on each employee and applicant, and must conduct in-depth analyses of their total employment processes to identify where impediments to equal opportunity exist. While we acknowledge these data collection requirements for federal contractors, we remain concerned that without requiring contractors to also establish placement goals to address any underrepresentation for specific minority groups, contractors may not develop objectives or targets to make affirmative action efforts work. We maintain, therefore, that DOL should take steps toward requiring contractors to develop placement goals disaggregated by race/ethnicity.
EEOC provided us a memo that it characterized as technical comments on the draft report. In these comments, EEOC neither agreed nor disagreed with our recommendation to develop a timeline to complete its planned effort to clean IMS data for a one-year period, which would include adding missing industry codes, but stated that it was taking some actions to enhance these data. We continue to maintain a timeline should be developed to complete this review, which is needed for the
Agency Comments and Our Evaluation
Page 48 GAO-18-69 Diversity in the Technology Sector
commission to conduct industry sector analysis that could be used to more effectively focus its limited resources and outreach activities. EEOC also emphasized the importance of systemic investigations, noting that while outreach may be somewhat useful in generating charges, individual charges are unlikely to make a substantial impact on a systemic practice affecting an entire employment sector. We maintain that the ability to analyze IMS data by industry could help EEOC to focus its resource use, including for systemic investigations. EEOC also noted staffing and resource constraints as issues faced by the commission. As agreed with your office, unless you publicly announce the contents of this report earlier, we plan no further distribution until 30 days from the report date. At that time, we will send copies to the appropriate congressional committees, the Secretary of Labor, the Chair of the Equal Employment Opportunity Commission, the Secretary of Commerce, and the Director of the National Science Foundation. In addition, the report will be available at no charge on GAO’s website at http://www.gao.gov.
If you or your staff should have any questions about this report, please contact me at (202) 512-7215 or [email protected]. Contact points for our Offices of Congressional Relations and Public Affairs may be found on the last page of this report. GAO staff who made key contributions to this report are listed in appendix VI.
Sincerely yours,
Cindy Brown Barnes Director, Education, Workforce, and Income Security Issues
Appendix I: Objectives, Scope, and Methodology
Page 49 GAO-18-69 Diversity in the Technology Sector
Our two objectives were to: (1) identify the demographic trends in the technology workforce over the past 10 years, and (2) assess the efforts by the U.S. Equal Employment Opportunity Commission (EEOC) and the Department of Labor’s Office of Federal Contract Compliance Programs (OFCCP) to oversee technology companies and technology contractors’ compliance with equal employment opportunity and affirmative action requirements. This appendix provides details of the data sources used to answer these questions, the analyses we conducted, and any limitations we encountered.
There is no commonly accepted definition of the technology sector or technology-oriented occupations. To arrive at our definition for the technology sector, we identified industries with the highest concentration of technology-oriented occupations, a similar approach to what other federal agencies have used recently to analyze trends within this sector.1 To identify technology-oriented occupations, we reviewed relevant research and interviewed researchers and other individuals knowledgeable about the technology sector.2 Based on this research, we defined technology-oriented occupations to include all computer, engineering and mathematical occupations, including managers.3 We selected our occupations using Bureau of Labor Statistics (BLS) Standard Occupational Classification (SOC) System codes, and crosswalked those occupations to the corresponding U.S. Census Bureau occupation codes
1Michael Wolf and Dalton Terrell, The high-tech industry, what is it and why it matters to our economic future, U.S. Bureau of Labor Statistics, May 2016; and EEOC, Diversity in High Tech (Washington, D.C.: May 2016). 2See, for example, EEOC, Diversity in High Tech; Wolf and Terrell, “The high-tech industry”; and Julia Beckhausen, Occupations in Information Technology, U.S. Census Bureau, August 2016. 3The Census Bureau periodically updates industry and occupation codes to reflect changes in the NAICS and SOC classification system, and provide crosswalks to facilitate analysis of data across the classification system. We used the Census 2002, 2007 and 2012 detailed industry code list for the Census/NAICS industry crosswalk. We used the 2002 and 2010 Census occupation codes for the Census/SOC occupation crosswalk.
Appendix I: Objectives, Scope, and Methodology
Definition of Technology Sector and Technology Occupations
Appendix I: Objectives, Scope, and Methodology
Page 50 GAO-18-69 Diversity in the Technology Sector
to conduct our analysis.4 (For a complete list of the occupations we included as technology occupations, see appendix II).
We defined the technology sector as a group of industries with the highest concentration of technology workers. Using data from the American Community Survey, an ongoing national survey conducted by the U.S. Census Bureau that collects information from a sample of households, we identified the 15 industries with the highest concentration of technology workers. For this analysis, we used Census industry codes since we used this dataset for many of our analyses. The concentration of technology workers in these industries ranged from a high of 62.2 percent in the computer systems design and related services industry to a low of 19.33 percent in the wired telecommunications carriers industry (see table 3).5 Companies in the technology sector also employ non-technical workers, such as sales people.
4The SOC system is used by federal statistical agencies to classify workers into occupational categories for the purpose of collecting, calculating, or disseminating data. We decided to select these occupation groupings using the SOC system because it had been used by both EEOC and BLS in their recent reports, and the SOC system easily crosswalks to other data systems, including Census. 5See Appendix III for corresponding 6-digit NAICS codes.
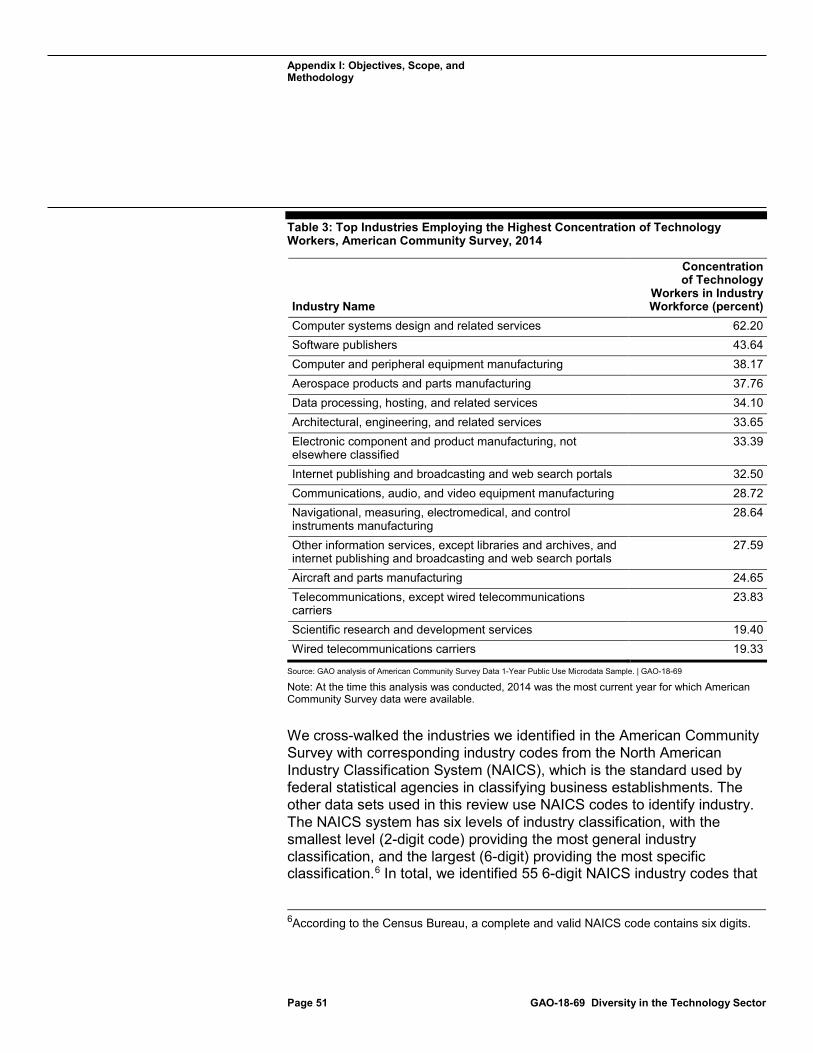
Appendix I: Objectives, Scope, and Methodology
Page 51 GAO-18-69 Diversity in the Technology Sector
Table 3: Top Industries Employing the Highest Concentration of Technology Workers, American Community Survey, 2014
Industry Name
Concentration of Technology
Workers in Industry Workforce (percent)
Computer systems design and related services 62.20 Software publishers 43.64 Computer and peripheral equipment manufacturing 38.17 Aerospace products and parts manufacturing 37.76 Data processing, hosting, and related services 34.10 Architectural, engineering, and related services 33.65 Electronic component and product manufacturing, not elsewhere classified
33.39
Internet publishing and broadcasting and web search portals 32.50 Communications, audio, and video equipment manufacturing 28.72 Navigational, measuring, electromedical, and control instruments manufacturing
28.64
Other information services, except libraries and archives, and internet publishing and broadcasting and web search portals
27.59
Aircraft and parts manufacturing 24.65 Telecommunications, except wired telecommunications carriers
23.83
Scientific research and development services 19.40 Wired telecommunications carriers 19.33
Source: GAO analysis of American Community Survey Data 1-Year Public Use Microdata Sample. | GAO-18-69
Note: At the time this analysis was conducted, 2014 was the most current year for which American Community Survey data were available.
We cross-walked the industries we identified in the American Community Survey with corresponding industry codes from the North American Industry Classification System (NAICS), which is the standard used by federal statistical agencies in classifying business establishments. The other data sets used in this review use NAICS codes to identify industry. The NAICS system has six levels of industry classification, with the smallest level (2-digit code) providing the most general industry classification, and the largest (6-digit) providing the most specific classification.6 In total, we identified 55 6-digit NAICS industry codes that
6According to the Census Bureau, a complete and valid NAICS code contains six digits.
Appendix I: Objectives, Scope, and Methodology
Page 52 GAO-18-69 Diversity in the Technology Sector
comprise the technology sector using this method. (See appendix III for a list of the 6-digit NAICS codes and industry names that correspond to the Census industries we identified.)
We compared our list of industries to those included in the 2016 reports by EEOC and the BLS on the technology sector. While each report includes a somewhat different set of industries depending on the authors’ particular definition of technology occupations, most of the 15 industries we selected overlap with industries selected in these other reviews. Stemming from their particular focus, these reports included some additional industries and/or occupations excluded from our analysis, such as those in the life sciences. We also compared our findings on the demographic trends in the technology workforce to 2016 EEOC and Census Bureau reports that reviewed diversity in the technology sector.7 Despite the definitional and methodological variations, the demographic trends found in these other reports were generally comparable to our findings.
To determine the demographic trends in the technology workforce over the past decade, we analyzed quantitative data on technology workers within and outside the technology sector from 2005 through 2015 from the Census Bureau’s Public Use Microdata Sample of the American Community Survey (ACS) for the years 2005, 2007, 2009, 2011, 2013, and 2015.8 ACS is an ongoing national survey that collects information from a sample of households. We analyzed trend data for gender, race, and ethnicity, and median salary by occupation and sector, and analyzed point-in-time data on educational background by occupation.9
We analyzed the percentage of technology workers who earned bachelor’s degrees in computer, engineering, mathematics, and
7EEOC, Diversity in High Tech (May 2016) and Julia Beckhusen, “Occupations in Information Technology,” American Community Survey Reports, ACS-35, U.S. Census Bureau, Washington, D.C.: 2016. 8We used the American Community Survey rather than the Current Population Survey due to the much larger sample size in the ACS, which allowed us to analyze various population subgroups with more precision. 9We excluded persons in the armed forces and not in the labor force. We included occupation for persons categorized as 1) civilian employed, at work, 2) civilian employed, with a job but not at work, and 3) unemployed.
American Community Survey (ACS) Data

Appendix I: Objectives, Scope, and Methodology
Page 53 GAO-18-69 Diversity in the Technology Sector
technology fields.10 For median salary, we analyzed data for workers who were employed full-time, which included those who, over the past 12 months, reported usually working 35 hours or more per week and 50 weeks or more per year, and those with wages greater than zero.
To account for the sample representation and design used in the ACS, we used the person weight present in the ACS data. We used the successive difference replication method to estimate the standard errors around any population estimate. For each comparison, we tested the statistical significance of the difference for men and women and for specific racial and ethnic groups at the p-value <0.05 level. In addition, we tested the statistical significance of the change between 2005 and 2015 for each gender and racial/ethnic group.
For race categories using ACS data in this report, we included only non-Hispanic members of White, Black, Asian, and Other categories. For the Asian category, we included Asian American, Native Hawaiian or Other Pacific Islander. The Hispanic category incorporated Hispanics of all races. Our analysis included American Indian or Alaskan Native, and Two or More Races, in the category reported as “Other.”
We assessed the reliability of the ACS generally and of data elements that were critical to our analyses and determined that they were sufficiently reliable for our analyses. Specifically, we reviewed documentation on the general design and methods of the ACS and on the specific elements of the ACS data that were used in our analysis. We interviewed Census Bureau officials knowledgeable about the ACS data and completed our own electronic data testing to assess the accuracy and completeness of the data used in our analyses.
10To analyze the academic backgrounds for those in technology-oriented occupations, we analyzed data from the 2014 ACS 1-Year Public Use Microdata Sample on field of degree for bachelor’s degree. While the ACS collects data on the highest level of academic degree obtained, such as a high school diploma or doctorate, it only collects academic fields related to the degree for bachelor’s degree. To determine the fields of degree for bachelor’s degree that are technology-oriented, based on our review of literature and discussions with representatives from academia, we identified degrees within the following four categories: computing, engineering, mathematics, and technology. We omitted “medical technologies technicians” because this degree fits within life sciences, which is outside the scope of our definition of technology-oriented fields. In total, we analyzed data for 43 related degrees in ACS, such as computer science, aerospace engineering, and electrical engineering.
Appendix I: Objectives, Scope, and Methodology
Page 54 GAO-18-69 Diversity in the Technology Sector
To determine workforce trends in companies within the technology sector and at leading information technology companies, we analyzed data from EEOC’s Employer Information Reports (EEO-1) for the years 2007, 2011, and 2015.11 We report EEO-1 data starting in 2007 because EEOC made significant changes to its requirements related to the reporting of EEO-1 data over time. For example, beginning in 2007, EEOC changed its requirements related to the reporting of data on managers and changed its practices for collecting certain racial/ethnicity information. EEO-1 reports contain firm-level data that is annually submitted to EEOC, generally by private-sector firms with at least 100 employees or federal contractors with at least 50 employees that have a contract, subcontract or purchase order amounting to $50,000 or more.12 Companies that fit the above criteria submit separate EEO-1 reports for their headquarters as well as each establishment facility.13 EEOC requires employers to use the North American Industry Classification System (NAICS) to classify their industry.
To identify trends using EEO-1 data for workers, we analyzed data for companies with the NAICS codes we initially identified as technology industries. We selected the leading information technology companies using Standard & Poor’s (S&P) 500 Information Technology Index list, which identifies the largest public information technology companies at a given time. In October 2016, this list consisted of 67 companies in the world that have stocks trading with the United States, and we analyzed EEO-1 data from 65 of these companies.14 For both analyses, we analyzed EEO-1 data from all job categories by gender, race and 11Due to the complex nature of private business mergers and acquisitions, we analyzed data for the leading technology companies for 2015 only. 12For this review, we only analyzed data from companies and federal contractors with at least 100 employees. 13Establishment refers to an economic unit which produces goods or services, such as a factory, office, or store. In most cases, an establishment is at a single physical location. 14We modified the list of companies for analysis to account for mergers and other company restructuring. To identify which NAICS codes to use for the analysis of the leading technology companies, we used the 55 NAICS codes we initially identified as technology industries and added in any additional industry code that the headquarters company was assigned. This approach is consistent with EEOC’s analysis on the top 75 companies in Silicon Valley in its High Tech report. See EEOC, Diversity in the High Tech Sector, 2016. In analyzing the data, we found that 13 of the 65 companies had 9 additional NAICS codes associated with their company outside the original list of 55. For our analysis, we pulled EEO-1 data from any establishment of the 65 companies that had a NAICS code associated with any of the 64 different technology industries.
Employer Information Report (EEO-1) Data
Appendix I: Objectives, Scope, and Methodology
Page 55 GAO-18-69 Diversity in the Technology Sector
ethnicity, and industry sectors. For job categories, the EEO-1 form collects data on 10 major job categories including 1) Executives, Senior Level Officials and Managers; 2) First/Mid-Level Officials and Managers; 3) Professionals; 4) Technicians; 5) Sales Workers; 6) Administrative Support Workers; 7) Craft Workers; 8) Operatives; 9) Laborers and Helpers; and 10) Service Workers. In our analysis, “all other jobs” combines sales workers, administrative support workers, craft workers, operatives, laborers and helpers, and service workers. We used the race/ethnicity categories used by the EEOC as follows: White, Black or African American, Asian (including Native Hawaiian or Other Pacific Islander), Hispanic or Latino, and “Two or more Races” (including American Indian or Alaska Native).
We assessed the reliability of the EEO-1 data and determined that despite limitations, they were sufficiently reliable for our analyses.15 To determine the reliability of the EEO-1 data that we received from EEOC, we interviewed knowledgeable EEOC officials, reviewed relevant documents provided by agency officials and obtained on its website, and performed manual data testing for missing variables.
For our analysis of technology degree earners, we used degree completion data tabulated by the National Science Foundation from the National Center for Education Statistics’ Integrated Postsecondary Education Data System (IPEDS) for the year 2014.16 Using a variety of sources, such as academic research and interviews with representatives from academia, we defined technology-related fields as degree programs in computer science, engineering, and mathematics.17 We analyzed IPEDS data by race and gender and who had obtained a bachelor’s or master’s degree in technology-related fields. We determined that the potential external candidates for technology positions generally had obtained either a bachelor’s or a master’s degree in a technology-related 15Prior to 2012, the NAICS code was an open-ended question; starting in 2012, it was used with a drop-down menu. It is possible that there may have been more entry errors prior to 2012 based on the open-ended nature of the question, but we could not identify or correct any errors that might have been incorporated. 16National Science Foundation, National Center for Science and Engineering Statistics. Women, Minorities, and Persons with Disabilities in Science and Engineering: 2015. Special Report NSF 15-311. Arlington, VA. 17We did not include science, engineering, or other science and engineering technologies degrees in this analysis.
Integrated Postsecondary Education Data System (IPEDS)
Appendix I: Objectives, Scope, and Methodology
Page 56 GAO-18-69 Diversity in the Technology Sector
field. We used the race/ethnicity categories used by IPEDS as follows: White, Black, Asian (including Pacific Islander), Hispanic, and Multiracial or other (which includes American Indian or Alaska Native, Other or Unknown Race, and Two or more Races, i.e. respondents who selected one or more racial designations). Race and ethnicity breakouts are for U.S. citizens and permanent residents only, and thus do not include data on temporary residents. The analysis by gender includes temporary residents.
To determine the reliability of IPEDs data, we reviewed relevant documents obtained on the National Center for Education Statistics website, such as annual methodology reports and the handbook of NCES survey methods. We determined that data from IPEDs were sufficiently reliable for our purposes.
To identify how EEOC and OFCCP have overseen technology companies’ compliance with federal equal opportunity and affirmative action requirements, we reviewed relevant federal statutes and regulations, EEOC and OFCCP policies, strategic planning documents, and operational manuals. We interviewed EEOC and OFCCP officials in headquarters, and in two regional locations selected based on the large proportion of technology companies in those areas. At EEOC, we met with officials from the San Francisco and New York district offices. At OFCCP, we met with officials from the Pacific and Northeast regional offices.
To explore charges of discrimination filed with the EEOC against technology companies, we planned to analyze data from the EEOC Integrated Mission System (IMS), which contains records on EEOC charges and enforcement activities. However, since industry code is not a mandatory field for investigators to complete, roughly half the entries did not have an industry code. Therefore, we could not reliably identify technology companies that have faced charges or enforcement. We attempted to match information we had developed on federal technology contractors with charges filed in the IMS database. Depending on the matching method we used, this yielded very different results and we determined this was not a sufficiently reliable method. Further, any matching method we used would have excluded technology companies that did not hold a federal contract.
To obtain information on evaluations of technology contractors completed by OFCCP and complaints received against technology contractors, we
Analysis of EEOC and OFCCP Oversight
Appendix I: Objectives, Scope, and Methodology
Page 57 GAO-18-69 Diversity in the Technology Sector
took a two-step approach.18 First, using the Federal Procurement Data System–Next Generation (FPDS-NG),19 we developed a list of company establishments and their subsidiaries that received federal contract obligations in fiscal years 2011-2015 under any of the 55 NAICS codes we included above as technology industries.20 We selected only company establishments that received 50 percent or more of their total federal contract obligations under these NAICS codes.21 Each establishment was counted only once regardless of how many federal contracts it received during the time period. Using this method, we identified 43,448 establishments in our pool of “technology contractors.” To identify subsidiaries, which are also subject to OFCCP requirements and evaluations, we identified any other establishments that shared the global vendor code with the contractors we identified, regardless of their NAICS code. This yielded 2,116 additional contractors. Second, we matched the names (removing suffixes) of the technology contractors and their subsidiaries that we identified in FPDS-NG against OFCCP’s data on their evaluations of contractors to identify the evaluations of technology contractors that OFCCP opened and completed from fiscal year 2011 through fiscal year 2016. We conducted a similar matching exercise to identify the complaints OFCCP received against technology companies. In addition, we identified which of the leading technology companies had completed evaluations between fiscal year 2011 through 2016.
We obtained information during interviews with researchers, and representatives of workforce and industry organizations and associations. In addition, we interviewed diversity and compliance representatives of 18OFCCP officials informed us that while NAICS code was available in their data system, it was not always completed until the agency made it mandatory in May 2015. Since we wanted to conduct our analysis for a longer period of time, we determined the industry data field was not reliable for this analysis. 19To assess the reliability of the FPDS-NG data, we performed electronic testing of relevant data elements, and reviewed internal control documents and data quality summaries. We determined that the FPDS-NG data were sufficiently reliable for our purposes. 20OFCCP officials told us they audited a random sample of violations data from fiscal year 2011 through April 2016 and confirmed that the data from 2011 are accurate in identifying cases with discrimination or technical violations. 21We excluded entities without Dun & Bradstreet’s Data Universal Numbering System (DUNS) numbers—a unique identifier required of all prospective contractors in order to do business with the government—or whose contract amount was negative (deobligation), if a consolidated or classified contract report, or an entity coded as educational institution, federal government or state/local government.
Appendix I: Objectives, Scope, and Methodology
Page 58 GAO-18-69 Diversity in the Technology Sector
eight of the leading information technology companies located in the San Francisco Bay area which were also federal contractors to discuss their efforts to increase diversity and to gain their perspectives on the federal role in overseeing compliance with nondiscrimination laws. These companies were:
• Adobe Systems Incorporated
• Cisco Systems, Inc.
• Facebook, Inc.
• Google Inc.
• Hewlett Packard Enterprise Company
• Intel Corporation
• Intuit Inc.
• Oracle America, Inc.
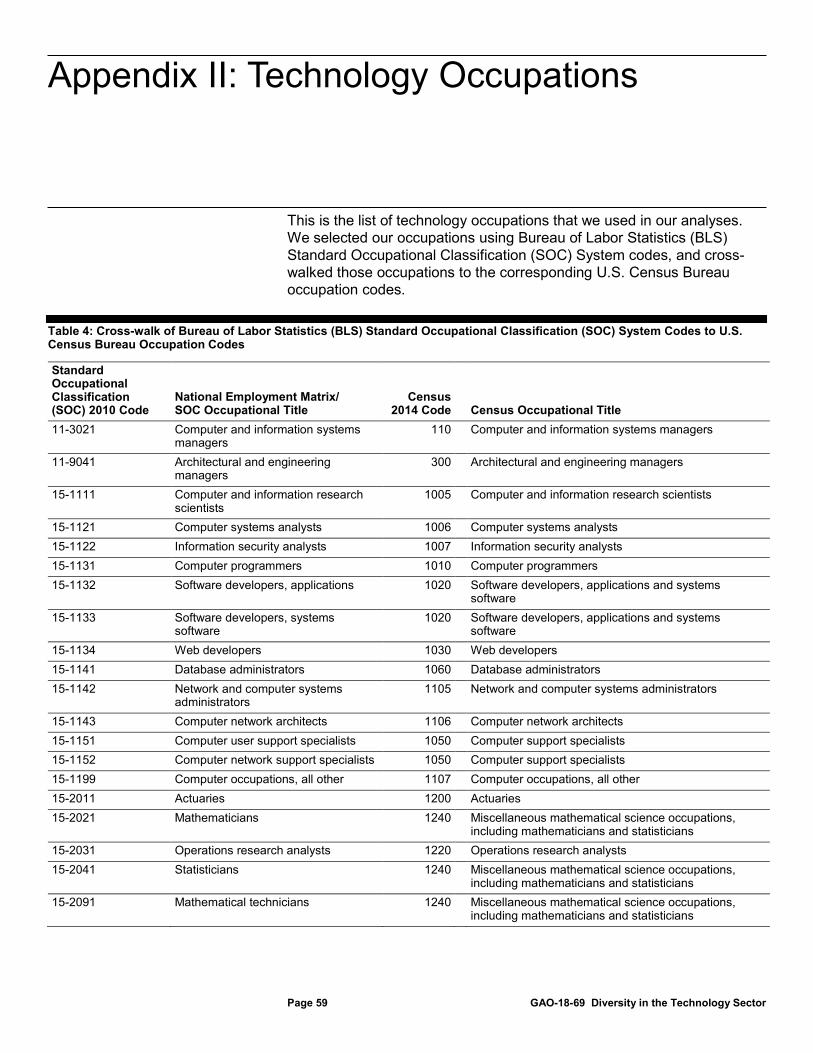
Appendix II: Technology Occupations
Page 59 GAO-18-69 Diversity in the Technology Sector
This is the list of technology occupations that we used in our analyses. We selected our occupations using Bureau of Labor Statistics (BLS) Standard Occupational Classification (SOC) System codes, and cross-walked those occupations to the corresponding U.S. Census Bureau occupation codes.
Table 4: Cross-walk of Bureau of Labor Statistics (BLS) Standard Occupational Classification (SOC) System Codes to U.S. Census Bureau Occupation Codes
Standard Occupational Classification (SOC) 2010 Code
National Employment Matrix/ SOC Occupational Title
Census 2014 Code
Census Occupational Title 11-3021 Computer and information systems
managers 110 Computer and information systems managers
11-9041 Architectural and engineering managers
300 Architectural and engineering managers
15-1111 Computer and information research scientists
1005 Computer and information research scientists
15-1121 Computer systems analysts 1006 Computer systems analysts 15-1122 Information security analysts 1007 Information security analysts 15-1131 Computer programmers 1010 Computer programmers 15-1132 Software developers, applications 1020 Software developers, applications and systems
software 15-1133 Software developers, systems
software 1020 Software developers, applications and systems
software 15-1134 Web developers 1030 Web developers 15-1141 Database administrators 1060 Database administrators 15-1142 Network and computer systems
administrators 1105 Network and computer systems administrators
15-1143 Computer network architects 1106 Computer network architects 15-1151 Computer user support specialists 1050 Computer support specialists 15-1152 Computer network support specialists 1050 Computer support specialists 15-1199 Computer occupations, all other 1107 Computer occupations, all other 15-2011 Actuaries 1200 Actuaries 15-2021 Mathematicians 1240 Miscellaneous mathematical science occupations,
including mathematicians and statisticians 15-2031 Operations research analysts 1220 Operations research analysts 15-2041 Statisticians 1240 Miscellaneous mathematical science occupations,
including mathematicians and statisticians 15-2091 Mathematical technicians 1240 Miscellaneous mathematical science occupations,
including mathematicians and statisticians
Appendix II: Technology Occupations
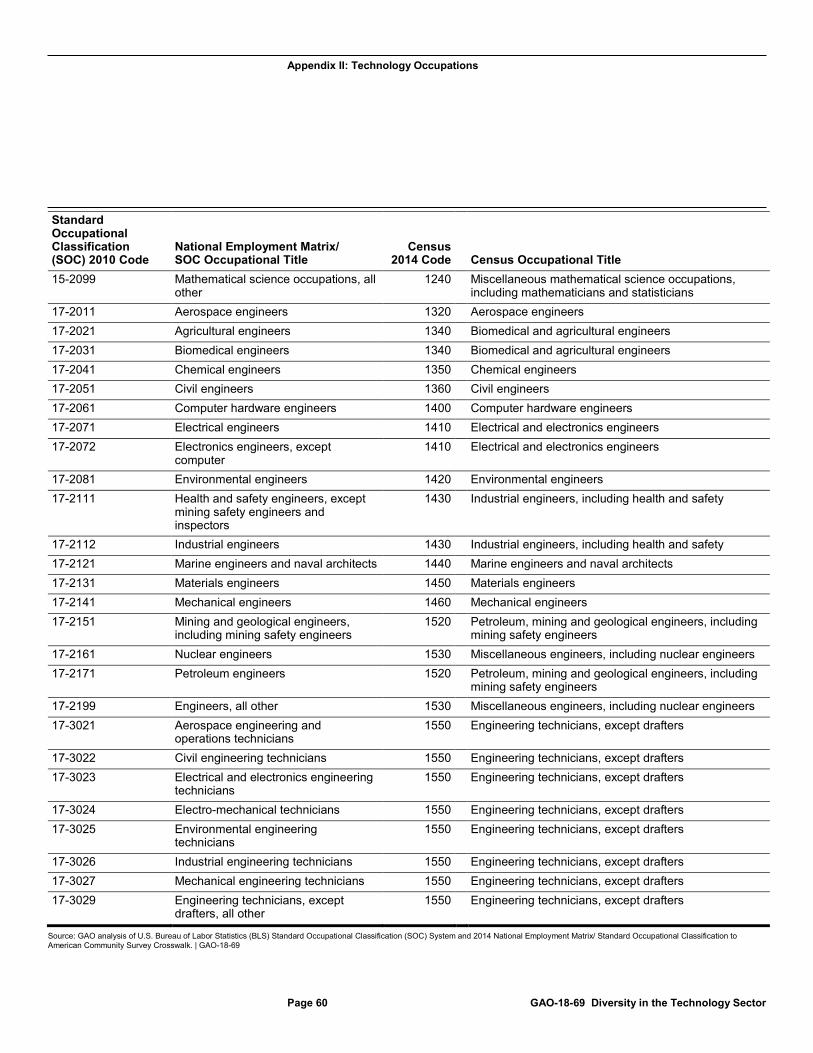
Appendix II: Technology Occupations
Page 60 GAO-18-69 Diversity in the Technology Sector
Standard Occupational Classification (SOC) 2010 Code
National Employment Matrix/ SOC Occupational Title
Census 2014 Code
Census Occupational Title 15-2099 Mathematical science occupations, all
other 1240 Miscellaneous mathematical science occupations,
including mathematicians and statisticians 17-2011 Aerospace engineers 1320 Aerospace engineers 17-2021 Agricultural engineers 1340 Biomedical and agricultural engineers 17-2031 Biomedical engineers 1340 Biomedical and agricultural engineers 17-2041 Chemical engineers 1350 Chemical engineers 17-2051 Civil engineers 1360 Civil engineers 17-2061 Computer hardware engineers 1400 Computer hardware engineers 17-2071 Electrical engineers 1410 Electrical and electronics engineers 17-2072 Electronics engineers, except
computer 1410 Electrical and electronics engineers
17-2081 Environmental engineers 1420 Environmental engineers 17-2111 Health and safety engineers, except
mining safety engineers and inspectors
1430 Industrial engineers, including health and safety
17-2112 Industrial engineers 1430 Industrial engineers, including health and safety 17-2121 Marine engineers and naval architects 1440 Marine engineers and naval architects 17-2131 Materials engineers 1450 Materials engineers 17-2141 Mechanical engineers 1460 Mechanical engineers 17-2151 Mining and geological engineers,
including mining safety engineers 1520 Petroleum, mining and geological engineers, including
mining safety engineers 17-2161 Nuclear engineers 1530 Miscellaneous engineers, including nuclear engineers 17-2171 Petroleum engineers 1520 Petroleum, mining and geological engineers, including
mining safety engineers 17-2199 Engineers, all other 1530 Miscellaneous engineers, including nuclear engineers 17-3021 Aerospace engineering and
operations technicians 1550 Engineering technicians, except drafters
17-3022 Civil engineering technicians 1550 Engineering technicians, except drafters 17-3023 Electrical and electronics engineering
technicians 1550 Engineering technicians, except drafters
17-3024 Electro-mechanical technicians 1550 Engineering technicians, except drafters 17-3025 Environmental engineering
technicians 1550 Engineering technicians, except drafters
17-3026 Industrial engineering technicians 1550 Engineering technicians, except drafters 17-3027 Mechanical engineering technicians 1550 Engineering technicians, except drafters 17-3029 Engineering technicians, except
drafters, all other 1550 Engineering technicians, except drafters
Source: GAO analysis of U.S. Bureau of Labor Statistics (BLS) Standard Occupational Classification (SOC) System and 2014 National Employment Matrix/ Standard Occupational Classification to American Community Survey Crosswalk. | GAO-18-69
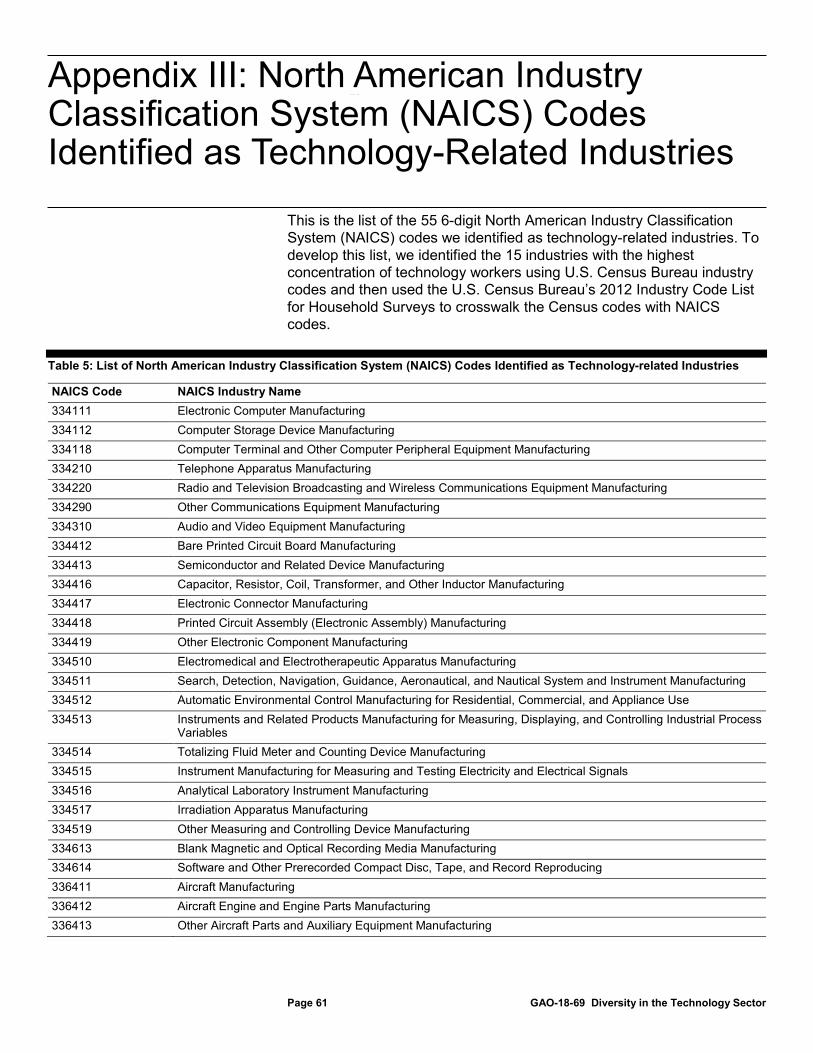
Appendix III: North American Industry Classification System (NAICS) Codes Identified as Technology-Related Industries
Page 61 GAO-18-69 Diversity in the Technology Sector
This is the list of the 55 6-digit North American Industry Classification System (NAICS) codes we identified as technology-related industries. To develop this list, we identified the 15 industries with the highest concentration of technology workers using U.S. Census Bureau industry codes and then used the U.S. Census Bureau’s 2012 Industry Code List for Household Surveys to crosswalk the Census codes with NAICS codes.
Table 5: List of North American Industry Classification System (NAICS) Codes Identified as Technology-related Industries
NAICS Code NAICS Industry Name 334111 Electronic Computer Manufacturing 334112 Computer Storage Device Manufacturing 334118 Computer Terminal and Other Computer Peripheral Equipment Manufacturing 334210 Telephone Apparatus Manufacturing 334220 Radio and Television Broadcasting and Wireless Communications Equipment Manufacturing 334290 Other Communications Equipment Manufacturing 334310 Audio and Video Equipment Manufacturing 334412 Bare Printed Circuit Board Manufacturing 334413 Semiconductor and Related Device Manufacturing 334416 Capacitor, Resistor, Coil, Transformer, and Other Inductor Manufacturing 334417 Electronic Connector Manufacturing 334418 Printed Circuit Assembly (Electronic Assembly) Manufacturing 334419 Other Electronic Component Manufacturing 334510 Electromedical and Electrotherapeutic Apparatus Manufacturing 334511 Search, Detection, Navigation, Guidance, Aeronautical, and Nautical System and Instrument Manufacturing 334512 Automatic Environmental Control Manufacturing for Residential, Commercial, and Appliance Use 334513 Instruments and Related Products Manufacturing for Measuring, Displaying, and Controlling Industrial Process
Variables 334514 Totalizing Fluid Meter and Counting Device Manufacturing 334515 Instrument Manufacturing for Measuring and Testing Electricity and Electrical Signals 334516 Analytical Laboratory Instrument Manufacturing 334517 Irradiation Apparatus Manufacturing 334519 Other Measuring and Controlling Device Manufacturing 334613 Blank Magnetic and Optical Recording Media Manufacturing 334614 Software and Other Prerecorded Compact Disc, Tape, and Record Reproducing 336411 Aircraft Manufacturing 336412 Aircraft Engine and Engine Parts Manufacturing 336413 Other Aircraft Parts and Auxiliary Equipment Manufacturing
Appendix III: North American Industry Classification System (NAICS) Codes Identified as Technology-Related Industries
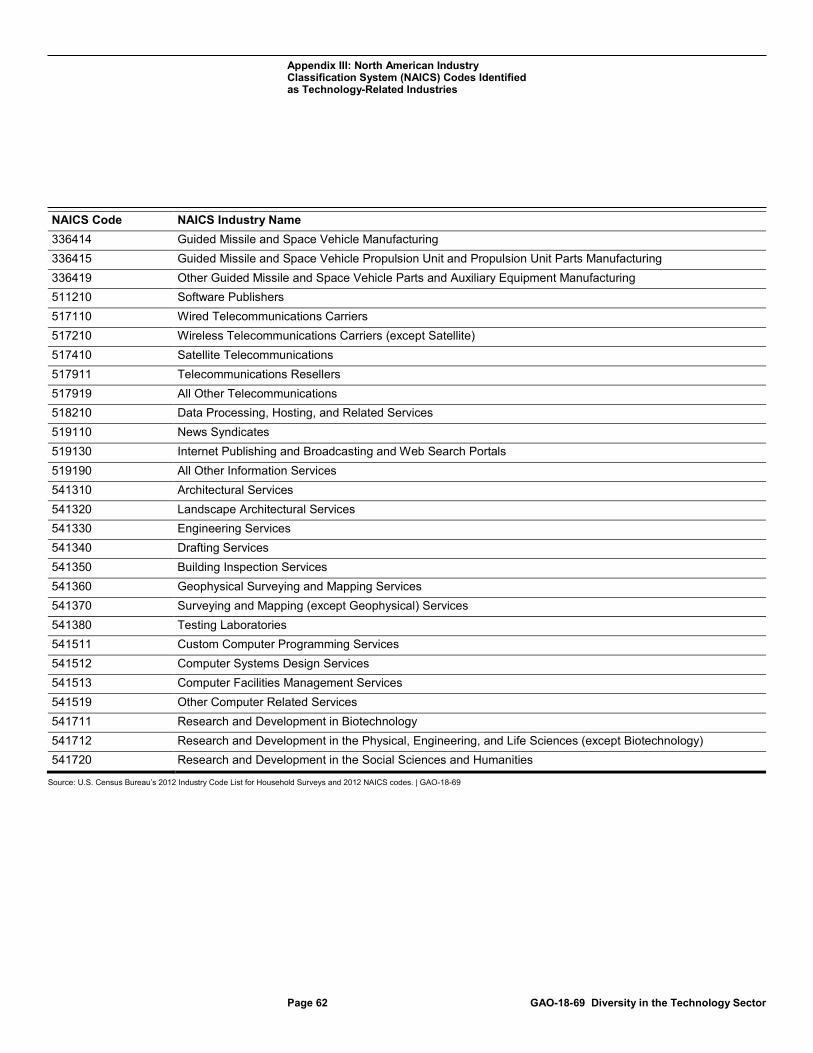
Appendix III: North American Industry Classification System (NAICS) Codes Identified as Technology-Related Industries
Page 62 GAO-18-69 Diversity in the Technology Sector
NAICS Code NAICS Industry Name 336414 Guided Missile and Space Vehicle Manufacturing 336415 Guided Missile and Space Vehicle Propulsion Unit and Propulsion Unit Parts Manufacturing 336419 Other Guided Missile and Space Vehicle Parts and Auxiliary Equipment Manufacturing 511210 Software Publishers 517110 Wired Telecommunications Carriers 517210 Wireless Telecommunications Carriers (except Satellite) 517410 Satellite Telecommunications 517911 Telecommunications Resellers 517919 All Other Telecommunications 518210 Data Processing, Hosting, and Related Services 519110 News Syndicates 519130 Internet Publishing and Broadcasting and Web Search Portals 519190 All Other Information Services 541310 Architectural Services 541320 Landscape Architectural Services 541330 Engineering Services 541340 Drafting Services 541350 Building Inspection Services 541360 Geophysical Surveying and Mapping Services 541370 Surveying and Mapping (except Geophysical) Services 541380 Testing Laboratories 541511 Custom Computer Programming Services 541512 Computer Systems Design Services 541513 Computer Facilities Management Services 541519 Other Computer Related Services 541711 Research and Development in Biotechnology 541712 Research and Development in the Physical, Engineering, and Life Sciences (except Biotechnology) 541720 Research and Development in the Social Sciences and Humanities
Source: U.S. Census Bureau’s 2012 Industry Code List for Household Surveys and 2012 NAICS codes. | GAO-18-69
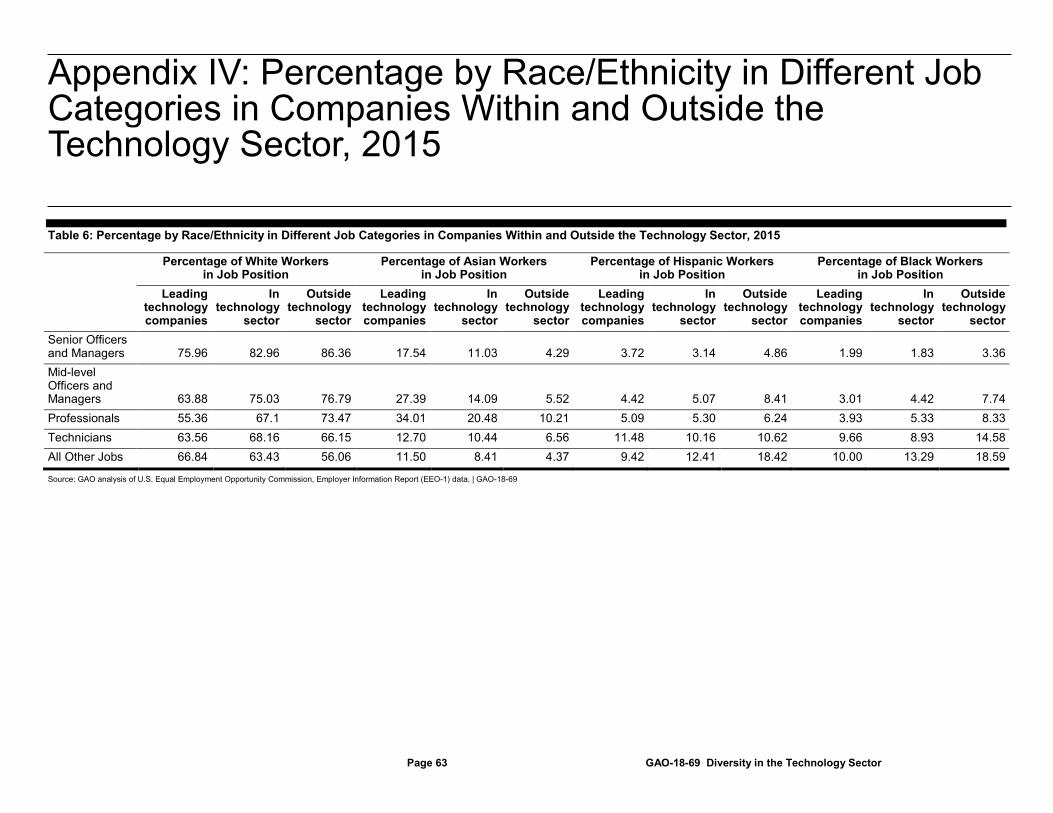
Appendix IV: Percentage by Race/Ethnicity in Different Job Categories in Companies Within and Outside the Technology Sector, 2015
Page 63 GAO-18-69 Diversity in the Technology Sector
Table 6: Percentage by Race/Ethnicity in Different Job Categories in Companies Within and Outside the Technology Sector, 2015
Percentage of White Workers in Job Position
Percentage of Asian Workers in Job Position
Percentage of Hispanic Workers in Job Position
Percentage of Black Workers in Job Position
Leading technology companies
In technology
sector
Outside technology
sector
Leading technology companies
In technology
sector
Outside technology
sector
Leading technology companies
In technology
sector
Outside technology
sector
Leading technology companies
In technology
sector
Outside technology
sector Senior Officers and Managers 75.96 82.96 86.36 17.54 11.03 4.29 3.72 3.14 4.86 1.99 1.83 3.36 Mid-level Officers and Managers 63.88 75.03 76.79 27.39 14.09 5.52 4.42 5.07 8.41 3.01 4.42 7.74 Professionals 55.36 67.1 73.47 34.01 20.48 10.21 5.09 5.30 6.24 3.93 5.33 8.33 Technicians 63.56 68.16 66.15 12.70 10.44 6.56 11.48 10.16 10.62 9.66 8.93 14.58 All Other Jobs 66.84 63.43 56.06 11.50 8.41 4.37 9.42 12.41 18.42 10.00 13.29 18.59
Source: GAO analysis of U.S. Equal Employment Opportunity Commission, Employer Information Report (EEO-1) data. | GAO-18-69
Appendix IV: Percentage by Race/Ethnicity in Different Job Categories in Companies Within and Outside the Technology Sector, 2015
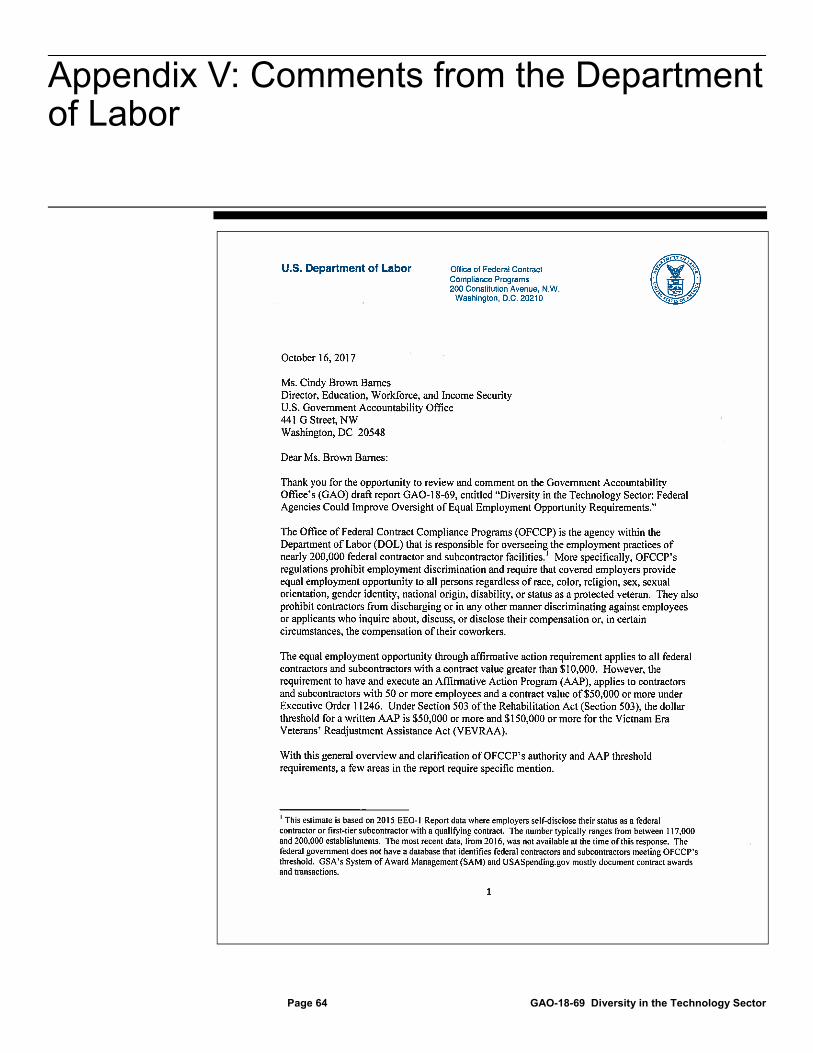
Appendix V: Comments from the Department of Labor
Page 64 GAO-18-69 Diversity in the Technology Sector
Appendix V: Comments from the Department of Labor
Appendix V: Comments from the Department of Labor
Page 65 GAO-18-69 Diversity in the Technology Sector
Appendix V: Comments from the Department of Labor
Page 66 GAO-18-69 Diversity in the Technology Sector
Appendix V: Comments from the Department of Labor
Page 67 GAO-18-69 Diversity in the Technology Sector
Appendix V: Comments from the Department of Labor
Page 68 GAO-18-69 Diversity in the Technology Sector
Appendix V: Comments from the Department of Labor
Page 69 GAO-18-69 Diversity in the Technology Sector
Appendix VI: GAO Contact and Staff Acknowledgments
Page 70 GAO-18-69 Diversity in the Technology Sector
Cindy Brown Barnes, (202) 512-7215 or [email protected]
In addition to the contact named above, Betty Ward-Zukerman (Assistant Director), Kate Blumenreich (Analyst-in-Charge), Sheranda Campbell, Julianne Hartmann Cutts, Clarita Mrena, Moon Parks, Alexandra Rouse, and John Yee made significant contributions to all phases of the work. Also contributing to this report were Rachel Beers, James Bennett, Hedieh Fusfield, Julia Kennon, Jean McSween, Jessica Orr, Dae Park, James Rebbe, Almeta Spencer, and Alexandra Squitieri.
Appendix VI: GAO Contact and Staff Acknowledgments
GAO Contact
Staff Acknowledgments
(100838)
The Government Accountability Office, the audit, evaluation, and investigative arm of Congress, exists to support Congress in meeting its constitutional responsibilities and to help improve the performance and accountability of the federal government for the American people. GAO examines the use of public funds; evaluates federal programs and policies; and provides analyses, recommendations, and other assistance to help Congress make informed oversight, policy, and funding decisions. GAO’s commitment to good government is reflected in its core values of accountability, integrity, and reliability.
The fastest and easiest way to obtain copies of GAO documents at no cost is through GAO’s website (http://www.gao.gov). Each weekday afternoon, GAO posts on its website newly released reports, testimony, and correspondence. To have GAO e-mail you a list of newly posted products, go to http://www.gao.gov and select “E-mail Updates.”
The price of each GAO publication reflects GAO’s actual cost of production and distribution and depends on the number of pages in the publication and whether the publication is printed in color or black and white. Pricing and ordering information is posted on GAO’s website, http://www.gao.gov/ordering.htm.
Place orders by calling (202) 512-6000, toll free (866) 801-7077, or TDD (202) 512-2537.
Orders may be paid for using American Express, Discover Card, MasterCard, Visa, check, or money order. Call for additional information.
Connect with GAO on Facebook, Flickr, Twitter, and YouTube. Subscribe to our RSS Feeds or E-mail Updates. Listen to our Podcasts. Visit GAO on the web at www.gao.gov.
Contact:
Website: http://www.gao.gov/fraudnet/fraudnet.htm E-mail: [email protected] Automated answering system: (800) 424-5454 or (202) 512-7470
Orice Williams Brown, Managing Director, [email protected], (202) 512-4400, U.S. Government Accountability Office, 441 G Street NW, Room 7125, Washington, DC 20548
Chuck Young, Managing Director, [email protected], (202) 512-4800 U.S. Government Accountability Office, 441 G Street NW, Room 7149 Washington, DC 20548
James-Christian Blockwood, Managing Director, [email protected], (202) 512-4707 U.S. Government Accountability Office, 441 G Street NW, Room 7814, Washington, DC 20548
GAO’s Mission
Obtaining Copies of GAO Reports and Testimony Order by Phone
Connect with GAO
To Report Fraud, Waste, and Abuse in Federal Programs
Congressional Relations
Public Affairs
Strategic Planning and External Liaison
Please Print on Recycled Paper.