Embed Size (px)
Citation preview
CROP INSURANCE
Savings Would Result from Program Changes and Greater Use of Data Mining
Report to the Ranking Member, Permanent Subcommittee on Investigations, Committee on Homeland Security and Governmental Affairs, U.S. Senate
March 2012
GAO-12-256
United States Government Accountability Office
GAO

United States Government Accountability Office
Highlights of GAO-12-256, a report to the Ranking Member, Permanent Subcommittee on Investigations, Committee on Homeland Security and Governmental Affairs, U.S. Senate
March 2012
CROP INSURANCE Savings Would Result from Program Changes and Greater Use of Data Mining
Why GAO Did This Study
The U.S. Department of Agriculture (USDA) administers the federal crop insurance program with private insurance companies. In 2011, the program provided about $113 billion in insurance coverage for over 1 million policies. Program costs include subsidies to pay for part of farmers’ premiums. According to the Congressional Budget Office, for fiscal years 2013 through 2022, the program costs—primarily premium subsidies—will average $8.9 billion annually.
GAO determined the (1) effect on program costs of applying limits on farmers’ premium subsidies, as payment limits are set for other farm programs, and (2) extent to which USDA uses key data mining tools to prevent and detect fraud, waste, and abuse in the program. GAO analyzed USDA data, reviewed economic studies, and interviewed USDA officials.
What GAO Recommends
To reduce crop insurance program costs, Congress should consider limiting premium subsidies for individual farmers, reducing subsidies for all farmers, or both. GAO also recommends, in part, that USDA encourage the completion of field inspections. In commenting on a report draft, USDA did not agree that Congress should consider limiting premium subsidies, but GAO believes that when farm income is at a record high and the nation faces severe fiscal problems, limiting premium subsidies is an appropriate area for consideration. USDA agreed with encouraging the completion of field inspections.
What GAO Found
If a limit of $40,000 had been applied to individual farmers’ crop insurance premium subsidies, as it is for other farm programs, the federal government would have saved up to $1 billion in crop insurance program costs in 2011, according to GAO’s analysis of U.S. Department of Agriculture (USDA) data. GAO selected $40,000 as an example of a potential subsidy limit because it is the limit for direct payments, which provide fixed annual payments to farmers based on a farm’s crop production history. Had such a limit been applied in 2011, it would have affected up to 3.9 percent of all participating farmers, who accounted for about one-third of all premium subsidies and were primarily associated with large farms. For example, one of these farmers insured crops in eight counties and received about $1.3 million in premium subsidies. Had premium subsidies been reduced by 10 percentage points for all farmers participating in the program, as recent studies have proposed, the federal government would have saved about $1.2 billion in 2011. A decision to limit or reduce premium subsidies raises other considerations, such as the potential effect on the financial condition of large farms and on program participation.
Since 2001, USDA has used data mining tools to prevent and detect fraud, waste, and abuse by either farmers or insurance agents and adjusters but has not maximized the use of these tools to realize potential additional savings. This is largely because of competing compliance review priorities, according to GAO’s analysis. USDA’s Risk Management Agency (RMA), which is responsible for overseeing the integrity of the crop insurance program, has used data mining to identify farmers who received claim payments that are higher or more frequent than others in the same area. USDA informs these farmers that at least one of their fields will be inspected during the coming growing season. RMA officials told GAO that this action has substantially reduced total claims. The value of identifying these farmers may be reduced, however, by the fact that USDA’s Farm Service Agency (FSA)—which conducts field inspections for RMA—does not complete all such inspections, and neither FSA nor RMA has a process to ensure that the results of all inspections are accurately reported. For example, RMA did not obtain field inspection results for about 20 percent and 28 percent of these farmers, respectively, in 2009 and 2010. As a result, not all of the farmers RMA identified were subject to a review, increasing the likelihood that fraud, waste, or abuse occurred without detection. Field inspections were not completed, in part because FSA state offices are not required to monitor the completion of such inspections. In addition, RMA generally does not provide insurance companies with FSA inspection results when crops are found to be in good condition, although USDA’s Inspector General has reported this information may be important for followup. Past cases have revealed that some farmers may harvest a high-yielding crop, hide its sale, and report a loss to receive an insurance payment. Furthermore, RMA has not directed insurance companies to review the results of all completed FSA field inspections before paying claims that are filed after inspections show a crop is in good condition. As a result, insurance companies may not have information that could help them identify claims that should be denied. View GAO-12-256. For more information,
contact Lisa Shames at (202) 512-3841 or [email protected].
Page i GAO-12-256 Crop Insurance
Letter 1
Background 4A Limit on Crop Insurance Subsidies Would Lower Program Costs 14RMA Has Not Maximized the Use of Data Mining Tools, Largely
Because of Competing Priorities 25Conclusions 35Matter for Congressional Consideration 36Recommendations for Executive Action 36Agency Comments and Our Evaluation 37
Appendix I Objectives, Scope, and Methodology 40
Appendix II Income and Payment Limits for Selected Farm Programs 43
Appendix III Locations of Participating Farmers Receiving More than $40,000 in Premium Subsidies, 2011 44
Appendix IV Information on the Levels of Premium Subsidies and Administrative Expense Subsidies for Individual Farmers 46
Appendix V Comments from the U.S. Department of Agriculture 47
Appendix VI GAO Contact and Staff Acknowledgments 57
Related GAO Products 58
Contents

Page ii GAO-12-256 Crop Insurance
Tables
Table 1: Premium Subsidies and Administrative Expense Subsidies, 2000 through 2011 8
Table 2: Number of RMA Requests for FSA Field Inspections and Percentage of Inspections Completed for Selected States in 2009 and 2010 27
Figures
Figure 1: Financial Relationships among the Federal Government, Private Insurance Companies, Agents, and Farmers 6
Figure 2: Levels of Premium Subsidies that Individual Farmers Received in 2010 16
Figure 3: Levels of Premium Subsidies that Individual Farmers Received in 2011 16
Figure 4: Percentage of Participating Farmers and Value of Premium Subsidies by Individual Farmers Receiving Subsidies of $40,000 or Less, or More than $40,000 in 2010 18
Figure 5: Percentage of Participating Farmers and Value of Premium Subsidies, by Individual Farmers Receiving Subsidies of $40,000 or Less, or More than $40,000 in 2011 19
Figure 6: Locations of Participating Farmers Receiving Premium Subsidies of More Than $40,000, 2011 45
Abbreviations ARPA Agricultural Risk Protection Act of 2000 FSA Farm Service Agency RMA Risk Management Agency SRA Standard reinsurance agreement USDA U.S. Department of Agriculture
This is a work of the U.S. government and is not subject to copyright protection in the United States. The published product may be reproduced and distributed in its entirety without further permission from GAO. However, because this work may contain copyrighted images or other material, permission from the copyright holder may be necessary if you wish to reproduce this material separately.

Page 1 GAO-12-256 Crop Insurance
United States Government Accountability Office Washington, DC 20548
March 13, 2012
The Honorable Tom Coburn Ranking Member Permanent Subcommittee on Investigations Committee on Homeland Security and Governmental Affairs United States Senate
Dear Dr. Coburn:
Federally subsidized crop insurance, which farmers can purchase to help manage the risk inherent in farming, has become one of the most important programs in the farm safety net. Under the federal crop insurance program, farmers can choose various levels and types of insurance protection: they can insure against losses caused by poor crop yields, declines in crop prices, or both, for each insurable crop they produce. In 2011, the crop insurance program provided about $113 billion in insurance coverage for about 264 million acres of farmland, for over 1.1 million policies. The federal government’s crop insurance costs include subsidies to pay for (1) part of a farmer’s crop insurance premiums, which averaged about 62 percent of the total premiums in 2011, and (2) administrative and operating expenses (administrative expenses)—provided on behalf of farmers—to insurance companies to cover their expenses for selling and servicing crop insurance policies. The amount of subsidies—for premiums and administrative expenses—is not limited for individuals or legal entities.
The Congressional Budget Office estimates that, for fiscal years 2013 through 2022, the federal government’s crop insurance costs will average $8.9 billion per year. The cost of the federal crop insurance program has come under increased scrutiny because of the nation’s budgetary pressures, particularly when farm income is at record-high levels. For 2011, the U.S. Department of Agriculture (USDA) reported that 2011 net farm income was a record $98.1 billion. For 2012, USDA estimates that net farm income will decline to $91.7 billion—still the second highest level on record. In addition, according to USDA, the top 5 earnings years for the past 3 decades have occurred since 2004, attesting to the recent profitability of farming. Furthermore, farmland values, another measure of farm prosperity, increased by 85 percent from 2003 through 2011.
We and others have reported over the years on the risks for fraud, waste, and abuse in the crop insurance program and recommended ways to
Page 2 GAO-12-256 Crop Insurance
minimize these risks, including examining data on crop insurance claims to identify potential abuses.1 For example, in 2005, we reported on crop insurance fraud cases investigated by USDA that resulted in criminal prosecutions.2 These cases showed that the farmers, sometimes in collusion with insurance agents and others, falsely claimed weather damage and low production to receive crop insurance payments. Several of these cases also demonstrated the importance of having USDA’s Farm Service Agency (FSA), which administers many farm programs, and Risk Management Agency (RMA), which administers the federal crop insurance program, work together to identify and share information on questionable farming practices and activities.3 In part to improve compliance with, and the integrity of, the crop insurance program, Congress enacted the Agricultural Risk Protection Act of 2000 (ARPA).4
1GAO, Crop Insurance: Actions Needed to Reduce Program’s Vulnerability to Fraud, Waste, and Abuse,
This act provided RMA and FSA with new tools for monitoring and controlling program abuses. Among other things, it required the Secretary of Agriculture to use data mining—a technique for extracting knowledge from large volumes of data—to administer and enforce the crop insurance program. Following USDA’s written procedures, developed pursuant to a requirement in ARPA, RMA provides FSA with a list of farmers who have received payments for anomalous claims—that is, claims that are higher or more frequent than others in the same area and that match RMA scenarios of fraud, waste, or abuse. Under the written procedures, staff in FSA county offices are to inspect the fields of the listed farmers and report the inspection results to RMA.
GAO-05-528 (Washington, D.C.: Sept. 30, 2005); GAO, Crop Insurance: Opportunities Exist to Reduce the Cost of Administering the Program, GAO-09-445 (Washington, D.C.: Apr. 29, 2009); GAO, Crop Insurance: More Needs to Be Done to Reduce Program’s Vulnerability to Fraud, Waste, and Abuse, GAO-06-878T (Washington, D.C.: June 15, 2006); and U.S. Department of Agriculture Office of the Inspector General, Risk Management Agency Compliance Activities, No. 05601-11-At (Washington, D.C: Sept. 16, 2009). 2GAO-05-528. 3FSA, which has an extensive field office structure, is generally responsible for helping farmers enroll in agricultural support programs, overseeing these programs, and issuing program payments. 4The Agricultural Risk Protection Act of 2000, Pub. L. No. 106-224, 114 Stat. 358, amended the Federal Crop Insurance Act .

Page 3 GAO-12-256 Crop Insurance
USDA also administers an array of other farm programs to support farm income, assist farmers after disasters, and conserve natural resources. Unlike the crop insurance program, these other farm programs generally have statutory income and payment limits that apply to individual farmers and legal entities, including corporations, estates, and trusts. For example, USDA provides about $5 billion in fixed annual payments—called direct payments—to farmers based on a farm’s crop production history. However, a person or legal entity with an average adjusted gross farm income (over the preceding 3 tax years) exceeding $750,000 is generally ineligible for direct payments. In addition, for direct payments, the annual payment is generally no more than $40,000 per person or legal entity. In anticipation of the next farm bill, farm groups have made proposals that would result in having crop insurance become the centerpiece of the federal farm safety net, with support through traditional commodity programs playing a significantly reduced role.
In this context, you asked us to identify additional opportunities for reducing the cost of the crop insurance program. Our objectives were to determine (1) the effect on program costs of applying limits on farmers’ federal crop insurance subsidies, as payment limits are applied to other farm programs, and (2) the extent to which USDA has used key data mining tools to prevent and detect fraud, waste, and abuse in the crop insurance program.
To address the first objective, we reviewed eligibility standards, such as adjusted gross income limits and payment limits, in the provisions of the Food, Conservation, and Energy Act of 2008 (2008 farm bill); other statutes; and USDA regulations. We also interviewed FSA and RMA officials regarding eligibility standards and payment limits. To determine the distribution of crop insurance subsidies among farmers who participate in the program, we analyzed RMA data for 2010 and 2011 on the number and percentage of farmers receiving various levels of subsidies and the locations of farmers who received higher subsidies. We selected $40,000 as an example of a potential subsidy limit because it is the payment limit for direct payments, which is one of the largest components of the farm safety net. We also reviewed USDA and others’ studies that examined participation in the crop insurance program and premium subsidies. In addition, we reviewed USDA data on the financial condition of farms of different sizes. To address the second objective, we interviewed officials at RMA headquarters and RMA’s six regional compliance offices to determine RMA’s current uses of data mining results, including data mining related to farmers with anomalous claim payments, as well as insurance agents and adjusters who had anomalous

Page 4 GAO-12-256 Crop Insurance
losses in comparison with their peers in the same geographic area. In addition, we analyzed 2009 and 2010 data on FSA’s completion of field inspections, pursuant to RMA’s data mining list of farmers with anomalous claim payments. We also interviewed officials at FSA headquarters and five FSA state offices—California, Colorado, Florida, North Dakota, and Texas—to obtain information about field inspection processes and obstacles to the completion of these inspections. We selected FSA’s North Dakota office because of its high completion rate of field inspections (96 percent) for 2009 and 2010 and large number of requests for field inspections (378). We selected the other four state offices because, over the 2-year period, they had low completion rates of field inspections (less than 33 percent) and at least 80 requests for field inspections. A more detailed discussion of our scope and methodology is presented in appendix I.
We conducted this performance audit from January 2011 to March 2012 in accordance with generally accepted government auditing standards. Those standards require that we plan and perform the audit to obtain sufficient, appropriate evidence to provide a reasonable basis for our findings and conclusions based on our audit objectives. We believe that the evidence obtained provides a reasonable basis for our findings and conclusions based on our audit objectives.
In conducting their operations, farmers are exposed to financial losses because of production risks—droughts, floods, and other natural disasters—as well as price risks. The federal government has played an active role in helping to mitigate the effects of these risks on farm income by promoting the use of crop insurance. RMA has overall responsibility for administering the federal crop insurance program, including controlling costs and protecting against fraud, waste, and abuse. RMA partners with 15 private insurance companies that sell and service the federal program’s insurance policies and share a percentage of the risk of loss and opportunity for gain associated with the policies.
Through the federal crop insurance program, farmers insure against losses on more than 100 crops. These crops include major crops—such as corn, cotton, soybeans, and wheat, which accounted for three-quarters of the acres enrolled in the program in 2011—as well as nursery crops and certain fruits and vegetables. For the purposes of this report, we generally refer to participants in the federal crop insurance program as participating farmers.
Background

Page 5 GAO-12-256 Crop Insurance
Most crop insurance policies are either production-based or revenue-based. For production-based policies, a farmer can receive a payment if there is a production loss relative to the farmer’s historical production per acre. Revenue-based policies protect against crop revenue loss resulting from declines in production, price, or both. The federal government encourages farmers’ participation in the federal crop insurance program by subsidizing their insurance premiums and acting as the primary reinsurer for the private insurance companies that take on the risk of covering, or “underwriting,” losses to insured farmers. A common measure of crop insurance program participation is the percentage of planted acres nationwide for major crops that are enrolled in the program.
In addition, the federal government pays administrative expense subsidies to insurance companies as an allowance that is intended to cover their expenses for selling and servicing crop insurance policies. In turn, insurance companies use these subsidies to cover their overhead expenses, such as payroll and rent, and to pay commissions to insurance agencies and agents. Companies also incur expenses associated with verifying—adjusting—the amount of loss claimed. These expenses include, for example, loss adjusters’ compensation and their travel expenses to farmers’ fields. The financial relationships among the federal government, private insurance companies, agents, and farmers are illustrated in figure 1.

Page 6 GAO-12-256 Crop Insurance
Figure 1: Financial Relationships among the Federal Government, Private Insurance Companies, Agents, and Farmers

Page 7 GAO-12-256 Crop Insurance
For 2011, the federal government’s subsidy costs were about $7.4 billion for crop insurance premiums and about $1.3 billion for administrative expenses. Crop insurance premium subsidies are not payments to farmers, but they can be considered a financial benefit. Without a premium subsidy, a participating farmer would have to pay the full amount of the premium. The administrative expense subsidies also can be considered a subsidy to farmers; with these subsidies, crop insurance premiums are lower than they would otherwise be if the program followed commercial insurance practices. In private insurance, such as automobile insurance, these administrative expenses typically are included in the premium that a policy holder pays.5
ARPA and the 2008 farm bill set premium subsidy rates, that is, the percentage of the premium paid by the government. Premium subsidy rates vary by the level of insurance coverage that the farmer chooses and the geographic diversity of the crops insured. For most policies, the statutory subsidy rates range from 38 percent to 80 percent. Table 1 shows the total costs of subsidies for all crop insurance premiums and administrative expenses for 2000 through 2011. The table shows that premium subsidies have generally increased since 2000, both in dollars and as a percentage of total premiums. The premium subsidy rates, authorized by ARPA, became effective in 2001. Premium subsidies increased, as a percentage of total premiums, from 37 percent in 2000 to 60 percent in 2001. In addition, premium subsidies rose as crop prices increased.
5Farmers’ benefit from administrative expense subsidies may not be equal to the full amount of these subsidies. That is, to the extent that administrative expense subsidies reflect an inefficient delivery system that provides services that farmers do not need or allows excess profits, these subsidies are not a benefit to farmers.
Costs of Crop Insurance Subsidies That Benefit Farmers

Page 8 GAO-12-256 Crop Insurance
Table 1: Premium Subsidies and Administrative Expense Subsidies, 2000 through 2011
Dollars in millions
Year
Government -paid premium
subsidies
Government–paid premium subsidies as a percentage of
total premiums
Farmer- paid
premiums
Farmer-paid premiums as a percentage of
total premiums Total
premiums
Administrative expense
subsidies 2000 $951 37 $1,589 63 $2,540 $552 2001 1,772 60 1,190 40 2,962 636 2002 1,741 60 1,175 40 2,916 626 2003 2,042 60 1,389 40 3,431 734 2004 2,477 59 1,709 41 4,186 888 2005 2,344 59 1,605 41 3,949 829 2006 2,682 59 1,898 41 4,580 959 2007 3,823 58 2,739 42 6,562 1,333 2008 5,691 58 4,160 42 9,851 2,009 2009 5,426 61 3,523 39 8,950 1,619 2010 4,710 62 2,882 38 7,592 1,368 2011 $7,367 62 $4,455 38 $11,822 $1,330
Source: GAO analysis of RMA data.
a
Note: The premium data are as of October 24, 2011. a
As crop prices increase, the value of the crops being insured increases, which results in higher crop insurance premiums and premium subsidies. For example, the prices of major crops were substantially higher in 2011 than in 2006, and premium subsidies in 2011 (about $7.4 billion) were substantially higher than in 2006 (about $2.7 billion). USDA forecasts that the prices of major crops—corn, cotton, soybeans, and wheat—will continue to be substantially higher than 2006 prices through 2016. Administrative expense subsidies also increased because of higher crop prices. However, RMA capped administrative expense subsidies in the 2011 standard reinsurance agreement (SRA), a cooperative financial agreement between USDA and insurance companies. These changes became effective in 2011. As a result, administrative expense subsidies were lower in 2011 than they otherwise would have been.
The 2011 administrative expense subsidy is estimated.
Page 9 GAO-12-256 Crop Insurance
The federal government provides crop insurance subsidies to farmers in part to achieve high crop insurance participation and coverage levels,6
Congress established a standing disaster program in the 2008 farm bill—the Supplemental Revenue Assistance Payments Program. Under this program, Congress funded a $3.8 billion permanent trust fund and directed the Secretary of Agriculture to make crop disaster assistance payments to eligible farmers who suffer crop losses on or before September 30, 2011. USDA—through FSA—began making disaster payments under this program in early 2010 for crop losses incurred in 2008. To qualify for a disaster assistance payment under this program, a farmer must have purchased either federal crop insurance coverage or be covered under the Noninsured Crop Disaster Assistance Program for all crops of economic significance on their farming operation. Without reauthorization, the Supplemental Revenue Assistance Payments Program will not make payments on losses caused by natural disasters that occurred after September 30, 2011.
which are intended, according to USDA economists, to reduce or eliminate the need for ad hoc disaster assistance payments to help farmers recover from natural disasters, which can be costly. For example, under three separate congressionally authorized ad hoc crop disaster programs, USDA provided $7 billion in disaster assistance payments to farmers whose crops were damaged or destroyed by natural disasters from 2001 through 2007.
Farmers’ participation in the federal crop insurance program and spending on ad hoc disaster assistance have been policy issues for more than 30 years. According to a 2005 USDA publication, Congress passed the Federal Crop Insurance Act in 1980 to strengthen participation in the crop insurance program with the goal of replacing the costly disaster assistance programs.7
6Farmers select a coverage level—that is, the percentage of their normal yield or revenue they want to insure. In 2009, over half of the enrolled corn and soybean acres were at coverage levels above 70 percent.
Crop insurance participation can be measured by acres enrolled in the program, the percentage of eligible acres of major crops and the percentage of a crop’s market value insured—the coverage level. According to the USDA publication, the government has historically
7R. Dismukes and J. Glauber, “Why Hasn’t Crop Insurance Eliminated Disaster Assistance?” Amber Waves, USDA Economic Research Service (June 2005).
Crop Insurance Participation and Disaster Assistance Payments
Page 10 GAO-12-256 Crop Insurance
attempted to increase participation by subsidizing premiums. Under the 1980 law, the government offered premium subsidy rates of up to 30 percent. However, by 1994, less than 40 percent of eligible acreage was enrolled in the program, and Congress had passed ad hoc disaster assistance totaling nearly $11 billion. In order to increase participation, according to the USDA publication, the Federal Crop Insurance Reform Act of 1994 increased premium subsidy rates. Farmers responded by enrolling more acres. Enrollment was about 100 million acres in 1993 before the act and about 182 million acres in 1997. Under ARPA, premium subsidy rates increased again in 2001. Farmers subsequently purchased more insurance at higher coverage levels. With the increases in acres enrolled and coverage levels, premium subsidy costs increased. The 2005 USDA publication noted that by 2004 premium subsidies totaled nearly $2.5 billion and had become an increasingly costly way of encouraging participation. As shown in table 1, premium subsidies reached $7.4 billion in 2011.
From 2008 through 2010, annual payments to farmers for their crop insurance claims averaged about $6 billion. Most claims are legitimate, but some involve fraud, waste, or abuse, according to RMA’S data mining contractor. USDA’s Office of the Inspector General has reported that fraud is commonly perpetrated through false certification of one or more of the basic data elements, such as production history, essential for RMA to determine program eligibility or validity of claims. Crop insurance fraud cases can be particularly complex in their details and correspondingly time-consuming to review. These fraud cases sometimes involve multiple individuals working together, such as farmers, insurance agents, and insurance loss adjusters. Claim payments based on fraudulent crop insurance losses sometimes result in comparatively large monetary costs to USDA. Waste is incurring unnecessary costs as a result of inefficient or ineffective practices, systems, or controls. Waste includes improper payments that may be caused by errors in data upon which claim payments are based. Abuse occurs when a participating farmer’s actions defeat the intent of the program, although no law, regulation, or contract provision may be violated. For example, under the Federal Crop Insurance Act, RMA must offer coverage for prevented planting—that is, if farmers cannot plant a crop for specified reasons, prevented planting coverage enables them to receive a claim payment. In 2005, we noted instances in which FSA county officials stated they believed that some farmers in their counties who claimed prevented planting losses never intended to plant or did not make a good faith attempt to plant their crop but still received prevented coverage claim payments. In 2011, RMA
Potential for Fraud, Waste, and Abuse in the Federal Crop Insurance Program
Page 11 GAO-12-256 Crop Insurance
issued guidance to its field offices and insurance companies to address abuse involving prevented planting.
RMA uses data mining—a technique for extracting knowledge from large volumes of data—to detect potential cases of fraud, waste, or abuse by (1) developing scenarios of potential program abuse by farmers, insurance agents, and loss adjusters and (2) querying the database containing crop insurance data and information on weather, soil, and land surveys to generate reports and lists of participating farmers with anomalous claim payments. RMA has contracted with the Center for Agribusiness Excellence, located at Tarleton State University in Stephenville, Texas, to conduct data mining since 2001. Following USDA written procedures, RMA and the insurance companies are to use data mining results to conduct reviews of the claims to determine if there is actual fraud, waste, or abuse. The data mining tools that RMA uses include the following:
• List of farmers with anomalous claim payments. Through data mining, RMA develops a list of farmers with anomalous claim payments.8
List of insurance agents and adjusters with anomalous losses. ARPA requires the Secretary of Agriculture to establish procedures that RMA can use to develop a list of insurance agents and loss adjusters with anomalous losses—losses that are higher than those of their peers in
RMA annually provides this list to FSA, which assists RMA in monitoring these farmers. Under USDA guidance, FSA county offices are to conduct two inspections (postplanting and preharvest) for each policy these farmers hold. FSA county offices are then to report to RMA on whether they inspected the crop and, if so, whether the inspection determined that (1) the inspected farmer’s crop was in good condition; (2) the inspected farmer’s crop was not in good condition, but other farmers’ crops in the local area were in good condition; or (3) the inspected farmer’s crop was not in good condition, and other farmers’ crops in the local were also not in good condition.
8For the purposes of this report, “farmers with anomalous claim payments” refers to those farmers with claim payments over $10,000. In 2011, RMA, for the first time, asked companies to review farmers with anomalous claims under $10,000 in 2010. These payments totaled over $7 million.
Data Mining to Prevent and Detect Fraud, Waste, and Abuse
Page 12 GAO-12-256 Crop Insurance
the same geographic area—and to review this list to determine whether the anomalous losses are the result of fraud, waste, or abuse. RMA uses data mining and scenarios it has developed for fraud, waste, and abuse to identify these insurance agents and adjusters.
The RMA contractor’s data mining reports identify individual farmers with anomalous claim payments or insurance agents and adjusters with anomalous losses, but these anomalies only indicate potential cases of fraud, waste or abuse. These claims and losses may be legitimate, resulting from unusual weather or other conditions on a farm. As such, a portion of each list inevitably represents “false positives”—farmers whose claims were valid. To determine if there is actual fraud, waste, or abuse, RMA or the insurance company must engage in additional review. Such reviews may require RMA or the company to, among other things, analyze the claims, appraisal sheets, special adjuster reports, photographs, and receipts for inputs, such as seeds and fertilizer. These reviews are needed to determine the validity of the data mining reports; providing feedback on the reports’ validity to the data mining contractor enables RMA’s contractor to refine its data mining tools, thereby improving the detection of fraud, waste and abuse.
RMA administers the crop insurance program through the SRA. This agreement establishes the terms and conditions under which insurance companies that sell and service policies have to operate. Under the 2011 SRA, insurance companies are to conduct reviews, including inspections of crop insurance policies for which anomalies have been identified through data mining, and report the results to RMA. These reviews are not to exceed 3 percent of eligible crop insurance contracts (about 30,000 policies), unless RMA provides notice that additional reviews are required. The SRA also requires insurance companies to conduct inspections or monitoring programs for agents and loss adjusters that RMA has identified as necessary for protecting the program’s integrity.
Standard Reinsurance Agreement
Page 13 GAO-12-256 Crop Insurance
Unlike the crop insurance program, many USDA farm programs—including income support programs, conservation programs, and disaster assistance programs9—have statutory income and payment limits that apply to individual farmers and legal entities. Income limits set the maximum amount of income that a person or legal entity can earn and still remain eligible for certain farm program payments. For example, a person or legal entity with an average adjusted gross farm income (over the preceding 3 tax years) exceeding $750,000 is generally ineligible for direct payments.10 Payment limits set the maximum payment amount that a person or legal entity can receive per year from a farm program. For example, for direct payments, the payment limit in the 2008 farm bill is generally $40,000 per person or legal entity.11 For a disaster assistance program, the annual payment limit is $100,000 per person or legal entity.12
Farming operations are organized in various ways, including as sole proprietorships, partnerships, and corporations. As we have previously reported,
Additional income and payment limits for selected farm programs are described in appendix II.
13
Eligibility for many farm programs also depends on compliance with other standards. For example, to receive direct payments or Average Crop
some farmers and legal entities change the way their farming operations are organized to maximize their farm program benefits. However, other considerations may outweigh the financial gains of making such a change.
9Income support programs help stabilize and support farmers’ income. Conservation programs encourage environmental stewardship of farmlands. Disaster assistance programs help farmers recover financially from a natural disaster. 10A husband and wife may divide their income for the income limit test as if they had filed separate income tax returns. 11A husband and wife can each receive a payment, which enables them collectively to receive up to $80,000 in direct payments annually. 12 USDA’s Farm Service Agency is responsible for ensuring that only eligible individuals receive farm program payments, either directly or as a member of an entity, and do not receive payments that exceed the established limits. 13GAO, Farm Program Payments: USDA Needs to Strengthen Regulations and Oversight to Better Ensure Recipients Do Not Circumvent Payment Limitations, GAO-04-407 (Washington, D.C.: Apr. 30, 2004).
Farm Programs’ Income and Payment Limits and Other Eligibility Standards
Page 14 GAO-12-256 Crop Insurance
Revenue Election Program payments under the 2008 farm bill,14
an individual or entity must be “actively engaged in farming.” To be considered actively engaged in farming, an individual must, among other things, make significant contributions to a farming operation in (1) capital, land, or equipment and (2) personal labor or active personal management. An entity is considered actively engaged in farming if, among other things, the entity separately makes a significant contribution of capital, land, or equipment, and its members collectively make a significant contribution of personal labor or active personal management. In addition, participants in many farm programs who farm in areas identified as having highly erodible land or a wetland must comply with certain land and environmental conservation requirements for payment eligibility purposes. Participants who fail to abide by or apply approved conservation practices on land identified as highly erodible or a wetland are subject to payment reductions or total ineligibility for program payments.
According to our analysis of RMA data for 2011, the federal government would have achieved savings in the crop insurance program by limiting premium subsidies for crop insurance participants, as payments are similarly limited for other farm programs. A decision to limit or reduce premium subsidies to achieve cost savings raises other considerations, such as the potential effect of such a limit on the financial condition of large farms and on program participation.
Without limits on the premium subsidies in the crop insurance program, the nearly 900,000 farmers participating in the program received premium subsidies of $4.7 billion in 2010 and $7.4 billion in 2011. Applying limits on premium subsidies to participating farmers, similar to the payment limits for other farm programs, would lower program costs and save federal dollars, according to our analysis of RMA data. Using a limit of $40,000 per participating farmer for premium subsidies for this period—the limit applied to direct payments—we identified significant potential
14Under the Average Crop Revenue Election Program, farmers may receive revenue-based payments as an alternative to receiving certain other types of farm program payments and must forgo 20 percent of their direct payments.
A Limit on Crop Insurance Subsidies Would Lower Program Costs
A Potential Limit on Crop Insurance Subsidies Would Have Resulted in Savings for 2011
Page 15 GAO-12-256 Crop Insurance
savings to the federal government—savings of up to $358 million for 2010 and $1 billion for 2011.15
The amount of these savings may depend on whether, and the extent to which, farmers and legal entities reorganized their business to avoid or lessen the effect of limits on premium subsidies. As we have previously reported regarding payment limits for other farm programs, some farming operations may reorganize to overcome payment limits to maximize their farm program benefits.
16
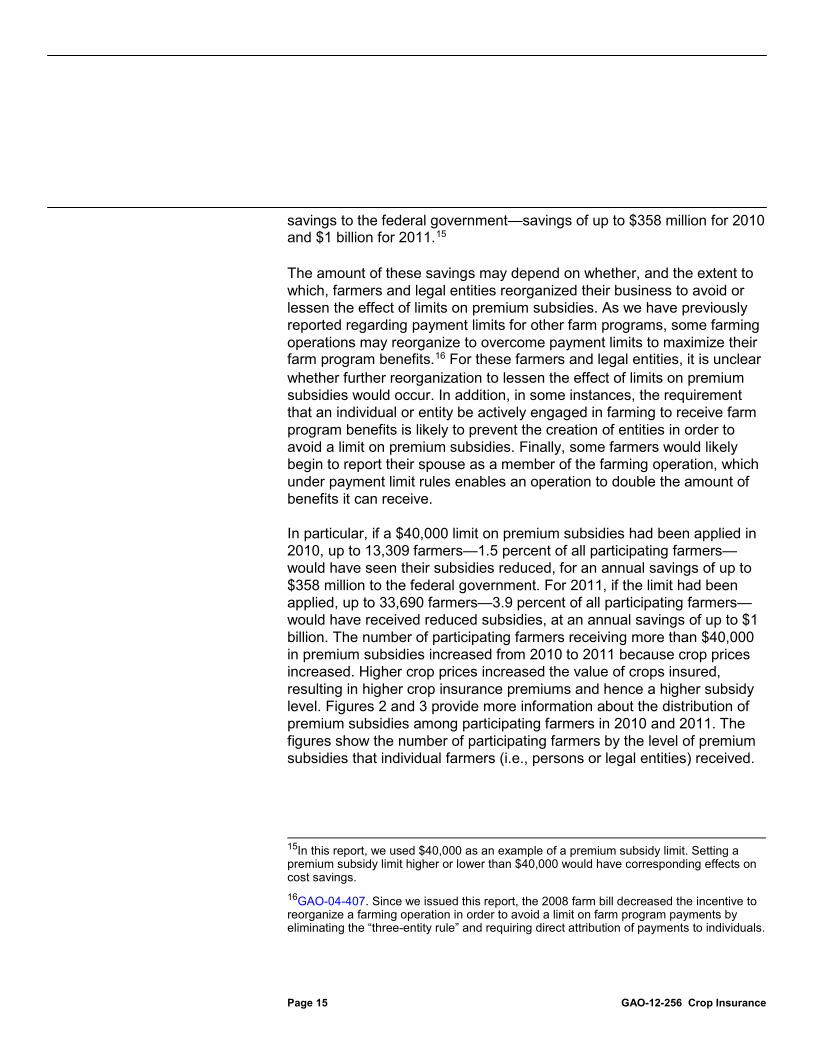
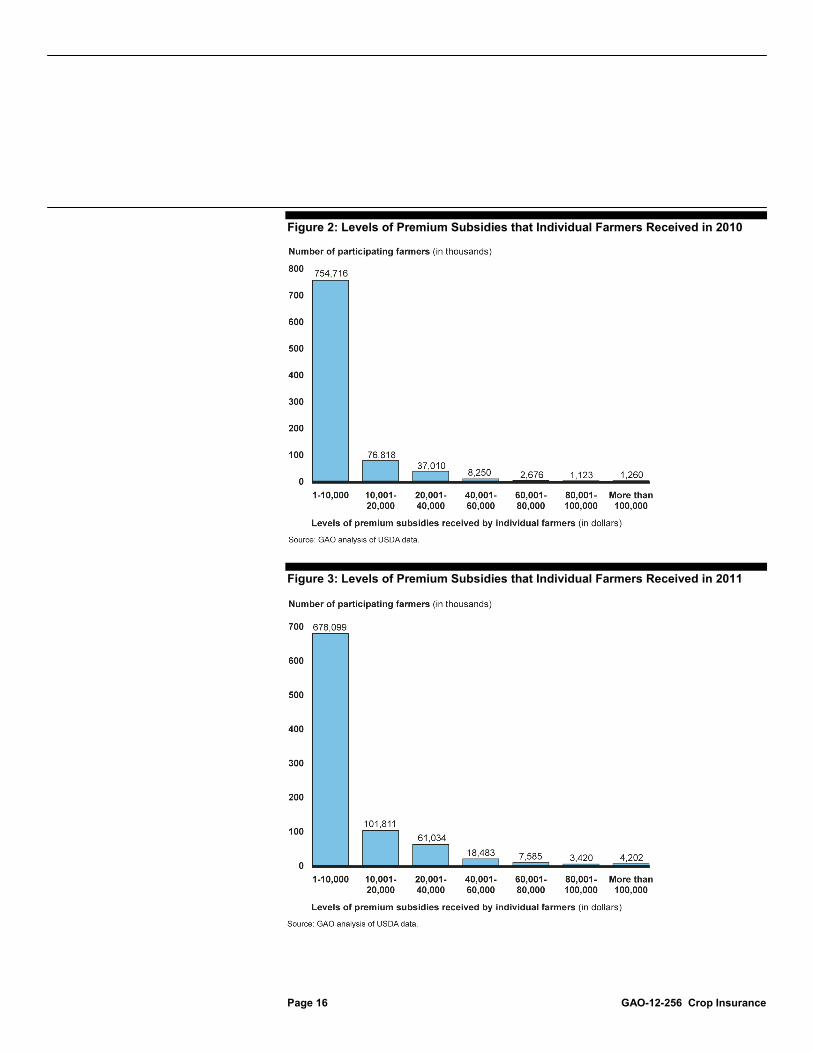
In particular, if a $40,000 limit on premium subsidies had been applied in 2010, up to 13,309 farmers—1.5 percent of all participating farmers—would have seen their subsidies reduced, for an annual savings of up to $358 million to the federal government. For 2011, if the limit had been applied, up to 33,690 farmers—3.9 percent of all participating farmers—would have received reduced subsidies, at an annual savings of up to $1 billion. The number of participating farmers receiving more than $40,000 in premium subsidies increased from 2010 to 2011 because crop prices increased. Higher crop prices increased the value of crops insured, resulting in higher crop insurance premiums and hence a higher subsidy level. Figures 2 and 3 provide more information about the distribution of premium subsidies among participating farmers in 2010 and 2011. The figures show the number of participating farmers by the level of premium subsidies that individual farmers (i.e., persons or legal entities) received.
For these farmers and legal entities, it is unclear whether further reorganization to lessen the effect of limits on premium subsidies would occur. In addition, in some instances, the requirement that an individual or entity be actively engaged in farming to receive farm program benefits is likely to prevent the creation of entities in order to avoid a limit on premium subsidies. Finally, some farmers would likely begin to report their spouse as a member of the farming operation, which under payment limit rules enables an operation to double the amount of benefits it can receive.
15In this report, we used $40,000 as an example of a premium subsidy limit. Setting a premium subsidy limit higher or lower than $40,000 would have corresponding effects on cost savings. 16GAO-04-407. Since we issued this report, the 2008 farm bill decreased the incentive to reorganize a farming operation in order to avoid a limit on farm program payments by eliminating the “three-entity rule” and requiring direct attribution of payments to individuals.
Page 16 GAO-12-256 Crop Insurance
Figure 2: Levels of Premium Subsidies that Individual Farmers Received in 2010
Figure 3: Levels of Premium Subsidies that Individual Farmers Received in 2011

Page 17 GAO-12-256 Crop Insurance
In addition, figures 2 and 3 show that 1,260 participating farmers received more than $100,000 in premium subsidies in 2010, and 4,202 participating farmers received more than $100,000 in premium subsidies in 2011. Even if a higher limit on premium subsidies were applied—$100,000, for example—in 2010 and 2011, the federal government would have still realized savings, according to our analysis—of up to $87 million and $232 million, respectively.
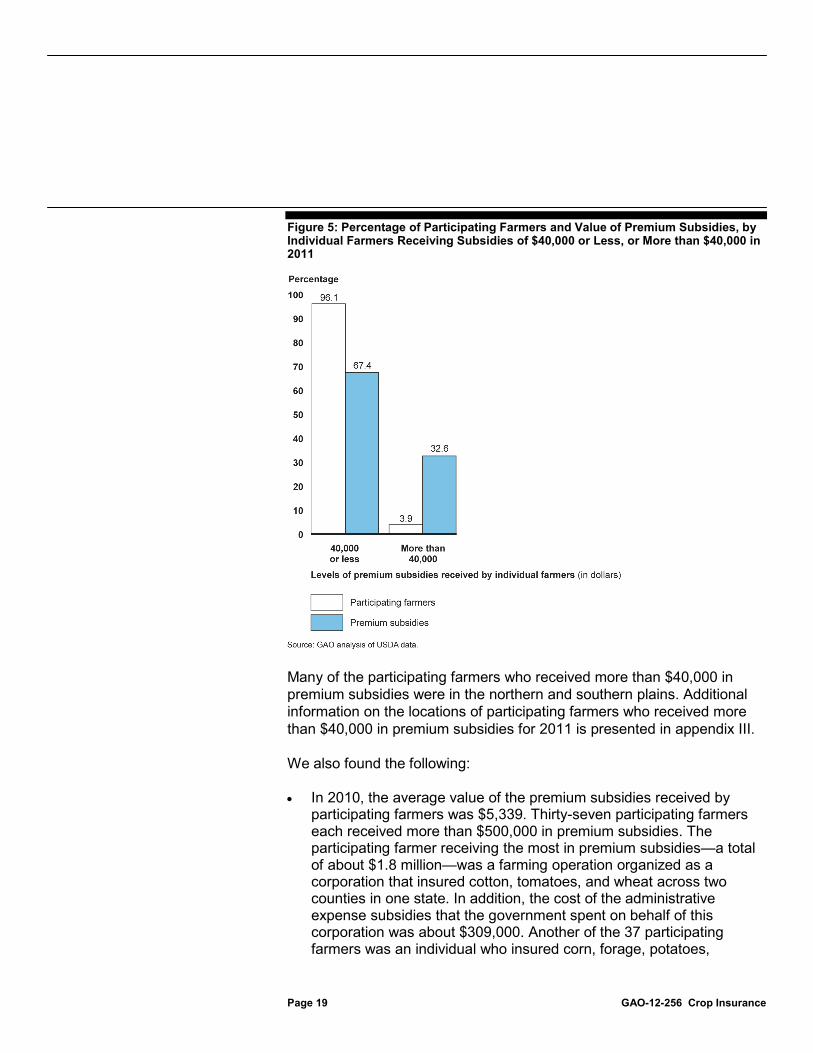
Figures 4 and 5 show, for 2010 and 2011, the percentage of participating farmers and the value of the premium subsidies they received, separated into two groups: those who received premium subsidies of $40,000 or less and those who received premium subsidies of more than $40,000. Figure 4 shows that 1.5 percent of all participating farmers (13,309 participating farmers) accounted for 18.9 percent of the premium subsidies in 2010.17 Figure 5 shows that 3.9 percent of all participating farmers (33,690 participating farmers) accounted for 32.6 percent of the premium subsidies in 2011.18
17Among the 13,309 participating farmers receiving more than $40,000 in premium subsidies, the average insured value of their crops was about $983,000. For all participating farmers, the average insured value of the crops was about $89,000.
18Among the 33,690 participating farmers receiving more than $40,000 in premium subsidies, the average insured value of their crops was about $873,000. For all participating farmers, the average insured value of the crops was about $129,000.

Page 18 GAO-12-256 Crop Insurance
Figure 4: Percentage of Participating Farmers and Value of Premium Subsidies by Individual Farmers Receiving Subsidies of $40,000 or Less, or More than $40,000 in 2010
Page 19 GAO-12-256 Crop Insurance
Figure 5: Percentage of Participating Farmers and Value of Premium Subsidies, by Individual Farmers Receiving Subsidies of $40,000 or Less, or More than $40,000 in 2011
Many of the participating farmers who received more than $40,000 in premium subsidies were in the northern and southern plains. Additional information on the locations of participating farmers who received more than $40,000 in premium subsidies for 2011 is presented in appendix III.
We also found the following:
• In 2010, the average value of the premium subsidies received by participating farmers was $5,339. Thirty-seven participating farmers each received more than $500,000 in premium subsidies. The participating farmer receiving the most in premium subsidies—a total of about $1.8 million—was a farming operation organized as a corporation that insured cotton, tomatoes, and wheat across two counties in one state. In addition, the cost of the administrative expense subsidies that the government spent on behalf of this corporation was about $309,000. Another of the 37 participating farmers was an individual who insured corn, forage, potatoes,

Page 20 GAO-12-256 Crop Insurance
soybeans, sugar beets, and wheat across 23 counties in six states, for a total of about $1.6 million in premium subsidies. In addition, the cost of the administrative expense subsidies that the government spent on behalf of this farmer was about $443,000.
• In 2011, the average value of the premium subsidies received was $8,312. Fifty-three of these farmers each received more than $500,000 in premium subsidies. The largest recipient was a corporation that insured nursery crops across three counties in one state, for a total of about $2.2 million in premium subsidies. In addition, the administrative expense subsidies that the government spent on behalf of this corporation totaled about $816,000. Another of the 53 farmers was an individual who insured canola, corn, dry beans, potatoes, soybeans, sugar beets, and wheat across eight counties in two states, for a total of about $1.3 million in premium subsidies. In addition, the administrative expense subsidies that the government spent on behalf of this farmer totaled about $499,000.
Alternatively, recent studies—noting the rising cost of premium subsidies—have proposed reducing premium subsidy rates for all participating farmers to achieve savings.19
We also examined the effect on costs for the federal crop insurance program of applying a crop insurance subsidy limit to administrative expense subsidies, as well as premium subsidies. Additional savings would be realized, according to our analysis. For example, if a limit of $40,000 per farmer for both premium subsidies and administrative expense subsidies had been applied to the crop insurance program for 2011, up to 52,693 farmers (6 percent of all participating farmers) would have seen their subsidies reduced, at an annual savings of up to nearly $1.8 billion to the federal government. In contrast, applying limits to premium subsidies alone would have resulted in a savings of about $1
For example, if the premium subsidy rate for 2010 and 2011 had been reduced by 10 percentage points—from 62 percent to 52 percent—for all participating farmers, the annual cost savings for those years would have been about $759 million and $1.2 billion, respectively.
19Bipartisan Policy Center’s Debt Reduction Task Force, Restoring America’s Future (Washington, D.C.: November 2010); Congressional Budget Office, Reducing the Deficit: Spending and Revenue Options (Washington, D.C.: March 2011); Office of Management and Budget, Fiscal Year 2013 Budget of the U.S. Government (Washington, D.C.: February 2012).
Page 21 GAO-12-256 Crop Insurance
billion. Additional information about the 2010 and 2011 cost of premium subsidies and administrative expense subsidies by farmer is in appendix IV.
In addition to federal cost savings, we identified a number of other considerations that may come into play in deciding whether to limit premium subsidies to individual farmers. These considerations include (1) the potential effect on the financial condition of large farms (i.e., those with annual gross sales of $1 million or more), whose owners are most likely to be affected by subsidy limits; (2) the availability of other risk management tools against crop losses, such as marketing contracts; and (3) the potential effect on beginning and smaller farmers. In addition, we identified considerations associated with either limiting premium subsidies to large farmers or reducing premium subsidy rates for all farmers.
The application of limits of $40,000 in premium subsidies to farmers participating in the federal crop insurance program would primarily affect farmers who have large farms. For example, as discussed earlier, using our data for 2011, these participating farmers represented 3.9 percent of the farmers participating in the crop insurance program in 2011 and accounted for 32.6 percent of the premium subsidies. In view of the insured value of these farmers’ crops, they likely had annual gross sales approaching or exceeding $1 million. In addition, the insured value of these farmers’ crops represented about 26 percent of the total value of insured crops in 2011.20
• During 2008 and 2009, the most recent years for which USDA data were available, the largest farms with crop insurance coverage (i.e., those with annual gross sales of $1 million or more) earned an average annual net farm income of about $561,000. In contrast, the next two farm categories (farms with annual gross sales of from $500,000 to $1 million and farms with annual gross sales of from
Limiting premium subsidies to farmers may raise concerns about how these limits could affect large farms’ financial condition. Based on our review of data from USDA’s Agricultural Resource Management Survey on the financial condition of farms, by farm size, large farms are better positioned than smaller farms to pay a higher share of their premiums. Specifically, according to the USDA data:
20We used 2011 numbers because, based on USDA crop price projections, 2011 is generally more indicative of the future than 2010.
Limiting or Reducing Premium Subsidies Raises Other Considerations
Potential Effect on Large Farms’ Financial Condition

Page 22 GAO-12-256 Crop Insurance
$250,000 to $500,000) had average annual net farm incomes of about $184,000 and $92,000, respectively.
• The largest farms with crop insurance coverage had higher relative profitability as measured by rate of return on equity, which is the ratio of net farm income to the net worth of the farm. These farms had an average rate of return on equity of 8.8 percent. In contrast, the next two farm categories had rates of 4.5 percent and 1.9 percent, respectively.
• The largest farms had higher debt-to-asset ratios than the next two farm categories,21
In addition, regarding the financial condition of large farms, a related consideration is the global competiveness of U.S. agriculture. According to critics of limits on farm program benefits, larger farms should not be penalized for the economies of size and efficiencies they have achieved, and farm programs should help make U.S. farmers more competitive in global markets.
but the largest farms’ ability to service debt by covering principal payments and interest on term debt was greater. Furthermore, a high debt-to-asset ratio is not necessarily a problem, as long as the rate of return on assets exceeds the interest rate on the funds borrowed. On average, farms with sales greater than $5 million generate more net cash income per dollar of assets than other farms, and the larger gross cash income can be used to pay interest or reduce loan balances.
If the large farmers affected by a limit on premium subsidies were to reduce their coverage, they may be able to self-insure through a variety of risk management methods, including the following:
• Marketing contracts. Marketing contracts reduce price risks and are already used by many large farmers. These contracts are either verbal or written agreements between a buyer and a farmer that set a price for a commodity before harvest or before the commodity is ready to be marketed.
21A debt-to-asset ratio is a ratio of the farm’s total debt to total assets, showing the share of assets owed to creditors. It is a measure of the risk exposure of the farm business, with a higher ratio corresponding to greater risk. According to a 2012 Congressional Research Service Report, the debt-to-asset ratio for all farms is expected to fall to 10.3 percent in 2012, the lowest ratio on record.
Availability of Other Risk Management Tools against Crop Losses

Page 23 GAO-12-256 Crop Insurance
• Futures contracts and hedging. A futures contact is a financial contract obligating the buyer to purchase an asset (or the seller to sell an asset), such as a commodity, at a predetermined future date and price. Futures contracts detail the quality and quantity of the underlying asset and are standardized to facilitate trading on a futures exchange. Futures can be used to hedge on the price movement of the underlying asset. For example, a producer of corn could use futures to lock in a certain price and manage risk (hedge).
• Crop and other enterprise diversification. Diversification is a risk management strategy that involves participating in more than one activity. A crop farm, for example, may have several productive enterprises (i.e., several different crops or both crops and livestock), or may operate nonadjacent parcels so that local weather disasters are less likely to reduce yields for all crops simultaneously.
• Liquid credit reserves. Farmers may maintain liquid credit reserves, such as an open line of credit, to generate cash quickly to meet financial obligations in the face of an adverse event. Liquid credit reserves reflect unused borrowing capacity.
• Private insurance. Certain agricultural risks—such as the risks associated with hail and other weather events damage—are insured by private companies without subsidized premiums.
Unlimited premium subsidies for individual farmers and farm entities may compound challenges that beginning and smaller farmers already face. For example, we reported in 2007 that the challenges facing beginning farmers include obtaining capital to purchase land and that the rising cost of land, driven in part by farm program subsidies, may make it difficult for beginning farmers to purchase land.22 According to USDA studies, farm program payments and other benefits, such as premium subsidies, result in higher prices to buy or rent land because, in some cases, the benefits go directly to landowners—resulting in higher land value—and in other cases the benefits go to tenants, prompting landlords to raise rental rates.23
22GAO, Beginning Farmers: Additional Steps Needed to Demonstrate the Effectiveness of USDA Assistance,
Furthermore, a recent USDA report explained how farm program
GAO-07-1130 (Washington, D.C.: Sept. 18, 2007). 23These studies analyzed the effects of farm program payments. Crop insurance premium subsidies have a similar effect, though the link is less direct.
Effect on Beginning and Smaller Farmers
Page 24 GAO-12-256 Crop Insurance
payments may provide an advantage to larger farms.24
We identified additional considerations associated with either limiting premium subsidies to large farms or reducing premium subsidy rates for all farmers.
According to this report, “For some farmers, payments may provide opportunities to increase the size of their operation. A steady stream of income may allow recipients to gain access to higher levels of credit or may allow them to increase their rental or purchase bids for land. This may provide opportunities for them to increase in size while driving out competition from smaller farms that don’t have access to the same levels of capital, which can impact the overall structure of agriculture.”
Premium subsidy limits or reduced premium subsidy rates could lead to lower participation in the federal crop insurance program and higher disaster assistance payments to farmers. In the past, Congress has authorized ad hoc disaster assistance payments to help farmers whose crops were damaged or destroyed by natural disasters. However, in view of the nation’s budgetary pressures, Congress may be less willing to approve such payments than it has in the past. In addition, according to a Congressional Budget Office report,25
As a member of the World Trade Organization, the United States has made commitments to limit domestic agricultural support that is most likely to distort trade. Under the current World Trade Organization agreement, the United States is committed to spending no more than $19.1 billion per year on this support. Keeping this domestic agricultural
the increasing importance of crop insurance to private lenders who provide farm loans may cause farmers to continue to participate in the crop insurance program, even if premium subsidies were reduced. Furthermore, assuming they are eligible to purchase unsubsidized crop insurance, farmers could still enroll all of their eligible crop acres in the program, making them eligible to receive claim payments on these acres. In the event of a loss, farmers who chose to maintain crop insurance coverage as they had in the past would then have the same level of protection.
24USDA Economic Research Service, The Changing Organization of U.S. Farming (Washington, D.C.: December 2011). 25Congressional Budget Office, Reducing the Deficit: Spending and Revenue Options (Washington, D.C.: March 2011).
Additional Considerations to Limiting or Reducing Subsidies

Page 25 GAO-12-256 Crop Insurance
support below this limit is likely to be a consideration of policymakers when they are developing or modifying farm programs. In August 2011, when the United States reported its domestic agricultural support for 2009 to the World Trade Organization, it included the value of crop insurance premium subsidies—$5.4 billion—in its submission as nonproduct-specific support.26
This $5.4 billion was the largest amount reported as nonproduct-specific support, which totaled $6.1 billion. However, under the current agreement, nonproduct-specific support in 2009 did not count toward the United States’ limit of $19.1 billion.
Since 2001, RMA has used data mining tools to prevent and detect fraud, waste, and abuse in the crop insurance program by either farmers or insurance agents and adjusters, but it has not maximized their use to realize potential additional savings, largely because of competing compliance review priorities. In particular, using data mining tools, RMA develops lists of farmers with anomalous claim payments and informs these farmers that their fields will be inspected. In addition, investigators from RMA and USDA’s Office of the Inspector General sometimes use the list of agents and adjusters—identified through data mining—who have anomalous losses to corroborate information from other sources, but RMA has not conducted required reviews of agents and adjusters to determine whether anomalous losses are the result of fraud, waste, and abuse. RMA has not maximized the use of data mining tools, largely because of competing compliance review priorities, according to RMA documents we examined and officials we spoke with. In addition, RMA and FSA have not taken full advantage of data management techniques to increase the effectiveness of data mining.
Using data mining, RMA has identified farmers with anomalous claim payments (listed farmers), as called for under USDA procedures developed pursuant to an ARPA requirement. In addition, as described in these procedures, at RMA’s request, FSA has sent letters informing these farmers that an official in the FSA county office would inspect the crop in at least one of their fields during the growing season and report the results of the field inspection to RMA. For example, in 2010—the most
26“U.S. Domestic Support Notification for Marketing Year 2009,” G/AG/N/USA/80, World Trade Organization, August 29, 2011.
RMA Has Not Maximized the Use of Data Mining Tools, Largely Because of Competing Priorities
Letters to Farmers Have Prevented Fraud, Waste, and Abuse, but RMA Has Not Fully Used This Data Mining Tool
Page 26 GAO-12-256 Crop Insurance
recent year for which data are available—RMA asked FSA to send letters to 1,747 listed farmers for each of their 2,452 policies with anomalous claim payments. RMA officials told us that the letters act as a warning and have substantially reduced total claims, by an estimated $838 million from 2001 through 2010. According to RMA officials, about two-thirds of the farmers who receive a letter from FSA reduce or stop filing claims for at least 2 or 3 years following receipt of the letter, and one-third of farmers make additional anomalous claims after being placed on the list; some of these claims are likely to be legitimate.
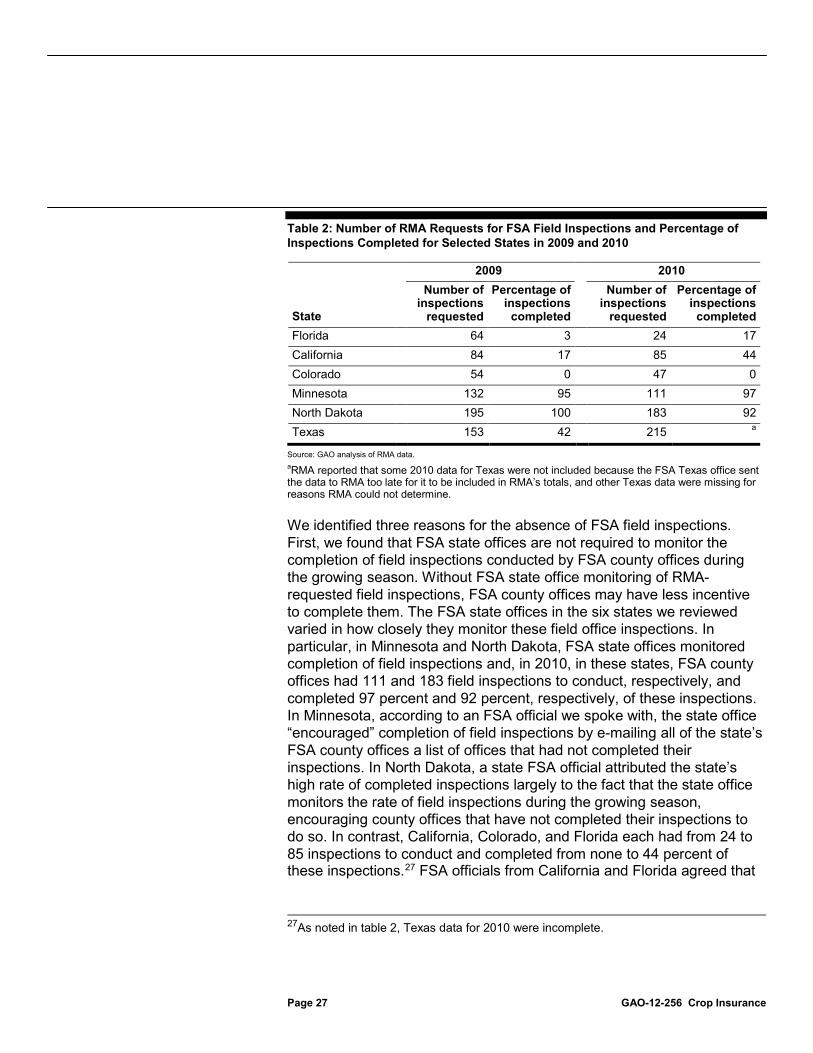
The value of identifying farmers with anomalous claim payments may be undermined, however, by the fact that FSA does not complete all field inspections, and neither FSA nor RMA has a process to ensure that the results of all completed inspections are accurately reported, in accordance with USDA’s written procedures. In particular, in 2009 and 2010, RMA did not have field inspection results for 20 percent and 28 percent, respectively, of the fields for farmers listed as having anomalous claim payments. Four states—California, Colorado, Florida, and Texas—accounted for more than 40 percent of the missing data. For example, in Florida, FSA inspected a field for 8 of the 88 farmers with anomalous claim payments, according to our review of RMA records. If FSA does not complete all field inspections requested by RMA, not all farmers who have had anomalous claim payments will be subject to a review, increasing the likelihood that fraud, waste, or abuse may occur without detection. Table 2 shows the number of requests RMA made for FSA field inspections and the percentage of fields inspected for 2009 and 2010 in selected states.
Page 27 GAO-12-256 Crop Insurance
Table 2: Number of RMA Requests for FSA Field Inspections and Percentage of Inspections Completed for Selected States in 2009 and 2010
2009 2010
State
Number of inspections
requested
Percentage of inspections
completed
Number of inspections
requested
Percentage of inspections
completed Florida 64 3 24 17 California 84 17 85 44 Colorado 54 0 47 0 Minnesota 132 95 111 97 North Dakota 195 100 183 92 Texas 153 42 215
Source: GAO analysis of RMA data.
a
a
We identified three reasons for the absence of FSA field inspections. First, we found that FSA state offices are not required to monitor the completion of field inspections conducted by FSA county offices during the growing season. Without FSA state office monitoring of RMA-requested field inspections, FSA county offices may have less incentive to complete them. The FSA state offices in the six states we reviewed varied in how closely they monitor these field office inspections. In particular, in Minnesota and North Dakota, FSA state offices monitored completion of field inspections and, in 2010, in these states, FSA county offices had 111 and 183 field inspections to conduct, respectively, and completed 97 percent and 92 percent, respectively, of these inspections. In Minnesota, according to an FSA official we spoke with, the state office “encouraged” completion of field inspections by e-mailing all of the state’s FSA county offices a list of offices that had not completed their inspections. In North Dakota, a state FSA official attributed the state’s high rate of completed inspections largely to the fact that the state office monitors the rate of field inspections during the growing season, encouraging county offices that have not completed their inspections to do so. In contrast, California, Colorado, and Florida each had from 24 to 85 inspections to conduct and completed from none to 44 percent of these inspections.
RMA reported that some 2010 data for Texas were not included because the FSA Texas office sent the data to RMA too late for it to be included in RMA’s totals, and other Texas data were missing for reasons RMA could not determine.
27
27As noted in table 2, Texas data for 2010 were incomplete.
FSA officials from California and Florida agreed that

Page 28 GAO-12-256 Crop Insurance
it would be a good practice to monitor the completion of field inspections during the growing season at the state or district level to hold the county offices accountable.
Second, FSA state officials in two of the four states with low inspection rates told us that insufficient resources were a key reason that county offices had not completed FSA inspections. These officials said that staffing had decreased for the past several years, but workload had increased.
Third, some FSA state officials said that county office staff may hesitate to spend time and effort on inspections when they do not believe the inspections will have any impact. For example, they said that neither they nor county officials are informed of any action taken on their inspection results and that county officials are discouraged when their inspections do not result in actions against the farmers who appear to be engaged in negligent farming practices. However, at least one RMA compliance office—RMA’s Northern Regional Compliance Office—does provide feedback to FSA. This office is responsible for Iowa, Minnesota, Montana, North Dakota, South Dakota, Wisconsin, and Wyoming. According to an FSA official in North Dakota, RMA’s Northern Regional Compliance Office sends FSA state officials letters describing the results of reviews RMA requested the insurance companies to conduct based on FSA inspections, and the state officials are to forward this information to the counties.
In addition, in 2010, as provided for under the SRA, RMA regional compliance offices directed insurance companies to review and report on farmers’ policies to ascertain whether fraud, waste, or abuse had occurred. These RMA offices have generally directed such reviews in two situations. First, when FSA inspectors reported that farmers’ crops were in worse condition than their peers, RMA regional compliance offices may direct companies to analyze the claims, documenting their work with appraisal sheets, special adjuster reports, pictures, and receipts for inputs such as seeds and fertilizer. Second, when farmers have anomalous claims data related to production history—a key factor in determining the total claims farmers make—RMA offices may direct the insurance companies to review these policies.

Page 29 GAO-12-256 Crop Insurance
USDA’s Office of the Inspector General reported in 2009 that RMA lacks documented procedures for following up on cases where farmers file claims after FSA’s field inspections indicate that crops are in good condition, and the farmer should not experience a loss. 28 Under the Standards for Internal Control in the Federal Government, federal agencies are to employ control activities, such as clearly documenting internal control in management directives, administrative policies, or operating manuals, and the documentation is to be readily available for examination.29
Without documented agency policies and procedures for reviewing farmers’ policies identified by data mining reports, RMA cannot provide reasonable assurance that the farmers’ policies would be reviewed consistently. The Inspector General added that, since RMA’s resources are not unlimited, the agency should consider requiring that insurance companies perform as much of this work as possible. In this regard, as we noted above, about one-third of farmers listed as having anomalous claim payments again claim losses after being placed on the list. RMA has not maximized the use of the list of farmers with anomalous claim payments by, for example, directing insurance companies to review these farmers’ claims before paying them after FSA has reported the crops to be in good condition. According to three current and former RMA and Office of the Inspector General officials, because these farmers have previously had anomalous claim payments, their claims warrant a review, particularly when FSA’s inspection found their crops to be in good condition within weeks of the time that the farmer made a claim.
28USDA Office of the Inspector General, RMA Compliance Activities. 29See GAO, Standards for Internal Control in the Federal Government, GAO/AIMD-00-21.3.1 (Washington, D.C.: November 1999). These standards, issued pursuant to the requirements of the Federal Managers’ Financial Integrity Act of 1982, provide the overall framework for establishing and maintaining internal control in the federal government.

Page 30 GAO-12-256 Crop Insurance
Investigators from RMA and USDA’s Office of the Inspector General said that they use the list of insurance agents and loss adjusters with anomalous losses at times to corroborate information from other sources—such as the Office of the Inspector General’s fraud hotline—rather than as a basis for initiating reviews. However, RMA has not fully met a statutory ARPA requirement to conduct a review of agents and adjusters with higher losses than their peers to determine whether the losses associated with these individuals are the result of fraud, waste, or abuse.
Officials from RMA and its data mining contractor told us of an instance in which an investigator in USDA’s Office of the Inspector General used the list of insurance agents and loss adjusters with anomalous losses as a starting point. Based on information in the list, the investigator began calling other USDA Inspector General investigative offices to determine whether they were also familiar with an agent who frequently had large anomalous losses. As a result of the list and telephone calls, the investigator identified an Inspector General hotline informant who had filed complaints about the same agent; the investigator initiated a review that became the largest crop insurance fraud case in U.S. history; this case involved tobacco farmers and insurance agents and adjusters working together. According to the Office of the Inspector General, the case may result in lower program costs of more than $80 million and continues to expand to more related reviews.
We also found that RMA had not fully met a requirement to conduct a review of agents and adjusters with higher losses than their peers to determine whether the losses associated with these individuals are the result of fraud, waste, or abuse. In 2009, the Inspector General found that RMA was not reviewing these individuals and recommended that RMA develop policies and procedures for reviewing disparately performing agents and adjusters to assess whether the higher-than-average loss ratios for the agents and adjusters identified are the result of potential fraud, waste, or abuse. According to RMA officials we interviewed, RMA had not fully met this requirement because of resource constraints, among other things. These officials told us that investigating agents and loss adjusters is more complex and time-consuming than investigating individual farmers because one agent or adjuster may be identified with a dozen or more policies. In addition, officials said, the insurance company database used to develop the list includes agents who are not servicing the policy they are identified with. RMA officials told us that they have discussed the problem of inaccurate data with insurance companies and that the companies have made improvements, but they could not specify
USDA May Use the List of Agents and Adjusters with Anomalous Losses to Corroborate Other Information, but RMA Does Not Conduct Required Reviews
Page 31 GAO-12-256 Crop Insurance
the extent of the problem or the improvements. Some RMA officials also pointed out that investigators use many different data mining tools and that it may be a better use of resources if the requirement for RMA to review the list of agents and adjusters was changed to allow RMA to review agents and adjusters and farmers using a variety of data mining tools, such as a software program that helps investigators identify links among producers, agents, or adjusters who are jointly engaged in activities that are anomalous. In addition, in response to another 2000 ARPA requirement, RMA included in the 2011 SRA a provision directing insurance companies to annually evaluate the performance of every agent and loss adjuster, including their loss ratios and the number and type of errors made by an agent or adjuster. The SRA does not, however, require additional focus on agents and adjusters identified as having anomalous losses through data mining.
According to RMA documents we examined and five of the six RMA regional compliance officials we spoke with, RMA staff devote most of their time to three priority compliance activities aimed at detecting fraud, waste, and abuse in crop insurance. As a result, they have limited time to review individuals identified by data mining tools, such as the list of farmers with anomalous claim payments and the list of agents and adjusters with anomalous losses. Specifically, regional compliance offices are responsible for carrying out the following priority activities:
• Reconciling conflicting RMA/FSA data associated with an FSA disaster assistance program, the Supplemental Revenue Assistance Payments Program. RMA headquarters directs staff to reconcile RMA data, such as the number of acres for which a farmer is claiming a loss, with FSA data on the number of acres planted. According to an RMA document, as of August 5, 2011, FSA had identified more than 5,000 discrepancies for 2008 and 2009 and sent these to RMA, and RMA regional compliance offices had resolved over half of them. RMA officials said that they do not use data mining to determine priorities for reconciliations because they are required to reconcile every discrepancy referred by FSA, even if it is a $10 discrepancy. In addition, the RMA Administrator told us that insurance companies that are asked to help RMA resolve discrepancies have discussed the substantial costs they incur to correct small errors.
• Reviewing crop insurance policies to comply with the Improper Payments Information Act of 2002. RMA staff review 250 randomly selected policies each year, as agreed with the Office of Management
Competing RMA Priorities Result in Limited Time to Conduct Reviews of Farmers and Agents and Adjusters Identified by Data Mining Tools
Page 32 GAO-12-256 Crop Insurance
and Budget, to estimate a payment error rate. Some RMA officials said that they would prefer to focus more attention on using data mining to review high-risk policies to detect and prevent fraud, waste, and abuse and focus less attention on conducting reviews to estimate an error rate.
• Reviewing potential cases of fraud, waste, or abuse in the crop insurance program that were identified through hotline calls and referred by USDA’s Inspector General. According to RMA data, each year the agency opens and closes several hundred cases of potential fraud, waste, and abuse involving thousands of crop insurance policies; some field offices reported having large backlogs of cases to address. Several RMA officials said they would like to use data mining to determine which referrals they should review, but Office of the Inspector General policy requires them to review all of these referrals within 90 days. They noted that some referrals provide little information or relate to small-value policies, but RMA may give priority to these referrals over reviews with a potentially greater cost-benefit result because of the Office of the Inspector General policy.
We identified three areas in which RMA and FSA have not taken full advantage of data management techniques to increase the effectiveness of data mining: inaccurate and incomplete FSA field inspection data for listed farmers, the insufficiency of the data collected from insurance companies on the results of their reviews, and RMA’s not providing insurance companies with results for most FSA inspections.
Certain FSA field inspection data for listed farmers may be inaccurate and incomplete because the results of the inspections may be reported late or not at all. This problem arises because RMA and FSA have a complicated process for transmitting the data, creating opportunities for errors and omissions. Specifically:
• Staff in about 1,000 FSA county offices transmit their field inspection data to nearly 50 state offices by e-mailing data, mailing CDs or paper documents, or inputting the data in their FSA computer systems.
• The FSA state offices e-mail or mail the data, in its different formats, to six RMA regional compliance offices.
• Two of the six RMA regional compliance offices retype the data into an RMA system, and the other four offices retype a small portion of the data—the field inspection date and crop conditions—into a
RMA and FSA Have Not Taken Full Advantage of Data Management Techniques to Facilitate Data Mining
Inaccurate and Incomplete FSA Field Inspection Data for Listed Farmers
Page 33 GAO-12-256 Crop Insurance
spreadsheet that already contains the original data mining information, such as the policy number and participating farmer’s name. The six offices then send the FSA data to RMA’s data mining contractor for analysis.
Through interviews with FSA state officials and a review of the data on FSA field inspection results, we identified several examples of errors and omissions that had occurred in the process of recording and transmitting the data from FSA to RMA and its data mining contractor for additional analysis and followup on anomalous claims and to its data mining contractor for further analysis. For example:
• Officials in three FSA state offices said that additional field inspections likely have been done even though the data for them are missing. They said that some county staff had not been trained on how to enter inspection results into the FSA computer system and therefore did not always report information on completed inspections to state FSA offices so that it could be provided to RMA.
• FSA state offices, at times, did not forward field inspection data to RMA for several months after the inspections were completed, according to our analysis of FSA records and an RMA official. All of the field inspection data for one state were missing from RMA’s data mining contractor records because the FSA state office provided the data to RMA after RMA had sent inspection data to the data mining contractor for analysis. At least 10 percent of the data for another state were missing for the same reason. One RMA official noted that FSA occasionally provides late responses for fields with crops in worse condition than others in the area. Such delays mean that RMA cannot ask insurance companies to review the fields for these policies before harvest or making a claim payment, when insurance adjusters could determine whether the crop was being deliberately managed in a way that reduces yield.
According to RMA officials and contractor staff, they have recognized these problems and proposed using software that other USDA agencies use in a new process to transmit the data from the FSA county offices directly to a USDA system while providing access to RMA and FSA. They told us that they are planning to implement the new system before 2012 field inspections have begun and believe the new system will eliminate problems we identified.

Page 34 GAO-12-256 Crop Insurance
RMA does not collect sufficient data from insurance company reviews in an electronic format that facilitates its data mining, according to RMA officials. RMA uses an electronic form to collect data from all types of company reviews, including those that RMA requested as a result of data mining and those that were requested because of Office of the Inspector General hotline referrals. However, this form does not provide the data mining contractor with sufficient information on which records the insurance companies reviewed and why they reviewed these records in order to determine if an adjustment needs to be made to improve data mining, according to RMA officials and the data mining contractor. In addition, RMA officials and the data mining contractor told us that the electronic form does not provide an efficient way of sorting out the data needed for data mining. RMA officials said that more complete data on the insurance company reviews are important for improving data mining because insurance companies often have information that RMA does not have that can explain why an anomalous claim is being made. The data mining contractor stated that it had developed proposals for revising the electronic form to collect information that could help it improve data mining lists, such as the list of farmers with anomalous claim payments and agents and adjusters with anomalous losses. In 2009, the Inspector General also concluded that the data mining contractor needed such information to refine data mining reports. Without an electronic mechanism to collect sufficient data from insurance companies on their reviews, RMA is limited in the analyses it can conduct and in the improvements it can make in data mining. As a result, RMA may be missing opportunities for savings that result from better data mining. RMA officials said that they are considering making changes so that the data mining contractor receives additional information.
RMA generally does not provide insurance companies with field inspection results for most FSA inspections—that is, those for fields in good condition—but provides them with the field inspection results for a small portion of the farmers—those with crops in worse condition than their peers. However, inspection information on fields in good condition is important—particularly for inspections that occurred shortly before a claim was made. Past cases have revealed that some farmers may harvest a high-yielding crop, hide the sale of that crop, and report a loss to receive an insurance payment. USDA’s Inspector General has reported on the need to use FSA field inspection information to identify potential fraud,
Insufficiency of the Data Collected from Insurance Companies on the Results of Their Reviews
RMA Is Not Providing Companies with Results for Most FSA Inspections
Page 35 GAO-12-256 Crop Insurance
waste, and abuse.30
For example, in 2009, the Inspector General reported on two farmers on the list of farmers with anomalous claim payments whose crops were in good condition, according to the FSA inspection; however, these farmers filed nearly $300,000 in claims a short time after the FSA inspection, and RMA did not notice the discrepancy. RMA’s data mining contractor stated that it could, with a few days of effort, provide all the FSA field inspection data to the insurance companies, including those on crops in good condition, which represent the bulk of inspections.
Federal crop insurance plays an important role in protecting farmers from losses caused by natural disasters and price declines, and it has become one of the most important programs in the safety net for farmers. As we have discussed, unlike other farm programs, the crop insurance program does not limit the subsidies that a farmer can receive. Without subsidy limits, a small number of farmers receive relatively large premium subsidies and a relatively large share of total premium subsidies. In addition, premium subsidies for all farmers, which averaged 62 percent of premiums in 2011, have increased substantially since 2000. With increasing pressure to reduce the federal budget deficit and with record farm income in recent years, it is critical that taxpayer-provided funds for the farm safety net are spent as economically as possible. Limits on premium subsidies to individual farmers or reductions in the amount of premium subsidies for all farmers participating in the crop insurance program, or both limits and reductions, present an opportunity to save hundreds of millions of dollars per year for taxpayers without compromising this safety net.
In addition, RMA has made substantial progress over the past decade in developing data mining tools to detect and prevent fraud, waste, and abuse from a list of farmers who have received payments for anomalous claims, but RMA’s use of these tools lags behind their development, largely because of competing priorities. By not maximizing the use of these tools, RMA may be missing opportunities to identify and prevent losses to the federal government that result from fraud, waste, or abuse. Furthermore, because FSA does not require its state offices to monitor, during the growing season, completion of its county office field
30U.S. Department of Agriculture Office of the Inspector General, RMA Compliance Activities.
Conclusions

Page 36 GAO-12-256 Crop Insurance
inspections for farmers with anomalous claim payments, and because FSA does not always communicate its inspection results to RMA in a timely manner, RMA and FSA may not know about farmers who improperly manage their crops or falsely report losses. FSA state offices that do such monitoring seem to encourage a higher completion rate of county office field inspections. RMA has also not provided insurance companies with most FSA inspection results, particularly findings that crops were in good condition, or directed insurance companies to review the results of all completed FSA field inspections before paying claims that occur after inspections showed a crop was in good condition. As a result, insurance companies may not have information that could help them identify claims that should be denied.
RMA has also not realized the potential of data mining tools to enhance its detection of fraud, waste, and abuse on the part of insurance agents and adjusters, including addressing the ARPA requirement to review agents and adjusters identified as having anomalous losses. Furthermore, RMA has not taken steps requiring minimal resources, for example, by directing insurance companies, during annual performance evaluations of agents and adjusters, to focus more attention on the list of agents and adjusters with such losses. In addition, RMA’s electronic form does not collect sufficient data from insurance companies on their reviews in order to facilitate the use of these reviews in data mining.
To reduce the cost of the crop insurance program, Congress should consider limiting the subsidy for premiums that an individual farmer can receive each year or reducing the subsidy for all farmers participating in the program, or both limiting and reducing these subsidies.
To help prevent and detect fraud, waste, and abuse in the federal crop insurance program, we recommend that the Secretary of Agriculture direct the Administrator of RMA and the Administrator of FSA, as appropriate, to take the following four actions:
• For the list of farmers with anomalous claim payments, encourage the completion of FSA county office inspections during the growing season by requiring FSA state offices to monitor the status of their completion.
• Maximize the use of the list of farmers with anomalous claim payments by, for example, ensuring that insurance companies receive the results of all FSA field inspections in a timely manner and directing
Matter for Congressional Consideration
Recommendations for Executive Action
Page 37 GAO-12-256 Crop Insurance
insurance companies to review the results of all completed FSA field inspections before paying claims that occur after inspections showed the crop was in good condition.
• Increase the use of the list of agents and adjusters with anomalous losses through actions, such as directing insurance companies, during annual performance evaluations of insurance agents and adjusters, to focus more of their attention on the list of agents and adjusters with anomalous losses.
• Develop a mechanism, such as a revised electronic form, to collect additional data from insurance companies in order to facilitate the use of the companies’ reviews in data mining.
We provided the Secretary of Agriculture with a draft of this report for review and comment. We received written comments from the acting USDA Under Secretary for Farm and Foreign Agricultural Services. In these comments, the acting Under Secretary stated it was ill advised for us to suggest that Congress consider limiting or reducing premium subsides without further study. The acting Under Secretary stated that in recommending a $40,000 limit on premium subsidies, the report does not fully account for all potentially negative impacts and costs resulting from such a change. However, as we state in the report, we do not recommend a $40,000 limit in premium subsidies per crop insurance participant. Instead, we used $40,000 as an example of a premium subsidy limit and noted that setting a premium subsidy limit higher or lower would have corresponding effects on cost savings. In addition, our report recognizes that setting a subsidy limit may have impacts, and we discuss some of these potential impacts. Moreover, at a time when the agriculture sector is enjoying record farm income and higher farmland values and the nation is facing severe deficit and long-term fiscal challenges, we believe that crop insurance premium subsidies—the single largest component of farm program costs—is a potential area for federal cost savings. Furthermore, the Administration’s budget for fiscal year 2013 and the Congressional Budget Office each proposed a reduction in premium subsidies. These subsidies increased fourfold, from $1.7 billion in 2002 to $7.4 billion in 2011.
USDA agreed with one of our recommendations, and did not directly respond to the other three. Regarding our first recommendation—encouraging the completion of FSA county office inspections for the list of farmers with anomalous claim payments by requiring FSA state offices to
Agency Comments and Our Evaluation

Page 38 GAO-12-256 Crop Insurance
monitor the status of their completion—USDA stated that it will update its written procedures to require FSA state offices to monitor county offices’ completion of these inspections.
Regarding our second recommendation—that USDA maximize its list of farmers with anomalous claims by providing the results of completed FSA inspections to the insurance companies—USDA stated it is unlikely that FSA will be able to accomplish this recommendation, but that comment is not responsive to our recommendation. We clarified the language to say that insurance companies should receive the results of all inspections that have been completed. This effort would not entail additional work on the part of FSA. RMA’s data mining contractor told us that it could complete this activity within a few days after an inspection was completed.
Regarding our third recommendation—to direct insurance companies, during annual performance evaluations of insurance agents and adjusters, to focus more of their attention on the list of agents and adjusters with anomalous losses than on others—USDA reported that it was issuing guidance directing companies to provide to USDA the results of reviews conducted on each agent/loss adjuster identified on the anomalous agent/loss adjuster list provided by RMA. We agree that providing guidance to the companies is important and continue to believe that directing insurance companies to focus more attention on these agents and loss adjusters during annual performance reviews would produce additional benefits.
Regarding the fourth recommendation—to develop a mechanism, such as a revised electronic form, to collect additional data from insurance companies in order to facilitate the use of the companies’ reviews in data mining—USDA did not clearly state whether it agreed or disagreed. USDA stated that as one of its information systems projects matures, it will find better ways to record and gather data for data mining. However, we continue to believe that the data mining contractor needs additional data from insurance company reviews in order to improve data mining, and that specific direction from USDA is needed to acquire it.
USDA comments and our response are in appendix V.

Page 39 GAO-12-256 Crop Insurance
As agreed with your office, unless you publicly announce the contents of this report earlier, we plan no further distribution until 30 days from the report date. At that time, we will send copies of this report to the appropriate congressional committees; the Secretary of Agriculture; the Director, Office of Management and Budget; and other interested parties. In addition, this report will be available at no charge on the GAO website at http://www.gao.gov.
If you or your staff members have any questions about this report, please contact me at (202) 512-3841 or [email protected]. Contact points for our Offices of Congressional Relations and Public Affairs may be found on the last page of this report. Key contributors to this report are listed in appendix VI.
Sincerely yours,
Lisa Shames, Director, Natural Resources and Environment
Appendix I: Objectives, Scope, and Methodology
Page 40 GAO-12-256 Crop Insurance
Our objectives were to determine (1) the effect on program costs of applying limits on farmers’ federal crop insurance subsidies, as payment limits are applied to other farm programs, and (2) the extent to which the U.S. Department of Agriculture (USDA) has used data mining tools to prevent and detect fraud, waste, and abuse in the crop insurance program.
To address the first objective, we reviewed eligibility standards, such as adjusted gross income limits and payment limits, in the provisions of the Food, Conservation, and Energy Act of 2008 (2008 farm bill); other statutes; and USDA regulations. We also interviewed officials from USDA’s Farm Service Agency (FSA) and Risk Management Agency (RMA) regarding eligibility standards and payment limits in the 2008 farm bill for farm programs other than the crop insurance program. To determine the distribution of crop insurance subsidies among farmers who participate in the program, we analyzed RMA data for 2010 and 2011 on the number and percentage of farmers receiving various levels of subsidies and the locations of farmers who received higher subsidies. We selected $40,000 as an example of a potential subsidy limit because it is the payment limit for direct payments. Many participants in the crop insurance program also participate in other farm programs that are administered by USDA’s Farm Service Agency (FSA). Many of these other farm programs have payment limits based on benefits that are attributed to each interest holder in a farming operation. Under a scenario of a limit on premium subsidies, it is likely these same rules regarding the attribution of benefits would also apply to premium subsidies for the crop insurance program. Therefore, in our analysis, we attributed these subsidies for each policy to the interest holders in the policy. We did so based on the payment share of each interest holder as recorded in FSA’s validated Permitted Entity database that is used to ensure compliance with payment limit rules. For entities, we attributed benefits through four levels, as appropriate. We summed premium subsidies across policies for each crop insurance participant. For those that were not found in FSA’s Permitted Entity database or if RMA’s database contradicted FSA’s Permitted Entity database, we attributed premium subsidies by dividing it equally among the policy holder and the interest holders as reported in RMA’s database. These participants represented 18.5 percent of the entities.
We also reviewed USDA and other studies that examined participation in the crop insurance program and premium subsidies. In addition, we reviewed USDA data on the financial condition of farms of various sizes. Furthermore, we reviewed USDA reports on the availability of private risk
Appendix I: Objectives, Scope, and Methodology
Appendix I: Objectives, Scope, and Methodology
Page 41 GAO-12-256 Crop Insurance
management tools against crop losses and the effects of farm program subsidies on beginning and smaller farmers. Finally, we reviewed farm and crop insurance industry organizations’ statements on the crop insurance program.
To determine the extent to which USDA has used data mining tools to prevent and detect fraud, waste, and abuse in the crop insurance program, we analyzed how RMA uses two data mining lists—the list of farmers with anomalous claim payments and the list of insurance agents and adjusters with anomalous losses—and the methods it uses to develop these lists. We reviewed requirements in the Agricultural Risk Protection Act of 2000 and the current and former standard reinsurance agreement related to data mining, FSA guidance for field inspections, FSA letters to farmers with anomalous claim payments, data analyses and summaries on data mining tools developed by RMA’s data mining contractor, USDA’s Inspector General reports and testimonies, and reports of RMA completion of disaster payment reconciliations. We also interviewed RMA data mining contractor staff, and RMA officials at headquarters and six regional compliance offices to identify RMA’s uses of these data mining tools, weaknesses found in the tools, opportunities for increased use of them, or competing RMA priorities. We also interviewed officials with USDA’s Office of Inspector General on their views and uses of these tools. In addition, we worked with RMA’s data mining contractor to analyze 2009 and 2010 data on FSA’s completion of field inspections for policies of those farmers listed as having anomalous claim payments. We conducted tests of the reliability of the data, such as checking formulas, and found the data to be sufficiently reliable for the purposes of this report. We also interviewed officials with RMA and its data mining contractor to determine the process used to acquire FSA’s field inspection data. We interviewed officials with FSA’s headquarters office and the five FSA state offices for California, Colorado, Florida, North Dakota, and Texas to obtain information about these data, obstacles to completing the inspections, and suggestions for increasing their completion and reporting.1
1One of the five officials we interviewed had been located in the Minnesota FSA office and informed us of the practices of this office.
We selected FSA’s North Dakota office because of its high completion rate of field inspections (96 percent) for 2009 and 2010 and large number of requests for field inspections (378). We selected the other four state offices because, over the 2-year period,
Appendix I: Objectives, Scope, and Methodology
Page 42 GAO-12-256 Crop Insurance
they had low completion rates of field inspections (less than 33 percent) and at least 80 requests for field inspections.
We conducted this performance audit from January 2011 to March 2012 in accordance with generally accepted government auditing standards. Those standards require that we plan and perform the audit to obtain sufficient, appropriate evidence to provide a reasonable basis for our findings and conclusions based on our audit objectives. We believe that the evidence obtained provides a reasonable basis for our findings and conclusions based on our audit objectives.
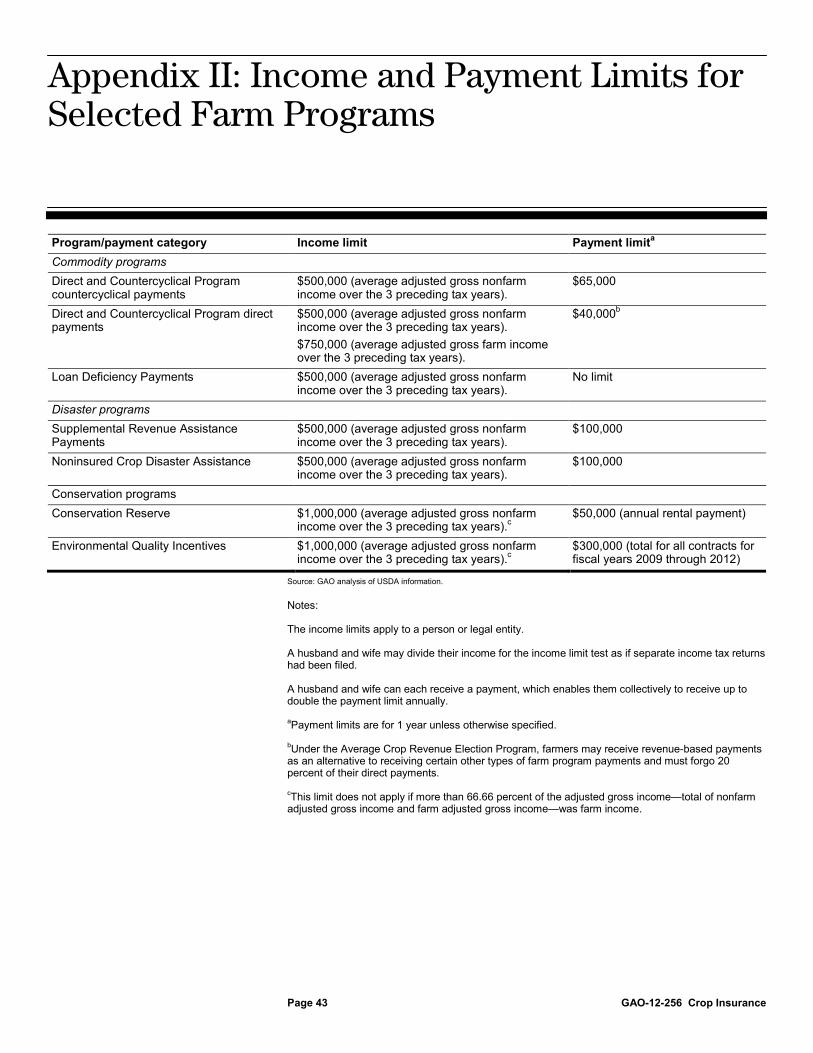
Appendix II: Income and Payment Limits for Selected Farm Programs
Page 43 GAO-12-256 Crop Insurance
Program/payment category Income limit Payment limitCommodity programs
a
Direct and Countercyclical Program countercyclical payments
$500,000 (average adjusted gross nonfarm income over the 3 preceding tax years).
$65,000
Direct and Countercyclical Program direct payments
$500,000 (average adjusted gross nonfarm income over the 3 preceding tax years). $750,000 (average adjusted gross farm income over the 3 preceding tax years).
$40,000b
Loan Deficiency Payments
$500,000 (average adjusted gross nonfarm income over the 3 preceding tax years).
No limit
Disaster programs Supplemental Revenue Assistance Payments
$500,000 (average adjusted gross nonfarm income over the 3 preceding tax years).
$100,000
Noninsured Crop Disaster Assistance $500,000 (average adjusted gross nonfarm income over the 3 preceding tax years).
$100,000
Conservation programs Conservation Reserve $1,000,000 (average adjusted gross nonfarm
income over the 3 preceding tax years).c$50,000 (annual rental payment)
Environmental Quality Incentives $1,000,000 (average adjusted gross nonfarm
income over the 3 preceding tax years).$300,000 (total for all contracts for fiscal years 2009 through 2012) c
Source: GAO analysis of USDA information.
Notes: The income limits apply to a person or legal entity. A husband and wife may divide their income for the income limit test as if separate income tax returns had been filed. A husband and wife can each receive a payment, which enables them collectively to receive up to double the payment limit annually. aPayment limits are for 1 year unless otherwise specified. bUnder the Average Crop Revenue Election Program, farmers may receive revenue-based payments as an alternative to receiving certain other types of farm program payments and must forgo 20 percent of their direct payments. c
This limit does not apply if more than 66.66 percent of the adjusted gross income—total of nonfarm adjusted gross income and farm adjusted gross income—was farm income.
Appendix II: Income and Payment Limits for Selected Farm Programs

Appendix III: Locations of Participating Farmers Receiving More than $40,000 in Premium Subsidies, 2011
Page 44 GAO-12-256 Crop Insurance
Figure 6 shows the locations of participating farmers who received more than $40,000 in premium subsidies for 2011. As the figure shows, many of these farmers were in the northern and southern plains. According to RMA officials, a region might have more farmers who received more than $40,000 in premium subsidies because farmers in the region have large-acreage farms; produce high-value crops, such as sugar beets; or have higher premium rates. For example, the average farm size in North Dakota is 1,241 acres, but the average size nationwide is 418 acres.1
1U.S. Department of Agriculture, National Agricultural Statistics Service, 2007 Census of Agriculture (Washington, D.C.: December 2009).
In addition, high-value crops, such as sugar beets in North Dakota and fruits and vegetables in California, contribute to higher premiums and premium subsidies. Regarding premium rates, areas that have a higher risk of crop loss generally have higher premium rates. For example, the average premium rate in North Dakota is 17 percent, and the average premium rate nationwide is 10 percent.
Appendix III: Locations of Participating Farmers Receiving More than $40,000 in Premium Subsidies, 2011

Appendix III: Locations of Participating Farmers Receiving More than $40,000 in Premium Subsidies, 2011
Page 45 GAO-12-256 Crop Insurance
Figure 6: Locations of Participating Farmers Receiving Premium Subsidies of More Than $40,000, 2011

Appendix IV: Information on the Levels of Premium Subsidies and Administrative Expense Subsidies for Individual Farmers
Page 46 GAO-12-256 Crop Insurance
Number of farmers by year Levels of subsidies received by individual farmers Subsidy type
2010 2011
$1-$10,000 Premium 754,716 678,099 a Premium and administrative expense 715,822 631,332 b $10,001-$20,000 Premium 76,818 101,811 Premium and administrative expense 92,507 115,092 $20,001-$30,000 Premium 25,767 40,775 Premium and administrative expense 34,438 49,713 $30,001-$40,000 Premium 11,243 20,259 Premium and administrative expense 16,118 26,776 $40,001-$50,000 Premium 5,374 11,445 Premium and administrative expense 8,683 15,758 $50,001-$60,000 Premium 2,876 7,038 Premium and administrative expense 4,904 10,222 $60,001-$70,000 Premium 1,737 4,545 Premium and administrative expense 2,858 6,870 $70,001-$80,000 Premium 939 3,040 Premium and administrative expense 1,895 4,690 $80,001-$90,000 Premium 676 2,023 Premium and administrative expense 1,283 3,407 $90,001-$100,000 Premium 447 1,397 Premium and administrative expense 765 2,435 More than $100,000 Premium 1,260 4,202 Premium and administrative expense 2,580 8,339 Total farmers 881,853 874,634
Source: RMA. aFor 754,716 participating farmers, 2010 premium subsidies ranged from $1 to $10,000. b
Appendix IV: Information on the Levels of Premium Subsidies and Administrative Expense Subsidies for Individual Farmers
For 715,822 participating farmers, the sum of 2010 premium subsidies and 2010 administrative expense subsidies ranged from $1 to $10,000.

Appendix V: Comments from the U.S. Department of Agriculture
Page 47 GAO-12-256 Crop Insurance
Appendix V: Comments from the U.S. Department of Agriculture
See comment 1.
Note: GAO’s comments supplementing thse in the report text appear at the end of this appendix.
Appendix V: Comments from the U.S. Department of Agriculture
Page 48 GAO-12-256 Crop Insurance
See comment 7.
See comment 6.
See comment 5.
See comment 4.
See comment 3. See comment 2.
See comment 5.
See comment 5.
See comment 5.
Appendix V: Comments from the U.S. Department of Agriculture
Page 49 GAO-12-256 Crop Insurance
See comment 11.
See comment 6.
See comment 8.
See comment 9.
See comment 10.
See comment 12.

Appendix V: Comments from the U.S. Department of Agriculture
Page 50 GAO-12-256 Crop Insurance
See comment 15.
See comment 14.
See comment 13.

Appendix V: Comments from the U.S. Department of Agriculture
Page 51 GAO-12-256 Crop Insurance
See comment 16.

Appendix V: Comments from the U.S. Department of Agriculture
Page 52 GAO-12-256 Crop Insurance
The following are GAO’s comments on the U.S. Department of Agriculture’s letter dated February 17, 2012.
1. As we clearly state in the report, we do not recommend a $40,000
limit in premium subsidies per crop insurance participant. Instead, as we stated, we used $40,000 as an example of a premium subsidy limit and noted that setting a premium subsidy limit higher or lower would have corresponding effects on cost savings. In this connection, we provided information on the potential savings that would result if premium subsidies were limited to $100,000. Furthermore, limits on premium subsidies would not prevent potentially affected farmers from enrolling all of their crop acres in the crop insurance program and receiving claim payments when a loss occurs. The report also notes that savings could result from reducing the subsidy amount for all farmers participating in the program, or both limiting and reducing these subsidies. In proposing these changes to the crop insurance program, we also identified other considerations that would come into play, including the potential effect on large farms’ financial condition and on participation in the crop insurance program.
2. We disagree. This report does show regions of the country that would be more affected by a limit on premium subsidies. On page 19, we state that many of the participating farmers who received more than $40,000 in premium subsidies were in the northern and southern plains. Additional information on the locations of participating farmers who received more than $40,000 in premium subsidies for 2011 is presented in appendix III.
3. An assessment of the availability of credit to the agricultural sector was not the focus of our work, but our review of data from USDA’s Agricultural Resource Management Survey shows that larger farms, which are more likely to be affected by a limit on premium subsidies, generally have stronger financial ratios and credit worthiness than other farms participating in the crop insurance program. (See pages 21 and 22 of this report.) Furthermore, since we sent our draft report to USDA for comment, we identified two Federal Reserve Bank reports—one from the Federal Reserve Bank of Chicago, and one from the Federal Reserve Bank of Kansas City—that reported that credit conditions for farmers are favorable. In addition, if premium subsidies were limited, an affected farmer could still purchase crop insurance, although the premiums might not be subsidized or subsidized less than currently. Thus, an affected farmer would not lose access to credit.
GAO Comments
Appendix V: Comments from the U.S. Department of Agriculture
Page 53 GAO-12-256 Crop Insurance
4. USDA did not adjust its estimate of affected crop insurance participants and savings in premium subsidies to reflect how a limit on premium subsidies might actually be implemented. That is, we assume that any subsidy limit would be administered as USDA’s Farm Service Agency (FSA) administers payment limits for other farm programs—allocating the benefits according to the interest holders in the farming operation. Most participants in the crop insurance program also participate in other farm programs that FSA administers, and many of these other farm programs have payment limits based on benefits that are attributed to each interest holder in a farming operation. As explained in our methodology, in developing our estimate for a potential $40,000 subsidy limit, we used the payment share of each interest holder as recorded in FSA’s validated Permitted Entity database, which FSA uses to ensure compliance with payment limit rules for farm programs. Using FSA’s information on the payment share of each interest holder, we attributed subsidies for each crop insurance policy to the interest holders in the policy. Therefore, we estimated that up to 33,690 participating farmers would have been affected in 2011 by a reduced subsidy, for a savings of up to $1 billion if a $40,000 subsidy limit were applied. We believe our analysis provides a reasonable estimate of the number of participating farmers who might be affected by a limit on premium subsidies and the dollars that might be saved. (See app. I for more information on our methodology.)
5. As we note in this report, a limit on crop insurance premium subsidies would affect more farmers in some areas of the country than in other areas. We also note in the report that large farms are better positioned than smaller farms to pay a higher share of their premiums. Furthermore, a higher limit on premium subsidies would affect fewer farmers. In addition, limits on farm program benefits already have disproportionate impacts. For example, under the Supplemental Revenue Assistance Payments program and Noninsured Crop Disaster Assistance program, annual payments are limited to $100,000, which disproportionately affects farmers in regions that are more prone to natural disasters. In addition to a limit on premium subsidies, this report also examines reducing premium subsidy rates for all farmers, which would have a more proportionate effect across states and regions. However, it would also reduce subsidies for those who may be less able to afford higher premiums, particularly beginning and limited resource farmers, as well as socially disadvantaged farmers.

Appendix V: Comments from the U.S. Department of Agriculture
Page 54 GAO-12-256 Crop Insurance
6. We do not agree that it would be virtually impossible to administratively track and control a limit on premium subsidies. Most farmers participating in the crop insurance program also participate in other farm programs that FSA administers. Many of the farm programs FSA administers already limit the payments an individual can receive. Therefore, we believe that FSA’s methods—which account for complicating factors such as the organization of farm businesses and multiple crops in multiple counties, and even multiple programs—could be applied to a limit on premium subsidies for crop insurance and that any addition to administrative burdens would not be significant. Moreover, as we stated in our report, premium subsidy rates vary by the level of insurance coverage that the farmer chooses and the geographic diversity of the crops insured. If RMA is capable of tracking these different subsidy rates, we believe USDA can also administer a subsidy limit.
7. We believe it would not be impractical to administer a limit on premium subsidies because of differences in dates and insurance periods. FSA attributes benefits to each individual or entity for each program that it administers. For each participant in a given program, payments are summed across all entities, crops, and counties for the crop year. Regarding livestock insurance, the amount of insurance purchased in comparison with crop insurance is very small. Moreover, this report did not discuss combining limits on premium subsidies for livestock insurance and crop insurance.
8. We do not agree that a limit on premium subsidies would prevent farmers from making sound and informed insurance choices. Under the crop insurance program, the amounts of a farmer’s premium subsidy and premium expense are estimated during the period before planting, when the farmer is making insurance choices. However, insurance companies determine the actual premium later in the growing season and bill the farmer at the end of the growing season. Therefore, to the extent that a limit on premium subsidies introduces additional uncertainty, it would likely be marginal.
9. We believe it is unlikely that a limit on premium subsidies would affect agricultural lenders’ decisions in providing farm operating loans. It is not clear how a limit on premium subsidies would introduce so much uncertainty about the amount of a farmer’s premium expenses that a lender could not decide whether to provide financing. Agricultural lenders already deal with a level of uncertainty about farmers’ revenues and expenses. In addition, lenders could require borrowers to purchase crop insurance.
Appendix V: Comments from the U.S. Department of Agriculture
Page 55 GAO-12-256 Crop Insurance
10. As we stated in this report, the amount of savings from a limit on premium subsidies may depend on whether, and to what extent, farmers and legal entities reorganized their business to avoid or lessen the effect of limits on premium subsidies. In addition, some farmers would likely begin to report their spouse as a member of the farming operation, which, under payment limit rules, enables an operation to double the amount of benefits it can receive. Regarding potential reorganizations, most of the farmers and legal entities who participate in the crop insurance program also participate in FSA programs, and many of them have already reorganized their business because of these programs’ payment limits. These farmers and legal entities would be unlikely to reorganize further in response to a limit on premium subsidies. In addition, in some instances, the requirement that an individual or entity be actively engaged in farming to receive farm program benefits is likely to prevent the creation of entities in order to avoid a limit on premium subsidies. Furthermore, the 2008 farm bill decreased the incentive to reorganize a farming operation in order to avoid a limit on farm program payments by eliminating the “three-entity rule” and requiring direct attribution of payments to individuals.
11. This report includes information about how crop insurance participation and coverage levels may relate to spending on ad hoc disaster assistance. The report also notes that in view of the nation’s budgetary pressures, Congress may be less willing to approve ad hoc disaster assistance payments than it has in the past. In addition, the Administration’s proposed fiscal year 2013 budget addresses participation and ad hoc disaster assistance and states, “With current participation rates, the deep premium subsidies are no longer needed.”
12. In addition to federal cost savings, our report discussed several considerations that would come into play with limits on premium subsidies. Furthermore, we noted that FSA has extensive experience in administering limits on farm program benefits, which USDA does not recognize in its comments. We believe RMA could benefit from FSA’s experience in administering payment limits.
13. We recognize that FSA, like most federal agencies, faces resource constraints. However, as we have previously reported, effective strategies help set priorities and allocate resources to inform decision making and help ensure accountability. Such priority setting and resource allocation is especially important in a fiscally constrained environment.

Appendix V: Comments from the U.S. Department of Agriculture
Page 56 GAO-12-256 Crop Insurance
14. We clarified the language to say that insurance companies should receive the results of all inspections that have been completed. This effort would not entail additional work on the part of FSA. RMA’s data mining contractor told us that it could complete this activity within a few days after an inspection was completed.
15. We are pleased that RMA is developing guidance and believe that this guidance may be a good first step towards increasing insurance companies’ focus on anomalous agents and loss adjusters, who warrant greater attention. However, we continue to believe that directing insurance companies to focus more attention on these agents and loss adjusters during annual performance reviews would produce additional benefits.
16. It is unclear from RMA’s response whether it agrees or disagrees with our recommendation. However, we continue to believe that the data mining contractor needs additional data from insurance company reviews in order to improve data mining and specific direction from the government to collect these data.
Appendix VI: GAO Contact and Staff Acknowledgments
Page 57 GAO-12-256 Crop Insurance
Lisa Shames, (202) 512-3841, or [email protected]
In addition to the individual named above, Susan Offutt, Chief Economist; Thomas M. Cook, Assistant Director; Kevin S. Bray; Gary T. Brown; Barbara J. El-Osta; Beverly Peterson; Anne Rhodes-Kline; Jeremy Sebest; and Carol Herrnstadt Shulman made key contributions to this report.
Appendix VI: GAO Contact and Staff Acknowledgments
GAO Contact
Staff Acknowledgments

Related GAO Products
Page 58 GAO-12-256 Crop Insurance
Crop Insurance: Opportunities Exist to Reduce the Costs of Administering the Program. GAO-09-445. Washington, D.C.: April 29, 2009.
Crop Insurance: Continuing Efforts Are Needed to Improve Program Integrity and Ensure Program Costs Are Reasonable. GAO-07-944T. Washington, D.C.: June 7, 2007.
Crop Insurance: Continuing Efforts Are Needed to Improve Program Integrity and Ensure Program Costs Are Reasonable. GAO-07-819T. Washington, D.C.: May 3, 2007.
Climate Change: Financial Risks to Federal and Private Insurers in Coming Decades Are Potentially Significant. GAO-07-760T. Washington, D.C.: April 19, 2007.
Climate Change: Financial Risks to Federal and Private Insurers in Coming Decades Are Potentially Significant. GAO-07-285. Washington, D.C.: March 16, 2007.
Suggested Areas for Oversight for the 110th Congress. GAO-07-235R. Washington, D.C.: November 17, 2006.
Crop Insurance: More Needs to Be Done to Reduce Program’s Vulnerability to Fraud, Waste, and Abuse. GAO-06-878T. Washington, D.C.: June 15, 2006.
Crop Insurance: Actions Needed to Reduce Program’s Vulnerability to Fraud, Waste, and Abuse. GAO-05-528. Washington, D.C.: September 30, 2005.
Crop Insurance: USDA Needs to Improve Oversight of Insurance Companies and Develop a Policy to Address Any Future Insolvencies. GAO-04-517. Washington, D.C.: June 1, 2004.
Department of Agriculture: Status of Efforts to Address Major Financial Management Challenges. GAO-03-871T. Washington, D.C.: June 10, 2003.
Crop Insurance: USDA Needs a Better Estimate of Improper Payments to Strengthen Controls Over Claims. GAO/RCED-99-266. Washington, D.C.: September 22, 1999.
Related GAO Products
Related GAO Products
Page 59 GAO-12-256 Crop Insurance
Crop Insurance: USDA’s Progress in Expanding Insurance for Specialty Crops. GAO/RCED-99-67. Washington, D.C.: April 16, 1999.
Crop Insurance: Increases in Insured Crop Prices and Premium Rates Raise the Administrative Expense Reimbursement Paid to Companies. GAO/RCED-98-115R. Washington, D.C.: March 20, 1998.
Crop Insurance: Opportunities Exist to Reduce Government Costs for Private-Sector Delivery. GAO/RCED-97-70. Washington, D.C.: April 17, 1997.
Crop Insurance: Federal Program Faces Insurability and Design Programs. GAO/RCED-93-98. Washington, D.C.: May 24, 1993.
Crop Insurance: Program Has Not Fostered Significant Risk Sharing by Insurance Companies. GAO/RCED-92-25. Washington, D.C.: January 13, 1992.
(361259)
The Government Accountability Office, the audit, evaluation, and investigative arm of Congress, exists to support Congress in meeting its constitutional responsibilities and to help improve the performance and accountability of the federal government for the American people. GAO examines the use of public funds; evaluates federal programs and policies; and provides analyses, recommendations, and other assistance to help Congress make informed oversight, policy, and funding decisions. GAO’s commitment to good government is reflected in its core values of accountability, integrity, and reliability.
The fastest and easiest way to obtain copies of GAO documents at no cost is through GAO’s website (www.gao.gov). Each weekday afternoon, GAO posts on its website newly released reports, testimony, and correspondence. To have GAO e-mail you a list of newly posted products, go to www.gao.gov and select “E-mail Updates.”
The price of each GAO publication reflects GAO’s actual cost of production and distribution and depends on the number of pages in the publication and whether the publication is printed in color or black and white. Pricing and ordering information is posted on GAO’s website, http://www.gao.gov/ordering.htm.
Place orders by calling (202) 512-6000, toll free (866) 801-7077, or TDD (202) 512-2537.
Orders may be paid for using American Express, Discover Card, MasterCard, Visa, check, or money order. Call for additional information.
Connect with GAO on Facebook, Flickr, Twitter, and YouTube. Subscribe to our RSS Feeds or E-mail Updates. Listen to our Podcasts . Visit GAO on the web at www.gao.gov.
Contact:
Website: www.gao.gov/fraudnet/fraudnet.htm E-mail: [email protected] Automated answering system: (800) 424-5454 or (202) 512-7470
Katherine Siggerud, Managing Director, [email protected], (202) 512-4400, U.S. Government Accountability Office, 441 G Street NW, Room 7125, Washington, DC 20548
Chuck Young, Managing Director, [email protected], (202) 512-4800 U.S. Government Accountability Office, 441 G Street NW, Room 7149 Washington, DC 20548
GAO’s Mission
Obtaining Copies of GAO Reports and Testimony
Order by Phone
Connect with GAO
To Report Fraud, Waste, and Abuse in Federal Programs
Congressional Relations
Public Affairs
Please Print on Recycled Paper.