Embed Size (px)
Citation preview
United States Government Accountability Office
GAO Testimony Before the Subcommittee on Select Revenue Measures, Committee on Ways and Means, House of Representatives
HIGHER EDUCATION
Multiple Higher Education Tax Incentives Create Opportunities for Taxpayers to Make Costly Mistakes
Statement of Michael Brostek Director, Tax Issues Strategic Issues George A. Scott Director, Higher Education Issues Education, Workforce, and Income Security
For Release on Delivery Expected at 10:00 a.m. EDT Thursday, May 1, 2008
GAO-08-717T
What GAO FoundWhy GAO Did This Study
HighlightsAccountability Integrity Reliability
May 1, 2008
HIGHER EDUCATION
Multiple Higher Education Tax Incentives Create Opportunities for Taxpayers to Make Costly Mistakes
Highlights of GAO-08-717T, a testimony before the Subcommittee on Select Revenue Measures, Committee on Ways and Means, House of Representatives
Federal assistance helps students and families pay for postsecondary education through several policy tools—grant and loan programs authorized by Title IV of the Higher Education Act of 1965 and more recently enacted tax preferences. This testimony summarizes our 2005 report and provides updates on (1) how Title IV assistance compares to that provided through the tax code (2) the extent to which tax filers effectively use education tax preferences, (3) potential benefits and costs of simplifying federal student aid, and (4) what is known about the effectiveness of federal assistance.
This hearing is an opportunity to consider whether changes should be made in the government’s overall strategy for providing such assistance or to the individual programs and tax provisions that provide the assistance. This statement is based on updates to previously published GAO work and reviews of relevant literature.
What GAO Recommends
GAO does not make new recommendations in this testimony. In 2002, GAO recommended, among other things, that the Department of Education sponsor research into key aspects of effectiveness of Title IV programs. Education began funding grants in July 2007 to conduct research on topics addressed in this statement; however, no project to date appears to directly evaluate the role and effectiveness of federal assistance in improving access to postsecondary education.
Tseroawoaapg
RD
Sdidltmc Shtu Lpbpm
To view the full product, including the scope and methodology, click on GAO-08-717T. For more information, contact Michael Brostek at (202) 512-9110 or George Scott at (202) 512-7215.
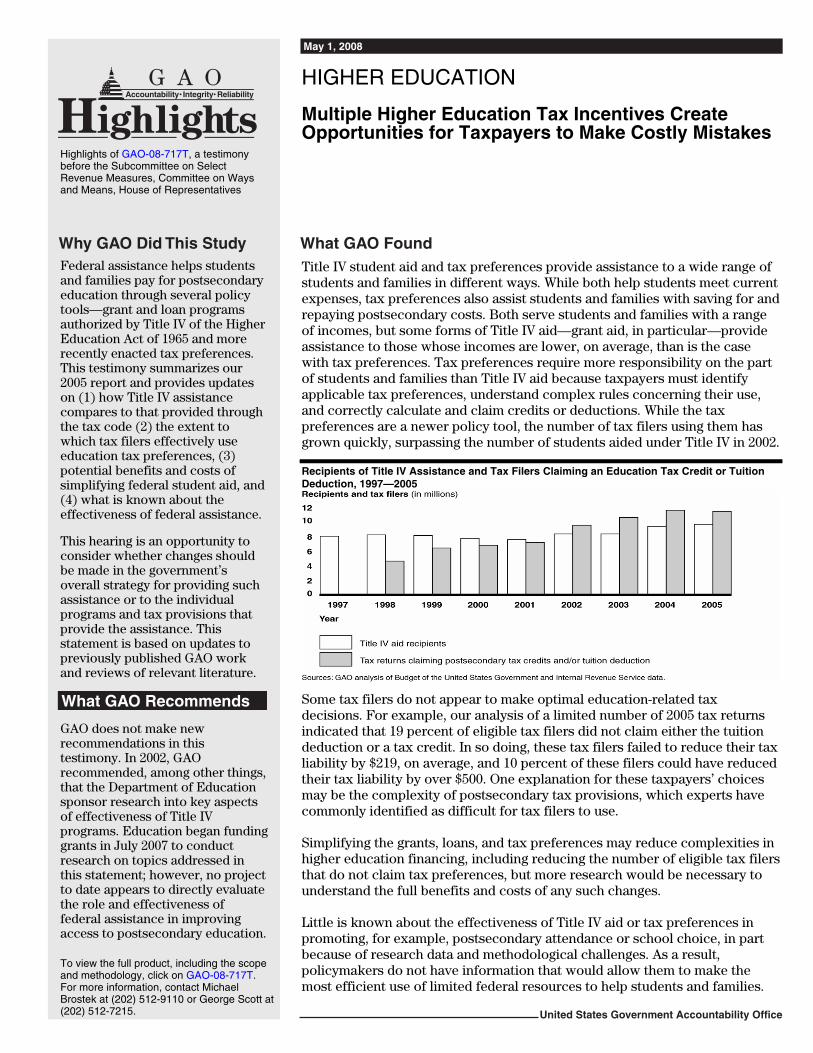
itle IV student aid and tax preferences provide assistance to a wide range of tudents and families in different ways. While both help students meet current xpenses, tax preferences also assist students and families with saving for and epaying postsecondary costs. Both serve students and families with a range f incomes, but some forms of Title IV aid—grant aid, in particular—provide ssistance to those whose incomes are lower, on average, than is the case ith tax preferences. Tax preferences require more responsibility on the part f students and families than Title IV aid because taxpayers must identify pplicable tax preferences, understand complex rules concerning their use, nd correctly calculate and claim credits or deductions. While the tax references are a newer policy tool, the number of tax filers using them has rown quickly, surpassing the number of students aided under Title IV in 2002.
ecipients of Title IV Assistance and Tax Filers Claiming an Education Tax Credit or Tuition eduction, 1997—2005
ome tax filers do not appear to make optimal education-related tax ecisions. For example, our analysis of a limited number of 2005 tax returns
ndicated that 19 percent of eligible tax filers did not claim either the tuition eduction or a tax credit. In so doing, these tax filers failed to reduce their tax
iability by $219, on average, and 10 percent of these filers could have reduced heir tax liability by over $500. One explanation for these taxpayers’ choices ay be the complexity of postsecondary tax provisions, which experts have
ommonly identified as difficult for tax filers to use.
implifying the grants, loans, and tax preferences may reduce complexities in igher education financing, including reducing the number of eligible tax filers hat do not claim tax preferences, but more research would be necessary to nderstand the full benefits and costs of any such changes.
ittle is known about the effectiveness of Title IV aid or tax preferences in romoting, for example, postsecondary attendance or school choice, in part ecause of research data and methodological challenges. As a result, olicymakers do not have information that would allow them to make the ost efficient use of limited federal resources to help students and families.
United States Government Accountability Office
Mr. Chairman and Members of the Subcommittee:
We are pleased to be here this morning to discuss the complexity of multiple tax incentives targeted to postsecondary education. American higher education has long been crucial to the development of our nation’s cultural, social, and economic capital. At the dawn of the 21st century, changing workforce demographics, a more integrated global economy, and numerous technological advances are placing new demands on our colleges and universities. For the United States to remain competitive in the rising global knowledge economy, its citizens will need both the ways and means to endow themselves with the tools necessary for the task. Nevertheless, the affordability of American higher education remains a topic of considerable attention as evidenced by the work of the current Congress in both passing the College Cost Reduction and Access Act1 and its ongoing efforts to reauthorize the Higher Education Act of 1965.
This hearing is an opportunity to consider whether any changes should be made in the government’s overall strategy and the individual programs and tax provisions that provide financial assistance to students and families saving or paying for postsecondary education or repaying student loans. This opportunity to review the programs and tax provisions is important for several reasons. The fact that we face large and growing structural deficits in the future—primarily driven by demographics and rising health care costs—emphasizes the need to consider how the government allocates resources. In addition, we have noted that fundamental reexamination of government programs, policies, and priorities is necessary to assure that they match the needs of the 21st century. We have identified the coordination of student aid programs2 and the effectiveness of those programs 3 both as key topics needing congressional oversight.
Our statement today will focus on four issues that emerged in our 2005 report and subsequent 2006 testimony on student grant and loan
1Pub. L. No. 110-84, 121 Stat. 784 (Sept. 27, 2007).
2GAO, 21st Century Challenges: Reexamining the Base of the Federal Government,
GAO-05-325SP (Washington, D.C.: February 2005).
3GAO, Suggested Areas for Oversight for the 110th Congress, GAO-07-235R (Washington,
D.C.: Nov. 17, 2006).
Page 1 GAO-08-717T
assistance made available under Title IV of the Higher Education Act and postsecondary education tax preferences.4
• Postsecondary student financial assistance provided through programs authorized under Title IV and the tax code differ in three key ways. First, Title IV grant and loan programs traditionally provide aid to students and families while students are in college, whereas tax preferences help both during the college years as well as before and after college by assisting with saving for or repaying college costs. Additionally, while student aid programs and tax preferences serve students and families across a wide range of income groups, some Title IV programs—particularly the Pell Grant program—provide much of their financial assistance to students and families whose incomes are lower, on average, than students and families who receive student loans, tax credits, and deductions, or who make use of tax-exempt saving vehicles. Last, students and families have more responsibility for appropriately using and thereby obtaining the benefits of tax preferences than they do with Title IV aid.
• Second, postsecondary tax preferences are difficult for families to
understand and use correctly. Perhaps due to the complexity of the tax provisions, hundreds of thousands of taxpayers fail to claim tax preferences to which they are entitled or do not claim the tax preference that would be most advantageous to them.
• Third, proposals to simplify the federal financial assistance programs
for postsecondary education may help to address the complexities in the current system and improve tax filers’ use of education tax preferences. However, more research is needed to understand the range of potential benefits and costs associated with any such changes.
• Finally, we found that Congress has received little evidence concerning
the effectiveness of assistance provided under Title IV or through tax preferences, including whether such assistance increases attendance or choice.
4 See GAO, Student Aid and Postsecondary Tax Preferences: Limited Research Exists on
Effectiveness of Tools to Assist Students and Families through Title IV Student Aid and
Tax Preferences, GAO-05-684 (Washington, D.C.: July 29, 2005), and GAO, Postsecondary
Education: Multiple Tax Preferences and Title IV Student Aid Programs Create a
Complex Education Financing Environment, GAO-07-262T (Washington, D.C.: Dec. 5, 2006).
Page 2 GAO-08-717T
Our statement today is drawn from reviews of relevant literature and updates to previous GAO reports and testimonies covering postsecondary Title IV programs and tax preferences. We conducted our work in April 2008 in accordance with generally accepted government auditing standards. Those standards require that we plan and perform the audit to obtain sufficient, appropriate evidence to provide a reasonable basis for our findings and conclusions based on our audit objectives. We believe that the evidence obtained provides a reasonable basis for our findings and conclusions based on our audit objectives.
Financial assistance to help students and families pay for postsecondary education has been provided for many years through student grant and loan programs authorized under Title IV of the Higher Education Act of 1965, as amended. Examples of these programs include Pell Grants for low-income students, PLUS loans to parents and graduate students, and Stafford loans.5 Much of this aid has been provided on the basis of the difference between a student’s cost of attendance and an estimate of the ability of the student and the student’s family to pay these costs, called the expected family contribution (EFC). The EFC is calculated based on information provided by students and parents on the Free Application for Federal Student Aid (FAFSA). Federal law establishes the criteria that students must meet to be considered independent of their parents for the purpose of financial aid and the share of family and student income and assets that are expected to be available for the student’s education.6 In fiscal year 2007, the Department of Education made available approximately $15 billion in grants and another $65 billion in Title IV loan assistance. Title IV also authorizes programs funded by the federal government and administered by participating higher education institutions, including the Supplemental Educational Opportunity Grant
Background
5Consolidation loans are also authorized under Title IV. These loans allow borrowers to combine multiple student loans, possibly from different lenders and from different loan programs, into a single new loan with extended repayment periods. Because consolidation loans do not generally result in an increase in loan principal, they are not addressed in this testimony.
6 To be classified as an independent student for the purpose of receiving Title IV financial aid, students must meet one of the following criteria: (1) be a veteran of the armed services, (2) be age 24 years or older by December 31st of the award year, (3) be married, (4) be enrolled in a graduate or professional education program, (5) have legal dependents other than a spouse, or (6) be an orphan or ward of the court. Financial aid administrators may also classify students as independent through the exercise of their professional judgment for other unusual circumstances.
Page 3 GAO-08-717T
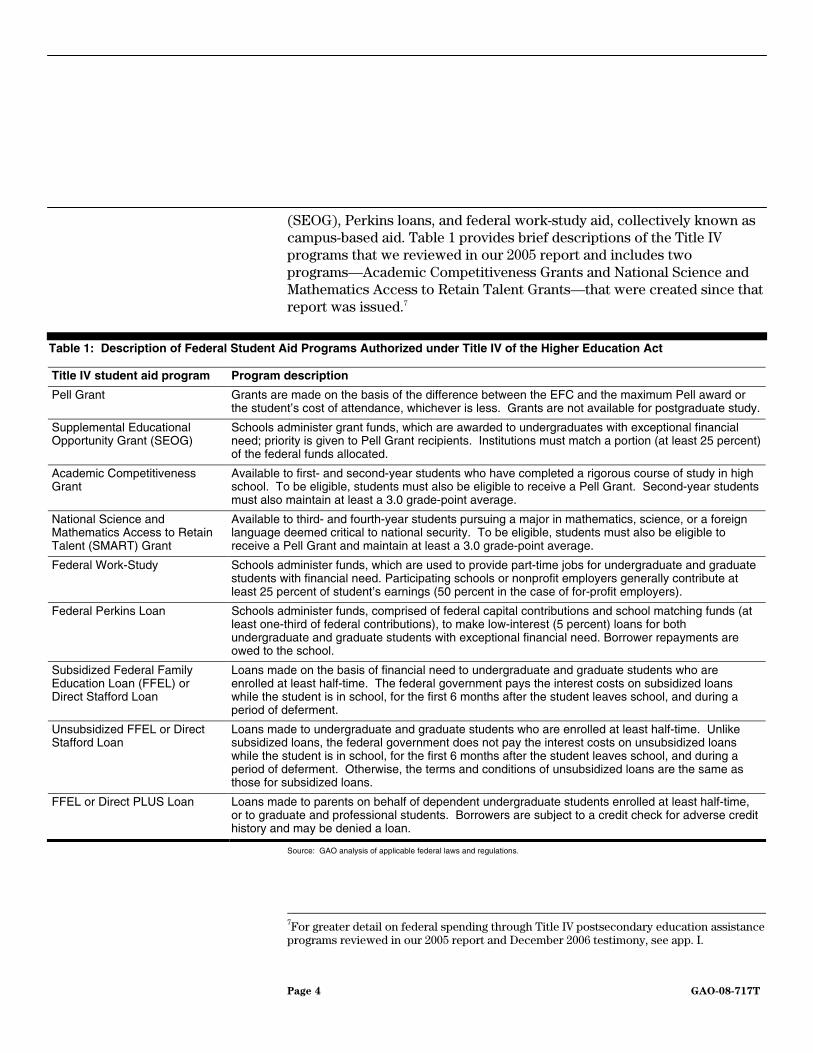
(SEOG), Perkins loans, and federal work-study aid, collectively known as campus-based aid. Table 1 provides brief descriptions of the Title IV programs that we reviewed in our 2005 report and includes two programs—Academic Competitiveness Grants and National Science and Mathematics Access to Retain Talent Grants—that were created since that report was issued.7
Table 1: Description of Federal Student Aid Programs Authorized under Title IV of the Higher Education Act
Title IV student aid program Program description
Pell Grant Grants are made on the basis of the difference between the EFC and the maximum Pell award or the student’s cost of attendance, whichever is less. Grants are not available for postgraduate study.
Supplemental Educational Opportunity Grant (SEOG)
Schools administer grant funds, which are awarded to undergraduates with exceptional financial need; priority is given to Pell Grant recipients. Institutions must match a portion (at least 25 percent) of the federal funds allocated.
Academic Competitiveness Grant
Available to first- and second-year students who have completed a rigorous course of study in high school. To be eligible, students must also be eligible to receive a Pell Grant. Second-year students must also maintain at least a 3.0 grade-point average.
National Science and Mathematics Access to Retain Talent (SMART) Grant
Available to third- and fourth-year students pursuing a major in mathematics, science, or a foreign language deemed critical to national security. To be eligible, students must also be eligible to receive a Pell Grant and maintain at least a 3.0 grade-point average.
Federal Work-Study Schools administer funds, which are used to provide part-time jobs for undergraduate and graduate students with financial need. Participating schools or nonprofit employers generally contribute at least 25 percent of student’s earnings (50 percent in the case of for-profit employers).
Federal Perkins Loan Schools administer funds, comprised of federal capital contributions and school matching funds (at least one-third of federal contributions), to make low-interest (5 percent) loans for both undergraduate and graduate students with exceptional financial need. Borrower repayments are owed to the school.
Subsidized Federal Family Education Loan (FFEL) or Direct Stafford Loan
Loans made on the basis of financial need to undergraduate and graduate students who are enrolled at least half-time. The federal government pays the interest costs on subsidized loans while the student is in school, for the first 6 months after the student leaves school, and during a period of deferment.
Unsubsidized FFEL or Direct Stafford Loan
Loans made to undergraduate and graduate students who are enrolled at least half-time. Unlike subsidized loans, the federal government does not pay the interest costs on unsubsidized loans while the student is in school, for the first 6 months after the student leaves school, and during a period of deferment. Otherwise, the terms and conditions of unsubsidized loans are the same as those for subsidized loans.
FFEL or Direct PLUS Loan Loans made to parents on behalf of dependent undergraduate students enrolled at least half-time, or to graduate and professional students. Borrowers are subject to a credit check for adverse credit history and may be denied a loan.
Source: GAO analysis of applicable federal laws and regulations.
7For greater detail on federal spending through Title IV postsecondary education assistance programs reviewed in our 2005 report and December 2006 testimony, see app. I.
Page 4 GAO-08-717T
Postsecondary assistance also has been provided through a range of tax preferences,8 including postsecondary tax credits, tax deductions, and tax-exempt savings programs. For example, the Taxpayer Relief Act of 1997 allows eligible tax filers to reduce their tax liability by receiving, for tax year 2007, up to a $1,650 Hope tax credit or up to a $2,000 Lifetime Learning tax credit for tuition and qualified related expenses paid for a single student.9 According to the Office of Management and Budget, the fiscal year 2007 federal revenue loss estimate of the postsecondary tax preferences that we reviewed was $8.7 billion. Tax preferences discussed as part of our 2005 report and December 2006 testimony include the following:10
• Lifetime Learning Credit—income-based tax credit claimed by tax filers on behalf of students enrolled in one or more postsecondary education courses.
• Hope Credit—income-based tax credit claimed by tax filers on behalf
of students enrolled at least half-time in an eligible program of study and who are in their first 2 years of postsecondary education.
• Student Loan Interest Deduction—income-based tax deduction claimed
by tax filers on behalf of students who took out qualified student loans while enrolled at least half-time.
• Tuition and Fees Deduction—income-based tax deduction claimed by
tax filers on behalf of students who are enrolled in one or more postsecondary education courses and have either a high school diploma or a General Educational Development (GED) credential.11
• Section 529 Qualified Tuition Programs—College Savings Programs
and Prepaid Tuition Programs—non-income-based programs that provide favorable tax treatment to investments and distributions used to pay the expenses of future or current postsecondary students.
8 Tax preferences—also known as tax expenditures—are reductions in tax liabilities that result from preferential provisions in the tax code, such as exemptions and exclusions from taxation, deductions, credits, deferrals, and preferential tax rates.
9Pub. L. No. 105-34, § 201, 111 Stat. 788, 799 (Aug. 5, 1997).
10For expanded descriptions of postsecondary education-related tax preferences, see app. I.
11The Tuition and Fees Deduction expired on December 31, 2007. Legislation has been introduced to reinstate the deduction.
Page 5 GAO-08-717T
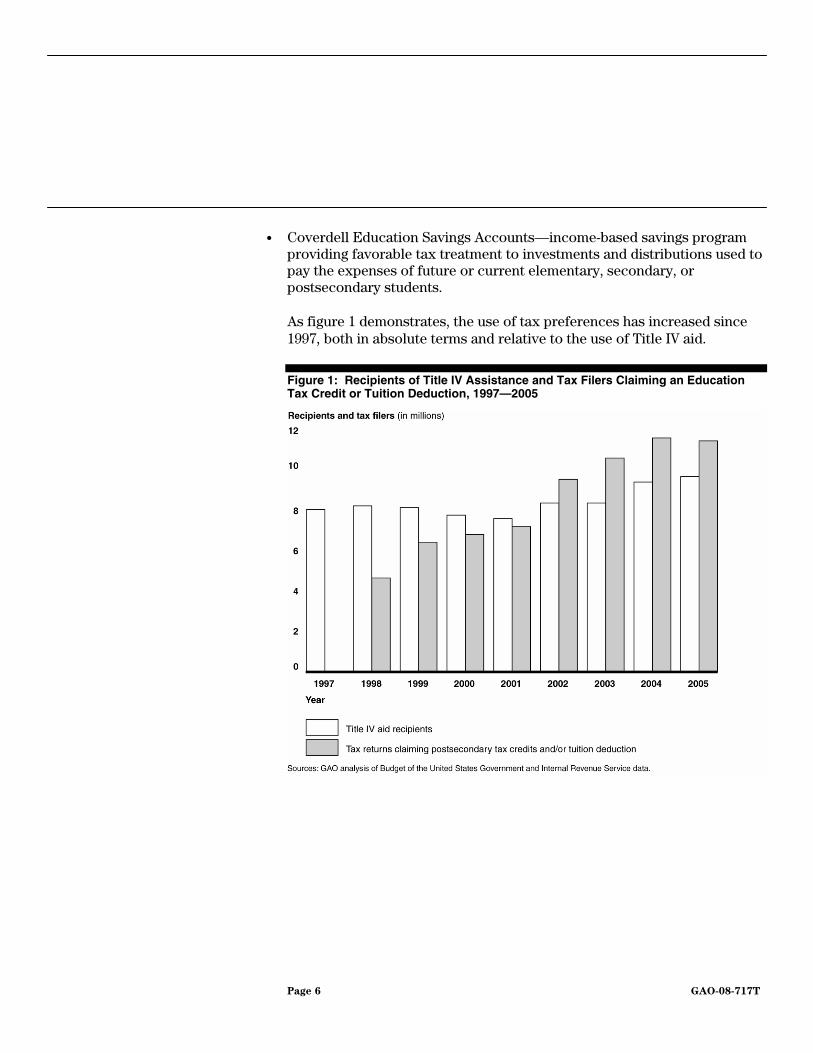
• Coverdell Education Savings Accounts—income-based savings program
providing favorable tax treatment to investments and distributions used to pay the expenses of future or current elementary, secondary, or postsecondary students. As figure 1 demonstrates, the use of tax preferences has increased since 1997, both in absolute terms and relative to the use of Title IV aid.
Figure 1: Recipients of Title IV Assistance and Tax Filers Claiming an Education Tax Credit or Tuition Deduction, 1997—2005
Page 6 GAO-08-717T
Postsecondary student financial assistance provided through programs authorized under Title IV of the Higher Education Act and the tax code differ in timing of assistance, the populations that receive assistance, and the responsibility of students and families to obtain and use the assistance.
Title IV programs and education-related tax preferences differ significantly in when eligibility is established and in the timing of the assistance they provide. Title IV programs generally provide benefits to students while they are in school. Education-related tax preferences, on the other hand, (1) encourage saving for college through tax-exempt saving, (2) assist enrolled students and their families in meeting the current costs of postsecondary education through credits and tuition deductions, and (3) assist students and families repaying the costs of past postsecondary education through a tax deduction for student loan interest paid.12
While Title IV programs and tax preferences assist many students and families, program and tax rules affect eligibility for such assistance. These rules also affect the distribution of Title IV aid and the assistance provided through tax preferences. As a result, the beneficiaries of Title IV programs and tax preferences differ.
Title IV programs generally have rules for calculating grant and loan assistance that give consideration to family and student income, assets, and college costs in the awarding of financial aid.13 For example, Pell Grant
Tax Preferences Differ from Title IV Assistance in Timing, Distribution, and Students’ and Families’ Responsibility for Obtaining Benefits
Title IV and Tax Programs Differ in Benefit Timing
Beneficiaries of Title IV Programs and Tax Preferences Differ
12Additional details on the differences in timing are available in app. II. 13Campus-based aid programs authorized under Title IV differ from these programs in funding and eligibility: institutions provide matching funding for federal spending, and participating institutions distribute aid using institution-specific criteria consistent with federal program requirements. Because they have institution-specific criteria, the relationship between program rules and the distribution of benefits is more complex and was excluded from the analysis of our 2005 report.
Page 7 GAO-08-717T
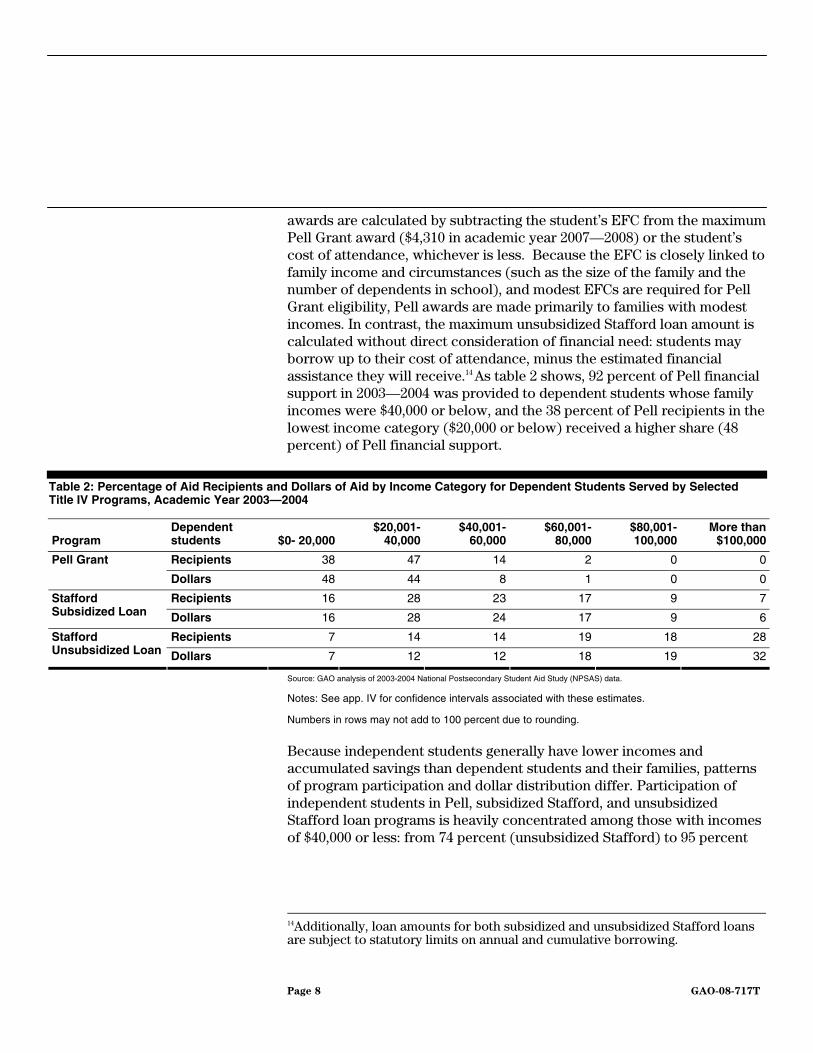
awards are calculated by subtracting the student’s EFC from the maximum Pell Grant award ($4,310 in academic year 2007—2008) or the student’s cost of attendance, whichever is less. Because the EFC is closely linked to family income and circumstances (such as the size of the family and the number of dependents in school), and modest EFCs are required for Pell Grant eligibility, Pell awards are made primarily to families with modest incomes. In contrast, the maximum unsubsidized Stafford loan amount is calculated without direct consideration of financial need: students may borrow up to their cost of attendance, minus the estimated financial assistance they will receive.14 As table 2 shows, 92 percent of Pell financial support in 2003—2004 was provided to dependent students whose family incomes were $40,000 or below, and the 38 percent of Pell recipients in the lowest income category ($20,000 or below) received a higher share (48 percent) of Pell financial support.
Table 2: Percentage of Aid Recipients and Dollars of Aid by Income Category for Dependent Students Served by Selected Title IV Programs, Academic Year 2003—2004
Program Dependent students $0- 20,000
$20,001-40,000
$40,001-60,000
$60,001-80,000
$80,001-100,000
More than $100,000
Recipients 38 47 14 2 0 0Pell Grant
Dollars 48 44 8 1 0 0
Recipients 16 28 23 17 9 7Stafford Subsidized Loan Dollars 16 28 24 17 9 6
Recipients 7 14 14 19 18 28Stafford Unsubsidized Loan Dollars 7 12 12 18 19 32
Source: GAO analysis of 2003-2004 National Postsecondary Student Aid Study (NPSAS) data.
Notes: See app. IV for confidence intervals associated with these estimates.
Numbers in rows may not add to 100 percent due to rounding.
Because independent students generally have lower incomes and accumulated savings than dependent students and their families, patterns of program participation and dollar distribution differ. Participation of independent students in Pell, subsidized Stafford, and unsubsidized Stafford loan programs is heavily concentrated among those with incomes of $40,000 or less: from 74 percent (unsubsidized Stafford) to 95 percent
14Additionally, loan amounts for both subsidized and unsubsidized Stafford loans are subject to statutory limits on annual and cumulative borrowing.
Page 8 GAO-08-717T
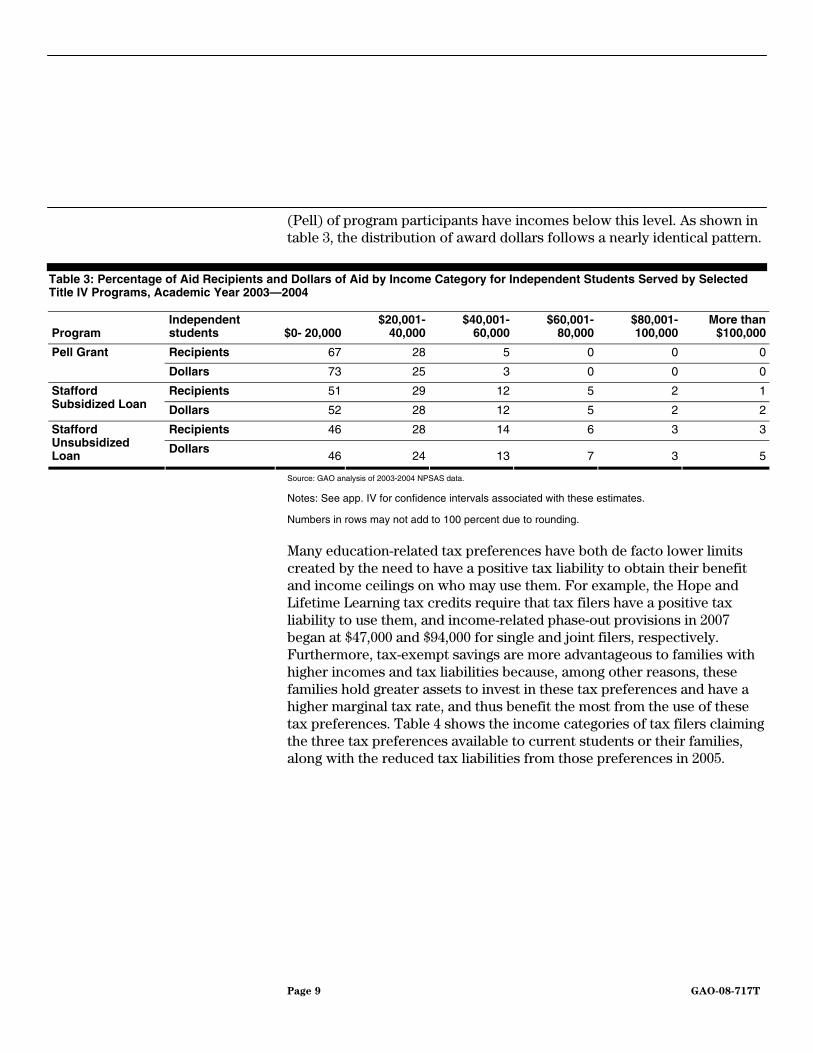
(Pell) of program participants have incomes below this level. As shown in table 3, the distribution of award dollars follows a nearly identical pattern.
Table 3: Percentage of Aid Recipients and Dollars of Aid by Income Category for Independent Students Served by Selected Title IV Programs, Academic Year 2003—2004
Program Independent students $0- 20,000
$20,001-40,000
$40,001-60,000
$60,001-80,000
$80,001-100,000
More than $100,000
Recipients 67 28 5 0 0 0Pell Grant
Dollars 73 25 3 0 0 0
Recipients 51 29 12 5 2 1Stafford Subsidized Loan Dollars 52 28 12 5 2 2
Recipients 46 28 14 6 3 3Stafford Unsubsidized Loan
Dollars 46 24 13 7 3 5
Source: GAO analysis of 2003-2004 NPSAS data.
Notes: See app. IV for confidence intervals associated with these estimates.
Numbers in rows may not add to 100 percent due to rounding.
Many education-related tax preferences have both de facto lower limits created by the need to have a positive tax liability to obtain their benefit and income ceilings on who may use them. For example, the Hope and Lifetime Learning tax credits require that tax filers have a positive tax liability to use them, and income-related phase-out provisions in 2007 began at $47,000 and $94,000 for single and joint filers, respectively. Furthermore, tax-exempt savings are more advantageous to families with higher incomes and tax liabilities because, among other reasons, these families hold greater assets to invest in these tax preferences and have a higher marginal tax rate, and thus benefit the most from the use of these tax preferences. Table 4 shows the income categories of tax filers claiming the three tax preferences available to current students or their families, along with the reduced tax liabilities from those preferences in 2005.
Page 9 GAO-08-717T
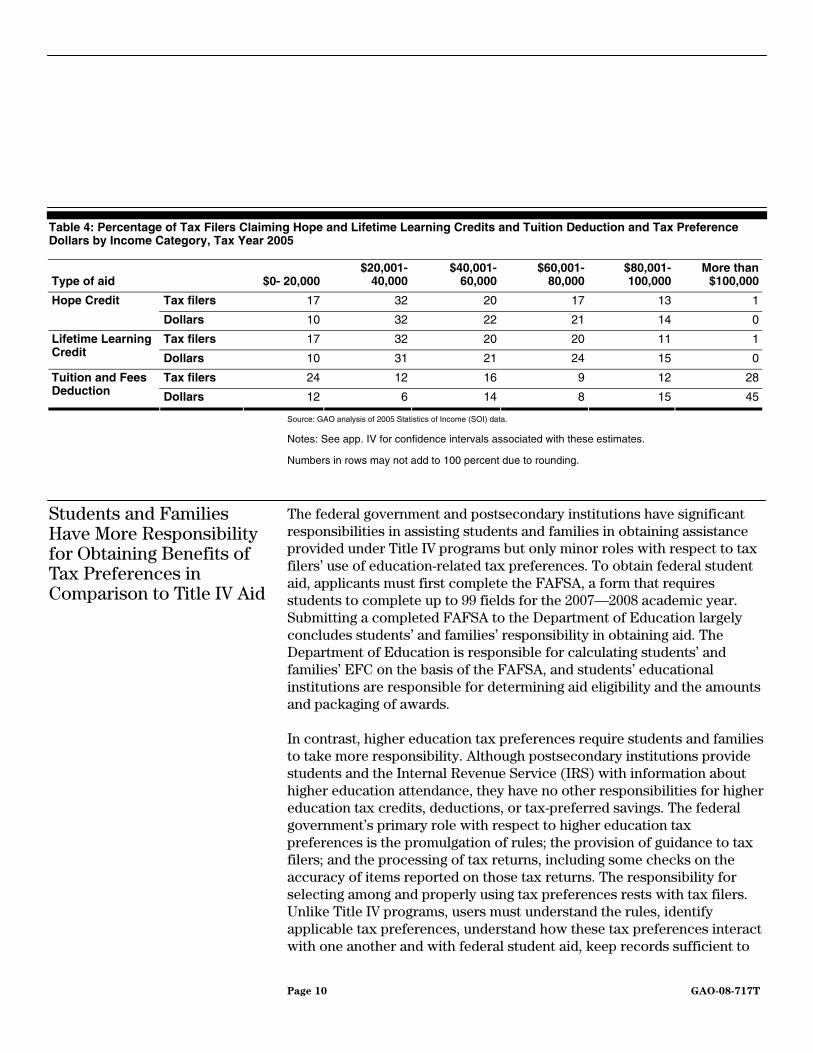
Table 4: Percentage of Tax Filers Claiming Hope and Lifetime Learning Credits and Tuition Deduction and Tax Preference Dollars by Income Category, Tax Year 2005
Type of aid
$0- 20,000 $20,001-
40,000$40,001-
60,000$60,001-
80,000 $80,001-100,000
More than $100,000
Tax filers 17 32 20 17 13 1Hope Credit
Dollars 10 32 22 21 14 0
Tax filers 17 32 20 20 11 1Lifetime Learning Credit Dollars 10 31 21 24 15 0
Tax filers 24 12 16 9 12 28Tuition and Fees Deduction Dollars 12 6 14 8 15 45
Source: GAO analysis of 2005 Statistics of Income (SOI) data.
Notes: See app. IV for confidence intervals associated with these estimates.
Numbers in rows may not add to 100 percent due to rounding.
Students and Families Have More Responsibility for Obtaining Benefits of Tax Preferences in Comparison to Title IV Aid
The federal government and postsecondary institutions have significant responsibilities in assisting students and families in obtaining assistance provided under Title IV programs but only minor roles with respect to tax filers’ use of education-related tax preferences. To obtain federal student aid, applicants must first complete the FAFSA, a form that requires students to complete up to 99 fields for the 2007—2008 academic year. Submitting a completed FAFSA to the Department of Education largely concludes students’ and families’ responsibility in obtaining aid. The Department of Education is responsible for calculating students’ and families’ EFC on the basis of the FAFSA, and students’ educational institutions are responsible for determining aid eligibility and the amounts and packaging of awards.
In contrast, higher education tax preferences require students and families to take more responsibility. Although postsecondary institutions provide students and the Internal Revenue Service (IRS) with information about higher education attendance, they have no other responsibilities for higher education tax credits, deductions, or tax-preferred savings. The federal government’s primary role with respect to higher education tax preferences is the promulgation of rules; the provision of guidance to tax filers; and the processing of tax returns, including some checks on the accuracy of items reported on those tax returns. The responsibility for selecting among and properly using tax preferences rests with tax filers. Unlike Title IV programs, users must understand the rules, identify applicable tax preferences, understand how these tax preferences interact with one another and with federal student aid, keep records sufficient to
Page 10 GAO-08-717T
support their tax filing, and correctly claim the credit or deduction on their return.
According to our analysis of 2005 IRS data on the use of Hope and Lifetime Learning Credits and the tuition deduction, some tax filers appear to make less-than-optimal choices among them. The apparent suboptimal use of postsecondary tax preferences may arise, in part, from the complexity of these provisions.
Some Tax Filers May Not Effectively Use Postsecondary Tax Preferences, Possibly Due to Complexity
Some Tax Filers Appear to Make Suboptimal Choices
Making poor choices among tax preferences for postsecondary education may be costly to tax filers. For example, families may strand assets in a tax-exempt savings vehicle and incur tax penalties on their distribution if their child chooses not to go to college. They may also fail to minimize their federal income tax liability by claiming a tax credit or deduction that yields less of a reduction in taxes than a different tax preference or by failing to claim any of their available tax preferences. For example, if a married couple filing jointly with one dependent in his/her first 2 years of college had an adjusted gross income of $50,000, qualified expenses of $10,000 in 2007, and tax liability greater than $2,000, their tax liability would be reduced by $2,000 if they claimed the Lifetime Learning Credit but only $1,650 if they claimed the Hope Credit.
In our analysis of 2005 IRS data for returns with information on education expenses incurred, we found that some people who appear to be eligible for tax credits or the tuition deduction did not claim them. We estimate that 2.1 million filers could have claimed a tax credit or tuition deduction and thereby reduced their taxes. However, about 19 percent of those filers, representing about 412,000 returns, failed to claim any of them. The amount by which these tax filers failed to reduce their tax averaged $219; 10 percent of this group could have reduced their tax liability by over $500.15
In total, including both those who failed to claim a tax credit or tuition deduction and those who chose a credit or a deduction that did not maximize their benefit, we found that in 2005, 28 percent, or nearly 601,000
15 Confidence intervals for all estimates in this section are included in app. IV.
Page 11 GAO-08-717T
tax filers did not maximize their potential tax benefit. Regarding those making a poor choice among the provisions, for example, 27 percent of tax filers that claimed the tuition deduction could have further reduced their tax liability by an average of $220 by instead claiming the Lifetime Learning Credit; 10 percent of this group could have reduced their tax liabilities by over $630. Tax filers that claimed the Hope Credit when the Lifetime Learning Credit was a more optimal choice failed to reduce their tax liabilities by an average of $356.
Suboptimal choices were not limited to tax filers who prepared their own tax returns. A possible indicator of the difficulty people face in understanding education-related tax preferences is how often the suboptimal choices we identified were found on tax returns prepared by paid tax preparers. We estimate that 50 percent of the returns we found that appear to have failed to optimally reduce the tax filer’s tax liability were prepared by paid tax preparers. Generalized to the population of tax returns we were able to review, returns prepared by paid tax preparers represent about 301,000 of the approximately 601,000 suboptimal choices we found. Our April 2006 study of paid tax preparers corroborates the problem of confusion over which of the tax preferences to claim.16 Of the nine undercover investigation visits we made to paid preparers with a taxpayer with a dependent college student, three preparers did not claim the credit most advantageous to the taxpayer and thereby cost these taxpayers hundreds of dollars in refunds. In our investigative scenario, the expenses and the year in school made the Hope education credit far more advantageous to the taxpayer than either the tuition and fees deduction or the Lifetime Learning credit.
The Suboptimal Use of Postsecondary Tax Preferences May Result from Their Complexity
The apparently suboptimal use of postsecondary tax preferences may arise, in part, because of the complexity of using these provisions. Tax policy analysts have frequently identified postsecondary tax preferences as a set of tax provisions that demand a particularly large investment of knowledge and skill on the part of students and families or expert assistance purchased by those with the means to do so. They suggest that this complexity arises from multiple postsecondary tax preferences with similar purposes, from key definitions that vary across these provisions, and from rules that coordinate the use of multiple tax provisions. Twelve
16GAO, Paid Tax Return Preparers: In a Limited Study, Chain Preparers Made Serious
Errors, GAO-06-563T (Washington, D.C.: Apr. 4, 2006).
Page 12 GAO-08-717T
tax preferences are outlined in IRS Publication 970, Tax Benefits for
Education: For Use in Preparing 2007 Returns. The publication includes four different tax preferences for educational saving. Three of these preferences—Coverdell Education Savings Accounts, Qualified Tuition Programs, and U.S. education savings bonds—differ across more than a dozen dimensions, including the tax penalty that occurs when account balances are not used for qualified higher education expenses, who may be an eligible beneficiary, annual contribution limits, and other features.
In addition to learning about, comparing, and selecting tax preferences, filers who wish to make optimal use of multiple tax preferences must understand how the use of one tax preference affects the use of others. The use of multiple education-related tax preferences is coordinated through rules that prohibit the application of the same qualified higher education expenses for the same student to more than one education-related tax preference, sometimes referred to as “anti-double-dipping rules.” These rules are important because they prevent tax filers from underreporting their tax liability. Nonetheless, anti-double-dipping rules are potentially difficult for tax filers to understand and apply, and misunderstanding them may have consequences for a filer’s tax liability.17
Many researchers and policy analysts support simplifying the existing federal grant, loans and tax preferences in the belief that doing so would have a net benefit on encouraging access. Indeed, suggestions put forth in recent years to combine the federal grants and tax credits, for example, may help address some of the challenges we identified in recent years regarding tax filers’ suboptimal use of postsecondary tax preferences or the confusion created by the interactions between direct student aid programs, such as the Pell Grant, and existing tax preferences. In this case, reducing the number of choices students and their families have to make would likely reduce tax filers’ confusion and mistakes.
Benefits to Simplifying Federal Student Aid Have Associated Implementation Challenges and Costs
To date, we have not undertaken any studies of how current Title IV student aid programs or tax preferences could be simplified and, as a result, have not developed any such models or proposals. However, while different aspects of simplification may provide students and their families with various benefits, Congress would likely want to weigh those benefits against a number of potentially related costs.
17For an example of this phenomenon, please see app. III.
Page 13 GAO-08-717T
Simplifying the federal application for student aid—A better understanding is needed about whether or to what extent simplifying the application for federal aid would: (1) alter the administration of other federal, state and institutional student aid programs, (2) be capable of accommodating future federal policies designed to target aid, and (3) affect current programs that are specifically tied to Pell Grant eligibility.18 The current FAFSA is used to determine students’ eligibility for various federal aid programs, including Pell Grants, Academic Competitiveness Grants, SMART Grants, Stafford and PLUS loans, Supplemental Educational Opportunity Grants (SEOG), Perkins Loans, and Federal Work-Study. In addition, many states and schools rely on the FAFSA when awarding state and institutional student aid.19 To the extent that other programs require FAFSA-like information from applicants to award financial aid, additional research is needed to determine whether simplifying the FAFSA may actually increase the number of applications students and families would be required to submit.
Simplifying eligibility verification requirements—Both grants and tax credits are awarded based, in part, on students’ and their families’ incomes, which means students and families are required to document their income to receive the benefit. Under the current system, some students and families are eligible to apply for Title IV student aid even though they are not required to file a tax return; in such cases, eligibility is computed based upon information reported on the FAFSA. Any plan to consolidate some or all of the current federal grants and tax preferences would need to consider how to minimize burden on students and families while also controlling federal administrative costs, for example, by minimizing the use of multiple verification procedures that use multiple forms of documentation and that are administered by multiple agencies.
Simplifying program administration while maintaining federal cost
controls —Federal grant and loan programs are administered by the Department of Education while federal tax preferences are administered by IRS. Under a system where existing grant aid and tax credits are consolidated, it is unclear without additional research, whether cost
18Examples include the recently established Academic Competitiveness and National Science and Mathematics Access to Retain Talent (SMART) Grants.
19The first page of the FAFSA lists states’ filing deadlines of the form for the purpose of state aid programs, which, for the 2007-2008 award year range from March 1, 2007, to June 30, 2008.
Page 14 GAO-08-717T
efficiency is better achieved through having the Department of Education or IRS assume federal budgeting and accounting responsibilities. In addition, the grant programs generally are subject to an annual appropriation which enables Congress to control overall federal expenditures by taking into account other federal priorities. In contrast, most tax preferences are like entitlement programs and their revenue losses can only be controlled by changing the statutory qualifications for the tax preference.
Simplifying aid distribution—Policymakers will need to consider costs associated with the federal government recovering funds if students fail to maintain eligibility requirements over the course of an academic year. Families currently claim tax preferences after qualifying higher education expenses have been incurred but receive federal grant benefits to pay current expenses. Program simplifications that consolidate grants and tax preferences into a benefit paid before expenses are incurred likely will require the implementation of new cost recovery mechanisms or other means to allocate payments based on costs actually incurred.
Simplifying eligible expenses—Room and board expenses are considered in the administration of the federal student aid programs authorized under Title IV of the Higher Education Act but not in all tax preferences, particular the Hope and Lifetime Learning Credits. Careful analysis will be needed of how such expenses could be accounted for in a simplified scheme if it is changed to being structured as a tax preference rather than a grant. Room and board expenses vary based on where a school is located or whether a student lives on or off campus, and they can be a significant component of a student’s cost of attendance, particularly at community colleges. While certain strategies might be employed to lessen tax filers’ recordkeeping requirements and result in fewer tax filer compliance issues, further research is needed on how such an allowance would be optimally set. Establishing too high an allowance, for example, could result in some students receiving a benefit in excess of the costs they incur for room and board, especially for those students who choose to live with their parents. Alternatively, if tax assistance is provided in advance of incurring costs, but the assistance is to be limited to costs actually incurred, a cost recovery or other administrative mechanism would be needed as discussed above.
Page 15 GAO-08-717T
Little is known about the effectiveness of federal grant and loan programs and education-related tax preferences in promoting attendance, choice, and the likelihood that students either earn a degree or continue their education (referred to as persistence). Many federal aid programs and tax preferences have not been studied, and for those that have been studied, important aspects of their effectiveness remain unexamined. In our 2005 report, we found no research on any aspect of effectiveness for several major Title IV federal postsecondary programs and tax preferences. For example, no research had examined the effects of federal postsecondary education tax credits on students’ persistence in their studies or on the type of postsecondary institution they choose to attend, and there is limited research on the effectiveness of the Pell Grant program on students’ persistence.20 One recently published study suggests that complexity in the federal grant and loan application processes may undermine its efficacy in promoting postsecondary attendance.21 The relative newness of most of the tax preferences also presents challenges because relevant data are just now becoming available. These factors may contribute to a lack of information concerning the effectiveness of the aid programs and tax preferences.
Research on Effectiveness of Federal Postsecondary Assistance Is Incomplete
In 2002, we recommended that the Department of Education sponsor research into key aspects of effectiveness of Title IV programs, that the Department of Education and the Department of the Treasury collaborate on such research into the relative effectiveness of Title IV programs and tax preferences, and that the Secretaries of Education and the Treasury collaborate in studying the combined effects of tax preferences and Title IV aid. 22 In April 2006, the Department of Education’s Institute for Education Sciences (IES) issued a Request for Applications to conduct research on, among other things, “evaluating the efficacy of programs, practices, or policies that are intended to improve access to, persistence
20Eric Bettinger. “How Financial Aid Affects Persistence,” in College Choices: The
Economics of Where to Go, When to Go, and How To Pay for It, edited by Caroline Hoxby, (Chicago: University of Chicago Press, 2004) 207-238. This study cites numerous data availability and reliability challenges confronting research examining Pell Grant effects on student collegiate outcomes.
21Susan M. Dynarski, and Judith E. Scott-Clayton. “The Cost of Complexity in Federal Student Aid: Lessons from Optimal Tax Theory and Behavioral Economics.” National Tax
Journal, June 2006.
22GAO, Student Aid and Tax Benefits: Better Research and Guidance Will Facilitate
Comparison of Effectiveness and Student Use, GAO-02-751 (Washington, D.C.: Sept. 13, 2002).
Page 16 GAO-08-717T
in, or completion of postsecondary education.” Multiyear projects funded under this subtopic began in July 2007. However, none of the grants awarded to date appear to directly evaluate the role and effectiveness of Title IV programs and tax preferences in improving access to, persistence in, or completion of postsecondary education.
As we noted in our 2002 report, more research into the effectiveness of different forms of postsecondary education assistance is important. 23
Without such information federal policymakers cannot make fact-based decisions about how to build on successful programs and make necessary changes to improve less-effective programs. The budget deficit and other major fiscal challenges facing the nation necessitate rethinking the base of existing federal spending and tax programs, policies, and activities by reviewing their results and testing their continued relevance and relative priority for a changing society.24
In light of the long-term fiscal challenge this nation faces and the need to make hard decisions about how the federal government allocates resources, this hearing provides an opportunity to continue a discussion about how the federal government can best help students and their families pay for postsecondary education. Some questions that Congress should consider during this dialog include the following:
Concluding Observations
• Should the federal government consolidate postsecondary education tax provisions to make them easier for the public to use and understand?
• Given its limited resources, should the government further target Title
IV programs and tax provisions based on need or other factors? • How can Congress best evaluate the effectiveness and efficiency of
postsecondary education aid provided through the tax code? • Can tax preferences and Title IV programs be better coordinated to
maximize their effectiveness?
23GAO-02-751.
24GAO-05-325SP.
Page 17 GAO-08-717T
Mr. Chairman and Members of the Subcommittee, this concludes our statement. We welcome any questions you have at this time.
For further information regarding this testimony, please contact Michael Brostek at (202) 512-9110 or [email protected] or George Scott at (202) 512-7215 or [email protected]. Individuals making contributions to this testimony include David Lewis, Assistant Director; Sarah Farkas, Sheila R. McCoy, John Mingus, Danielle Novak, Daniel Novillo, Carlo Salerno, Andrew J. Stephens, and Jessica Thomsen.
Staff Contacts and Acknowledgments
Page 18 GAO-08-717T
Page 19 GAO-08-717T
Appendix I: Postsecondary Aid Programs
The federal government helps students and families save, pay for, and repay the costs of postsecondary education through grant and loan programs authorized under Title IV of the Higher Education Act of 1965, as amended, and through tax preferences—reductions in federal tax liabilities that result from preferential provisions in the tax code, such as exemptions and exclusions from taxation, deductions, credits, deferrals, and preferential tax rates.
Assistance provided under Title IV programs include Pell Grants for low-income students, the Academic Competitiveness and National Science and Mathematics Access to Retain Talent Grants, PLUS loans, which parents as well as graduate and professional students may apply for, and Stafford loans.1 While each of the three grants reduces the price paid by the student, student loans help to finance the remaining costs and are to be repaid according to varying terms. Stafford loans may be either subsidized or unsubsidized. The federal government pays the interest cost on subsidized loans while the student is in school, and during a 6-month period known as the grace period, after the student leaves school. For unsubsidized loans, students are responsible for all interest costs.2 Stafford and PLUS loans are provided to students through both the Federal Family Education Loan program (FFEL) and the William D. Ford Direct Loan Program (FDLP). The federal government’s role in financing and administering these two loan programs differs significantly. Under the FFEL program, private lenders, such as banks, provide loan capital and make loans, and the federal government guarantees FFEL lenders a minimum yield on the loans they make and repayment if borrowers
Federal Grant and Loan Assistance to Postsecondary Students
1Consolidation loans are also authorized under Title IV. These loans allow borrowers to combine multiple student loans, possibly from different lenders and from different loan programs, into a single new loan with extended repayment periods. Because consolidation loans do not generally result in an increase in loan principal, consolidation loans are not addressed in this review. However, the federal government can incur significant costs in providing borrowers with these loans. See GAO, Student Loan Programs: As Federal Costs of Loan Consolidation Rise, Other Options Should Be Examined, GAO-04-101 (Washington, D.C.: Oct. 31, 2003) and Student Loan Programs: Lower Interest Rates and Higher Loan Volume Have Increased Federal Consolidation Loan Costs, GAO-04-568T (Washington, D.C.: Mar. 17, 2004). 2While called “unsubsidized,” the federal government can still incur costs on such loans, including the costs associated with borrowers who default on their loans and, under the Federal Family Education Loan Program, the costs of making payments to lenders to ensure them a minimum federally guaranteed yield.
default. Under FDLP, the federal government makes loans to students using federal funds.
The Department of Education and its private-sector contractors jointly administer the program. Title IV also authorizes programs funded by the federal government and administered by participating higher education institutions, including the Supplemental Educational Opportunity Grant (SEOG), Perkins loans, and federal work-study aid, collectively known as campus-based aid.
To receive Title IV aid, students (along with parents, in the case of dependent students) must complete a Free Application for Federal Student Aid form. Information from the FAFSA, particularly income and asset information, is used to determine the amount of money—called the expected family contribution—that the student and/or family is expected to contribute to the student’s education. Federal law establishes the criteria that students must meet to be considered independent of their parents for the purpose of financial aid and the share of family and student income and assets that are expected to be available for the student’s education. Once the EFC is established, it is compared with the cost of attendance at the institution chosen by the student. The cost of attendance comprises tuition and fees; room and board; books and supplies; transportation; certain miscellaneous personal expenses; and, for some students, additional expenses. 3 If the EFC is greater than the cost of attendance, the student is not considered to have financial need, according to the federal aid methodology. If the cost of attendance is greater than the EFC, then the student is considered to have financial need. Title IV assistance that is made on the basis of the calculated need of aid applicants is called need-based aid. Key characteristics of Title IV programs are summarized in table 5 below.
3For example, these may include child care expenses for parents of young dependent children or supportive services for disabled students.
Page 20 GAO-08-717T
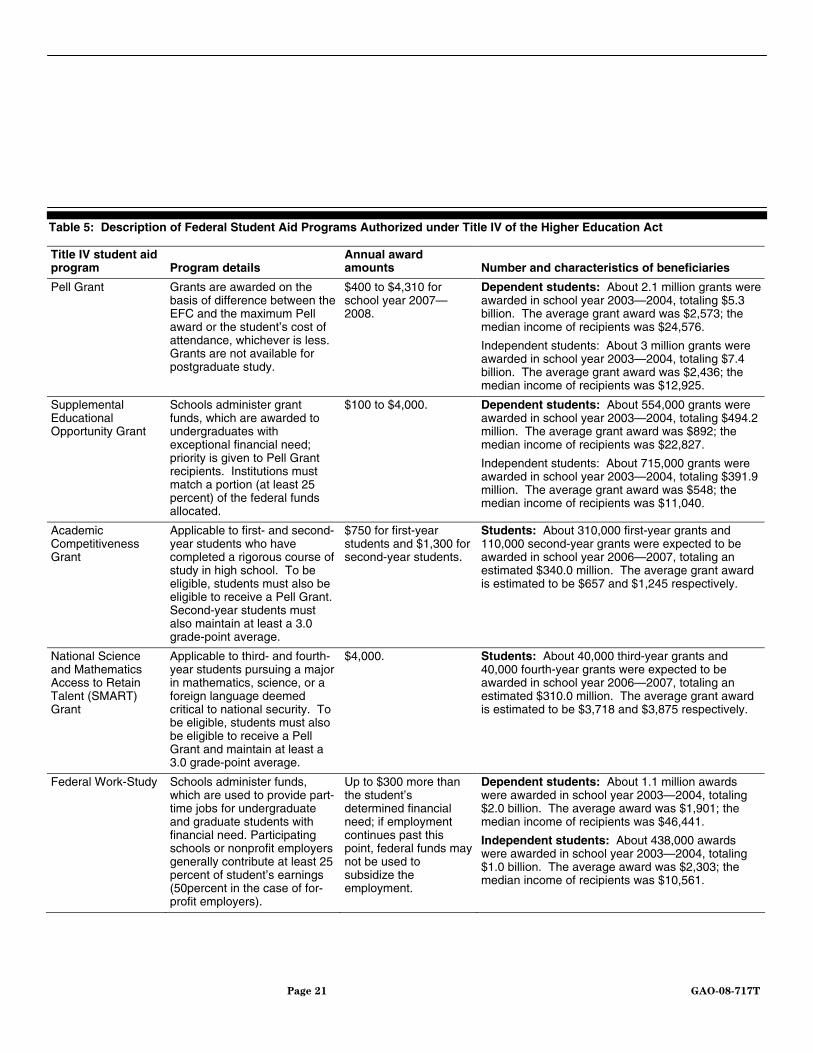
Table 5: Description of Federal Student Aid Programs Authorized under Title IV of the Higher Education Act
Title IV student aid program Program details
Annual award amounts Number and characteristics of beneficiaries
Pell Grant Grants are awarded on the basis of difference between the EFC and the maximum Pell award or the student’s cost of attendance, whichever is less. Grants are not available for postgraduate study.
$400 to $4,310 for school year 2007—2008.
Dependent students: About 2.1 million grants were awarded in school year 2003—2004, totaling $5.3 billion. The average grant award was $2,573; the median income of recipients was $24,576.
Independent students: About 3 million grants were awarded in school year 2003—2004, totaling $7.4 billion. The average grant award was $2,436; the median income of recipients was $12,925.
Supplemental Educational Opportunity Grant
Schools administer grant funds, which are awarded to undergraduates with exceptional financial need; priority is given to Pell Grant recipients. Institutions must match a portion (at least 25 percent) of the federal funds allocated.
$100 to $4,000. Dependent students: About 554,000 grants were awarded in school year 2003—2004, totaling $494.2 million. The average grant award was $892; the median income of recipients was $22,827.
Independent students: About 715,000 grants were awarded in school year 2003—2004, totaling $391.9 million. The average grant award was $548; the median income of recipients was $11,040.
Academic Competitiveness Grant
Applicable to first- and second-year students who have completed a rigorous course of study in high school. To be eligible, students must also be eligible to receive a Pell Grant. Second-year students must also maintain at least a 3.0 grade-point average.
$750 for first-year students and $1,300 for second-year students.
Students: About 310,000 first-year grants and 110,000 second-year grants were expected to be awarded in school year 2006—2007, totaling an estimated $340.0 million. The average grant award is estimated to be $657 and $1,245 respectively.
National Science and Mathematics Access to Retain Talent (SMART) Grant
Applicable to third- and fourth-year students pursuing a major in mathematics, science, or a foreign language deemed critical to national security. To be eligible, students must also be eligible to receive a Pell Grant and maintain at least a 3.0 grade-point average.
$4,000. Students: About 40,000 third-year grants and 40,000 fourth-year grants were expected to be awarded in school year 2006—2007, totaling an estimated $310.0 million. The average grant award is estimated to be $3,718 and $3,875 respectively.
Federal Work-Study Schools administer funds, which are used to provide part-time jobs for undergraduate and graduate students with financial need. Participating schools or nonprofit employers generally contribute at least 25 percent of student’s earnings (50percent in the case of for-profit employers).
Up to $300 more than the student’s determined financial need; if employment continues past this point, federal funds may not be used to subsidize the employment.
Dependent students: About 1.1 million awards were awarded in school year 2003—2004, totaling $2.0 billion. The average award was $1,901; the median income of recipients was $46,441.
Independent students: About 438,000 awards were awarded in school year 2003—2004, totaling $1.0 billion. The average award was $2,303; the median income of recipients was $10,561.
Page 21 GAO-08-717T
Title IV student aid program Program details
Annual award amounts Number and characteristics of beneficiaries
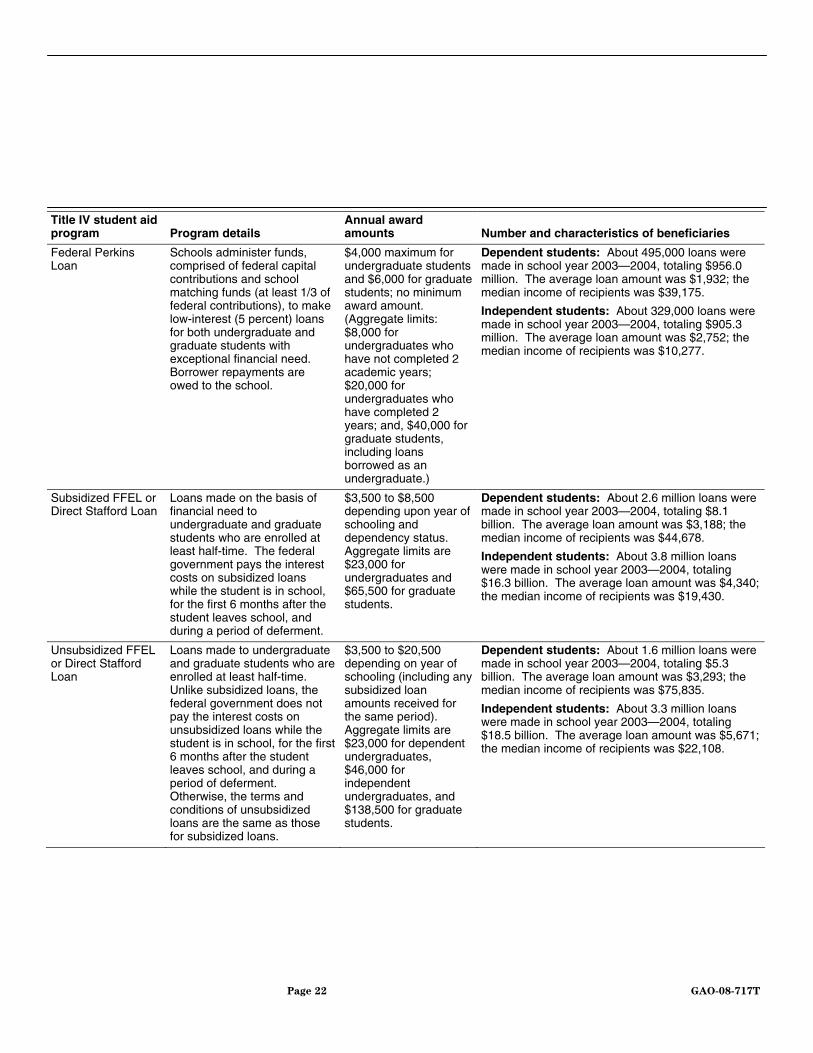
Federal Perkins Loan
Schools administer funds, comprised of federal capital contributions and school matching funds (at least 1/3 of federal contributions), to make low-interest (5 percent) loans for both undergraduate and graduate students with exceptional financial need. Borrower repayments are owed to the school.
$4,000 maximum for undergraduate students and $6,000 for graduate students; no minimum award amount. (Aggregate limits: $8,000 for undergraduates who have not completed 2 academic years; $20,000 for undergraduates who have completed 2 years; and, $40,000 for graduate students, including loans borrowed as an undergraduate.)
Dependent students: About 495,000 loans were made in school year 2003—2004, totaling $956.0 million. The average loan amount was $1,932; the median income of recipients was $39,175.
Independent students: About 329,000 loans were made in school year 2003—2004, totaling $905.3 million. The average loan amount was $2,752; the median income of recipients was $10,277.
Subsidized FFEL or Direct Stafford Loan
Loans made on the basis of financial need to undergraduate and graduate students who are enrolled at least half-time. The federal government pays the interest costs on subsidized loans while the student is in school, for the first 6 months after the student leaves school, and during a period of deferment.
$3,500 to $8,500 depending upon year of schooling and dependency status. Aggregate limits are $23,000 for undergraduates and $65,500 for graduate students.
Dependent students: About 2.6 million loans were made in school year 2003—2004, totaling $8.1 billion. The average loan amount was $3,188; the median income of recipients was $44,678.
Independent students: About 3.8 million loans were made in school year 2003—2004, totaling $16.3 billion. The average loan amount was $4,340; the median income of recipients was $19,430.
Unsubsidized FFEL or Direct Stafford Loan
Loans made to undergraduate and graduate students who are enrolled at least half-time. Unlike subsidized loans, the federal government does not pay the interest costs on unsubsidized loans while the student is in school, for the first 6 months after the student leaves school, and during a period of deferment. Otherwise, the terms and conditions of unsubsidized loans are the same as those for subsidized loans.
$3,500 to $20,500 depending on year of schooling (including any subsidized loan amounts received for the same period). Aggregate limits are $23,000 for dependent undergraduates, $46,000 for independent undergraduates, and $138,500 for graduate students.
Dependent students: About 1.6 million loans were made in school year 2003—2004, totaling $5.3 billion. The average loan amount was $3,293; the median income of recipients was $75,835.
Independent students: About 3.3 million loans were made in school year 2003—2004, totaling $18.5 billion. The average loan amount was $5,671; the median income of recipients was $22,108.
Page 22 GAO-08-717T
Title IV student aid program Program details
Annual award amounts Number and characteristics of beneficiaries
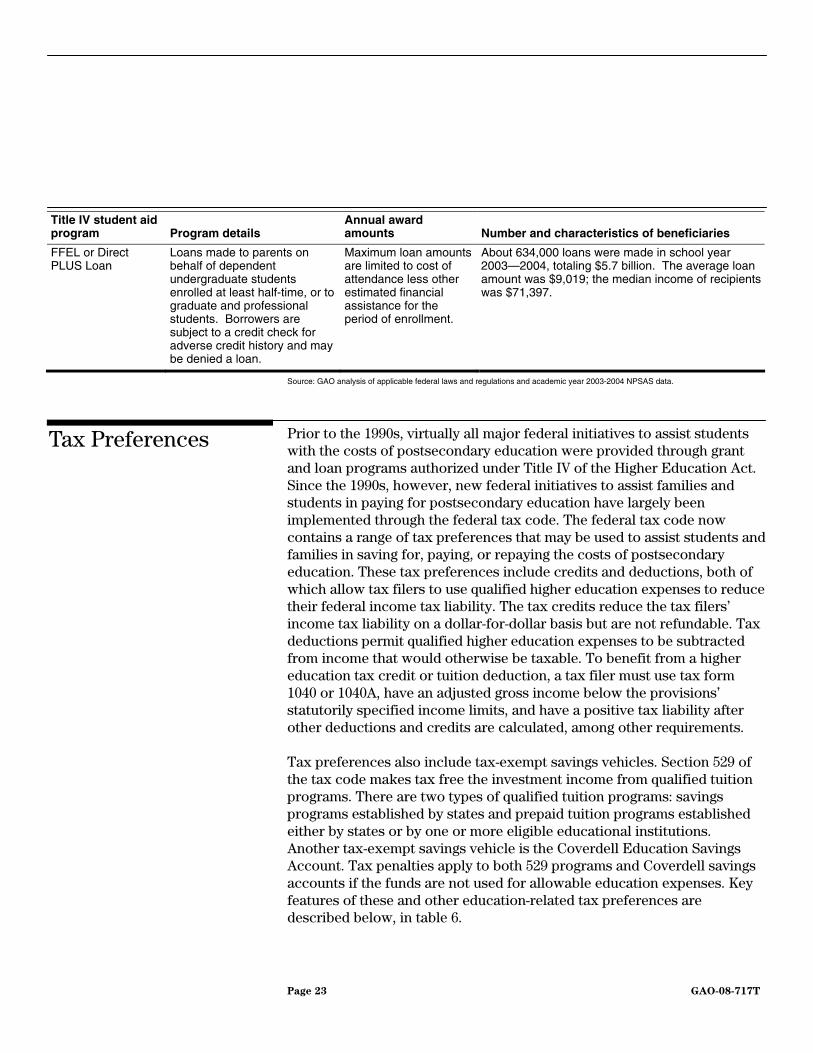
FFEL or Direct PLUS Loan
Loans made to parents on behalf of dependent undergraduate students enrolled at least half-time, or to graduate and professional students. Borrowers are subject to a credit check for adverse credit history and may be denied a loan.
Maximum loan amounts are limited to cost of attendance less other estimated financial assistance for the period of enrollment.
About 634,000 loans were made in school year 2003—2004, totaling $5.7 billion. The average loan amount was $9,019; the median income of recipients was $71,397.
Source: GAO analysis of applicable federal laws and regulations and academic year 2003-2004 NPSAS data.
Prior to the 1990s, virtually all major federal initiatives to assist students with the costs of postsecondary education were provided through grant and loan programs authorized under Title IV of the Higher Education Act. Since the 1990s, however, new federal initiatives to assist families and students in paying for postsecondary education have largely been implemented through the federal tax code. The federal tax code now contains a range of tax preferences that may be used to assist students and families in saving for, paying, or repaying the costs of postsecondary education. These tax preferences include credits and deductions, both of which allow tax filers to use qualified higher education expenses to reduce their federal income tax liability. The tax credits reduce the tax filers’ income tax liability on a dollar-for-dollar basis but are not refundable. Tax deductions permit qualified higher education expenses to be subtracted from income that would otherwise be taxable. To benefit from a higher education tax credit or tuition deduction, a tax filer must use tax form 1040 or 1040A, have an adjusted gross income below the provisions’ statutorily specified income limits, and have a positive tax liability after other deductions and credits are calculated, among other requirements.
Tax Preferences
Tax preferences also include tax-exempt savings vehicles. Section 529 of the tax code makes tax free the investment income from qualified tuition programs. There are two types of qualified tuition programs: savings programs established by states and prepaid tuition programs established either by states or by one or more eligible educational institutions. Another tax-exempt savings vehicle is the Coverdell Education Savings Account. Tax penalties apply to both 529 programs and Coverdell savings accounts if the funds are not used for allowable education expenses. Key features of these and other education-related tax preferences are described below, in table 6.
Page 23 GAO-08-717T
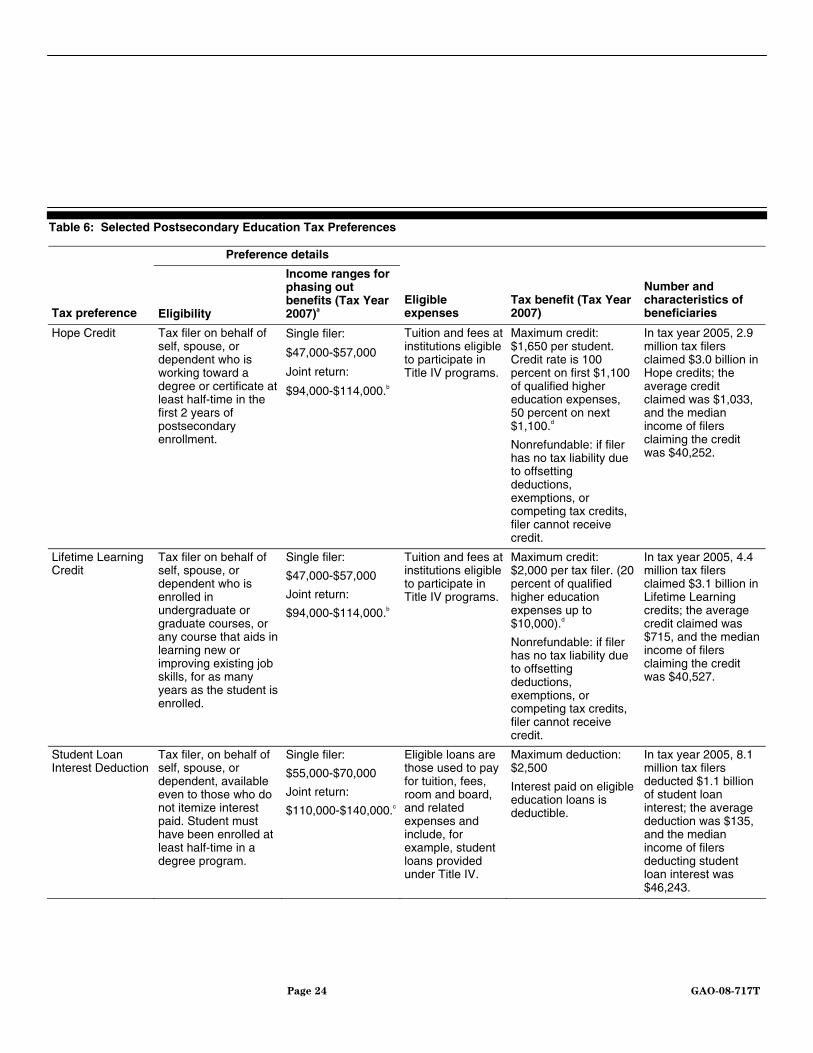
Table 6: Selected Postsecondary Education Tax Preferences
Preference details
Tax preference Eligibility
Income ranges for phasing out benefits (Tax Year 2007)a
Eligible expenses
Tax benefit (Tax Year 2007)
Number and characteristics of beneficiaries
Hope Credit Tax filer on behalf of self, spouse, or dependent who is working toward a degree or certificate at least half-time in the first 2 years of postsecondary enrollment.
Single filer:
$47,000-$57,000
Joint return:
$94,000-$114,000.b
Tuition and fees at institutions eligible to participate in Title IV programs.
Maximum credit: $1,650 per student. Credit rate is 100 percent on first $1,100 of qualified higher education expenses, 50 percent on next $1,100.d
Nonrefundable: if filer has no tax liability due to offsetting deductions, exemptions, or competing tax credits, filer cannot receive credit.
In tax year 2005, 2.9 million tax filers claimed $3.0 billion in Hope credits; the average credit claimed was $1,033, and the median income of filers claiming the credit was $40,252.
Lifetime Learning Credit
Tax filer on behalf of self, spouse, or dependent who is enrolled in undergraduate or graduate courses, or any course that aids in learning new or improving existing job skills, for as many years as the student is enrolled.
Single filer:
$47,000-$57,000
Joint return:
$94,000-$114,000.b
Tuition and fees at institutions eligible to participate in Title IV programs.
Maximum credit: $2,000 per tax filer. (20 percent of qualified higher education expenses up to $10,000).d
Nonrefundable: if filer has no tax liability due to offsetting deductions, exemptions, or competing tax credits, filer cannot receive credit.
In tax year 2005, 4.4 million tax filers claimed $3.1 billion in Lifetime Learning credits; the average credit claimed was $715, and the median income of filers claiming the credit was $40,527.
Student Loan Interest Deduction
Tax filer, on behalf of self, spouse, or dependent, available even to those who do not itemize interest paid. Student must have been enrolled at least half-time in a degree program.
Single filer:
$55,000-$70,000
Joint return:
$110,000-$140,000.c
Eligible loans are those used to pay for tuition, fees, room and board, and related expenses and include, for example, student loans provided under Title IV.
Maximum deduction: $2,500
Interest paid on eligible education loans is deductible.
In tax year 2005, 8.1 million tax filers deducted $1.1 billion of student loan interest; the average deduction was $135, and the median income of filers deducting student loan interest was $46,243.
Page 24 GAO-08-717T
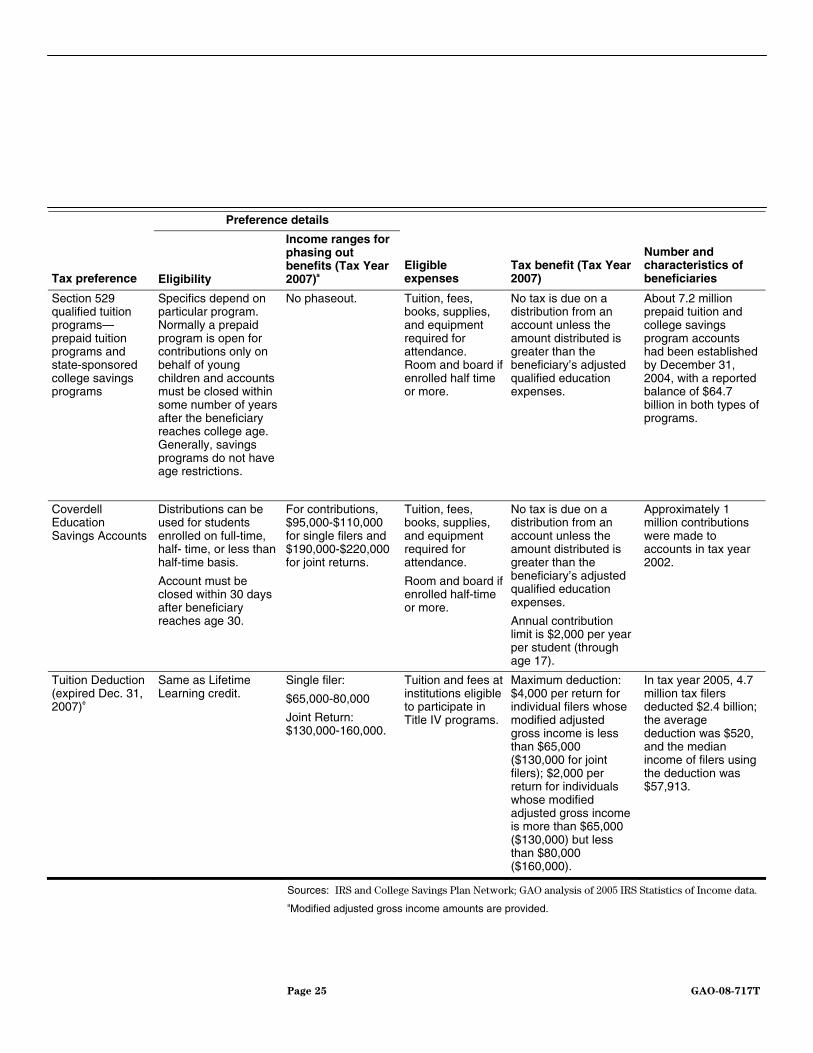
Preference details
Tax preference Eligibility
Income ranges for phasing out benefits (Tax Year 2007)a
Eligible expenses
Tax benefit (Tax Year 2007)
Number and characteristics of beneficiaries
Section 529 qualified tuition programs—prepaid tuition programs and state-sponsored college savings programs
Specifics depend on particular program. Normally a prepaid program is open for contributions only on behalf of young children and accounts must be closed within some number of years after the beneficiary reaches college age. Generally, savings programs do not have age restrictions.
No phaseout. Tuition, fees, books, supplies, and equipment required for attendance. Room and board if enrolled half time or more.
No tax is due on a distribution from an account unless the amount distributed is greater than the beneficiary’s adjusted qualified education expenses.
About 7.2 million prepaid tuition and college savings program accounts had been established by December 31, 2004, with a reported balance of $64.7 billion in both types of programs.
Coverdell Education Savings Accounts
Distributions can be used for students enrolled on full-time, half- time, or less than half-time basis.
Account must be closed within 30 days after beneficiary reaches age 30.
For contributions, $95,000-$110,000 for single filers and $190,000-$220,000 for joint returns.
Tuition, fees, books, supplies, and equipment required for attendance.
Room and board if enrolled half-time or more.
No tax is due on a distribution from an account unless the amount distributed is greater than the beneficiary’s adjusted qualified education expenses.
Annual contribution limit is $2,000 per year per student (through age 17).
Approximately 1 million contributions were made to accounts in tax year 2002.
Tuition Deduction (expired Dec. 31, 2007)e
Same as Lifetime Learning credit.
Single filer:
$65,000-80,000
Joint Return: $130,000-160,000.
Tuition and fees at institutions eligible to participate in Title IV programs.
Maximum deduction: $4,000 per return for individual filers whose modified adjusted gross income is less than $65,000 ($130,000 for joint filers); $2,000 per return for individuals whose modified adjusted gross income is more than $65,000 ($130,000) but less than $80,000 ($160,000).
In tax year 2005, 4.7 million tax filers deducted $2.4 billion; the average deduction was $520, and the median income of filers using the deduction was $57,913.
Sources: IRS and College Savings Plan Network; GAO analysis of 2005 IRS Statistics of Income data. aModified adjusted gross income amounts are provided.
Page 25 GAO-08-717T
bUnder section 25A(h) of title 26, United States Code, the income phase-out amounts are indexed to inflation according to a formula specified in law for this purpose, which may or may not result in a yearly increase.
cUnder section 221(f) of title 26, United States Code, the income phase-out amounts are indexed to inflation according to a formula specified in law for this purpose, which may or may not result in a yearly increase.
d or students who attended otherwise eligible educational institutions located within the Gulf Opportunity Zone in tax years 2005 and 2006, the maximum Hope tax credit and maximum Lifetime Learning tax credit were doubled. This increase does not apply to tax years after 2006. Gulf Opportunity Zone Act, Pub. L. No. 109-135, § 102, 119 Stat. 2577, 2594 (Jan. 7, 2005).
eAlthough the tuition deduction has expired, legislation has been introduced that would reinstate the deduction.
Our review of tax preferences did not include exclusions from income, which permit certain types of education-related income to be excluded from the calculation of adjusted gross income on which taxes are based. For example, qualified scholarships covering tuition and fees and qualified tuition reductions from eligible educational institutions are not included in gross income for income tax purposes. Similarly, student loans forgiven when a graduate goes into certain professions for a certain period of time are also not subject to federal income taxes. We did not include special provisions in the tax code that also extend existing tax preferences when tax filers support a postsecondary education student. For example, tax filers may claim postsecondary education students as dependents after age 18, even if the student has his or her own income over the limit that would otherwise apply. Also, gift taxes do not apply to funds used for certain postsecondary educational expenses, even for amounts in excess of the usual $12,000 limit on non-taxable gifts. In addition, funds withdrawn early from an Individual Retirement Account are not subject to the usual 10 percent penalty when used for either a tax filer’s or his or her dependent’s postsecondary educational expenses.
Page 26 GAO-08-717T
Page 27 GAO-08-717T
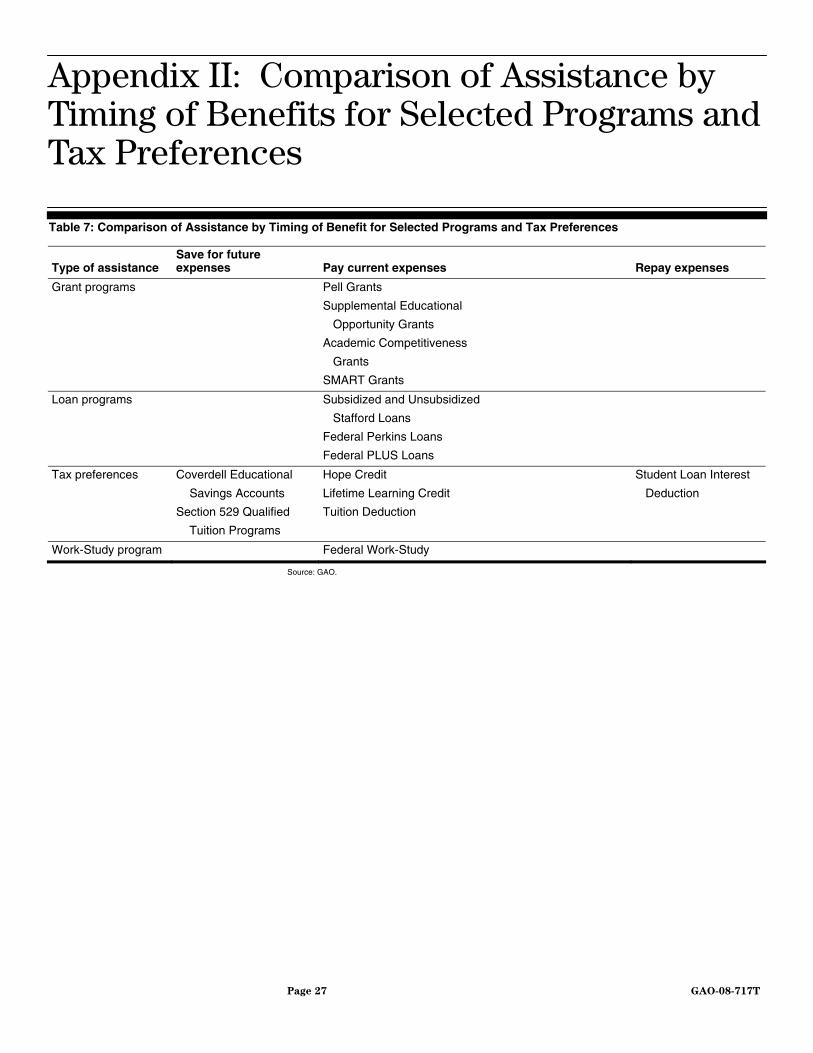
Appendix II: Comparison of Assistance by Timing of Benefits for Selected Programs and Tax Preferences
Table 7: Comparison of Assistance by Timing of Benefit for Selected Programs and Tax Preferences
Type of assistance Save for future expenses Pay current expenses Repay expenses
Grant programs Pell Grants
Supplemental Educational
Opportunity Grants
Academic Competitiveness
Grants
SMART Grants
Loan programs Subsidized and Unsubsidized
Stafford Loans
Federal Perkins Loans
Federal PLUS Loans
Tax preferences Coverdell Educational
Savings Accounts
Section 529 Qualified
Tuition Programs
Hope Credit
Lifetime Learning Credit
Tuition Deduction
Student Loan Interest
Deduction
Work-Study program Federal Work-Study
Source: GAO.
Page 28 GAO-08-717T
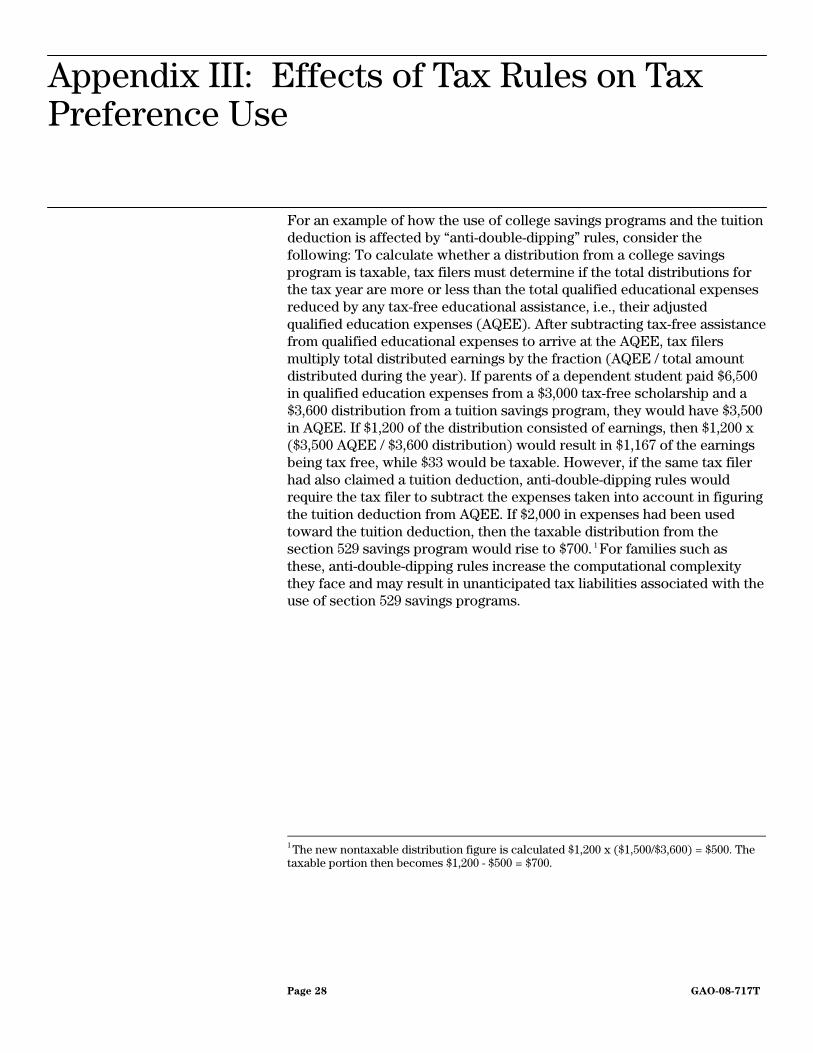
Appendix III: Effects of Tax Rules on Tax Preference Use
For an example of how the use of college savings programs and the tuition deduction is affected by “anti-double-dipping” rules, consider the following: To calculate whether a distribution from a college savings program is taxable, tax filers must determine if the total distributions for the tax year are more or less than the total qualified educational expenses reduced by any tax-free educational assistance, i.e., their adjusted qualified education expenses (AQEE). After subtracting tax-free assistance from qualified educational expenses to arrive at the AQEE, tax filers multiply total distributed earnings by the fraction (AQEE / total amount distributed during the year). If parents of a dependent student paid $6,500 in qualified education expenses from a $3,000 tax-free scholarship and a $3,600 distribution from a tuition savings program, they would have $3,500 in AQEE. If $1,200 of the distribution consisted of earnings, then $1,200 x ($3,500 AQEE / $3,600 distribution) would result in $1,167 of the earnings being tax free, while $33 would be taxable. However, if the same tax filer had also claimed a tuition deduction, anti-double-dipping rules would require the tax filer to subtract the expenses taken into account in figuring the tuition deduction from AQEE. If $2,000 in expenses had been used toward the tuition deduction, then the taxable distribution from the section 529 savings program would rise to $700. 1 For families such as these, anti-double-dipping rules increase the computational complexity they face and may result in unanticipated tax liabilities associated with the use of section 529 savings programs.
1 The new nontaxable distribution figure is calculated $1,200 x ($1,500/$3,600) = $500. The taxable portion then becomes $1,200 - $500 = $700.
Page 29 GAO-08-717T
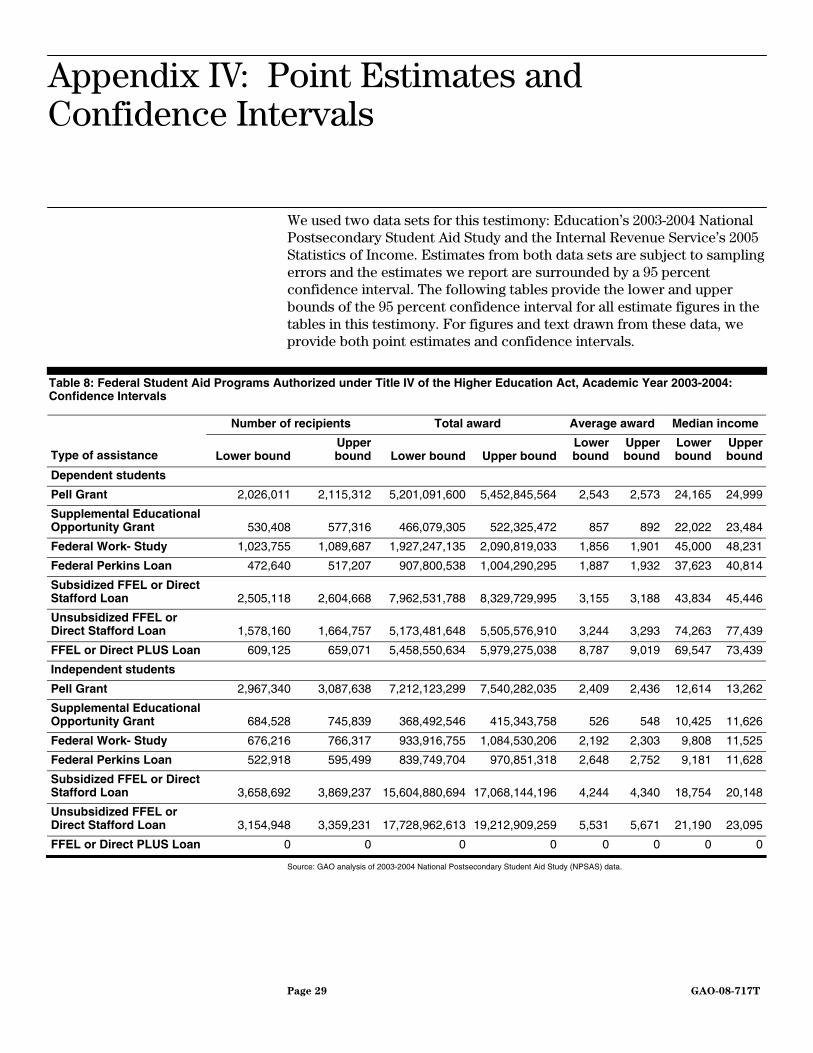
Appendix IV: Point Estimates and Confidence Intervals
We used two data sets for this testimony: Education’s 2003-2004 National Postsecondary Student Aid Study and the Internal Revenue Service’s 2005 Statistics of Income. Estimates from both data sets are subject to sampling errors and the estimates we report are surrounded by a 95 percent confidence interval. The following tables provide the lower and upper bounds of the 95 percent confidence interval for all estimate figures in the tables in this testimony. For figures and text drawn from these data, we provide both point estimates and confidence intervals.
Table 8: Federal Student Aid Programs Authorized under Title IV of the Higher Education Act, Academic Year 2003-2004: Confidence Intervals
Number of recipients Total award Average award Median income
Type of assistance Lower bound Upper bound Lower bound Upper bound
Lower bound
Upper bound
Lower bound
Upper bound
Dependent students
Pell Grant 2,026,011 2,115,312 5,201,091,600 5,452,845,564 2,543 2,573 24,165 24,999
Supplemental Educational Opportunity Grant 530,408 577,316 466,079,305 522,325,472 857 892 22,022 23,484
Federal Work- Study 1,023,755 1,089,687 1,927,247,135 2,090,819,033 1,856 1,901 45,000 48,231
Federal Perkins Loan 472,640 517,207 907,800,538 1,004,290,295 1,887 1,932 37,623 40,814
Subsidized FFEL or Direct Stafford Loan 2,505,118 2,604,668 7,962,531,788 8,329,729,995 3,155 3,188 43,834 45,446
Unsubsidized FFEL or Direct Stafford Loan 1,578,160 1,664,757 5,173,481,648 5,505,576,910 3,244 3,293 74,263 77,439
FFEL or Direct PLUS Loan 609,125 659,071 5,458,550,634 5,979,275,038 8,787 9,019 69,547 73,439
Independent students
Pell Grant 2,967,340 3,087,638 7,212,123,299 7,540,282,035 2,409 2,436 12,614 13,262
Supplemental Educational Opportunity Grant 684,528 745,839 368,492,546 415,343,758 526 548 10,425 11,626
Federal Work- Study 676,216 766,317 933,916,755 1,084,530,206 2,192 2,303 9,808 11,525
Federal Perkins Loan 522,918 595,499 839,749,704 970,851,318 2,648 2,752 9,181 11,628
Subsidized FFEL or Direct Stafford Loan 3,658,692 3,869,237 15,604,880,694 17,068,144,196 4,244 4,340 18,754 20,148
Unsubsidized FFEL or Direct Stafford Loan 3,154,948 3,359,231 17,728,962,613 19,212,909,259 5,531 5,671 21,190 23,095
FFEL or Direct PLUS Loan 0 0 0 0 0 0 0 0
Source: GAO analysis of 2003-2004 National Postsecondary Student Aid Study (NPSAS) data.
Table 9: Selected Postsecondary Education Tax Preferences, Tax Year 2005
Number of returns Total benefits ($) Average benefit ($) Median income ($)
Type of assistance Estimate Estimate Estimate Estimate
Hope Credit 2,892,288 2,988,183,691 1,033 40,252
Lifetime Learning Credit 4,382,182 3,131,447,378 715 40,527
Student Loan Interest Deduction 8,072,896 1,069,200,260 135 46,243
Tuition Deduction 4,696,013 2,425,899,689 520 57,913
Source: GAO analysis of 2005 Statistics of Income data.
Table 10: Selected Postsecondary Education Tax Preferences, Tax Year 2005: Confidence Intervals
Number of returns Total benefits Average benefit Median Income
Type of assistance
Lower bound
Upper bound
Lower bound
Upper bound
Lower bound
Upper bound
Lower bound
Upper bound
Hope Credit 2,793,098 2,994,041 2,871,011,860 3,105,355,522 1,014 1,053 39,117 41,727
Lifetime Learning Credit 4,260,679 4,506,182 3,013,903,998 3,248,990,757 696 733 39,605 41,700
Student Loan Interest Deduction 7,910,043 8,235,749 1,021,740,137 1,116,660,382 130 141 45,336 47,021
Tuition Deduction 4,573,917 4,820,453 2,331,295,407 2,520,503,972 504 535 56,259 60,249
Source: GAO analysis of 2005 Statistics of Income data.
Table 11: Number of Tax Filers Claiming an Education Tax Credit or Tuition Deduction, Tax Years 1998-2005
1998 1999 2000 2001 2002 2003 2004 2005Hope Credit, Lifetime Learning Credit, and Tuition Deduction 4,652,600 6,436,650 6,815,320 7,212,550 9,564,760 10,626,200 11,626,220 11,478,662
Source: GAO analysis of Statistics of Income data.
Table 12: Number of Tax Filers Claiming an Education Tax Credit or Tuition Deduction, Tax Years 1998-2005: Confidence Intervals
1998 1999 2000 2001 2002 2003 2004 2005
Lower bound 4,482,106 6,233,732 6,606,583 6,997,019 9,319,692 10,370,110 11,360,283 11,288,996
Hope Credit, Lifetime Learning Credit, and Tuition Deduction
Upper bound 4,827,719 6,639,576 7,024,049 7,428,088 9,809,833 10,882,359 11,892,067 11,668,329
Source: GAO analysis of 2005 Statistics of Income data.
Page 30 GAO-08-717T
Table 13: Percentage of Aid Recipients and Dollars of Aid by Income Category for Dependent Students Served by Selected Title IV Programs, Academic Year 2003-2004: Confidence Intervals
Program Dependent students
$0- 20,000
$20,001-40,000
$40,001-60,000
$60,001-80,000
$80,001-100,000
More than $100,000
Lower bound 36.66 45.41 13.17 1.41 0 0Recipients
Upper bound 38.89 47.72 14.76 2.02 0 0
Lower bound 46.29 42.41 7.38 0.65 0 0
Pell Grant
Dollars
Upper bound 48.82 44.89 8.5 1.04 0 0
Lower bound 15.41 26.79 22.45 16.1 8.38 6.23Recipients
Upper bound 16.94 28.73 24.3 17.72 9.61 7.33
Lower bound 15.32 27.14 22.83 15.68 7.92 5.87
Stafford Subsidized Loan
Dollars
Upper bound 17.07 29.35 24.94 17.51 9.3 7.08
Lower bound 6.51 12.83 13.15 17.69 16.68 27Recipients
Upper bound 7.88 14.76 15.21 19.94 18.84 29.5
Lower bound 6.22 11.05 11.31 16.69 17.55 30.3
Stafford Unsubsidized Loan
Dollars
Upper bound 7.75 12.99 13.41 19.2 20.15 33.37
Source: GAO analysis of 2003-2004 NPSAS data.
Table 14: Percentage of Aid Recipients and Dollars of Aid by Income Category for Independent Students Served by Selected Title IV Programs, Academic Year 2003-2004: Confidence Intervals
Program $0-
20,000$20,001-
40,000$40,001-
60,000$60,001-
80,000 $80,001-100,000
More than $100,000
Lower bound 66.28 26.59 4.59 0 0 0Recipients
Upper bound 68.35 28.57 5.62 0 0 0
Lower bound 71.68 23.62 2.32 0 0 0
Pell Grant
Dollars
Upper bound 73.77 25.65 2.96 0 0 0
Lower bound 49.67 27.54 10.78 4.04 1.3 0.86Recipients
Upper bound 52.62 30.38 13.48 5.36 1.98 2.38
Lower bound 49.93 25.26 10.05 3.87 1.2 0.46
Stafford Subsidized Loan
Dollars
Upper bound 54.61 29.79 14.73 5.4 2.05 2.65
Lower bound 44.65 26.59 12.09 5.48 2.31 2.26Recipients
Upper bound 47.82 29.75 15.18 6.87 3.18 4.08
Lower bound 44.28 22.51 11.96 6.22 2.86 3.42
Stafford Unsubsidized Loan
Dollars
Upper bound 48.37 26 14.78 8.49 4.12 6.99
Source: GAO analysis of 2003-2004 NPSAS data.
Page 31 GAO-08-717T
Table 15: Percentage of Tax Filers Claiming Hope and Lifetime Learning Credits and Tuition Deduction and Tax Preference Dollars by Income Category, Tax Year 2005: Confidence Intervals
Type of aid $0-20,000$20,001-
40,000$40,001-
60,000$60,001-
80,000 $80,001-100,000
More than $100,000
Lower bound 15.85 30.64 18.36 15.29 11.8 0.92Tax filers
Upper bound 18.53 33.92 21.09 17.85 14.12 1.71
Lower bound 8.57 30.44 20.49 19.77 12.86 0.21
Hope Credit
Dollars
Upper bound 10.46 34.11 23.8 23.18 15.67 0.44
Lower bound 15.66 31.06 18.53 18.43 10.02 0.57Tax filers
Upper bound 17.81 33.72 20.74 20.66 11.78 1.09
Lower bound 8.79 28.94 19.18 22.12 13.41 0.17
Lifetime Learning Credit
Dollars
Upper bound 10.52 32.4 22.25 25.49 16.25 0.46
Lower bound 22.56 11.2 14.69 8.43 10.68 26.63Tax filers
Upper bound 24.83 12.95 16.65 10.01 12.42 28.96
Lower bound 10.93 5.39 13.24 6.58 13.39 43.42
Tuition Deduction
Dollars
Upper bound 12.55 6.62 15.69 8.54 16.17 47.48
Source: GAO analysis of 2005 Statistics of Income data.
Table 16: Number and Percentage of Form 1098-Ts with and without Postsecondary Education Expense Information, Tax Year 2005
Number of returns Percent of returns
1098-Ts with expense information 4,292,132 24
1098-Ts without expense information 13,399,837 76
Source: GAO analysis of 2005 Statistics of Income data.
Table 17: Number and Percentage of Form 1098-Ts with and without Postsecondary Education Expense Information, Tax Year 2005: Confidence Intervals
Number of returns:
Lower boundNumber of returns:
Upper boundPercent of returns:
Lower bound Percent of returns:
Upper bound
1098-Ts with expense information 4,173,915 4,410,349 24 25
1098-Ts without expense information
13,200,126 13,599,548 75 76a
Source: GAO analysis of 2005 Statistics of Income data.
aLower and upper bounds were estimated independently and therefore may not add up to 100 percent.
Page 32 GAO-08-717T
Table 18: Number and Percentage of Taxpayers Apparently Eligible to Claim an Education Tax Credit or Tuition Deduction in Tax Year 2005
Number of returns Percent of returns
Total 4,292,132 100
Apparently eligible 2,770,570 65
All other 1,521,562 35
Source: GAO analysis of 2005 Statistics of Income data.
Table 19: Number and Percentage of Taxpayers Apparently Eligible to Claim an Education Tax Credit or Tuition Deduction in Tax Year 2005: Confidence Intervals
Number of returns:
Lower bound Number of returns:
Upper boundPercent of returns:
Lower bound Percent of returns:
Upper bound
Total 4,290,711 4,292,132 100 100
Apparently eligible 2,673,200 2,867,940 63 66
All other 1,453,105 1,590,019 34 37a
Source: GAO analysis of 2005 Statistics of Income data.
aLower and upper bounds were estimated independently and therefore may not add up to 100 percent.
Table 20: Number and Percentage of Taxpayers Apparently Eligible to Claim an Education Tax Credit or Tuition Deduction That Failed to Do So in Tax Year 2005
Number of returns Percent of returns
Failed to claim 412,058 19
Source: GAO analysis of 2005 Statistics of Income data.
Table 21: Number and Percentage of Taxpayers Apparently Eligible to Claim an Education Tax Credit or Tuition Deduction That Failed to Do So in Tax Year 2005: Confidence Intervals
Number of returns: Lower
bound Number of returns: Upper
boundPercent of returns: Lower
bound Percent of returns: Upper
bound
Failed to claim 374,089 450,027 18 21
Source: GAO analysis of 2005 Statistics of Income data.
Page 33 GAO-08-717T
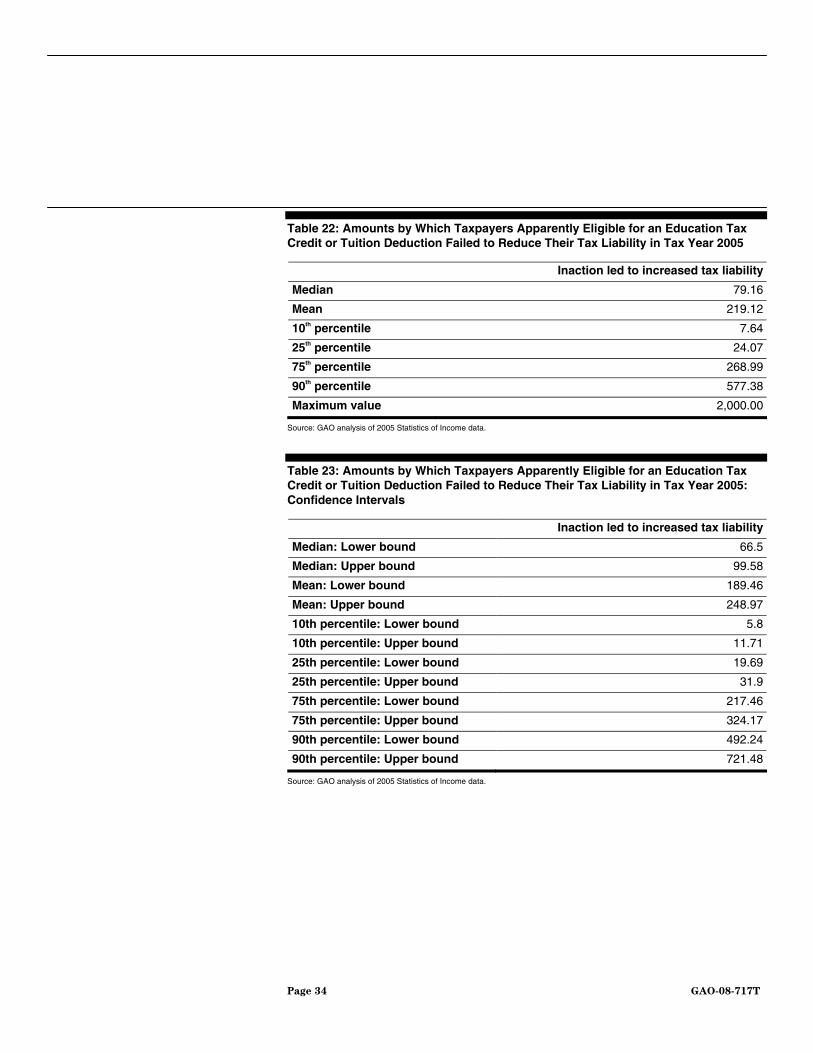
Table 22: Amounts by Which Taxpayers Apparently Eligible for an Education Tax Credit or Tuition Deduction Failed to Reduce Their Tax Liability in Tax Year 2005
Inaction led to increased tax liability
Median 79.16
Mean 219.12
10th percentile 7.64
25th percentile 24.07
75th percentile 268.99
90th percentile 577.38
Maximum value 2,000.00
Source: GAO analysis of 2005 Statistics of Income data.
Table 23: Amounts by Which Taxpayers Apparently Eligible for an Education Tax Credit or Tuition Deduction Failed to Reduce Their Tax Liability in Tax Year 2005: Confidence Intervals
Inaction led to increased tax liability
Median: Lower bound 66.5
Median: Upper bound 99.58
Mean: Lower bound 189.46
Mean: Upper bound 248.97
10th percentile: Lower bound 5.8
10th percentile: Upper bound 11.71
25th percentile: Lower bound 19.69
25th percentile: Upper bound 31.9
75th percentile: Lower bound 217.46
75th percentile: Upper bound 324.17
90th percentile: Lower bound 492.24
90th percentile: Upper bound 721.48
Source: GAO analysis of 2005 Statistics of Income data.
Page 34 GAO-08-717T
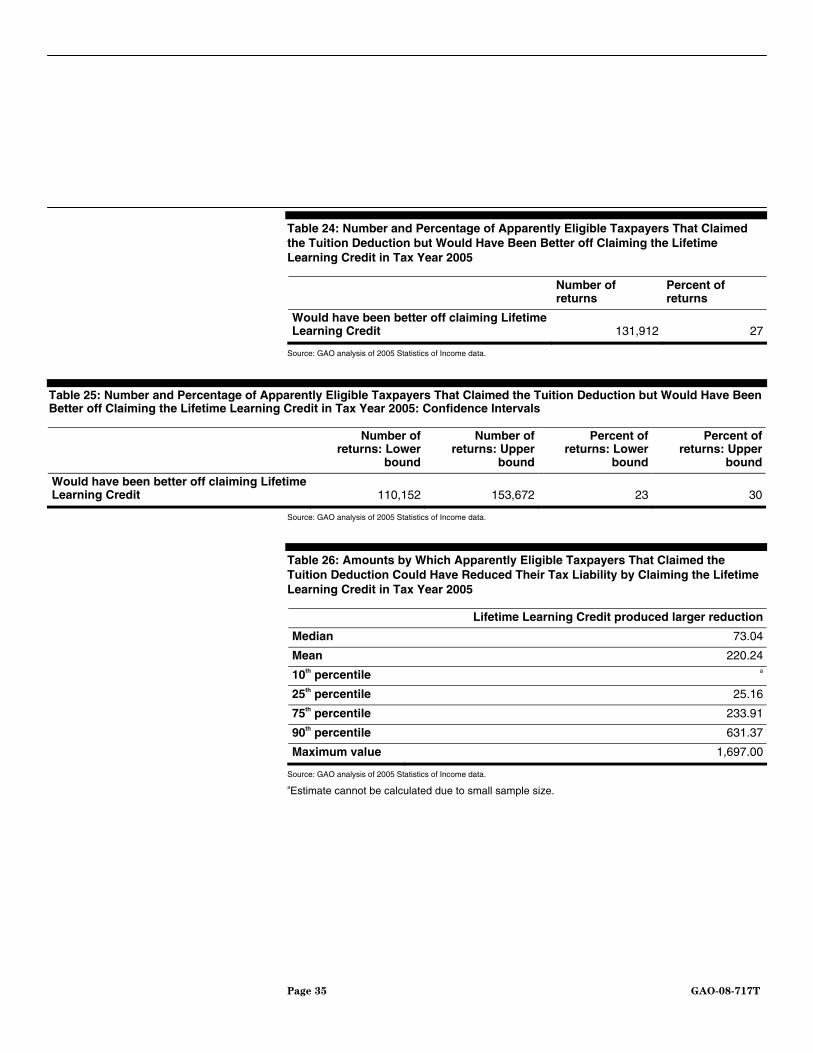
Table 24: Number and Percentage of Apparently Eligible Taxpayers That Claimed the Tuition Deduction but Would Have Been Better off Claiming the Lifetime Learning Credit in Tax Year 2005
Number of returns
Percent of returns
Would have been better off claiming Lifetime Learning Credit 131,912 27
Source: GAO analysis of 2005 Statistics of Income data.
Table 25: Number and Percentage of Apparently Eligible Taxpayers That Claimed the Tuition Deduction but Would Have Been Better off Claiming the Lifetime Learning Credit in Tax Year 2005: Confidence Intervals
Number of returns: Lower
bound
Number of returns: Upper
bound
Percent of returns: Lower
bound
Percent of returns: Upper
bound
Would have been better off claiming Lifetime Learning Credit 110,152 153,672 23 30
Source: GAO analysis of 2005 Statistics of Income data.
Table 26: Amounts by Which Apparently Eligible Taxpayers That Claimed the Tuition Deduction Could Have Reduced Their Tax Liability by Claiming the Lifetime Learning Credit in Tax Year 2005
Lifetime Learning Credit produced larger reduction
Median 73.04
Mean 220.24
10th percentile a
25th percentile 25.16
75th percentile 233.91
90th percentile 631.37
Maximum value 1,697.00
Source: GAO analysis of 2005 Statistics of Income data.
aEstimate cannot be calculated due to small sample size.
Page 35 GAO-08-717T
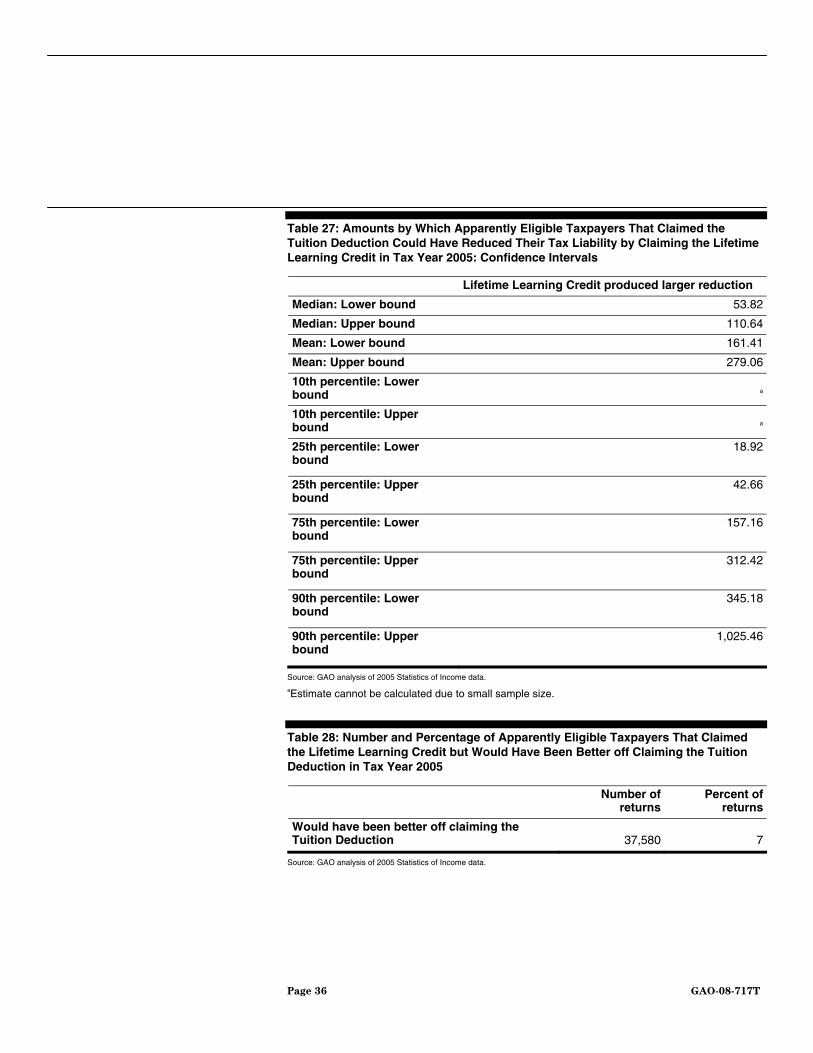
Table 27: Amounts by Which Apparently Eligible Taxpayers That Claimed the Tuition Deduction Could Have Reduced Their Tax Liability by Claiming the Lifetime Learning Credit in Tax Year 2005: Confidence Intervals
Lifetime Learning Credit produced larger reduction
Median: Lower bound 53.82
Median: Upper bound 110.64
Mean: Lower bound 161.41
Mean: Upper bound 279.06
10th percentile: Lower bound a
10th percentile: Upper bound a
25th percentile: Lower bound
18.92
25th percentile: Upper bound
42.66
75th percentile: Lower bound
157.16
75th percentile: Upper bound
312.42
90th percentile: Lower bound
345.18
90th percentile: Upper bound
1,025.46
Source: GAO analysis of 2005 Statistics of Income data.
aEstimate cannot be calculated due to small sample size.
Table 28: Number and Percentage of Apparently Eligible Taxpayers That Claimed the Lifetime Learning Credit but Would Have Been Better off Claiming the Tuition Deduction in Tax Year 2005
Number of
returnsPercent of
returns
Would have been better off claiming the Tuition Deduction 37,580 7
Source: GAO analysis of 2005 Statistics of Income data.
Page 36 GAO-08-717T
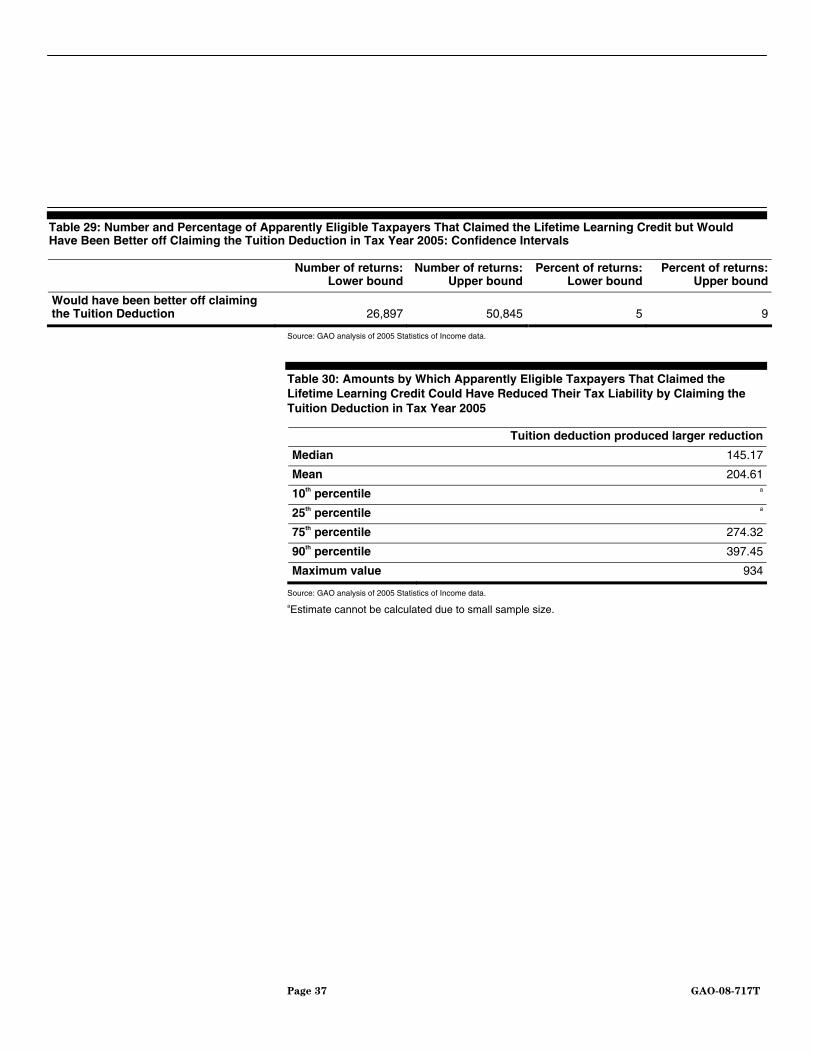
Table 29: Number and Percentage of Apparently Eligible Taxpayers That Claimed the Lifetime Learning Credit but Would Have Been Better off Claiming the Tuition Deduction in Tax Year 2005: Confidence Intervals
Number of returns:
Lower boundNumber of returns:
Upper boundPercent of returns:
Lower bound Percent of returns:
Upper bound
Would have been better off claiming the Tuition Deduction 26,897 50,845 5 9
Source: GAO analysis of 2005 Statistics of Income data.
Table 30: Amounts by Which Apparently Eligible Taxpayers That Claimed the Lifetime Learning Credit Could Have Reduced Their Tax Liability by Claiming the Tuition Deduction in Tax Year 2005
Tuition deduction produced larger reduction
Median 145.17
Mean 204.61
10th percentile a
25th percentile a
75th percentile 274.32
90th percentile 397.45
Maximum value 934
Source: GAO analysis of 2005 Statistics of Income data.
aEstimate cannot be calculated due to small sample size.
Page 37 GAO-08-717T
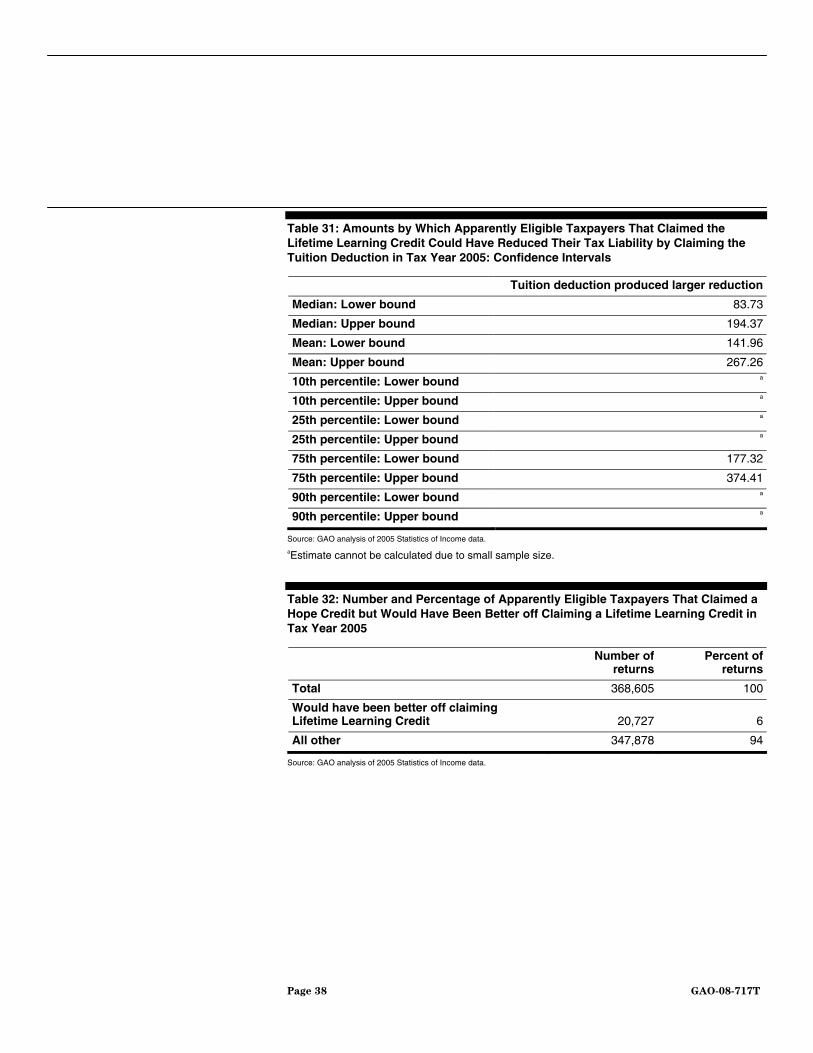
Table 31: Amounts by Which Apparently Eligible Taxpayers That Claimed the Lifetime Learning Credit Could Have Reduced Their Tax Liability by Claiming the Tuition Deduction in Tax Year 2005: Confidence Intervals
Tuition deduction produced larger reduction
Median: Lower bound 83.73
Median: Upper bound 194.37
Mean: Lower bound 141.96
Mean: Upper bound 267.26
10th percentile: Lower bound a
10th percentile: Upper bound a
25th percentile: Lower bound a
25th percentile: Upper bound a
75th percentile: Lower bound 177.32
75th percentile: Upper bound 374.41
90th percentile: Lower bound a
90th percentile: Upper bound a
Source: GAO analysis of 2005 Statistics of Income data.
aEstimate cannot be calculated due to small sample size.
Table 32: Number and Percentage of Apparently Eligible Taxpayers That Claimed a Hope Credit but Would Have Been Better off Claiming a Lifetime Learning Credit in Tax Year 2005
Number of
returnsPercent of
returns
Total 368,605 100
Would have been better off claiming Lifetime Learning Credit 20,727 6
All other 347,878 94
Source: GAO analysis of 2005 Statistics of Income data.
Page 38 GAO-08-717T
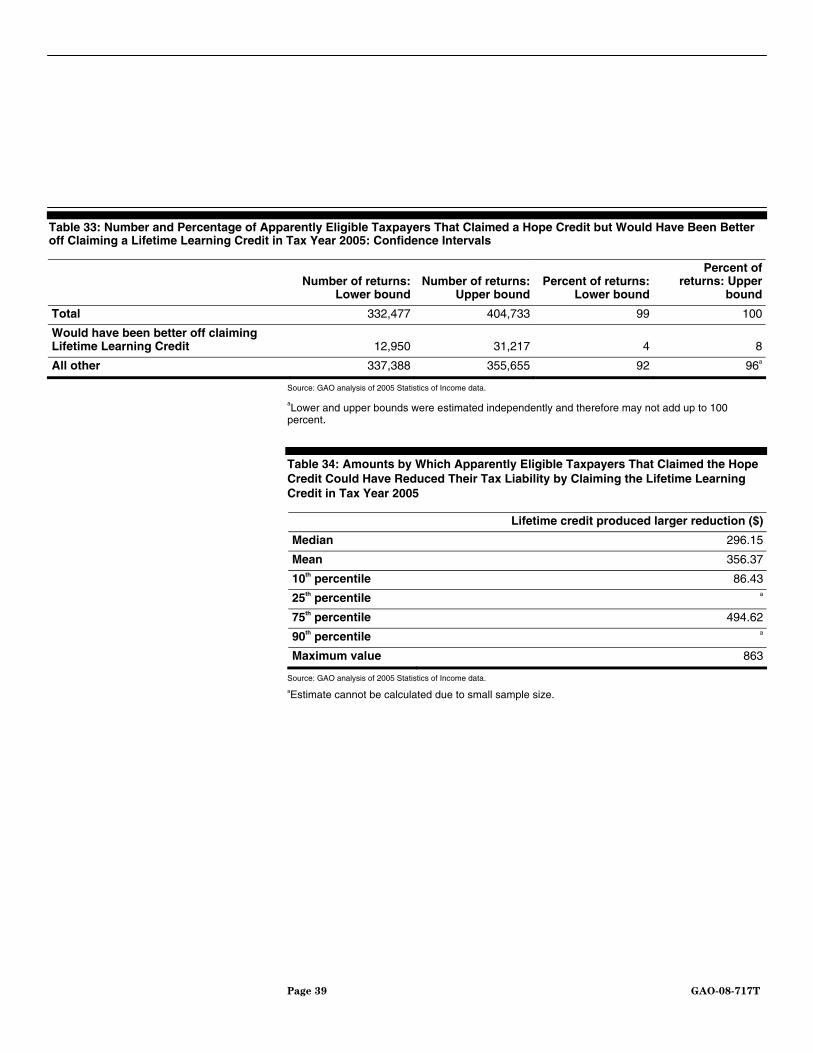
Table 33: Number and Percentage of Apparently Eligible Taxpayers That Claimed a Hope Credit but Would Have Been Better off Claiming a Lifetime Learning Credit in Tax Year 2005: Confidence Intervals
Number of returns:
Lower boundNumber of returns:
Upper boundPercent of returns:
Lower bound
Percent of returns: Upper
bound
Total 332,477 404,733 99 100
Would have been better off claiming Lifetime Learning Credit 12,950 31,217 4 8
All other 337,388 355,655 92 96a
Source: GAO analysis of 2005 Statistics of Income data.
aLower and upper bounds were estimated independently and therefore may not add up to 100 percent.
Table 34: Amounts by Which Apparently Eligible Taxpayers That Claimed the Hope Credit Could Have Reduced Their Tax Liability by Claiming the Lifetime Learning Credit in Tax Year 2005
Lifetime credit produced larger reduction ($)
Median 296.15
Mean 356.37
10th percentile 86.43
25th percentile a
75th percentile 494.62
90th percentile a
Maximum value 863
Source: GAO analysis of 2005 Statistics of Income data.
aEstimate cannot be calculated due to small sample size.
Page 39 GAO-08-717T
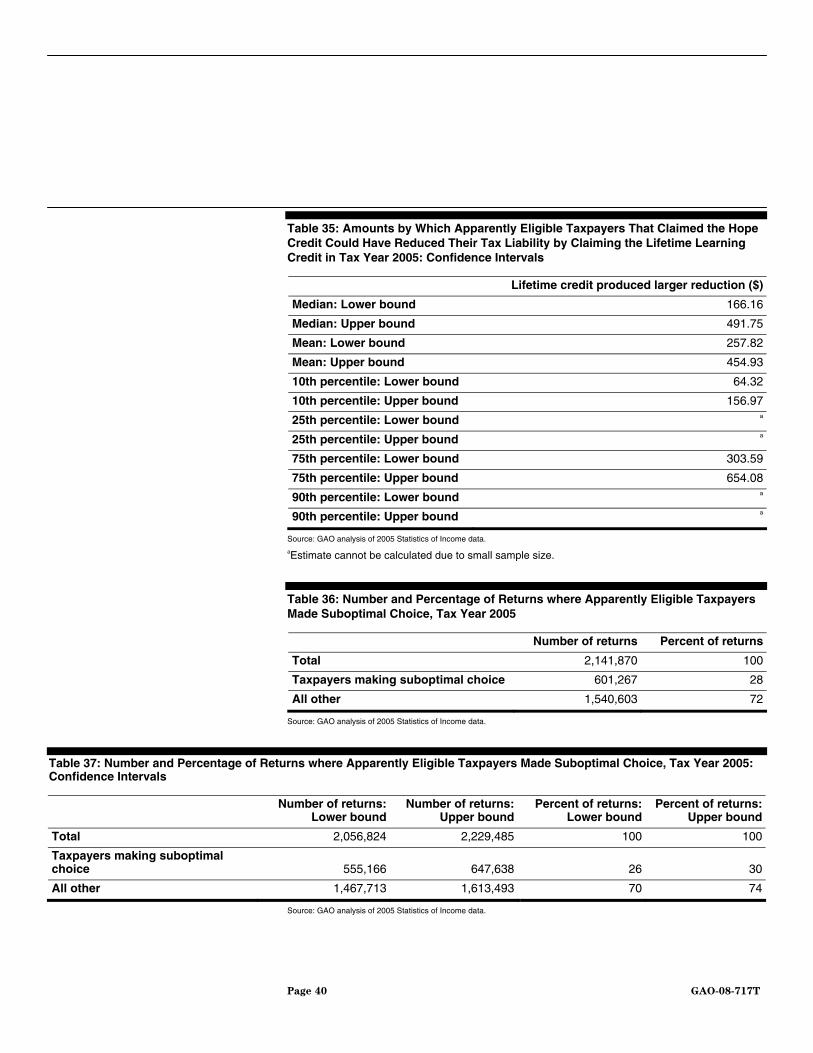
Table 35: Amounts by Which Apparently Eligible Taxpayers That Claimed the Hope Credit Could Have Reduced Their Tax Liability by Claiming the Lifetime Learning Credit in Tax Year 2005: Confidence Intervals
Lifetime credit produced larger reduction ($)
Median: Lower bound 166.16
Median: Upper bound 491.75
Mean: Lower bound 257.82
Mean: Upper bound 454.93
10th percentile: Lower bound 64.32
10th percentile: Upper bound 156.97
25th percentile: Lower bound a
25th percentile: Upper bound a
75th percentile: Lower bound 303.59
75th percentile: Upper bound 654.08
90th percentile: Lower bound a
90th percentile: Upper bound a
Source: GAO analysis of 2005 Statistics of Income data.
aEstimate cannot be calculated due to small sample size.
Table 36: Number and Percentage of Returns where Apparently Eligible Taxpayers Made Suboptimal Choice, Tax Year 2005
Number of returns Percent of returns
Total 2,141,870 100
Taxpayers making suboptimal choice 601,267 28
All other 1,540,603 72
Source: GAO analysis of 2005 Statistics of Income data.
Table 37: Number and Percentage of Returns where Apparently Eligible Taxpayers Made Suboptimal Choice, Tax Year 2005: Confidence Intervals
Number of returns:
Lower boundNumber of returns:
Upper boundPercent of returns:
Lower bound Percent of returns:
Upper bound
Total 2,056,824 2,229,485 100 100
Taxpayers making suboptimal choice 555,166 647,638 26 30
All other 1,467,713 1,613,493 70 74
Source: GAO analysis of 2005 Statistics of Income data.
Page 40 GAO-08-717T
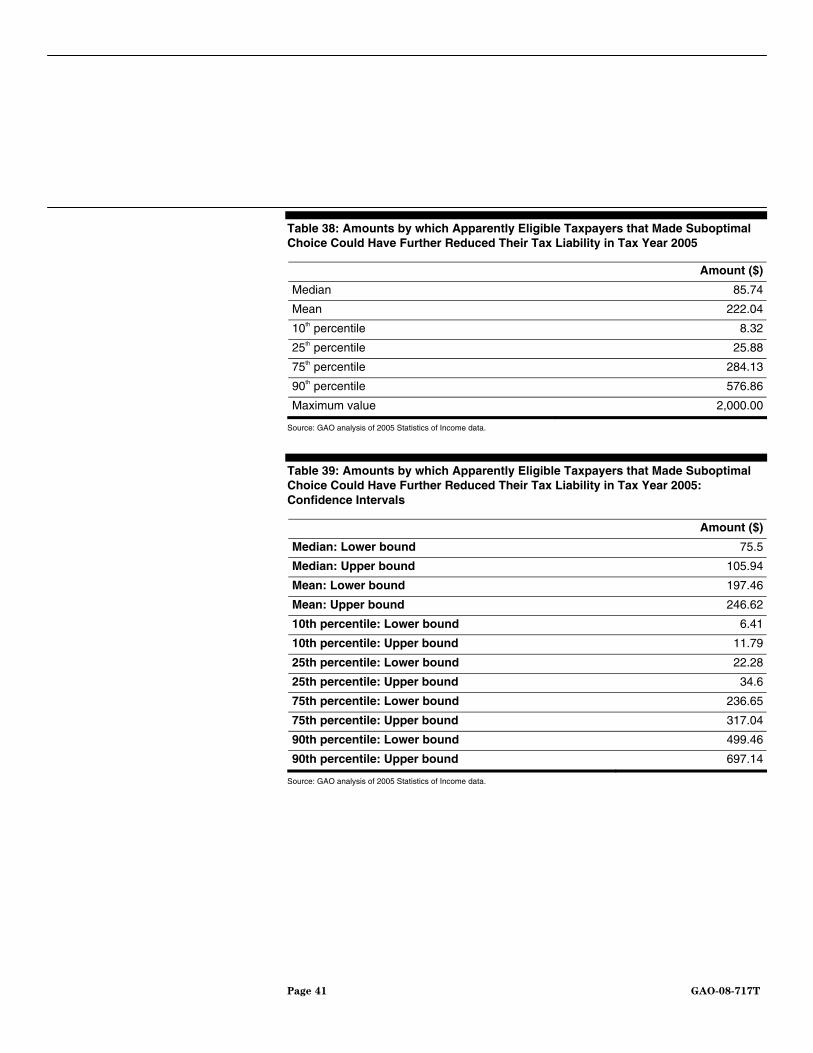
Table 38: Amounts by which Apparently Eligible Taxpayers that Made Suboptimal Choice Could Have Further Reduced Their Tax Liability in Tax Year 2005
Amount ($)
Median 85.74
Mean 222.04
10th percentile 8.32
25th percentile 25.88
75th percentile 284.13
90th percentile 576.86
Maximum value 2,000.00
Source: GAO analysis of 2005 Statistics of Income data.
Table 39: Amounts by which Apparently Eligible Taxpayers that Made Suboptimal Choice Could Have Further Reduced Their Tax Liability in Tax Year 2005: Confidence Intervals
Amount ($)
Median: Lower bound 75.5
Median: Upper bound 105.94
Mean: Lower bound 197.46
Mean: Upper bound 246.62
10th percentile: Lower bound 6.41
10th percentile: Upper bound 11.79
25th percentile: Lower bound 22.28
25th percentile: Upper bound 34.6
75th percentile: Lower bound 236.65
75th percentile: Upper bound 317.04
90th percentile: Lower bound 499.46
90th percentile: Upper bound 697.14
Source: GAO analysis of 2005 Statistics of Income data.
Page 41 GAO-08-717T
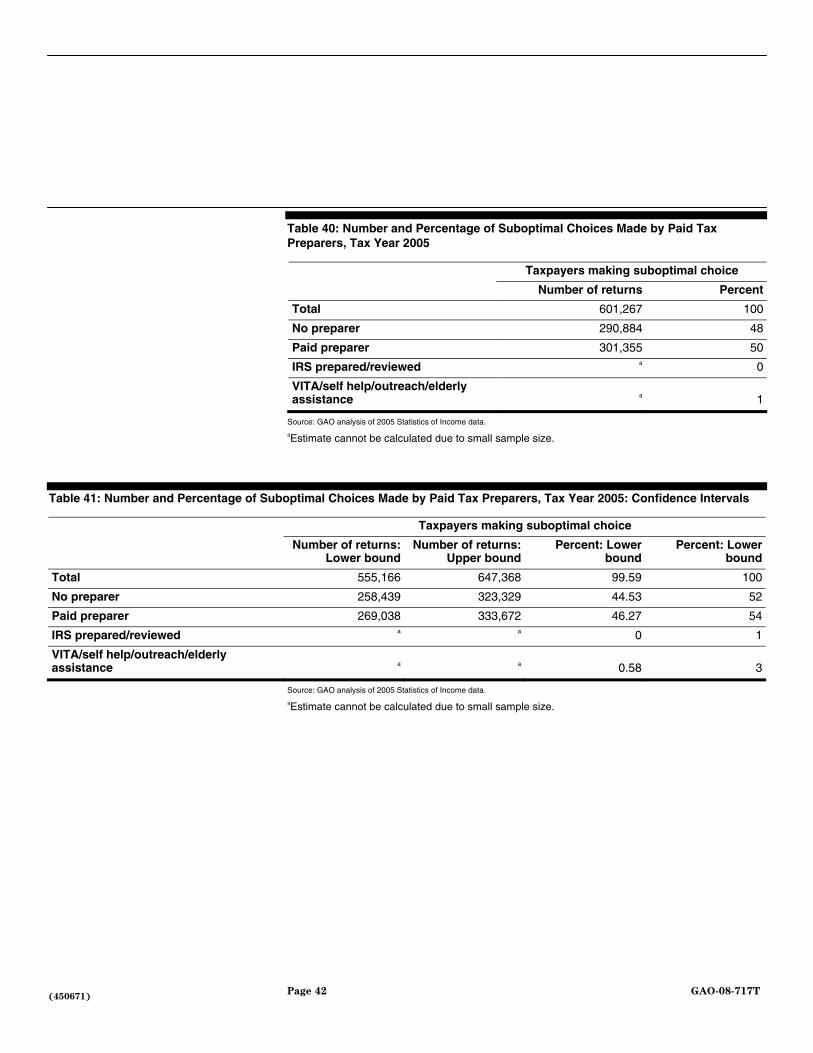
Table 40: Number and Percentage of Suboptimal Choices Made by Paid Tax Preparers, Tax Year 2005
Taxpayers making suboptimal choice
Number of returns Percent
Total 601,267 100
No preparer 290,884 48
Paid preparer 301,355 50
IRS prepared/reviewed a 0
VITA/self help/outreach/elderly assistance a 1
Source: GAO analysis of 2005 Statistics of Income data.
aEstimate cannot be calculated due to small sample size.
Table 41: Number and Percentage of Suboptimal Choices Made by Paid Tax Preparers, Tax Year 2005: Confidence Intervals
Taxpayers making suboptimal choice
Number of returns:
Lower boundNumber of returns:
Upper boundPercent: Lower
bound Percent: Lower
bound
Total 555,166 647,368 99.59 100
No preparer 258,439 323,329 44.53 52
Paid preparer 269,038 333,672 46.27 54
IRS prepared/reviewed a a 0 1
VITA/self help/outreach/elderly assistance a a 0.58 3
Source: GAO analysis of 2005 Statistics of Income data.
aEstimate cannot be calculated due to small sample size.
Page 42 GAO-08-717T
(450671)

This is a work of the U.S. government and is not subject to copyright protection in the United States. It may be reproduced and distributed in its entirety without further permission from GAO. However, because this work may contain copyrighted images or other material, permission from the copyright holder may be necessary if you wish to reproduce this material separately.
GAO’s Mission The Government Accountability Office, the audit, evaluation, and investigative arm of Congress, exists to support Congress in meeting its constitutional responsibilities and to help improve the performance and accountability of the federal government for the American people. GAO examines the use of public funds; evaluates federal programs and policies; and provides analyses, recommendations, and other assistance to help Congress make informed oversight, policy, and funding decisions. GAO’s commitment to good government is reflected in its core values of accountability, integrity, and reliability.
The fastest and easiest way to obtain copies of GAO documents at no cost is through GAO’s Web site (www.gao.gov). Each weekday, GAO posts newly released reports, testimony, and correspondence on its Web site. To have GAO e-mail you a list of newly posted products every afternoon, go to www.gao.gov and select “E-mail Updates.”
The first copy of each printed report is free. Additional copies are $2 each. A check or money order should be made out to the Superintendent of Documents. GAO also accepts VISA and Mastercard. Orders for 100 or more copies mailed to a single address are discounted 25 percent. Orders should be sent to:
U.S. Government Accountability Office 441 G Street NW, Room LM Washington, DC 20548
To order by Phone: Voice: (202) 512-6000 TDD: (202) 512-2537 Fax: (202) 512-6061
Contact:
Web site: www.gao.gov/fraudnet/fraudnet.htm E-mail: [email protected] Automated answering system: (800) 424-5454 or (202) 512-7470
Ralph Dawn, Managing Director, [email protected], (202) 512-4400 U.S. Government Accountability Office, 441 G Street NW, Room 7125 Washington, DC 20548
Chuck Young, Managing Director, [email protected], (202) 512-4800 U.S. Government Accountability Office, 441 G Street NW, Room 7149 Washington, DC 20548
Obtaining Copies of GAO Reports and Testimony
Order by Mail or Phone
To Report Fraud, Waste, and Abuse in Federal Programs
Congressional Relations
Public Affairs
PRINTED ON RECYCLED PAPER