Embed Size (px)
Citation preview

Report to Congressional RequestersUnited States Government Accountability Office
GAO
August 2005
REGISTERED APPRENTICESHIP PROGRAMS
Labor Can Better Use Data to Target Oversight
GAO-05-886

What GAO Found
United States Government Accountability Office
Why GAO Did This Study
HighlightsAccountability Integrity Reliability
www.gao.gov/cgi-bin/getrpt?GAO-05-886. To view the full product, including the scope and methodology, click on the link above. For more information, contact Sigurd Nilsen at (202) 512-7215 or [email protected].
Highlights of GAO-05-886, a report to congressional requesters
August 2005
REGISTERED APPRENTICESHIP PROGRAMS
Labor Can Better Use Data to Target Oversight
Labor’s monitoring of programs it directly oversees has been limited. We found that in 2004 Labor reviewed only 4 percent of programs in the 23 states where it has direct oversight. According to federal program directors in those states, limited staff constrained their ability to do more reviews. Also, Labor has focused in recent years on registering new programs and recruiting apprentices. Although Labor collects much data about the programs it oversees, it has not employed its database to generate information indicative of program performance, such as completion rates, that might allow it to be more efficient in its oversight. Labor does not regularly review council-monitored states or collect data from them that would allow for a national picture of apprenticeships. Labor is responsible for conducting formal reviews of the 27 states and the District of Columbia that established apprenticeship councils to monitor their own apprenticeship programs; but, according to directors in these states, the reviews have been infrequent and not necessarily useful. While Labor collects only aggregate data on apprentices from most of these states, we identified 10 states with large numbers of apprentices that were willing and capable of providing GAO data on apprentices by occupation as well as some information on completion rates, completion times, and wages. Data in Labor’s apprenticeship database and from council-monitored states show that completion rates and wages for construction apprentices in programs sponsored jointly by employers and unions were higher than those for programs sponsored by employers alone. We found that completion rates for apprentices in programs jointly sponsored by unions and employers were 47 percent on average compared with 30 percent in programs sponsored solely by employers. Completion rates declined under both types of sponsorship for the period we examined, but Labor, as part of its oversight, does not track reasons for noncompletion, making it difficult to determine what lies behind this trend. Construction Apprentices at Work
Source: Department of Labor/OATELS.
Between 2002 and 2012 nearly 850,000 jobs will open in the construction industry; experts predict that there will not be enough skilled workers to fill them. This has heightened concerns about program outcomes and program quality in the nation’s apprenticeship system and the Department of Labor’s oversight of it. GAO assessed (1) the extent to which Labor monitors registered apprenticeship programs in the states where it has direct oversight, (2) its oversight activities in states that do their own monitoring, and (3) the outcomes for construction apprentices in programs sponsored by employers and unions in relation to programs sponsored by employers alone.
What GAO Recommends
GAO recommends that Labor better utilize its database for oversight—particularly for apprenticeship programs with expected future labor shortages—develop a cost effective strategy for collecting data from council-monitored states for selected occupations, conduct its reviews of apprenticeship activities in states that regulate their own programs on a regular basis to ensure that state activities are in accord with those requirements set forth by federal law, and offer substantive feedback. Labor concurred with these recommendations and said it has taken initial steps to implement them.

Page i GAO-05-886 Registered Apprenticeship Programs
Letter 1
Results in Brief 3 Background 5 Labor’s Monitoring of Registered Apprenticeship Programs Is
Limited 7 Labor Has Reviewed Council-Monitored States Infrequently,
Provided Little Feedback, and Not Collected Data That Would Allow for a National Picture of Apprenticeships 12
Construction Apprenticeship Completion Rates and Wages Vary by Program Sponsor 16
Conclusions 25 Recommendations 25 Agency Comments 26
Appendix I Scope and Methodology 27
Appendix II Completion Rates, Time Taken to Complete, and
Wages for Construction Apprentices in Council-
Monitored States 30
Appendix III Responses to Survey of Directors of Apprenticeships
in Federally-Monitored States 38
Appendix IV Responses to Survey of Directors of Apprenticeships
in Council-Monitored States 51
Appendix V Comments from the Department of Labor 63
Appendix VI GAO Contact and Staff Acknowledgments 65
Contents

Page ii GAO-05-886 Registered Apprenticeship Programs
Related GAO Products 66
Tables
Table 1: Differences between Actual and Expected Completion Time for Apprentices in Joint and Non-joint Construction Programs in Weeks 23
Table 2: Survey Numbers and Response Rates 28 Table 3: Percentages of Apprentices Completing Joint and Non-
joint Construction Programs as Reported by Selected Council-monitored States for Fiscal Years 1997-2004 30
Table 4: Average Number of Weeks Spent to Complete Joint and Non-joint Construction Apprenticeship Programs as Reported by Selected Council-monitored States 32
Table 5: Mean Hourly Wage Rates for Beginning Apprentices in Joint and Non-joint Construction Programs as Reported by Selected Council-monitored States, Fiscal Year 2004 34
Table 6: Mean Hourly Wage Rates for Apprentices Achieving Journey Status in Joint and Non-joint Construction Programs as Reported by Selected Council-monitored States, Fiscal Year 2004 36
Figures
Figure 1: States with Apprenticeship Programs Overseen by Federal Officials and State Apprenticeship Councils 6
Figure 2: Frequency of Quality and Equal Employment Opportunity Reviews of Apprenticeship Programs in Federally- and Council-monitored States during Fiscal Year 2004 9
Figure 3: Frequency of Federal Reviews of Council-monitored States 13
Figure 4: Council-monitored States’ Rankings of the Usefulness of Federal Quality Reviews 14
Figure 5: Council-monitored States’ Rankings of the Usefulness of EEO Reviews 15
Figure 6: Completion Rates after 6 Years for Apprentices Entering Construction Programs in FY 1994 through 1998 18
Figure 7: Completion Rates after 6 Years by Occupation for Apprentices Who Began Joint and Non-joint Construction Programs between FY 1994 and 1998 19

Page iii GAO-05-886 Registered Apprenticeship Programs
Figure 8: Enrollment for Apprentices in Joint and Non-joint Construction Programs, FY 1994 through 1998 21
Figure 9: Trends in Completion Rates after 6 Years for Apprentices in Joint and Non-joint Construction Programs Entering Programs in FY 1994 through 1998 22
Figure 10: Average Wages for Apprentices in Joint and Non-Joint Construction Programs in FY 2004 24
Abbreviations
EEO Equal Employment Opportunity ETA Employment and Training Administration OATELS Office of Apprenticeship Training, Employer and Labor Services RAIS Registered Apprenticeship Information System SAC State Apprenticeship Council WIA Workforce Investment Act

Page iv GAO-05-886 Registered Apprenticeship Programs
This is a work of the U.S. government and is not subject to copyright protection in the United States. It may be reproduced and distributed in its entirety without further permission from GAO. However, because this work may contain copyrighted images or other material, permission from the copyright holder may be necessary if you wish to reproduce this material separately.
Page 1 GAO-05-886 Registered Apprenticeship Programs
August 29, 2005
The Honorable Edward M. Kennedy Ranking Member Committee on Health, Education, Labor and Pensions United States Senate
The Honorable Patty Murray Ranking Member Subcommittee on Employment, Safety and Training Committee on Health, Education, Labor and Pensions United States Senate
Between 2002 and 2012 an estimated 850,000 jobs will open in the construction industry, but experts predict that there will not be enough skilled workers to fill them. The National Registered Apprenticeships System, administered by the Office of Apprenticeship Training, Employer and Labor Services (OATELS) within the Department of Labor, has an important role in the development of this skilled workforce. With a budget of $21 million, OATELS promulgates standards to safeguard the welfare of apprentices and registers apprenticeship programs that meet those standards, which include requirements for related instruction, on-the-job training, and equal employment opportunity for apprentices. OATELS also oversees apprenticeship programs to ensure that they provide quality training for apprentices, as many as 480,000 of whom may be enrolled at any one time. Labor, through OATELS, directly registers and oversees programs in 23 states. It has granted 27 other states, the District of Columbia, and 3 territories authority to register and oversee their own programs, and ensures programs comply with federal standards and meet additional state standards. In these states, referred to here as council-monitored states, OATELS reviews the activities of the apprenticeship councils that are responsible for ensuring programs in their state comply with federal labor standards and equal opportunity protections. While Labor and apprenticeship councils provide oversight, recent studies have shown that a significant number of construction apprentices are not completing their programs and that construction programs sponsored by employers without union participation have lower completion rates and wages for apprentices. In addition, some have raised concerns that the failure to complete programs could be indicative of poor program quality. The anticipated shortage of skilled construction workers has heightened concerns about the relationship between program outcomes and program
United States Government Accountability Office
Washington, DC 20548

Page 2 GAO-05-886 Registered Apprenticeship Programs
quality, the prospect for expanding the supply of skilled workers through apprenticeships, and Labor’s oversight of these programs.
In view of these concerns, you asked us to review the extent of federal oversight of apprenticeship programs in general and compare apprenticeship outcomes in the construction industry by type of program sponsorship. Specifically, we assessed (1) the extent to which the U.S. Department of Labor monitors the operations and outcomes of registered apprenticeship programs in the states where it has direct oversight, (2) its oversight activities for council-monitored states, and (3) the outcomes for construction apprentices in programs sponsored jointly by employers and unions in relation to those sponsored by employers alone.
To obtain national information on Labor’s monitoring and oversight activities, we surveyed all state directors of apprenticeship training programs through electronic questionnaires posted on the World Wide Web. We excluded the three territories—Guam, Puerto Rico, and the Virgin Islands—from our analyses because the few programs they had were atypical. We also visited four states, both federal (Texas) and council-monitored (California, New York, and Washington), that had large numbers of construction apprentices (from about 52,000 to 6,500). In these states, we talked to knowledgeable officials, private-sector experts and stakeholders, including employer and labor union sponsors of apprenticeship programs. In some cases, we visited apprentice training facilities. To determine completion rates, times to completion, and wage rates for apprentices, we analyzed data in Labor’s apprenticeship database for the fiscal years 1994 through 2004. In calculating completion rates, we constructed five cohorts based on when apprentices enrolled in a program—1994, 1995, 1996, 1997, or 1998—and established their completion status 6 years after they enrolled. These analyses included data on programs in 23 states where Labor has direct oversight and programs in 8 council-monitored states.1 In addition, we obtained comparable data on construction programs from 10 council-monitored states that have large numbers of construction apprentices and were able to provide this information. The 41 states for which we had some type of data accounted for an estimated 92 percent of all construction apprentices. We also interviewed Labor officials and other knowledgeable parties. (See app. I.)
1Labor’s database also includes data from some federally registered programs in council-monitored states.

Page 3 GAO-05-886 Registered Apprenticeship Programs
We conducted our work between August of 2004 and July 2005 in accordance with generally accepted government auditing standards.
Labor’s monitoring of the programs it directly oversees has been limited, in part, due to staffing levels and also its reluctance to use data to target oversight. In 2004, Labor reviewed only 4 percent of programs in the 23 states where it has direct oversight, in part, because of limited staffing, according to federal program directors in those states. Currently each reviewer has responsibility for about 2,000 apprentices for whom they enter apprentice and program information in Labor’s database, in addition to reviewing program quality and equal employment opportunities, and overseeing program progress. Labor officials also said that in recent years their resources have been more focused on developing new programs and recruiting apprentices, particularly for new fields. Although Labor collects much data about the programs it oversees, its Apprenticeship Office has not employed its database to generate information on program performance. Federal program directors for the states told us, for example, that they do not systematically use outcome data from the database, such as completion rates or apprentices’ reasons for dropping out, to determine which programs to review. This limited use of data may stem, in part, from challenges in accessing it. These program directors reported that they were not able to generate customized reports and that data fields had been changing frequently. Recently, however, the Apprenticeship Office has begun piloting new software that agency officials say will make it possible for federal program directors to effectively extract information from the database and generate customized reports. Still, federal program directors in two states who were already using the software said they were still unable to look at programs by occupation at the state level, a level of analysis that most state program directors—17 of 23 we surveyed—said they wanted. In addition, we found little evidence that the Apprenticeship Office had systematically sought input from federal program directors regarding their reporting needs or problems they might face in using the new software. Nor could Labor officials provide a plan with explicit steps for its implementation.
Labor does not regularly review the activities of the states apprenticeship councils or collect data from them that would allow for a national picture of apprenticeships. Labor’s reviews have been infrequent, according to directors of apprenticeship systems in most of the 27 council-monitored states. Moreover, some directors reported not having had reviews in the last 9 to 12 years, and our examination of apprenticeship office documents indicated the department had conducted only three reviews for 2002 and
Results in Brief

Page 4 GAO-05-886 Registered Apprenticeship Programs
2003, and none for 2004. In addition, many directors reported the reviews were of limited use in helping them assess programs or make informed decisions about their administration, in part because of the limited feedback they received. While neither statute nor regulations specify the frequency of these reviews, according to Labor officials they are important for ensuring that states are fulfilling federal requirements for recognition and oversight of apprenticeship programs. Labor has only collected aggregate counts of apprentices from most of these states, and to date has been unable to develop a composite national picture of apprentices. We nevertheless found 10 states with large numbers of apprentices that readily provided apprentice data to us by industry, sponsor, and occupation, as well as some information on completions, on-time completions, and wages—information that Labor could use to build a national portrait of apprentices in key programs.
Data in Labor’s apprenticeship database and from council-monitored states show that completion rates and wages for construction apprentices in programs sponsored jointly by employers and unions were higher than those for programs sponsored by employers alone. Of apprentices beginning training between 1994 and 1998 (and completing by 2004), on average, 47 percent of those in programs sponsored jointly with unions completed compared with 30 percent in programs sponsored solely by employers, a 17 percentage point difference. Officials said joint programs had higher completion rates because they were more established and more likely to provide mentoring and job placement services. Despite growth in construction program enrollments, completion rates consistently declined for both types of program sponsorship for the time period we examined. Specifically, while 59 percent of the apprentices who enrolled in construction programs in 1994 graduated within 6 years, only 37 percent of 1998 enrollees did. Given that Labor, as part of its oversight, does not track the reasons for noncompletions, it is difficult to determine what lies behind this trend or what might account for differences in completion rates by type of sponsorship. Those apprentices that did complete programs within 6 years tended to finish earlier than they were expected to. Construction wages were generally higher for apprentices in joint programs than for those in non-joint programs—being more than $2.00 per hour higher on average at the start and $6.00 per hour higher on average at completion of training in 2004, the first full year Labor began collecting wage data. Factors that may explain such differences in wages include the presence of a collective bargaining agreement.
In this report we recommend that the Secretary of Labor take steps to use the data Labor has to better target its oversight activities, develop a cost-

Page 5 GAO-05-886 Registered Apprenticeship Programs
effective strategy for collecting data from council-monitored states, and conduct regular reviews with feedback for those states. In its written comments on a draft of this report the Department of Labor concurred with these recommendations and said it is taking initial steps to implement them.
Although apprenticeship programs in the United States are largely private systems that are paid for largely by program sponsors, the National Apprenticeship Act of 1937 authorizes and directs the Secretary of Labor to formulate and promote labor standards that safeguard the welfare of apprentices. The responsibility for formulating and promoting these standards resides with OATELS. OATELS had a staff of about 176 full-time equivalencies and an annual appropriation of about $21 million in 2004. In addition, because of budgetary constraints, OATELS officials do not expect resources to increase. At the national level, OATELS can register and deregister apprenticeship programs (i.e., give or take away federal recognition), issue nationally recognized, portable certificates to individuals who have completed registered programs, plan appropriate outreach activities targeted to attract women and minorities, and promote new apprenticeship programs to meet workforce needs. In addition to this national role, OATELS directly oversees individual apprenticeship programs in 23 states. In these states, the director for the state’s apprenticeship system and other program staff are federal employees who monitor individual apprenticeship programs for quality and their provision of equal opportunity.
Labor can give authority to states to oversee their own apprenticeship programs if the state meets certain requirements. Labor has given this authority to 27 states, the District of Columbia, and three territories. In these states, which we refer to as council-monitored, the federal government is not responsible for monitoring individual apprenticeship programs; instead, the state is. It does so through state apprenticeship councils. OATELS does, however, conduct two types of reviews to determine how well the state fulfills its responsibilities. Quality reviews determine, in part, conformance with prescribed federal requirements concerning state apprenticeship laws, state council composition, and program registration, cancellation and deregistration provisions. Equal Employment Opportunity (EEO) reviews assess the conformity of state EEO plans, affirmative action activities, record-keeping procedures, and other activities with federal EEO regulations. In addition to these reviews, OATELS may also provide state agencies with federal staff to assist in day-to-day operations.
Background

Page 6 GAO-05-886 Registered Apprenticeship Programs
The number and type of construction apprenticeship programs are distributed differently across federally- and council-monitored states. Council-monitored states not only have more programs, but these programs are more likely to be jointly sponsored by employers and unions than sponsored by employers alone. On average, a construction apprenticeship program in federally-monitored states trains about 17 apprentices and in council-monitored states trains about 20. Beyond this average, it’s important to note that there can be great variation among programs, with some having over 400 participants and others 1 or 2. Figure 1 identifies states where programs are federally- and council-monitored.
Figure 1: States with Apprenticeship Programs Overseen by Federal Officials and State Apprenticeship Councils
N.H.
Mass.
R.I.
Conn.
N.J.
Del.
Md.
D.C.
Hawaii
Vt.
Ala.
Ariz.Ark.
Calif.
Ga.
Ill. Ind.
Iowa
Kans.
La.
Maine
Mo.
Nebr.
N.Mex.
N.Y.
N.Dak.Oreg.
Pa.
Tex.
Wisc.
Fla.
Miss.
N.C.
Ohio
Okla.
S.Dak.Wyo.
Alaska
Idaho
Mont.
Wash.
Nev.
Utah
Colo.
Mich.
Minn.
Va.W.Va.Ky.
Federally-monitored states
Council-monitored states
Source: Department of Labor/OATELS.
S.C.
Tenn.
Virgin Islands
Guam
Page 7 GAO-05-886 Registered Apprenticeship Programs
Both the federal and council-monitored states collect data on the individual programs they oversee. Labor maintains a large database called the Registered Apprenticeship Information System (RAIS) and collects information about individual programs, apprentices, and sponsors for apprenticeships in the 23 states where it has direct oversight and in 8 council-monitored states that have chosen to report into this system. The other council-monitored states, 20 in total, maintain their own data and collect various pieces of information on apprenticeship systems. Labor does collect aggregate data on apprentices and programs from these states.
In all states, individuals can enter the construction trades without completing formal apprenticeship programs, but many construction workers, particularly those working in highly skilled occupations that require extensive training, such as the electrical, carpentry, and plumbing trades, receive their training though registered apprenticeship programs. To complete their programs, apprentices must meet requirements for on-the-job training and classroom instruction that must meet the minimum standards for the trade as recognized by Labor or the state apprenticeship council. Programs in some trades, for example, commercial electricity, may take 5 years to complete but programs to train laborers may only take a year. Beginning apprentices’ wages generally start at about 40 percent of the wage of someone certified in a particular trade and rise to about 90 percent of that wage near completion. Apprentices’ contracts with their program sponsors specify a schedule of wage increases.
Although OATELS is responsible for overseeing thousands of apprenticeship programs in the states where it has direct oversight, it reviews few of these programs each year. Also, while its apprenticeship database collects much information about individual participants and programs, Labor hasn’t used these data to systematically generate program performance indicators such as completion rates. As a result, it lacks information that would allow it to identify poorly performing programs and adjust its oversight accordingly. Furthermore, despite many technical upgrades, Labor’s database hasn’t provided information that meets the needs of federal apprenticeship directors or the needs of other stakeholders.
Labor’s Monitoring of Registered Apprenticeship Programs Is Limited
Page 8 GAO-05-886 Registered Apprenticeship Programs
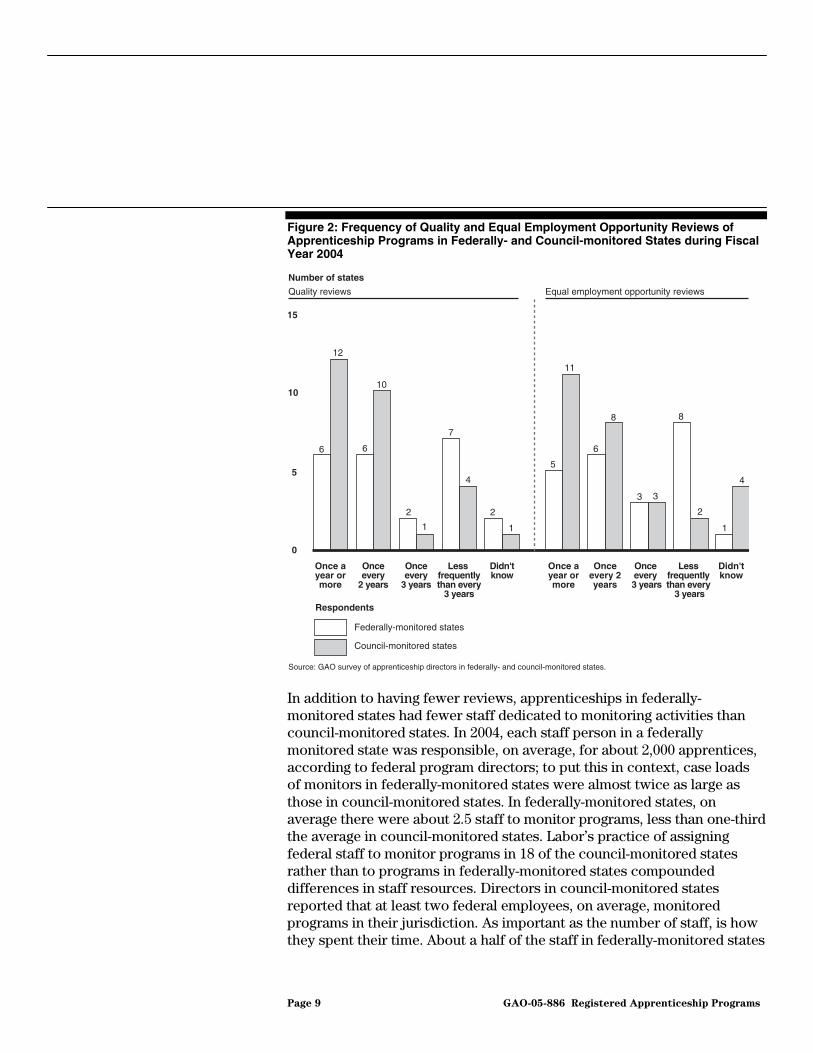
OATELS has reviewed very few of the apprenticeship programs in the states where it has direct oversight. Federal apprenticeship directors in these states reported they conducted 379 quality reviews in 2004, covering only about 4 percent of the programs under their watch. These reviews are done to determine, for example, whether sponsors have provided related instruction and on-the-job training hours in accordance with the standards for the program and whether wages reflected actual time in the program. The number of reviews conducted varied across states. On average, 22 quality reviews per state were conducted, but one director reported conducting as many as 67 reviews while another reported conducting no reviews at all. In addition, programs in council-monitored states were almost twice as likely as programs in federally-monitored states to have been reviewed within 3 years. (See fig. 2.) Several federal officials said over the past several years they had placed primary emphasis on registering new programs and recruiting more apprentices, particularly in nontraditional areas such as childcare and health. In addition, they told us it was not possible to do more reviews in part because of limited staff.
Few Federal Staff Are Engaged in Monitoring the Programs That Labor Directly Oversees
Page 9 GAO-05-886 Registered Apprenticeship Programs
Figure 2: Frequency of Quality and Equal Employment Opportunity Reviews of Apprenticeship Programs in Federally- and Council-monitored States during Fiscal Year 2004
In addition to having fewer reviews, apprenticeships in federally-monitored states had fewer staff dedicated to monitoring activities than council-monitored states. In 2004, each staff person in a federally monitored state was responsible, on average, for about 2,000 apprentices, according to federal program directors; to put this in context, case loads of monitors in federally-monitored states were almost twice as large as those in council-monitored states. In federally-monitored states, on average there were about 2.5 staff to monitor programs, less than one-third the average in council-monitored states. Labor’s practice of assigning federal staff to monitor programs in 18 of the council-monitored states rather than to programs in federally-monitored states compounded differences in staff resources. Directors in council-monitored states reported that at least two federal employees, on average, monitored programs in their jurisdiction. As important as the number of staff, is how they spent their time. About a half of the staff in federally-monitored states
0
5
10
15
Didn'tknow
Less frequently than every
3 years
Once every 3 years
Onceevery 2years
Once ayear ormore
Didn'tknow
Less frequentlythan every
3 years
Onceevery
3 years
Onceevery
2 years
Once ayear ormore
Number of states
Quality reviews Equal employment opportunity reviews
Respondents
Federally-monitored states
6
12
6
10
2 2
1 1 1
7
4
5
11
6
8
3 3
8
2
4
Council-monitored states
Source: GAO survey of apprenticeship directors in federally- and council-monitored states.

Page 10 GAO-05-886 Registered Apprenticeship Programs
spent 40 percent or more of their time in the field performing monitoring, oversight, and providing related technical assistance, according to federal program directors whereas one-half of the staff in council-monitored states spent about 70 percent or more in the field.
Although Labor collects information to compute completion rates and track participants who do not complete programs in the time expected, it does not use these data to focus its oversight efforts on programs with poor performance. During a site visit in a federally-monitored state, a monitor showed us how she computed cancellation rates by hand for apprentices in programs that she felt were not doing an adequate job of training apprentices to see if her hypotheses were correct. In the absence of performance information, directors and staff in federally-monitored states reported that a variety of factors dictated which programs to review. These included size, newness, location, date of the last review, sponsor’s cooperativeness, as well as the location of staff resources.
In addition to not using program data to target reviews, Labor has not collected and consistently entered into its database information about why apprentices cancel out of programs, although its database was designed to include such information and having it could help target reviews. Officials told us that voluntary cancellation or transfers to another program were at times associated with program quality, while other nonvoluntary reasons, such as illness or military service, were not. Currently, recording the reason for an apprentice’s cancellation in the database is an optional field. We found that no reason was recorded for 60 percent of the cancellations and the remaining 40 percent did not effectively capture the reasons for leaving. Of the 18 reasons entered, the most common reasons were “Unknown,” “Voluntarily Quit,” “Unsatisfactory Performance,” “Discharged/Released,” and “Cancelled with the Occupation,” some of which did not provide useful information to target reviews. Also, other entries were close duplicates of one another, such as “left for related employment” and “left for other employment.”
Labor also treats as optional data entries for its equal employment opportunity reviews: including the date of the last review, compliance status, status of corrective actions, and other information that would improve the efficiency of managing reviews. As a result, such data were available for about 5 percent of programs in Labor’s database in fiscal year 2004. Without this information, it is more difficult to determine when programs had their last EEO review and to readily identify programs with known problems.
While Labor Collects Much Information about Apprenticeship Programs, It Does Not Systematically Use Data to Focus Its Oversight

Page 11 GAO-05-886 Registered Apprenticeship Programs
Despite many technical upgrades, Labor’s database hasn’t provided information that meets the needs of its federal directors or the needs of other stakeholders. While acknowledging that Labor’s database has been updated and improved, 22 out of the 23 directors of apprenticeship programs and their monitoring staff have expressed dissatisfaction with the present system. One complained of “daily” changes to the data fields without being informed of “why or when they will change.” Expressing the desire to select and sort data on any field and generate unique reports in context with all available data, another concluded, “In short, we need a lot of flexibility with database reports that we don’t have at this time.” Many federal apprenticeship directors made recommendations for improving the database. In general, what state directors wanted most was a system that was stable, user friendly, and that would allow them to produce customized reports to better oversee the apprenticeship programs in their states. The list below shows those potential improvements endorsed by more than half of the state apprenticeship directors:
• Increase the timeliness of notifications to state and regional offices for changes to RAIS (e.g., provide for more frequent communication), (22 of 23 surveyed states).
• Simplify instruction and procedures for producing reports (18 of 23 surveyed states).
• Allow production of customized state and regional reports by type of industry (18 of 23 surveyed states).
• Allow production of customized state and regional reports by sponsor type (17 of 23) and occupational type (17 of 23 surveyed states).
• Improve the frequency of RAIS training (17 of 23 surveyed states). • Improve the quality of RAIS training (16 of 23 surveyed states). • Simplify instructions and procedures for inputting and updating data
(16 of 23 surveyed states). • Increase available coding options to explain why apprentices leave the
program (14 of 23 surveyed states). • Allow production of customized state and regional reports by sex of
apprentice and race of apprentice (14 of 23 surveyed states). OATELS has recently purchased software that enables users to extract data from Labor’s databases in order to produce customized reports. Purchased originally for the Secretary of Labor’s use, Labor Information Technology and OATELS officials said they foresaw the software’s utility for many programs and therefore decided to purchase licenses for apprenticeship field staff. However, OATELS has not necessarily taken steps to ensure field staff will be able to make optimal use of the software. About half the directors in federally-monitored states did not know the
Labor’s Data Base Does Not Meet the Needs of Apprenticeship Directors and Other Stakeholders

Page 12 GAO-05-886 Registered Apprenticeship Programs
software was available or what it was. Although the software was demonstrated at a directors’ meeting in 2004, several couldn’t recall the demonstration and others were not in attendance. Moreover, two of the directors lacked basic hardware, such as a high-speed cable needed to support the software. In fact, one director told us he was working from his home because his office didn’t have such basics as a cable hook-up for his computer. Even if such obstacles are surmounted, the new system may not meet the staffs’ data needs. Two directors who were already attempting to use the software reported to us that it did not allow them to select information using factors that would be most useful to them, such as state-level data on apprenticeship programs. In addition, Labor could or would not supply us with formal documentation describing its plans to implement the software or its vision of how the software would be used by its staff. Labor also reported that because of budget constraints and the easy use of the new software, it had no plans to provide training. Without such plans, Labor’s commitment to the full implementation and future financing of the program is questionable.
Labor has infrequently reviewed states to which it has delegated oversight responsibility. This includes both quality reviews and EEO reviews to assure that these states are in compliance with federal rules for overseeing apprenticeship programs and also adhering to equal employment opportunity requirements. Moreover, states that have been reviewed in recent years reported that they had little utility for helping them manage their programs, in part, because of the little feedback they received. In terms of providing information to Congress and others, Labor does not collect from these states information that is readily available on apprenticeships by occupation or industry, even for occupations where shortages of skilled workers are anticipated.
Agency records indicate that Labor conducted only three quality and EEO reviews of council-monitored states in calendar years 2002 and 2003, and none in 2004 but has scheduled seven for 2005. State apprenticeship directors confirmed that reviews are infrequent. Twelve of the 27 directors in council-monitored states reported that OATELS had conducted reviews of their programs less frequently than once every 3 years and several responded that reviews had not taken place in the last 9 to 12 years. An additional five directors reported their states had never been reviewed or that they were unaware if such reviews had taken place. The remaining
Labor Has Reviewed Council-Monitored States Infrequently, Provided Little Feedback, and Not Collected Data That Would Allow for a National Picture of Apprenticeships
Labor Has Reviewed Council-Monitored States Infrequently in Recent Years

Page 13 GAO-05-886 Registered Apprenticeship Programs
10 reported reviews took place in their states at least once every 3 years. (See fig. 3.) While neither statute nor regulation specifies the frequency with which OATELS should conduct such reviews, they constitute an important mechanism for ensuring that state laws conform to requirements necessary for Labor’s recognition of a state’s registered apprenticeship program.
Figure 3: Frequency of Federal Reviews of Council-monitored States
State directors reported that the Quality Reviews and the EEO Reviews had limited utility for helping them manage their programs. For example, only about half of them reported that the quality reviews were at least moderately useful for helping them determine their compliance with federal regulation. (See fig. 4.) Results were similar for the EEO reviews. (See fig. 5.) For example, slightly less than half of state directors reported that EEO reviews were at least moderately useful in helping them determine their compliance with federal EEO regulations. Some directors said reviews would be more useful if they focused on reviewing program-related activities in the state. Eight of the directors suggested that Labor focus more on state and local conditions and the performance of apprenticeship programs instead of focusing only on whether council-monitored states comply with federal standards. For example, one
Officials in Most Council-Monitored States Reported Reviews Were Not Very Useful, in Part Because of Limited Feedback
0
5
10
15
Didn'tknow
Lessfrequentlythan every
3 years
Onceevery
3 years
Onceevery
2 years
Once ayear ormore
Number of states
Source: GAO survey of apprenticeship directors in states that do their own monitoring.
3
2
5 5
12

Page 14 GAO-05-886 Registered Apprenticeship Programs
director reported the feedback he received on EEO activities was unrelated to the racial composition of the state. Also, some suggested reviews could provide opportunities for federal officials to provide assistance and share knowledge about strategies that other states have found useful.
Figure 4: Council-monitored States’ Rankings of the Usefulness of Federal Quality Reviews
0
2
4
6
8
10
12
14
16
Number of states
Very great or great extent
Moderate extent
Some, or little or no extent
Don't know
Source: GAO survey of apprenticeship directors in council-monitored states.
Making informeddecisions about
programs
Evaluating strengths andweaknesses of
programs
Assessing how well programs comply with
federalregulations
Completingreports aboutyour state's
program
5
9
2 2
7
9
3
14
8
5
7
6
2
12
7
10

Page 15 GAO-05-886 Registered Apprenticeship Programs
Figure 5: Council-monitored States’ Rankings of the Usefulness of EEO Reviews
While directors had a number of ideas for improving the usefulness of quality and EEO reviews, many noted that Labor provided limited or no feedback as part of the review process. For example, one said his state agency received a brief letter from Labor stating only that the state was in compliance with federal regulations. Two others said their agencies received no documentation that a review had in fact been conducted, even though in one of these cases the state had made requests for the review findings. Officials in one state said feedback from their last review was positive and indicated no problems, but a few years later, OATELS took steps to get their state apprenticeship council derecognized with no prior notice or subsequent review.
0
2
4
6
8
10
12
14
16
Number of states
Very great or great extent
Moderate extent
Some, or little or no extent
Don't know
Source: GAO survey of apprenticeship directors in council-monitored states.
Making informed decisions about
programs
Evaluating strengths and weaknesses of
programs
Assessing how well programs
comply with federal regulations
Completing reports about your state's
program
4
8
4
1
9
65
11
10
6
9
4
5
9 9
8

Page 16 GAO-05-886 Registered Apprenticeship Programs
Labor collects aggregate counts of apprentices for most council-monitored states and has not developed strategies to collect more detailed information that would allow for a description of apprenticeships at the national level, even for those where shortages of skilled workers are anticipated. Of the 28 council-monitored states, 20 have their own data system and do not report data to Labor’s apprenticeship database. These 20 states represent about 68 percent of the nation’s apprentices. Labor and council-monitored states have differing opinions about why there are separate data systems. Labor officials told us that, as they were developing their database, they conducted outreach to council-monitored states. Officials from these states say otherwise. They also said that participating in Labor’s database would be an onerous process or that Labor’s system did not meet their state’s information needs and, therefore, they had invested the time and money to develop their own systems. Because many of these systems are not compatible with Labor’s, the agency collects only total counts of apprentices and programs from these 20 states, which it uses for its official reports.
While incompatible data systems may suggest that it would be difficult or costly to obtain more than aggregate counts, in collecting data for this report, we found many of the council-monitored states—including 10 with large numbers of apprentices—were both willing and capable of providing us data on apprentices by industry and by occupation as well as information on completion rates, completion times, and some wage data for occupations that we had specified. In fact, one state reported that it had designed its apprenticeship database to collect all information required by Labor’s database and had offered to report these data to Labor electronically—but Labor had not taken steps to accept this offer. Nevertheless, as one director pointed out, having a unified data picture is central to OATELS’ oversight as well as its promotional activities and, as many agree, such a system would promote the health of the registered apprenticeship system.
Construction apprentices in programs sponsored jointly by employers and unions (joint programs) generally completed at a higher rate and in greater numbers than those enrolled in programs sponsored by employers alone (non-joint programs). More importantly, despite growth in construction program enrollment, there has been a decline over time in completion rates for both types of programs. Completion rates declined from 59 percent for apprentices enrolling in 1994 to 37 percent for apprentices enrolling in 1998. It is difficult to know what factors underlie this trend because, as noted earlier, Labor does not systematically record
Labor Has Not Collected Data That Would Allow for a National Picture of Apprenticeships
Construction Apprenticeship Completion Rates and Wages Vary by Program Sponsor

Page 17 GAO-05-886 Registered Apprenticeship Programs
information about why apprentices leave programs. Apprentices who completed programs within 6 years tended to finish earlier than expected. In addition, wages for joint apprentices were generally higher at the start and upon completion of their programs. Data received from 10 council-monitored states that do not report to Labor’s database generally mirrored these findings.
Completion rates were generally higher for apprentices in joint programs than for those in non-joint programs. Of the apprentices who entered programs between 1994 and 1998, about 47 percent of apprentices in joint programs and 30 percent of apprentices in non-joint programs completed their apprenticeships by 2004. For five consecutive classes (1994-1998) of apprentices in Labor’s database, completion rates calculated after 6 years, were higher for joint programs, as shown in figure 6.2 The data we received from 10 additional states that do not report into Labor’s database showed similar trends, with joint apprentices having higher completion rates. For complete data that we received from these 10 states, see appendix II.
2Most apprenticeship programs in construction require 4 years to complete. In our analysis, we allowed for 6 years, to account for slow work periods and other delays.
Nearly Half of Apprentices in Joint Programs Completed Their Apprenticeships Compared with about a Third in Non-joint Programs

Page 18 GAO-05-886 Registered Apprenticeship Programs
Figure 6: Completion Rates after 6 Years for Apprentices Entering Construction Programs in FY 1994 through 1998
For the programs in Labor’s database, this higher completion rate for joint apprenticeship programs was true for all but 1 of the 15 largest individual trades which collectively account for 93 percent of active apprentices in construction. (See fig. 7.) It should be noted that among the trades, themselves, there were substantial variations in completion rates, often due to the nature of work environment and other constraints, according to federal and state officials. For example, roofing programs, which have low completion rates, face unpredictable weather and seasonal work flows.
Percentage of apprentices
Completed Cancelled
Respondents
Joint
63
46 46
52
34
4244
272826 26
66
34
44
26
4338
58
4846
27
63
46
65
48
42
48
10
Non-joint
Sources: GAO analysis of RAIS database.
0
10
20
30
40
50
60
70
80
90
100
1998199719961995199419981997199619951994

Page 19 GAO-05-886 Registered Apprenticeship Programs
Figure 7: Completion Rates after 6 Years by Occupation for Apprentices Who Began Joint and Non-joint Construction Programs between FY 1994 and 1998
Officials said that joint programs have higher completion rates because they are more established and better funded. For some joint programs, these additional resources stem in part from union members paying a small portion of their paychecks into a general training fund that is used to help defray some of the training costs for apprentices. In addition, they suggested that, because unions tend to have a network of affiliates spread across an area, they are more likely to find work for participating apprentices in other areas when work is slow in a particular area. Local union chapters often have portability agreements with one another other,
0
10
20
30
40
50
60
70
80
90
100
60
29
36 35
52
31
59
27
55
30
18 17
50
9
51
31
39
16
51
18
54
61
29 28
53 53
2925
45
24
Respondents
Percentage of apprentices completing in 6 years
Joint apprentices
Elect
ricia
n
Carpe
nter
Plum
ber
Pipe
fitte
r
Roofe
rStru
ctur
al s
teel
Brickl
ayer
Paint
erO
pera
ting
engi
neer
Insu
latio
n w
orke
r
Cemen
t mas
on
Mill
wrig
ht
Const
ruct
ion
craf
t la
bore
r
Heatin
g an
d ai
r con
ditio
ner
inst
alla
tion
and
serv
ice
Sheet
met
al
Non-joint apprentices
Source: GAO analysis of RAIS database.
wor
ker
wor
ker

Page 20 GAO-05-886 Registered Apprenticeship Programs
which help to facilitate such transfers. Officials also said these programs provide mentoring and other social supports.
Enrollments in construction apprenticeship programs more than doubled from 1994 to 1998, increasing from 20,670 construction apprentices to 47,487.3 (See fig. 8.) Meanwhile, completion rates declined from 59 percent for the class of 1994 to 37 percent for the class of 19984. This decline for these cohorts held for both joint and non-joint programs. (See fig. 9.) Completion rates for joint apprentices dropped from nearly 63 percent to 42 percent, and from 46 percent to 26 percent for non-joint apprentices. This trend was consistent across different occupations as well, with most experiencing declines.
3Enrollment increased through fiscal year 2000, reaching a total of 59,625. Since then, there have been fewer apprentices enrolling in 2001 through 2004, with 36,325 apprentices enrolling in fiscal year 2004.
4Apprentices entering programs during 1994 to 1998 would be expected to completed these programs by 2000 to 2004 unless they dropped out.
While Enrollments Increased, Completion Rates Declined in General for the Period Examined

Page 21 GAO-05-886 Registered Apprenticeship Programs
Figure 8: Enrollment for Apprentices in Joint and Non-joint Construction Programs, FY 1994 through 1998
0
5
10
15
20
25
30
35
40
Source: GAO analysis of RAIS database.
Fiscal year
Enrollment (in thousands)
Joint
Non-joint
1994 1995 1996 1997 1998

Page 22 GAO-05-886 Registered Apprenticeship Programs
Figure 9: Trends in Completion Rates after 6 Years for Apprentices in Joint and Non-joint Construction Programs Entering Programs in FY 1994 through 1998
Because Labor does not systematically record the explanations that apprentices offer for canceling out of programs, it is difficult to determine what may lie behind this downward trend. Labor suggested that some apprentices may choose to acquire just enough training to make them marketable in the construction industry in lieu of completing a program and achieving journey status. While we cannot confirm this hypothesis, we did find that those apprentices who did cancel chose to do so after receiving over a year of training. Joint apprentices cancelled after 92 weeks on average and non-joint apprentices cancelled after 85 weeks on average. Other reasons offered included a decline in work ethic, the emphasis placed by high schools on preparing students for college and the corresponding under-emphasis on preparation for the trades, and a lack of work in the construction industry. We cannot verify the extent to which unemployment played a role influencing outcomes, but, according to the Bureau of Labor Statistics, the unemployment rate for construction increased overall from 6.2 percent to 8.4 percent between 2000 to 2004, despite the predictions of future worker shortages in construction.
0
10
20
30
40
50
60
70
80
Source: GAO analysis of RAIS database.
Fiscal year
Completion rate (percentage)
JointNon-joint
1994 1995 1996 1997 1998
Page 23 GAO-05-886 Registered Apprenticeship Programs
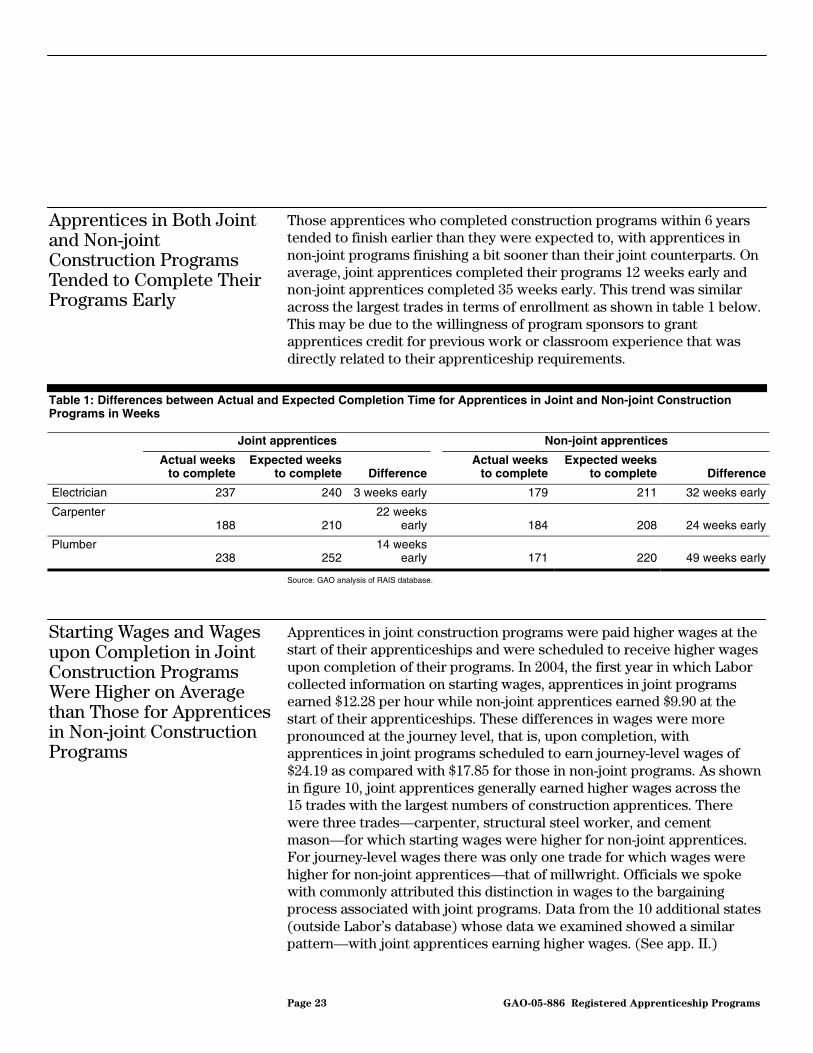
Those apprentices who completed construction programs within 6 years tended to finish earlier than they were expected to, with apprentices in non-joint programs finishing a bit sooner than their joint counterparts. On average, joint apprentices completed their programs 12 weeks early and non-joint apprentices completed 35 weeks early. This trend was similar across the largest trades in terms of enrollment as shown in table 1 below. This may be due to the willingness of program sponsors to grant apprentices credit for previous work or classroom experience that was directly related to their apprenticeship requirements.
Table 1: Differences between Actual and Expected Completion Time for Apprentices in Joint and Non-joint Construction Programs in Weeks
Joint apprentices Non-joint apprentices
Actual weeks to complete
Expected weeks to complete Difference
Actual weeks to complete
Expected weeks to complete Difference
Electrician 237 240 3 weeks early 179 211 32 weeks early
Carpenter 188 210
22 weeks early
184 208 24 weeks early
Plumber 238 252
14 weeks early
171 220 49 weeks early
Source: GAO analysis of RAIS database.
Apprentices in joint construction programs were paid higher wages at the start of their apprenticeships and were scheduled to receive higher wages upon completion of their programs. In 2004, the first year in which Labor collected information on starting wages, apprentices in joint programs earned $12.28 per hour while non-joint apprentices earned $9.90 at the start of their apprenticeships. These differences in wages were more pronounced at the journey level, that is, upon completion, with apprentices in joint programs scheduled to earn journey-level wages of $24.19 as compared with $17.85 for those in non-joint programs. As shown in figure 10, joint apprentices generally earned higher wages across the 15 trades with the largest numbers of construction apprentices. There were three trades—carpenter, structural steel worker, and cement mason—for which starting wages were higher for non-joint apprentices. For journey-level wages there was only one trade for which wages were higher for non-joint apprentices—that of millwright. Officials we spoke with commonly attributed this distinction in wages to the bargaining process associated with joint programs. Data from the 10 additional states (outside Labor’s database) whose data we examined showed a similar pattern—with joint apprentices earning higher wages. (See app. II.)
Apprentices in Both Joint and Non-joint Construction Programs Tended to Complete Their Programs Early
Starting Wages and Wages upon Completion in Joint Construction Programs Were Higher on Average than Those for Apprentices in Non-joint Construction Programs

Page 24 GAO-05-886 Registered Apprenticeship Programs
Figure 10: Average Wages for Apprentices in Joint and Non-Joint Construction Programs in FY 2004
02468
1012141618
20
11.4
9
12.1 12.611.3
9.911.8
10
12.1 12.113.3
14.3 13.8
10.912.612.2 11.5
9.2
13.4
10.1
12.8 11.813.8
15.4
12.5
9.6
12.4
9.4
13.412.3
Average starting wages for apprentices (dollars per hour)
Elect
ricia
n
Carpe
nter
Plum
ber
Pipe
fitte
r
Roofe
r
Struct
ural
ste
el
Brickl
ayer
Paint
erO
pera
ting
engi
neer
Insu
latio
n w
orke
r
Mill
wrig
ht
Cemen
t mas
on
Const
ruct
ion
craf
t la
bore
r
Heatin
g an
d ai
r con
ditio
ner
inst
alla
tion
and
serv
ice
Heatin
g an
d ai
r con
ditio
ner
inst
alla
tion
and
serv
ice
Sheet
met
al
Wages
Joint apprentices
Non-joint apprentices
Source: GAO analysis of RAIS database.
wor
ker
wor
ker
Elect
ricia
n
Carpe
nter
Plum
ber
Pipe
fitte
r
Roofe
r
Struct
ural
ste
el
Brickl
ayer
Paint
erO
pera
ting
engi
neer
Insu
latio
n w
orke
r
Mill
wrig
ht
Cemen
t mas
on
Const
ruct
ion
craf
t la
bore
r
Sheet
met
al
wor
ker
wor
ker
0
5
10
15
20
25
30
25.5
17.4
23.8 23.124.6
17.4
25.8
17.7
25.3
18.3
22.3
18.2
26.6
18.7
23.3
16.1
23.8
15.6
24.4
14.7
22.3
17.6
24.3 24.1 23.3
15.5
22.7
16
21.7 23.1
Average scheduled journey wage (dollars per hour)

Page 25 GAO-05-886 Registered Apprenticeship Programs
As a small program with finite resources tasked with an important mission, it is incumbent on Labor’s Apprenticeship Office to leverage the tools at its disposal to carry out its oversight, all the more so during a period of tight budgets. Labor’s responsibility for assuring that registered apprenticeship programs meet appropriate standards is no small charge, given the thousands of programs in operation today. In terms of the programs it directly monitors, Labor has not made optimal use of the information it collects to target resources. The failure to do so limits the agency’s ability to target its oversight activities to address and remedy areas where there may be significant need, particularly the construction trades where completion rates are declining. Underscoring this point is the fact that apprenticeship directors in federally-monitored states cannot get easy access to the data in the form of customized reports. Irrespective of distinctions between apprentice outcomes for joint and non-joint programs, without better use of its data, Labor is still not in a position to assess programs on their individual merits. Given the relatively limited number of staff available for field visits, by not using the program data it has, Labor misses opportunities to more efficiently use its staff.
With regard to states with council-monitored apprenticeship programs, Labor’s oversight practices do not necessarily ensure that those states’ activities comply with federal standards for oversight because the Apprenticeship Office has only sporadically assessed their operations. Moreover, to the extent that the federal office does not provide useful feedback to the states when it does conduct reviews, states may lose opportunities to improve programs under their jurisdiction. Finally, because Labor does not seek much information beyond aggregate numbers from a majority of council-monitored states, policymakers lose an opportunity to gain perspective and insight for aligning workforce training with national needs, specifically for key occupations within construction that are likely to be faced with shortages of skilled workers in the near future.
We recommend that the Secretary of Labor take steps to (1) better utilize information in Labor’s database, such as indicators of program performance, for management oversight, particularly for apprenticeship programs in occupations with expected future labor shortages; (2) develop a cost-effective strategy for collecting data from council-monitored states; (3) conduct Labor’s reviews of apprenticeship activities in states that regulate their own programs on a regular basis to ensure that state activities are in accord with Labor’s requirements for recognition of
Conclusions
Recommendations

Page 26 GAO-05-886 Registered Apprenticeship Programs
apprenticeship programs; and (4) offer substantive feedback to states from its reviews.
We provided a draft of this report to the Department of Labor for review and comment. Labor provided written comments on the draft report that are reproduced in appendix V. Labor concurred with our recommendations and has already taken steps to obtain data on apprenticeships from some council-monitored states and to regularly review activities in these states. Further, Labor stated it plans to use the data to better target the performance of the apprenticeship programs that OATELS directly registers and oversees, and to provide improved feedback to states that register and oversee their own apprenticeship programs.
Unless you publicly announce its contents earlier, we plan no further distribution of this report until 14 days after the date of this letter. At that time, we will send copies of this report to the Secretary of Labor and other interested parties. We will also make copies available to others upon request. In addition, the report will be available at no charge on GAO’s Web site at http://www.gao.gov.
Please contact me on 512-7215 or [email protected] if you or your staff have any questions about this report. Contact points for our Offices of Congressional Relations and Public Affairs may be found on the last page of this report. GAO staff who made major contributions to this report are listed in appendix VI.
Sigurd R. Nilsen Director, Education, Workforce, and Income Security Issues
Agency Comments

Appendix I: Scope and Methodology
Page 27 GAO-05-886 Registered Apprenticeship Programs
Our objectives were to determine (1) the extent to which the U.S. Department of Labor monitors the operations and outcomes of registered apprenticeship programs in the states where it has direct oversight, (2) its oversight activities for council-monitored states, and (3) outcomes for construction apprentices in programs sponsored jointly by employers and unions in relation to those sponsored by employers alone.
To carry out these objectives, we surveyed OATELS officials in charge of apprenticeship programs in 23 federally monitored states and state apprenticeship directors in 28 states, including the District of Columbia, where state apprenticeship councils oversee programs. We used two surveys—one for federally- monitored states and one for council-monitored states—to obtain national information on OATELS’ monitoring and oversight activities. We focused only on apprentices in the civilian sector of the economy and did not include military or prison-based programs. We asked questions designed to determine the amount of resources devoted to oversight, the frequency of oversight activities, and the outcomes from these activities. The surveys were conducted using self-administered electronic questionnaires posted on the World Wide Web. We pretested our surveys with a total of five federally-monitored and council-monitored state officials to determine if the surveys were understandable and if the information was feasible to collect. We then refined the questionnaire as appropriate. We sent e-mail notifications to all federally-monitored and council-monitored state officials on January 5, 2005. We then sent each potential respondent a unique password and username by e-mail on January 13, 2005, to ensure that only members of the target population could participate in the appropriate survey. To encourage respondents to complete the surveys, we sent e-mail messages to prompt each nonrespondent approximately 1½ weeks after the initial e-mail message and a final e-mail reminder on February 7, 2005. We also called nonrespondents to encourage them to complete the survey. We closed the surveys on March 18, 2005. We received responses from all 23 federally-monitored and 27 of 28 council-monitored state officials including the District of Columbia. (See table 2.) Copies of the surveys are provided in appendices III and IV.
Appendix I: Scope and Methodology

Appendix I: Scope and Methodology
Page 28 GAO-05-886 Registered Apprenticeship Programs
Table 2: Survey Numbers and Response Rates
Respondents Surveys conducted Surveys received
Federally-monitored states 23 23
Council-monitored states and the District of Columbia 28 27
Source: GAO.
To examine the outcomes for apprentices in the construction industry, we analyzed data from Labor’s RAIS database. In calculating completion rates, we constructed five cohorts based on when they enrolled in their programs; we had cohorts for fiscal years 1994, 1995, 1996, 1997, and 1998. We then considered the status of these cohorts 6 years after they enrolled to determine if they had completed, cancelled, or remained in training. Our analysis of wage data focused on data collected in fiscal year 2004, the first full year that Labor began collecting such information. We assessed the reliability of the RAIS database by reviewing relevant information on the database, interviewing relevant OATELS officials, and conducting our own testing of the database. This testing included examining the completeness of the data, performing data reliability checks, and assessing the internal controls of the data. Based on this information and our analysis, we determined that these data were sufficiently reliable for the purposes of our report.
Because Labor’s RAIS database does not contain data from all states, we supplemented these data with data from 10 council-monitored states that do not report to this database. We selected these states based on the number of apprentices they had and whether their data were in an electronic format that would facilitate extracting and sending these data to us. We submitted a data request that asked for selected information on enrollment, completion, and wages for the 10 largest apprenticeship occupations to these states and received data from all of them. We determined that these data were reliable for our purposes. We did not combine these data with those from RAIS; we used them as a means of comparison.
To learn more about the oversight of apprenticeship programs and their outcomes, we conducted site visits to four states—New York, California, Texas, and Washington. These states represented both federal and council-monitored states and had large numbers (from a high of about 52,000 to a low of 6,500) of construction apprentices. On these site visits, we interviewed relevant federal and state officials along with joint and non-

Appendix I: Scope and Methodology
Page 29 GAO-05-886 Registered Apprenticeship Programs
joint program sponsors. We also toured facilities in two states where certain apprentices are trained.
Throughout the engagement we interviewed relevant Labor officials and experts that have researched apprenticeship programs and reviewed relevant past reports and evaluations of these programs. We conducted our review from August 2004 through July 2005 in accordance with generally accepted government auditing standards.

Appendix II: Completion Rates, Time Taken
to Complete, and Wages for Construction
Apprentices in Council-Monitored States
Page 30 GAO-05-886 Registered Apprenticeship Programs
Table 3: Percentages of Apprentices Completing Joint and Non-joint Construction Programs as Reported by Selected Council-monitored States for Fiscal Years 1997-2004
Californiaa Kentuckyb Marylandc Massachusettsd Minnesotad
Joint
Non-joint Joint
Non-joint Joint
Non-joint Joint
Non-joint Joint
Non-Joint
Electrician 48 32 60 38 52 35 63 38 77 25
Carpenter 22 12 20 0 26 27 48 0 20 0
Plumber 46 25 65 67 45 10 77 25 59 20
Pipe fitter 43 20 89 0 66 0 — — — —
Sheet metal worker 55 19 58 0 50 56 — — — —
Structural steel worker 35 — 26 — 33 — — — — —
Bricklayer 28 0 — 56 37 8 — — — —
Roofer 7 8 35 — 0 — — — — —
Painter 27 15 33 — 18 — — — — —
Operating engineer 53 0 50 — 47 — — — — —
Appendix II: Completion Rates, Time Taken to Complete, and Wages for Construction Apprentices in Council-Monitored States

Appendix II: Completion Rates, Time Taken
to Complete, and Wages for Construction
Apprentices in Council-Monitored States
Page 31 GAO-05-886 Registered Apprenticeship Programs
New York Oregone Virginiaf Washingtong Wisconsinh
Joint Non- joint Joint
Non-joint- Joint
Non-joint Joint
Non- joint Joint
Non-joint
68 12 65 — 42 20 62 38 86 90
36 28 20 — 47 16 32 21 69 55
53 15 49 — 67 25 94 22 75 56
90 13 46 — 58 22 70 — 82 33
70 0 41 — 10 27 37 0 63 45
61 0 41 — 50 7 41 — — —
37 11 44 — 16 25 33 — 51 67
21 8 5 — — — 6 — 43 0
25 0 25 — — 0 11 — 47 50
65 0 29 — 60 — 52 7 81 —
Source: Data were provided by selected council-monitored states.
Note: Data include apprentices entering program from October 1, 1997, through September 30, 1998, and completing before October 1, 2004.
aCalifornia reported no structural steel worker non-joint programs.
bKentucky reported that no apprentices entered bricklayer joint programs or carpenter, structural steel worker, roofer, painter, and operating engineer non-joint programs from October 1, 1997, through September 30, 1998.
cMaryland reported that no apprentices entered structural steel worker, roofer, painter, and operating engineer non-joint programs from October 1, 1997, through September 30, 1998.
dMassachusetts and Minnesota reported data for electrician, carpenter, and plumber programs only. We told state directors they could do this in order to save resources and because these three fields represent over half of all apprentices in the construction trades.
eOregon reported that no non-joint apprenticeship programs are registered in the state.
fVirginia reported that no apprentices entered roofer and painter joint programs, and roofer and operating engineer non-joint programs from October 1, 1997, through September 30, 1998.
gWashington reported no pipe fitter, structural steel worker, bricklayer, roofer, and painter non-joint programs.
hWisconsin reported no structural steel worker joint or non-joint programs and no operating engineer non-joint programs.

Appendix II: Completion Rates, Time Taken
to Complete, and Wages for Construction
Apprentices in Council-Monitored States
Page 32 GAO-05-886 Registered Apprenticeship Programs
Table 4: Average Number of Weeks Spent to Complete Joint and Non-joint Construction Apprenticeship Programs as Reported by Selected Council-monitored States
Californiaa Kentuckyb Marylandc Massachusettsc Minnesotad
Joint
Non-joint Joint
Non-joint Joint
Non-joint Joint
Non-joint Joint
Non-joint
Electrician 225 218 253 177 — — — — 208 60
Carpenter 188 140 219 — — — — — 191 —
Plumber 232 203 247 151 — — — — 213 85
Pipe fitter 231 191 234 — — — — — — —
Sheet metal worker 224 217 226 — — — — — — —
Structural steel worker 167 — 156 — — — — — — —
Bricklayer 140 — — 149 — — — — — —
Roofer 192 188 184 — — — — — — —
Painter 152 119 234 — — — — — — —
Operating engineer 183 — 150 — — — — — — —

Appendix II: Completion Rates, Time Taken
to Complete, and Wages for Construction
Apprentices in Council-Monitored States
Page 33 GAO-05-886 Registered Apprenticeship Programs
New Yorke Oregonf Virginiag Washingtonh Wisconsini
Joint Non- joint Joint
Non-joint Joint
Non-joint Joint
Non- joint Joint
Non-joint
290 219 205 — 240 166 233 209 256 264
165 213 176 — 169 234 201 184 207 204
262 247 211 — 254 168 234 161 274 280
209 — 198 — 214 201 247 — 259 216
217 52 217 — 214 104 219 — 264 244
162 — 188 — 154 196 149 — — —
155 174 171 — 159 215 161 — 173 139
197 174 146 — — — 121 — 165 —-
166 — 164 — — — 115 — 208 157
194 — 261 — 149 — 198 — 140 —
Source: Data were provided by selected council-monitored states.
Note: Data include apprentices entering program from October 1, 1997, through September 30, 1998, and completing before October 1, 2004.
aCalifornia reported no structural steel worker non-joint programs and no completers from bricklayer and operating engineer non-joint programs.
bKentucky reported that no apprentices entered bricklayer joint programs and carpenter, pipe fitter, structural steel, sheet metal worker, roofer, painter, and operating engineer non-joint programs from October 1, 1997, through September 30, 1998.
cMaryland and Massachusetts do not track these data.
dMinnesota reported data for electrician, carpenter, and plumber programs only and reported no completions for carpenters in non-joint programs. We told state directors they could report only for these three fields in order to save resources and because these three fields represent over half of all apprentices in the construction trades.
eNew York reported no completers for pipe fitter, structural steel worker, painter, and operating engineer non-joint programs.
fOregon reported no non-joint apprenticeship programs are registered in the state.
gVirginia reported no apprentices entered roofer and painter joint programs and roofer, painter and operating engineer non-joint programs from October 1, 1997, through September 30, 1998.
hWashington reported no pipe fitter, structural steel worker, bricklayer, operating engineer and roofer non-joint programs. Also, no apprentices completed sheet metal worker and painter non-joint programs.
iWisconsin reported no structural steel worker programs and no roofer and operating engineer non-joint programs.

Appendix II: Completion Rates, Time Taken
to Complete, and Wages for Construction
Apprentices in Council-Monitored States
Page 34 GAO-05-886 Registered Apprenticeship Programs
Table 5: Mean Hourly Wage Rates for Beginning Apprentices in Joint and Non-joint Construction Programs as Reported by Selected Council-monitored States, Fiscal Year 2004
Californiaa Kentucky Marylandb Massachusettsb Minnesotac
Joint
Non-joint Joint
Non-joint Joint
Non-joint Joint
Non-joint Joint
Non-joint
Electrician $13.50 $12.28 $9.31 $6.41 —- — — — $11.81 $11.06
Carpenter 15.16 14.11 8.05 8.31 — — — — 13.46 9.63
Plumber 13.82 12.85 12.14 7.54 — — — — 14.69 14.36
Pipe fitter 11.80 13.10 12.14 7.08 — — — — — —
Sheet metal worker 12.64 10.85 11.79 7.08 — — — — — —
Structural steel worker 17.24 — 13.56 7.08 — — — — — —
Bricklayer 11.22 11.40 10.59 9.82 — — — — — —
Roofer 11.90 10.96 10.12 7.08 — — — — — —
Painter 11.31 10.63 9.86 8.00 — — — — — —
Operating engineer 20.30 18.42 12.50 7.08 — — — — — —

Appendix II: Completion Rates, Time Taken
to Complete, and Wages for Construction
Apprentices in Council-Monitored States
Page 35 GAO-05-886 Registered Apprenticeship Programs
New Yorkb Oregond Virginiae Washingtonf Wisconsinb
Joint Non-joint Joint Non-joint Joint Non-joint Joint Non-joint Joint Non-joint
— — $9.81 — $9.50 $8.08 $11.64 $11.38 — —
— — 11.03 — 8.22 9.68 14.67 12.67 — —
— — 9.68 — 8.70 8.59 12.67 10.63 — —
— — 11.03 — 9.75 9.36 13.64 —- — —
— — 8.83 — 9.43 8.05 13.11 7.61 — —
— — 18.51 — 9.49 — 17.74 — — —
— — 13.35 — 8.02 9.47 12.62 — — —
— — 10.03 — — 7.44 13.28 — — —
— — 11.26 — — 10.95 11.50 8.33 — —
— — 17.43 — 10.99 — 15.95 15.37 — —
Source: Data were provided by selected council-monitored states.
Note: Data includes wages for apprentices who began programs on October 1, 2003, through September 30, 2004.
aCalifornia reported no structural steel worker non-joint programs.
bMaryland, Massachusetts, New York, and Wisconsin do not collect wage data.
cMinnesota reported data for electrician, carpenter, and plumber programs only. We told state directors they could do this in order to save resources and because these three fields represent over half of all apprentices in the construction trades.
dOregon reported no non-joint apprenticeship programs are registered in the state.
eVirginia reported no roofer joint programs and no operating engineer non-joint programs. Also, no apprentices entered painter joint programs and structural steel worker non-joint programs that year.
fWashington reported no pipe fitter, structural steel worker, bricklayer, painter, and roofer non-joint programs as of September 30, 2004.

Appendix II: Completion Rates, Time Taken
to Complete, and Wages for Construction
Apprentices in Council-Monitored States
Page 36 GAO-05-886 Registered Apprenticeship Programs
Table 6: Mean Hourly Wage Rates for Apprentices Achieving Journey Status in Joint and Non-joint Construction Programs as Reported by Selected Council-monitored States, Fiscal Year 2004
Californiaa Kentucky Marylandb Massachusettsb Minnesotac
Joint Non-joint
Joint
Non-joint
Joint
Non-joint Joint Non-joint
Joint
Non-joint
Electrician $34.98 $30.35 $20.74 $12.81 — — — — $26.62 $25.31
Carpenter 32.45 32.48 16.57 15.00 — — — — 23.20 29.38
Plumber 31.80 30.91 24.28 14.00 — — — — 32.65 30.56
Pipe fitter 32.40 — 24.28 12.00 — — — — — —
Sheet metal worker 32.50 31.98 23.58 12.00 — — — — — —
Structural steel worker 31.35 —- 22.68 12.00 — — — — — —
Bricklayer 29.97 30.28 21.17 16.98 — — — — — —
Roofer 25.92 24.89 18.40 12.00 — — — — — —
Painter 30.98 29.08 17.20 16.00 — — — — — —
Operating engineer 34.34 —- 21.03 12.00 — — — — — —

Appendix II: Completion Rates, Time Taken
to Complete, and Wages for Construction
Apprentices in Council-Monitored States
Page 37 GAO-05-886 Registered Apprenticeship Programs
New Yorkb Oregond Virginiae Washingtonf Wisconsin
Joint Non- joint Joint
Non- joint Joint
Non-joint Joint
Non- joint Joint
Non-joint
— — $23.57 — $16.54 $13.34 $24.38 $28.46 — —
— — 20.06 — 11.39 10.73 24.46 22.04 — —
— — 23.38 — 17.15 14.47 26.68 26.52 — —
— — 25.46 — 17.38 13.53 27.07 — — —
— — 19.74 — 14.85 11.15 25.58 18.12 — —
— — 28.47 — 13.87 - 27.30 — — —
— — 26.70 — 14.75 18.62 25.23 — — —
— — 19.42 — — —- 22.14 — — —
— — 18.77 — — —- 20.44 18.51 — —
— — 22.67 — 18.73 — 25.52 25.63 — —
Source: Data were provided by selected council-monitored states.
Note: Data include wages for apprentices who achieved journey status that year.
aCalifornia reported no structural steel worker non-joint programs. Also, no apprentices completed pipe fitter and operating engineer non-joint programs that year.
bMaryland, Massachusetts, New York, and Wisconsin do not collect wage data.
cMinnesota reported data for electrician, carpenter, and plumber programs only. We told state directors they could do this in order to save resources and because these three fields represent over half of all apprentices in the construction trades.
dOregon reported no non-joint apprenticeship programs are registered in the state.
eVirginia reported no roofer and painter joint programs, and no roofer, painter, and operating engineer non-joint programs, and no apprentices completed joint painter and non-joint structural steel worker programs as of September 30, 2004.
fWashington reported no pipe fitter, structural steel worker, bricklayer, and roofer non-joint programs as of September 30, 2004.

Appendix III: Responses to Survey of
Directors of Apprenticeships in Federally-
Monitored States
Page 38 GAO-05-886 Registered Apprenticeship Programs
Q1. At the close of federal fiscal year (FFY) 2004 (September 30, 2004), what was the total number of registered apprentices in your state?
Mean Median Minimum Maximum
Numberof
respondents
4,792 3437 271 20,496 23
Q1a. At the close of FFY 2004, what was the total number of registered apprentices in construction trades in your state?
Mean Median Minimum Maximum
Numberof
respondents
3,057 2226 207 10,396 22
Q1b. At the close of FFY 2004, what was the total number of approved apprenticeship programs in construction trades in your state?
Mean Median Minimum Maximum
Numberof
respondents
169 84 22 844 23
Q2. During FFY 2004, how many full-time equivalency (FTE) apprenticeship training staff were employed by OATELS to monitor and oversee apprenticeship programs in your state?
Mean Median Minimum Maximum
Numberof
respondents
3 2 0 6 22
Q3. Of the FTE apprenticeship training staff reported above, approximately what percentage of their time was spent in the field monitoring and overseeing apprenticeship programs or providing technical assistance related to monitoring and oversight during FFY 2004?
0 - 19% 20 - 39% 40 - 59% 60 - 79% 80 - 100% Don't know
Numberof
respondents
5 6 5 4 2 1 23
Q4. During FFY 2004, how many full-time equivalency (FTE) apprenticeship training representative, field, and other nonadministrative staff were employed by the state to monitor and oversee apprenticeship programs in your state?
Mean Median Minimum Maximum
Numberof
respondents
0 0 0 2 22
Appendix III: Responses to Survey of Directors of Apprenticeships in Federally-Monitored States

Appendix III: Responses to Survey of
Directors of Apprenticeships in Federally-
Monitored States
Page 39 GAO-05-886 Registered Apprenticeship Programs
Q6. In your opinion, would the following updates or modifications improve Registered Apprenticeship Information System’s (RAIS) usefulness to your state?
Yes No Don't know
Numberof
respondents
a. Increasing timeliness of notifying state and regional offices of changes to RAIS 22 1 0 23
b. Increasing available coding options to explain why apprentices leave the programs 14 7 2 23
c. Allowing production of customized state or regional reports by sponsorship type 17 2 4 23
d. Allowing production of customized state or regional reports by industry type 18 1 4 23
e. Allowing production of customized state or regional reports by occupational type 17 2 3 22
f. Allowing production of customized state or regional reports by sex of apprentices 14 1 8 23

Appendix III: Responses to Survey of
Directors of Apprenticeships in Federally-
Monitored States
Page 40 GAO-05-886 Registered Apprenticeship Programs
Yes No Don't know
Numberof
respondents
g. Allowing production of customized state or regional reports by race of apprentices 14 1 8 23
h. Simplifying instructions and procedures for inputting and updating data 16 6 1 23
i. Simplifying procedures required to produce reports 18 3 2 23
j. Increasing frequency of RAIS training 17 1 5 23
k. Improving quality of RAIS training 16 3 4 23
l. Other 9 0 2 11
Q8. Did your state use WIA Governor’s 15% State Set-Aside funds to support new and/or established apprenticeship programs in FFY 2004?
Yes No Don't know
Numberof
respondents
3 15 5 23

Appendix III: Responses to Survey of
Directors of Apprenticeships in Federally-
Monitored States
Page 41 GAO-05-886 Registered Apprenticeship Programs
Q9. Were WIA State Set-Aside funds used to support new and/or established apprenticeship programs in your state in FFY 2004 to do any of the following?
Yes, new apprenticeship
programs
Yes, established apprenticeship
programs No Don't know
Number of
respondents
a. To provide related instruction or other education that satisfied specific apprenticeship requirements 1 2 0 0 3
b. To provide on-the-job training 0 0 1 0 1
c. To disseminate information about apprenticeship programs 0 1 0 0 1
d. To encourage entities to sponsor and register additional or new programs 1 0 1 0 2
e. Other 1 0 0 0 1
Q11. For which of the following reasons did your state not use WIA Set-Aside Funds to support apprenticeship programs in FFY 2004?
Yes No Don't know
Numberof
respondents
a. Decision-makers gave priority to other programs. 11 0 6 17
b. Decision-makers did not believe funds could be used to support new apprenticeship programs. 7 2 8 17

Appendix III: Responses to Survey of
Directors of Apprenticeships in Federally-
Monitored States
Page 42 GAO-05-886 Registered Apprenticeship Programs
Yes No Don't know
Numberof
respondents
c. Decision-makers did not believe funds could be used to support established apprenticeship programs. 7 2 7 16
d. Decision-makers did not believe funds could be used to provide related instruction or other education that satisfied specific apprenticeship requirements. 6 2 9 17
e. Decision-makers did not believe funds could be used to provide on-the-job training. 6 3 8 17
f. Decision-makers did not believe funds could be used to disseminate information about apprenticeship programs. 5 2 10 17
g. Decision-makers did not believe funds could be used to encourage the recruitment of entities to sponsor and register new programs. 6 1 10 17

Appendix III: Responses to Survey of
Directors of Apprenticeships in Federally-
Monitored States
Page 43 GAO-05-886 Registered Apprenticeship Programs
Yes No Don't know
Numberof
respondents
h. Decision-makers did not establish linkages between the state apprenticeship unit and unit(s) responsible for WIA. 11 2 4 17
i. Other 8 0 3 11
Q13. Were WIA funding sources other than State Set-Aside Funds used in your state to support new and/or established apprenticeship programs in FFY 2004?
Yes No Don't know
Numberof
respondents
4 12 6 22
Q14. Other than State Set-Aside Funds, which of the following WIA funding sources were used to support new and/or established apprenticeship programs in FFY 2004?
Yes, new
programs
Yes, established
programs No Don't know
Number of
respondents
a. Adult Funds 1 1 1 1 4
b. Dislocated Worker Funds 0 1 1 2 4
c. Youth Funds 0 0 2 2 4
d. Other 0 2 0 1 3
Q16. Did your state establish linkages between WIA state unit and the state apprenticeship unit in FFY 2004 for any of the following purposes?
Yes No Don't know
Numberof
respondents
a. Shared decision making 0 18 4 22
b. Shared information gathering 4 14 4 22

Appendix III: Responses to Survey of
Directors of Apprenticeships in Federally-
Monitored States
Page 44 GAO-05-886 Registered Apprenticeship Programs
Yes No Don't know
Numberof
respondents
c. Shared information dissemination, including presentations 7 11 4 22
d. Shared use of educational programs that satisfy specific apprenticeship requirements 2 15 5 22
e. Shared grant development activities 4 13 6 23
f. Other 7 2 4 13
Q19. How often does your unit conduct formalized Quality Reviews of individual apprenticeship programs that address on-the-job training, related instruction, and/or program operations in your state?
Less frequently than every three years
Once every three years
Once every two years Once a year Twice a year
More than twice a year Don't know
Numberof
respondents
7 2 6 3 0 3 1 22
Q21. Approximately how many Quality Reviews did your unit conduct in FFY 2004? ( Click in the box and then enter up to a 4-digit whole number only. )
Mean Median Minimum Maximum
Numberof
respondents
17 10 0 67 22
Q22. To what extent, if at all, did your state find the FFY 2004 Quality Reviews useful for the following purposes?
Very great
extent Great extent Moderate extentSome extent
Little or no extent ( Please specify in Question 24. )
Don't know
Numberof
respondents
a. Making informed decisions about the administration and operation of apprenticeship programs 2 8 5 5 1 1 22
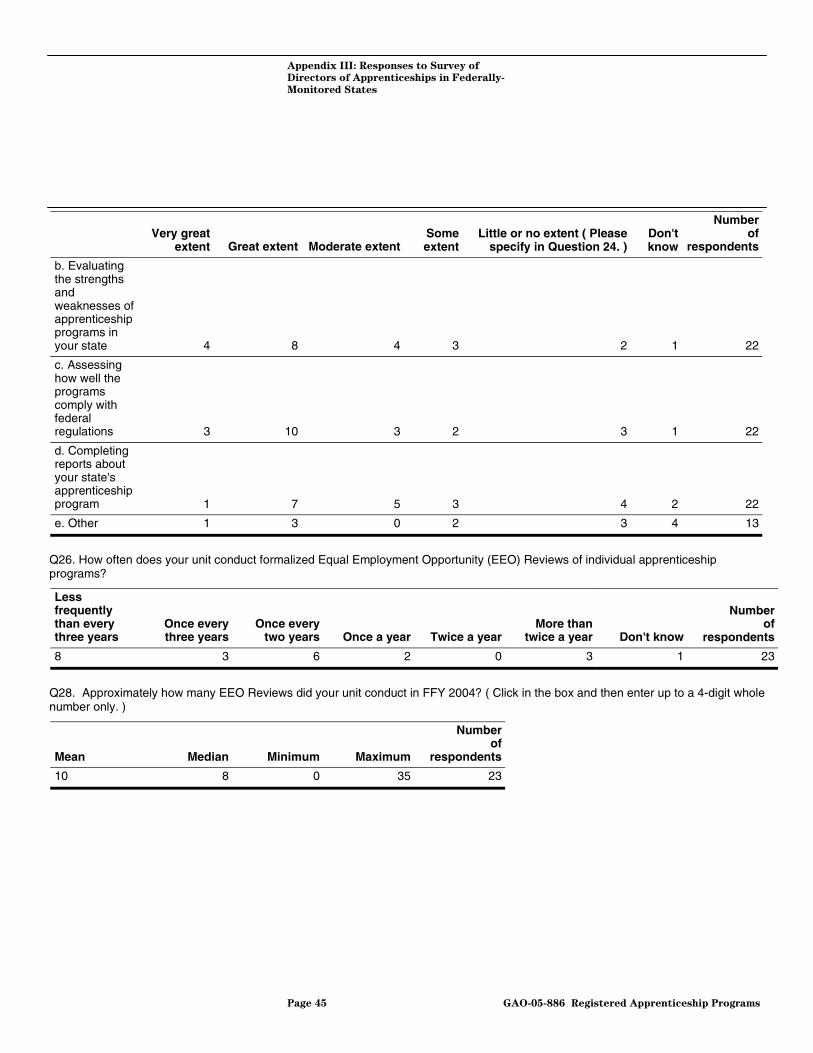
Appendix III: Responses to Survey of
Directors of Apprenticeships in Federally-
Monitored States
Page 45 GAO-05-886 Registered Apprenticeship Programs
Very great
extent Great extent Moderate extentSome extent
Little or no extent ( Please specify in Question 24. )
Don't know
Numberof
respondents
b. Evaluating the strengths and weaknesses of apprenticeship programs in your state 4 8 4 3 2 1 22
c. Assessing how well the programs comply with federal regulations 3 10 3 2 3 1 22
d. Completing reports about your state's apprenticeship program 1 7 5 3 4 2 22
e. Other 1 3 0 2 3 4 13
Q26. How often does your unit conduct formalized Equal Employment Opportunity (EEO) Reviews of individual apprenticeship programs?
Less frequently than every three years
Once every three years
Once every two years Once a year Twice a year
More than twice a year Don't know
Numberof
respondents
8 3 6 2 0 3 1 23
Q28. Approximately how many EEO Reviews did your unit conduct in FFY 2004? ( Click in the box and then enter up to a 4-digit whole number only. )
Mean Median Minimum Maximum
Numberof
respondents
10 8 0 35 23

Appendix III: Responses to Survey of
Directors of Apprenticeships in Federally-
Monitored States
Page 46 GAO-05-886 Registered Apprenticeship Programs
Q29. To what extent, if at all, did your state find the FFY 2004 EEO Reviews useful for the following purposes?
Very great
extent Great extent Moderate
extent Some extent
Little or no extent ( Please
specify in Question 31. ) Don't know
Numberof
respondents
a. Making informed decisions about the administration and operation of apprenticeship programs in your state 4 9 3 3 2 1 22
b. Evaluating the strengths and weaknesses of apprenticeship programs in your state 6 10 2 2 1 1 22
c. Assessing how well the programs comply with federal regulations 7 8 4 2 0 1 22
d. Completing reports about the state's apprenticeship programs 1 8 7 2 2 2 22
e. Other 3 0 0 1 2 5 11
Q33. Did your state have procedures or policies for recording complaints filed in FFY 2004 that were elevated to the level of the state or regional OATELS office?
Yes No Don't know
Numberof
respondents
18 3 1 22
Q34a1. In your state, how many total complaints were referred to state officials in FFY 2004?
Mean Median Minimum Maximum
Numberof
respondents
2 1 0 10 18

Appendix III: Responses to Survey of
Directors of Apprenticeships in Federally-
Monitored States
Page 47 GAO-05-886 Registered Apprenticeship Programs
Q34a2. Check if actual, estimate, or do not know or cannot estimate
Count
Number of
respondents
Check here if actual 12 19
Check here if estimate 7 19
Check here if do not know or cannot estimate 0 19
Q34b1. How many complaints concerned termination in FFY 2004?
Mean Median Minimum Maximum
Numberof
respondents
1 0 0 8 18
Q34b2. Check if actual, estimate, or do not know or cannot estimate
Count
Number of
respondents
Check here if actual 12 18
Check here if estimate 6 18
Check here if do not know or cannot estimate 0 18
Q34c1. How many complaints concerned discrimination in FFY 2004?
Mean Median Minimum Maximum
Numberof
respondents
0 0 0 5 18
Q34c2. Check if actual, estimate, or do not know or cannot estimate
Count
Number of
respondents
Check here if actual 13 18

Appendix III: Responses to Survey of
Directors of Apprenticeships in Federally-
Monitored States
Page 48 GAO-05-886 Registered Apprenticeship Programs
Count
Number of
respondents
Check here if estimate 5 18
Check here if do not know or cannot estimate 0 18
Q34d1. How many complaints concerned wages in FFY 2004?
Mean Median Minimum Maximum
Numberof
respondents
0 0 0 2 18
Q34d2. Check if actual, estimate, or do not know or cannot estimate
Count
Number of
respondents
Check here if actual 13 18
Check here if estimate 5 18
Check here if do not know or cannot estimate 0 18
Q34e1. How many complaints concerned related instruction in FFY 2004?
Mean Median Minimum Maximum
Numberof
respondents
0 0 0 3 18
Q34e2. Check if actual, estimate, or do not know or cannot estimate
Count
Number of
respondents
Check here if actual 13 18
Check here if estimate 5 18

Appendix III: Responses to Survey of
Directors of Apprenticeships in Federally-
Monitored States
Page 49 GAO-05-886 Registered Apprenticeship Programs
Count
Number of
respondents
Check here if do not know or cannot estimate 0 18
Q34f1. How many complaints concerned on-the-job training in FFY 2004?
Mean Median Minimum Maximum
Numberof
respondents
0 0 0 4 20
Q34f2. Check if actual, estimate, or do not know or cannot estimate
Count
Number of
respondents
Check here if actual 12 16
Check here if estimate 4 16
Check here if do not know or cannot estimate 0 16
Q34g1. How many complaints concerned other issues in FFY 2004?
Mean Median Minimum Maximum
Numberof
respondents
1 0 0 5 18
Q34g2. Check if actual, estimate, or do not know or cannot estimate
Count
Number of
respondents
Check here if actual 13 18
Check here if estimate 5 18
Check here if do not know or cannot estimate 0 18

Appendix III: Responses to Survey of
Directors of Apprenticeships in Federally-
Monitored States
Page 50 GAO-05-886 Registered Apprenticeship Programs
Q36. Which of the following were sources of data used to answer the prior questions about complaints regarding apprenticeship programs in FFY 2004?
Yes No Don't know
Numberof
respondents
Electronic statewide system 3 12 1 16
Centralized listing, log, or other paper compilation 6 10 1 17
Manual search of files 7 8 0 15
Other 3 2 1 6
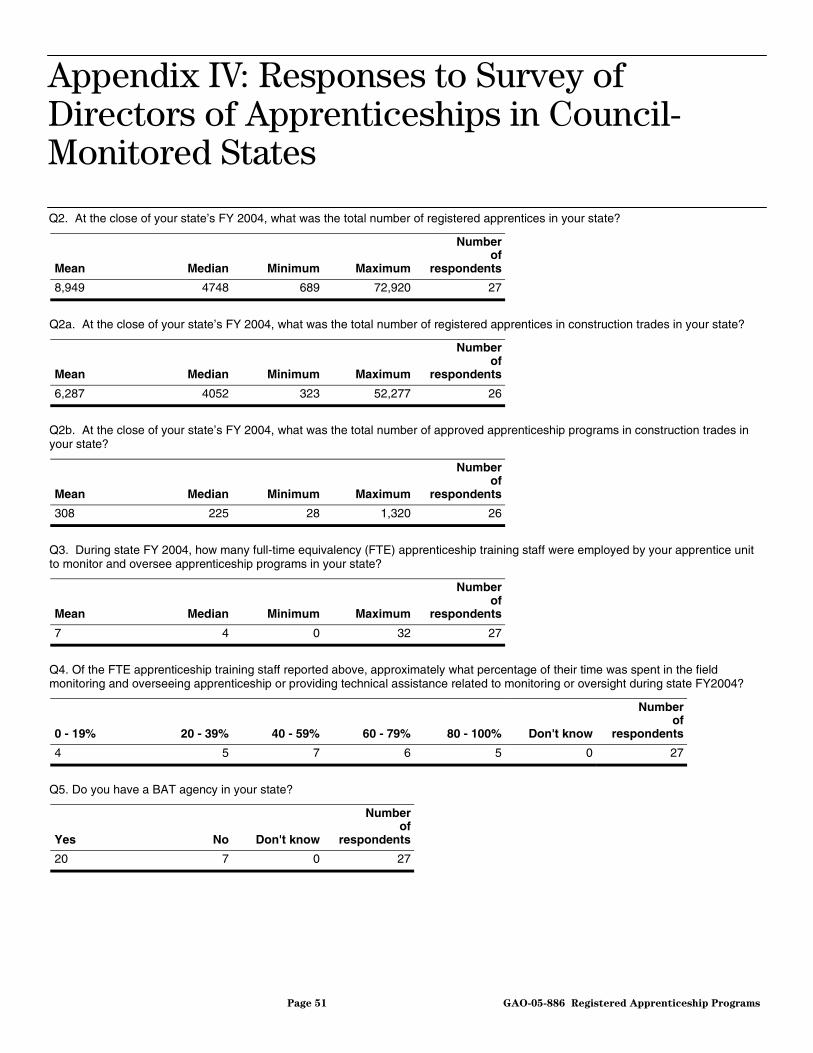
Appendix IV: Responses to Survey of
Directors of Apprenticeships in Council-
Monitored States
Page 51 GAO-05-886 Registered Apprenticeship Programs
Q2. At the close of your state’s FY 2004, what was the total number of registered apprentices in your state?
Mean Median Minimum Maximum
Numberof
respondents
8,949 4748 689 72,920 27
Q2a. At the close of your state’s FY 2004, what was the total number of registered apprentices in construction trades in your state?
Mean Median Minimum Maximum
Numberof
respondents
6,287 4052 323 52,277 26
Q2b. At the close of your state’s FY 2004, what was the total number of approved apprenticeship programs in construction trades in your state?
Mean Median Minimum Maximum
Numberof
respondents
308 225 28 1,320 26
Q3. During state FY 2004, how many full-time equivalency (FTE) apprenticeship training staff were employed by your apprentice unit to monitor and oversee apprenticeship programs in your state?
Mean Median Minimum Maximum
Numberof
respondents
7 4 0 32 27
Q4. Of the FTE apprenticeship training staff reported above, approximately what percentage of their time was spent in the field monitoring and overseeing apprenticeship or providing technical assistance related to monitoring or oversight during state FY2004?
0 - 19% 20 - 39% 40 - 59% 60 - 79% 80 - 100% Don't know
Numberof
respondents
4 5 7 6 5 0 27
Q5. Do you have a BAT agency in your state?
Yes No Don't know
Numberof
respondents
20 7 0 27
Appendix IV: Responses to Survey of Directors of Apprenticeships in Council-Monitored States

Appendix IV: Responses to Survey of
Directors of Apprenticeships in Council-
Monitored States
Page 52 GAO-05-886 Registered Apprenticeship Programs
Q6. During state FY 2004, how many full-time equivalency (FTE) apprenticeship training staff were employed by the BAT agency in your state to monitor and oversee apprenticeship programs in your state?
Mean Median Minimum Maximum
Numberof
respondents
2 1 0 10 19
Q8. How often does your OATELS conduct SAC 29/29 Review (Review of Labor Standards for Registration of Apprenticeship Programs) in your state?
Less frequently than every three years
Once every three years
Once every two years Once a year Twice a year
More than twice a year Don't know
Numberof
respondents
12 5 3 2 0 0 5 27
Q10. To what extent did your state find OATELS’ most recent SAC 29/29 Review (Review of Labor Standards for Registration of Apprenticeship Programs) useful for the following purposes in your state?
Very great
extent Great extent Moderate
extent Some extentLittle or no
extent Don't know
Numberof
respondents
a. Making informed decisions about the administration and operation of apprenticeship programs 2 3 5 4 6 7 27
b. Evaluating the strengths and weaknesses of apprenticeship programs in your state 2 4 2 5 7 7 27
c. Assessing how well the programs comply with federal regulations 3 6 2 3 6 7 27
d. Completing reports about your state's apprenticeship program 1 1 3 6 8 8 27
e. Other 2 0 1 1 1 9 14

Appendix IV: Responses to Survey of
Directors of Apprenticeships in Council-
Monitored States
Page 53 GAO-05-886 Registered Apprenticeship Programs
Q15. How often does OATELS conduct SAC 29/30 Review (Review of Equal Employment Opportunity in Apprenticeship and Training) in your state?
Less frequently than every three years
Once every three years
Once every two years Once a year Twice a year
More than twice a year Don't know
Numberof
respondents
12 5 3 2 0 0 5 27
Q17. To what extent, if at all, did your state find OATELS’ most recent SAC 29/30 Review (Equal Employment Opportunity in Apprenticeship and Training) useful for the following purposes?
Very great
extent Great extent Moderate
extent Some extentLittle or no
extent Don't know
Numberof
respondents
a. Making informed decisions about the administration and operation of apprenticeship programs 2 2 6 3 5 9 27
b. Evaluating the strengths and weaknesses of apprenticeship programs in your state 1 3 5 4 5 9 27
c. Assessing how well the programs comply with federal regulations 2 6 4 2 4 9 27
d. Completing reports about your state's apprenticeship program 1 0 5 6 5 10 27
e. Other 1 0 0 1 2 4 8
Q21. Does your state presently use OATELS’ Registered Apprenticeship Information System (RAIS) to register apprentices and to track apprentice and program information?
Yes No
Number of
respondents
6 21 27

Appendix IV: Responses to Survey of
Directors of Apprenticeships in Council-
Monitored States
Page 54 GAO-05-886 Registered Apprenticeship Programs
Q23. Does you state plan or intend to use RAIS to register apprentices and track apprenticeship and program information in the future ?
Yes No Don't know
Numberof
respondents
7 12 5 24
Q26. Did your state use the WIA Governor’s 15% State Set-Aside funds to support new and/or established apprenticeship programs in state FY 2004?
Yes No Don't know
Numberof
respondents
7 20 0 27
Q27. Were WIA State Set-Aside funds used to support new and/or established apprenticeship programs in your state in state FY 2004 to do any of the following?
Yes, new apprenticeship
programs
Yes, established apprenticeship
programs No Don't know
Number of
respondents
a. To provide related instruction or other education that satisfied specific apprenticeship requirements 4 1 2 0 7
b. To provide on-the-job training 2 1 3 0 6
c. To disseminate information about apprenticeship programs 4 0 3 0 7
d. To encourage entities to sponsor and register additional or new programs 2 1 3 0 6
e. Other 2 2 1 0 5

Appendix IV: Responses to Survey of
Directors of Apprenticeships in Council-
Monitored States
Page 55 GAO-05-886 Registered Apprenticeship Programs
Q29. For which of the following reasons did your state not use WIA Set-Aside Funds to support apprenticeship programs in state FY 2004?
Yes No Don't know
Numberof
respondents
a. Decision-makers gave priority to other programs. 10 5 7 22
b. Decision-makers did not believe funds could be used to support new apprenticeship programs. 8 4 10 22
c. Decision-makers did not believe funds could be used to support established apprenticeship programs. 8 4 10 22
d. Decision-makers did not believe funds could be used to provide related instruction or other education that satisfied specific apprenticeship requirements. 5 5 12 22
e. Decision-makers did not believe funds could be used to provide on-the-job training. 4 7 11 22
f. Decision-makers did not believe funds could be used to disseminate information about apprenticeship programs. 3 6 13 22
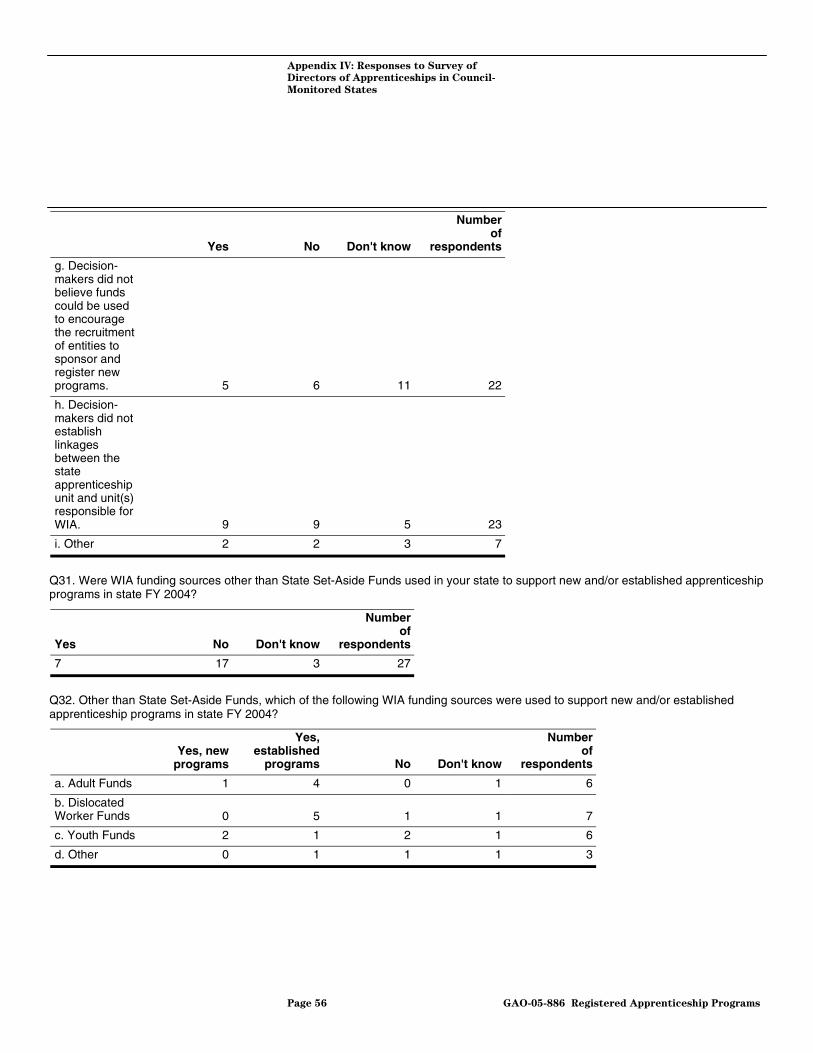
Appendix IV: Responses to Survey of
Directors of Apprenticeships in Council-
Monitored States
Page 56 GAO-05-886 Registered Apprenticeship Programs
Yes No Don't know
Numberof
respondents
g. Decision-makers did not believe funds could be used to encourage the recruitment of entities to sponsor and register new programs. 5 6 11 22
h. Decision-makers did not establish linkages between the state apprenticeship unit and unit(s) responsible for WIA. 9 9 5 23
i. Other 2 2 3 7
Q31. Were WIA funding sources other than State Set-Aside Funds used in your state to support new and/or established apprenticeship programs in state FY 2004?
Yes No Don't know
Numberof
respondents
7 17 3 27
Q32. Other than State Set-Aside Funds, which of the following WIA funding sources were used to support new and/or established apprenticeship programs in state FY 2004?
Yes, new
programs
Yes, established
programs No Don't know
Number of
respondents
a. Adult Funds 1 4 0 1 6
b. Dislocated Worker Funds 0 5 1 1 7
c. Youth Funds 2 1 2 1 6
d. Other 0 1 1 1 3

Appendix IV: Responses to Survey of
Directors of Apprenticeships in Council-
Monitored States
Page 57 GAO-05-886 Registered Apprenticeship Programs
Q34. Did your state establish linkages between WIA and the state apprenticeship unit in state FY 2004 for any of the following purposes?
Yes No Don't know
Numberof
respondents
a. Shared decision making 7 17 2 26
b. Shared information gathering 15 10 1 26
c. Shared information dissemination, including presentations 14 13 0 27
d. Shared use of educational programs that satisfy specific apprenticeship requirements 6 17 3 26
e. Shared grant development activities 5 18 3 26
f. Other 1 4 1 6
Q37. Did your state have a mechanism for conducting formalized reviews of apprenticeship programs that address on-the-job training, related instruction, and/or program operations in state FY 2004?
Yes No Don't know
Numberof
respondents
25 0 0 25
Q38. Which of the following components -- on-the-job training, related instruction, and/or program operations -- were included in these reviews?
Yes No Don't know
Numberof
respondents
a. Currency of on-the-job training with acceptable industry practice 22 3 0 25
b. Relative continuity of employment for on-the-job training 25 0 0 25

Appendix IV: Responses to Survey of
Directors of Apprenticeships in Council-
Monitored States
Page 58 GAO-05-886 Registered Apprenticeship Programs
Yes No Don't know
Numberof
respondents
c. Provision of on-the-job training in all aspects of trades 25 0 0 25
d. Consistency with standards for related instructions 25 0 0 25
e. Currency of related instruction with acceptable industry practice 21 3 1 25
f. Appropriateness of wages to actual hours of related instruction and on-the-job training 24 1 0 25
g. Establishment of criteria or guidelines for instructors 14 11 0 25
h. Completion rates 23 2 0 25
i. Cancellation rates 22 2 1 25
j. Relative amount of time taken by apprentices to complete programs relative to time required for program 18 7 0 25
k. Maintenance of required records 25 0 0 25
l. Other 1 1 1 3
Q40. How often does your state conduct formalized reviews of individual apprenticeship programs that address on-the-job training, related instruction, and/or program operations?
Less frequently than every three years
Once every three years
Once every two years Once a year Twice a year
More than twice a year Don't know
Numberof
respondents
4 1 10 7 2 3 0 27

Appendix IV: Responses to Survey of
Directors of Apprenticeships in Council-
Monitored States
Page 59 GAO-05-886 Registered Apprenticeship Programs
Q42. Does your state have a mechanism for conducting formalized Equal Employment Opportunity (EEO) reviews of individual apprenticeship programs?
Yes No Don't know
Numberof
respondents
24 3 0 27
Q43. How often does your state conduct formalized Equal Employment Opportunity (EEO) reviews of individual apprenticeship programs?
Less frequently than every three years
Once every three years
Once every two years Once a year Twice a year
More than twice a year Don't know
Numberof
respondents
2 3 8 11 0 0 0 24
Q45. Did your state have procedures or policies for recording complaints filed in state FY 2004 that were elevated to the level of state apprenticeship agencies?
Yes No Don't know
Numberof
respondents
22 3 1 26
Q46a1. In your state, how many total complaints were referred to state officials in state FY 2004?
Mean Median Minimum Maximum
Numberof
respondents
46 1 0 699 20
Q46a2. Check if actual, estimate, or do not know or cannot estimate
Count
Number of
respondents
Check here if actual 15 22
Check here if estimate 5 22
Check here if do not know or cannot estimate 2 22

Appendix IV: Responses to Survey of
Directors of Apprenticeships in Council-
Monitored States
Page 60 GAO-05-886 Registered Apprenticeship Programs
Q46b1. How many complaints concerned termination in state FY 2004?
Mean Median Minimum Maximum
Numberof
respondents
10 1 0 100 20
Q46b2. Check if actual, estimate, or do not know or cannot estimate
Count
Number of
respondents
Check here if actual 16 22
Check here if estimate 3 22
Check here if do not know or cannot estimate 3 22
Q46c1. How many complaints concerned discrimination in state FY 2004?
Mean Median Minimum Maximum
Numberof
respondents
0 0 0 2 20
Q46c2. Check if actual, estimate, or do not know or cannot estimate
Count
Number of
respondents
Check here if actual 17 21
Check here if estimate 1 21
Check here if do not know or cannot estimate 3 21
Q46d1. How many complaints concerned wages in state FY 2004?
Mean Median Minimum Maximum
Numberof
respondents
2 0 0 25 20

Appendix IV: Responses to Survey of
Directors of Apprenticeships in Council-
Monitored States
Page 61 GAO-05-886 Registered Apprenticeship Programs
Q46d2. Check if actual, estimate, or do not know or cannot estimate
Count
Number of
respondents
Check here if actual 15 22
Check here if estimate 4 22
Check here if do not know or cannot estimate 3 22
Q46e1. How many complaints concerned related instruction in state FY 2004?
Mean Median Minimum Maximum
Numberof
respondents
1 0 0 5 21
Q46e2. Check if actual, estimate, or do not know or cannot estimate
Count
Number of
respondents
Check here if actual 16 21
Check here if estimate 4 21
Check here if do not know or cannot estimate 1 21
Q46f1. How many complaints concerned on-the-job training in state FY 2004?
Mean Median Minimum Maximum
Numberof
respondents
1 0 0 9 23
Q46f2. Check if actual, estimate, or do not know or cannot estimate
Count
Number of
respondents
Check here if actual 17 22

Appendix IV: Responses to Survey of
Directors of Apprenticeships in Council-
Monitored States
Page 62 GAO-05-886 Registered Apprenticeship Programs
Count
Number of
respondents
Check here if estimate 4 22
Check here if do not know or cannot estimate 1 22
Q46g1. How many complaints concerned other issues in state FY 2004?
Mean Median Minimum Maximum
Numberof
respondents
37 0 0 664 19
Q46g2. Check if actual, estimate, or do not know or cannot estimate
Count
Number of
respondents
Check here if actual 16 20
Check here if estimate 2 20
Check here if do not know or cannot estimate 2 20
Q48. Which of the following were sources of data used to answer the prior questions about complaints regarding apprenticeship programs in the construction trade in state FY 2004?
Yes No Don't know
Numberof
respondents
a. Electronic statewide system 5 6 1 12
b. Centralized listing, log, or other paper compilation 8 5 1 14
c. Manual search of files 11 4 1 16
d. Other 3 1 0 4
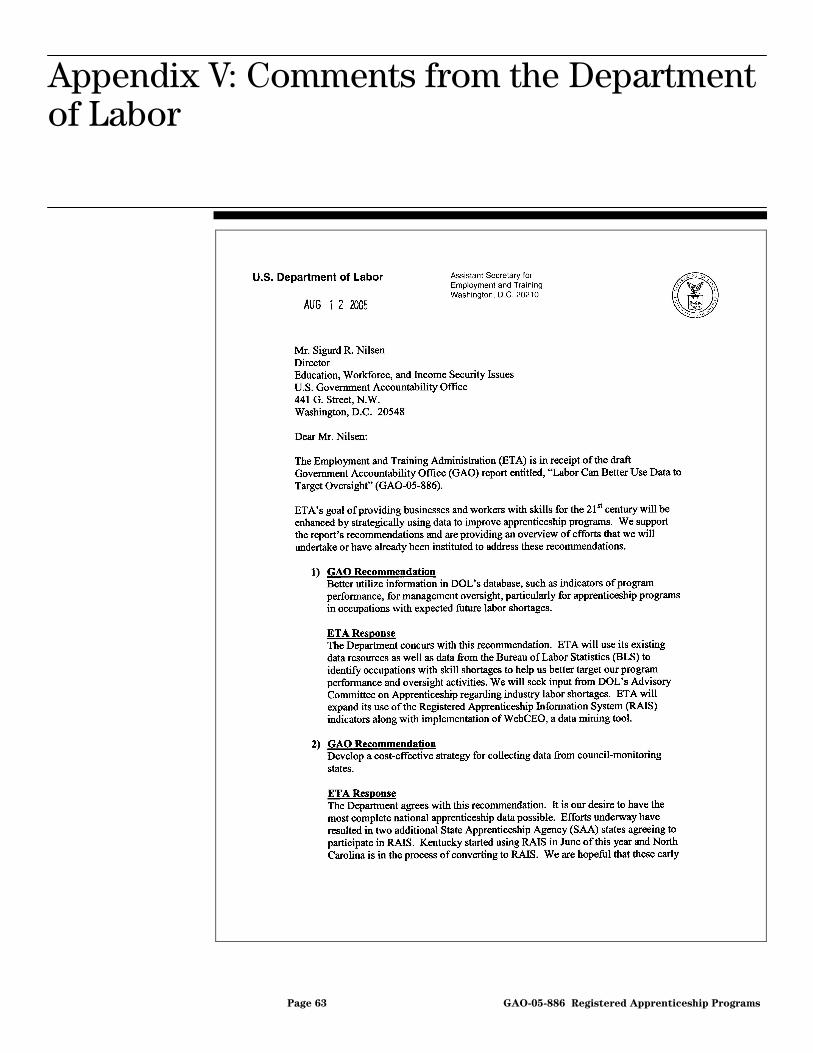
Appendix V: Comments from the Department of Labor
Page 63 GAO-05-886 Registered Apprenticeship Programs
Appendix V: Comments from the Department of Labor

Appendix V: Comments from the Department of Labor
Page 64 GAO-05-886 Registered Apprenticeship Programs

Appendix VI: GAO Contact and Staff
Acknowledgments
Page 65 GAO-05-886 Registered Apprenticeship Programs
Sigurd R. Nilsen (202) 512-7215
Patrick DiBattista, Assistant Director, Scott Heacock, Linda W. Stokes, and Kathleen D. White managed all aspects of the assignment. The following individuals made significant contributions to this report: Susan Bernstein, Jessica Botsford, Richard Burkard, Cathy Hurley, and Jean McSween.
Appendix VI: GAO Contact and Staff Acknowledgments
GAO Contact
Staff Acknowledgments

Page 66 GAO-05-886 Registered Apprenticeship Programs
Workforce Investment Act: Substantial Funds Are Used for Training, but
Little Is Known Nationally about Training Outcomes. GAO-05-650. Washington, D.C.: June 2005.
Public Community Colleges and Technical Schools: Most Schools Use
Both Credit and Noncredit Programs for Workforce Development.
GAO-05-4. Washington, D.C.: October 2004.
Registered Apprenticeships: Labor Could Do More to Expand to Other
Occupations. GAO-01-940. Washington, D.C.: September 2001.
Youth Training. PEMD-94-32R. Washington, D.C.: September 1994.
Apprenticeship Training: Administration, Use, and Equal Opportunity. HRD-92-43. Washington, D.C.: March 1992.
Related GAO Products
(130394)

The Government Accountability Office, the audit, evaluation and investigative arm of Congress, exists to support Congress in meeting its constitutional responsibilities and to help improve the performance and accountability of the federal government for the American people. GAO examines the use of public funds; evaluates federal programs and policies; and provides analyses, recommendations, and other assistance to help Congress make informed oversight, policy, and funding decisions. GAO’s commitment to good government is reflected in its core values of accountability, integrity, and reliability.
The fastest and easiest way to obtain copies of GAO documents at no cost is through GAO’s Web site (www.gao.gov). Each weekday, GAO posts newly released reports, testimony, and correspondence on its Web site. To have GAO e-mail you a list of newly posted products every afternoon, go to www.gao.gov and select “Subscribe to Updates.”
The first copy of each printed report is free. Additional copies are $2 each. A check or money order should be made out to the Superintendent of Documents. GAO also accepts VISA and Mastercard. Orders for 100 or more copies mailed to a single address are discounted 25 percent. Orders should be sent to:
U.S. Government Accountability Office 441 G Street NW, Room LM Washington, D.C. 20548
To order by Phone: Voice: (202) 512-6000 TDD: (202) 512-2537 Fax: (202) 512-6061
Contact:
Web site: www.gao.gov/fraudnet/fraudnet.htm E-mail: [email protected] Automated answering system: (800) 424-5454 or (202) 512-7470
Gloria Jarmon, Managing Director, [email protected] (202) 512-4400 U.S. Government Accountability Office, 441 G Street NW, Room 7125 Washington, D.C. 20548
Paul Anderson, Managing Director, [email protected] (202) 512-4800 U.S. Government Accountability Office, 441 G Street NW, Room 7149 Washington, D.C. 20548
GAO’s Mission
Obtaining Copies of GAO Reports and Testimony
Order by Mail or Phone
To Report Fraud, Waste, and Abuse in Federal Programs
Congressional Relations
Public Affairs
PRINTED ON RECYCLED PAPER