Embed Size (px)
Citation preview
DOE/SC-ARM-10-019
Ganges Valley Aerosol Experiment: Science and Operations Plan VR Kotamarthi, Argonne National Laboratory June 2010

DISCLAIMER
This report was prepared as an account of work sponsored by the U.S. Government. Neither the United States nor any agency thereof, nor any of their employees, makes any warranty, express or implied, or assumes any legal liability or responsibility for the accuracy, completeness, or usefulness of any information, apparatus, product, or process disclosed, or represents that its use would not infringe privately owned rights. Reference herein to any specific commercial product, process, or service by trade name, trademark, manufacturer, or otherwise, does not necessarily constitute or imply its endorsement, recommendation, or favoring by the U.S. Government or any agency thereof. The views and opinions of authors expressed herein do not necessarily state or reflect those of the U.S. Government or any agency thereof.
DOE/SC-ARM-10-019
Ganges Valley Aerosol Experiment: Science and Operations Plan VR Kotamarthi, Argonne National Laboratory June 2010 Work supported by the U.S. Department of Energy, Office of Science, Office of Biological and Environmental Research

VR Kotomarthi, June 2010, DOE/SC-ARM-10-019
iii
Abstract
The Ganges Valley region is one of the largest and most rapidly developing sections of the Indian subcontinent. The Ganges River, which provides the region with water needed for sustaining life, is fed primarily by snow and rainfall associated with Indian summer monsoons. Impacts of changes in precipitation patterns, temperature, and the flow of the snow-fed rivers can be immense. Recent satellite-based measurements have indicated that the upper Ganges Valley has some of the highest persistently observed aerosol optical depth values. The aerosol layer covers a vast region, extending across the Indo-Gangetic Plain to the Bay of Bengal during the winter and early spring of each year. The persistent winter fog in the region is already a cause of much concern, and several studies have been proposed to understand the economic, scientific, and societal dimensions of this problem. During the INDian Ocean EXperiment (INDOEX) field studies, aerosols from this region were shown to affect cloud formation and monsoon activity over the Indian Ocean. This is one of the few regions showing a trend toward increasing surface dimming and enhanced mid-tropospheric warming. Increasing air pollution over this region could modify the radiative balance through direct, indirect, and semi-indirect effects associated with aerosols. The consequences of aerosols and associated pollution for surface insolation over the Ganges Valley and monsoons, in particular, are not well understood.
The proposed field study is designed for use of (1) the ARM Mobile Facility (AMF) to measure relevant radiative, cloud, convection, and aerosol optical characteristics over mainland India during an extended period of 9–12 months and (2) the G-1 aircraft and surface sites to measure relevant aerosol chemical, physical, and optical characteristics in the Ganges Valley during a period of 6–12 weeks. The aerosols in this region have complex sources, including burning of coal, biomass, and biofuels; automobile emissions; and dust. The extended AMF deployment will enable measurements under different regimes of the climate and aerosol abundance—in the wet monsoon period with low aerosol loading; in the dry, hot summer with aerosols dispersed throughout the atmospheric column; and in the cool, dry winter with aerosols confined mostly to the boundary later and mid-troposphere. Each regime, in addition, has its own distinct radiative and atmospheric dynamic drivers. The aircraft operational phase will assist in characterizing the aerosols at times when they have been observed to be at the highest concentrations. A number of agencies in India will collaborate with the proposed field study and provide support in terms of planning, aircraft measurements, and surface sites. The high concentration of aerosols in the upper Ganges Valley, together with hypotheses involving several possible mechanisms with direct impacts on the hydrologic cycle of the region, gives us a unique opportunity to generate data sets that will be useful both in understanding the processes at work and in providing answers regarding the effects of aerosols on climate in a region where the perturbation is the highest.

VR Kotomarthi, June 2010, DOE/SC-ARM-10-019
iv
Contents
Abstract ........................................................................................................................................................ iii 1.0 Introduction .......................................................................................................................................... 1
2.0 Scientific Objectives ............................................................................................................................. 2
3.0 Relationship between Proposed Study and Ongoing Efforts in India: Context and Opportunities ...... 5
4.0 Support from Indian Agencies .............................................................................................................. 6
5.0 Proposed Project Plan ........................................................................................................................... 6
6.0 Outstanding Aerosol Issues .................................................................................................................. 8
6.1 Aerosol Sources............................................................................................................................ 9
6.2 Climate Impacts and Hypothesized Role of Aerosols ................................................................ 10
6.3 Secondary Organic Aerosols ...................................................................................................... 11
6.3.1 Sulfate Aerosol Formation/Nucleation Rates .................................................................. 12
6.3.2 Sulfate/Nitrate Ratios ...................................................................................................... 12
6.3.3 Black Carbon and Organic Carbon Emissions under Various Conditions. ..................... 12
7.0 Proposed Surface-Based Observations ............................................................................................... 13
7.1 Surface Measurement Benefits ................................................................................................... 13
7.2 AMF Measurements ................................................................................................................... 14
7.2.1 Energy Budget—AMF Instruments ................................................................................ 14
7.2.2 Aerosol Measurements—AMF Instruments ................................................................... 14
7.2.3 Cloud Properties—AMF Instruments ............................................................................. 16
7.2.4 Surface and Remote Sensing Meteorological Measurements – AMF Instruments ......... 16
7.3 Sites ............................................................................................................................................ 16
7.3.1 Nainital ............................................................................................................................ 16
7.3.2 Pantnagar ......................................................................................................................... 17
7.3.3 Lucknow .......................................................................................................................... 17
8.0 Aircraft Platforms Observations ......................................................................................................... 19
8.1 Gulfstream G-1 Operated by DOE ............................................................................................. 19
8.2 Beachcraft-20 Operated by Indian Institute of Science .............................................................. 22
9.0 Integrated Implementation Plan .......................................................................................................... 22
10.0 Modeling and Data Analysis .............................................................................................................. 25
11.0 Data Sharing and Archiving ............................................................................................................... 26
12.0 Additional Guest/Supporting Measurements by Host Institutes ......................................................... 27
12.1 Nainital Site at the Arybhatta Research Institute for Observational Sciences ........................... 27
12.2 Bangalore: Aerosol-Climate Observatory and Instrumentation at the Indian Institute of Science ....................................................................................................................................... 27
13.0 Science Management Plan .................................................................................................................. 28

VR Kotomarthi, June 2010, DOE/SC-ARM-10-019
v
14.0 Relevancy to DOE Long-Term Goals ................................................................................................ 29
15.0 References .......................................................................................................................................... 29
Figures
1 AERONET aerosol optical thickness measurements. ........................................................................... 12 Multiangle imaging spectroradiometer AOD values at mid visible wavelengths, averaged
over December–February of years 2001, 2002, 2003, and 2004 .......................................................... 23 Proposed and existing monitoring sites for aerosols in India under ISRO-GBP .................................. 54 AERONET data from Kanpur, 2005. ................................................................................................... 95 Left: Carbon emissions from coal usage in India ............................................................................... 106 Mean wind field at 850 mb and 300 mb from the National Centers for Environmental
Prediction data set, averaged for 1980 to 2006. .................................................................................. 107 Locations of the AMS data sets .......................................................................................................... 128 Circularly polarized light, cross-polarized light, and ratio from two days at the ARM
Southern Great Plains site ................................................................................................................... 159 AOD measured over Nainital, separated into forenoon and afternoon bins, with the
difference D between the two ............................................................................................................. 1810 Proposed sites for surface stations in the Ganges Valley .................................................................... 1811 The G-1 instrument layout. ................................................................................................................. 2012 The yellow tab is Lucknow, the likely base for G-1 ........................................................................... 2113 Proposed flight path for the flight path shown in the middle of Figure 12. ........................................ 2114 Proposed flight plan for the IISc/ISRO Beachcraft-20 operations. ..................................................... 2215 Conceptual diagram of the proposed field study ................................................................................ 2416. Timeline for the GVAX field experiment. .......................................................................................... 24
Tables
1 Ongoing and planned climate and aerosol-related measurement activities in India ............................. 8

VR Kotomarthi, June 2010, DOE/SC-ARM-10-019
1
1.0 Introduction
The impact of aerosols on climate is highly uncertain, according to the latest assessment of the Intergovernmental Panel on Climate Change (IPCC), AR-4. Although aerosols affect the global energy budget, they also have strong regional distributions and impacts. An evaluation of surface measurements from approximately 700 AErosol Robotic NETwork (AERONET) sites worldwide operated by the National Aeronautics and Space Administration (NASA) indicated that the regional nature of the aerosol distribution (Figure 1) is highest in the southern portions of the Western and Northern hemispheres, specifically in the southwestern United States and Mexico and in the southern and southeastern portions of the tropical and subtropical eastern Northern Hemisphere—including India and China.
Figure 1. AERONET aerosol optical thickness (AOT) measurements. The ordinate shows longitude
bins of 30 degrees from 180 W to 180 E. The y-axis shows AOT for each 10-degree latitude band on a logarithmic scale from 001 to 10, from the equator to 90 N. The longitude bands are 30 degrees wide.
In the subtropical eastern Northern Hemisphere, the upper Ganges Valley has some of the highest persistently observed aerosol optical density (AOD) values in the Multi-Angle Imaging Spectroradiometer (MISR) global data set (Di Girolamo et al. 2004, Figure 2). This region is also home to about 700 million people and accounts for about 20% of the Indian gross domestic product. It houses heavy industry such as steel, cement, and power plants and is one of the most ancient continuously farmed regions of the world. The observed aerosol layer covers a vast region, extending across the Indo-Gangetic Plain to the Bay of Bengal during the winter and early spring of each year. The AOD shows variability within the region and is highest in the sub Himalayan regions of eastern India. The aerosols are composed mostly of anthropogenic pollution particles and are high in sulfate, nitrate, organic, and black carbon (BC) contents (Singh et al. 2004, Tripathi et al. 2005, Dey and Tripathi 2007). The aerosols may also include mineral dust from the Thar Desert (Chinnam et al. 2006).

VR Kotomarthi, June 2010, DOE/SC-ARM-10-019
2
Figure 2. Multiangle imaging spectroradiometer AOD values at mid visible wavelengths (558 nm),
averaged over December–February of years 2001, 2002, 2003, and 2004 (from Di Girolamo et al. 2004).
The consequences of these aerosols and associated pollution for surface insolation over the Ganges Valley—and particularly for monsoons—are not well understood. During the INDOEX field studies (Ramanathan et al. 2002, Ramanathan et al. 2005), aerosols from the Ganges Valley were shown to affect cloud formation and monsoon activity over the Indian Ocean. Doubling of the concentration of the major greenhouse gas CO2 is expected to result in increasing temperatures over the land of the subcontinent and into the mid-troposphere (Kothwale and Rupa Kumar 2002). This effect could be expected to intensify the summer pressure gradient differential between the land and ocean and thus strengthen the Indian summer monsoon (ISM) (Hu et al. 2000). Several recent studies that include aerosols and greenhouse gases have shown an equally likely possibility that precipitation could be much lower than the range observed during the Halocene because of changes in orbital parameters. Abrupt changes of this type can result from a bifurcation in the response of precipitation to planetary albedo changes (Zickfield et al. 2005). Raising further concern, a recent study showed that the measured surface insolation over India decreased by 4% between 1980 and 2000. This surface dimming seems to have been accompanied by warming of the atmosphere. At the same time, over the Indian Ocean, the lower atmospheric solar heating has increased by about 50% because of the brown cloud (Ramnathan et al. 2007). This is expected to make the atmosphere more stable over the ocean and thus reduce convective mixing. Increasing air pollution can thus modify the radiative balance through (1) increased backscattering from anthropogenic aerosols such as sulfates and nitrates; (2) localized heating of the cloud air mass due to increasing concentrations of BC, thus leading to droplet evaporation; (3) changes in the size of cloud droplets due to increasing aerosols in the atmospheric column; and (4) altered precipitation due to changes in aerosol sizes.
2.0 Scientific Objectives
The AMF/G-1 deployment will bring an entire suite of instruments for measuring physical, chemical, and optical characteristics of aerosols. Included will be capabilities for measuring aerosols’ atmospheric profiles and spatial extents, as well as for probing the planetary boundary layer (PBL), the mid-

VR Kotomarthi, June 2010, DOE/SC-ARM-10-019
3
troposphere, radiative balance, and cloud properties. The proposed study seeks to answer the following questions:
1. What effect do increasing aerosols in the Ganges Valley have on the ISM?
a. Does the increase in mid-tropospheric aerosols act as a heat pump and drive moist air over from the Indian Ocean to the northern parts of India and Tibet, thus extending the monsoons and causing earlier onset?
b. Does the increase in mid-tropospheric aerosol cause increasing cloud heating rates and lead to evaporation of clouds and decreased rainfall?
c. What are the vertical profiles of the chemical, physical, and optical characteristics of the aerosols that cause one of the above to be true?
With the AMF, we will be in a position to make continuous, extended estimates of heating rates within cloud over continental India by measuring cloud properties, drop sizes, and liquid water content and making complete radiative balance measurements of clouds. Coupling these estimates with measurements of in situ cloud properties and aerosol measurements made from the G-1, as well as ongoing Indian activities (Aerosol Radiative Forcing over India [ARFI]) to obtain a regional footprint, we will be able to estimate heating rates within clouds over an extended period of time over the region. This will be the first such effort to synthesize the various measurements into a combined data product over this region. The results will be available for model validation and evaluating current cloud level aerosol heating hypotheses and would provide data from the region for evaluating the Ramanathan et al. (2007) measurements made by using unmanned aerial vehicles.
2. What effect does the diurnal PBL cycle in the Ganges Valley have on the atmospheric distribution of aerosols? a. Does the diurnal cycle in the PBL transport smaller and radiatively more active particles for
mixing into the mid troposphere and regional-scale transport? b. Does the diurnal mixing of aerosols in the atmospheric column have an impact on measured
cloud properties?
Satellite-based measurements show high concentrations of aerosols (measured as AOD) over the Ganges Valley. However, little is known about the vertical structure of the distribution of aerosols and the fraction of the aerosols available for regional- and global-scale transport. The AMF is uniquely positioned to make continuous, high-frequency measurements through the atmospheric column, and our site selection is nearly ideal for achieving this goal. The G-1 will add the additional capability of generating in situ measurements and vertical profiles within the PBL and above, to generate estimates of the amounts of aerosols that are transported into the mid troposphere and to regional scales.
3. What effect do aerosols have on deep convective activity over the northern plains and the Ganges Valley region, and how does this affect cloud formation? a. What effect do the changes in heating rates in the PBL have on convection?
b. Does the PBL have a “lifted” profile as a result of aerosol heating, as proposed during the INDOEX studies?
c. What effect does the additional heating have on convective available potential energy (CAPE) in the PBL?
d. What is the CAPE at cloud level as compared to the PBL?

VR Kotomarthi, June 2010, DOE/SC-ARM-10-019
4
The uncertainty in parameterization of deep convective activity in climate models has a profound impact on the calculated climate sensitivity to rising CO2. Deep convective activity is common during much of the summer; the initial onset of monsoon over the southern tip of India is initiated by land-sea circulation and then enhanced and driven by deep convective activity over the northern Indian plains. This study will provide an opportunity to measure the influence of aerosols on deep convection. This highly complex, little understood problem in modeling deep convection is complementary to the elevated heat pump hypothesis. Measurement of aerosols from surface supersites to identify their chemical and physical characteristics will provide key constraints to the estimates of radiative forcing heating rates from these aerosols in the PBL.
The proposed joint activity with Indian scientists and organizations will greatly enhance our capability to achieve this objective by making available data from the Indian Space Research Organization (ISRO) Geosphere Biosphere Programme (GBP) network operated by Indian collaborators, where additional radiosonde ascents will be launched in coordination with the AMF radiosonde launches to give a larger footprint. In addition to the usual datastreams, a synthesized data set will be developed to greatly enhance the utility of the measurements for validation of convective activity over the Indian subcontinent.
4. What are the sources and sinks of the aerosols constituting the aerosol plume over continental India, and what effects does the plume have on clear-sky radiation fields, as well as on cloud microphysical and macrophysical properties?
a. What fraction of the aerosol is derived from biomass burning?
b. What fraction of the measured aerosol mass is secondary organic aerosol?
c. What is the chemical composition of the aerosols in the mid troposphere and hence available for regional transport?
Recent studies indicate that nearly 50–90% of the measured black carbon aerosols that give rise to brown clouds over the Indian Ocean are from biomass burning (residential cooking and agricultural burning), but little quantitative information is available regarding how properties of these aerosols—such as light scattering and absorption and droplet nucleating properties—evolve as a function of time. The time evolution of such properties will be studied by using the G-1 aircraft to examine the properties of aerosols and trace gases from various source types as these emissions age and mix with the ambient atmosphere. Key issues include the following: What is the rate of accumulation of organic aerosol mass? Is this consistent with rates derived from other studies? Is the dramatic increase in the aerosol-specific absorption observed, for example, in Mexico City, also observed with the mix of pollutants present over the Indian subcontinent?
By combining AMF surface-based measurements and remote sensing capabilities with G-1 measurements of mid-tropospheric aerosol chemical and physical compositions, the proposed study will develop a comprehensive data set—extending from pre-monsoon to post-monsoon—that can be used to constrain convection, cloud properties, and aerosols. This data set will establish a baseline and improve evaluation of the potential effects of increasing regional-scale atmospheric pollution on the ISM and consequently on the hydrology of the climatologically sensitive Ganges Valley.
In addition, the proposed study will serve as the focal point for leveraging infrastructure and complementary efforts by other groups, discussed in Sections 3 and 4. The result will be a greater completeness of aggregated data, thereby accelerating improved characterization of aerosols and radiation.

VR Kotomarthi, June 2010, DOE/SC-ARM-10-019
5
3.0 Relationship between Proposed Study and Ongoing Efforts in India: Context and Opportunities
Three programs are under way in India that are complementary to our proposed study. First, ISRO has undertaken a well-focused activity with long-term objectives for characterizing aerosol properties over Indian regions with a long-term, dedicated instrumented network, under the GBP. The network currently has about 12 stations making regular measurements of spectral AOD through use of ISRO’s instruments (multiwavelength solar radiometer, or MWR), surface aerosol concentrations and size distributions, and BC aerosols. In addition, several light detection and ranging (lidar) units operating from distinct locations provide information on the altitude profiles of aerosols. Figure 3 shows the spatial coverage of network stations under ISRO-GBP, with the red circles indicating places where ISRO-GBP has operational stations at present or will be installing them shortly. In the Ganga basin, observations have been available at Kanpur, Dehradun, and Kharagpur; new stations have been operational in Jodhpur, Nagpur, and Varanasi since 2008. This is an ongoing activity. Dr. K. Krishnamoorthy is a project director, Dr. S.K. Satheesh is a principal investigator (PI), and Dr. C.B.S. Dutt manages the program. More than a dozen stations have now been established as AERONET stations. Along with a few additional sites near New Delhi, these stations form an extensive ground-based observational network that follows NASA data quality and data collection protocols.
TVM MCY
PBR CBE
BLR
ATP GOA
HYD VSKA
PUN
AMD
JDR KNP
DBRN
DDN NTL
KLUPUN
PTL
NGP
BBR
KGP
NARLP
SNGP
KPM
Figure 3. Proposed and existing monitoring sites for aerosols in India under ISRO-GBP. More than a
dozen sites at some of these locations are part of the NASA AERONET ground-based aerosol observational network.
Second, a new field study in 2008–2011, sponsored by the Indian Climate Research Program, will evaluate the effect of the continental tropical convergence zone (CTCZ) on the ISM. The large-scale rainfall over the Indian region during the summer monsoon is associated with a zone characterized by

VR Kotomarthi, June 2010, DOE/SC-ARM-10-019
6
intense convergence in the boundary layer, cyclonic vorticity above the boundary layer, and deep moist convection. This convergence zone is termed continental (CTCZ) to distinguish it from the more common intertropical convergence zone (ITCZ) seen over tropical oceans. The main objective of the CTCZ study is to understand the mechanisms leading to space-time variation in the CTCZ during the summer monsoon. The CTCZ project (with 29 surface observatories and aircraft measurements) is supported by ISRO-GBP and sponsored primarily by the Department of Science and Technology (DST). The field study will employ ships, aircraft, and ground observations to develop a more complete understanding of the role of the ITCZ on the Indian monsoon.
Third, ISRO has recently initiated a large field study to coincide with the Ganges Valley Aerosol Experiment (GVAX) time period. The project, known as RAWEX (Regional Atmospheric Warming Experiment), will operate during the pre-monsoon periods of 2010, 2011, and 2012 to coincide with GVAX operations. This study will use ground-based observations, airborne observations, ship-based observations, and satellite data sets to generate a pre-monsoon heating profile for much of the Ganges Valley.
4.0 Support from Indian Agencies
Guest and supporting measurements from Indian scientists are expected to augment the proposed project. The primary agencies supporting climate research in India—ISRO, DST, the Earth System Ministry, and the Indian Institute of Science, Bangalore—have all expressed support for the work. We have contacted technical representatives from these organizations and have discussed the project with them. The deployment, data collection, and reporting of the data from any guest instruments from these organizations will be supported by internal funding of the respective Indian agencies, at no cost to the ARM Climate Research Facility (ARM).
The following resources will be available from our Indian counterparts:
• Assistance in managing logistics and in-country handling of clearances and approvals as needed.
• Ground support for U.S. crew and scientists.
• Cooperative operation of additional ground stations, with full data sharing during the field study.
• A Beachcraft-20 aircraft modestly equipped with aerosol sampling instruments and lidar to support the AMF deployment. (The Beachcraft-20 has no capability for chemical characterization of aerosols, as the G-1 does.)
• Data archiving and sharing by the Indian participants, according to ARM data archiving and reporting requirements.
5.0 Proposed Project Plan
The AMF deployment is the most critical resource request in this proposal; it will ensure the achievement of many of our science objectives. A deployment starting in approximately April 2011 and lasting to April 2012 is anticipated for AMF ground operations. The start of the deployment will coincide with the increase in the concentration of dust and mineral aerosol and the beginning of the hot summer over the

VR Kotomarthi, June 2010, DOE/SC-ARM-10-019
7
plains of the Ganges basin. The onset of the monsoon in June coincides with high aerosol concentrations (primarily dust mixed with regional anthropogenic emissions). Aerosol concentrations were observed to be larger at the Kanpur AERONET site during this period. At the end of the monsoon period (September–October), the particle sizes of the aerosols decrease, and anthropogenic emissions from fossil fuel burning and biomass sources increase. This pattern continues from winter to early spring. Thus, deploying the AMF as an anchor facility in the context of other activities being conducted in India during the same period (as discussed above) over an annual cycle will enable us to measure different periods: the wet monsoon; the dry, hot summer; and the cool, dry winter.
The G-1 will enable chemical characterization and in situ measurements of aerosols and precursors and will establish the regional context for the study. The beginning of the intensive period coincides with the highest observed AOD in the region. An intensive period using the G-1 aircraft and additional surface monitoring sites is planned for a period of 8–12 weeks, starting in approximately January 2011 and lasting to the end of March 2011. The period from mid-March to April marks the beginning of increased convective activity, cloud formation, and the breakup of the thick aerosol layer, primarily because of vertical mixing. Thus, during the proposed deployment we will have an opportunity to measure different regimes of the climate: the late winter with high AOD, and the early spring with increasing convective activity, increasing vertical mixing, and higher mid-tropospheric aerosol concentrations. This will give us an opportunity to evaluate concentrations, composition, and potential contributions to local heating rates in the mid-troposphere due to the mixing of boundary layer aerosols.
Table 1 summarizes the ongoing and planned aerosol and climate-related activities in India, particularly those that coincide in time with the planned study.
• The field studies listed in Table 1 are managed by a variety of agencies in India and the U.S. The projects have wide-ranging objectives and goals, some of which overlap with the objectives of GVAX. An umbrella organization will need to be formed to facilitate data sharing and collaboration during the GVAX. The AMF deployment will provide the catalyst for organizing such an effort with the cooperation of collaborating PIs from Indian and their sponsoring agencies.
• The use of an aircraft platform requires approvals from the government in India at the highest levels and formal agreement to that effect with the U.S. Department of Energy (DOE). A bilateral agreement on Science and Technology signed by the United States and India in October 2005 established a framework for the exchange of ideas, information, skills, and technologies. Under the terms of this agreement, the United States and India will be able to advance scientific progress in clean energy research and development, the sharing of training facilities, and the exchange of materials and equipment. This agreement most likely will provide the framework for establishing the memorandum of understanding (MOU) for this project.

VR Kotomarthi, June 2010, DOE/SC-ARM-10-019
8
Table 1. Ongoing and planned climate and aerosol-related measurement activities in India. Dates for activities that overlap with this proposal in time of operation are highlighted in red. The yellow-highlighted dates signify possible overlap. The proposed activities are highlighted in green.
Campaign Sponsor Location When Focus CTCZ DST (India) Covers most of India
and surrounding oceans
2008–2011 Space-time variations of the continental tropical convergence zone
CAIPEX IMD (India) Covers the coastal areas of India with a leased C-130
2009–2010 Cloud seeding experiments
RAWEX ISRO (India) Ganges Valley region 2010–2012 Radiative transfer and aerosol vertical profiles
AERONET NASA About a dozen surface sites spread over India
Ongoing Aerosol optical depths and asymmetry factors
GBP ISRO (India) Over 30 surface sites spread over India
Ongoing Aerosol size, mass, and AOT
GVAX (AMF) DOE Nainital, Ganges Valley, India
April 2011–April 2012
Radiative transfer, clouds, and aerosols
GVAX (G-1) DOE Mid-Ganges Valley region
Jan. 2012–Mar. 2012
Chemical, physical, and optical characterization of aerosols, process studies
GVAX( Surface Sites) DOE Lucknow, Pantanagar Jan. 2012– Mar. 2012
Chemical, physical, and optical characterization of aerosols
6.0 Outstanding Aerosol Issues
Beyond the broad science questions in Section 2, process-specific questions arise about our current understanding of atmospheric aerosols and their role in climate change. A field campaign in the Ganges Valley provides an excellent opportunity to evaluate these processes in a region where aerosol formation, transport, and chemistry are potentially the most intense worldwide. The current process uncertainties discussed below can be resolved by a targeted intensive period using the G-1 aircraft platform as a part of the extended deployment of the AMF in this region.
An AERONET site has been operational in Kanpur (26.28 N, 80.24 E) for the past six years. Initial analysis of the data has already yielded interesting results. The measured AOD at this site shows large variability, with high values during much of the year and lower values during spring. The Angstrom coefficient has small values during the summer months and higher values during the winter and early spring (Figure 4). The low Angstrom values during the summer indicate larger particles (most likely desert dust), while the higher values during winter and early spring indicate an abundance of smaller particles, potentially of anthropogenic origin. The principal investigator (PI) of the AERONET project for NASA, Dr. Brent Holbern, will provide full support for this field study using the Kanpur and more recently established aerosol monitoring sites around India and Nepal.

VR Kotomarthi, June 2010, DOE/SC-ARM-10-019
9
Figure 4. AERONET data from Kanpur, 2005.
6.1 Aerosol Sources
The Ganges Valley is undergoing rapid industrialization. Coal remains the primary energy source for heavy industry. The region is dotted with large coal-based power generation facilities, cement factories, and steel mills, all using extensive amounts of coal (Figure 5). The long-range viability of the aerosol plume, and hence its regional and global impacts, are highly dependent on the vertical structure of the aerosol cloud. Climatologically, a high-pressure ridge over the wintertime Indo-Gangetic Plain confines the pollution to the PBL, creating the high concentrations. The synoptic regional wind is dominated by westerly flow (Figure 6). This flow pattern is the basis for suggestions that most of the dust observed in this region has its origin in the western Thar Desert of India and, beyond India’s national boundaries, in the Middle East (Mishra et al. 2008). The northwesterly flow pattern in the PBL over this region is marked by light winds. The primary sources of the aerosols are thought to be emissions from large coal-fired power plants, local and long-range-transported dust, and biofuels and biomass burning. The period during late December and early January marks the traditional planting of the year’s second crop in much of the Ganges Valley. This period is also associated with burning of agricultural waste from the previous harvest, which is a significant additional source of aerosols to the regional aerosol mix (Singh et al. 2006). The northwesterly winds at the 850 mb level indicate a potential for long-range transport of biomass burning plumes into the region of observed high aerosols (Figure 6). The measured aerosols thus constitute a mixture of dust, BC, secondary organic aerosols, and inorganic aerosols from industrial sources. Measuring aerosols during this time will be ideal for characterizing the anthropogenic component of the observed aerosols in the Ganges Valley and evaluating their impacts on regional and global scales. Recent studies have attempted to estimate the ratio of BC to organic carbon and also the ratios of sulfate to nitrate aerosols over this region, by using primarily AERONET data and similar measurements (Mishra et al. 2008).

VR Kotomarthi, June 2010, DOE/SC-ARM-10-019
10
Figure 5. Left: Carbon emissions from coal usage in India (based on data from CARMA [http://carma.org/]). The northern part of the country along the Ganges Valley shows a significant number of emission sources. Right: The increase in coal consumption in India in the recent past.
Figure 6. Mean wind field at 850 mb (left) and 300 mb (right) from the National Centers for
Environmental Prediction data set, averaged for 1980 to 2006.
6.2 Climate Impacts and Hypothesized Role of Aerosols
The effect of aged aerosols, potentially from this source region, on the hydrologic cycle was explored in the context of monsoons over the Indian Ocean during the INDOEX field study in 1998. The current analysis indicates contradictory effects of aerosols and greenhouse gases on monsoon-related rainfall over India (Chung and Ramanathan 2006). Aerosols alone have been shown to decrease temperature over portions of the Indian Ocean and thus reduce monsoon activity and related rainfall. However, increasing temperatures due to greenhouse gases might increase land-ocean temperature contrasts and hence

VR Kotomarthi, June 2010, DOE/SC-ARM-10-019
11
strengthen the monsoon circulation and precipitation. A recent analysis of monsoon rainfall patterns showed a trend of increasingly extreme rainfall events over the Indian subcontinent (Goswami et al. 2006).
Lau et al. (2006) recently proposed that an “elevated heat pump” effect could result from heating of the atmosphere due to accumulation of dust transported from the Indian western desert (Thar) over the upper Gangetic Plain, with subsequent mixing of aerosols with anthropogenically generated soot, sulfate, nitrate, and BC. This “elevated heat pump,” the authors suggest, could provide a diabatic heating source that leads to additional heating in the upper and middle atmosphere, as well as strengthening of the monsoon and additional rainfall. The near-source impacts on cloud generation and hydrologic cycles are relatively unknown, though high concentrations of fine aerosols were recently shown to decrease precipitation in hilly areas during the Chinese monsoon (Rosenfeld et al. 2007). The Total Ozone Mapping Spectrometer (TOMS) AOT data set has been used to demonstrate a warming in the mid-troposphere over the Tibetan plateau and the surrounding elevated regions of the Himalayas over the past few years (Gautam et al. 2009).
In order to resolve these issues, which are intimately related to the dynamics of the monsoons, cloud processes, and aerosols, a one-year deployment of the AMF with all its associated capabilities is anticipated. The AMF measurements—combined with the IGBP, AERONET data sets, and the field campaigns planned for this region and an intensive period using the G-1 aircraft platform for characterization of aerosol physical and chemical characteristics—would provide an extraordinary data set for addressing these issues.
6.3 Secondary Organic Aerosols
The formation, transport, and abundance of secondary organic aerosols and their role in changing atmospheric radiative balance and cloud processes are highly uncertain (IPCC, AR-4, Jacobson, 2002). The source of secondary organic aerosols is also uncertain (Jacobson 2002, Volkamer et al. 2006). A compilation of aerosol mass spectrometer (AMS) measurements (Zhang et al. 2007) of oxygenated fractions in organic aerosols shows wide variation, worldwide, in the abundance of the oxygenated fractions (Figure 7). The expected biospheric emissions and high concentrations of volatile organic compounds (VOCs) in the Ganges Valley should help evaluate the secondary organic aerosol formation mechanisms and rates proposed by Volkamer et al. (2006). Measurements performed in Mumbai on the western coast of India—away from the Ganges Valley—suggest organic carbon concentrations of about 30% in the total suspended particulates (Venkataraman et al. 2002). No equivalent numbers are available for measurements within the Ganges Valley plume.

VR Kotomarthi, June 2010, DOE/SC-ARM-10-019
12
Figure 7. Locations of the AMS data sets. The pie charts show the average mass concentration and
chemical composition of organic (green), sulfate (red), nitrate (blue), ammonium (orange), and chloride (purple).
6.3.1 Sulfate Aerosol Formation/Nucleation Rates
About 70% of the electric power produced in India is generated by coal-fired power plants. The sulfur content of Indian coal ranges from about 0.5% to very high values of 2–6%, depending on the region where the coal is mined (Acharya et al. 2005). Indian coal also has very high ash content. The particulate mass around power plants in India is typically dominated by fly ash. Sulfate emissions from biomass burning are thought to be very high; of the total sulfur emissions of 2 Tg/yr, approximately 0.5 Tg/yr is from this source (Venkataraman et al. 1999). Corresponding to the time of high use of biofuels and biomass burning in northern India, the period of the proposed field study offers an excellent opportunity to characterize the size of this source and evaluate sulfate formation rates in a heterogeneous environment with abundant opportunities to evaluate nucleation rates for sulfate formation in the presence of ash, BC, and fog.
6.3.2 Sulfate/Nitrate Ratios
Measurements over the Indian Ocean suggest a very high sulfate:nitrate ratio in the aerosol mass (Ball et al. 2003). Measurements near the urban center of Mumbai on the western coast showed sulfate:nitrate ratios of approximately 1:1 (Reddy et al. 2002), whereas modeled ratios of sulfate:nitrate ratios are approximately 10:1. The higher observed sulfate:nitrate ratios in the Ganges Valley are not yet fully explained.
6.3.3 Black Carbon and Organic Carbon Emissions under Various Conditions.
Very high BC emissions from India have been observed (Ramanathan et al. 2002). Researchers (Ramanathan et al. 2007, Menon et al. 2002) have suggested that the high BC emissions in the Ganges Valley might cause large-scale changes in local hydrology. Biofuels use was suggested as the primary

VR Kotomarthi, June 2010, DOE/SC-ARM-10-019
13
source of the BC aerosols. Characterization of the source signatures of these aerosols and their potential atmospheric lifetimes will enable estimation of their regional and global impacts. The winter campaign proposed here offers an excellent opportunity to evaluate the source-sink relationships for BC in the Ganges Valley and to make preliminary estimates of fluxes of BC aerosols into the regional and global background.
7.0 Proposed Surface-Based Observations
The proposed measurements are focused on generating a self-consistent data set of chemical, physical, and dynamic properties of aerosols in the Ganges Valley region during the winter and early spring. Aerosol physical, chemical, and dynamical characterization instrumentation will be available on the surface and on aircraft (and potentially on shipboard platforms).
7.1 Surface Measurement Benefits
Surface measurements are crucial in providing the background and context for the proposed field study. The requested year-long AMF deployment will make substantial contributions to the data sets designed for understanding convective mixing and surface heating preceding the onset of monsoon, during the onset of monsoon, and during the dry winter period. The role of aerosols in each of these regimes will be a key observation. Bringing the resources of the AMF together with the AERONET sites and NASA Micropulse Lidar Network (MPLNET) sites, as well as support from occasional aircraft-platform-based measurements from the ISRO throughout the year, will provide a comprehensive suite of data for understanding the aerosols, their precursors, and their impact on radiative transfer and dynamics of this region. We also anticipate a shorter, intensive operational period during the winter and early spring of 2012 (January–March), and the pre-monsoon period of 2011, when DOE and Indian science teams will operate additional surface sites, bringing surface-based chemical speciation and meteorological capabilities in addition to physical characterization of aerosols.
The deployment of the AMF in the Ganges Valley will also offer a unique opportunity to improve the characterization of the widespread fog that frequently occurs in northeastern India and Pakistan. These fog episodes can last for weeks and can cause extensive economic damage and disruptions to transport. The combination of aerosol, humidity, and cloud observations from the AMF will allow us to investigate the roles of various meteorological conditions and of aerosol concentration and composition on the formation and maintenance of this persistent fog. Previous studies from Moderate Resolution Imaging Spectroradiometer (MODIS) data have suggested that BC might significantly affect fog formation, but few studies have investigated this phenomenon by using comprehensive ground-based remote sensing observations. Such observations will also allow us to investigate whether precipitation efficiency is affected by the presence of aerosols, not only for this widespread fog, but also for other clouds that develop over the year in heavily polluted conditions. This is an issue of high priority to the Indian collaborators and will be conducted primarily by them, with assistance from the data collected by the AMF and other surface sites.

VR Kotomarthi, June 2010, DOE/SC-ARM-10-019
14
7.2 AMF Measurements
The proposed AMF deployment offers an opportunity to study the prevailing patterns of cloud, convective mixing, and aerosol loads that are representative of the Indian subcontinent. Increases in aerosol concentrations lead to smaller cloud droplets that increase cloud albedo and suppress drizzle (first and second indirect effects). Where absorption of solar radiation by carbonaceous aerosols is significant, warming of the cloud layer may lead to a reduction in cloud cover (semi-direct effect). Through these effects, anthropogenic aerosols can modify the surface radiation budget, the vertical profile of atmospheric heating and cooling, evaporation from Earth’s surface, detrainment from clouds, and fluxes of sensible and latent heat. These, in turn, impact cloud cover, feed back to the energy budget and hydrologic cycle, and induce cloud dynamical responses. However, it is still unknown how cloud microphysical and macrophysical properties are influenced by further increases in aerosols when the environment already has heavy aerosol loading. The AMF deployment will allow us to establish a baseline for evaluating the impacts for the rest of the Ganges Valley and auxiliary sites operated by AERONET. We will use the data sets from these various sources to investigate the impact of aerosols on cloud and radiative fluxes. The nearly one-year deployment and the combination of regional-scale field studies should allow us to separate effects of variations in cloud parameters (e.g., cloud fraction, optical depth, liquid water path, location of cloud layers, cloud phase) caused by varying AOD values and meteorological conditions, by using reanalysis products to characterize the background meteorology. Comparison of trends in the dependence of cloud properties on aerosol parameters derived from the AMF data against trends obtained from the numerical models will allow us to determine whether models are replicating the basic physical behavior manifest in the observations.
7.2.1 Energy Budget—AMF Instruments
The AMF has a full suite of instruments for measuring shortwave and longwave radiative transfer through the column. The ground radiation system will be deployed to collect upwelling shortwave and longwave radiation. The sky radiation system will be needed for measuring downwelling shortwave, longwave, and ultraviolet components. The data from these instruments, archived at 1-minute intervals, will provide the incident and reflected radiation for the site. To complement the radiative transfer measurements, the eddy correlation flux measurement system (ECOR) will be deployed. The ECOR measures fluxes of latent and sensible heats and generates estimates of momentum flux transfer rates. Measurements of CO2 and water vapor fluxes are also part of the system. The data are generally available as 30-minute averages. A total sky imager will be needed to determine the cloud cover over the site and to help in developing energy budgets. A multifilter rotating shadowband radiometer (MFRSR) will also be deployed to measure radiative properties associated with aerosol measurements. The MFRSR provides measurements of diffuse spectral radiance, direct spectral radiance optical depth, and surface albedo.
7.2.2 Aerosol Measurements—AMF Instruments
The goal of aerosol measurements is to obtain constraints for model calculations of aerosol direct and indirect effects on radiative transfer. Ideally, achieving “closure” for these measurements would involve measuring the chemical, physical, and optical characteristics of the aerosols as a function of time and altitude. The AMF is equipped with a wealth of instrumentation for measuring aerosols in the atmosphere. The Aerosol Observing System (AOS), which is primarily a surface aerosol characterization facility, measures a number of physical and optical characteristics of aerosols. Late spring and early summer over

VR Kotomarthi, June 2010, DOE/SC-ARM-10-019
15
the Ganges Valley are dominated by dust, and the MFRSR will provide aerosol optical thickness variability and help in the detection of dust events. The winter/spring period has a mix of aerosols, including dust, and the combination of the AOS and the MFRSR could provide information on the compositions of aerosols and their numbers.
The micropulse lidar (MPL) is used extensively by the ARM Facility for cloud detection and discrimination; however, it is also an excellent tool for detection and evaluation of aerosols. Operating at a wavelength of 0.52 mm (green), it is engineered to be eye-safe, even immediately at the telescope. The new instrument in use at the AMF produces circularly polarized and cross-polarized light in alternating 3-second averages; other averaging times between 1 second and 60 seconds are possible. The use of the two polarized states enables discrimination between ice and water clouds, because ice crystals produce a measurable signal return from the cross-polarized signal. The ratio of cross-to-circularly polarized signals (depolarization ratio) can be used as a measure of the amount of nonspherical scatterers in the cloud (Figure 8). In general, cloud bases up to 15 km are easily detectable, although the instrument cannot penetrate thick clouds. Aerosols with sizes near 0.5 mm produce a weaker but easily measurable signal that can be useful for measuring aerosol extinction profiles, AOD, and the height of the well-mixed layer (because aerosols will be essentially well mixed within the layer and concentrations will be much less above this height). Moreover, the polarization capability enables some discrimination between air masses with different aerosol shape characteristics.
Figure 8. Circularly polarized light (top), cross-polarized light (middle), and ratio (bottom) from two
days (left, right) at the ARM Southern Great Plains site. A descending cirrus cloud layer at approximately 12 km produces distinctly different depolarization ratios on the two days. The layered returns below 2 km are from aerosols within the PBL.

VR Kotomarthi, June 2010, DOE/SC-ARM-10-019
16
We propose to use MPL-generated aerosol extinction profiles, along with the AOD values from the MFRSR and the single-scatter albedo retrieved from the MFRSR direct/diffuse ratio, to estimate PBL loading of aerosols—and, in particular, dust—to meet similar modeling needs. Water vapor profiles will also be available from the 6-hour balloon-borne sounding system (sonde) launches that are standard with each AMF deployment.
7.2.3 Cloud Properties—AMF Instruments
An intensive investigation of indirect effects of aerosols requires in situ sampling of cloud air masses and accurate estimates of upwelling velocities and particle size, number, and chemical composition with altitude. The AMF is equipped with a number of remote sensing instruments that together provide a significant amount of information on cloud boundaries, cloud droplet size distribution, radiative transfer through clouds, and chemical composition. The W-Band ARM cloud radar (WACR) is designed primarily to give information on the extent of the clouds and their bottom and top locations. The cloud internal structure is measured by using the narrow field of view, which measures downwelling spectral radiance at 869 nm. The MPL can provide insight into droplet distribution within clouds. The widespread shallow convective clouds that are common during monsoon are embedded with deep convective regions. The site at Nainital (see Section 7.3.1) offers an excellent opportunity to gather a data set for monsoon clouds in the middle of the Indian subcontinent.
7.2.4 Surface and Remote Sensing Meteorological Measurements – AMF Instruments
Measurements of surface and lower troposphere meteorological conditions are needed to contextualize the data and make inferences on the regional scope of the observations and physical conditions of the observed states of the aerosols and the atmosphere. The 915 MHz radar wind profiler and the microwave radiometer profiler (MWRP) will be needed for profiles of temperature, RH, wind velocity, and direction. The MWRP will provide a measure of the cloud liquid content, another potentially useful parameter in climate models for developing and evaluating monsoon cloud systems over this region. The vertical velocities generated could, in principle, be used along with measurements of cloud condensation nuclei to test models of aerosol activation.
7.3 Sites
The main AMF site will be in Nainital; two other sites will be located at Pantnagar and Lucknow.
7.3.1 Nainital
The AMF will be located in Nainital, 2 km above sea level, at Manora Peak, the location of the Aryabhatta Research Institute for Observational Sciences (ARIES) observatory (http://www.aries.res.in/). The diurnal variability of the AOD at the Nainital site leads to interesting differences in measured AOD. Recently, differences in the measured AOD were shown to be lower in the morning than in the afternoon (Figure 9). Much of the difference has been attributed to the growth of the PBL, bringing aerosol collected in the valley below the site during the night and early morning hours to the site by late afternoon. This diurnal variability in aerosol of 50% and more can provide a unique opportunity to estimate the direct radiative forcing impact of aerosols on radiative transfer and collect data leading to

VR Kotomarthi, June 2010, DOE/SC-ARM-10-019
17
better understanding of everyday cloud-aerosol interactions in a predictable manner. The director of the ARIES observatory, Dr. Ram Sagar, is a co-investigator on this proposal. He will provide all necessary support for the AMF team. Items needed by the AMF, such as helium gas for the sondes, can easily be obtained and provided by the ARIES and Indian Institute of Science (IISc) research teams at no cost to DOE. Facilities for hosting guest scientists are available on campus and also in the town of Nainital, below the location of the observatory.
Nainital is easily accessible from New Delhi, the capital of India. New Delhi is a transportation hub for many international airlines, including American Airlines and United Airlines, with connections to many U.S. cities. New Delhi is 150 miles from Nainital by road (approximately 6–7 hours driving time). The nearest domestic airport with service to New Delhi is in Pantnagar, 30 miles from Nainital. Pantnagar is also connected by railways to New Delhi and other major Indian cities. The project co-investigator in India, Dr. Staheesh, and the IISc will provide all necessary logistical support needed for the Nainital AMF deployment. ARIES director Dr. Ram Sagar (a co-investigator on this proposal) has also agreed to provide all needed support for setting up the site on the Nainital ARIES campus and to provide assistance with lodging and transportation between Nainital and New Delhi.
7.3.2 Pantnagar
We expect a fully instrumented surface site (a supersite) to be available for the period of G-1 operation, mostly likely at Pantnagar, adjoining the current ISRO-GBP sites (Figure 10). This site will be augmented to perform some basic chemical characterization of aerosols for time periods before and after the intensive period of 8 weeks in winter and early spring. Chemical characterization of aerosols at the Nainital site could also be immensely interesting, most likely accomplished by using the Aerodyne mobile van, for example, as the hillsides are covered with pine tree vegetation. The possibility of unique secondary organic aerosol (SOA) formation chemistry from the VOCs emissions from the pine trees, mixed with fossil fuel and biofuels burning sources in the valley with a strong signal, could help evaluate the role of biogenic emissions in SOA formation.
7.3.3 Lucknow
The Mobile Aerosol Observing System (MAOS) is also expected to be available during this period. It will be located in a high-aerosol loading region in the city of Lucknow. The ISRO operates a regional center in this city, and we have assurance from ISRO for getting permissions for operating the MAOS from their facility for this period. Additionally, it is expected that three different sites, Jodhpur, Nagpur and Kharagpur, will be maintained by ISRO with additional instrumentation and radiosonde launches every six hours for this time period along with the AMF. We envision the AMF location to be at Nainital (Figure 13), with many of the aerosol characterization resources closer to the source region in the valley. The Aerodyne van will be used to characterize the aerosols near the surface site. The DOE aircraft platform, G-1, is expected to be on-site for eight weeks (mid-January 2012 to March 2012). During winter and early spring, when the aerosol concentrations are highest in this region, we will have the full capabilities of the ARM Facility to measure the radiative, optical, and chemical characteristics of the aerosols and clouds.

VR Kotomarthi, June 2010, DOE/SC-ARM-10-019
18
Figure 9. AOD measured over Nainital, separated into forenoon (FN) and afternoon (AF) bins, with
the difference D between the two. In general, through the year the AF AOD values are higher than the FN AOD values; the differences are particularly high during the pre-monsoon period (Dumka et al. 2008). The ratio of two or more between the FN and AF values is an excellent opportunity for measuring the effects of aerosols on radiative transfer, heating rates, and clouds.
(a) (b)
Figure 10. (a) Proposed sites for surface stations in the Ganges Valley. ARM will operate the Pantnagar (orange) and Nainital (yellow) about 30 km distance from each other; (b) the Lucknow (orange) site will host the MAOS facility and the location of aircraft operations. The rest of the sites below Lucknow will be operated by IISc/ISRO.

VR Kotomarthi, June 2010, DOE/SC-ARM-10-019
19
8.0 Aircraft Platforms Observations
To meet the objectives of the program, in addition to sites mentioned in Section 7, we expect to have support from two aircraft platforms. Aircraft support measurements are intended for making chemical, physical, and optical characterization of aerosols and clouds in situ for a limited period of time. This will coincide with the deployment of ARM resources for a surface characterization supersite at Pantanagar and the MAOS availability at Lucknow during the winter and early spring of 2012.
8.1 Gulfstream G-1 Operated by DOE
The ARM Climate Research Facility, in cooperation with the ARM Aerial Facility (AAF), operates the Gulfstream aircraft platform for making aerosol measurements. The G-1 platform has a suite of instruments and space for guest instrumentation for characterizing aerosols. The altitude range of the aircraft is 0.5–7.5 km, with about 6 hours of fuel and operating speeds of 100 m/s (about 1000 km operating range one way). The instrumentation available on the aircraft will yield data from trace gas measurements to the full AMS suite. Some of the available instrumentation is shown in Figure 11. The aircraft platform’s standard instrumentation package provides real-time measurements of the following:
• Aerosol precursors such as SO, NOx, and VOCs
• Products of atmospheric chemistry such as O3, CO, formaldehyde, and H2O2
• Aerosol size distributions (from a passive-cavity aerosol spectrometer probe)
• Water vapor supersaturation at two temperatures
• Aerosol light scattering (from a three-wavelength nephelometer)
• Absorption coefficient (from a particle soot absorption photometer)
• Fine-sized particles (from a tandem scanning electrical mobility system)
• Time-integrated single-particle compositions
• Particle ionic composition
• Standard radiation measurements, including ultraviolet radiation (Eppley), short-wave irradiance (Eppley PSP), and upwelling and downwelling longwave irradiance (Eppley PIR)
• Spectrally resolved shortwave and longwave radiation (from an MFRSR)
• Infrared temperature for clear sky and surface
• Standard set of meteorology measurements
• Cloud physics parameters such as particle and droplet size, liquid water content, droplet size distribution, cloud water, and cloud condensation nuclei.

VR Kotomarthi, June 2010, DOE/SC-ARM-10-019
20
Figure 11. The G-1 instrument layout.
One of the key unknowns in developing a complete understanding of the monsoon and aerosol interactions over continental India is the vertical profile of aerosols. It has been estimated that much of the aerosols over continental India are in the lower few kilometers of the atmosphere. Surface-based instruments, such as the MPL, are expected to provide some information about the vertical structure of aerosols during the AMF deployment. However, in situ measurement of aerosol number, size, and distribution would help constrain the models of radiative forcing and calculate localized heating rates (Ramanathan et al. 2007) much more effectively for evaluating any possible impacts on cloud formation over continental India. To put the AMF data collection in context and develop a regional-scale idea of the aerosol distributions, we request the deployment of G-1 for approximately eight weeks.

VR Kotomarthi, June 2010, DOE/SC-ARM-10-019
21
Approximate flight tracks for the G-1 operations are shown in the Figures 12 and 13. The yellow tab marks Lucknow, a possible base for the operations, and the orange tab denotes Nainital, the location of AMF. We propose three different flight paths to investigate potentially three different air masses. The path to the left of yellow tab and reaching into Agra has a roundtrip distance of approximately 550 miles. This path will sample air mass coming from the west and heavily influenced by industrial regions and heavily populated New Delhi and surrounding regions. The middle track is mostly focused on the Nainital-Pantanagar-Lucknow triangle where many of the GVAX resources will be concentrated during the field study and is about 550 miles. The track to the right traverses a path that has large heavy industry, the highest observed AOD, number of power plants, and biofuels use. The track covers approximately 600 miles. All distances noted here are linear distances and do not take into account spirals, ascents, and descents.
Figure 12. The yellow tab is Lucknow, the likely base for G-1. The orange tab is Nainital.
Figure 13. Proposed flight path for the flight path shown in the middle of Figure 12.

VR Kotomarthi, June 2010, DOE/SC-ARM-10-019
22
8.2 Beachcraft-20 Operated by Indian Institute of Science
A Beachcraft-20 aircraft equipped with a number of aerosol sampling instruments and lidars will be available from the ISRO and IISc to support the AMF deployment. The number of flight hours and the mode of operation will be determined upon approval of the proposed work. Over the year of the AMF deployment at Nainital, approximately 100 or more hours of flight time may be available, depending on the needs of the program and the science objectives of the aircraft deployment. The nearest airport at Pantnagar will serve as the base for Beachcraft-20 operation, including survey flights and spirals above the AMF location. This operation will be completely funded by the Indian agencies, and opportunities for U.S. scientists to place guest instruments on this platform are expected, at no cost to ARM.
Figure 14. Proposed flight plan for the IISc/ISRO Beachcraft-20 operations.
9.0 Integrated Implementation Plan
To achieve these science objectives, we have formulated an implementation in collaboration with scientists in India. The primary anchor facility for the project is the ARM Mobile Facility. We anticipate that AMF ground operations will be deployed at the ARIES observatory located in Nainital starting in approximately April 2011 and lasting to April 2012. During this one-year deployment of the AMF there will be two intensive periods, one from April 15, 2011, to July 15, 2011 (pre-monsoon) and a second from January 15, 2012, to March 15, 2012 (winter). The combination of the AMF resources and aerosol characterization available for us with the ARM Facility and Atmospheric System Research (ASR) resources provides an exceptional opportunity to generate a one-of-a-kind data set with the potential for major contribution to evaluating aerosols and their impacts on clouds.

VR Kotomarthi, June 2010, DOE/SC-ARM-10-019
23
The pre-monsoon intensive period is marked by absence of clouds, high temperatures, westerly flows, and development of low pressure over the Ganges Valley region, leading to the temperature and pressure gradients that triggers the monsoon flows over the Indian sub-continent. The role of dust and dust mixed with black carbon aerosols in enhancing the pressure and thermal gradients between the Indian Ocean and land (listed as Objective 1 in Section 2) is one of the key questions that we will address. During this period we will have the following resources available: the AMF at Nainital; a Beachcraft-20 aircraft from IISc/ISRO; additional balloon launches; and potentially enhanced surface sites operated by ISRO at Jodhpur, Nagpur, and Kharagpur, the NASA AERONET sites in India, and sites operated by Dr. Bill Lau (NASA) in Nepal. An enhanced surface site at Pantanagar with instrumentation capabilities focused on probing the PBL and measuring primarily black carbon aerosols and dust is also requested by IISc/ISRO for this period, using Indian resources and capabilities. The focus of the aircraft operations will be on reaching higher altitudes and shorter horizontal legs to get aerosol and heating profiles over the Pantanagar/Nainital region
The winter intensive period seeks to address additional process-specific questions about our current understanding of atmospheric aerosols and their role in climate change. Targeted measurements using the DOE G-1 aircraft platform will be performed as a part of the extended deployment of AMF in this region. During this period we expect a fully instrumented surface site (a supersite) to be available located at Pantnagar, adjoining the current ISRO-GBP sites. This site will be augmented to perform basic chemical characterization of aerosols for time periods before and after the intensive period of 8 weeks in the winter and early spring. The MAOS aerosol observatory is also expected to be available during this period and will be located in a high-aerosol loading region in Lucknow. The ISRO operates a regional center in this city, and we have assurance from ISRO for getting permissions for operating the MAOS from their facility for this period. Additionally, it is expected that three sites—Jodhpur, Nagpur and Kharagpur—will be maintained by ISRO with additional instrumentation and radiosonde launches every six hours for this time period along with the AMF. We envision the AMF location to be at Nainital (Figure 13), with many of the aerosol characterization resources closer to the source region in the valley. The instrumented van will be used to characterize the aerosols near the surface site. The DOE aircraft platform, G-1, is expected to be on-site for eight weeks (mid-January 2012 to March 2012). During winter and early spring, when the aerosol concentrations are highest in this region, we will have the full capabilities of the ARM Facility to measure the radiative, optical, and chemical characteristics of the aerosols and clouds.
Figure 16 shows the projected timeline for the field experiment from April 1, 2011, to April 1, 2012.

VR Kotomarthi, June 2010, DOE/SC-ARM-10-019
24
Figure 15. Conceptual diagram of the proposed field study. The aerosol characterization supersite will
be located in the valley and inside the aerosol layer at Pantnagar. The G-1 aircraft will probe the PBL and over the AMF and above into the mid-troposphere to characterize the chemical composition of aerosols and their physical and optical properties within clouds and outside.
Figure 16. Timeline for the GVAX field experiment.
VR Kotomarthi, June 2010, DOE/SC-ARM-10-019
25
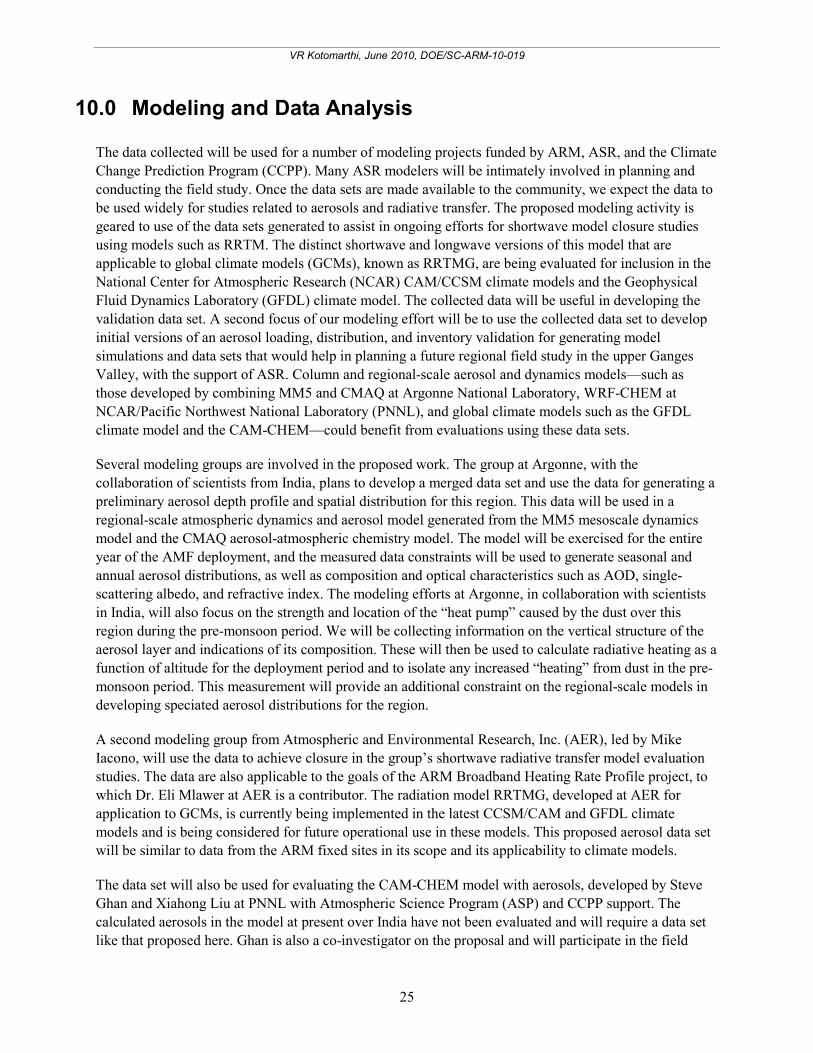
10.0 Modeling and Data Analysis
The data collected will be used for a number of modeling projects funded by ARM, ASR, and the Climate Change Prediction Program (CCPP). Many ASR modelers will be intimately involved in planning and conducting the field study. Once the data sets are made available to the community, we expect the data to be used widely for studies related to aerosols and radiative transfer. The proposed modeling activity is geared to use of the data sets generated to assist in ongoing efforts for shortwave model closure studies using models such as RRTM. The distinct shortwave and longwave versions of this model that are applicable to global climate models (GCMs), known as RRTMG, are being evaluated for inclusion in the National Center for Atmospheric Research (NCAR) CAM/CCSM climate models and the Geophysical Fluid Dynamics Laboratory (GFDL) climate model. The collected data will be useful in developing the validation data set. A second focus of our modeling effort will be to use the collected data set to develop initial versions of an aerosol loading, distribution, and inventory validation for generating model simulations and data sets that would help in planning a future regional field study in the upper Ganges Valley, with the support of ASR. Column and regional-scale aerosol and dynamics models—such as those developed by combining MM5 and CMAQ at Argonne National Laboratory, WRF-CHEM at NCAR/Pacific Northwest National Laboratory (PNNL), and global climate models such as the GFDL climate model and the CAM-CHEM—could benefit from evaluations using these data sets.
Several modeling groups are involved in the proposed work. The group at Argonne, with the collaboration of scientists from India, plans to develop a merged data set and use the data for generating a preliminary aerosol depth profile and spatial distribution for this region. This data will be used in a regional-scale atmospheric dynamics and aerosol model generated from the MM5 mesoscale dynamics model and the CMAQ aerosol-atmospheric chemistry model. The model will be exercised for the entire year of the AMF deployment, and the measured data constraints will be used to generate seasonal and annual aerosol distributions, as well as composition and optical characteristics such as AOD, single-scattering albedo, and refractive index. The modeling efforts at Argonne, in collaboration with scientists in India, will also focus on the strength and location of the “heat pump” caused by the dust over this region during the pre-monsoon period. We will be collecting information on the vertical structure of the aerosol layer and indications of its composition. These will then be used to calculate radiative heating as a function of altitude for the deployment period and to isolate any increased “heating” from dust in the pre-monsoon period. This measurement will provide an additional constraint on the regional-scale models in developing speciated aerosol distributions for the region.
A second modeling group from Atmospheric and Environmental Research, Inc. (AER), led by Mike Iacono, will use the data to achieve closure in the group’s shortwave radiative transfer model evaluation studies. The data are also applicable to the goals of the ARM Broadband Heating Rate Profile project, to which Dr. Eli Mlawer at AER is a contributor. The radiation model RRTMG, developed at AER for application to GCMs, is currently being implemented in the latest CCSM/CAM and GFDL climate models and is being considered for future operational use in these models. This proposed aerosol data set will be similar to data from the ARM fixed sites in its scope and its applicability to climate models.
The data set will also be used for evaluating the CAM-CHEM model with aerosols, developed by Steve Ghan and Xiahong Liu at PNNL with Atmospheric Science Program (ASP) and CCPP support. The calculated aerosols in the model at present over India have not been evaluated and will require a data set like that proposed here. Ghan is also a co-investigator on the proposal and will participate in the field

VR Kotomarthi, June 2010, DOE/SC-ARM-10-019
26
study and data analysis as needed. Another group, led by Dr. Ramaswamy of the National Aeronautics and Space Administration, will use the GVAX data set to continue research on the impact of aerosols on monsoons. In particular, this data set will help in testing the prevailing theories on the effect of aerosols on monsoon rainfall. Recent studies suggest that both the extinction optical depth and absorbing/scattering ratio are determinants of changes in precipitation. This data set will provide measurements to evaluate this hypothesis. The GFDL group will also investigate radiative forcing due to aerosols (by using the same radiation code as in the GCM) and will explore the sensitivities to assumptions/data on optical properties and mixing states.
The quality of satellite remotely sensed products on atmospheric composition, clouds, and the surface universally depends on environmental conditions at the time and place of the observations. For example, errors in AOD in the standard products of MISR and MODIS are systematically dependent on the magnitude of the AOD; underestimation of AOD increases with increasing AOD values. The generation of these products depends on assumptions (e.g., the vertical distribution of aerosols) that may not be appropriate for the time and location of the observations. The atmospheric environment of the Ganges Valley provides highly challenging and variable conditions needed to verify and improve our satellite remotely sensed products. For example, the annual seasonal cycle of aerosol type (e.g., desert dust, sulfates, BC), concentration, and vertical layering in the Ganges Valley sets up a wide range of difficult conditions for verifying satellite-derived AOD. Further difficulties arise from the cloud detection procedures used by many satellites in deriving geophysical products. Properties of the atmosphere, clouds, and surface are derived with the assumption that the satellite’s instantaneous field of view is either clear or cloudy. Errors in this clear/cloud classification directly impact the quality of satellite remotely sensed products and remain the dominant source of error in many satellite products. The high frequency of fog and large AOD values in the Ganges Valley (e.g., Di Girolamo et al. 2004) provide the challenging conditions needed to verify satellite cloud detection procedures. The ARM Facility’s capabilities, along with other instruments participating in the proposed study, will provide many of the needed in situ and ground-based remotely sensed data needed for satellite product verification.
11.0 Data Sharing and Archiving
Data collection and sharing will be established prior to the field study, upon approval of the proposed work. Data reporting standards, limited embargo of data for analysis by the PIs, and archiving and distribution of the U.S. data will be handled by the ARM Facility. The data from Indian scientists will also be formatted and reported according to the ARM protocols. Embargo and reporting timelines for data gathered by the Indian scientists will be established when the field study is finalized; they most likely will follow the ARM protocol. The IISc, Bangalore, will mirror the data collected during the field study. A merged data set that includes the AMF-collected data and that collected by the participating AERONET sites during the one-year AMF deployment will also be specially processed and provided to ARM scientists.

VR Kotomarthi, June 2010, DOE/SC-ARM-10-019
27
12.0 Additional Guest/Supporting Measurements by Host Institutes
Specific instruments available for the field study from Indian scientists are indicated below.
12.1 Nainital Site at the Arybhatta Research Institute for Observational Sciences
The Nainital site (29.4 N, 79.5 E) at ARIES is at an altitude of 2 km above mean sea level (AMSL) and to the north of Kanpur and Nagpur. The Nainital site, with its higher elevation, has been shown to be more representative of a clean-background atmosphere than other sites in India (Pant et al. 2006). Dr. Ram Sagar, the director of ARIES, is a co-investigator on this proposal; he has provided a letter of support. The Nainital site has the following set of instrumentation and measurements:
• Multiwavelength radiometer to measure the AOD at ten wavelengths
• Sun photometer to measure instantaneous AODs at six different wavelengths
• Measurements of the instantaneous values of total columnar ozone
• Aerosol spectrometer (GRIMM Technologies) to measure the number concentration and size distribution of near-surface aerosols
• Dual-channel aethalometer to measure the near-surface mass concentration of BC aerosols
• High-volume air sampler to measure the mass loading of near-surface aerosols
• Pyranometer for measuring global solar radiation.
We are submitting the research plan of this proposal to the GBP measurement network as a sponsor for additional measurements at sites. Measurements at Jodhpur (JDR in Figure 3—near the dust source region) and at Patiala (indicated by PTL in Figure 3—near the source of agricultural biomass burning) will be valuable for developing a regional understanding of the wintertime and pre-monsoon aerosols. In addition, this proposal will be submitted to the CTCZ program managers, and measurements from the AMF will be made available to CTCZ under a reciprocal agreement.
12.2 Bangalore: Aerosol-Climate Observatory and Instrumentation at the Indian Institute of Science
The primary technical contact and the PI for the project in India, Dr. Satheesh, set up an aerosol-climate observatory at Bangalore in southern India in 2001. In order to characterize aerosols over the Bangalore region and assess their radiative impacts, a number of sophisticated instruments were acquired for the measurement of various parameters related to aerosols and radiation. The instruments include the following (with parameters measured in parentheses):
• Multiwavelength solar radiometer (spectral optical depth)
• Aethalometer (aerosol BC)
• Micro-pulse lidar (aerosol vertical distribution)

VR Kotomarthi, June 2010, DOE/SC-ARM-10-019
28
• Optical particle counter (aerosol size distribution)
• High-volume aerosol sampler (aerosol chemical composition)
• Sky-scanning radiometer (sky radiance)
• Shadowband radiometer (direct, diffuse, and global radiation)
• Three-wavelength nephelometer (spectral scattering coefficient)
• Automatic weather station (meteorological parameters).
Similar observatories were set up at Minicoy, in the Lakshadweep Islands of the Arabian Sea, and at Port Blair, in the Andaman Nicobar Islands in Bay of the Bengal, by using a subset of the above instruments. In addition to these two fixed observatories, aerosol measurements for characterization of aerosol spatial heterogeneity are made by identical or nearly identical instruments on several instrumented mobile platforms. Over-ocean aerosol measurements are made aboard the R/V Sagar Kanya. Vertical distribution of aerosol properties is routinely characterized by an MPL mounted onboard a research aircraft (belonging to National Remote Sensing Agency, Department of Space), as well as by making measurements over continental and coastal India and over oceanic regions adjacent to the Indian subcontinent. These sites are equipped with facilities such as a scanning electron microscope to determine microscopic features of aerosol samples. The Bangalore site will be operated cooperatively with the AMF primary site at Nagpur during the deployment. Several of the AMF instruments are duplicated at the Bangalore site operated by Dr. Satheesh. Some of the duplicates will be located either with the AMF at Nainital or at auxiliary sites, depending on the needs for coverage and for duplication. The Bangalore instruments will all be operative during the CTCZ study, coincident with AMF deployment.
13.0 Science Management Plan
The project will be managed primarily by the PI, Dr. Kotamarthi of Argonne. Prof. Sethu Raman of the North Carolina State University, who has worked on several field studies in India and has an extensive network of contacts in India, will work with Dr. Kotamarthi. The logistics and day-to-day management at the site will be handled by a management team in India, led by Dr. Satheesh of the IISc in Bangalore. As the primary contact for site selection and leading the AMF deployment in India, Dr. Satheesh will handle logistics and interactions with government officials in India and any needed support for AMF deployment requiring financial commitments from AMF. Dr. Krishnamoorthy, the lead scientist for the Indo Gangetic Plain aerosol studies sponsored by the Indian government, is well equipped to guide the project science goals and integration with the ongoing CTCZ and GBP field studies. Dr. Krishnamoorthy will lead the efforts to make the data set a part of the GBP and CTCZ study and will broaden the scope of the measurements by including some additional surface sites of the ongoing monitoring network. In further evidence of organizational commitment from the Indian host organization, the ISRO director, Dr. C.B.S. Dutt, has provided a support letter for the AMF deployment. In addition, Dr. G. Ramesh of the Earth Systems Ministry, Government of India, will be available to help the management team with logistics and clearances. We have discussed the project with the Indian Meteorological Department (IMD), the agency tasked with weather forecasting and monitoring in India. Dr. Attri, the director of the Environmental Monitoring Division, and Dr. Ajit Tyagi, IMD director, were made aware of the project. The agency’s support will be requested as needed by the science team. In addition, the Department of Science and

VR Kotomarthi, June 2010, DOE/SC-ARM-10-019
29
Technology official in the Erath Sciences ministry, Dr. K. J. Ramesh, was also involved in our discussion and expressed support for the project.
The primary contact in India for collaboration with the CTCZ field study and modeling will be Prof. Satheesh of the IISc in Bangalore. He will collaborate with Dr. Kotamarthi on the aerosol modeling aspects. Prof. Satheesh will also be interested in the cloud products generated and will collaborate with the appropriate instrument mentors to generate modeling products. Dr. Steve Ghan and Xiahong Liu will lead the effort to use the data set in climate models. Dr. Ghan is a PI in ASR; along with Dr. Liu, he is developing an aerosol module for the CAM-CHEM model for use in the coupled CCSM simulations of climate. Prof. Larry Di Girolamo of the University of Illinois at Urbana-Champaign will use the data for evaluation of satellite remote sensing data. Mike Iacono of AER will collaborate with the PI, Dr. Ghan and Liu, and various instrument mentors and the modeling groups in India, primarily to evaluate the RRTMG for shortwave closure studies.
14.0 Relevancy to DOE Long-Term Goals
DOE is tasked with developing improved climate data and models for developing climate mitigation and adaptation strategies, as well as with helping policymakers arrive at the required decisions. DOE has also the goal of reducing model-predicted and measured temperature differences at subcontinental scales over the next five years. The proposed measurements will further both of these goals. The measurements over the Indian subcontinent will form one of the first highly comprehensive sets of radiative transfer measurements, with a scope similar to that of the ARM fixed sites. The resulting data set will prove invaluable in helping the radiative transfer modeling community with shortwave budget closure studies over one of the potentially climate sensitive regions of the world. The measurements of aerosol chemical, physical, and optical properties will provide constraints for climate modeling and evaluation of regional-scale changes in temperature forcing by aerosols. The effort will help reduce differences between measured temperatures and temperatures predicted by climate models on a subcontinental scale and will advance progress toward attaining the second long-term goal of the DOE Climate Change Research Program.
15.0 References
Acharya, C, LB Sukla, and VN Misra. 2005. “Biological elimination of sulphur from high sulphur coal by Aspergillus-like fungi.” Fuel: 1597–1600.
Ball, WP, RR Dickerson, BG Doddridge, JW Stehr, TL Miller, DL Savoie, and TP Carsey. 2003. “Bulk and size-segregated aerosol composition observed during INDOEX 1999: Overview of meteorology and continental impacts.” Journal of Geophysical Research 108(D10): 8001, doi:10.1029/2002JD002467.
Chinnam, N, S Dey, SN Tripathi, and M Sharma. 2006. “Dust events in Kanpur, Northern India: Chemical evidence for source and implications to radiative forcing.” Geophysical Research Letters 33: L08803, doi:10.1029/2005GL025278.

VR Kotomarthi, June 2010, DOE/SC-ARM-10-019
30
Chung, CE, and V Ramanathan. 2006. “Weakening of North Indian SST gradients and the monsoon rainfall in India and the Sahel.” Journal of Climate 19(10): 2036.
Dey, S, and SN Tripathi. 2007. “Estimation of aerosol optical properties and radiative effects in the Ganga basin, Northern India during the winter time.” Journal of Geophysical Research 112: D03203.
Di Girolamo, L, TC Bond. D Bramer. DJ Diner, F Fettinger, RA Kahn, JV Martonchik, MV Ramana, V Ramanathan, and PJ Rasch. 2004. “Analysis of Multi-angle Imaging SpectroRadiometer (MISR) aerosol optical depths over greater India during winter 2001-2004.” Geophysical Research Letters 31: L23115, doi:10.1029/2004GL021273.
Dumka, UC, K Krishna Moorthy, SK Satheesh, Ram Sagar, and P Pant. 2008. “Short-period modulations in aerosol optical depths over the central Himalayas: Role of mesoscale processes.” Journal of Applied Meteorology and Climatology 47: 1467–1475.
Gautam,R, NC Hsu, K-M. Lau, S-C Tsay, and M Kafatos, 2009. “Enhanced pre-monsoon warming over the Himalayan-Gangetic region from 1979 to 2007.” Geophysical Research Letters 36: L07704, doi:10.1029/2009GL037641.
Goswami, BN, V Venugopal, D Sengupta, MS Madusoodanan, and PK Xavier. 2006. “Increasing trend of extreme rain events over India in a warming environment.” Science 314: 1442–1445.
Hu, Z-Z, M Latif, E Roeckner, and L Bengtsson. 2000. “Intensified Asian summer monsoon and its variability in a coupled model forced by increasing greenhouse gas concentrations.” Geophysical Research Letters 27: 2681–2684.
Jacobson, MZ. 2002. “Control of fossil-fuel particulate black carbon and organic matter, possibly the most effective method of slowing global warming.” Journal of Geophysical Research 107: doi:10.1029/2001JD001 376.
Kothwale, DR, and K Rupa Kumar. 2002. “Tropospheric temperature variations over India and links with the Indian summer monsoon.” Masusam 53: 289–308.
Menon, S, J Hansen, L Nazarenko, and Y Luo. 2002. “Climate effects of black carbon aerosols in China and India.” Science 297: 2250–2253.
Mishra, SK, S Dey, and SN Tripathi. 2008. “Implications of particle composition and shape to dust radiative effect: A case study from the Great Indian Desert.” Geophysical Research Letters 35: L23814, doi:10.1029/2008GL036058.
Pant, P, et al. 2006. “Aerosol characteristics at a high-altitude location in central Himalayas: Optical properties and radiative forcing.” Journal of Geophysical Research 111: D17206.
Ramanathan, V, PJ Crutzen, and AP Mitra. 2002. “The Indian Ocean Experiment and the Asian brown cloud.” Current Science (India) 83(8): 947–955.

VR Kotomarthi, June 2010, DOE/SC-ARM-10-019
31
Ramanathan, V, CE Chung, et al. 2005. “Atmospheric brown clouds: Impacts on South Asian climate and hydrological cycle.” Proceedings of the National Academy of Sciences of the United States of America 102(15): 5326.
Ramanathan, V, MV Ramana, G Roberts, D Kim, C Corrigan, C Chung, and D Winker. 2007. “Warming trends in Asia amplified by brown cloud solar absorption.” Nature 448: 575–578.
Reddy, MS, and C Venkataraman. 2002. “Inventory of aerosol and sulphur dioxide emissions from India: Part I, Fossil fuel combustion.” Atmospheric Environment 36: 677–697.
Rosenfeld, D, J Dai, X Yu, Z Yao, X Xu, X Yang, and C Du. 2007. “Inverse relations between amounts of air pollution and orographic precipitation.” Science 315: 1396–1398.
Singh, RP, S Dey, and SN Tripathi. 2004. “Variability of aerosol parameters over Kanpur, northern India.” Journal of Geophysical Research 109: D23.
Singh, RP, et al. 2006. “Satellite and ground based observations on air quality over major cities in the Indo-Gangetic Basin.” EOS Transactions, AGU 87(36): Joint Assembly Supplement, Abstract A31A-05.
Tripathi, SN, S Dey, and V Tare. 2005. “Enhanced layer of black carbon in a north Indian industrial city.” Geophysical Research Letters 32: 12.
Venkataraman, C, B Chandramouli, and A Patwardhan. 1999. “Anthropogenic sulphate aerosol from India: Estimates of burden and direct radiative forcing.” Atmospheric Environment 33: 3225–3235.
Venkataraman, C, CK Reddy, S Josson, and MS Reddy. 2002. “Aerosol size and chemical characteristics at Mumbai, India, during the INDOEX-IFP (1999).” Atmospheric Environment 36: 1979–1991.
Volkamer, R, JL Jimenez, F San Martini, K Dzepina, Q Zhang, D Salcedo, LT Molina, DR Worsnop, and MJ Molina. 2006. “Secondary organic aerosol formation from anthropogenic air pollution: Rapid and higher than expected.” Geophysical Research Letters 33: L17811.
Zhang, Q, JL Jimenez, MR Canagaratna, et al. 2007. “Ubiquity and dominance of oxygenated species in organic aerosols in anthropogenically-influenced Northern Hemisphere midlatitudes.” Geophysical Research Letters 34: L13801, doi:10.1029/2007GLO29979.
Zickfeld, K, B Knopf, V Petoukhov, and HJ Schellnhuber. 2005. “Is the Indian summer monsoon stable against global change?” Geophysical Research Letters 32: L15707.