Embed Size (px)
Citation preview
Gaming the Liver Transplant Market
Jason Snyder*
University of California Los Angeles
The liver transplant waiting list is designed to allocate livers to the sickest
patients first. Before March 1, 2002, livers were allocated to patients based
on objective clinical indicators and subjective factors. In particular, a center
placing a prospective transplant recipient in the intensive care unit (ICU) leads
to a higher position on the liver transplant waiting list. After March 1, 2002, a pol-
icy reform mandated that priority on the liver transplant waiting list no longer be
influenced by whether the patient was in the ICU. I show that after the reform,
ICU usage declined most precipitously in areas with multiple transplant centers.
I find no evidence that pervasive manipulation in the most crowded liver trans-
plant markets distorted the allocation of livers away from the intended prioriti-
zation of the sickest patients first. It appears that centers in areas with
multiple competitors manipulated the waiting list to ensure that the sickest
patients received a liver. (JEL I11, D73, I18, L22)
1. Introduction
It is well known that competition can lead to many socially desirable outcomes
such as lower prices, higher productivity, and less deadweight loss. Although
often socially beneficial, competition can also spawn unethical strategic
choices that harm many of a firm�s stakeholders and the greater public welfare(Staw and Szwajkowski 1975; Shleifer 2004). Business stealing, predatory
pricing, sabotage, and dishonesty can spread across firms as strategic responses
to increased competition. These responses may yield private benefit to the firm
at the expense of other stakeholders.
*Anderson School of Management, University of California Los Angeles, Los Angeles, CA,
USA. Email: [email protected].
I would like to thank the anonymous referees, Ronen Avraham, John De Figueiredo, Annalise
Keen, Steven Lippman, Anne Marie Knott, Siona Listokin, Gabriel Natividad, Richard Saouma,
Mary Catherine Snyder, Pablo Spiller, Chris Tang, and Albert Yoon and seminar participants at
Cornell University, University of Maryland, Washington University at Saint Louis, University of
California at Los Angeles, and The Business and Non-Market Environment Conference for
thoughtful input. Victor Bennett and Lamar Pierce were especially useful in my thinking about
this project. Sarah Hagar and Guowei Sun provided outstanding research assistance. All mistakes
are mine alone.
The Journal of Law, Economics, & Organization, Vol. 26, No. 3,
doi:10.1093/jleo/ewq003
Advance Access publication April 1, 2010
� The Author 2010. Published by Oxford University Press on behalf of Yale University.
All rights reserved. For Permissions, please email: [email protected]
546 JLEO, V26 N3
at UC
LA B
iomedical Library S
erials on January 24, 2011jleo.oxfordjournals.org
Dow
nloaded from
A key mechanism that drives the relationship between competition and un-
ethical firm strategies is that firms are unable to commit to ethical behavior. In
many interactions, if all firms could commit to eschew unethical strategies,
then collectively, they would be better off. However, if all the other firms
are behaving ethically, then there are enormous incentives for any one firm
to behave unethically. This generates a race to the bottom where the lack
of commitment that leads many firms to behave unethically oftentimes leaves
all of them collectively worse off.
Uncovering evidence of ethically dubious strategies is quite difficult
because these practices are usually hidden under a veil of secrecy. Firms
intentionally hide unethical practices from public view to avoid legal and
market-based sanctions of their strategic behavior. To study the impact of com-
petition on unethical behavior, I use a focused empirical study of the liver
transplant market that uses particularly rich data, substantial variation in com-
petition, and a shift in policy to overcome many of the hurdles in studying the
relationship between competition on unethical firm behavior.
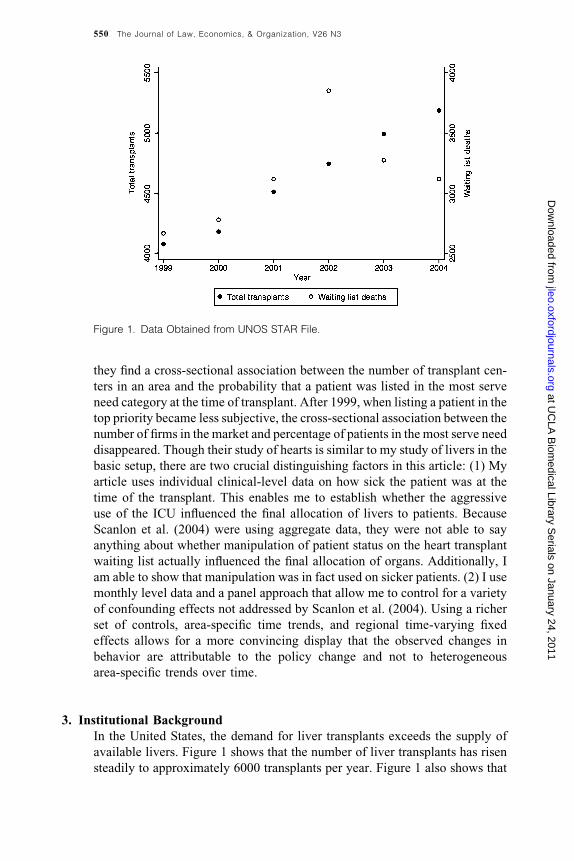
Approximately 6000 transplants are performed annually, and, on average,
2500 people die while waiting for a liver.1 There is substantial variation in the
number of transplant centers across markets; somemarkets have only one firm,
whereas othermarkets havemultiple participants. Prior toMarch 1, 2002, ama-
jor determinant of whether a patient would obtain a liver was whether he/she
was in the intensive care unit (ICU). Patients in the ICU jumped to the top of
the priority list regardless of how sick they actually were. There is considerable
anecdotal evidence, suggesting that to obtain livers for their patients, the trans-
plant centers created faux-ICUs where relatively healthy people were put in the
ICU to strategically advance their positions on the waiting list. After March 1,
2002, the allocation of livers changed to a system where livers were allocated
solely on clinical indicators of sickness. ICU status was no longer a factor in
determining whether a patient obtained a liver or not. This policy resulted in, if
anything, an increase in the sickness of the average patient at transplant and
a dramatic discontinuous decrease in the number of patients who were in the
ICU at the time of their transplant. This seemingly contradictory behavior is
consistent with centers strategically misrepresenting the health of their patients
prior to the policy reforms.
Using the policy change to examine changes in ICU admission behavior,
I find that after the policy change, the use of the ICU decreased more in mar-
kets with more firms. I also find that after the policy change, the percentage of
relatively healthy people in the ICU decreased most in the areas with more
firms. This suggests that the threshold sickness level for admitting a patient
to the ICU increases most dramatically after the policy reform in the areas
with more firms. Although this overly aggressive use of the ICU was certainly
costly in and of itself, it is unclear whether this distorted the allocation of livers
to patients. I find no evidence that after the policy change, patients were sicker
at the time of transplant in markets where multiple centers compete. This
1. See Figure 1.
Gaming the Liver Transplant Market 547
at UC
LA B
iomedical Library S
erials on January 24, 2011jleo.oxfordjournals.org
Dow
nloaded from
suggests that the strategic use of the ICU by centers competing with each other
was offsetting. It appears that each competing center used the ICU to move
their sickest patients to the top of the list and had a negligible overall impact on
the rank ordering of patients waiting for a liver. Although certain specifications
are not always significant, overall the consistency of the results highlights an
association between competitive pressures and the gaming of the transplant
system.
This article proceeds as follows: Section 2 reviews the relevant literature.
Section 3 describes the relevant institutions and some qualitative evidence.
Section 4 develops the hypotheses. Section 5 discusses the identification strat-
egy and summarizes the sample. Section 6 explains the empirical strategy.
Section 7 presents the results. Section 8 concludes.
2. Prior Literature
There has been some prior literature on the impact of competition on ethical
behavior.2 Staw and Szwajkowski (1975) and Shleifer (2004) present
a straightforward argument on how competition can increase unethical behav-
ior. They define unethical behavior as ‘‘a behavior that is morally sanctioned
by the larger community but can improve firm performance.’’ Unethical be-
havior on the part of competitors forces the firm to behave unethically even if
the firm places some value on ethical behavior.3
There have been various approaches to the empirical study of the impact of
competition on unethical behavior. Hegarty and Sims (1978) provide some of
the first evidence linking competition to unethical behavior in the laboratory
setting. They find a strong result indicating that competition increases uneth-
ical behavior, but the laboratory setting is of concern when trying to generalize
the results. In contrast, in a survey of sales person behavior, Dubinsky and
Ingram (1984) find no significant evidence of competition influencing ethical
behavior. It is difficult to take this work as definitive due to the difficulties that
are pervasive in using surveys in this area. Cai et al. (2007) find a positive
association between increases in competition and an increase in tax avoidance
activity among Chinese manufacturers. This article is similar to Cai et al. in
that both empirical studies show the importance of competition as an expla-
nation of unethical behavior. The current study is distinctive because many of
the factors that suggest self-regulation can work are absent in the work of Cai
et al. on Chinese manufacturers.
2. There is an exceptionally large literature on ethics in business, which is beyond the scope of
this article. See Ford and Richardson (1994), Loe et al. 2000, and Trevino et al. (2006).
3. This is part of the more general argument that ethical behavior is endogenous to social cir-
cumstances. For example, see Milgram (1963) and Trevino et al. (2006). Scalet (2006) provides an
intriguing argument that it might not always be optimal to design institutions to solve ethical
behavior induced by competition.
548 The Journal of Law, Economics, & Organization, V26 N3
at UC
LA B
iomedical Library S
erials on January 24, 2011jleo.oxfordjournals.org
Dow
nloaded from
There is a limited economics literature studying the impact of the opportu-
nity to engage in business stealing practices on market entry. These articles
demonstrate in a variety of settings that free entry can be inefficient when
the entrant�s business plan is to steal incumbent�s business rather than generatenew value.4
There are also sets of studies in the health-care literature that look at the
impact of incentives on ethical behavior. Dafny (2005) provides a useful
framework for dividing this literature into two areas: nominal responses to
incentives and real responses. The work on nominal responses focuses on
how price changes in reimbursement rates provide incentives for hospitals
to change their diagnosis. This behavior essentially redistributes wealth from
the insurance providers to the hospital without providing additional services.
Additionally, many articles find that as the relative reimbursement rates for
treatments change, hospitals respond by moving to more lucrative diagnoses
(Carter et al. 1990; Psaty et al. 1999; Silverman and Skinner 2004; Dafny
2005).5
This literature also studies how real responses, such as treatment choices,
are affected by financial incentives. In an influential article, Gruber and
Owings (1996) show that an increase in reimbursements for cesarean sections
is associated with an increase in the number of cesarean sections performed by
obstetricians. Cutler (1995) and Gilman (2000) additionally find evidence of
a positive association between reimbursement rate and procedure intensity, as
measured by length of stay or number of procedures performed. However, the
results are not ubiquitous. Dafny (2005) finds little evidence of increases in
reimbursements leading to changes in length of stay, procedure volume, or
survival rates.
This article contributes to the literature in two ways. First, the ethical di-
lemma is much more intense in liver transplants than in other markets. Second,
few of these studies look at the impact of competition on ethical behavior.6
One could easily imagine that when the potential for harm is high, a relatively
small number of hospitals could find ways to cooperate so as to avoid giving
a liver to a relatively healthy patient. Professional codes of ethics and not-for-
profit organizational status are major factors that could push these centers to
cooperate. This article shows that even with a limited number of competitors
and muted incentives, many centers act unethically.
Finally, Scanlon et al. (2004) also has a study similar to mine looking at the
association between competition and the gaming of the heart transplant mar-
ket. They study a policy change in 1999 that made it more difficult to move
patients to the top of the heart transplant waiting list. In 3 years prior to 1999,
4. Examples from this literature include Hsieh and Moretti (2003), Berry and Waldfogel
(1999), and Davis (2006).
5. Vaughn (1983) provides a detailed case study on Medicare fraud that is related to this
empirical literature.
6. There is a literature on how hospital competition influences other outcomes (health, costs,
etc.). See Dranove et al. (1992), Kessler and McClellan (2000), and Kessler and Geppert (2005).
Gaming the Liver Transplant Market 549
at UC
LA B
iomedical Library S
erials on January 24, 2011jleo.oxfordjournals.org
Dow
nloaded from
they find a cross-sectional association between the number of transplant cen-
ters in an area and the probability that a patient was listed in the most serve
need category at the time of transplant. After 1999, when listing a patient in the
top priority became less subjective, the cross-sectional association between the
number of firms in the market and percentage of patients in the most serve need
disappeared. Though their study of hearts is similar to my study of livers in the
basic setup, there are two crucial distinguishing factors in this article: (1) My
article uses individual clinical-level data on how sick the patient was at the
time of the transplant. This enables me to establish whether the aggressive
use of the ICU influenced the final allocation of livers to patients. Because
Scanlon et al. (2004) were using aggregate data, they were not able to say
anything about whether manipulation of patient status on the heart transplant
waiting list actually influenced the final allocation of organs. Additionally, I
am able to show that manipulation was in fact used on sicker patients. (2) I use
monthly level data and a panel approach that allow me to control for a variety
of confounding effects not addressed by Scanlon et al. (2004). Using a richer
set of controls, area-specific time trends, and regional time-varying fixed
effects allows for a more convincing display that the observed changes in
behavior are attributable to the policy change and not to heterogeneous
area-specific trends over time.
3. Institutional Background
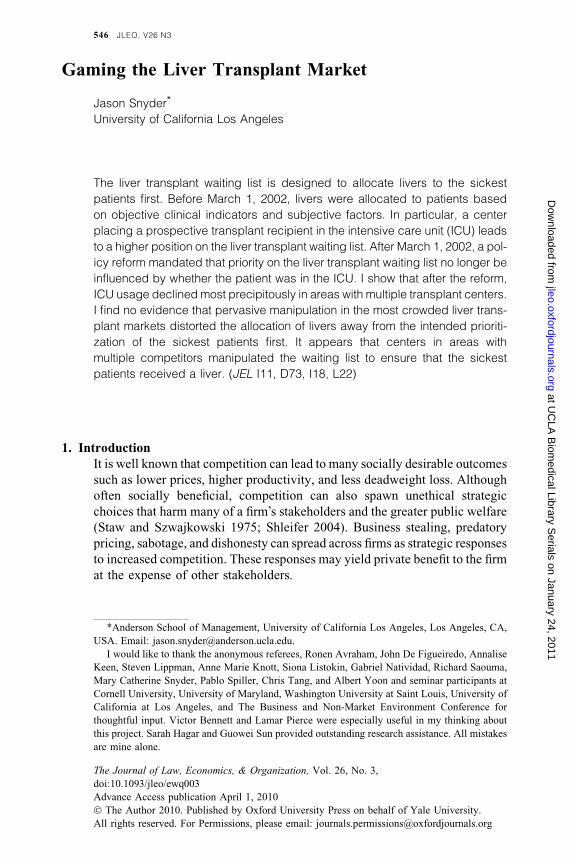
In the United States, the demand for liver transplants exceeds the supply of
available livers. Figure 1 shows that the number of liver transplants has risen
steadily to approximately 6000 transplants per year. Figure 1 also shows that
Figure 1. Data Obtained from UNOS STAR File.
550 The Journal of Law, Economics, & Organization, V26 N3
at UC
LA B
iomedical Library S
erials on January 24, 2011jleo.oxfordjournals.org
Dow
nloaded from
there is still a significant gap, as more than 2000 people die each year waiting
for a liver. Occasionally, part of a liver can be given from a living donor to
a patient in need, but the risk associated with this procedure is high. More than
95% of all liver transplants come from deceased donors.
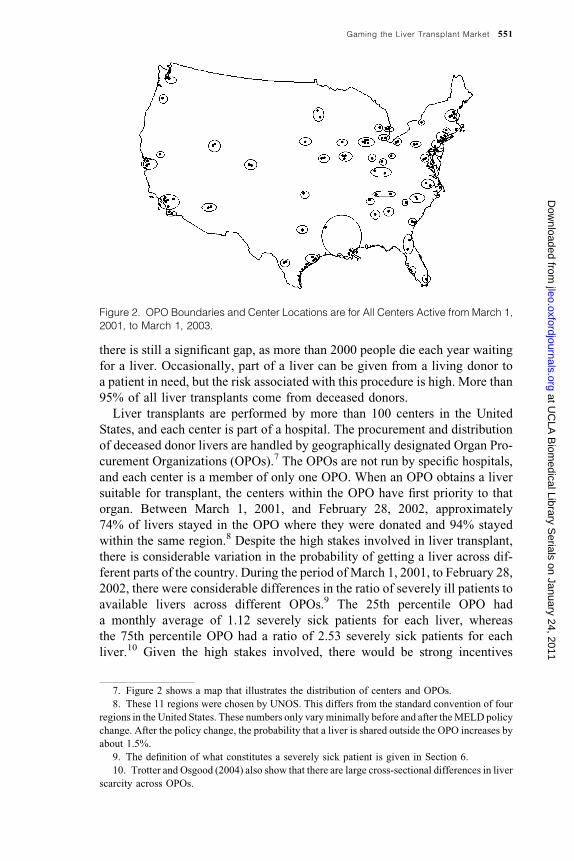
Liver transplants are performed by more than 100 centers in the United
States, and each center is part of a hospital. The procurement and distribution
of deceased donor livers are handled by geographically designated Organ Pro-
curement Organizations (OPOs).7 The OPOs are not run by specific hospitals,
and each center is a member of only one OPO. When an OPO obtains a liver
suitable for transplant, the centers within the OPO have first priority to that
organ. Between March 1, 2001, and February 28, 2002, approximately
74% of livers stayed in the OPO where they were donated and 94% stayed
within the same region.8 Despite the high stakes involved in liver transplant,
there is considerable variation in the probability of getting a liver across dif-
ferent parts of the country. During the period of March 1, 2001, to February 28,
2002, there were considerable differences in the ratio of severely ill patients to
available livers across different OPOs.9 The 25th percentile OPO had
a monthly average of 1.12 severely sick patients for each liver, whereas
the 75th percentile OPO had a ratio of 2.53 severely sick patients for each
liver.10 Given the high stakes involved, there would be strong incentives
Figure 2. OPO Boundaries and Center Locations are for All Centers Active from March 1,
2001, to March 1, 2003.
7. Figure 2 shows a map that illustrates the distribution of centers and OPOs.
8. These 11 regions were chosen by UNOS. This differs from the standard convention of four
regions in the United States. These numbers only varyminimally before and after theMELD policy
change. After the policy change, the probability that a liver is shared outside the OPO increases by
about 1.5%.
9. The definition of what constitutes a severely sick patient is given in Section 6.
10. Trotter and Osgood (2004) also show that there are large cross-sectional differences in liver
scarcity across OPOs.
Gaming the Liver Transplant Market 551
at UC
LA B
iomedical Library S
erials on January 24, 2011jleo.oxfordjournals.org
Dow
nloaded from
for a patient to move across the country to an area with less liver scarcity.
Intuitively, two factors seem to limit sick patients from sorting across the coun-
try to compete away this variation: financial constraints and attachment to
home hospitals. It is often difficult to move away from your home to swait
for another liver. People who are in poor health often do not have the financial
resources to relocate across the country. Insurance may not cover procedures at
hospitals located further away from your home. Finally, some individuals may
be unaware of these differences and or have other attachments to local health-
care providers.
The boundaries of the OPOs that limit national sharing of organs are main-
tained in part for political reasons; areas with a relatively good supply of
organs are reticent to share them with other parts of the country. Within each
OPO, there are a variety of market structures; some OPOs only have one center
that provides liver transplants, and others have multiple transplant centers.
When a patient needs a liver, they join the waiting list that is specific to a par-
ticular center. Although a patient can be listed at multiple centers for a liver
transplant, during the sample period, this occurred approximately 4% of the
time. There are certain compatibility concerns based on blood type. The
matching requirements tend not to be as severe as those for kidney transplants.
Centers have discretion in the organs that they accept. When a center
decides whether to accept or decline an organ, there are no hard guidelines.
Centers make decisions on whether to accept a lower quality organ today based
on the expected probability of receiving a higher quality organ sometime in the
future (Howard 2002; Alagoz et al. 2007). The conclusions of these models
and from practice is that people who are very sick are more likely to receive
a marginal organ since the cost of waiting is exceptionally high.
The goal of the allocation system since the mid-1990s until today has been to
prioritize the sickest individuals first. This is certainly not the only welfare
criteria that could be used for allocation policy.11 During the period of study,
the stated goals of the program did not change, but the ways in which the
allocation scheme meant to implement those goals did. Prior to March 1,
2002, livers were allocated on both objective and subjective criteria.12 Priority
was determined on the basis of a discrete aggregation of clinical scores13 and
waiting list time. Since the scoring system was not continuous, this leads to
many patients being clumped together in terms of priority. Time on the waiting
list was used to distinguish between these patients and became one of the most
important factors in determining who received a liver and who did not.14 The
rules at the time stated that if a patient was in the ICU, they would move up the
11. Currently, in kidney transplants, there is a substantial debate over changing the kidney
allocation scheme to one based on net lifetime benefit, where kidneys go to those who would ben-
efit the most from them.
12. See the Institute of Medicine�s (1999) report for a detailed discussion of the allocation priorto the policy change. In the interest of space, I am only able to give a very brief overview.
13. This aggregation was called the Child-Turcotte-Pugh scoring system.
14. Unfortunately, prior research has shown that time on the waiting list was a poor predictor of
patient health.
552 The Journal of Law, Economics, & Organization, V26 N3
at UC
LA B
iomedical Library S
erials on January 24, 2011jleo.oxfordjournals.org
Dow
nloaded from
list ahead of anyone who was not in the ICU. Being moved into the ICU meant
being moved ahead of those who had been on the waiting list longer but were
not in the ICU. Once in the ICU, livers would then be allocated to patients
based on a discrete aggregation of clinical scores and then on the basis of
how long they have been in the ICU. Patients within an OPO had first priority,
but there was a system in place to promote limited regional sharing. If there
were no patients who required continuous medical care (either in the hospital
or at a facility close to the hospital), then a liver would be moved outside of the
OPO. This policy leads to about a fourth of the livers moving outside of their
home OPO.
The system was criticized for creating numerous incentives and opportuni-
ties to manipulate who gets a liver. Centers could put potential patients on the
waiting list years before they would actually need a liver so as to inflate their
waiting time. Many of the subjective indicators could also be manipulated. For
example, one of the subjective indicators transplant centers were required to
measure was the severity of ascites, which is an accumulation of fluid in the
abdomen. Without an invasive surgery, measurement of this condition is sub-
jective and left considerable discretion to the centers.15
Crucially, putting someone in the ICU improved their priority status, even
over those who had more time on the waiting list. There was some anecdotal
evidence that ICU admission was being used strategically. The most salient
case involved the University of Illinois� liver transplant program in the highly
competitive Chicago liver transplant market. It was claimed that ‘‘according to
the Chicago Tribune, some of the patients [in the ICU] at the University of
Illinois Medical Center spent weekends at home, one acted the part of a clown
at a blood drive, and another was at a restaurant having dinner when he got
word that a suitable liver had been located. Authorities alleged that one patient
on the list was not even eligible for transplantation’’ (Murphy 2004).16 Centers
could use the ICU strategically by admitting patients who were not critically ill
so as to move them ahead on the list. The University of Illinois was eventually
fined 2 million dollars by Medicare for this abuse of the transplant system.
In response to these problems, the United Network for Organ Sharing
(UNOS) completely changed the allocation policy by instituting the Model
for End-Stage Liver Disease (MELD) allocation policy.17 The MELD policy
was instituted on March 1, 2002. The MELD allocation policy for livers is
based on a linear combination of three clinical indicators: serum bilirubin,
International normalized ratio, and serum creatinine. These factors combined
to create a continuous MELD score that is strongly associated with severity of
liver disease. Higher MELD scores reflected higher expected mortality rates
for a patient with end-stage liver disease absent a transplant. After the policy
15. In response, it is widely believed that most centers gave almost everyone a high score. The
data to confirm this observation unfortunately do not exist.
16. Also, see Transplant News (November 30, 2003).
17. For more details on the policy change and some of its direct effects, see Freeman (2003),
Freeman et al. (2002), Trotter and Osgood (2004), and Wiesner et al. (2003).
Gaming the Liver Transplant Market 553
at UC
LA B
iomedical Library S
erials on January 24, 2011jleo.oxfordjournals.org
Dow
nloaded from
change, waiting list time and ICU status were no longer considered in the al-
location of livers. Priority was now based on clinical indicators that came from
blood tests, which are markedly more difficult indicators to manipulate.
4. Empirical Tests
Using the logic of Staw and Szwajkowski (1975) and Shleifer (2004), I pro-
pose a simple framework for analyzing the impact of competition on strategic
misrepresentation in the liver transplant market. Prior to the policy change
within an OPO with multiple competitors, it is sensible to believe that strategic
use of the ICU by centers to move patients ahead on the list can be a rational
outcome, absent the ability to commit to ethical strategies. If one center in an
OPO decided not to engage in strategically using the ICU, that center would
face the prospect of losing opportunities to perform liver transplants. More
centers should lead to more competition. After the policy change, the impact
of competition on strategic use of the ICU should be eliminated. This leads to
the following hypothesis:
Hypothesis 1. After the policy change, the rate of ICU usage should de-
crease more in OPOs with more centers.
A natural point of concern is that areas with more competitors may also have
sicker patients on average. If the patients are sicker in more competitive areas,
then hypothesis 1 could be true without strategic manipulation. This can be
addressed in a number of ways. First, it is possible to control for the underlying
number of sick patients on the waiting list. Second, I can construct an objective
clinical measure of illness at the time of transplant. This measure can be used
to examine what the threshold for admission to the ICU was. If strategic ma-
nipulation was present prior to the policy change, then in competitive areas,
there would be a higher likelihood that relatively healthy patients would be in
the ICU at transplant. If the policy change eliminated the incentives for this
behavior, then we have the following hypothesis.
Hypothesis 2. After the policy change, the MELD scores of patients trans-
planted from the ICU should increase more in OPOs with more centers.
Finally, it is important to know whether distortions to the sickest first pri-
oritization were more likely in OPOs with more firms. Consider a hypothetical
OPO with two centers. Suppose that both centers were equally aggressive in
admitting their sickest patients to the ICU prior to the reform. The sickest
patients would be moved into the ICU and consequentially to the top of
the list. Though the ICUwas being used excessively, the sickest patients would
still receive livers regardless of the attempt to manipulate the list. After the
reform, the ICU would be used less aggressively, relatively healthy patients
would be kept out of the ICU, but the average level of sickness of patients at the
time of transplant should remain unchanged. Empirically, I would expect to
554 The Journal of Law, Economics, & Organization, V26 N3
at UC
LA B
iomedical Library S
erials on January 24, 2011jleo.oxfordjournals.org
Dow
nloaded from
observe that the change in the average patient�s MELD scores at the time of
transplant induced by the policy reforms would not be influenced by the num-
ber of centers in an OPO. Alternatively, if the centers were using the ICU to
move relatively healthy people ahead of sicker people on the list, I would ex-
pect the average level of sickness of patients at the time of transplant to in-
crease after the reforms.
5. Data and Sample Selection
The data for this project come from a comprehensive database on every liver
transplant performed in the United States from the middle of 1987 to the end of
2008 maintained and provided free of charge from the UNOS. These patient-
level data include observations when (1) a patient registers for the waiting list,
(2) a patient gets a transplant, and (3) if a patient dies. In these data, there is
clinical information sufficient to create a MELD score for each patient,18 iden-
tification of the center where the patient was wait listed and received their
transplant at, when they were wait listed and transplanted, demographic data,
cause of liver disease, and whether they were in the ICU or not at transplant.
From these data, I was able to incorporate the identity of the OPO with each
center based on data publicly available on the UNOS Web site. Even though
the data are at the patient level, all the data are collapsed to the OPO/Month
level or the center/Month level.
To study the impact of the change in allocation policy, I restrict the sample
to 1 year before and 1 year after the policy shift. I use the identifiers provided in
the data set to define a center. One exception to this is the case of children�shospitals. Pediatric liver transplants performed at a children�s hospital are donein conjunction with a team at a hospital that performs adult liver transplants.
For example, in Chicago, both Northwestern Memorial Hospital and Child-
ren�s Memorial Hospital are in the Northwestern University system. The trans-
plant teams in both these hospitals work together and the surgeons at both
institutions are Northwestern faculty members. For the 17 children�s hospitalsin the data set, I searched to find what adult transplant program they were
affiliated with and merged the two together as one center.
Another difficulty with the data was that there were many observations
where theMELD score could not be computed because one of the three clinical
indicators was missing. To address this problem, I created predicted MELD
scores at transplant when one or two of the clinical factors were missing.
Though this is not desirable, it provides a useful way to incorporate more than
98% of the data into the analysis. The remaining observations where noMELD
score could be computed for a transplant recipient were dropped.
6. Empirical Strategy
I compare how the number of firms in an OPO influences the key outcome
variables: ICU usage rates, average sickness at the time of transplant,
18. Ocassionally, one component of the MELD score was missing. To make all the MELD
scores comparable across individuals that component was interpolated.
Gaming the Liver Transplant Market 555
at UC
LA B
iomedical Library S
erials on January 24, 2011jleo.oxfordjournals.org
Dow
nloaded from
percentage of healthy patients in the ICU, and share of patients in the ICU. This
comparison is done in two ways: in the cross section and through a difference
in differences approach. In the cross section, I look at how variation in the
number of firms across markets impacts the outcomes before and after the
policy change. One objection to this cross-sectional approach is that omitted
fixed characteristics at the OPO level drives the results. To address this
concern, I estimate how firms in competitive markets respond to the
change in policy. If there was more strategic manipulation of the list in markets
with more firms, then, for example, we would expect a decrease in the
percentage of patients who were admitted to the ICU relative to less compet-
itive markets.
To examine the impact of the number of firms on the different sets of out-
comes in the cross section before and after the policy shift, I use the following
specification at the OPO/Month level:
Outcomei;t ¼ b1FirmCounti þMontht þ ei;t: 1
Here, firm count is the number of distinct centers active during the 2-year sam-
ple period in a given OPO. Although the count of the number of firms in an
OPO is a crude measure of market competition, it has the advantage of being
plausibly exogenous. One could use a Herfindahl index based on number of
transplants performed, but the distribution of transplants is likely to be endo-
genously determined by the behaviors of moving patients into the ICU stra-
tegically. It also may be important to measure the presence of a small player in
the market since they could threaten the positions of the other firms in the
market. The Month variable is a fixed effect for each month in the sample,
so the same calendar month in separate years have separate fixed effects. Re-
gion is a fixed effect that controls for 11 different parts of the country. These
regions are approximately equal in size. This sentence has different font for
some reason.
To partially obviate the concerns about using a cross-sectional approach,
I employ a difference in differences estimation strategy:
Outcomei;t ¼ b1Firm Counti þ b2MELD erat � Firm Counti
þ b3Controlsi;t þ b4MELD erat � Controlsi;t
þ Montht þ OPOiþei;t:
2
Here, the identification of the impact of competition on the outcome of interest
is measured by the b3 parameter. This measures howOPOs with different num-
bers of firms respond to the policy change, whereMELD era equals zero before
the policy change and equals one afterward. Since there are dummies for each
month, the main effect of MELD era is absorbed. If the cross-sectional results
indicate an effect of competition on the outcome but there is no difference in
the response to the policy shift, the evidence would be far less compelling.
Since the variation in the market structure of the OPOs does not change over
time when the OPO fixed effects are included, the parameter b1 will be
absorbed. However, the interaction effect is still identified.
556 The Journal of Law, Economics, & Organization, V26 N3
at UC
LA B
iomedical Library S
erials on January 24, 2011jleo.oxfordjournals.org
Dow
nloaded from
To control for OPO-level characteristics that may confound the relationship
between the firm count and the outcome, I construct several control variables at
the OPO level. Sick ratio is a proxy for the scarcity of livers in a given OPO. To
construct this variable, I compute the number of patients who died waiting for
a transplant in a given month for every OPO and then divide by the cumulative
waiting list size in the OPO. Though somewhat crude, this ratio captures in part
the scarcity at the OPO level. I also create a monthly measure of the total num-
ber of transplants at the OPO level calledOPO volume. This is included because
it is possible that size of the OPO rather than the number of firms in the OPO
might be driving the relationship between the firm count and the outcome of
interest. To evaluate whether this is the case, it is important to control for the
number of livers transplanted in the OPO and the interaction of that variable
with MELD era. I also created a variable to capture the prestige of the medical
center. This control measures the percentage of centers in an OPO that were
listed in the 2002 U.S. News survey of hospitals as a top 25 center for digestive
disease.19 Finally, I use the waiting list data to construct a composite measure of
the average age, median income, and percentage of minorities on the waiting
list at the OPO level.20 For the characteristics where there is no panel varia-
tion,21 the main effect will be absorbed by the OPO-level fixed effect. However,
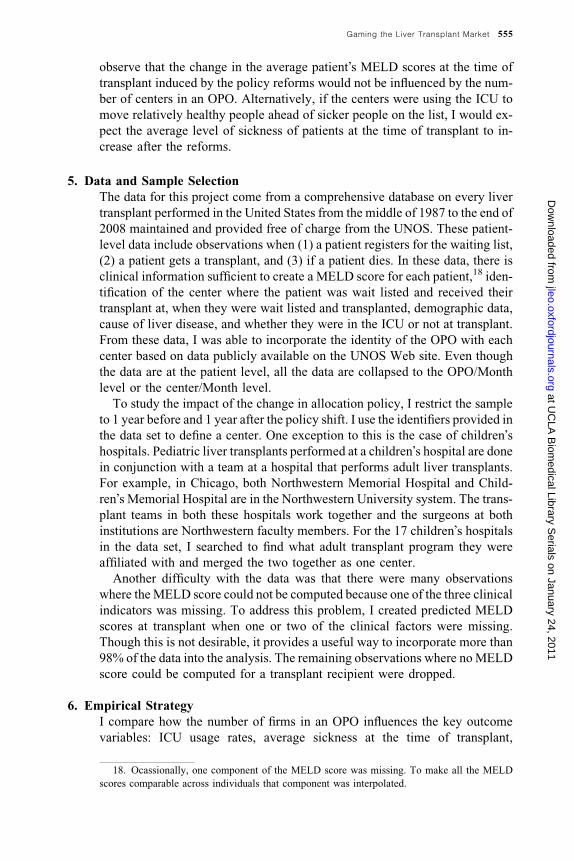
Figure 3. The Policy Change Occurred on March 1, 2002. MELD Scores are a Clinical
Measure of Illness. Higher Scores Imply Sicker Patients. Scores are Compute from the
UNOS STAR File.
19. Using top 25 nephrology programs yields similar results.
20. This measure was constructed from the average characteristics of each person added to the
wait list from January 1, 2000, to December 31, 2002.
21. The demographic characteristics and the center rankings.
Gaming the Liver Transplant Market 557
at UC
LA B
iomedical Library S
erials on January 24, 2011jleo.oxfordjournals.org
Dow
nloaded from
when these controls are interacted with the MELD era dummy, this interaction
is not absorbed by the OPO-level fixed effect.
There are further worries about specification (2) that could pollute the val-
idity of the regressions. First, if there are different trends in the movement of
the outcome variable of interest at the OPO level that could lead to an omitted
variables bias. Although the month fixed effects absorb the common changes
over time to the entire system, they do little to address changes at the OPO
level. Although it would be ideal to add OPO-specific month effects, this
would absorb all the variation to observe the parameter of interest b3. Onecompromise is to allow for quadratic trends at the OPO level. I create a qua-
dratic term for months centered at zero for March 2002 and going backward
and forward 1 unit for each month difference. Though this imposes a quadratic
structure on the trends, it is much less restrictive than not allowing for any
OPO-specific time changes. In other specifications, I interact the variable sick
ratio with the OPO fixed effects. The intention of this strategy is to estimate the
b3 parameter while flexibly controlling OPO-specific changes in the level of
scarcity.
Table 1. Summary Statistics
Pre-MELD era Post-MELD era
Total number of liver transplants 5221 5368
Percentage of patients coming from the ICU 24.38 13.38
Mean predicted MELD score at transplant 18.32 20.01
Percentage of patients with a predicted MELD
score greater than or equal to 25 at transplant
21.96 26.15
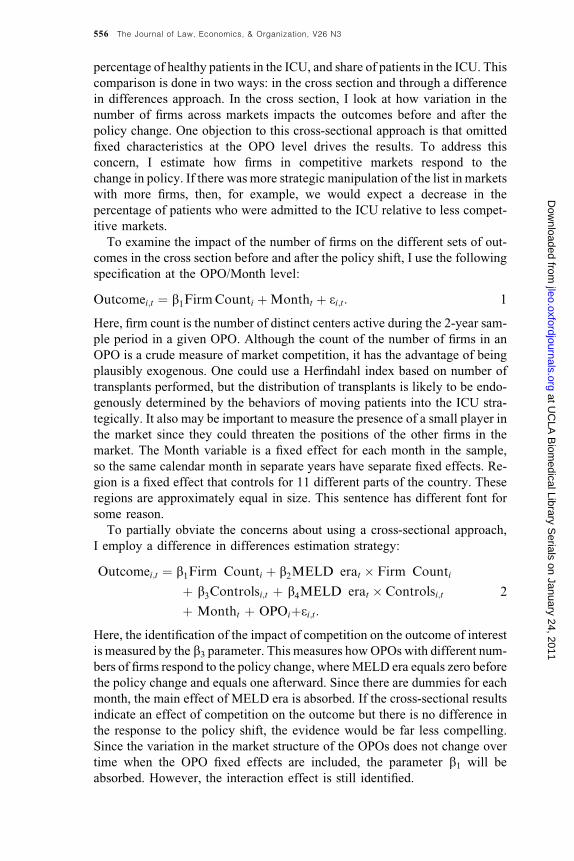
Figure 4. The Policy Change Occurred on March 1, 2002. Data Obtained from UNOS
STAR File.
558 The Journal of Law, Economics, & Organization, V26 N3
at UC
LA B
iomedical Library S
erials on January 24, 2011jleo.oxfordjournals.org
Dow
nloaded from
As a robustness test, I include a specification that interacts MELD era and
region22 to further allow for flexible time effects across geographically con-
nected OPOs. All the results are estimated using clustering at the OPO level.
This addresses the problem of serial correlation without which the regression
would assume that each observation is independent.
7. Results
7.1 Summary Statistics
In Figure 3, the average MELD score at transplant is computed on a monthly
basis. It is difficult to determine whether there is a discontinuous jump in the
average sickness at transplant, but it is clear that sickness of patients at trans-
plant is increasing over time.
Prior to the policy change, the average MELD score was 18.32 and after the
policy shifts, the average MELD score was 20.01 Table 1. Although the av-
erage sickness of patients at transplant was increasing over time, Figure 4
shows that there was a large discontinuous drop in ICU admissions. Intuitively,
one would think the opposite: As patients are getting sick, they should appear
in the ICU more on average. Strategic manipulation of the allocation process
leads to the opposite conclusion, when the incentive to place a patient in the
ICU decreases, the usage of the ICU decreases overall. This occurs despite the
fact that patients are getting sicker over time.
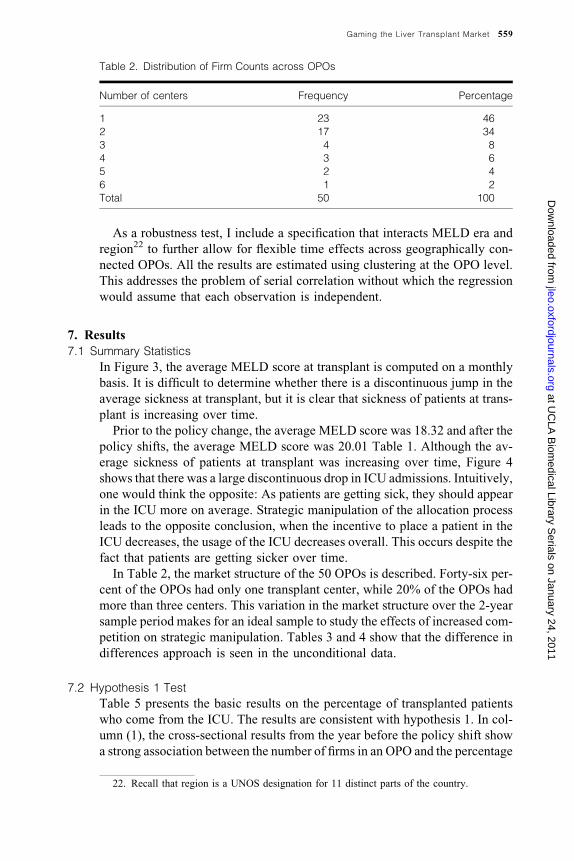
In Table 2, the market structure of the 50 OPOs is described. Forty-six per-
cent of the OPOs had only one transplant center, while 20% of the OPOs had
more than three centers. This variation in the market structure over the 2-year
sample period makes for an ideal sample to study the effects of increased com-
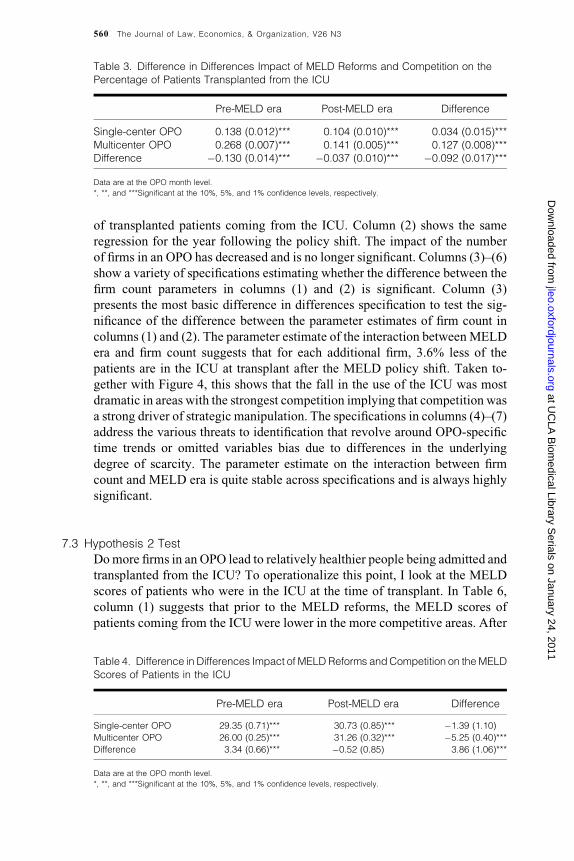
petition on strategic manipulation. Tables 3 and 4 show that the difference in
differences approach is seen in the unconditional data.
7.2 Hypothesis 1 Test
Table 5 presents the basic results on the percentage of transplanted patients
who come from the ICU. The results are consistent with hypothesis 1. In col-
umn (1), the cross-sectional results from the year before the policy shift show
a strong association between the number of firms in an OPO and the percentage
Table 2. Distribution of Firm Counts across OPOs
Number of centers Frequency Percentage
1 23 46
2 17 34
3 4 8
4 3 6
5 2 4
6 1 2
Total 50 100
22. Recall that region is a UNOS designation for 11 distinct parts of the country.
Gaming the Liver Transplant Market 559
at UC
LA B
iomedical Library S
erials on January 24, 2011jleo.oxfordjournals.org
Dow
nloaded from
of transplanted patients coming from the ICU. Column (2) shows the same
regression for the year following the policy shift. The impact of the number
of firms in an OPO has decreased and is no longer significant. Columns (3)–(6)
show a variety of specifications estimating whether the difference between the
firm count parameters in columns (1) and (2) is significant. Column (3)
presents the most basic difference in differences specification to test the sig-
nificance of the difference between the parameter estimates of firm count in
columns (1) and (2). The parameter estimate of the interaction betweenMELD
era and firm count suggests that for each additional firm, 3.6% less of the
patients are in the ICU at transplant after the MELD policy shift. Taken to-
gether with Figure 4, this shows that the fall in the use of the ICU was most
dramatic in areas with the strongest competition implying that competition was
a strong driver of strategic manipulation. The specifications in columns (4)–(7)
address the various threats to identification that revolve around OPO-specific
time trends or omitted variables bias due to differences in the underlying
degree of scarcity. The parameter estimate on the interaction between firm
count and MELD era is quite stable across specifications and is always highly
significant.
7.3 Hypothesis 2 Test
Domore firms in an OPO lead to relatively healthier people being admitted and
transplanted from the ICU? To operationalize this point, I look at the MELD
scores of patients who were in the ICU at the time of transplant. In Table 6,
column (1) suggests that prior to the MELD reforms, the MELD scores of
patients coming from the ICU were lower in the more competitive areas. After
Table 3. Difference in Differences Impact of MELD Reforms and Competition on the
Percentage of Patients Transplanted from the ICU
Pre-MELD era Post-MELD era Difference
Single-center OPO 0.138 (0.012)*** 0.104 (0.010)*** 0.034 (0.015)***
Multicenter OPO 0.268 (0.007)*** 0.141 (0.005)*** 0.127 (0.008)***
Difference �0.130 (0.014)*** �0.037 (0.010)*** �0.092 (0.017)***
Data are at the OPO month level.
*, **, and ***Significant at the 10%, 5%, and 1% confidence levels, respectively.
Table 4. Difference in Differences Impact of MELD Reforms andCompetition on theMELD
Scores of Patients in the ICU
Pre-MELD era Post-MELD era Difference
Single-center OPO 29.35 (0.71)*** 30.73 (0.85)*** �1.39 (1.10)
Multicenter OPO 26.00 (0.25)*** 31.26 (0.32)*** �5.25 (0.40)***
Difference 3.34 (0.66)*** �0.52 (0.85) 3.86 (1.06)***
Data are at the OPO month level.
*, **, and ***Significant at the 10%, 5%, and 1% confidence levels, respectively.
560 The Journal of Law, Economics, & Organization, V26 N3
at UC
LA B
iomedical Library S
erials on January 24, 2011jleo.oxfordjournals.org
Dow
nloaded from
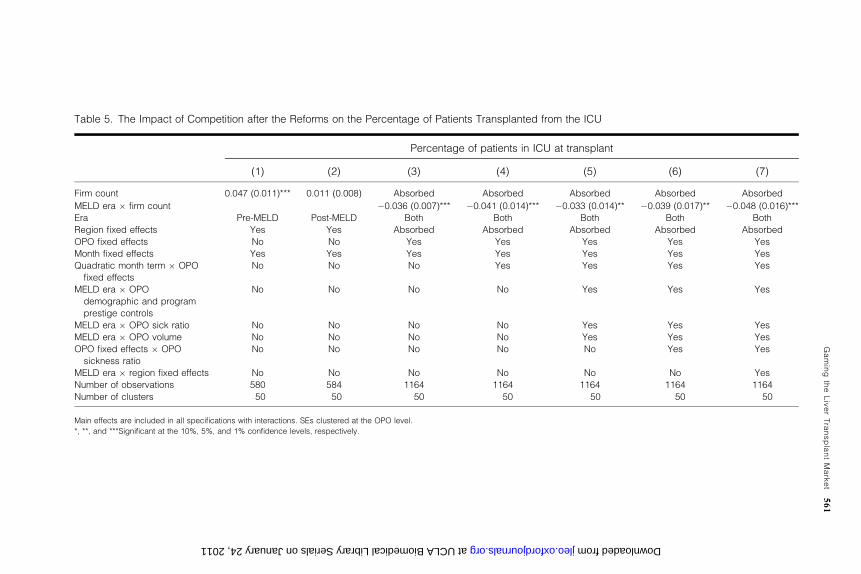
Table 5. The Impact of Competition after the Reforms on the Percentage of Patients Transplanted from the ICU
Percentage of patients in ICU at transplant
(1) (2) (3) (4) (5) (6) (7)
Firm count 0.047 (0.011)*** 0.011 (0.008) Absorbed Absorbed Absorbed Absorbed Absorbed
MELD era � firm count �0.036 (0.007)*** �0.041 (0.014)*** �0.033 (0.014)** �0.039 (0.017)** �0.048 (0.016)***
Era Pre-MELD Post-MELD Both Both Both Both Both
Region fixed effects Yes Yes Absorbed Absorbed Absorbed Absorbed Absorbed
OPO fixed effects No No Yes Yes Yes Yes Yes
Month fixed effects Yes Yes Yes Yes Yes Yes Yes
Quadratic month term � OPO
fixed effects
No No No Yes Yes Yes Yes
MELD era � OPO
demographic and program
prestige controls
No No No No Yes Yes Yes
MELD era � OPO sick ratio No No No No Yes Yes Yes
MELD era � OPO volume No No No No Yes Yes Yes
OPO fixed effects � OPO
sickness ratio
No No No No No Yes Yes
MELD era � region fixed effects No No No No No No Yes
Number of observations 580 584 1164 1164 1164 1164 1164
Number of clusters 50 50 50 50 50 50 50
Main effects are included in all specifications with interactions. SEs clustered at the OPO level.
*, **, and ***Significant at the 10%, 5%, and 1% confidence levels, respectively.
Gaming
theLiverTransplantMarket
561
at UCLA Biomedical Library Serials on January 24, 2011 jleo.oxfordjournals.org Downloaded from
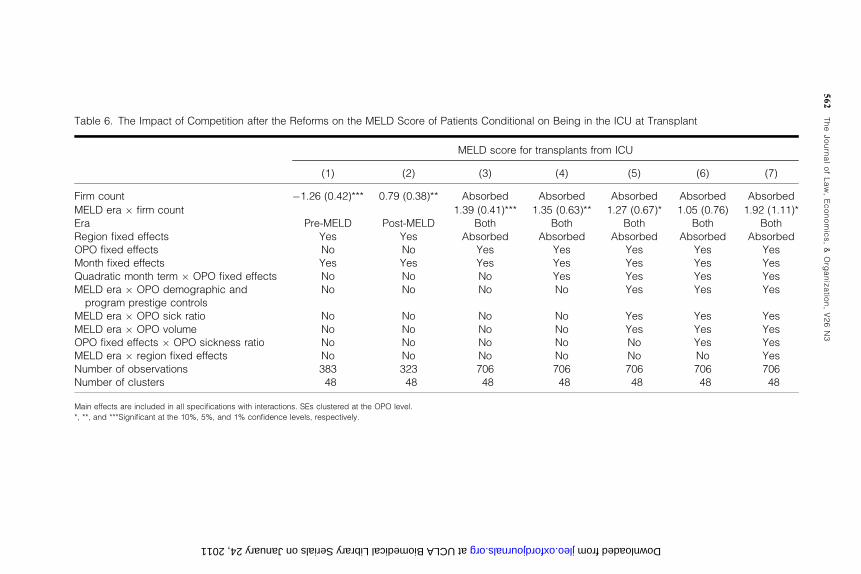
Table 6. The Impact of Competition after the Reforms on the MELD Score of Patients Conditional on Being in the ICU at Transplant
MELD score for transplants from ICU
(1) (2) (3) (4) (5) (6) (7)
Firm count �1.26 (0.42)*** 0.79 (0.38)** Absorbed Absorbed Absorbed Absorbed Absorbed
MELD era � firm count 1.39 (0.41)*** 1.35 (0.63)** 1.27 (0.67)* 1.05 (0.76) 1.92 (1.11)*
Era Pre-MELD Post-MELD Both Both Both Both Both
Region fixed effects Yes Yes Absorbed Absorbed Absorbed Absorbed Absorbed
OPO fixed effects No No Yes Yes Yes Yes Yes
Month fixed effects Yes Yes Yes Yes Yes Yes Yes
Quadratic month term � OPO fixed effects No No No Yes Yes Yes Yes
MELD era � OPO demographic and
program prestige controls
No No No No Yes Yes Yes
MELD era � OPO sick ratio No No No No Yes Yes Yes
MELD era � OPO volume No No No No Yes Yes Yes
OPO fixed effects � OPO sickness ratio No No No No No Yes Yes
MELD era � region fixed effects No No No No No No Yes
Number of observations 383 323 706 706 706 706 706
Number of clusters 48 48 48 48 48 48 48
Main effects are included in all specifications with interactions. SEs clustered at the OPO level.
*, **, and ***Significant at the 10%, 5%, and 1% confidence levels, respectively.
562
TheJournalofLaw,Economics,&
Org
anizatio
n,V26N3
at UCLA Biomedical Library Serials on January 24, 2011 jleo.oxfordjournals.org Downloaded from
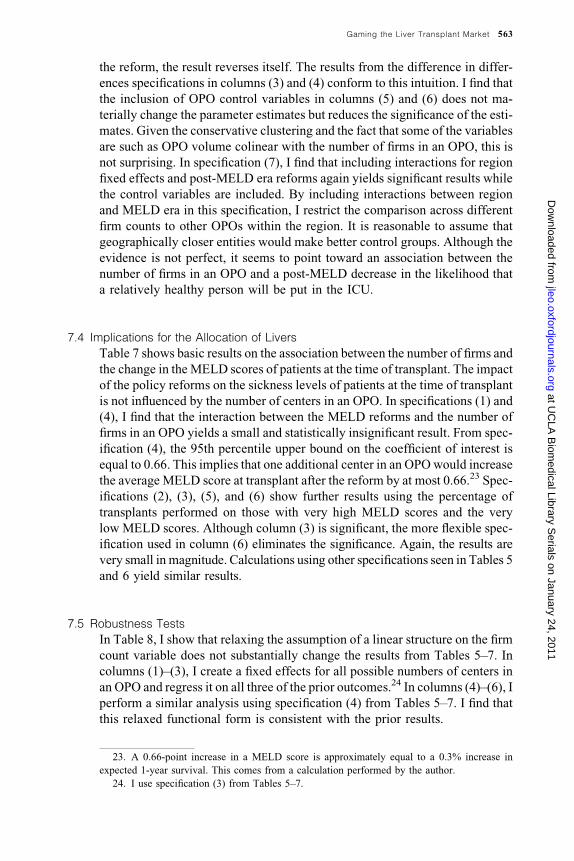
the reform, the result reverses itself. The results from the difference in differ-
ences specifications in columns (3) and (4) conform to this intuition. I find that
the inclusion of OPO control variables in columns (5) and (6) does not ma-
terially change the parameter estimates but reduces the significance of the esti-
mates. Given the conservative clustering and the fact that some of the variables
are such as OPO volume colinear with the number of firms in an OPO, this is
not surprising. In specification (7), I find that including interactions for region
fixed effects and post-MELD era reforms again yields significant results while
the control variables are included. By including interactions between region
and MELD era in this specification, I restrict the comparison across different
firm counts to other OPOs within the region. It is reasonable to assume that
geographically closer entities would make better control groups. Although the
evidence is not perfect, it seems to point toward an association between the
number of firms in an OPO and a post-MELD decrease in the likelihood that
a relatively healthy person will be put in the ICU.
7.4 Implications for the Allocation of Livers
Table 7 shows basic results on the association between the number of firms and
the change in theMELD scores of patients at the time of transplant. The impact
of the policy reforms on the sickness levels of patients at the time of transplant
is not influenced by the number of centers in an OPO. In specifications (1) and
(4), I find that the interaction between the MELD reforms and the number of
firms in an OPO yields a small and statistically insignificant result. From spec-
ification (4), the 95th percentile upper bound on the coefficient of interest is
equal to 0.66. This implies that one additional center in an OPOwould increase
the average MELD score at transplant after the reform by at most 0.66.23 Spec-
ifications (2), (3), (5), and (6) show further results using the percentage of
transplants performed on those with very high MELD scores and the very
low MELD scores. Although column (3) is significant, the more flexible spec-
ification used in column (6) eliminates the significance. Again, the results are
very small in magnitude. Calculations using other specifications seen in Tables 5
and 6 yield similar results.
7.5 Robustness Tests
In Table 8, I show that relaxing the assumption of a linear structure on the firm
count variable does not substantially change the results from Tables 5–7. In
columns (1)–(3), I create a fixed effects for all possible numbers of centers in
an OPO and regress it on all three of the prior outcomes.24 In columns (4)–(6), I
perform a similar analysis using specification (4) from Tables 5–7. I find that
this relaxed functional form is consistent with the prior results.
23. A 0.66-point increase in a MELD score is approximately equal to a 0.3% increase in
expected 1-year survival. This comes from a calculation performed by the author.
24. I use specification (3) from Tables 5–7.
Gaming the Liver Transplant Market 563
at UC
LA B
iomedical Library S
erials on January 24, 2011jleo.oxfordjournals.org
Dow
nloaded from
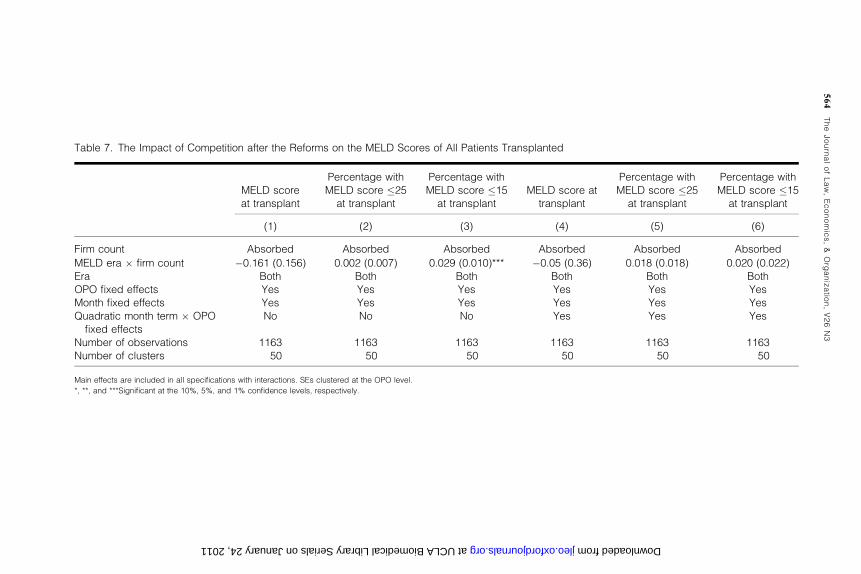
Table 7. The Impact of Competition after the Reforms on the MELD Scores of All Patients Transplanted
MELD score
at transplant
Percentage with
MELD score �25
at transplant
Percentage with
MELD score �15
at transplant
MELD score at
transplant
Percentage with
MELD score �25
at transplant
Percentage with
MELD score �15
at transplant
(1) (2) (3) (4) (5) (6)
Firm count Absorbed Absorbed Absorbed Absorbed Absorbed Absorbed
MELD era � firm count �0.161 (0.156) 0.002 (0.007) 0.029 (0.010)*** �0.05 (0.36) 0.018 (0.018) 0.020 (0.022)
Era Both Both Both Both Both Both
OPO fixed effects Yes Yes Yes Yes Yes Yes
Month fixed effects Yes Yes Yes Yes Yes Yes
Quadratic month term � OPO
fixed effects
No No No Yes Yes Yes
Number of observations 1163 1163 1163 1163 1163 1163
Number of clusters 50 50 50 50 50 50
Main effects are included in all specifications with interactions. SEs clustered at the OPO level.
*, **, and ***Significant at the 10%, 5%, and 1% confidence levels, respectively.
564
TheJournalofLaw,Economics,&
Org
anizatio
n,V26N3
at UCLA Biomedical Library Serials on January 24, 2011 jleo.oxfordjournals.org Downloaded from
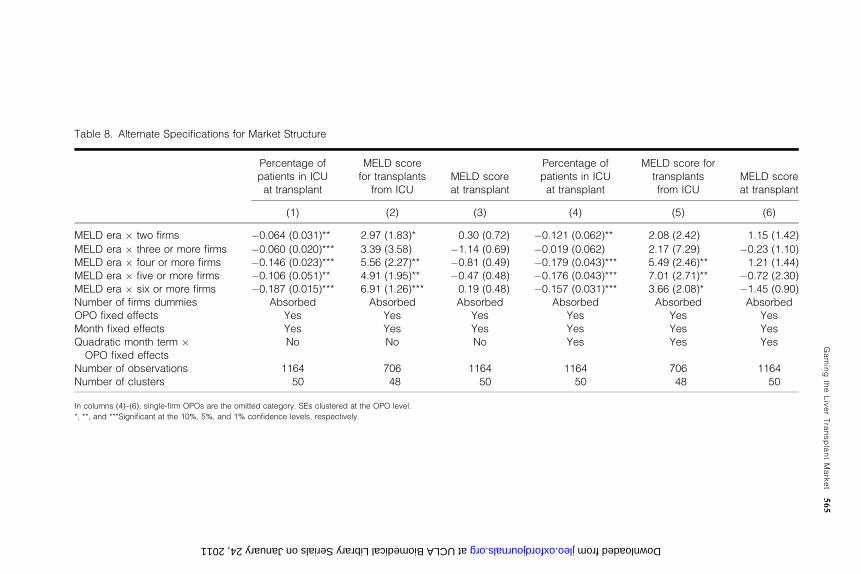
Table 8. Alternate Specifications for Market Structure
Percentage of
patients in ICU
at transplant
MELD score
for transplants
from ICU
MELD score
at transplant
Percentage of
patients in ICU
at transplant
MELD score for
transplants
from ICU
MELD score
at transplant
(1) (2) (3) (4) (5) (6)
MELD era � two firms �0.064 (0.031)** 2.97 (1.83)* 0.30 (0.72) �0.121 (0.062)** 2.08 (2.42) 1.15 (1.42)
MELD era � three or more firms �0.060 (0.020)*** 3.39 (3.58) �1.14 (0.69) �0.019 (0.062) 2.17 (7.29) �0.23 (1.10)
MELD era � four or more firms �0.146 (0.023)*** 5.56 (2.27)** �0.81 (0.49) �0.179 (0.043)*** 5.49 (2.46)** 1.21 (1.44)
MELD era � five or more firms �0.106 (0.051)** 4.91 (1.95)** �0.47 (0.48) �0.176 (0.043)*** 7.01 (2.71)** �0.72 (2.30)
MELD era � six or more firms �0.187 (0.015)*** 6.91 (1.26)*** 0.19 (0.48) �0.157 (0.031)*** 3.66 (2.08)* �1.45 (0.90)
Number of firms dummies Absorbed Absorbed Absorbed Absorbed Absorbed Absorbed
OPO fixed effects Yes Yes Yes Yes Yes Yes
Month fixed effects Yes Yes Yes Yes Yes Yes
Quadratic month term �OPO fixed effects
No No No Yes Yes Yes
Number of observations 1164 706 1164 1164 706 1164
Number of clusters 50 48 50 50 48 50
In columns (4)–(6), single-firm OPOs are the omitted category. SEs clustered at the OPO level.
*, **, and ***Significant at the 10%, 5%, and 1% confidence levels, respectively.
Gaming
theLiverTransplantMarket
565
at UCLA Biomedical Library Serials on January 24, 2011 jleo.oxfordjournals.org Downloaded from
Finally, in unreported results,25 I find that organ acceptance policies do not
change after the MELD policy. Using age of the donor26 as a proxy for organ
quality, I find no effect on the interaction between firm count and MELD era
using specifications similar to Tables 5–7. This issue is of concern since
marginal organs often go to very sick patients. If after the MELD era OPOs
with more firms became less likely to accept marginal organs, then transplants
from the ICU would also go down. The evidence is not consistent with this
explanation.
8. Conclusions
This article shows that the number of firms in the OPO appears to be robustly
associated with increases in strategic behavior in the liver transplant market
prior to the MELD reforms. The findings suggest that when centers are faced
with opportunities to reallocate livers from the patients of other centers to their
own patients, these opportunities were taken. I found that prior to the reforms,
competition encouraged centers to use the ICU more often for patients who
were relatively healthy. There was little evidence to suggest that this distorted
the level of sickness of patients at transplant. This suggests that centers used
the ICU to make sure that their sickest patients maintained a high priority on
the waiting list. The aggressive use of the ICU in OPOs with many firms did
not seem to significantly distort away from the intended policy of prioritizing
the sickest patients first for a liver transplant.
One important issue to note is that these estimates should not be interpreted
as a causal relationship between competition and ethical behavior. Although
the policy change enables me to observe a change in gaming behavior, I do not
have a good instrument for competition across OPOs. Although it is likely that
many exogenous factors shaped the current market structure, it is difficult to
isolate these factors in the form of an instrument.
Another issue to note is that there is considerable ambiguity in the welfare
implications of the gaming of the liver list. Strategically manipulating the list
for the benefit of a relatively healthy patient at the expense of a relatively sick,
one could be welfare improving. An anecdotal observation among transplant
surgeons is that patients often stay at their level of activity prior to transplant.
So, if a patient was not working prior to transplant, anecdotally they do not
return to work. By providing a liver to a patient sooner rather than later, the
patient�s benefit from the organ could be larger. However, if the sole purpose of
strategically manipulating the list was to get healthier patients� livers, then weshould not see such a strong association between the number of firms and gam-
ing behavior. Examining these broader ethical issues of strategic manipulation
is interesting but is beyond the capabilities of this article.
25. Results available upon request.
26. Although age is not a perfect proxy for organ quality, it is one of the proxies that is uni-
formly collected and easily observable. This is an important measure of quality in Howard (2002).
566 The Journal of Law, Economics, & Organization, V26 N3
at UC
LA B
iomedical Library S
erials on January 24, 2011jleo.oxfordjournals.org
Dow
nloaded from
Further work is needed to assess how general these results are. In principle,
similar findings to those in this article might be present where it is possible to
strategically misrepresent some characteristic to gain access to a scarce re-
source. Allocating scarce physician time and admissions to college are two
plausible areas where strategic misrepresentation of need or candidate quality
could be increasing in competition for access to resources.
Funding
Searle Center at the Northwestern University School of Law.
References
Alagoz, O., L. Maillart, A. Schaefer, and M. Roberts. 2007. ‘‘Determining the Acceptance of
Cadaveric Livers Using an Implicit Model of theWaiting List,’’ 55Operations Research 23–36.
Berry, S., and J. Waldfogel. 1999. ‘‘Free Entry and Social Inefficiency in Radio Broadcasting,’’ 30
Rand Journal of Economics 397–420.
Cai, H., Q. Liu, and G. Xiao. 2007. ‘‘Does Competition Encourage Unethical Behavior? The Case
of Corporate Profit Hiding in China,’’ Working Paper. Los Angeles: University of California.
Carter, G., J. Newhouse, and D. Relles. 1990. ‘‘How Much Change in the Case Mix Index Is DRG
Creep,’’ 9 Journal of Health Economics 411–28.
Cutler, D. 1995. ‘‘The Incidence of Adverse Medical Outcomes Under Prospective Payment,’’ 63
Econometrica 29–50.
Dafny, L. 2005. ‘‘How Do Hospitals Respond to Price Changes?’’ 95 American Economic Review
1525–47.
Davis, P. 2006. ‘‘Measuring the Business Stealing, Cannibalization and Market Expansion Effects
of Entry in the US Motion Picture Exhibition Market,’’ 54 Journal of Industrial Economics
293–321.
Dranove, D., M. Shanley, and C. Simon. 1992. ‘‘Is Hospital Competition Wasteful,’’ 23 Rand
Journal of Economics 247–62.
Dubinsky, A. J, and T. Ingram. 1984. ‘‘Correlates of Salespeoples Ethical Conflict—An Explor-
atory Investigation,’’ 3 Journal of Business Ethics 343–53.
Ford, R., and W. Richardson. 1994. ‘‘Ethical Decision-Making—A Review of the Empirical Lit-
erature,’’ 13 Journal of Business Ethics 205–21.
Freeman, R. 2003. ‘‘Meld/Peld: One Year Later,’’ 35 Transplantation Proceedings 2425–27.
Freeman, R., R. Wiesner, A. Harper, S. McDiarmid, J. Lake, E. Edwards, R. Merion, R. Wolfe,
J. Turcotte, and L. Teperman. 2002. ‘‘The New Liver Allocation System: Moving Toward
Evidence-Based Transplantation Policy,’’ 8 Liver Transplantation 851–58.
Gilman, B. H. 2000. ‘‘Hospital Response to DRGRefinements: The Impact ofMultiple Reimburse-
ment Incentives on Inpatient Length of Stay,’’ 9 Health Economics 277–94.
Gruber, J., andM. Owings. 1996. ‘‘Physician Financial Incentives and Cesarean Section Delivery,’’
27 Rand Journal of Economics 99–123.
Hegarty, W., and H. Sims. 1978. ‘‘Some Determinants of Unethical Decision Behavior—
Experiment,’’ 63 Journal of Applied Psychology 451–57.
Howard, D. 2002. ‘‘Why Do Transplant Surgeons Turn Down Organs? A Model of the Accept
Reject Decision,’’ 21 Journal of Health Economics 957–69.
Hsieh, C., and E. Moretti. 2003. ‘‘Can Free Entry Be Inefficient? Fixed Commissions and Social
Waste in the Real Estate Industry,’’ 111 Journal of Political Economy 1076–122.
Institute of Medicine. 1999. ‘‘Organ Procurement and Transplantation: Assessing Current Pol-
icies and the Potential Impact of the DHHS Final Rule,’’ Washington, DC: National Academy
Press.
Kessler, D., and J. Geppert. 2005. ‘‘The Effects of Competition on Variation in the Quality and
Cost of Medical Care,’’ 14 Journal of Economics & Management Strategy 575–89.
Gaming the Liver Transplant Market 567
at UC
LA B
iomedical Library S
erials on January 24, 2011jleo.oxfordjournals.org
Dow
nloaded from
Kessler, D., andM.McClellan. 2000. ‘‘Is Hospital Competition SociallyWasteful?’’ 115Quarterly
Journal of Economics 577–615.
Loe, T., L. Ferrell, and P. Mansfield. 2000. ‘‘A Review of Empirical Studies Assessing Ethical
Decision Making in Business,’’ 25 Journal of Business Ethics 185–204.
Milgram, S. 1963. ‘‘Behavioral-Study of Obedience,’’ 4 Journal of Abnormal Psychology 371–8.
Murphy, T. 2004. ‘‘Gaming the Transplant System,’’ 4 American Journal of Bioethics 28.
Psaty, B., R. Boineau, L. Kuller, and R. Luepker. 1999. ‘‘The Potential Costs for Upcoding for
Heart Failure in the United States,’’ 84 American Journal of Cardiology 108–9.
Scalet, S. 2006. ‘‘Prisoner�s Dilemmas, Cooperative Norms, and Codes of Business Ethics,’’ 65
Journal of Business Ethics 309–23.
Scanlon, D., C. Hollenbeak, W. Lee, E. Loh, and P. Ubel. 2004. ‘‘Does Competition for Trans-
plantable Hearts Encourage �Gaming� of the Waiting List?’’ 23 Health Affairs 191–198.
Shleifer, A. 2004. ‘‘Does Competition Destroy Ethical Behavior?’’ 94 American Economic Review
414–18.
Silverman, E., and J. Skinner. 2004. ‘‘Medicare Upcoding and Hospital Ownership,’’ 23 Journal of
Health Economics 369–89.
Staw, B., and E. Szwajkowski. 1975. ‘‘Scarcity-Munificence Component of Organizational Envi-
ronments and Commission of Illegal Acts,’’ 20 Administrative Science Quarterly 345–54.
Transplant News, ‘‘University of Illinois, Chicago Settles Lawsuit Alleging Liver TransplantWait-
ing List Improprieties,’’ 13 November 30, 2003.
Trevino, L., G. Weaver, and S. Reynolds. 2006. ‘‘Behavioral Ethics in Organizations: A Review,’’
32 Journal of Management 951–90.
Trotter, J., and M. Osgood. 2004. ‘‘Meld Scores of Liver Transplant Recipients According to Size
of Waiting List—Impact of Organ Allocation and Patient Outcomes,’’ 291 Journal of the
American Medical Association 1871–74.
Vaughn, D. 1983.Controlling Unlawful Organizational Behavior: Social Structure and Corporate
Misconduct. Chicago, IL: University of Chicago Press.
Wiesner, R., E. Edwards, R. Freeman, A. Harper, R. Kim, P. Kamath, andW. Kremers, et al. 2003.
‘‘Model for End-Stage Liver Disease (Meld) and Allocation of Donor Livers,’’ 124
Gastroenterology 91–6.
568 The Journal of Law, Economics, & Organization, V26 N3
at UC
LA B
iomedical Library S
erials on January 24, 2011jleo.oxfordjournals.org
Dow
nloaded from