Embed Size (px)
Citation preview

GAMIFICATION AND ALGEBRA 1: WILL A GAMIFIED CLASSROOM
INCREASE STUDENT ACHIEVEMENT AND MOTIVATION?
____________
A Thesis
Presented
to the Faculty of
California State University, Chico
____________
In Partial Fulfillment
of the Requirements for the Degree
Master of Science
in
Mathematics Education
____________
by
Kathleen Urrutia
Summer 2014


iii
TABLE OF CONTENTS
PAGE
List of Tables ............................................................................................................. v
List of Figures ............................................................................................................ vi
Abstract ...................................................................................................................... vii CHAPTER I. Introduction................................................................................................. 1
Background of Study ......................................................................... 1 Statement of the Problem................................................................... 2 Purpose of the Study .......................................................................... 3 Definition of Terms............................................................................ 7
II. Literature Review........................................................................................ 9
What is Gamification ......................................................................... 9 What Makes Games Motivating?....................................................... 9 Gamification in Education ................................................................. 10 Reasons to Gamify............................................................................. 11 Mastery Learning Model.................................................................... 12
III. Methodology............................................................................................... 14
Design of Investigation and Treatment.............................................. 14 Sample................................................................................................ 15 Data Collection .................................................................................. 16 Data Analysis Procedure.................................................................... 18 Anticipated Results ............................................................................ 23 Limitations ......................................................................................... 23
IV. Findings....................................................................................................... 25
RQI..................................................................................................... 25 RQ2.................................................................................................... 30

iv
CHAPTER PAGE
V. Discussion................................................................................................... 36 Initial Findings ................................................................................... 36
References.................................................................................................................. 42 Appendices
A. “Feelings about Mathematics” Survey Given at Beginning and End of School Year ................................................................................ 46
B. Consent Letter............................................................................................. 48 C. Data Collection Part 1 and Part 2 for Treatment (Gamified Group)........... 50 D. Data Collection Part 1 and Part 2 for Traditional Group ............................ 54 E. Level Tests .................................................................................................. 62

v
LIST OF TABLES
TABLE PAGE
1. Student Groups by Percent .............................................................................. 16
2. t-Test: Two Sample Assuming Unequal Variances ........................................ 26
3. t-Test: Two Sample Assuming Unequal Variances ........................................ 27
4. t-Test: Two Sample Assuming Unequal Variances ........................................ 28
5. t-Test: Two Sample Assuming Unequal Variances ........................................ 28
6. t-Test: Two Sample Assuming Unequal Variances ........................................ 29
7. paired t-Test..................................................................................................... 31
8. t-Test: Two Sample Assuming Unequal Variances ........................................ 32
9. t-Test: Two Sample Assuming Unequal Variances on Multiple Questions ................................................................................................... 33

vi
LIST OF FIGURES
FIGURE PAGE
1. Data Collection Procedure............................................................................... 17

vii
ABSTRACT
GAMIFICATION AND ALGEBRA 1: WILL A GAMIFIED CLASSROOM
INCREASE STUDENT ACHIEVEMENT AND MOTIVATION?
by
Kathleen Urrutia
Master of Science in Mathematics Education
California State University, Chico
Summer 2014
This study investigated how implementing the mastery learning model with
gamification techniques affected student achievement and motivation. At Inspire School
of Arts and Sciences, many math teachers are challenged by students who are
unmotivated and unengaged.
In this study, an Algebra 1 teacher at Inspire implemented mastery learning
with gamification into her class. Average test scores of 13 exams of students in a
gamified Algebra 1 class were compared to the average test scores of 13 of the same
exams in the traditional Algebra 1 class. Each Algebra 1 test consists of the following
types of questions: Knowledge, Comprehension, Application, and Analysis, Synthesis,
Evaluation. A statistical test was used to compare each category of the test between the
gamified (treatment) group and the traditional group. The exam data was analyzed to
determine the following:
viii
How do the students’ average test scores in the gamified classroom compare to
those of students in the traditional classroom?
Does the gamified approach have a larger impact on test performance with
either the higher or lower block of students?
A “Feelings About Mathematics” survey was also administered to all Algebra
1 students receiving the gamification treatment at the beginning of the school year with
23 Likert Score questions. The same survey was subsequently administered at the end of
the year to all Algebra 1 students (gamification and traditional groups. The data was
analyzed to determine if there was a difference between students’ attitude towards
mathematics in the gamified classroom and the traditional classroom at the end of the
school year and whether the gamified course opinions changed from the beginning of the
school year to the end.
The results of this study indicate the following:
1. Students in the gamified group scored significantly higher on average test scores
throughout the school year.
2. Students in the gamified group scored significantly higher on the knowledge,
comprehension, and application sections of the tests. There was no difference between
the two groups on the synthesis, analysis, and evaluation section.
3. Students in the gamified group had a more positive attitude about mathematics
than they did at the beginning of the year.
4. At the end of the school year students in the gamified group had a more positive
attitude about mathematics than the traditional group.

1
CHAPTER I
INTRODUCTION
Background of Study
Too often mathematics instruction focuses on rote drill, practice, and
memorization facts (Lesser, 2000, p. 372) causing students to not have an inherent
interest in mathematics. Specifically, the Algebra 1 proficiency levels have historically
been low at Inspire. Data from the past three years indicate that in the 2010-2011 school
year, 12% of Algebra 1 students were proficient or advanced, 10% in the 2011-2012
school year, and 29% in the 2012-2013 school year. Although there was a jump from
10% proficiency to 29% in one year, there was still room for improvement (California
Department of Education, 2013a).
It is evident that many children and adults spend a great amount of time
playing video games (Griffiths, 2002). One reason that kids love playing video games is
that they “are learning a new interactive language that grants them access to virtual
worlds that are filled with intrigue, engagement and meaningful challenges” (Levasseur,
2011).
Although video games can often have a negative connotation, evidence
suggests that gaming can be beneficial. There are many reasons why gaming in education
can be useful (Griffiths, 2002):

2
Videogames attract participation by individuals across many demographic
boundaries (e.g., age, gender, ethnicity, educational status)
Videogames can assist children in setting goals, ensuring goal rehearsal,
providing feedback, reinforcement, and maintaining records of behavioral change.
Videogames can be useful because they allow the researcher to measure
performance on a very wide variety of tasks, and can be easily changed, standardized and
understood.
Videogames can be used when examining individual characteristics such as
self-esteem, self-concept, goal setting and individual differences.
Videogames are fun and stimulating for participants.
Video games also reinforce to players that it is okay to be wrong and to try and try again.
Sir Ken Robinson discusses in his TED talk, “How Schools Kill Creativity,” that our
educational system has stigmatized mistakes (Robinson, 2006). Our students are terrified
of being wrong or making a mistake (Robinson, 2006). We must be prepared to be
wrong, as it helps us come up with creative solutions or solve complex problems. Video
games embed trial and error into the foundation of the game. (Levassaeur, 2011).
Statement of the Problem
Algebra 1 at the high school level is a course that has many different types of
students enrolled. Some of these students are freshmen entering their first year of high
school, who are eager and ready to learn. Some of these students are seniors who need the
Algebra credit to graduate and are retaking the class for possibly their second or third
time. For some students, the learning comes quickly and they are ready to keep moving

3
through the course. For others, it is very difficult and they are pushed to higher levels
before they are ready. There is a wide range of experiences, abilities, and needs that
students in Algebra 1 at the high school level bring with them. Regardless of their
differences, students are expected to learn the same material and master the same
concepts. Teaching and helping all students succeed is a challenging and requires
differentiating instruction. Differentiated instruction is a method in which teachers
structure the learning environment addressing a variety of learning styles, abilities, and
interests in a classroom (Willoughby, 2005). Each student is somewhat unique and may
need to move through the Algebra 1 curriculum at a different pace than their peers.
Gamification is a way of differentiation that can be used in any classroom to promote
learning at the right pace for each student.
This study examines the impact gamification in the Algebra 1 class has on
student performance and motivation. It focuses on two research questions:
1. Does implementing the mastery learning model and gamification techniques
into the classroom increase student achievement?
2. Does implementing the mastery learning model and gamification techniques
into the classroom improve student engagement, motivation, and attitude toward
mathematics?
Purpose of Study
The purpose of this study was to determine if implementing gamification
techniques into an Algebra 1 class will increase student achievement and general
disposition toward mathematics. The study began at the start of the fall semester 2013.
4
On the first day of school, students in the treatment group were introduced to
gamification and given a description of how it would work in class.
Gamified Treatment
The Algebra 1 curriculum for the semester was broken into levels. Each level
had a learning target consisting of two to three objectives. Objectives were written by the
math department at Inspire based on the CPM curriculum, California state standards, and
common core standards. A level does not correlate with a chapter or unit in the book.
Each level had a set of tasks that the student must complete before taking the level test.
All levels and level tasks were outlined on the teacher website for students to
view at their convenience. The following are level tasks:
Missions: These are assignments that students must complete. They may be an
assignment out of the textbook, a worksheet, etc.
Quest: An exploration that students did in class. They had the option to work by
themselves, with a partner, or with a group. Quests are student lead with the teacher as a
facilitator.
Multi-Player Quest: An exploration that must be done in groups or with a
partner in class. Students were directed to the discussion board forum on the teacher’s
website to help them form groups or pairs.
Tutorial: A screencast video that students can view to get information on the
objective they are learning. This takes the place of the typical lecture. Some screencasts
were created by other Algebra 1 teachers at Inspire, or consist of additional resources
such as Khan Academy or YouTube.

5
Checkpoint: A mini quiz that students could take online. These mini quizzes had
a time limit, were multiple choice, and students could retake the quiz up to 3 times.
SubBoss: A quiz that students took in class. This included prerequisite skills
needed to learn the current objective. If a student did not pass the “SubBoss”, then they
were required to remediate and retake it.
BossBattle: The test at the end of the level
The level test, BossBattle, was a set of questions based on the objective(s) for
the level. Each level test was broken into four parts based on Blooms Taxonomy:
Knowledge (0-1 points), Comprehension (0-2 points), Application (0-4 points), and
Analysis/Synthesis/Evaluation (0-3 points). If a student got a score of a 7 or higher, they
could move on to the next level. If the student received anything lower, they were
required to remediate. Remediation consisted of extra practice and instruction. When
ready, the student could retake a different version of the level test. The higher of the two
test scores was used for the student’s grade.
Students were able to move through the Algebra 1 course as quickly as they
preferred. Students were not all working in the same level at the same time; therefore
they were working on different tasks during class time. On any given day, some students
were watching a tutorial on the computer, some were working on a quest, and others
were fighting the bossbattle. Class started and ended everyday as a whole group. This
time included whole class discussion, reflection and writing in their learning logs.
Students’ grades in the class were dependent on how many Experience Points
(XP) they achieved in the semester. Experience points were earned by completing

6
missions, quests, multi-player quests, tutorials, checkpoints, sub-bosses, and boss battles.
Since students were moving at their own pace, there was a suggested pacing guide given
to students by the teacher to help them plan their learning. Students would know before
they started the level the last possible day that they could take the level test. If a student
was still having difficulty completing all assignments during that time, they would work
one-on-one during class with the teacher or a student aide that was also present in class.
The student was also advised to come in during lunch or after school for additional
support.
Control Group Treatment
The Algebra 1 sections that did not receive the gamification treatment took the
same 16 exams throughout the semester. The exams from all of the classes were graded
on a common rubric by any of the three Algebra 1 teachers. In the traditional classroom,
students worked through the material of a given unit together with their class within the
same time frame. They all took the exam at the end of the unit. The teacher graded the
exam and the following day the class was split into two groups. The first group, being
those students who were successful on the exam, did an enrichment activity. The other
group that did not perform on the exam and received a grade less than 7 out of 10
remediated and retook a different version of the exam.
In the gamified classroom, students did not all take the exam on the same
given day. They took the exam when they had completed all given assignments for the
unit (level) and felt adequately prepared (or on the last possible date allowed). Some
students took the exam before the traditional classes took it and some took it after. The
teacher graded the exam and the following day if they needed to remediate, they would

7
do so and then retake a different version of the test. Students were not given an
enrichment activity like the traditional class. Indeed, if they passed the exam, they moved
on to the next level.
Definition of Terms
Gamification
The use of game mechanics, dynamics, and frameworks to promote desired
behaviors, has found its way into domains like marketing, politics, health and fitness,
with analysts predicting that it will become a multi-billion dollar industry by 2015
(MacMillan, 2011). Gamification is not the actual use of video games, rather using the
techniques of video games to drive user behavior.
Mastery Learning Model
Mastery learning uses differentiated and individualized instruction, progress
monitoring, formative assessment, feedback, corrective procedures, and instructional
alignment to minimize achievement gaps (Bloom, 1971; Zimmerman & Dibenedetto,
2008).
Traditional Model
In this study, the traditional model refers to students in the two Algebra 1
classes who are not receiving the gamification as a treatment.
Blooms Taxonomy
A way of organizing levels of thinking in order to promote higher levels of
thinking in education. There are six major categories that can be thought of as degree of
difficulty:

8
Knowledge: Recall data or information
Comprehension: Understand the meaning, translation, interpolation, and
interpretation of instructions and problems. State a problem in one’s own words.
Application: Use a concept in a new situation or unprompted use of an
abstraction. Applies what was learned in the classroom into novel situations in the work
place.
Analysis: Separates material or concepts into component parts so that its
organizational structure may be understood. Distinguishes between facts and inferences.
Synthesis: Builds a structure or pattern from diverse elements. Put parts together
to form a whole, with emphasis on creating a new meaning or structure.
Evaluation: Make judgments about the value of ideas or materials.
For this study, the analysis, synthesis, and evaluation categories have been grouped
together.
California Standardized Test (CST)
The California Standardized Test (CST) is a state mandated test up through
the school year 2012-2013 which measures a student’s skills in English Language Arts
and Mathematics and if their skills are at grade level. For this study, we will only be
focusing on the math section.
Differentiated Instruction
A method in which teachers structure learning environments that address the
variety of learning styles, interests, and abilities within a classroom.

9
CHAPTER II
LITERATURE REVIEW
What is Gamification?
Gamification is starting to become very popular all over the world and can be
applied in most industries (MacMillan, 2011). Gamification, defined as the use of game
mechanics, dynamics, and frameworks to promote desired behaviors, has found its way
into domains like marketing, politics, health and fitness, with analysts predicting that it
will become a multi-billion dollar industry by 2015 (MacMillan, 2011). Gamification is
not the actual use of video games, rather using the techniques of video games to drive
user behavior.
What Makes Games Motivating?
Games are designed for success otherwise they would not be played. They
activate intrinsic motivation by offering clear (compelling, uncertain, desirable,
worthwhile) goals combined with an intense and varied feedback system (McGonigal,
2011). Video games stimulate the development of mastery through leveling up, having
challenges and tasks that adapt to the players skills and abilities. The tasks are not too
hard where one would give up or too easy, where one is not challenged. This is what gets
people to continue playing (Whyte, 2013).

10
People are engaged when their brain is rewarded which evokes positive
emotions. Games give off a range of powerful emotions including wonder, curiosity,
frustration, and joy that impacts a player’s attention and facilitates learning (Lazarro,
2004). When learners participate in challenges at individual achievable levels, their
brains give more effort and make them more responsive to feedback (Whyte, 2013)
Gamification in Education
Schools already have several game-like elements. Students get points for
completing assignments, which transfer to a letter grade; which can be a badge in a game.
Students are rewarded for positive behavior and if they perform well enough they “level-
up” at the end of the academic year. With these features, it would appear that schools
already have a gamified experience. However, “something about this environment fails to
engage students… The default environment of schools often results in undesirable
outcomes such as disengagement, cheating, learned helplessness, and dropping out” (Lee
& Hammer, 2011). Video games, on the other hand create high engagement. Angry Birds
has been downloaded over 200 million times (Kovach, 2011) and Farmille 2 is played by
about 8 million users a day only 6 months after its release (Bort, 2013).
Gamification attempts to capture the motivational power of games and apply
it to real-world problems –such as, in our case, the motivational problems in schools.
Motivation and engagement are major challenges for the American educational system
(Bridgeland, Dilulio, & Morison, 2006).
11
Reasons to Gamify
Educators are realizing that students are not responding anymore to old-school
lectures and are looking for something new and innovative that will engage all students.
Educators are beginning to implement gamification because games are something that
many people of all ages take interest in. The blog; “Best Practices: Gamify Your Class
with Moodle” states five reasons to gamify the classroom (Hayman, 2013):
1. Engagement: Video games focus on quests, challenges, dungeons, levels, etc.
that hold the student’s attention while they are learning the content.
2. Safe Failure: Games teach students that failure is acceptable and they can try
and try again until they master the level without any real-world penalty. The same is true
in a gamified classroom. Students make mistakes and learn from it in the educational
process. Students can retake a test or assignment until they master or complete it. The
teacher’s role is to guide student learning and offer constructive feedback.
3. Alternative rewards: Not all students are motivated by a letter grade in class or
on their report card. In a gamified classroom, there is a different reward system such as
experience points (XP), badges, achievement titles, leveling up, etc. that represents
student achievement and learning. Knowledge, skills, achievement, and other learning
accomplishments can be validated with rewards other than a letter grade.
4. Student choice: Students have a choice of what they can do within the context
of a gamified classroom, which can motivate them. They have the opportunity to learn
the content depending on their skill and move at their own pace. That being said, not all
students will be on the same level, learning the same thing, at the same time.

12
5. Collaboration: Some students can have a difficult time working in groups in the
classroom. This is mitigated when games have the aspects of working together in small
groups, guilds, families, or houses in which they have similar goals and identify with
each other.
Mastery Learning Model
Mastery learning uses differentiated and individualized instruction, progress
monitoring, formative assessment, feedback, corrective procedures, and instructional
alignment to minimize achievement gaps (Bloom, 1971; Zimmerman & Dibenedetto,
2008). The strategy is based on Benjamin Bloom’s Learning for Mastery Model which
incorporates differentiated instruction including remediation to increase student
achievement. Bloom believed that nearly all students, when provided with the more
favorable learning conditions of mastery learning, could truly master academic content
(Bloom, 1976; Guskey, 1997a)
Teachers who use the mastery learning model determine important concepts
and skills and organize them into smaller learning units requiring one to two weeks of
instructional time. Following instruction, teachers use formative assessment to identify
what students have learned and what they still need work on (Bloom, 1971). “In mastery
learning, assessments are not a one-shot, do-or-die experience; instead, they are part of an
ongoing effort to help students learn. It also serves as a powerful motivational tool by
offering students a second chance to succeed” (Guskey, 2010).
Mastery Learning allows students to work at their own pace through the
curriculum. When they complete a unit they must demonstrate that they have learned the

13
content by taking an exam (Overmyer, 2012). When students learning in the mastery
model are compared with those in a traditional classroom, students in well-implemented
mastery learning classes consistently reach higher levels of achievement (Guskey, 2010).

14
CHAPTER III
METHODOLGY
Design of Investigation and Treatment
This study focused on two questions:
1. Does implementing the mastery learning model and gamification techniques
into the classroom increase student achievement?
Does implementing the mastery learning model and gamification techniques
into the classroom improve student engagement, motivation, and attitude toward
mathematics?
The following tests were used to answer the first research question:
Independent t-tests were performed to determine:
o If there was a significant difference of performance on level tests of the
students involved in the treatment compared to the students who were not involved
in the treatment.
o If there was a statistically significant difference between the average
scores within each category of questions on the test between the gamified
(treatment) and traditional groups.
To get at the second main question of this thesis we collected data regarding student
perceptions and attitude.

15
A “Feelings about Mathematics” survey was administered to all Algebra 1
students receiving the gamified treatment at the beginning of the school year with 23
Likert Score statements. The same survey was subsequently administered at the end of
the year to all Algebra 1 students. The questions on the survey explored students’
perceptions on mathematics; how much they enjoyed it, their difficulty with the subject,
how important they thought it was, and how comfortable they are in a mathematics
classroom. The students were asked to what extent they agree or disagree with each of 23
statements on a scale from 1 (“Strongly Disagree) to 5 (“Strongly Agree”). A high Likert
score on questions 4, 5, 6, 7, 19, and 21 imply a negative attitude toward mathematics
whereas for the other questions a high score implied a positive attitude. The Likert Scores
for the 6 negative questions were reversed in order that high scores would consistently
indicate a positive attitude. A score of 5- strongly agree was switched with a score of 1-
strongly disagree. The same was done for a score of 2- agree and 4- disagree. A score of
3 did not change because it was neutral. A paired t-test was performed on each question
of the survey to determine if the attitudes of students in the gamified course had changed
from the beginning of the school year to the end. An independent t-test was also
performed on each question of the survey to determine if there was an attitude difference
at the end of the school year between students’ in the gamified classroom compared to
those in the traditional classroom.
Sample
Eighty-five students participated in this study from the three total Algebra 1
classes at Inspire School of Arts and Sciences, a charter school within Chico Unified

16
School District. Inspire School has a population of about 440 students with the following
breakdown. See Table 1.
Table 1
Student Groups by Percent
Group Percent
Black or African American 2.9
American Indian or Alaska Native 1.3
Asian 1.8
Filipino 0.8
Hispanic or Latino 10.2
Native Hawaiian/Pacific Islander 0
White 78.5
Socioeconomically Disadvantaged 26.4
The curriculum used for all of the Algebra 1 classes at Inspire is College
Preparatory Math (CPM), Core Connections Algebra. This curriculum was also used in
the 2011-2012 school year and addresses the current California State Standards as well as
the Common Core Algebra 1 standards. Each Algebra 1 course was taught by a different
instructor. Students only participated in the study with permission forms signed by
parents/guardians.
Data Collection
The data collection for this study was quantitative and taken over the entire
2013-2014 school year. All three Algebra 1 classes took the exact same exams
throughout the year and also used the same curriculum and textbook. The exams were

17
created in collaboration by the three Algebra 1 teachers. Each student took a total of 16
exams throughout the year. Student performance was evaluated by comparing exam
scores between the three classes using the common exams, and as an aggregate using
overall exam averages. The exams were all scored consistently against the same rubric.
Care was taken so that exam grading was independent of the teacher who did the scoring.
The goal was to determine if there are significant differences in student performance
between the two types of classes. See Figure 1.
Exam #1
Average
Exam #2
Average
Exam #3
Average
Exam #4
Average
…. Exam #16
Average
Class # 1
(Treatment-
Gamified)
Class # 2 &
3 (No
Treatment-
Traditional)
Figure 1. Data collection procedure.
These same exams were also be broken into four sections based on Blooms
Taxonomy:
1. Knowledge
2. Comprehension
3. Application
4. Analysis, Synthesis, Evaluation
Each student had a knowledge score, comprehension score, application score,
and analysis, synthesis, evaluation score on each exam. An overall score in each category
was given by taking an average of all individual scores.

18
All students took a “Feelings about Mathematics” survey at the end of the
school year. Students in the treatment (gamified) group also took the same survey at the
beginning of the year. Analysis included looking at how scores differed from the
beginning of the year to the end of the year within the treatment group only. Analysis was
also done to compare end of the year scores between the traditional and treatment group.
The data for each individual question was analyzed.
Data Analysis Procedures:
The following statistical analysis procedures were used in this study: paired t-
tests, and independent t-tests.
Each Algebra 1 test consists of the following types of questions:
Knowledge (1 point)
Comprehension (2 points)
Application (4 points)
Analysis, Synthesis, Evaluation (3 points)
An independent t-test was used to determine if there is a difference between
the average score within each category of the tests as well as the overall test averages.
The following hypotheses were tested:
Hypothesis Test 1:
There is no difference in the overall mean test scores of students in the gamified
classroom and students in the traditional classroom vs. the mean test score for the
gamified students was greater than the mean for the traditional classroom students

19
G = mean test scores of students in the gamified Algebra 1 class
(treatment).
T= mean test scores of students in the traditional Algebra 1 class.
(1)
Hypothesis Test 2:
There is no difference in mean knowledge scores between the gamified and
traditional group vs. the gamified mean knowledge score was greater than the mean for
the traditional students
GK= Gamified groups’ knowledge score
TK= Traditional groups’ knowledge score
(2)
Hypothesis Test 3:
There is no difference in mean comprehension scores between the gamified and
traditional group vs. the mean comprehension score was greater for the gamified students
than for the traditional students
GC= Gamified groups’ comprehension score
TC= Traditional groups’ comprehension score
(3)
Hypothesis Test 4:
There is no difference in mean application scores between the gamified and
traditional group vs. the mean application score was greater for the gamified students
than for the traditional students
GC= Gamified groups’ application score
TC= Traditional groups’ application score
(4)

20
Hypothesis Test 5:
There is no difference in mean analysis, synthesis, evaluation scores between the
gamified and traditional group vs. the mean analysis, synthesis, evaluation scores are
greater for the gamified students than for the traditional students
GC= Gamified groups’ analysis, synthesis, evaluation
score
TC= Traditional groups’ analysis, synthesis, evaluation
score
(5)
Hypothesis Test 1 helps answer the first research question. This test helps us
determine if students in the treatment (gamified) group scored significantly higher when
averaged overall sections of the level tests than those in the traditional group. If data
support rejection of the null hypothesis, it will be concluded that students in the gamified
group scored, on average, significantly higher on the level tests than students in the
traditional group. If data also support rejection of any of the remaining null hypotheses, it
will also be concluded that students in the gamified group scored, on average,
significantly higher on the knowledge, comprehension, application, or
analysis/synthesis/evaluation parts of each level test.
To address the second research question, each student in Algebra 1 took a survey
with 23 Likert Scale questions at the end of the school year. Each of the 23 Likert Scale
Choices were assigned a number. As explained earlier, some scores were reversed so that
a 5 would always indicate a positive attitude toward mathematics.
1. Strongly Disagree
2. Disagree
3. Neutral

21
4. Agree
5. Strongly Agree
A paired t-test was used to determine if there was a difference of opinion at the
beginning of the school year and the end of the school year within the gamified
(treatment) group, under the assumption that the distribution of paired differences was
normal. Each survey in the first sample (beginning of the year survey) was paired by
student with the survey in the second sample (end of the year survey). The next three
hypotheses were tested to answer the second research question regarding an improvement
in students’ motivation, engagement, and attitude toward mathematics of students in the
gamified group.
Hypothesis Test 6:
There is no difference between survey scores at the beginning and the end of the
year vs. the scores at the end of the year were higher than at the beginning of the year.
d=difference in survey scores at the beginning and end
of the year where the difference = end score – beginning
score
(6)
If data support null hypothesis 6 to be rejected, it will be concluded that student’s in the
gamified group had improved feelings about mathematics at the end of the school year
than they did at the beginning of the school year.
An independent t-test determined if there was a difference in opinion at the end of
the school year based on the “Feelings about Mathematics” survey between the gamified
(treatment) group and the traditional group. The following hypothesis was tested:

22
Hypothesis Test 7:
There is no difference between the mean differences in opinion between the two
groups vs. the gamified group had more positive feelings about mathematics than the
traditional group.
GL= Gamified groups’ Likert survey score
TL= Traditional groups’ Liker survey score
(7)
If data indicates rejection of null hypothesis 7, it will be concluded that students in the
gamified group have more positive feelings about mathematics than those of students in
the traditional group at the end of the school year.
An independent t-test was used to determine if there was a difference in opinion on
each question on the “Feelings about Mathematics” survey between the gamified
(treatment) group and the traditional group. The following hypothesis was tested:
Hypothesis Test 8:
There is no difference in opinion on each question between the two groups vs. the
gamified group had more positive feelings on the question than the traditional group
GQ= Gamified groups’ individual score on each Likert
question
TQ= Traditional groups’ individual score on each Likert
question.
(8)
If data allows null hypothesis 8 to be rejected, it will be concluded that students in the
gamified group have more positive feelings about mathematics than those of the
traditional group.

23
Anticipated Results
It was anticipated that the independent t-test would show that students in the
gamified (treatment) group performed significantly higher than traditional students on the
exams throughout the year. Within the independent t-test of average scores broken down
by category, it was predicted that students in the gamified (treatment) group performed
higher in knowledge, comprehension, application and analysis, synthesis, evaluation
questions than traditional Algebra 1 students.
It was also expected that students in the gamified class had more positive
opinions about mathematics and were more engaged than they were at the beginning of
the school year based on the paired t-test of the “Feelings about Mathematics” survey.
Similarly, it was predicted that students in the gamified class would have
more positive feelings about mathematics than students in the traditional class at the end
of the school year based on the independent t-test.
Limitations
There are limitations in this study that should be considered:
Algebra 1 is a course needed to graduate from high school. There is no
guarantee that a homogeneous cross-section was enrolled in each course section. The
assumption is that students were randomly distributed across the course sections. Since
our school is small, it is possible that students were placed in each course section based
on convenience of scheduling. This could have led to an unanticipated bias among
students. For example, sophomores in Algebra 1 could have been placed in a specific
section due to conflict with another sophomore level class needed.

24
Although each section of Algebra 1 uses a common textbook, similar
assignments, and the same exams, the three Algebra 1 classes were taught by three
different teachers. By the nature of personality, it is assumed that each teacher conducted
the class in a slightly different manner. However, the teachers planed lessons, quizzes,
assignments, and tests together to make it as uniform as possible.
The sample size was small. Inspire School of Arts and Sciences has a
population of about 430 students. Because of this, there are only 3 Algebra 1 sections.
This gave a total sample of 81 students.
This was the first time that the teacher had done a gamified approach in Algebra
1 or any other class.
No pretesting was used to establish whether or not the one group or the other
was better prepared to begin with. It was assumed that they were equally prepared.

25
25
CHAPTER IV
FINDINGS
RQ1
Does implementing the mastery learning model and gamification techniques
into the classroom increase student achievement?
Null hypothesis 1 states that there is no difference in mean test scores between
the gamified and traditional group. The alternative hypothesis states that the mean test
score for the gamified group is larger than the mean test score of the traditional group.
G = average test scores of students in the gamified Algebra 1 class
(treatment).
T= average test scores of students in the traditional Algebra 1 class.
(9)
A two-sample t-test was done on the mean test scores for both groups
assuming unequal variances. The test gave a t-statistic of 1.584 and a p-value of 0.0585.
With this p-value and a significance level of , we fail to reject the null
hypothesis. There is not sufficient evidence to conclude there was a statistically
significant difference between the mean test performances of the two groups with 95%
confidence. However, we can be 94.15% confident that the mean test scores of students
in the gamified group are significantly greater than the mean test scores of students in the
traditional group. The average test score for the traditional group was 7.44, while the
mean score for the gamified group was 7.837. See Table 2.

26
Table 2
t-Test: Two Sample Assuming Unequal Variances
Null hypothesis 2 states that there is no difference in mean knowledge scores
between the gamified and traditional group. The alternative hypothesis states that the
mean knowledge scores for the gamified group is larger than the mean knowledge score
of the traditional group. See Table 3.
GC= Gamified groups’ knowledge score
TC= Traditional groups’ knowledge score
(10)
A two-sample t-test was done on the mean knowledge scores for both groups
assuming unequal variances. The test gives a t-statistic of 1.746 and a p-value of 0.0444.
With this p-value and a significance level , we reject the null hypothesis. We
can conclude that there is a statistically significant difference between the mean test
performances on the comprehension section of the two groups with 95% confidence. The
mean comprehension score for the traditional group was 0.812, while the mean score for
the gamified group was statistically higher at 0.8542.
Gamified Average Score Traditional Average Score
Mean 7.837 7.44
Standard Deviation 0.898 1.17
Observations 20 61
Pooled Standard Deviation
Hypothesized Mean
Difference
0
df 41.92
T Stat 1.584
p-value 0.0585

27
Table 3
t-Test: Two Sample Assuming Unequal Variances
Gamified Knowledge Score Traditional Knowledge Score
Mean 0.8542 0.812
Standard Deviation 0.0932 0.102
Observations 21 61
Pooled Standard
Deviation
Hypothesized Mean
Difference
0
df 37.75
T Stat 1.746
p-value 0.0444
Null hypothesis 3 states that there was no difference in mean comprehension
scores between the gamified and traditional groups. The alternative hypothesis states that
the mean comprehension score for the gamified group is larger than the mean
comprehension scores of the traditional group. See Table 4.
GC= Gamified groups’ comprehension score
TC= Traditional groups’ comprehension score
(11)
mean score for the gamified group was 0.776. The traditional group’s average
comprehension test score was significantly lower, indicating that the traditional group
was not able to perform at the same level as the gamified group with 95% confidence.
Null hypothesis 4 states that there is no difference in mean application score
between the gamified and traditional groups. The alternative hypothesis states that the
mean application score for the gamified group is larger than the mean application scores
of the traditional group. See Table 5.

28
Table 4
t-Test: Two Sample Assuming Unequal Variances
Gamified
Comprehension Score
Traditional
Comprehension Score
Mean 0.776 0.700
Standard Deviation 0.158 0.155
Observations 20 61
Pooled Standard Deviation
Hypothesized Mean Difference 0
df 31.88
T Stat 1.87
p-value 0.035
GC= Gamified groups’ application score
TC= Traditional groups’ application score
(12)
Table 5
t-Test: Two Sample Assuming Unequal Variances
Gamified Application
Score
Traditional Application
Score
Mean 3.576 3.068
Standard Deviation 0.639 0.453
Observations 20 61
Pooled Standard Deviation
Hypothesized Mean Difference 0
df 25.56
T Stat 3.294
p-value 0.0014

29
A two-sample t-test was done on the mean application scores for both groups
assuming unequal variances. The test gave a t-statistic of 3.30 and a p-value of 0.001.
With this p-value and a significance level of , we reject the null hypothesis. We
can say with 95% confidence that the mean application score for the gamified group is
significantly greater than the mean application score for the traditional group. The mean
application score for the traditional group was 3.068, while the mean score for the
gamified group was 3.576.
Null hypothesis 5 states that there is no difference in mean analysis, synthesis,
evaluation scores between the gamified and traditional groups. The alternative hypothesis
states that the mean analysis, synthesis, evaluation score for the gamified group is larger
than the mean analysis, synthesis, evaluation score of the traditional group. See Table 6.
GC= Gamified groups’ analysis, synthesis, evaluation score
TC= Traditional groups’ analysis, synthesis, evaluation
score
(13)
Table 6
t-Test: Two Sample Assuming Unequal Variances
Gamified Synthesis
Score
Traditional Synthesis
Score
Mean 2.203 2.189
Standard Deviation 0.292 0.346
Observations 20 61
Pooled Standard Deviation
Hypothesized Mean Difference 0
df 37.97
T Stat 0.1774
p-value 0.4300
30
A two-sample t-test was done on the mean analysis, synthesis, evaluation
scores for both groups assuming unequal variances. The test gave a t-statistic of 0.1774
and a p-value of 0.4300. With this p-value and a significance level of , we fail to
reject the null hypothesis. There is not sufficient evidence to conclude that the mean
gamified score is greater than the mean for the traditional group. The mean analysis,
synthesis, evaluation score for the traditional group was 2.189, while the mean score for
the gamified group was 2.203.
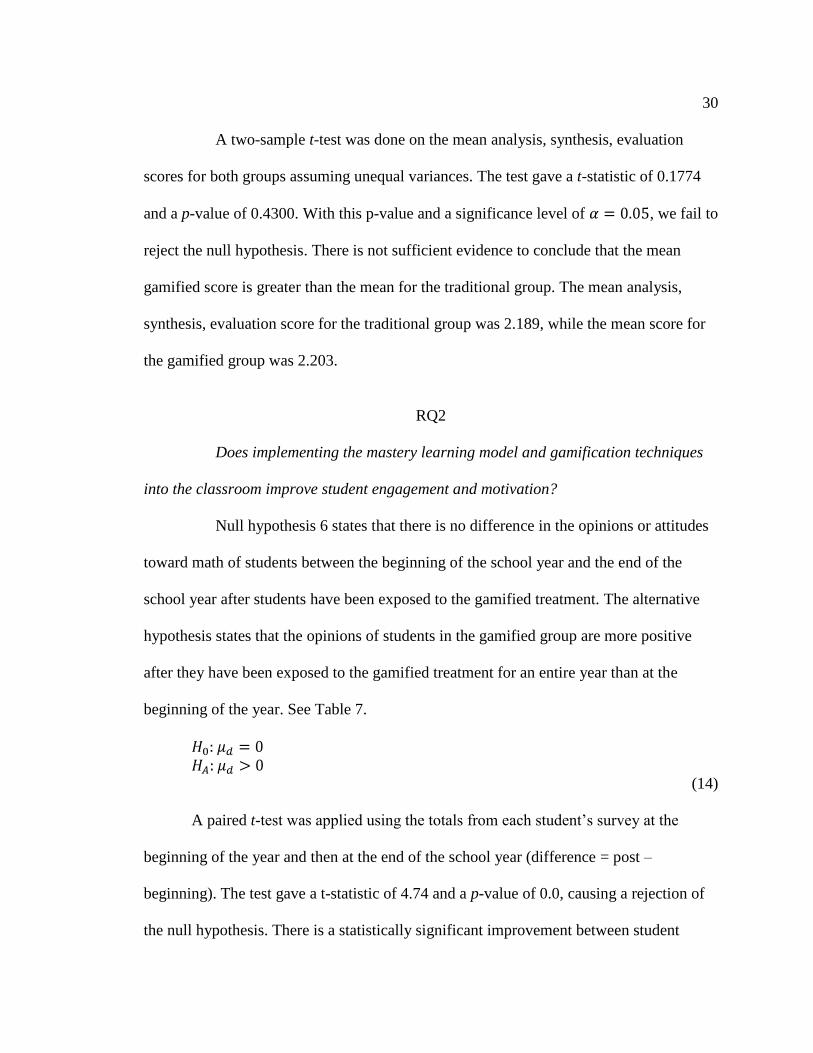
RQ2
Does implementing the mastery learning model and gamification techniques
into the classroom improve student engagement and motivation?
Null hypothesis 6 states that there is no difference in the opinions or attitudes
toward math of students between the beginning of the school year and the end of the
school year after students have been exposed to the gamified treatment. The alternative
hypothesis states that the opinions of students in the gamified group are more positive
after they have been exposed to the gamified treatment for an entire year than at the
beginning of the year. See Table 7.
(14)
A paired t-test was applied using the totals from each student’s survey at the
beginning of the year and then at the end of the school year (difference = post –
beginning). The test gave a t-statistic of 4.74 and a p-value of 0.0, causing a rejection of
the null hypothesis. There is a statistically significant improvement between student

31
Table 7
paired t-Test
Gamified Beginning Survey Gamified Post Survey
Mean 70.21 88.64
Standard Deviation 8.24 8.88
Observations 15 15
Mean Difference (post-
beginning)
18.43 14.55
df 14
T Stat 4.74
p-value 0.0
95% Confidence Interval for
Difference:
(10.03, 26.83)
opinions at the beginning of the year and at the end of the year based on a Likert survey.
The 95% confidence interval shows that the post survey scores are much higher than then
the pre survey scores.
Null hypothesis 7 states that there is no difference in mean opinion at the end
of the school year based on the “Feelings about Mathematics” survey between the
gamified and traditional group. The alternative hypothesis states that the mean opinions
of students in the gamified group at the end of the year are more positive than those of
students in the traditional group. See Table 8.
GL= Gamified groups’ Likert survey score
TL= Traditional groups’ Likert survey score
(15)
A two-sample t-test was done on the average of total Likert survey scores for
both groups assuming unequal variances. The test gave a t-statistic of 3.12 and a p-value
of 0.002. With this p-value and a significance level , we reject the null

32
Table 8
t-Test: Two Sample Assuming Unequal Variances
Gamified Likert Survey
Score
Traditional Likert Survey
Score
Mean 87.9 77
Standard Deviation 12.3 12.4
Observations 17 12.4
Pooled Standard Deviation
Hypothesized Mean
Difference
0
df 29
T Stat 3.12
p-value 0.002
95% Confidence Interval
for Difference:
(3.77, 18.12)
hypothesis. We have sufficient evidence to conclude that opinions of students in the
gamified group are statistically more positive than those of students in the traditional
group. The average Likert score of students in the gamified group was 87.9 and the
average score of students in the traditional group was 77.
Null hypothesis 8 states that there is no difference in mean attitude on each of
the 23 questions between the two groups. See Table 9
GQ= Gamified groups’ individual score on each Likert
question
TQ= Traditional groups’ individual score on each Likert
question.
(16)
A two-sample t-test was done on the mean score for each of the 23 Likert
Score Questions for both groups assuming unequal variances. Based on the p-values, it

33
Table 9
t-Test: Two Sample Assuming Unequal Variances on Multiple Questions
Question N Mean StDev T-Value p-value DF
G1 17 4.0 0.197 0.49 0.313 29
T1 45 3.889 0.804
G2 17 3.529 0.874 1.48 0.074 36
T2 45 3.13 1.10
G3 17 3.82 1.01 1.0 0.163 29
T3 45 3.53 1.04
G4 17 1.88 1.05 2.85 0.004 30
T4 45 2.76 1.13
G5 17 2.12 1.05 -1.51 .072 25
T5 45 2.556 0.918
G6 17 1.941 0.748 -0.93 0.179 36
T6 45 2.156 0.952
G7 17 1.882 0.781 2.14 0.020 32
T7 45 2.378 0.886
G8 17 4.059 0.827 2.07 0.023 31
T8 45 3.553 0.918
G9 17 3.882 0.928 2.59 0.007 34
T9 45 3.16 1.13
G10 17 3.294 0.920 2.08 0.023 35
T10 45 2.71 1.14
G11 17 3.588 0.870 3.20 .001 36
T11 45 2.73 1.10
G12 17 3.647 0.786 3.10 .002 31
T12 45 2.933 0.863
G13 17 3.59 1.62 0.61 0.274 27
T13 45 3.31 1.55
G14 17 3.41 1.06 1.05 0.150 29
T14 45 3.09 1.10
G15 17 3.18 1.13 0.79 0.219 24
T15 45 2.933 0.939
G16 17 3.71 1.05 1.70 .050 28
T16 45 3.20 1.04
G17 17 3.882 0.928 2.35 0.013 31
T17 45 3.24 1.03
G18 17 4.06 1.20 0.92 0.182 25
T18 45 3.76 1.03
G19 17 2.412 0.618 2.93 0.003 48
T19 45 3.04 1.04
G20 17 3.88 1.27 0.84 0.205 22
T20 45 3.60 0.915
G21 17 2.176 0.728 2.66 0.006 37
T21 45 2.778 0.951
G22 17 4.529 0.717 2.09 0.022 36
T22 45 4.067 0.915
G23 17 4.294 0.772 2.18 0.018 36
T23 45 3.778 0.974

34
was concluded that the students in the Gamified Group have a significantly improved
attitude on the following statements:
#4: Math makes me feel uncomfortable.
#7: It makes me nervous to think about having to do a math problem.
#8: I am able to solve math problems without too much difficulty.
#9: I expect to do well in any math class I take.
#10: I have usually enjoyed studying mathematics in school.
#11: I have a lot of self-confidence when it comes to mathematics.
#12: I like to solve new problems in mathematics
#16: I believe studying math helps me problem solve in other areas
#17: I am comfortable answering questions in class.
#19 I get worried I will be called on in math class.
#21 I understand what is taught during math class, but forget it when I come home.
#22: It helps when my teacher demonstrates how to do the math.
#23: It helps when I can practice working out the math.
There is not a statistically significant difference on the following statements:
#1: Mathematics is a very worthwhile and necessary subject.
#2: I get a great deal of satisfaction out of solving a math problem.
#3: Math is important in everyday life.
#5: My mind goes blank and I am unable to think clearly when working with
mathematics.
#6: I am always under a terrible strain in a math class.
#13: I prefer to do a math assignment than write an essay.

35
#14: I really like mathematics.
#15: I like the challenge of mathematics
#18: A strong math background could help me in my professional life.
#20: It helps me understand math when I can talk about it with others

36
CHAPTER V
DISCUSSION
Initial Findings
The results of this study indicated that implementing gamification with the
mastery learning model into the Algebra 1 classroom increased student achievement. The
two-sample t-test in Table 2 showed that we can be 94.15% confident that the mean test
scores in the gamified group were significantly higher than those of the traditional group.
Not only did the students in the gamified group score significantly higher on average test
scores than the traditional group, but they also scored higher on three out of four
individual sections of the test. Each test was broken into the four sections: Knowledge,
Comprehension, Application, and Analysis/Synthesis/Evaluation. The two-sample t-tests
in Tables 3, 4, and 5 showed that students in the gamified group scored significantly
higher on the knowledge, comprehension, and application sections of each test. There
was not a statistically significant difference on the analysis/synthesis/evaluation section
of the test. With this evidence we conclude that students in the gamified group had higher
levels of thinking in three of the major categories of Bloom’s Taxonomy. These students
can recall data or information and understand the meaning, translation, interpolation, and
interpretation of instructions and problems better than students in the traditional group.
The gamified group can better state a problem in their own words. These students can
37
37
also apply what they know about a certain algebraic or mathematical concept to a new
situation or problem.
Students benefited the most in the knowledge and comprehension sections.
The students were given as much time as they needed to understand the basic skills of a
topic. The knowledge and comprehension skills are needed when doing application and
analysis/synthesis/evaluation. Gamification also helped students in application. Once they
had a solid foundation of the basic skills in the knowledge and comprehension categories,
they were able to apply it to real world contexts. Gamification did not conclusively
improve learning in the area of analysis/synthesis/evaluation. It is not easy to explain why
no significant improvement occurred in this area as opposed to all of the others. One
reason for this may be that it incorporates prior knowledge to answer more difficult
questions. This prior knowledge is more than just what they have learned in this course,
but also information and skills they may have previously acquired in mathematics and
other disciplines. Adjustments in the gamification structure will be made that specifically
target this component of learning. For example, there will be certain days in class where
students will all be doing the same task. The tasks will be outlined for them ahead of time
within the level objectives. These tasks will be inquiry type investigations and a class
discussion will occur. With more inquiry and whole class discussion, hopefully
analysis/synthesis/evaluation scores will improve.
This study also provides evidence to answer the second research question.
Implementing gamification with the mastery learning model into the Algebra 1 classroom
improved student engagement, motivation, and attitude toward mathematics. Students in
the gamified group took the same “Feelings about Mathematics” survey at the beginning

38
38
of the school year and the end of the school year. The results of the paired t-test in Table
7 show that there was a significant improvement in student attitude and feelings about
mathematics from the beginning to the end of the school year. We are 95% confident that
post scores increased anywhere from 10.03 to 26.83 points on average.
Students in the traditional group took the same survey but only at the end of
the year. They did not take the survey at the beginning of the course. The results of the
two-sample t-test in Table 8 show that the students in the gamified group had a
significantly more positive attitude toward mathematics than those from the traditional
group. Each question on the survey was analyzed between the two groups at the end of
the year. The results in Table 9 show that students in the gamified group were more
engaged and held a more positive attitude toward mathematics than students in the
control group. Data analysis shows that students in the gamified course have greater self-
confidence when it comes to math; they enjoy learning about math in school, they like
solving new problems in mathematics, and they are more comfortable answering
questions in math class than students in the control group. The results also show that
students in the gamified group do not feel as uncomfortable with math as students in the
traditional group, they do not get as nervous when thinking about doing a math problem,
and they are not as worried that they are going to get called on in class.
As pointed out earlier, April Hayman provides five reasons to gamify the
classroom; engagement, safe failure, alternative rewards, student choice, and
collaboration (Hayman, 2013). The researcher felt that the improved attitudes could relate
directly to engagement and safe failure. Gamification in the Algebra 1 classroom
provides immediate student engagement. Because students could work at their own pace,
39
39
the more advanced students were never bored. They always had a task to be working on
and if they finished early, they could move to the next task. In contrast, the student in the
traditional Algebra class who finished a class activity early could be left with down time
while waiting for the rest of the class to complete an activity.
The students in particular who struggled more in the gamified class likely felt
safe failure as predicted by Hayman. The students who were at lower levels or worked
slower than a majority of the class did not feel the extra pressure to keep moving forward.
They were allowed the time to fully understand and grasp the material before moving on.
If they didn’t pass a test the first time around, they could always retake it. They also
never experienced that moment in class where the teacher handed back all of the tests and
the student who failed looked around feeling ashamed of himself, wondering if everyone
knew he had failed. Since the students took each test when they were ready, they did not
all take the test at the same time. The test was graded almost immediately after they took
it and the student got instant one on one feedback.
After implementing one year of gamification and the mastery model in an
Algebra 1 classroom, several adjustments were planned for the future to improve the
program. Other adjustments were made as the class progressed. For example, although it
was not originally anticipated that the teacher would impose a final deadline to complete
each level, the teacher did so on a few occasions. Having a concrete deadline helped
students who were the most behind with time management. In the future, the classroom
teacher will give a final deadline to complete each level. The deadline will still allow
students an appropriate amount of time to complete each level, and at the same time
provide more leeway than a traditional Algebra 1 class.

40
40
Another finding observed by the researcher besides the increase in student
achievement and an improvement of student engagement was also an increase in the
number of assignments that students in the gamified classroom completed. Students were
required to do all of the assignments in a given level before taking the level test and
moving forward. Because of this policy, students completed more work and seemed to
use their time more productively than in the traditional treatment.
Although gamified students were completing more assignments, it was
observed that they may not have been doing as much homework as expected. Because the
students were not given a specific homework assignment each night that was graded
immediately, students often worked their hardest in class but not necessarily at home. In
the future, to help increase the amount of work students do at home, they will be given a
goal sheet to help monitor their progress. Each day when a student walks into class they
will fill out what their goal for the day is and what they would like to complete. At the
end of the class period, they will indicate if they completed their goal, and if not, they
will briefly explain. Finally, they will state what they plan to do for homework. The
teacher will check the goal sheets daily. If students do not do what they assigned
themselves for homework, they will not receive participation points. If a student often
fails to complete assignments they will be required to attend a math support session
during their lunch period at school.
As a result of the findings for this study, all math teachers at Inspire School of
Arts and Sciences have decided to implement gamification into their Algebra 1
classroom. The same model that the researcher used in this study will be used with some
of the accommodations mentioned above to improve the program. The implementation of

41
41
gamification will be strongly considered for other math courses as the school moves into
the new Common Core curriculum within the next couple of years.

REFERENCES

43
REFERENCES
Bloom, B. S. (1971). Mastery learning. In J. H. Block (Ed.), Mastery learning: Theory
and practice (pp. 47–63). New York: Holt, Rinehart & Winston.
Bloom, B. S. (1976). Human characteristics and school learning. New York: McGraw-
Hill.
Bort, J. 8 Million People Play Zynga's FarmVille 2 Every Day, Mark Pincus Says. (2013,
May 8). Business Insider. Retrieved from http://www.businessinsider. com/8-
million-people-play-zyngas-farmville-2-every-day-mark-pincus-says-2013-5
Bridgeland, J., DiIulio, J., & Morison, K. B. (2006). The silent epidemic. Seattle, WA:
Gates Foundation.
California Department of Education. (2013a, July). 2013 STAR test results. Retrieved
from Retrieved from http://star.cde.ca.gov/star2013/ViewReport.aspx?
ps=true&lstTestYear=2013&lstTestType=C&lstCounty=04&lstDistrict=6142
4-000&lstSchool=0120394&lstGroup=1&lstSubGroup=1
California Department of Education. (2013b, Aug 8). Algebra I graduation requirements.
High School. Retrieved from http://www.cde.ca.gov/ci/gs/hs/algebrafaq.asp
Griffiths, M. (2003). The educational benefits of videogames. Education and Health,
20(3). Retrieved from http://sheu.org.uk/sites/sheu.org.uk/files/imagepicker/
1/eh203mg.pdf

44
Guskey, T. R. (1997a). Implementing mastery learning (2nd ed.). Belmont, CA:
Wadsworth.
Guskey, T. R. (1997b). Putting it all together: Integrating educational innovations. In S. J.
Caldwell (Ed.), Professional development in learning-centered schools (pp.
130–149). Oxford, OH: National Staff Development Council.
Guskey, T. R. (2010). Educational Leadership: Interventions that work: Lessons of
mastery learning. Educational Leadership, 68(2), 52-57. Retrieved from
http://www.ascd.org/publications/ educational-leadership/oct10/vol68/
num02/Lessons-of-Mastery-Learning.aspx
Hayman, A. (2013, July, 30). Best practices: Gamify your class with Moodle. Retrieved
from http://www.moodlerooms.com/resources/blog/best-practices-gamify-
your-class-moodle
Kovach, S. (2011, May 18). Guess how many times Angry Birds has been downloaded.
Business Insider. Retrieved from http://www.businessinsider.com/angry-
birds-has-been-downloaded-200-million-times-so-far-2011-5
Lazzaro, N. (2004). Why we play games: Four keys to more emotion without story.
[Abstract]. Player Experience Research and Design for Mass Market
Interactive Entertainment, 3-8.
Lee, J. J. & Hammer, J. (2011). Gamification in education: What, how, why bother?
Academic Exchange Quarterly, 15(2), 1-5.
Lesser, L. M. (2000). Sum of songs: Making mathematics less monotone! Mathematics
Teacher, 93(5), 372-378. Retrieved from http://www.nctm.org/publications/
article.aspx?id=18021

45
Levasseur, A. (2013, Aug 7). The literacy of gaming: What kids learn from playing.
MediaShift. PBS. Retrieved from http://www.pbs.org/mediashift/2011/08/the-
literacy-of-gaming-what-kids-learn-from-playing215
MacMillan (2011, Jan. 19). 'Gamification': A growing business to invigorate stale
websites. Retrieved from: http://www.businessweek.com/magazine/content/
11_05/b4213035403146.htm
McGonigal, J. (2011). Reality is broken: Why games make us better and how they can
change the world. Penguin Press. New York, NY.
Overmyer, J. (2012). Flipped classrooms 101. Principal, September/October.
Robinson, K. (2006, Feb.). Ken Robinson: How schools kill creativity. TED: Ideas worth
Spreading. TED Talks. [Film]. http://www.ted.com/
talks/ken_robinson_says_schools_kill_creativity.html
Whyte, M (2013, Feb. 18). Gamification in higher education. Retrieved from:
http://www.mixtmedia.nl/WP/2013/06/20/ma-thesis-gamification-in-higher-
education/
Willoughby, J. (2014, July, 7). Differentiating instruction: Meeting students where they
are, teaching today, Glencoe Online. Glencoe/McGraw-Hil, Retrieved from
http://www.glencoe.com/sec/teachingtoday/subject/di_meeting.phtml.
Zimmerman, B. J., & Dibenedetto, M. K. (2008). Mastery learning and assessment:
Implications for students and teachers in an era of high-stakes testing.
Psychology in the Schools, 45(3), 206-216.

APPENDIX A

47
“Feelings about Mathematics” Survey Given at Beginning and End of School Year
Question: Strongly
Agree
Agree Neutral Disagree Strongly
Disagree
1 Mathematics is a very worthwhile
and necessary subject.
2 I get a great deal of satisfaction out of
solving a math problem.
3 Math is important in everyday life.
4 Math makes me feel uncomfortable.
5 My mind goes blank and I am unable
to think clearly when working with
mathematics.
6 I am always under a terrible strain in
a math class.
7 It makes me nervous to think about
having to do a math problem.
8 I am able to solve math problems
without too much difficulty.
9 I expect to do well in any math class I
take.
10 I have usually enjoyed studying
mathematics in school.
11 I have a lot of self-confidence when it
comes to mathematics.
12 I like to solve new problems in
mathematics
13 I prefer to do a math assignment than
write an essay.
14 I really like mathematics.
15 I like the challenge of mathematics
16 I believe studying math helps me
problem solve in other areas
17 I am comfortable answering
questions in class.
18 A strong math background could help
me in my professional life.
19 I get worried I will be called on in
math class.
20 It helps me understand math when I
can talk about it with others
21 I understand what is taught during
math class, but forget it when I come
home.
22 It helps when my teacher
demonstrates how to do the math.
23 It helps when I can practice working
out the math.

APPENDIX B

49
CONSENT LETTER
Dear Parent or Guardian,
Your child’s class is being asked to participate in a voluntary research survey. The
purpose of the survey is to determine students’ reactions to the gamified classroom
experience. All questions relate to teaching practices, and no personal questions will be
asked. There are no foreseeable risks or discomforts to the participants. A copy of the
survey will be available in the school office.
The survey will be administered in your child’s Algebra 1 class towards the end of the 1st
semester. The survey will take a portion of the class period. If your child does not return
his/her permission slip, he/she will not be able to participate. Each child’s participation is
voluntary. There is no penalty for non-participation. Students not participating in the
survey will be given an alternate activity while the survey is being administered.
All information gathered will be strictly confidential. Surveys will only be viewed by me,
the researcher. Follow-up interviews will be conducted for selected participants solely for
the purpose of gaining further understanding to survey responses.
Data for this survey will be used in a master’s thesis at Chico State University. If you
have any further questions, please contact me at [email protected].
Please sign the bottom of this page and have your child turn it in during Algebra 1 class.
Thank you very much for your cooperation.
Sincerely,
Katie Raymond
Mathematics Teacher
Inspire School of Arts and Sciences
www.raymondsclass.com
I have read the above information and understand that my student,
________________________________________, is being invited to participate in the
above study.
_____ I DO give permission for my student to participate
_____I DO NOT give permission for my student to participate
_______________________________ ______________________________ ______
Parent/Guardian Signature Student Signature Date

APPENDIX C

51
Data Collection Part 1 For Treatment (Gamified) Group
Knowledge Comprehension Application Synthesis
Student 1 0.896212121 0.83974359 3.836 2.238461538
Student 2 0.88548951 0.746153846 2.993333333 1.8
Student 3 0.762563131 0.551282051 2.98 2.438461538
Student 4 0.829487179 0.814102564 4.22 2.369230769
Student 5 0.830128205 0.916666667 2.85 2.226923077
Student 6 0.861538462 0.903846154 3.566666667 2.1875
Student 7 0.896212121 0.908974359 4.033333333 2.415384615
Student 8 0.858333333 0.804166667 2.776923077 1.916666667
Student 9 0.961174242 0.967948718 4.116666667 1.895833333
Student 10 0.977564103 0.35 2.527777778 2.046153846
Student 11 0.636363636 0.825 4.276923077 2.363636364
Student 12 0.894230769 0.833333333 2.721428571 1.607692308
Student 13 0.844155012 0.933333333 4.186666667 2.546153846
Student 14 0.844871795 0.807692308 4.420833333 2.39
Student 15 0.9125 0.897435897 3.056666667 2.446153846
Student 16 0.867365967 0.891025641 4.133333333 2.619230769
Student 17 0.8504662 0.576923077 3.163333333 2.373076923
Student 18 0.645454545 0.692307692 3.873333333 1.838461538
Student 19 1 0.647222222 4.375 1.855
Student 20 0.929166667 0.619047619 3.4245 2.48
Average CST Block
Student 1 8.234615385 High
Student 2 7.026923077 Low
Student 3 6.357692308 NA
Student 4 8.180769231 NA
Student 5 7.788461538 High
Student 6 7.661538462 High
Student 7 8.573076923 High
Student 8 8.4375 High
Student 9 5.25 NA
Student 10 9.007692308 NA
Student 11 8.277272727 High

52
Table Continued
Average CST Block
Student 12 7.783333333 NA
Student 13 8.307692308 High
Student 14 8.27 High
Student 15 7.653846154 Low
Student 16 8.484615385 NA
Student 17 6.912307692 Low
Student 18 7.642307692 Low
Student 19 7.954545455 High
Student 20 8.941666667 High

53
Data Collection Part 2 for Treatment (Gamified) Group
#1 #2 #3 #4 #5 #6 #7 #8 #9 #10 #11 #12 #13 #14 #15
Student 1 4 3 3 3 4 3 3 2 4 4 2 4 1 3 1
Student 2 3 4 4 2 3 2 2 4 3 2 3 4 1 3 2
Student 3 3 4 3 2 2 2 1 3 3 3 3 3 5 3 3
Student 4 4 2 4 2 2 3 3 4 3 3 3 3 3 2 3
Student 5 4 3 3 1 3 3 3 3 2 2 2 2 1 1 1
Student 6 4 3 4 2 2 2 2 4 4 4 4 4 4 3 3
Student 7 5 5 5 5 4 3 1 5 4 4 5 5 5 5 5
Student 8 3 3 1 1 1 1 1 5 5 5 4 3 5 3 3
Student 9 5 4 4 2 1 2 2 4 5 4 4 4 2 5 4
Student 10 4 3 4 3 3 2 3 4 5 3 4 4 5 4 3
Student 11 3 2 4 1 2 2 2 4 4 3 4 4 2 3 4
Student 12 5 4 4 1 1 1 1 5 3 3 3 3 5 4 4
Student 13 5 5 5 1 1 1 1 5 5 5 5 5 5 5 5
Student 14 4 4 4 1 1 2 2 4 4 3 4 3 4 3 4
Student 15 5 3 5 1 1 1 2 5 4 2 4 3 5 4 3
Student 16 3 4 3 2 2 1 1 4 5 3 4 4 5 4 3
Student 17 4 4 5 2 3 2 2 4 3 3 3 4 3 3 3
#16 #17 #18 #19 #20 #21 #22 #23
Student 1 4 3 4 3 5 2 4 3
Student 2 3 4 1 2 4 3 4 4
Student 3 3 4 4 2 5 2 5 5
Student 4 3 3 5 3 3 3 5 4
Student 5 3 2 4 3 3 3 3 3
Student 6 3 3 3 2 4 2 4 4
Student 7 5 5 5 3 1 3 5 5
Student 8 1 4 2 3 1 1 5 5
Student 9 5 5 5 2 5 3 5 5
Student 10 4 3 3 3 5 2 5 5
Student 11 4 4 5 2 4 2 5 4
Student 12 4 3 5 3 5 1 5 5
Student 13 5 5 5 1 5 1 5 5
Student 14 4 4 4 2 4 2 4 4
Student 15 5 5 5 2 4 2 5 4
Student 16 4 4 4 2 4 2 5 5
Student 17 3 5 5 3 4 3 3 3

APPENDIX D

55
Data Collection Part 1 for Traditional Group
Knowledge Comprehension Application Synthesis
Student 1 0.899242424 0.784848485 3.14545455 2.51
Student 2 0.731404959 0.605769231 2.26363636 2.015909
Student 3 0.788842975 0.490384615 2.55833333 1.889583
Student 4 0.87037037 0.700757576 3.42 2.5625
Student 5 0.577651515 0.497222222 2.68888889 1.538889
Student 6 0.740909091 0.622222222 3.29 2.3725
Student 7 0.696280992 0.548076923 2.17272727 2.136364
Student 8 0.803030303 0.608974359 3.33 2.045455
Student 9 0.847727273 0.596153846 3.44 2.545
Student 10 0.996280992 0.703846154 3.4 1.972727
Student 11 0.818181818 0.326923077 2.2875 1.71875
Student 12 0.784090909 0.520833333 2.67142857 1.828125
Student 13 0.894570707 0.815972222 3.6 2.425
Student 14 0.683712121 0.347222222 2.5125 1.75
Student 15 0.825126263 0.66025641 2.71923077 1.384615
Student 16 0.768065268 0.695512821 3 2.319231
Student 17 0.576806527 0.474358974 2.06923077 1.169231
Student 18 0.839646465 0.81474359 3.36666667 2.2125
Student 19 1 0.730769231 3.23636364 2.727273
Student 20 0.904356061 0.638888889 3.625 2.454545
Student 21 0.847796143 0.855769231 3.44545455 2.704545
Student 22 0.66017316 0.409722222 2.51666667 2.142857
Student 23 0.866792929 0.742948718 3.70833333 2.466667
Student 24 0.761655012 0.639102564 2.62307692 2.023077
Student 25 0.902146465 0.772435897 3.62727273 2.491667
Student 26 0.825174825 0.826923077 2.70769231 2.076923
Student 27 0.782051282 0.841666667 3.03846154 2.230769
Student 28 0.922979798 0.858974359 3.49166667 2.225
Student 29 0.781313131 0.822222222 2.91666667 2.108333
Student 30 0.756410256 0.554487179 3.03076923 2.00625
Student 31 0.920454545 0.897435897 3.57083333 2.45
Student 32 0.819949495 0.685897436 3.1125 2.45
Student 33 0.77972028 0.762820513 2.71818182 2.363636

56
Table Continued
Knowledge Comprehension Application Synthesis
Student 34 0.864801865 0.801282051 3.35 2.108333
Student 35 0.807692308 0.823717949 3.15 1.991667
Student 36 0.791666667 0.583333333 2.92083333 2.383333
Student 37 0.864685315 0.740384615 3.59545455 2.277273
Student 38 0.978535354 0.857692308 3.34583333 2.608333
Student 39 0.77979798 0.717948718 3.60454545 2.445455
Student 40 0.89957265 0.891666667 3.12777778 1.755556
Student 41 0.619463869 0.820512821 3.05 2.570833
Student 42 0.893356643 0.432692308 2.17916667 1.533333
Student 43 0.826430976 0.840277778 3.66666667 2.266667
Student 44 0.817866162 0.529861111 2.74444444 2
Student 45 0.961538462 0.492424242 3.01428571 1.9
Student 46 0.713498623 0.804487179 3.24583333 2.366667
Student 47 0.925505051 0.701388889 3.505 2.555
Student 48 0.731157731 0.923611111 3.45 2.477273
Student 49 0.873737374 0.698717949 2.90416667 1.883333
Student 50 0.967365967 0.83974359 3.27083333 2.066667
Student 51 0.846736597 0.929487179 3.05833333 2.391667
Student 52 0.854895105 0.878205128 3.66666667 2.275
Student 53 0.86013986 0.903846154 3.2875 2.575
Student 54 0.951631702 0.833333333 3.46666667 2.545833
Student 55 0.6121633 0.858974359 3.82272727 2.833333
Student 56 0.788510101 0.487179487 2.39090909 1.772727
Student 57 0.777146465 0.480769231 2.4 1.763636
Student 58 0.669386169 0.769230769 2.61363636 1.922727
Student 59 0.771173271 0.666666667 3.33181818 2.375
Student 60 0.83270202 0.75 3.05 2.333333
Student 61 0.583333333 0.8125 2.62 2.23
Average CST Block
Student 1 7.472727273 Low
Student 2 6.668181818 Low
Student 3 6.422727273 NA
Student 4 9.416666667 NA
Student 5 5.325 Low
Student 6 8.19 High
Student 7 6.077272727 NA

57
Table Continued
Average CST Block
Student 8 7.377272727 NA
Student 9 8.14 Low
Student 10 8.231818182 High
Student 11 5.9 Low
Student 12 6.8125 Low Student 13 8.429166667 Low
Student 14 5.575 Low
Student 15 5.653846154 Low
Student 16 7.469230769 NA
Student 17 4.865384615 Low
Student 18 8.0375 Low
Student 19 8.927272727 High
Student 20 7.565 Low
Student 21 8.804545455 High
Student 22 5.133333333 High
Student 23 8.6125 NA
Student 24 6.523076923 Low
Student 25 8.654166667 Low
Student 26 7.484615385 Low
Student 27 8 High
Student 28 8.8 Low
Student 29 7.4 NA
Student 30 7.459090909 NA
Student 31 8.472727273 NA
Student 32 9 High
Student 33 7.395454545 NA
Student 34 8.25 NA
Student 35 6.990909091 Low
Student 36 7.459090909 NA
Student 37 8.165 NA
Student 38 8.272727273 Na
Student 39 7.872727273 Low
Student 40 7.63125 NA
Student 41 8.222727273 Low
Student 42 5.345454545 Low
Student 43 8.790909091 Low
Student 44 6.275 NA
Student 45 6.114285714 NA
Student 46 8.222727273 NA
Student 47 7.081818182 Low
Student 48 8.71 High

58
Table Continued
Average CST Block
Student 49 6.931818182 NA
Student 50 7.913636364 Low
Student 51 8.431818182 Low
Student 52 8.081818182 NA Student 53 8.495454545 Low
Student 54 8.586363636 High
Student 55 8.909090909 NA
Student 56 5.727272727 NA
Student 57 6.340909091 NA
Student 58 6.913636364 NA
Student 59 8.009090909 NA
Student 60 6.477777778 NA
Student 61 5.0875 High

59
Data Collection Part 2 for Traditional Group
#1 #2 #3 #4 #5 #6 #7 #8 #9 #10 #11 #12 #13 #14 #15
Student 1 4 5 5 3 3 3 4 3 3 3 1 3 4 3 3
Student 2 5 4 5 1 3 3 3 4 3 3 3 3 4 3 3
Student 3 3 1 1 1 2 1 1 3 3 5 5 2 5 3 2
Student 4 4 3 3 3 4 4 3 3 2 2 3 3 2 2 2
Student 5 4 3 4 3 3 2 1 3 2 1 4 3 3 2 4
Student 6 4 4 5 1 1 1 1 4 4 3 4 3 5 3 3
Student 7 5 4 3 1 2 1 2 4 4 4 4 3 3 3 3
Student 8 5 3 5 2 1 1 1 4 3 3 4 4 5 3 3
Student 9 3 3 4 3 2 2 2 4 5 3 2 4 5 4 3
Student 10 4 3 3 2 2 2 2 4 4 3 3 4 3 5 4
Student 11 4 3 4 4 2 2 3 4 3 2 2 3 3 2 3
Student 12 4 3 3 4 2 3 2 3 3 4 1 3 3 3 3
Student 13 4 4 4 5 3 3 4 1 1 1 1 1 1 1 3
Student 14 3 3 3 4 3 3 2 4 3 1 1 3 4 2 3
Student 15 3 4 4 2 2 2 2 4 4 4 4 4 4 4 4
Student 16 5 3 4 1 4 2 2 4 3 2 3 4 5 4 3
Student 17 4 5 3 4 4 3 3 2 3 4 3 4 5 5 5
Student 18 3 4 2 2 2 2 2 4 3 3 4 3 1 4 3
Student 19 3 2 3 4 4 4 4 2 1 1 1 1 1 1 1
Student 20 4 5 4 3 2 3 3 3 5 4 3 4 3 4 3
Student 21 5 4 3 2 2 1 2 4 5 4 4 3 5 4 4
Student 22 4 4 5 4 3 3 3 3 2 2 2 2 4 2 2
Student 23 5 4 4 1 3 1 1 3 4 5 3 4 5 5 4
Student 24 4 3 2 4 4 3 3 4 2 2 2 4 1 5 5
Student 25 4 3 3 3 4 2 2 3 4 1 2 2 5 3 3
Student 26 5 4 4 2 3 5 3 2 2 3 2 3 5 4 3
Student 27 3 2 1 3 3 2 4 3 3 2 3 2 1 3 2
Student 28 3 2 4 3 2 2 3 4 4 3 3 2 1 2 2
Student 29 3 1 3 3 2 2 2 5 4 1 3 2 4 3 1
Student 30 3 2 3 5 3 2 3 4 1 2 1 2 1 1 4
Student 31 2 1 3 3 2 2 2 4 3 2 3 2 3 2 2
Student 32 4 3 4 3 2 2 2 4 4 3 2 3 2 3 3
Student 33 4 3 3 2 4 3 3 2 3 2 2 2 3 2 2
Student 34 3 1 4 3 3 2 3 2 1 3 2 3 2 3 3

60
#1 #2 #3 #4 #5 #6 #7 #8 #9 #10 #11 #12 #13 #14 #15
Student 35 4 3 3 2 2 1 2 3 3 4 3 3 4 3 3
Student 36 3 2 3 5 4 3 4 3 2 1 1 3 1 1 3
Student 37 5 3 5 1 1 1 1 5 5 5 5 3 1 5 3
Student 38 4 4 5 3 2 1 2 5 5 3 4 3 5 3 3
Student 39 5 2 5 2 3 2 3 4 2 2 3 3 5 3 2
Student 40 4 3 4 2 1 1 1 5 3 2 3 4 5 4 3
Student 41 3 3 2 4 3 1 3 4 3 2 2 3 5 3 1
Student 42 5 5 5 3 3 3 2 5 5 3 4 3 5 4 3
Student 43 3 3 3 2 2 1 2 4 3 2 3 2 3 3 2
Student 44 5 2 3 3 1 2 2 4 3 3 2 2 1 3 3
Student 45 4 5 3 3 2 2 2 4 4 4 3 5 3 4 5
#16 #17 #18 #19 #20 #21 #22 #23
Student 1 3 1 4 5 3 4 5 4
Student 2 4 4 4 3 4 3 4 4
Student 3 1 5 1 1 2 2 3 3
Student 4 3 3 2 3 3 4 4 4
Student 5 2 3 1 3 3 3 3 3
Student 6 3 4 4 2 4 1 5 5
Student 7 3 2 5 5 4 3 5 4
Student 8 5 4 4 2 4 1 3 5
Student 9 4 4 4 3 5 2 5 5
Student 10 3 4 4 2 4 2 1 1
Student 11 3 3 5 4 3 3 2 2
Student 12 5 3 4 3 5 3 5 4
Student 13 4 3 5 5 4 3 4 4
Student 14 3 1 3 5 4 4 3 2
Student 15 3 3 4 3 4 2 4 4
Student 16 5 3 4 3 3 4 4 4
Student 17 3 2 4 5 4 5 5 4
Student 18 3 4 4 2 4 2 5 5
Student 19 2 1 1 4 2 3 3 3
Student 20 4 3 4 3 5 3 5 5
Student 21 3 5 4 1 5 2 4 4
Student 22 4 4 5 3 4 3 4 4
Student 23 3 3 4 2 4 3 5 3

61
Table Continued
#16 #17 #18 #19 #20 #21 #22 #23
Student 24 5 5 4 3 3 2 3 2
Student 25 2 3 4 4 5 3 4 4
Student 26 4 2 4 5 3 2 5 5
Student 27 3 3 3 3 3 3 3 3
Student 28 2 4 3 3 1 3 5 4
Student 29 2 2 4 3 3 3 4 3
Student 30 1 5 3 3 3 5 4 3
Student 31 2 3 3 3 4 2 4 4
Student 32 4 4 5 2 3 2 4 5
Student 33 4 3 4 3 4 3 4 4
Student 34 3 4 5 3 4 4 4 3
Student 35 3 3 4 3 3 2 5 5
Student 36 2 2 4 4 4 4 4 4
Student 37 5 5 5 1 4 2 4 4
Student 38 3 3 4 3 3 1 4 3
Student 39 4 3 4 2 3 2 4 3
Student 40 3 3 4 3 2 3 3 3
Student 41 3 3 4 3 4 2 5 4
Student 42 5 4 5 3 5 3 5 5
Student 43 2 4 4 3 3 3 5 3
Student 44 3 3 2 2 3 4 5 5
Student 45 3 3 3 3 5 2 4 5

APPENDIX E

63
Level Tests
Level 2 Test
Level 2 retest
Level 3 Test
Level 3 retest
Level 4 Test
Level 4 retest
Level 5 Test
Level 5 retest
Level 6 Test
Level 7 Test
Level 7 retest
Level 8 Test
Level 8 retest
Level 9 Test
Level 9 retest
Level 10 Test
Level 10 retest
Level 11 Test
Level 12 Test
Level 12 retest
Level 14 Test
Level 14 retest

64

65
Application
4. If create a function that produces an output of
5. The area for any square is given by the function , where is the length of a
side of the square. Use function notation to find the area of a square with a side length of
3.5 inches. (Include units in your answer).
Analysis/Synthesis/Evaluation
6. Completely fill out the table below so that the data DOES NOT represent a function.
7. Sketch a graph that fits each description.
a. A graph that passes through all four quadrants and represents a function.
b. A graph that passes through all four quadrants and does not represent a function.
c. A graph that passes through Quadrants 1, 2, & 3 only and represents a function.
d. A graph that passes through Quadrants 1, 2, & 3 only and does not represent a
function.

66
Level 2 Re-Test: Function Notation Learning Targets:
Understand and correctly interpret function notation & Find inputs and outputs of
functions.
Knowledge
1. Given the function machine below what is
the value of f(2)?
2.
If 7 is the input of the function above,
what is the output?
Comprehension
3. Examine each graph below. State whether the graph is or is not a function. If it is not a
function explain how you know.

67
Application
4. If create a function that produces an output of
5. The area for any square is given by the function , where x is the length of the
side of the square. Write the equation in function notation. Find the area of a square when
the side is 4 ft.
Analysis/Synthesis/Evaluation
6. Completely fill out the table below so that the data DOES represent a function.
7. Sketch a graph that fits each description.
a. A graph that passes through all four quadrants and does represents a function.
b. A graph that passes through all four quadrants and does not represent a function.
c. A graph that passes through Quadrants 1, 2, & 4 only and represents a function.
d. A graph that passes through Quadrants 1, 2, & 4 only and does not represent a
function.

68

69
Comprehension
3. Write the equation of the line using the table below:
x 0 1 2 3 4 5
y -3 2 7 12 17 22
Application
4. Write an equation for a line that is decreasing, crosses the x-axis at the point (3,0)
and crosses the y-axis at the point (0,4).
5. Find the slope of the line containing the two points: (2,3) and (4,7)

70

71

72
Level 4 Test
Objective: Write the equation (and/or interpret slope and y-intercept) from:
a) Tile pattern
b) Situation
Find the slope from a table without a y- intercept
Understand the slope as a rate
Knowledge
1. What is the rule (equation) that makes the table
2. Write a rule for the given tile pattern. How many tiles will be in figure 20?
Comprehension
3. Find the equation of the line passing through the two points:
Application
4. Eric starts with $30 in his bank account and saves $15 every month. Write an
equation for the amount of money in his bank account. State what x and y
represent.

73
5. Create a tile pattern that grows by 4 tiles for every new figure. Draw figures 0, 1,
2, and 3 of your pattern. Make an x y table to match your drawings and write
an equation (rule) for the table.
Analysis/Synthesis/Evaluation
6. Examine the fractal pattern below
a. Make a table of values where x= stage # and y= # of dark squares
b. Plot the points on a coordinate plane
c. Describe the graph

74
Level 4 Test RETAKE
Objective: Write the equation (and/or interpret slope and y-intercept) from:
c) Tile pattern
d) Situation
Find the slope from a table without a y- intercept
Understand the slope as a rate
Knowledge
7. What is the rule (equation) that makes the table
8. Write a rule for the given tile pattern. How many tiles will be in figure 20?
Comprehension
9. Find the equation of the line passing through the two points:
Application
10. Eric starts with $75 in his bank account and spends $8 every month. Write an
equation for the amount of money in his bank account. State what x and y
represent.
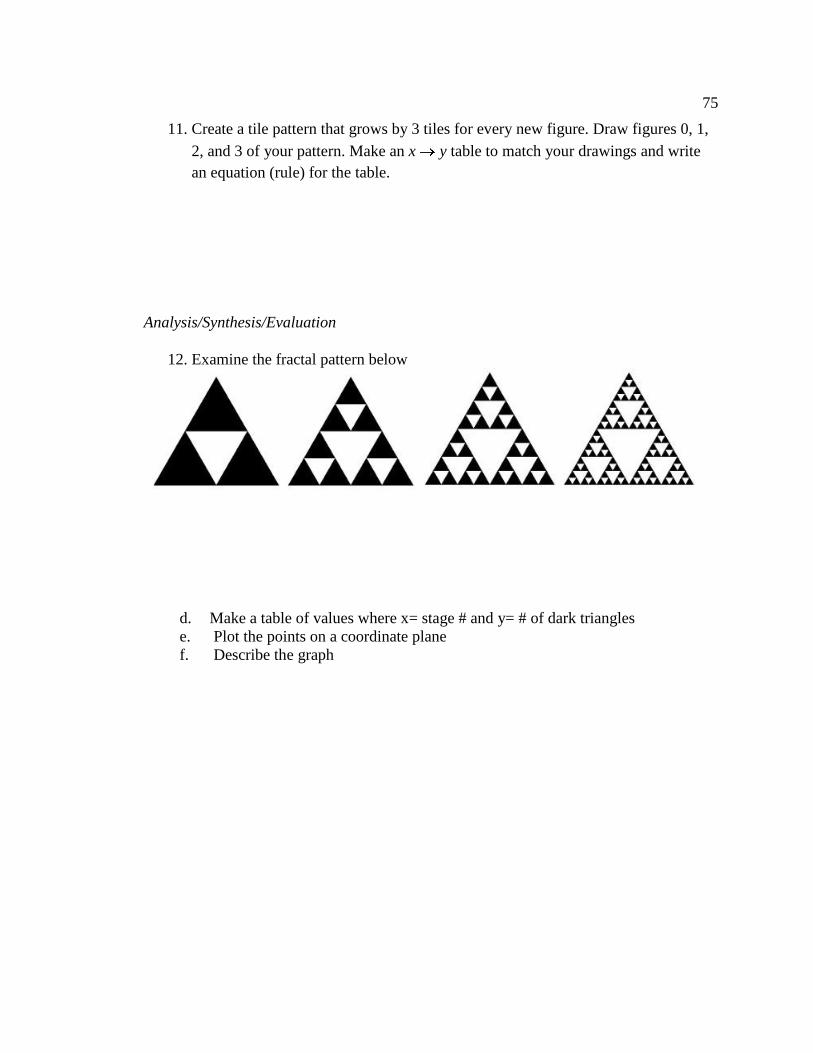
75
11. Create a tile pattern that grows by 3 tiles for every new figure. Draw figures 0, 1,
2, and 3 of your pattern. Make an x y table to match your drawings and write
an equation (rule) for the table.
Analysis/Synthesis/Evaluation
12. Examine the fractal pattern below
d. Make a table of values where x= stage # and y= # of dark triangles
e. Plot the points on a coordinate plane
f. Describe the graph
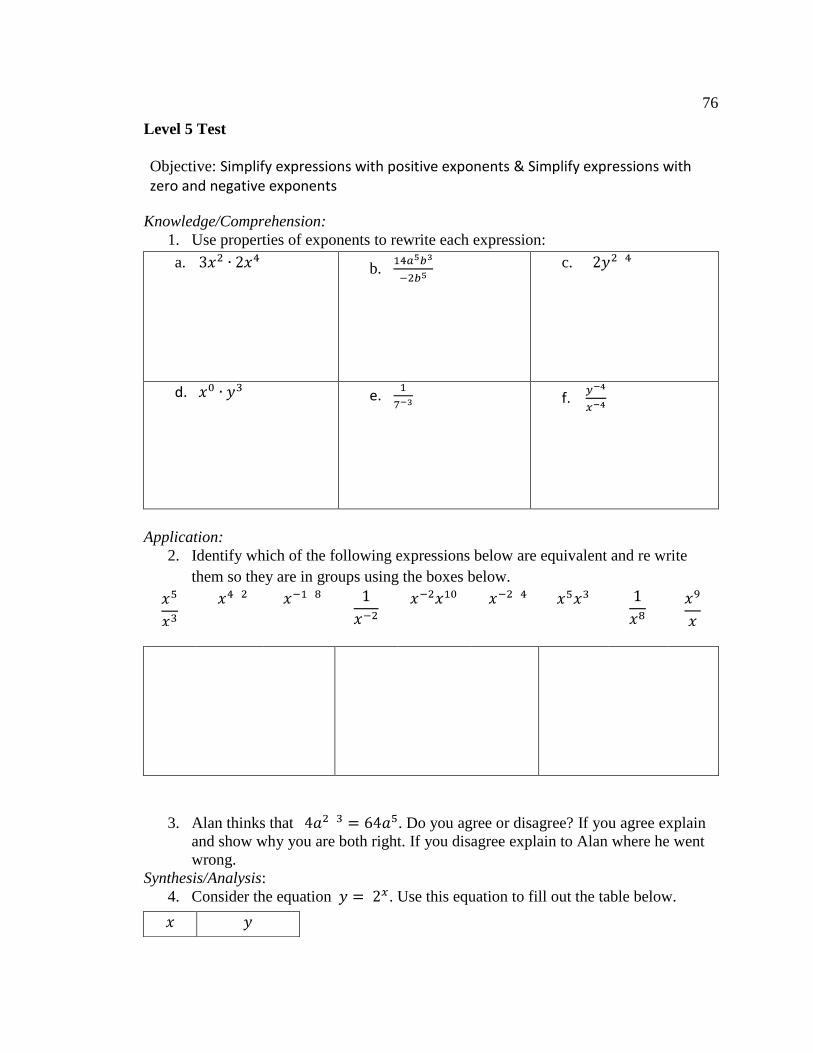
76
Level 5 Test
Objective: Simplify expressions with positive exponents & Simplify expressions with zero and negative exponents
Knowledge/Comprehension:
1. Use properties of exponents to rewrite each expression:
a. b.
c.
d. e. f.
Application:
2. Identify which of the following expressions below are equivalent and re write
them so they are in groups using the boxes below.
3. Alan thinks that . Do you agree or disagree? If you agree explain
and show why you are both right. If you disagree explain to Alan where he went
wrong.
Synthesis/Analysis:
4. Consider the equation . Use this equation to fill out the table below.

77
5. The pattern below looks at the black triangles in each stages:
Stage #
Number of Black Triangles
0 1 1 3 2 9 3
4
Fill out the rest of the table and EXPLAIN how exponents relate to this problem.
Stage 0 Stage 1 Stage 2
EXPLAIN why
is

78
Level 5 Test RETEST
Objective: Simplify expressions with positive exponents & Simplify expressions with zero and negative exponents
Knowledge/Comprehension:
6. Use properties of exponents to rewrite each expression:
g. h.
i.
j. k. l.
Application:
7. Identify which of the following expressions below are equivalent and re write
them so they are in groups using the boxes below.
8. Eric thinks that . Do you agree or disagree? If you agree explain and
show why you are both right. If you disagree explain to Alan where he went
wrong.
Synthesis/Analysis:
9. Consider the equation . Use this equation to fill out the table below.

79
10. The pattern below looks at the black triangles in each stages:
Stage #
Number of Black Triangles
0 1 1 3 2 9 3
4
Fill out the rest of the table and EXPLAIN how exponents relate to this problem.
Stage 0 Stage 1 Stage 2
EXPLAIN why
is

80
Level 6 Test
Objectives: Compute areas and dimensions on generic rectangles Use the distributive property to simply and solve equations Multiply binomials and polynomials
Knowledge
1. What is the area as a product AND
as a sum:
2. Find the area of each part and the
find the area of the whole.
Comprehension
3. Use the distributive property to simplify the following expressions:
a.
b.
Application:
4. Refer to the generic rectangle at the right
a. Use what you know about generic
rectangles to fill in the blanks.
b. Write the area as a product and as a sum.
?
3
?
5 –3
1
12 5
6
4
?
?
81
5. Multiply and simplify the following expression by using either a generic rectangle
or the distributive property:
6. Create your own generic rectangle and find the area as a product and as a sum.
Synthesis/Analysis:
7. Dan thinks that . Is he correct, why or why not?
8. Use what you know about multiplying binomials and exponents to expand and
then simplify

82
Level 7 Test
Objectives:
Solve simple absolute value equations in the form
Solve multivariable equations for one of its variables
Knowledge
1. Evaluate:
Comprehension
2. Solve the absolute value equation:
Solve the equation for the given variable:
3. Solve for x:
4. Solve for F:
5. Solve for C:
6. Solve for :
Application:
7. Use this formula to answer the following question:

83
.
You and your friends are pushing a piano. The combined Force is 500 Newtons.
The amount of work done is 1800 Joules. How far did they travel moving the
piano?
8. If the absolute value of the equation equals 60, what are the values of x?
Synthesis/Analysis
9. Consider the equation Eric thinks that completely solving for y
results in the equation Is Eric correct? Why or why not?
10. Renee is in a race. She is running at a pace of 7 miles per hour and gets a half of a
mile head start. The equation representing this situation is
Solve the equation for x and answer the following question: At what time was she 2
miles from the starting point?

84
Level 7 Retest
Objectives:
Solve simple absolute value equations in the form
Solve multivariable equations for one of its variables
Knowledge
1. Evaluate:
Comprehension
2. Solve the absolute value equation:
Solve the equation for the given variable:
3. Solve for x:
4. Solve form:
5. Solve for n:
6. Solve for :
Application:
7. Use this formula to answer the following question:

85
, where ρ represents density, v is volume, and m is mass.
If the density of turquoise is 2.6 grams/ . Using a cylinder full of water you
found the volume is 5 ml. What is the mass?
8. If the absolute value of the equation equals 16, what are the values of x?
Synthesis/Analysis
9. Consider the equation Eric thinks that completely solving for y
results in the equation Is Eric correct? Why or why not?
10. Fahrenheit can be found by using the equation , where C represents
Celsius.
Solve the equation for C and answer the following question: If the temperature outside is
50 degrees F what is the temperature in Celsius?

86
Level 8 Test: Systems of Equations Objectives:
Solve simple systems of equations, when one equation is given in
form, and the other is in standard form.
Understand that the solution to a system of equations is the point that makes both
equations true
Use graphing to estimate a solution to a system of equations
Knowledge/Comprehension
1. Solve each system of equations and check your answers.
Check: Check:
2. Solve the system of equations by graphing.

87
Application
3. Tickets for students to see White Christmas costs $10 and tickets for the public
cost $15. Currently 370 tickets have been sold and $4,700 has been collected in
ticket sales. How many student and public tickets have been sold?
Analysis/Synthesis/Evaluation
4. A door is on one side of the classroom, and a set of windows is on the opposite
wall.
Emily starts at the windows, which are 6 feet from the door, and walks towards
the door at 3 feet per second. Allison starts at the door and walks towards the
windows at the same pace as Emily.
a) Sketch a graph to represent the situation, with the x-axis representing time
and the y-axis representing distance from the door.
b) Where will Allison and Emily cross paths? Use a system of equations.

88
Level 8 RE-Test: Systems of Equations Objectives:
Solve simple systems of equations, when one equation is given in
form, and the other is in standard form.
Understand that the solution to a system of equations is the point that makes both
equations true
Use graphing to estimate a solution to a system of equations
Knowledge/Comprehension
5. Solve each system of equations and check your answers. YOU MUST SHOW
YOUR WORK!
Check: Check:
6. Solve the system of equations by graphing.
What is the solution to the system?

89
Application
7. Inspire Algebra Students are raising money for a charity. They are hosting a bake
sale and selling brownies for $3 each and peanut butter cookies for $2 each. At
the end of the sale they know they have sold a total of 200 treats and made $510.
How many brownies and how many cookies did the Students sell?
Analysis/Synthesis/Evaluation
8. You are at school walking to Celestino’s for some delicious Oscar’s Spicy Luau
Pizza. Mrs. Reynolds is walking back to school from Celestino’s already having
had her Oscar’s Spicy Luau Pizza for lunch.
Celestino’s is 5 miles away from school. You are walking at a speed 2 miles per
hour and Mrs. Reynolds is walking at a speed of 3 miles per hour.
c) Sketch a graph to represent the situation, with the x-axis representing time
and the y-axis representing distance from school.
d) Where will you and Mrs. Reynolds cross paths? Use a system of
equations. Show or explain how you got your answer.

90

91
Application
1. Mr. Kauffman is starting a farm. He will start out with a total of 63 animals, only
Pigs and Chickens. Altogether the pig and chicken legs add up to 210 Note that
each pig has all 4 legs and each chicken has both their legs. Use this information
to set up a system of equations and tell us how many pigs and how many
chickens Mr. Kauffman is starting his farm with.
Analysis/Synthesis/Evaluation
2. Write a system of two equations that satisfies each condition. Then solve the
system of equations.
a. The graphs of the equations do not intersect.
b. The solution to the system of equations is (0,0)
b) Describe what happened when you
tried to solve the system.
d) How does the graph of the system explain what happened with the
equations?

92

93
Application
7. The difference of two numbers is 3. The sum of the same two numbers is 13.
What are the two numbers?
8. Katie and Danielle are selling fruit for a school fundraiser. You can buy a small
box of oranges or a large box of oranges. Katie sold 3 small boxes of oranges and
14 large boxes of oranges for a total of $203. Danielle sold 11 small boxes of
oranges and 11 large boxes of oranges for a total of $220. What is the cost of a
bag of small oranges? What is the cost of a bag of large oranges?
Analysis/Synthesis/Evaluation
9. Write a system of two equations that satisfies each condition. Then solve the
system of equations.
c. The graphs of the equations do not intersect.
d. The solution to the system of equations is (1, 4)

94
Level 10 Test
Objectives:
Recognize whether a sequence, table, or graph is linear (arithmetic), exponential
(geometric), or something else.
Identify the sequence generator from a sequence, table, or graph of arithmetic and
geometric sequences and extend the pattern
Knowledge (part 1) /Comprehension (Part 2) (30%)
1. Describe how the sequence is generated and give the next three terms.
a)
b)
c)
Application (40%)
Complete this problem on a separate sheet of graph paper.
Investigate the three scenarios below. You may find it helpful to make a diagram or draw
a picture to help you investigate the scenario BEFORE you make the table.
For each scenario:
Create a sequence and put it in a table.
Identify the sequence generator and extend the pattern in your table to include at
least 6 data points
Create a graph
Fully describe the growth pattern and everything you can about the
sequence/scenario. Use proper vocabulary from class in your description for full
credit.
Scenario 1:
Lisa begins with 2 rabbits. Every month each pair of rabbits has 6 babies.
Scenario 2:
Mrs. Reynolds cactus is a height of 18 inches and will grow 3 inches each month.
Scenario 3:

95
A tennis ball is dropped from a height of 100 cm and bounces to a height of 50 cm.
Analysis/Synthesis/Evaluation 30%
Consider the sequence:
a) What is the sequence generator?
b) Put the sequence into a table.
c) Graph the sequence.
d) Completely describe the graph taking into consideration the following
Is the graph linear, exponential or something else?
Identify any and intercepts (if any).
Does the graph increase, decrease, or something else?
e) What is the equation for your graph in terms of and .
f) What new conclusions/connections can you form about this type of sequence and
the type of equation you discovered?

96
Level 10 RETest
Objectives:
Recognize whether a sequence, table, or graph is linear (arithmetic), exponential
(geometric), or something else.
Identify the sequence generator from a sequence, table, or graph of arithmetic and
geometric sequences and extend the pattern
Knowledge (part 1) /Comprehension(part 2)
2. Describe how the sequence is generated and give the next three terms.
d)
e)
f)
Application
Complete this problem on a separate sheet of graph paper.
Investigate the three scenarios below. You may find it helpful to make a diagram or draw
a picture to help you investigate the scenario BEFORE you make the table.
For each scenario:
Create a sequence and put it in a table.
Identify the sequence generator and extend the pattern in your table to include at
least 6 data points
Create a graph
Fully describe the growth pattern and everything you can about the
sequence/scenario. Use proper vocabulary from class in your description for full
credit.
Scenario 1:
Lisa begins 4 baseball cards. Every month she buys 10 more.
Scenario 2:
Mrs. Reynolds started with 4 rabbits. Every month each pair of rabbits has 3 rabbits.
Scenario 3:
A tennis ball is dropped from a height of 120 cm and bounces to a height of 30 cm.

97
Analysis/Synthesis/Evaluation
Consider the sequence:
g) What is the sequence generator?
h) Put the sequence into a table.
i) Graph the sequence.
j) Completely describe the graph taking into consideration the following
Is the graph linear, exponential or something else?
Identify any and intercepts (if any).
Does the graph increase, decrease, or something else?
k) What is the equation for your graph in terms of and .
l) What new conclusions/connections can you form about this type of sequence and
the type of equation you discovered?

98
Level 11 Test Objectives: Write a recursive equation for an arithmetic sequence Use multiple representations for arithmetic sequences Knowledge 1. Consider the sequence:
a) Identify the sequence generator and the first term.
b) Write an explicit equation from the sequence.
c) Write a recursive equation from the sequence.
d) What is the 10th term of the sequence?
2. Write the 1st five terms of the sequence:
a.
b.
Comprehension
3. Consider the sequence 12, 14, 16, 18, 20, …
a. Find the EXPLICIT equation for this sequence.
b. Show how to find the 27th term using the equation from a.
Application
4. Determine whether 323 is a term of the sequences below. If so which term?

99
5. Consider the graph at the right.
a. Which recursive equation goes with the graph?
i. 5
ii.
iii.
b. Is the sequence represented by the graph Arithmetic, Geometric, or
something else? How can you tell?
Synthesis/Analysis/Evaluation
6. Consider the pattern: Please do this problem on a separate piece of graph paper.
a. If you only look at the number of black triangles, at each stage in the
pattern, what sequence can you find? Write the sequence for us. b. Sketch a graph of this sequence c. What type of sequence is this? d. What is the recursive equation for this sequence? e. Find another sequence in this pattern?

100

101
Synthesis, Analysis, Evaluation 1. Consider the following scenario. Jake and Jenny close their savings accounts at the same
time. Jake had a total of $25,000 and Jenny had a total of $17,500. Jake is a wild gambler and
spends 10% each month at the casino. Jenny decided to reinvest her savings and is now
earning 5% interest of her total savings each month in her new savings account.
Use the tables provided to represent the two situations above.
Approximately which month will Jenny have more money than Jake?
0
25,000
0
17,500

102
Level 12 Retest Learning Targets Write a recursive equation and explicit equation for geometric sequences
Use multiple representations for geometric sequences
Determine a sequence generator from a percent increase/decrease word problem
Identify percent increase and/or decrease from a sequence Knowledge
Consider the sequence: 50, 70, 98, 137.2, 192.08 … 1. What is the sequence generator and what do we call it for geometric sequences?
2. Put this sequence in a table.
3. Graph your sequence
4. Describe your graph.
Comprehension 5. What is the RECURSIVE equation for the sequence?
6. What is the EXPLICIT equation for the sequence?
Application Consider the function .
7. Fill out the table to represent the sequence contained by this function.
8. If this sequence represents the value of a house over time, what was the initial value of the
house?
9. Does the price of the house increase or decrease as time increases and by what percentage
rate?
10. How much will the house be worth after 10 years?
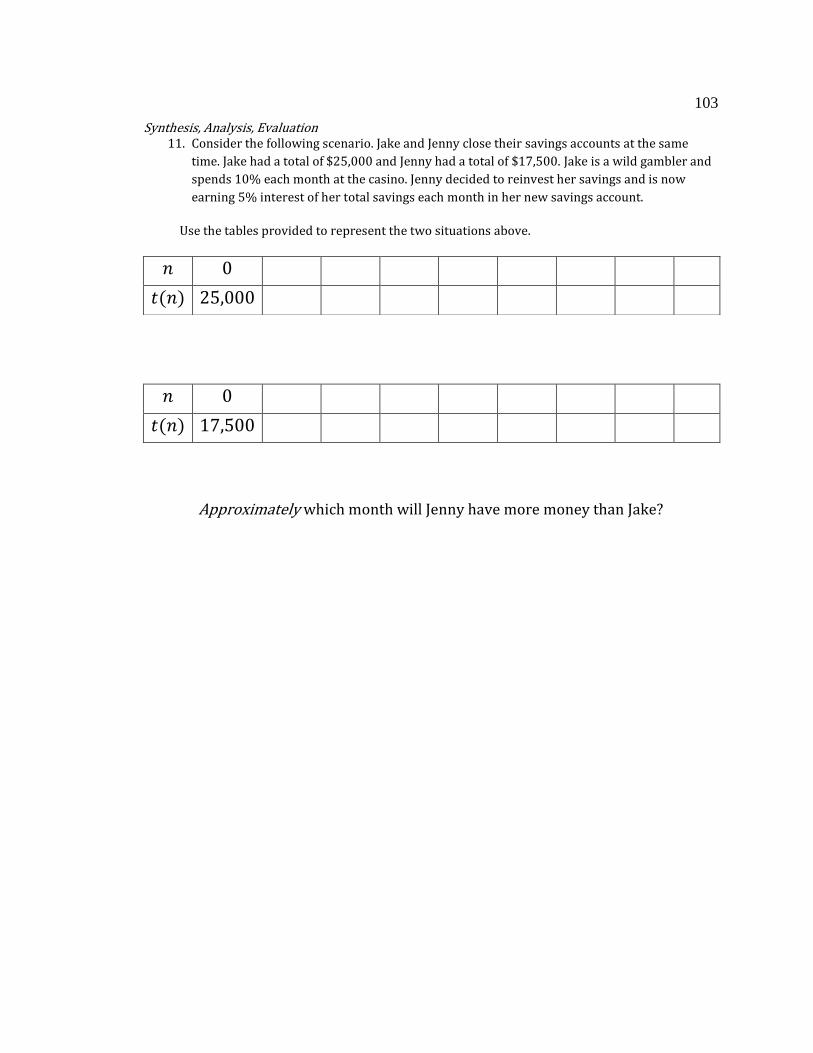
103
Synthesis, Analysis, Evaluation 11. Consider the following scenario. Jake and Jenny close their savings accounts at the same
time. Jake had a total of $25,000 and Jenny had a total of $17,500. Jake is a wild gambler and
spends 10% each month at the casino. Jenny decided to reinvest her savings and is now
earning 5% interest of her total savings each month in her new savings account.
Use the tables provided to represent the two situations above.
Approximately which month will Jenny have more money than Jake?
0
25,000
0
17,500

104
Level 15 Test
Objectives:
Identify the x intercepts from a table and a graph for a quadratic
Find the y intercepts of a quadratic from a table, graph, and/or equation
Find the x intercepts from an equation by factoring and applying the Zero Product
Property
Find the vertex of a parabola using the x intercepts and equation
Sketch a parabola once you have found the x intercepts and the vertex
Sketch a parabola from vertex form of a quadratic
(1) Knowledge (2) Comprehension:
Application:
3. Match each parabola below with its rule. Write the correct rule under its graph. Justify
how you know the rule goes with each parabola. Note: Not all rules will be matched
with a parabola.
Justify:
Justify:
Justify:
Synthesis/Evaluation/Analysis
4. Consider the equation:
1. Factor the quadratic:
2. Find the x- and y-intercept(s) for the quadratic
without making a table or
graphing. How are you able to do this? Explain
completely.
1. 2. 3. 4.
5.

105
a. Solve this equation for x, neatly show all
work.
b. Find the x intercepts for the graph of
c. Find the vertex of the graph, using the
line of symmetry.
d. Find the y intercept.
e. Carefully sketch the graph of . Label all intercepts and vertex.
Include the line of symmetry in your drawing to show that it goes through the
vertex.
f. Is there a connection between your answer to part (a) and your graph? Explain
completely.

106
Level 15 ReTest
Objectives:
Identify the x intercepts from a table and a graph for a quadratic
Find the y intercepts of a quadratic from a table, graph, and/or equation
Find the x intercepts from an equation by factoring and applying the Zero Product
Property
Find the vertex of a parabola using the x intercepts and equation
Sketch a parabola once you have found the x intercepts and the vertex
Sketch a parabola from vertex form of a quadratic
(1) Knowledge (2) Comprehension:
Application:
3. Match each parabola below with its rule. Write the correct rule under its graph. Justify
how you know the rule goes with each parabola. Note: Not all rules will be matched
with a parabola.
Synthesis/Evaluation/Analysis
3. Factor the quadratic:
4. Find the x- and y-intercept(s) for the quadratic
without making a table or
graphing. How are you able to do this? Explain
completely.
a.
Justify:
b.
Justify:
c.
Justify:
1. 2. 3. 4.
5.

107
4. Consider the equation:
g. Solve this equation for x, neatly show all work.
h. Find the x intercepts for the
graph of
i. Find the vertex of the graph,
using the line of symmetry.
j. Find the y intercept.
k. Carefully sketch the graph of
. Label all
intercepts and vertex. Include the
line of symmetry in your drawing
to show that it goes through the vertex.
l. Is there a connection between your answer to part (a) and your graph? Explain
completely.


![Welcome! [] Game is Afoot.pdfIn practice, gamification in education has been used with gamified designs in an instructional system that supports nongame activities to increase student](https://img.pdfslide.us/doc/110x75/60a7707b05a5442a4f3dfe17/welcome-game-is-afootpdf-in-practice-gamification-in-education-has-been-used.jpg)