Embed Size (px)
Citation preview
Games and Economic Behavior 93 (2015) 89–107
Contents lists available at ScienceDirect
Games and Economic Behavior
www.elsevier.com/locate/geb
Focal points and bargaining in housing markets ✩
Devin G. Pope a,d,∗, Jaren C. Pope b, Justin R. Sydnor c,d
a Booth School of Business, University of Chicago, 5807 S Woodlawn Ave., Room 310, Chicago, IL 60637, United Statesb Department of Economics, Brigham Young University, 180 Faculty Office Building, Provo, UT 84602-2363, United Statesc Wisconsin School of Business, University of Wisconsin-Madison, 975 University Ave., 5287 Grainger Hall, Madison, WI 53706, United Statesd NBER, United States
a r t i c l e i n f o a b s t r a c t
Article history:Received 21 August 2014Available online 30 July 2015
JEL classification:C78
Keywords:Focal pointsBargainingHousing prices
Are focal points important for determining the outcome of high-stakes negotiations? We investigate this question by examining the role that round numbers play as focal points in negotiations in the housing market. Using a large dataset on home transactions in the U.S., we document sharp spikes in the distribution of final negotiated house prices at round numbers, especially those divisible by $50,000. The patterns cannot be easily explained by simple stories of convenience rounding or by list prices. We conclude that round numbers can serve as focal points, even in settings with very high stakes.
© 2015 Elsevier Inc. All rights reserved.
1. Introduction
Nobel Prize winner Thomas Schelling introduced the concept of a focal point and described its role in coordination, bargaining and game theory in his seminal book The Strategy of Conflict (1960). A focal point is defined to be an outcome that is often chosen as the ”resting place” of a negotiation because it is somehow natural or special.
In relating the concept of a focal point to explicit numerical bargaining Schelling states: “In bargains that involve numerical magnitudes, for example, there seems to be a strong magnetism in mathematical simplicity. A trivial illustration is the tendency for the outcomes to be expressed in ‘round numbers’; the salesman who works out the arithmetic for his ‘rock-bottom’ price on the automobile at $2,507.63 is fairly pleading to be relieved of $7.63.” While the intuition that Schelling presents in his statement above is clear, there is surprisingly little empirical evidence of whether, and how round numbers serve as focal points in real-world bargaining situations.
Experimental literatures in both bargaining (see Roth, 1995) and negotiations (see Tsay and Bazerman, 2009) reveal that there is substantial room for social and cultural influences to affect bargaining outcomes. The experimental bargaining literature has revealed that perceptions of fairness appear to matter and that outcomes often center on 50/50 “fair splits” of the available rewards. While a desire for fairness appears to be part of the explanation for these patterns, many authors have shown that reliance on even splits also appears to have a strategic element related to the focal nature of these outcomes (Roth, 1985; Janssen, 2006; Andreoni and Bernheim, 2009). Janssen (2006), in particular, argues that there may be too much emphasis in the literature on fairness and that there should be more work to systematically understand the modal
✩ We thank James Cardon, Val Lambson, Jesse Shapiro, George Wu, and seminar participants at Cornell University, the Federal Trade Commission, the Munich workshop on natural experiments and controlled field studies, and the University of Chicago. The standard disclaimer applies.
* Corresponding author at: Booth School of Business, University of Chicago, 5807 S Woodlawn Ave., Room 310, Chicago, IL 60637, United States.E-mail addresses: [email protected] (D.G. Pope), [email protected] (J.C. Pope), [email protected] (J.R. Sydnor).
http://dx.doi.org/10.1016/j.geb.2015.07.0020899-8256/© 2015 Elsevier Inc. All rights reserved.
90 D.G. Pope et al. / Games and Economic Behavior 93 (2015) 89–107
responses that form focal points in bargaining situations. We see this as a particularly relevant point for understanding real-world bargaining, since, in contrast to experimental settings, it is generally difficult to know the size of the total surplus in real-world negotiations. Schelling’s arguments suggest the possibility that round numbers may serve the focal-point role when it is unclear what a fair split of the surplus should be.
In this paper we explore the role of round-numbered focal points for bargaining in a high-stakes environment by in-vestigating negotiated prices in the U.S. housing market. We define a focal point very simply as a negotiated outcome that occurs more frequently than would be expected. The standard way to describe ”expected” prices in the housing market has been Rosen’s (1974) “hedonic model” which has guided empirical estimation of housing prices and implicit prices of housing characteristics for forty years. The model captures the notion that houses are heterogeneous goods that consist of a bundle of characteristics. When the housing market is sufficiently thick, then the housing price is determined by the combined value of the implicit or shadow prices of the individual characteristics of houses in the market that are revealed by trades between buyers and sellers. In this stylized setting, the bargaining that takes place between buyers and sellers in the real world is noticeably absent.1 However, anyone who has purchased a house knows that thousands of dollars of “sur-plus” is bargained over, often with the aid of real estate agents. An important question is: does this bargaining process end up revealing the “true” value of a house given the assumptions of an efficient and thick market underlying the traditional hedonic model, or do house prices systematically reflect the influence of focal points in the negotiation process?2
To investigate the role of round-number focal points in the housing market, we acquired an extensive housing dataset of over 11 million housing transactions that took place between 1998 and 2009. The data were compiled from county assessor offices in 331 counties in 30 states and provide the final transaction price for each single-family house sold during this period. These counties represent approximately 45% of the population in the United States. We also acquired a small housing dataset for Chicago, Illinois, that provides not only the final transaction price, but also the price at which the houses were originally listed on the multiple listing service (MLS). These extensive data allow us to take Janssen’s (2006)more “modal” approach in understanding bargaining and focal points seriously in this important market.
Using these housing data we tested the hypothesis that the focal nature of round numbers would lead to an increased mass of final negotiated prices at salient round numbers. We find strong confirmation for this hypothesis. Looking at simple histograms of the transaction-price distribution we find that there are spikes in the distribution at round numbers. The spikes are especially large at prices divisible by 50,000 and are also quite sizeable at those divisible by 25,000. For example, we find that there are approximately 21% more houses whose final sales price falls between $500,000 and $504,999 than would have been expected assuming a smooth distribution of housing values. Similarly, we find that there are six times more houses with a final sales price between $1,000,000 and $1,004,999 than there are houses with a final sales price between $1,005,000 and $1,009,999. We refine our histogram approach by looking at very small bins of housing transactions and show that the excess mass can be attributed to a large number of transactions right at the salient 50,000 and 25,000 round-number marks.
Given that there are transaction costs to negotiations, some degree of rounding in the process of negotiations is natural and efficient. We would not necessarily expect parties to negotiate over precise dollar amounts in increments of dollars or even perhaps hundreds of dollars. Indeed, convenience rounding likely explains the fact that the overwhelming majority of prices end on $1000 marks. However, the frequency of round-number pricing observed in the housing market cannot be fully explained with this sort of simple convenience-rounding story. In particular, we observe especially pronounced spikes at $25,000 and $50,000 marks, which cannot be explained by convenience rounding unless we believe that transaction costs are so large that negotiations occur in $50,000 increments even for houses worth $300,000 or $400,000. Instead, the patterns observed here strongly suggest that houses where negotiations might reasonably end in the neighborhood of a salient round number, are especially likely to end right on the round number. In fact, we document that most of the excess mass in the distribution of prices at $50,000 marks is drawn from within $10,000 of those prices. We also find some asymmetry in how salient, round-number prices, draw mass in the distribution of prices around them, contrary to a simple story of convenience rounding.
We argue that this excess mass is due to the round numbers serving as focal points in a bargaining situation. However, one might worry that institutional features of the housing market—and not focal points—may be the cause of this effect. For example, an alternative hypothesis is that our findings are a result of the listing prices that sellers set in this market. Using our smaller Chicago, IL dataset, we are able to explore this alternative hypothesis directly. We show that nearly all of the houses whose final sales price was right at a round number (e.g. $400,000) had a list price when the house went under contract of a larger number ($419,000, $429,000, $439,000, etc.). Homes with list prices of $419,000 were much more likely to be negotiated down to $400,000 than other final values (e.g. $395,000 or $405,000). Thus, the excess mass that we find at round numbers does not appear to be caused by list prices, but rather is driven by the negotiation process stopping at round numbers.
Our data run from 1998 to 2008 covering the housing boom in the U.S. and ending just as the housing market began to crash. When we analyze the patterns over time, we see that the extra mass spikes at $50k focal prices was present in each
1 See Palmquist (2005) for more detail on the hedonic model applied to housing markets. Also, see Harding et al. (2003) for an attempt at introducing bargaining power into the hedonic model.
2 See Kuminoff and Pope (2014) for a discussion of the hedonic model and the assumptions needed to identify willingness-to-pay using housing data.
D.G. Pope et al. / Games and Economic Behavior 93 (2015) 89–107 91
year and rose over this housing boom period, showing especially sharp rises in states with rapid price appreciation. We also find that the asymmetry pattern with more mass pulled from the “seller’s side” above the $50k focal prices appears in all years except for 2008, when the asymmetry pattern reverses. Taken together these patterns are suggestive that reliance on focal prices and the slight asymmetry in favor of buyers around these focal prices may be stronger during a time of rising values.
In this paper, we document that housing negotiations are disproportionately likely to end on a salient round number. This provides empirical evidence from a high-stakes bargaining environment of the importance of “focal points” in the broadest sense of that term – namely a focal point as a frequent and special ending place for negotiations.
However, our study also leaves open important questions for future research as to why round-number transactions are so prevalent. In particular, with the data we have we are unable to assess the extent to which round numbers are focal in housing transactions due to strategic reasoning versus individual reasoning. As we discuss in the literature review in Section 2, there is a growing body of research showing that the salience of round numbers is an important property of individual reasoning processes in a number of different contexts. What is difficult to determine, though, is whether the importance of round numbers in the strategic setting of housing negotiations arises because round numbers play a role in the reasoning individuals do in considering their own willingness to pay/accept for the house or because people recognize the shared salience of round numbers as part of their strategic reasoning. Shelling’s discussion of focal points focuses on the second mechanism where common knowledge of shared focal points is a strategic coordinating device, but it could also be that round numbers become focal points in housing negotiations because they are where individuals frequently set their individual reservation values in negotiation. As we discuss in the conclusion, it could be valuable for future research to explore these mechanisms, as they are important for understanding negotiation processes generally as well as for understanding the efficiency of round-number focal points and their relation to bargaining impasses (Babcock and Loewenstein, 1997).
The paper proceeds as follows. In Section 2 we provide a brief literature review on bargaining and focal points as it relates to this paper. We proceed in Section 3 to describe the key housing datasets used in our analysis. In Section 4, we describe the empirical evidence that round numbers act as focal points in the bargaining between buyers and sellers in the housing market. Finally, we provide a discussion and conclude in Section 5.
2. Background on bargaining and focal points
2.1. History of bargaining, game theory and focal points
Theoretical models of bargaining have a long and interesting history within economics.3 Early models by Edgeworth(1881), Zeuthen (1930), Hicks (1932), and Pigou (1932) modeled bargaining by analyzing the negotiation process as a series of bargaining steps that played out over time that related to the price adjustment process. However, the work by John Nash (Nash, 1950, 1953) took a very different approach to modeling bargaining. His was an axiomatic approach that determined a bargaining equilibrium without explicitly modeling the process of negotiation that led to the bargaining solution. A key axiom that led to a unique solution of the bargaining game was the concept of symmetry between perfectly informed players. Symmetry implied that players followed the same rules of behavior or in Nash’s words, that the axiom “expresses equality of bargaining skill.” Fundamentally, Nash’s approach and the axiom of symmetry relied on bargainers having rational expectations.
Economists’ views on how to model the bargaining process after Nash’s seminal contributions were largely divided into two camps in the late 1950s and 1960s. The primary voice of one of the competing viewpoints was that of John Harsanyi. Harsanyi (1956) showed that by relying on the axiom of symmetry, Zeuthen’s (1930) bargaining solution was equivalent to the Nash solution to the problem even though it did not model the process of negotiation explicitly. Then in a series of other papers, Harsanyi further fleshed out the crucial axiom of symmetry that allowed for a unique outcome to the bargaining game, and then formalized how this solution could be extended to situations where players have incomplete information about each other or the rules of the game (see Harsanyi, 1961 and 1967–1968). Later, Ariel Rubinstein (1982) extended Nash and Harsanyi’s approach to include the passage of time, making this axiomatic approach the dominant approach to modeling strategic bargaining in economics.
The primary competing viewpoint on modeling strategic bargaining was that of Thomas Schelling. Schelling’s (1959)paper entitled “For the Abandonment of Symmetry in Game Theory” points out that there are many other factors in a game, including psychological factors, that can lead to a bargaining solution other than that imposed by the axiom of symmetry.4
Furthermore, he pointed out forcefully in his (1960) book that in real-world strategic environments with asymmetry, players will try to influence other players’ expectations, and those players’ expectations about their own choices, implying that there is an important endogeneity to the negotiation process that was axiomatically excluded in the Nash and Harsanyi models of bargaining. This more nuanced concept of rationality (or lack thereof) and the realistic assumption of asymmetry led
3 Innocenti (2008) provides a more extensive literature review that provides a rich historical perspective on the evolution of bargaining as it relates to game theory and the competing views of Harsanyi and Schelling.
4 This paper was also included in an appendix in Schelling’s (1960) book “The Strategy of conflict.”
92 D.G. Pope et al. / Games and Economic Behavior 93 (2015) 89–107
Schelling to believe that there is a multiplicity of potential bargaining solutions in many situations. However, he proposed that “focal points” that have shared prominence or salience in a strategic environment may be the “clue” that allow people to coordinate their behavior and reach a bargaining solution. Thus Schelling advocated a more empirical and experimental approach to understanding how the process of negotiation and focal points affect bargaining in real-world situations.
While the axiomatic approach, which led to unique game-theoretic solutions, became the dominant approach in eco-nomics, it is also clear that this line of research has floundered in recent years. This is in large part due to the fact that the axiomatic models have not performed extremely well in predicting real-world solutions to bargaining.5
On the other hand, Schelling’s multi-faceted approach to bargaining has not been fully developed or explored. There have been some attempts to formalize the notion of focal points (e.g., Roth, 1985; Mehta et al., 1994; Sugden, 1995;Janssen, 2001) but there has been surprisingly little work on understanding, empirically, the potential role of focal points in bargaining outcomes in important markets.
2.2. Experimental evidence on focal points and bargaining
There is a substantial literature in experimental economics, largely motivated by Schelling’s work, exploring the role of focal points in coordination games. In the simplest coordination games participants benefit if they can both choose the same option and all that matters is coordinating. Mehta et al. (1994) show that individuals playing matching games coordinate at much higher rates than would be expected if they ignored potentially salient labels to the options in the game. They further show that the effects of salient labels as focal-point coordinating devices stem not only from these labels being natural choices when people are “just asked to pick something” but rely in part on individuals engaging in a further step of reasoning about what others will find salient. Recent research, however, has highlighted that the underlying psychological forces at work in generating these focal points are unclear and that there is likely a “diversity of methods by which focal points are found” (Bardsley et al., 2009).
There is also a stream of experimental literature investigating whether payoff-irrelevant cues and labels are useful focal points in coordination games, including bargaining games. Crawford et al. (2008) conduct matching games and find that when payoffs are aligned subjects are likely to coordinate on salient labels but that coordination on salient labels breaks down when subjects have conflicting preferences over equilibria. However, recent studies have found that payoff-irrelevant cues have strong effects in tacit bargaining games and are also used as coordinating devices in explicit bargaining situations when there are multiple potential outcomes with similar levels of economic efficiency and equality of payoffs between parties (Isoni et al., 2013, 2014).
These recent studies suggest that the conflicting-interest nature of bargaining situations does not eliminate a potential coordinating role for focal points. However, it is less clear how these insights extend to other bargaining contexts in which individuals bargain in monetary units without natural payoff-irrelevant cues to use in coordination. Nonetheless, experimen-tal studies on bargaining developed to test game-theoretic predictions about bargaining outcomes have consistently revealed deviations from theoretical predictions that suggest some potential role for focal-point considerations.
A series of influential studies (Roth and Malouf, 1979; Roth et al., 1981; Roth and Murnighan, 1982) conducted experi-ments where subjects had to bargain over splitting a set of lottery tickets for potential prizes. If the subjects could not agree in the allotted time, both parties received nothing. These studies revealed that there was a strong tendency for bargaining outcomes to cluster on either even splits of the lottery tickets or even splits of expected dollar outcomes for both parties. Work on ultimatum games, which can be thought of as a highly stylized bargaining situation, also showed tendencies for outcomes to deviate away from game-theoretic predictions and toward more even splits of the available experimental pie (Ochs and Roth, 1989).
These studies led to substantial interest in the role that concerns for fairness play in economic outcomes. Yet a range of findings in these studies strongly suggest that simple rules about “fair splits” and aversion to inequity cannot fully account for observed bargaining behavior (Roth and Murnighan, 1982; Neelin et al., 1988; Ochs and Roth, 1989; Prasnikar and Roth, 1992; Roth, 1995; Andreoni and Bernheim, 2009). Instead, the literature points to a rich and complicated interaction between concerns for fairness and strategic considerations of what the other party may be willing to accept. Roth (1985)argues that the data from experimental bargaining studies “suggest that bargainers sought to identify initial bargaining positions that had some special reason for being credible, and that these credible bargaining positions then served as focal points that influenced the subsequent conduct of negotiations and their outcome.” Janssen (2006) further argues that it may not be concerns for fairness per-se that lead us to observe even splits in many bargaining games, but rather the fact that fair splits are potential focal points that facilitate coordination in bargaining and that in general the role of focal points in bargaining has been under-explored.
At the same time that the experimental literature on bargaining was being established there was a parallel but sepa-rate movement toward experimental studies of negotiations (see Sebenius, 1992 and Tsay and Bazerman, 2009 for reviews). Where the bargaining literature was motivated by game theory, the negotiations literature focused on the process of ne-gotiations and was not generally grounded as tightly in economic theory. The setup of experiments in the negotiations literature is also generally different from that in the bargaining literature. The bargaining literature usually follows from
5 See Kreps (1990) for this viewpoint.
D.G. Pope et al. / Games and Economic Behavior 93 (2015) 89–107 93
game-theoretic models where tight predictions can be made and asks subjects to bargain over the split of a known mone-tary “pie.” Experiments in negotiations, on the other hand, usually give the subjects roles as sellers and buyers with stated reservation values that are private information and come closer to the setup of many real-world negotiations. The key to negotiations experiments is generally that there is a “zone of agreement” where reservation values overlap and the subjects could potentially reach an agreement.
Experiments in negotiations generally manipulate various factors of the negotiation situation and have documented a range of psychological effects that influence whether an agreement is found and if so where it lies in the zone of agreement. The literature has documented first-mover advantages (Galinsky and Mussweiler, 2001), the importance of a negotiators’ focus and aspirations (White and Neale, 1994; Galinsky et al., 2002), framing effects (Neale and Bazerman, 1985; Bazerman et al., 1985), important effects of anchoring (Tversky and Kahneman, 1973; Northcraft and Neale, 1987) and pervasive overconfidence about bargaining outcomes (Bazerman and Neale, 1982).
Despite this rich literature, until very recently there has been little work focusing on the role that round numbers may play in negotiations. A series of recent papers (Janiszewski and Uy, 2008; Thomas et al., 2010; Mason et al., 2013;Backus et al., 2015), though, provide evidence that in negotiations if the first offer (or listing price) is more precise (i.e., not round) that the other party appears to bargain less forcefully and outcomes are closer to the initial offer. Janiszewski and Uy propose that this effect arises because precise numbers trigger people to think in a finer classification scale and hence adjustment from an initial anchor happens over a tighter range of values. Mason et al. (2013) argue instead that precise offers may be “more effective anchors” because they convey a sense that the proposing party is more knowledgeable, while Backus et al. (2015) argue that non-round list-prices signal that the seller is more patient. Janiszewski and Uy (2008) provide some evidence that round listing prices often generate negotiations that are conducted in round increments, but otherwise these studies do not focus on the role of round versus precise numbers in the final agreements for these negotiations.6
2.3. Research on the focal nature of round numbers
Our interest in the potential role of round numbers as focal points in negotiations stems from a growing literature discussing the role of round numbers as focal or reference points in individual judgment and decision-making outside of the strategic bargaining context. Rosch (1975) discusses the role of round numbers as cognitive reference points. Pope and Simonsohn (2011) and Allen et al. (2014) demonstrate that round-number targets seem to serve as goals or reference points in a range of settings. There is also evidence that because people pay differential attention to the left digit of numbers, that round numbers with trailing zeroes become salient threshold points in how consumers process prices and other numeric information (Basu, 1997; Anderson and Simester, 2003; Lacetera et al., 2012; Busse et al., 2013). Applied to housing transactions, this literature suggests broadly that round numbers may play a role in how people feel about different negotiated outcomes.
It is also possible that round numbers could be involved in how people establish their own valuation for a house. While classic economic theory starts from the premise that people have well-defined preferences over all consumption bundles, there is substantial literature in economics, psychology and decision sciences developing the idea that people do not have such precise preferences. Butler and Loomes (2007), for example, develop a model in which individuals’ valuations are imprecise, which then can lead to preference reversals and related issues of inconsistent preferences. Related work in decision sciences has argued that preferences are often “constructed” once a valuation problem has been posed and are affected by features of the decision environment (e.g., Payne et al., 1992). Taken to the context of housing, this work suggests that it may be that round numbers play a role because individuals have imprecise valuations for houses and within a range of valuations over which the person cannot distinguish her feelings, the salience of round numbers causes them to be chosen frequently.
In fact, experimental studies where people are ask to give willingness to pay and willingness to accept for different objects in non-strategic settings (e.g., BDM mechanisms) shows this pattern of valuations reflecting round numbers. For example, looking at the data reported by Plott and Zeiler (2005, Table 4) on the willingness to pay and willingness to accept thresholds for mugs in their experimental tests of the endowment effect we see that although subjects could in principle set very precise thresholds for their valuations, 82% reported a valuation that was a $0.50 increment. The question of interest is whether this type of coarse reasoning is also prevalent in high-stakes housing markets and whether it ends up influencing the distribution of negotiated prices in a meaningful way.
2.4. Research on house-price anomalies
There is also a literature on behavioral influences to housing prices that relates to our work. One strand of this literature focuses on the role that list prices have on final outcomes. As Yavas and Yang (1995) discuss, if listing prices systematically
6 On the surface these results about listing prices would actually seem to predict if anything that we might observe negotiations ending at precise numbers more than round numbers, since precise numbers are less likely to be bid down. However, it is certainly plausible that individuals could tend to reach agreement more easily on round numbers while still tending to bargain down from precise initial offers to a lower degree. Furthermore, Mason et al. (2013) suggest that “if precise offer recipients have other reasons for being skeptical about the offer maker’s expertise, preparation or motives, a precise offer could backfire in being seen as a manipulative gambit or obnoxious ploy.” This may be a reasonable possibility in the housing market, where the typical seller is unlikely to be seen as a special expert on housing values.
94 D.G. Pope et al. / Games and Economic Behavior 93 (2015) 89–107
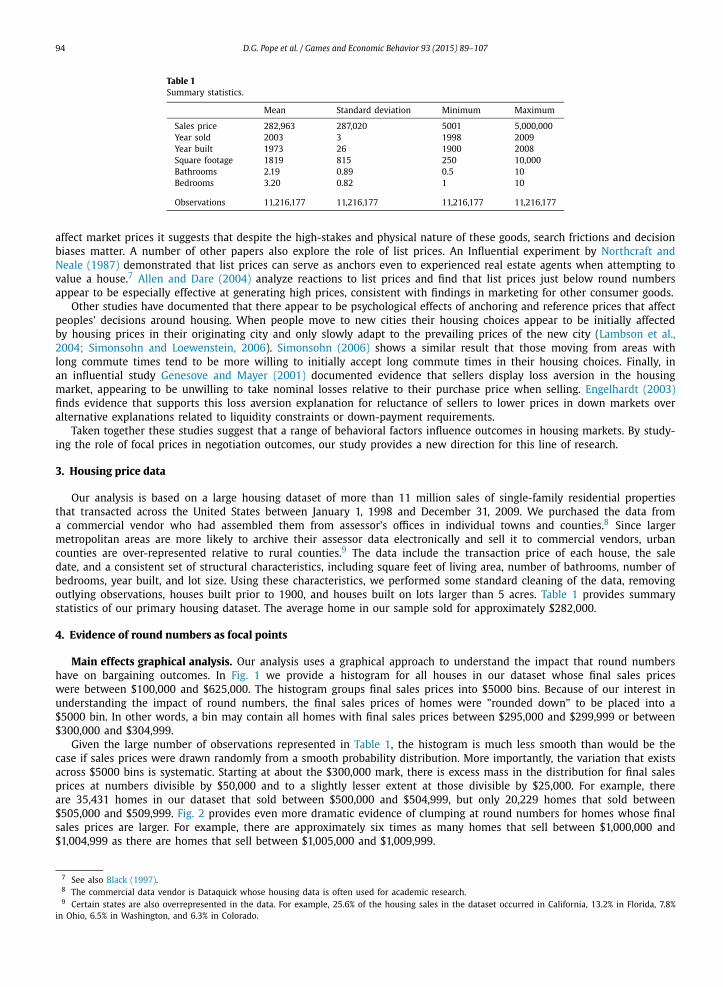
Table 1Summary statistics.
Mean Standard deviation Minimum Maximum
Sales price 282,963 287,020 5001 5,000,000Year sold 2003 3 1998 2009Year built 1973 26 1900 2008Square footage 1819 815 250 10,000Bathrooms 2.19 0.89 0.5 10Bedrooms 3.20 0.82 1 10
Observations 11,216,177 11,216,177 11,216,177 11,216,177
affect market prices it suggests that despite the high-stakes and physical nature of these goods, search frictions and decision biases matter. A number of other papers also explore the role of list prices. An Influential experiment by Northcraft and Neale (1987) demonstrated that list prices can serve as anchors even to experienced real estate agents when attempting to value a house.7 Allen and Dare (2004) analyze reactions to list prices and find that list prices just below round numbers appear to be especially effective at generating high prices, consistent with findings in marketing for other consumer goods.
Other studies have documented that there appear to be psychological effects of anchoring and reference prices that affect peoples’ decisions around housing. When people move to new cities their housing choices appear to be initially affected by housing prices in their originating city and only slowly adapt to the prevailing prices of the new city (Lambson et al., 2004; Simonsohn and Loewenstein, 2006). Simonsohn (2006) shows a similar result that those moving from areas with long commute times tend to be more willing to initially accept long commute times in their housing choices. Finally, in an influential study Genesove and Mayer (2001) documented evidence that sellers display loss aversion in the housing market, appearing to be unwilling to take nominal losses relative to their purchase price when selling. Engelhardt (2003)finds evidence that supports this loss aversion explanation for reluctance of sellers to lower prices in down markets over alternative explanations related to liquidity constraints or down-payment requirements.
Taken together these studies suggest that a range of behavioral factors influence outcomes in housing markets. By study-ing the role of focal prices in negotiation outcomes, our study provides a new direction for this line of research.
3. Housing price data
Our analysis is based on a large housing dataset of more than 11 million sales of single-family residential properties that transacted across the United States between January 1, 1998 and December 31, 2009. We purchased the data from a commercial vendor who had assembled them from assessor’s offices in individual towns and counties.8 Since larger metropolitan areas are more likely to archive their assessor data electronically and sell it to commercial vendors, urban counties are over-represented relative to rural counties.9 The data include the transaction price of each house, the sale date, and a consistent set of structural characteristics, including square feet of living area, number of bathrooms, number of bedrooms, year built, and lot size. Using these characteristics, we performed some standard cleaning of the data, removing outlying observations, houses built prior to 1900, and houses built on lots larger than 5 acres. Table 1 provides summary statistics of our primary housing dataset. The average home in our sample sold for approximately $282,000.
4. Evidence of round numbers as focal points
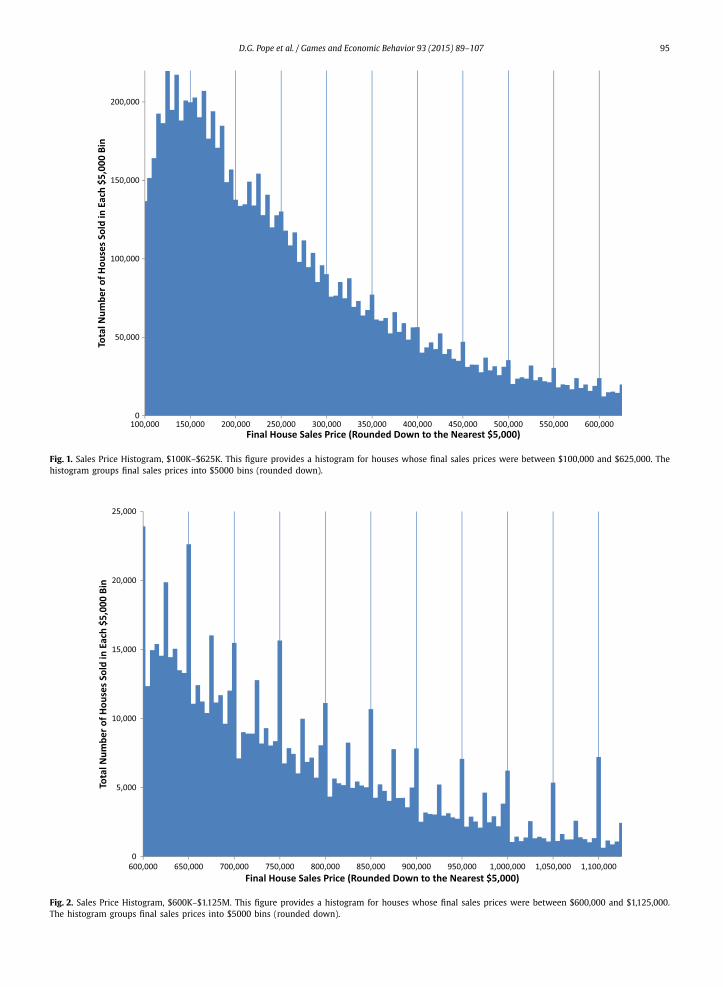
Main effects graphical analysis. Our analysis uses a graphical approach to understand the impact that round numbers have on bargaining outcomes. In Fig. 1 we provide a histogram for all houses in our dataset whose final sales prices were between $100,000 and $625,000. The histogram groups final sales prices into $5000 bins. Because of our interest in understanding the impact of round numbers, the final sales prices of homes were ”rounded down” to be placed into a $5000 bin. In other words, a bin may contain all homes with final sales prices between $295,000 and $299,999 or between $300,000 and $304,999.
Given the large number of observations represented in Table 1, the histogram is much less smooth than would be the case if sales prices were drawn randomly from a smooth probability distribution. More importantly, the variation that exists across $5000 bins is systematic. Starting at about the $300,000 mark, there is excess mass in the distribution for final sales prices at numbers divisible by $50,000 and to a slightly lesser extent at those divisible by $25,000. For example, there are 35,431 homes in our dataset that sold between $500,000 and $504,999, but only 20,229 homes that sold between $505,000 and $509,999. Fig. 2 provides even more dramatic evidence of clumping at round numbers for homes whose final sales prices are larger. For example, there are approximately six times as many homes that sell between $1,000,000 and $1,004,999 as there are homes that sell between $1,005,000 and $1,009,999.
7 See also Black (1997).8 The commercial data vendor is Dataquick whose housing data is often used for academic research.9 Certain states are also overrepresented in the data. For example, 25.6% of the housing sales in the dataset occurred in California, 13.2% in Florida, 7.8%
in Ohio, 6.5% in Washington, and 6.3% in Colorado.
D.G. Pope et al. / Games and Economic Behavior 93 (2015) 89–107 95
Fig. 1. Sales Price Histogram, $100K–$625K. This figure provides a histogram for houses whose final sales prices were between $100,000 and $625,000. The histogram groups final sales prices into $5000 bins (rounded down).
Fig. 2. Sales Price Histogram, $600K–$1.125M. This figure provides a histogram for houses whose final sales prices were between $600,000 and $1,125,000. The histogram groups final sales prices into $5000 bins (rounded down).
96 D.G. Pope et al. / Games and Economic Behavior 93 (2015) 89–107
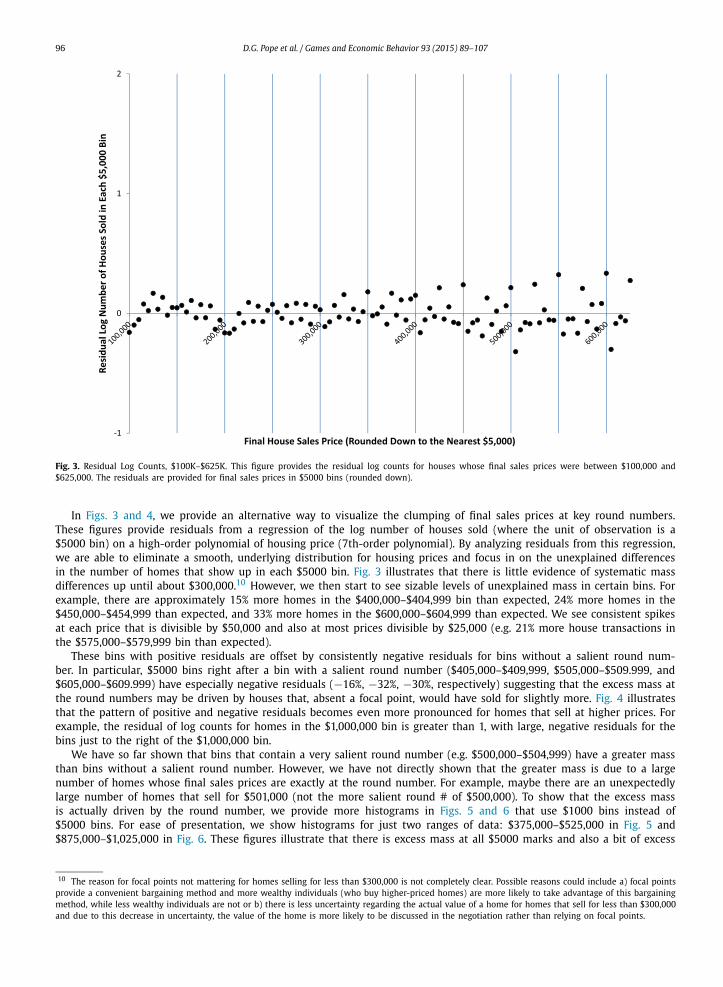
Fig. 3. Residual Log Counts, $100K–$625K. This figure provides the residual log counts for houses whose final sales prices were between $100,000 and $625,000. The residuals are provided for final sales prices in $5000 bins (rounded down).
In Figs. 3 and 4, we provide an alternative way to visualize the clumping of final sales prices at key round numbers. These figures provide residuals from a regression of the log number of houses sold (where the unit of observation is a $5000 bin) on a high-order polynomial of housing price (7th-order polynomial). By analyzing residuals from this regression, we are able to eliminate a smooth, underlying distribution for housing prices and focus in on the unexplained differences in the number of homes that show up in each $5000 bin. Fig. 3 illustrates that there is little evidence of systematic mass differences up until about $300,000.10 However, we then start to see sizable levels of unexplained mass in certain bins. For example, there are approximately 15% more homes in the $400,000–$404,999 bin than expected, 24% more homes in the $450,000–$454,999 than expected, and 33% more homes in the $600,000–$604,999 than expected. We see consistent spikes at each price that is divisible by $50,000 and also at most prices divisible by $25,000 (e.g. 21% more house transactions in the $575,000–$579,999 bin than expected).
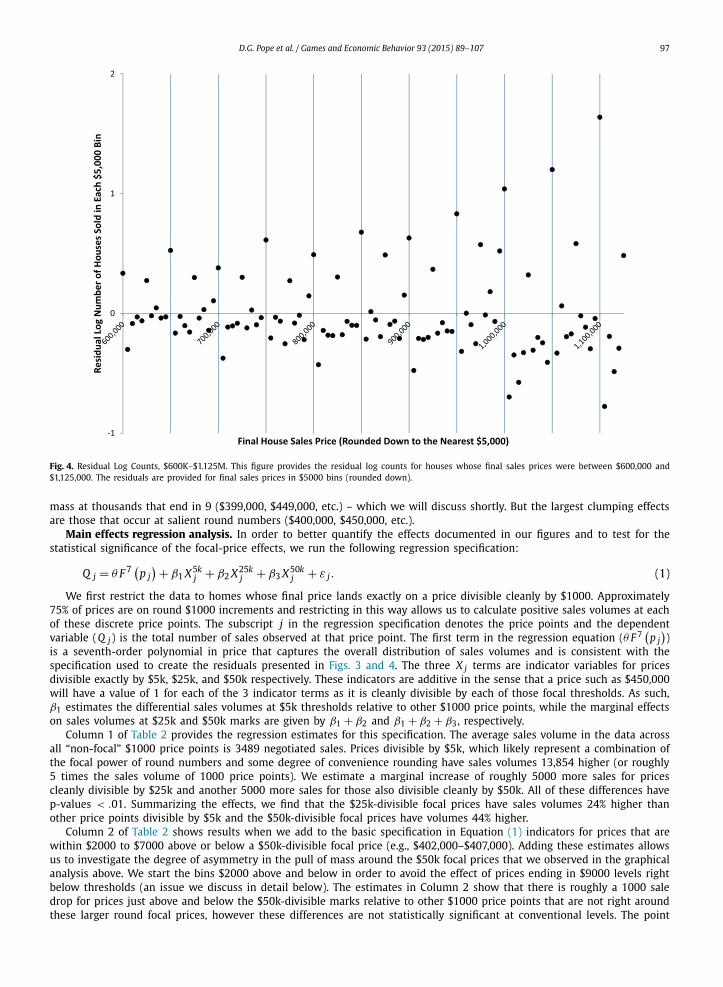
These bins with positive residuals are offset by consistently negative residuals for bins without a salient round num-ber. In particular, $5000 bins right after a bin with a salient round number ($405,000–$409,999, $505,000–$509.999, and $605,000–$609.999) have especially negative residuals (−16%, −32%, −30%, respectively) suggesting that the excess mass at the round numbers may be driven by houses that, absent a focal point, would have sold for slightly more. Fig. 4 illustrates that the pattern of positive and negative residuals becomes even more pronounced for homes that sell at higher prices. For example, the residual of log counts for homes in the $1,000,000 bin is greater than 1, with large, negative residuals for the bins just to the right of the $1,000,000 bin.
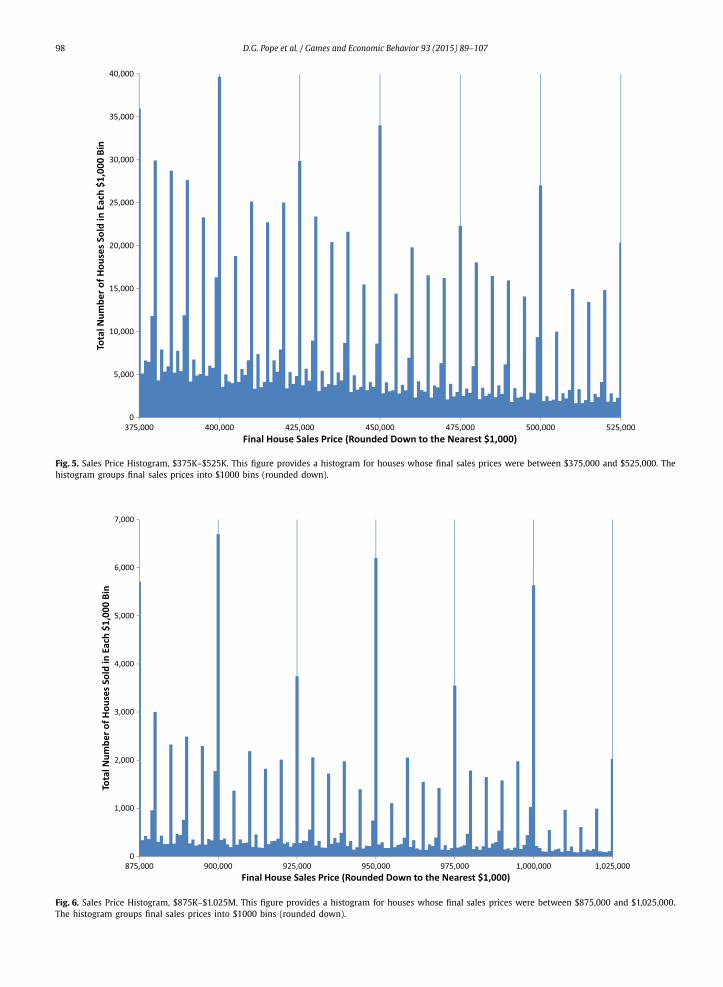
We have so far shown that bins that contain a very salient round number (e.g. $500,000–$504,999) have a greater mass than bins without a salient round number. However, we have not directly shown that the greater mass is due to a large number of homes whose final sales prices are exactly at the round number. For example, maybe there are an unexpectedly large number of homes that sell for $501,000 (not the more salient round # of $500,000). To show that the excess mass is actually driven by the round number, we provide more histograms in Figs. 5 and 6 that use $1000 bins instead of $5000 bins. For ease of presentation, we show histograms for just two ranges of data: $375,000–$525,000 in Fig. 5 and $875,000–$1,025,000 in Fig. 6. These figures illustrate that there is excess mass at all $5000 marks and also a bit of excess
10 The reason for focal points not mattering for homes selling for less than $300,000 is not completely clear. Possible reasons could include a) focal points provide a convenient bargaining method and more wealthy individuals (who buy higher-priced homes) are more likely to take advantage of this bargaining method, while less wealthy individuals are not or b) there is less uncertainty regarding the actual value of a home for homes that sell for less than $300,000 and due to this decrease in uncertainty, the value of the home is more likely to be discussed in the negotiation rather than relying on focal points.
D.G. Pope et al. / Games and Economic Behavior 93 (2015) 89–107 97
Fig. 4. Residual Log Counts, $600K–$1.125M. This figure provides the residual log counts for houses whose final sales prices were between $600,000 and $1,125,000. The residuals are provided for final sales prices in $5000 bins (rounded down).
mass at thousands that end in 9 ($399,000, $449,000, etc.) – which we will discuss shortly. But the largest clumping effects are those that occur at salient round numbers ($400,000, $450,000, etc.).
Main effects regression analysis. In order to better quantify the effects documented in our figures and to test for the statistical significance of the focal-price effects, we run the following regression specification:
Q j = θ F 7 (p j
) + β1 X5kj + β2 X25k
j + β3 X50kj + ε j . (1)
We first restrict the data to homes whose final price lands exactly on a price divisible cleanly by $1000. Approximately 75% of prices are on round $1000 increments and restricting in this way allows us to calculate positive sales volumes at each of these discrete price points. The subscript j in the regression specification denotes the price points and the dependent variable (Q j) is the total number of sales observed at that price point. The first term in the regression equation (θ F 7
(p j
))
is a seventh-order polynomial in price that captures the overall distribution of sales volumes and is consistent with the specification used to create the residuals presented in Figs. 3 and 4. The three X j terms are indicator variables for prices divisible exactly by $5k, $25k, and $50k respectively. These indicators are additive in the sense that a price such as $450,000 will have a value of 1 for each of the 3 indicator terms as it is cleanly divisible by each of those focal thresholds. As such, β1 estimates the differential sales volumes at $5k thresholds relative to other $1000 price points, while the marginal effects on sales volumes at $25k and $50k marks are given by β1 + β2 and β1 + β2 + β3, respectively.
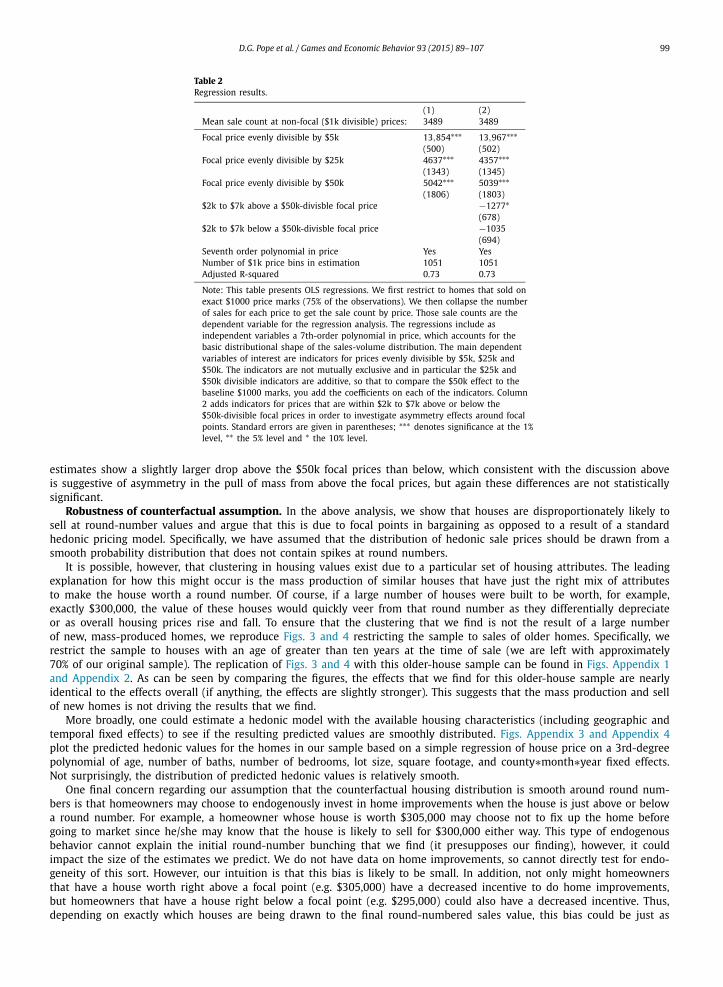
Column 1 of Table 2 provides the regression estimates for this specification. The average sales volume in the data across all “non-focal” $1000 price points is 3489 negotiated sales. Prices divisible by $5k, which likely represent a combination of the focal power of round numbers and some degree of convenience rounding have sales volumes 13,854 higher (or roughly 5 times the sales volume of 1000 price points). We estimate a marginal increase of roughly 5000 more sales for prices cleanly divisible by $25k and another 5000 more sales for those also divisible cleanly by $50k. All of these differences have p-values < .01. Summarizing the effects, we find that the $25k-divisible focal prices have sales volumes 24% higher than other price points divisible by $5k and the $50k-divisible focal prices have volumes 44% higher.
Column 2 of Table 2 shows results when we add to the basic specification in Equation (1) indicators for prices that are within $2000 to $7000 above or below a $50k-divisible focal price (e.g., $402,000–$407,000). Adding these estimates allows us to investigate the degree of asymmetry in the pull of mass around the $50k focal prices that we observed in the graphical analysis above. We start the bins $2000 above and below in order to avoid the effect of prices ending in $9000 levels right below thresholds (an issue we discuss in detail below). The estimates in Column 2 show that there is roughly a 1000 sale drop for prices just above and below the $50k-divisible marks relative to other $1000 price points that are not right around these larger round focal prices, however these differences are not statistically significant at conventional levels. The point
98 D.G. Pope et al. / Games and Economic Behavior 93 (2015) 89–107
Fig. 5. Sales Price Histogram, $375K–$525K. This figure provides a histogram for houses whose final sales prices were between $375,000 and $525,000. The histogram groups final sales prices into $1000 bins (rounded down).
Fig. 6. Sales Price Histogram, $875K–$1.025M. This figure provides a histogram for houses whose final sales prices were between $875,000 and $1,025,000. The histogram groups final sales prices into $1000 bins (rounded down).
D.G. Pope et al. / Games and Economic Behavior 93 (2015) 89–107 99
Table 2Regression results.
(1) (2)Mean sale count at non-focal ($1k divisible) prices: 3489 3489
Focal price evenly divisible by $5k 13,854∗∗∗(500)
13,967∗∗∗(502)
Focal price evenly divisible by $25k 4637∗∗∗(1343)
4357∗∗∗(1345)
Focal price evenly divisible by $50k 5042∗∗∗(1806)
5039∗∗∗(1803)
$2k to $7k above a $50k-divisble focal price −1277∗(678)
$2k to $7k below a $50k-divisble focal price −1035(694)
Seventh order polynomial in price Yes YesNumber of $1k price bins in estimation 1051 1051Adjusted R-squared 0.73 0.73
Note: This table presents OLS regressions. We first restrict to homes that sold on exact $1000 price marks (75% of the observations). We then collapse the number of sales for each price to get the sale count by price. Those sale counts are the dependent variable for the regression analysis. The regressions include as independent variables a 7th-order polynomial in price, which accounts for the basic distributional shape of the sales-volume distribution. The main dependent variables of interest are indicators for prices evenly divisible by $5k, $25k and $50k. The indicators are not mutually exclusive and in particular the $25k and $50k divisible indicators are additive, so that to compare the $50k effect to the baseline $1000 marks, you add the coefficients on each of the indicators. Column 2 adds indicators for prices that are within $2k to $7k above or below the $50k-divisible focal prices in order to investigate asymmetry effects around focal points. Standard errors are given in parentheses; ∗∗∗ denotes significance at the 1% level, ∗∗ the 5% level and ∗ the 10% level.
estimates show a slightly larger drop above the $50k focal prices than below, which consistent with the discussion above is suggestive of asymmetry in the pull of mass from above the focal prices, but again these differences are not statistically significant.
Robustness of counterfactual assumption. In the above analysis, we show that houses are disproportionately likely to sell at round-number values and argue that this is due to focal points in bargaining as opposed to a result of a standard hedonic pricing model. Specifically, we have assumed that the distribution of hedonic sale prices should be drawn from a smooth probability distribution that does not contain spikes at round numbers.
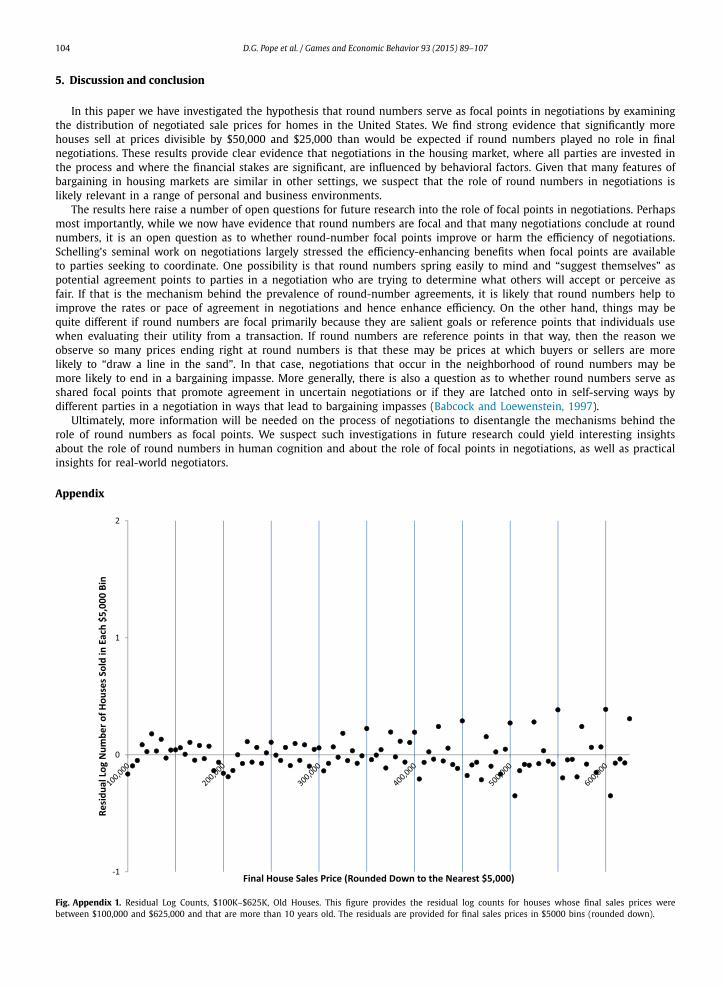
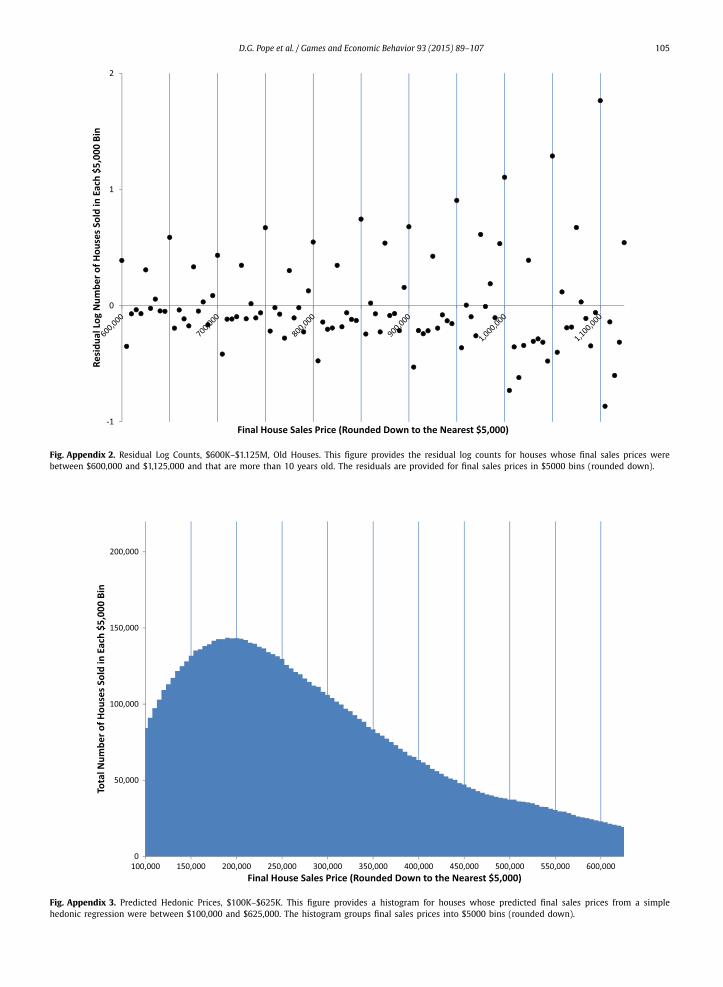
It is possible, however, that clustering in housing values exist due to a particular set of housing attributes. The leading explanation for how this might occur is the mass production of similar houses that have just the right mix of attributes to make the house worth a round number. Of course, if a large number of houses were built to be worth, for example, exactly $300,000, the value of these houses would quickly veer from that round number as they differentially depreciate or as overall housing prices rise and fall. To ensure that the clustering that we find is not the result of a large number of new, mass-produced homes, we reproduce Figs. 3 and 4 restricting the sample to sales of older homes. Specifically, we restrict the sample to houses with an age of greater than ten years at the time of sale (we are left with approximately 70% of our original sample). The replication of Figs. 3 and 4 with this older-house sample can be found in Figs. Appendix 1and Appendix 2. As can be seen by comparing the figures, the effects that we find for this older-house sample are nearly identical to the effects overall (if anything, the effects are slightly stronger). This suggests that the mass production and sell of new homes is not driving the results that we find.
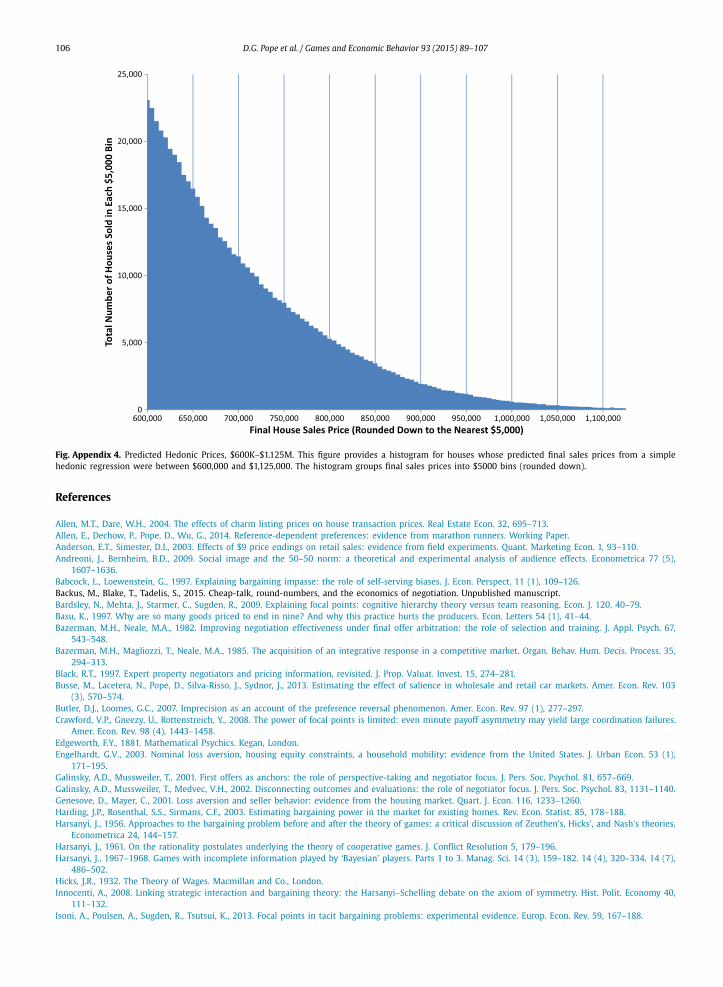
More broadly, one could estimate a hedonic model with the available housing characteristics (including geographic and temporal fixed effects) to see if the resulting predicted values are smoothly distributed. Figs. Appendix 3 and Appendix 4plot the predicted hedonic values for the homes in our sample based on a simple regression of house price on a 3rd-degree polynomial of age, number of baths, number of bedrooms, lot size, square footage, and county∗month∗year fixed effects. Not surprisingly, the distribution of predicted hedonic values is relatively smooth.
One final concern regarding our assumption that the counterfactual housing distribution is smooth around round num-bers is that homeowners may choose to endogenously invest in home improvements when the house is just above or below a round number. For example, a homeowner whose house is worth $305,000 may choose not to fix up the home before going to market since he/she may know that the house is likely to sell for $300,000 either way. This type of endogenous behavior cannot explain the initial round-number bunching that we find (it presupposes our finding), however, it could impact the size of the estimates we predict. We do not have data on home improvements, so cannot directly test for endo-geneity of this sort. However, our intuition is that this bias is likely to be small. In addition, not only might homeowners that have a house worth right above a focal point (e.g. $305,000) have a decreased incentive to do home improvements, but homeowners that have a house right below a focal point (e.g. $295,000) could also have a decreased incentive. Thus, depending on exactly which houses are being drawn to the final round-numbered sales value, this bias could be just as
100 D.G. Pope et al. / Games and Economic Behavior 93 (2015) 89–107
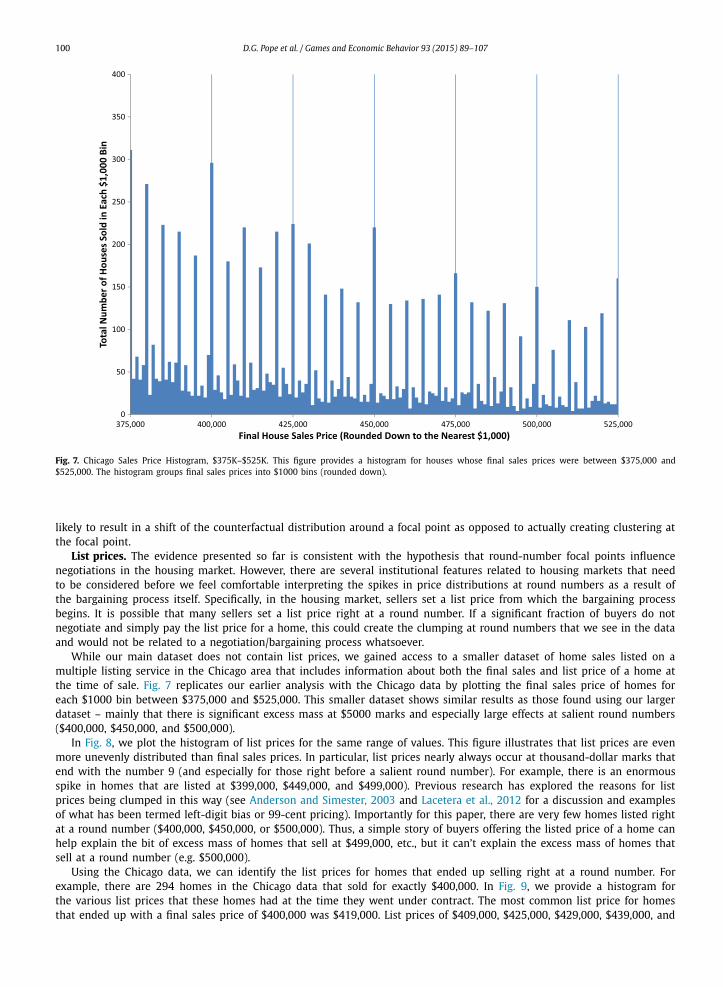
Fig. 7. Chicago Sales Price Histogram, $375K–$525K. This figure provides a histogram for houses whose final sales prices were between $375,000 and $525,000. The histogram groups final sales prices into $1000 bins (rounded down).
likely to result in a shift of the counterfactual distribution around a focal point as opposed to actually creating clustering at the focal point.
List prices. The evidence presented so far is consistent with the hypothesis that round-number focal points influence negotiations in the housing market. However, there are several institutional features related to housing markets that need to be considered before we feel comfortable interpreting the spikes in price distributions at round numbers as a result of the bargaining process itself. Specifically, in the housing market, sellers set a list price from which the bargaining process begins. It is possible that many sellers set a list price right at a round number. If a significant fraction of buyers do not negotiate and simply pay the list price for a home, this could create the clumping at round numbers that we see in the data and would not be related to a negotiation/bargaining process whatsoever.
While our main dataset does not contain list prices, we gained access to a smaller dataset of home sales listed on a multiple listing service in the Chicago area that includes information about both the final sales and list price of a home at the time of sale. Fig. 7 replicates our earlier analysis with the Chicago data by plotting the final sales price of homes for each $1000 bin between $375,000 and $525,000. This smaller dataset shows similar results as those found using our larger dataset – mainly that there is significant excess mass at $5000 marks and especially large effects at salient round numbers ($400,000, $450,000, and $500,000).
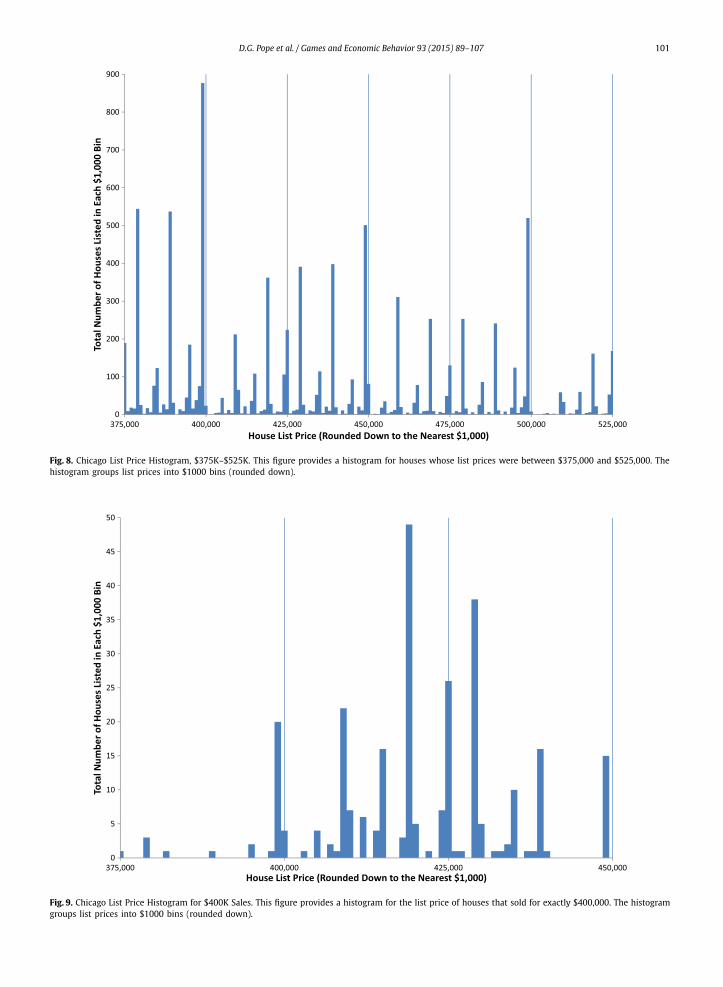
In Fig. 8, we plot the histogram of list prices for the same range of values. This figure illustrates that list prices are even more unevenly distributed than final sales prices. In particular, list prices nearly always occur at thousand-dollar marks that end with the number 9 (and especially for those right before a salient round number). For example, there is an enormous spike in homes that are listed at $399,000, $449,000, and $499,000). Previous research has explored the reasons for list prices being clumped in this way (see Anderson and Simester, 2003 and Lacetera et al., 2012 for a discussion and examples of what has been termed left-digit bias or 99-cent pricing). Importantly for this paper, there are very few homes listed right at a round number ($400,000, $450,000, or $500,000). Thus, a simple story of buyers offering the listed price of a home can help explain the bit of excess mass of homes that sell at $499,000, etc., but it can’t explain the excess mass of homes that sell at a round number (e.g. $500,000).
Using the Chicago data, we can identify the list prices for homes that ended up selling right at a round number. For example, there are 294 homes in the Chicago data that sold for exactly $400,000. In Fig. 9, we provide a histogram for the various list prices that these homes had at the time they went under contract. The most common list price for homes that ended up with a final sales price of $400,000 was $419,000. List prices of $409,000, $425,000, $429,000, $439,000, and
D.G. Pope et al. / Games and Economic Behavior 93 (2015) 89–107 101
Fig. 8. Chicago List Price Histogram, $375K–$525K. This figure provides a histogram for houses whose list prices were between $375,000 and $525,000. The histogram groups list prices into $1000 bins (rounded down).
Fig. 9. Chicago List Price Histogram for $400K Sales. This figure provides a histogram for the list price of houses that sold for exactly $400,000. The histogram groups list prices into $1000 bins (rounded down).
102 D.G. Pope et al. / Games and Economic Behavior 93 (2015) 89–107
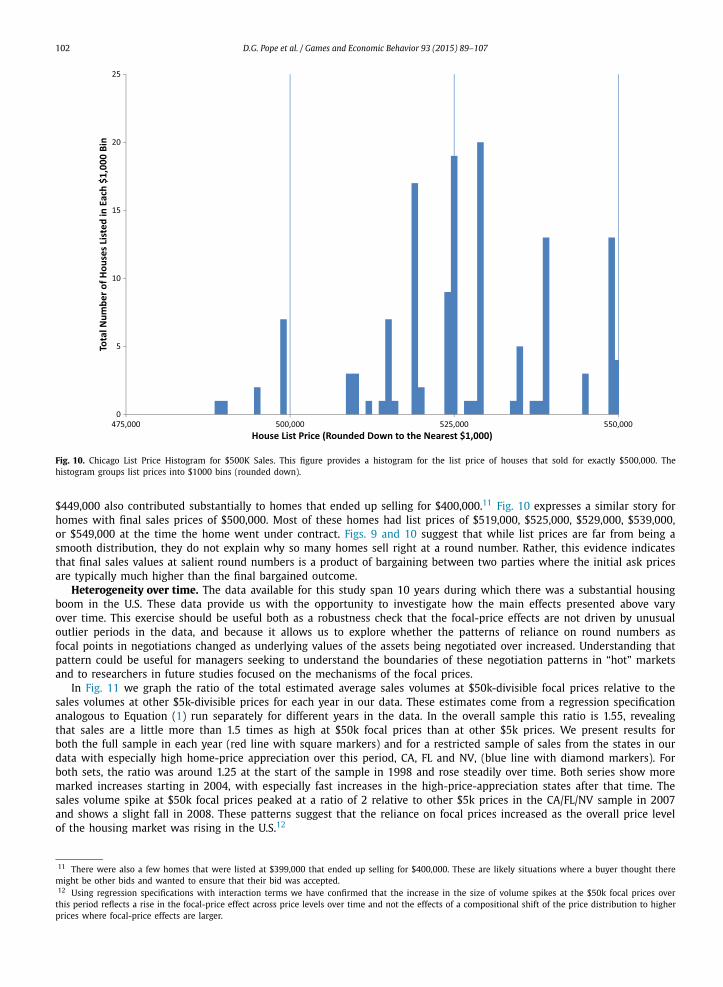
Fig. 10. Chicago List Price Histogram for $500K Sales. This figure provides a histogram for the list price of houses that sold for exactly $500,000. The histogram groups list prices into $1000 bins (rounded down).
$449,000 also contributed substantially to homes that ended up selling for $400,000.11 Fig. 10 expresses a similar story for homes with final sales prices of $500,000. Most of these homes had list prices of $519,000, $525,000, $529,000, $539,000, or $549,000 at the time the home went under contract. Figs. 9 and 10 suggest that while list prices are far from being a smooth distribution, they do not explain why so many homes sell right at a round number. Rather, this evidence indicates that final sales values at salient round numbers is a product of bargaining between two parties where the initial ask prices are typically much higher than the final bargained outcome.
Heterogeneity over time. The data available for this study span 10 years during which there was a substantial housing boom in the U.S. These data provide us with the opportunity to investigate how the main effects presented above vary over time. This exercise should be useful both as a robustness check that the focal-price effects are not driven by unusual outlier periods in the data, and because it allows us to explore whether the patterns of reliance on round numbers as focal points in negotiations changed as underlying values of the assets being negotiated over increased. Understanding that pattern could be useful for managers seeking to understand the boundaries of these negotiation patterns in “hot” markets and to researchers in future studies focused on the mechanisms of the focal prices.
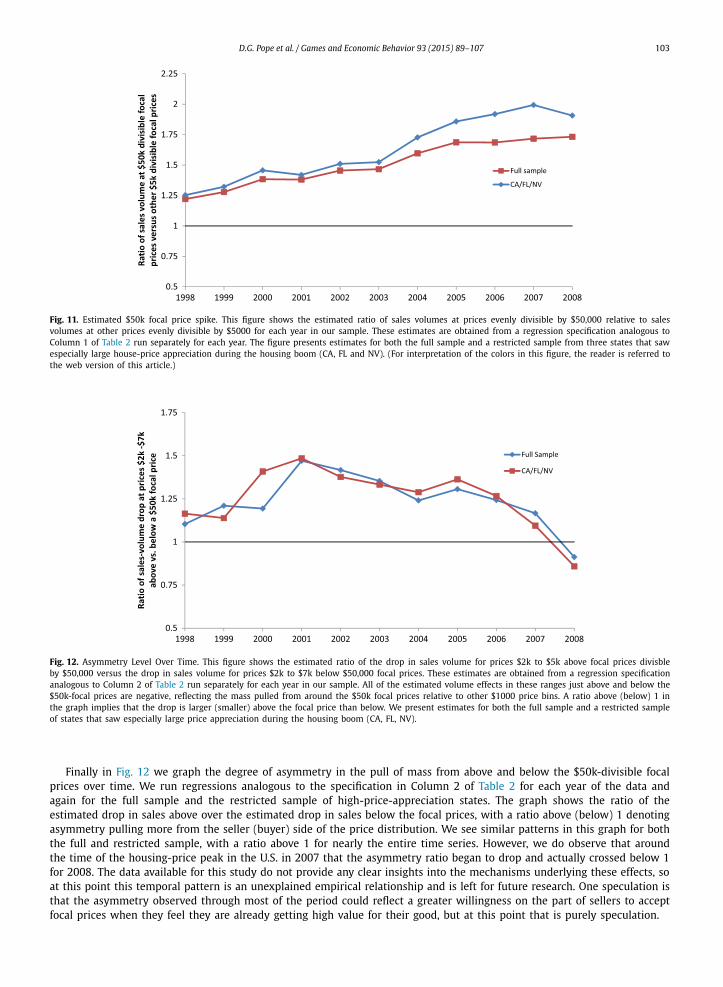
In Fig. 11 we graph the ratio of the total estimated average sales volumes at $50k-divisible focal prices relative to the sales volumes at other $5k-divisible prices for each year in our data. These estimates come from a regression specification analogous to Equation (1) run separately for different years in the data. In the overall sample this ratio is 1.55, revealing that sales are a little more than 1.5 times as high at $50k focal prices than at other $5k prices. We present results for both the full sample in each year (red line with square markers) and for a restricted sample of sales from the states in our data with especially high home-price appreciation over this period, CA, FL and NV, (blue line with diamond markers). For both sets, the ratio was around 1.25 at the start of the sample in 1998 and rose steadily over time. Both series show more marked increases starting in 2004, with especially fast increases in the high-price-appreciation states after that time. The sales volume spike at $50k focal prices peaked at a ratio of 2 relative to other $5k prices in the CA/FL/NV sample in 2007 and shows a slight fall in 2008. These patterns suggest that the reliance on focal prices increased as the overall price level of the housing market was rising in the U.S.12
11 There were also a few homes that were listed at $399,000 that ended up selling for $400,000. These are likely situations where a buyer thought there might be other bids and wanted to ensure that their bid was accepted.12 Using regression specifications with interaction terms we have confirmed that the increase in the size of volume spikes at the $50k focal prices over
this period reflects a rise in the focal-price effect across price levels over time and not the effects of a compositional shift of the price distribution to higher prices where focal-price effects are larger.
D.G. Pope et al. / Games and Economic Behavior 93 (2015) 89–107 103
Fig. 11. Estimated $50k focal price spike. This figure shows the estimated ratio of sales volumes at prices evenly divisible by $50,000 relative to sales volumes at other prices evenly divisible by $5000 for each year in our sample. These estimates are obtained from a regression specification analogous to Column 1 of Table 2 run separately for each year. The figure presents estimates for both the full sample and a restricted sample from three states that saw especially large house-price appreciation during the housing boom (CA, FL and NV). (For interpretation of the colors in this figure, the reader is referred to the web version of this article.)
Fig. 12. Asymmetry Level Over Time. This figure shows the estimated ratio of the drop in sales volume for prices $2k to $5k above focal prices divisble by $50,000 versus the drop in sales volume for prices $2k to $7k below $50,000 focal prices. These estimates are obtained from a regression specification analogous to Column 2 of Table 2 run separately for each year in our sample. All of the estimated volume effects in these ranges just above and below the $50k-focal prices are negative, reflecting the mass pulled from around the $50k focal prices relative to other $1000 price bins. A ratio above (below) 1 in the graph implies that the drop is larger (smaller) above the focal price than below. We present estimates for both the full sample and a restricted sample of states that saw especially large price appreciation during the housing boom (CA, FL, NV).
Finally in Fig. 12 we graph the degree of asymmetry in the pull of mass from above and below the $50k-divisible focal prices over time. We run regressions analogous to the specification in Column 2 of Table 2 for each year of the data and again for the full sample and the restricted sample of high-price-appreciation states. The graph shows the ratio of the estimated drop in sales above over the estimated drop in sales below the focal prices, with a ratio above (below) 1 denoting asymmetry pulling more from the seller (buyer) side of the price distribution. We see similar patterns in this graph for both the full and restricted sample, with a ratio above 1 for nearly the entire time series. However, we do observe that around the time of the housing-price peak in the U.S. in 2007 that the asymmetry ratio began to drop and actually crossed below 1 for 2008. The data available for this study do not provide any clear insights into the mechanisms underlying these effects, so at this point this temporal pattern is an unexplained empirical relationship and is left for future research. One speculation is that the asymmetry observed through most of the period could reflect a greater willingness on the part of sellers to accept focal prices when they feel they are already getting high value for their good, but at this point that is purely speculation.
104 D.G. Pope et al. / Games and Economic Behavior 93 (2015) 89–107
5. Discussion and conclusion
In this paper we have investigated the hypothesis that round numbers serve as focal points in negotiations by examining the distribution of negotiated sale prices for homes in the United States. We find strong evidence that significantly more houses sell at prices divisible by $50,000 and $25,000 than would be expected if round numbers played no role in final negotiations. These results provide clear evidence that negotiations in the housing market, where all parties are invested in the process and where the financial stakes are significant, are influenced by behavioral factors. Given that many features of bargaining in housing markets are similar in other settings, we suspect that the role of round numbers in negotiations is likely relevant in a range of personal and business environments.
The results here raise a number of open questions for future research into the role of focal points in negotiations. Perhaps most importantly, while we now have evidence that round numbers are focal and that many negotiations conclude at round numbers, it is an open question as to whether round-number focal points improve or harm the efficiency of negotiations. Schelling’s seminal work on negotiations largely stressed the efficiency-enhancing benefits when focal points are available to parties seeking to coordinate. One possibility is that round numbers spring easily to mind and “suggest themselves” as potential agreement points to parties in a negotiation who are trying to determine what others will accept or perceive as fair. If that is the mechanism behind the prevalence of round-number agreements, it is likely that round numbers help to improve the rates or pace of agreement in negotiations and hence enhance efficiency. On the other hand, things may be quite different if round numbers are focal primarily because they are salient goals or reference points that individuals use when evaluating their utility from a transaction. If round numbers are reference points in that way, then the reason we observe so many prices ending right at round numbers is that these may be prices at which buyers or sellers are more likely to “draw a line in the sand”. In that case, negotiations that occur in the neighborhood of round numbers may be more likely to end in a bargaining impasse. More generally, there is also a question as to whether round numbers serve as shared focal points that promote agreement in uncertain negotiations or if they are latched onto in self-serving ways by different parties in a negotiation in ways that lead to bargaining impasses (Babcock and Loewenstein, 1997).
Ultimately, more information will be needed on the process of negotiations to disentangle the mechanisms behind the role of round numbers as focal points. We suspect such investigations in future research could yield interesting insights about the role of round numbers in human cognition and about the role of focal points in negotiations, as well as practical insights for real-world negotiators.
Appendix
Fig. Appendix 1. Residual Log Counts, $100K–$625K, Old Houses. This figure provides the residual log counts for houses whose final sales prices were between $100,000 and $625,000 and that are more than 10 years old. The residuals are provided for final sales prices in $5000 bins (rounded down).
D.G. Pope et al. / Games and Economic Behavior 93 (2015) 89–107 105
Fig. Appendix 2. Residual Log Counts, $600K–$1.125M, Old Houses. This figure provides the residual log counts for houses whose final sales prices were between $600,000 and $1,125,000 and that are more than 10 years old. The residuals are provided for final sales prices in $5000 bins (rounded down).
Fig. Appendix 3. Predicted Hedonic Prices, $100K–$625K. This figure provides a histogram for houses whose predicted final sales prices from a simple hedonic regression were between $100,000 and $625,000. The histogram groups final sales prices into $5000 bins (rounded down).
106 D.G. Pope et al. / Games and Economic Behavior 93 (2015) 89–107
Fig. Appendix 4. Predicted Hedonic Prices, $600K–$1.125M. This figure provides a histogram for houses whose predicted final sales prices from a simple hedonic regression were between $600,000 and $1,125,000. The histogram groups final sales prices into $5000 bins (rounded down).
References
Allen, M.T., Dare, W.H., 2004. The effects of charm listing prices on house transaction prices. Real Estate Econ. 32, 695–713.Allen, E., Dechow, P., Pope, D., Wu, G., 2014. Reference-dependent preferences: evidence from marathon runners. Working Paper.Anderson, E.T., Simester, D.I., 2003. Effects of $9 price endings on retail sales: evidence from field experiments. Quant. Marketing Econ. 1, 93–110.Andreoni, J., Bernheim, B.D., 2009. Social image and the 50–50 norm: a theoretical and experimental analysis of audience effects. Econometrica 77 (5),
1607–1636.Babcock, L., Loewenstein, G., 1997. Explaining bargaining impasse: the role of self-serving biases. J. Econ. Perspect. 11 (1), 109–126.Backus, M., Blake, T., Tadelis, S., 2015. Cheap-talk, round-numbers, and the economics of negotiation. Unpublished manuscript.Bardsley, N., Mehta, J., Starmer, C., Sugden, R., 2009. Explaining focal points: cognitive hierarchy theory versus team reasoning. Econ. J. 120, 40–79.Basu, K., 1997. Why are so many goods priced to end in nine? And why this practice hurts the producers. Econ. Letters 54 (1), 41–44.Bazerman, M.H., Neale, M.A., 1982. Improving negotiation effectiveness under final offer arbitration: the role of selection and training. J. Appl. Psych. 67,
543–548.Bazerman, M.H., Magliozzi, T., Neale, M.A., 1985. The acquisition of an integrative response in a competitive market. Organ. Behav. Hum. Decis. Process. 35,
294–313.Black, R.T., 1997. Expert property negotiators and pricing information, revisited. J. Prop. Valuat. Invest. 15, 274–281.Busse, M., Lacetera, N., Pope, D., Silva-Risso, J., Sydnor, J., 2013. Estimating the effect of salience in wholesale and retail car markets. Amer. Econ. Rev. 103
(3), 570–574.Butler, D.J., Loomes, G.C., 2007. Imprecision as an account of the preference reversal phenomenon. Amer. Econ. Rev. 97 (1), 277–297.Crawford, V.P., Gneezy, U., Rottenstreich, Y., 2008. The power of focal points is limited: even minute payoff asymmetry may yield large coordination failures.
Amer. Econ. Rev. 98 (4), 1443–1458.Edgeworth, F.Y., 1881. Mathematical Psychics. Kegan, London.Engelhardt, G.V., 2003. Nominal loss aversion, housing equity constraints, a household mobility: evidence from the United States. J. Urban Econ. 53 (1),
171–195.Galinsky, A.D., Mussweiler, T., 2001. First offers as anchors: the role of perspective-taking and negotiator focus. J. Pers. Soc. Psychol. 81, 657–669.Galinsky, A.D., Mussweiler, T., Medvec, V.H., 2002. Disconnecting outcomes and evaluations: the role of negotiator focus. J. Pers. Soc. Psychol. 83, 1131–1140.Genesove, D., Mayer, C., 2001. Loss aversion and seller behavior: evidence from the housing market. Quart. J. Econ. 116, 1233–1260.Harding, J.P., Rosenthal, S.S., Sirmans, C.F., 2003. Estimating bargaining power in the market for existing homes. Rev. Econ. Statist. 85, 178–188.Harsanyi, J., 1956. Approaches to the bargaining problem before and after the theory of games: a critical discussion of Zeuthen’s, Hicks’, and Nash’s theories.
Econometrica 24, 144–157.Harsanyi, J., 1961. On the rationality postulates underlying the theory of cooperative games. J. Conflict Resolution 5, 179–196.Harsanyi, J., 1967–1968. Games with incomplete information played by ‘Bayesian’ players. Parts 1 to 3. Manag. Sci. 14 (3), 159–182. 14 (4), 320–334. 14 (7),
486–502.Hicks, J.R., 1932. The Theory of Wages. Macmillan and Co., London.Innocenti, A., 2008. Linking strategic interaction and bargaining theory: the Harsanyi–Schelling debate on the axiom of symmetry. Hist. Polit. Economy 40,
111–132.Isoni, A., Poulsen, A., Sugden, R., Tsutsui, K., 2013. Focal points in tacit bargaining problems: experimental evidence. Europ. Econ. Rev. 59, 167–188.
D.G. Pope et al. / Games and Economic Behavior 93 (2015) 89–107 107
Isoni, A., Poulsen, A., Sugden, R., Tsutsui, K., 2014. Efficiency, equality and labeling: an experimental investigation of focal points in explicit bargaining. Amer. Econ. Rev. 104, 3256–3287.
Janiszewski, C., Uy, D., 2008. Precision of the anchor influences the amount of adjustment. Psychol. Sci. 19, 121–127.Janssen, M.C.W., 2001. Rationalizing focal points. Theory Dec. 50 (2), 119–148.Janssen, M.C.W., 2006. On the strategic use of focal points in bargaining situations. J. Econ. Psych. 27, 622–634.Kreps, D., 1990. Game Theory and Economic Modeling. Oxford University Press, New York.Kuminoff, N., Pope, J., 2014. Do ‘capitalization effects’ for public goods reveal the public’s willingness to pay? Int. Econ. Rev. 55 (4), 1227–1250.Lacetera, N., Pope, D., Sydnor, J.R., 2012. Heuristic thinking and limited attention in the car market. Amer. Econ. Rev. 102 (5), 2206–2236.Lambson, V.E., McQueen, G.R., Slade, B.A., 2004. Do out-of-state buyers pay more for real estate? An examination of anchoring-induced bias and search
costs. Real Estate Econ. 32, 85–126.Mason, M.F., Lee, A.J., Wiley, E.A., Ames, D.R., 2013. Precise offers are potent anchors: conciliatory counteroffers and attributions of knowledge in negotations.
J. Exp. Soc. Psychol. 49, 759–763.Mehta, J., Starmer, C., Sugden, R., 1994. Focal points in pure coordination games: an experimental investigation. Theory Dec. 36 (2), 163–185.Nash, J.F., 1950. The bargaining problem. Econometrica 18, 155–162.Nash, J.F., 1953. Two-person cooperative games. Econometrica 21, 128–140.Neale, M.A., Bazerman, M.H., 1985. The effect of externally set goals on reaching integrative agreements in competitive markets. J. Occup. Behav. 6 (1),
19–32.Neelin, J., Sonnenschein, H., Spiegel, M., 1988. A further test of noncooperative bargaining theory. Amer. Econ. Rev. 78, 824–836.Northcraft, G.B., Neale, M.A., 1987. Experts, amateurs, and real estate: an anchoring-and-adjustment perspective on property pricing decisions. Organ. Behav.
Hum. Decis. Process. 39, 84–97.Ochs, J., Roth, A.E., 1989. An experimental study of sequential bargaining. Amer. Econ. Rev. 79, 355–384.Palmquist, R.B., 2005. Property value models. In: Mäler, K., Vincent, J. (Eds.), Handbook of Environmental Economics. North-Holland, Amsterdam.Payne, J.W., Bettman, J.R., Johnson, E.J., 1992. Behavioral decision research: a constructive processing perspective. Annu. Rev. Psychol. 43 (1), 87–131.Pigou, A.C., 1932. The Economics of Welfare. Macmillan and Co., London.Plott, C.R., Zeiler, K., 2005. The willingness to pay-willingness to accept gap, the ‘Endowment effect’, subject misconceptions, and experimental procedures
for eliciting valuations. Amer. Econ. Rev. 95 (3), 530–545.Pope, D., Simonsohn, U., 2011. Round numbers as goals: evidence from baseball, SAT takers, and the lab. Psychol. Sci. 22 (1), 71–79.Prasnikar, V., Roth, A.E., 1992. Considerations of fairness and strategy: experimental data from sequential games. Quart. J. Econ. 107 (3), 865–888.Rosch, E., 1975. Cognitive reference points. Cogn. Psychol. 7, 532–547.Rosen, S., 1974. Hedonic prices and implicit markets: product differentiation in pure competition. J. Polit. Economy 82 (1), 34–55.Roth, A.E., 1985. Common and conflicting interests in two-sided matching markets. Europ. Econ. Rev. 27 (1), 75–96.Roth, A.E., 1995. Bargaining experiments. In: Kagel, J., Roth, A.E. (Eds.), Handbook of Experimental Economics. Princeton University Press, pp. 253–348.Roth, A.E., Malouf, M., 1979. Game theoretic models and the role of information in bargaining. Psychol. Rev. 86, 574–594.Roth, A.E., Malouf, M., Murnighan, J.K., 1981. Sociological versus strategic factors in bargaining. J. Econ. Behav. Organ. 2 (2), 153–177.Roth, A.E., Murnighan, J.K., 1982. The role of information in bargaining: an experimental study. Econometrica 50, 1123–1142.Rubinstein, A., 1982. Perfect equilibrium in a bargaining model. Econometrica 50, 97–110.Schelling, T.C., 1959. For the abandonment of symmetry in game theory. Rev. Econ. Statist. 41, 213–214.Schelling, T.C., 1960. The Theory of Conflict. Harvard University Press, Cambridge, Mass.Sebenius, J.K., 1992. Negotiation analysis: a characterization and review. Manag. Sci. 38, 18–38.Simonsohn, U., 2006. New-Yorkers commute more everywhere: contrast effects in the field. Rev. Econ. Statist. 88 (1), 1–9.Simonsohn, U., Loewenstein, G., 2006. Mistake #37: the impact of previously faced prices on housing demand. Econ. J. 116 (1), 175–199.Sugden, R., 1995. A theory of focal points. Econ. J. 105 (430), 533–550.Thomas, M., Simon, D.H., Kadiyali, V., 2010. The price precision effect: evidence from laboratory and market data. Marketing Sci. 29 (1), 175–190.Tsay, C., Bazerman, M., 2009. A decision-making perspective to negotiation: a review of the past and a look into the future. Negot. J. 25 (4), 467–480.Tversky, A., Kahneman, D., 1973. Judgment under uncertainty: heuristics and biases. Science 185, 1124–1131.White, S.B., Neale, M.A., 1994. The role of negotiator aspirations and settlement expectancies in bargaining outcomes. Organ. Behav. Hum. Decis. Process. 57
(2), 303–318.Yavas, A., Yang, S., 1995. The strategic role of listing price in marketing real estate: theory and evidence. Real Estate Econ. 23 (3), 347–368.Zeuthen, F., 1930. Problems of Monopoly and Economic Warfare. Routledge and Kegan Paul, London.

![What Motivates Effort? Evidence and Expert Forecastsfaculty.chicagobooth.edu/devin.pope/research/pdf/website_motivate... · [20:12 16/3/2018 rdx033.tex] RESTUD: The Review of Economic](https://img.pdfslide.us/doc/110x75/5c75ef4309d3f2d3778baf61/what-motivates-effort-evidence-and-expert-2012-1632018-rdx033tex-restud.jpg)