Embed Size (px)
Citation preview
Gambling Impact and BehaviorStudy, 1997-1999: [United States]
ICPSR 2778
National Gambling Impact StudyCommission
Adult Survey Codebook
Inter-university Consortium forPolitical and Social ResearchP.O. Box 1248Ann Arbor, Michigan 48106www.icpsr.umich.edu

**ICPSR Processor Notes** Gambling Impact and Behavior Study, 1997-99
1) The codebook contains several references to a SAS data file (COMBOPUF.SD2) and another data file (COMBINED.PUF) that were originally created by the data producers. The ICPSR version of the data collection does not contain a dataset by this name. To provide the data to users in a format that is neither system- nor platform-specific, the ICPSR version of the data file is in ASCII text format with SAS and SPSS data definition statements. The ASCII data file, in accordance with ICPSR standard naming convention, is called da2778.p1. The p1 file extension identifies this data file as part one (i.e. the Adult Survey) of the Gambling Impact and Behavior Study. 2) Telephone interviews were conducted for all but 14 respondents who chose to participate via mail-in questionnaire. However, these mail respondents cannot be identified in the data. 3) The 80 patron survey cases that were nonplayers (i.e., 530–450) are not intended for use with this combined file, because these cases are probably not representative of nonplayers in the U.S.
4) The codebook contains references to a “table of contents listing all variables in their order of appearance…” Since this table of contents was created by the data producers from the original data file, it no longer coincides with the ICPSR version of the data and has therefore been removed
5) Question B113_ (CHARITABLE TYPE OF GAME) was dropped from the data set, in order to resolve certain problems with the responses.

UPDATED ICPSR PROCESSOR NOTE
The second edition of this data collection corrects errors in column locations for several variables, which were previously mis-specified. The recodes performed in this second edition changed the logical record length of the data files. The new column location specifications are documented in this revised codebook. Note, the column specifications in the codebook frequencies reflect the 1st ICPSR edition.
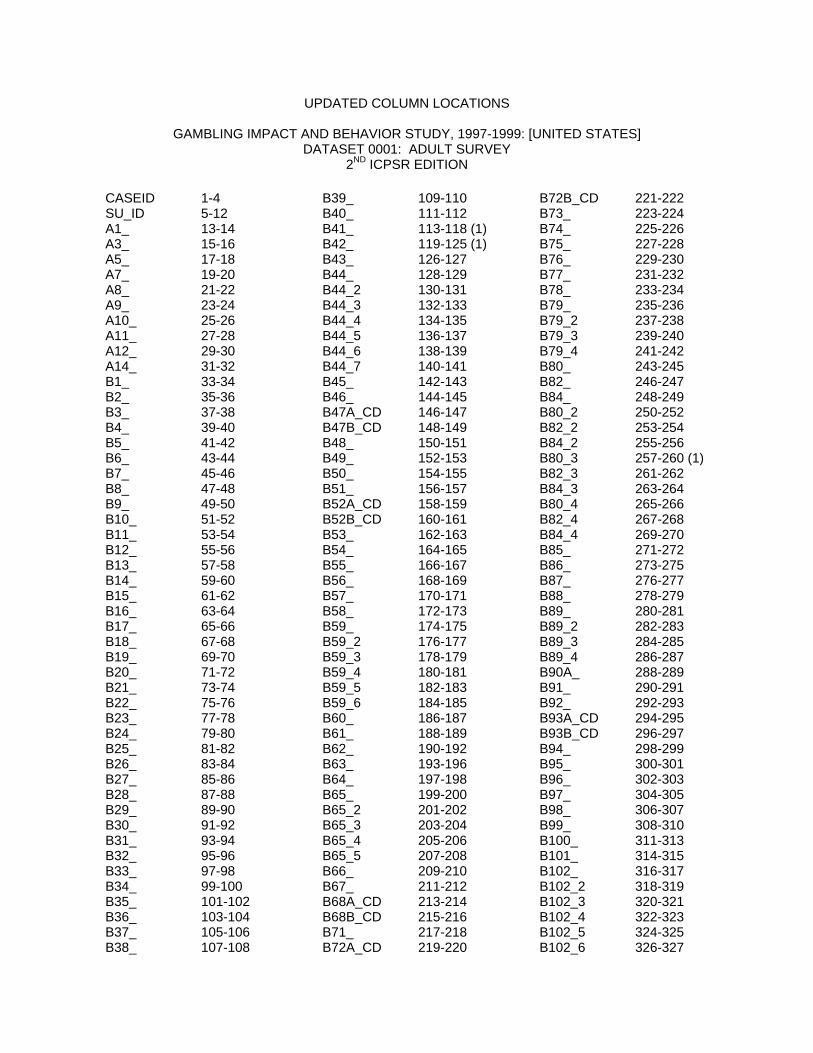
UPDATED COLUMN LOCATIONS
GAMBLING IMPACT AND BEHAVIOR STUDY, 1997-1999: [UNITED STATES] DATASET 0001: ADULT SURVEY
2ND ICPSR EDITION
CASEID 1-4 SU_ID 5-12 A1_ 13-14 A3_ 15-16 A5_ 17-18 A7_ 19-20 A8_ 21-22 A9_ 23-24 A10_ 25-26 A11_ 27-28 A12_ 29-30 A14_ 31-32 B1_ 33-34 B2_ 35-36 B3_ 37-38 B4_ 39-40 B5_ 41-42 B6_ 43-44 B7_ 45-46 B8_ 47-48 B9_ 49-50 B10_ 51-52 B11_ 53-54 B12_ 55-56 B13_ 57-58 B14_ 59-60 B15_ 61-62 B16_ 63-64 B17_ 65-66 B18_ 67-68 B19_ 69-70 B20_ 71-72 B21_ 73-74 B22_ 75-76 B23_ 77-78 B24_ 79-80 B25_ 81-82 B26_ 83-84 B27_ 85-86 B28_ 87-88 B29_ 89-90 B30_ 91-92 B31_ 93-94 B32_ 95-96 B33_ 97-98 B34_ 99-100 B35_ 101-102 B36_ 103-104 B37_ 105-106 B38_ 107-108
B39_ 109-110 B40_ 111-112 B41_ 113-118 (1) B42_ 119-125 (1) B43_ 126-127 B44_ 128-129 B44_2 130-131 B44_3 132-133 B44_4 134-135 B44_5 136-137 B44_6 138-139 B44_7 140-141 B45_ 142-143 B46_ 144-145 B47A_CD 146-147 B47B_CD 148-149 B48_ 150-151 B49_ 152-153 B50_ 154-155 B51_ 156-157 B52A_CD 158-159 B52B_CD 160-161 B53_ 162-163 B54_ 164-165 B55_ 166-167 B56_ 168-169 B57_ 170-171 B58_ 172-173 B59_ 174-175 B59_2 176-177 B59_3 178-179 B59_4 180-181 B59_5 182-183 B59_6 184-185 B60_ 186-187 B61_ 188-189 B62_ 190-192 B63_ 193-196 B64_ 197-198 B65_ 199-200 B65_2 201-202 B65_3 203-204 B65_4 205-206 B65_5 207-208 B66_ 209-210 B67_ 211-212 B68A_CD 213-214 B68B_CD 215-216 B71_ 217-218 B72A_CD 219-220
B72B_CD 221-222 B73_ 223-224 B74_ 225-226 B75_ 227-228 B76_ 229-230 B77_ 231-232 B78_ 233-234 B79_ 235-236 B79_2 237-238 B79_3 239-240 B79_4 241-242 B80_ 243-245 B82_ 246-247 B84_ 248-249 B80_2 250-252 B82_2 253-254 B84_2 255-256 B80_3 257-260 (1) B82_3 261-262 B84_3 263-264 B80_4 265-266 B82_4 267-268 B84_4 269-270 B85_ 271-272 B86_ 273-275 B87_ 276-277 B88_ 278-279 B89_ 280-281 B89_2 282-283 B89_3 284-285 B89_4 286-287 B90A_ 288-289 B91_ 290-291 B92_ 292-293 B93A_CD 294-295 B93B_CD 296-297 B94_ 298-299 B95_ 300-301 B96_ 302-303 B97_ 304-305 B98_ 306-307 B99_ 308-310 B100_ 311-313 B101_ 314-315 B102_ 316-317 B102_2 318-319 B102_3 320-321 B102_4 322-323 B102_5 324-325 B102_6 326-327
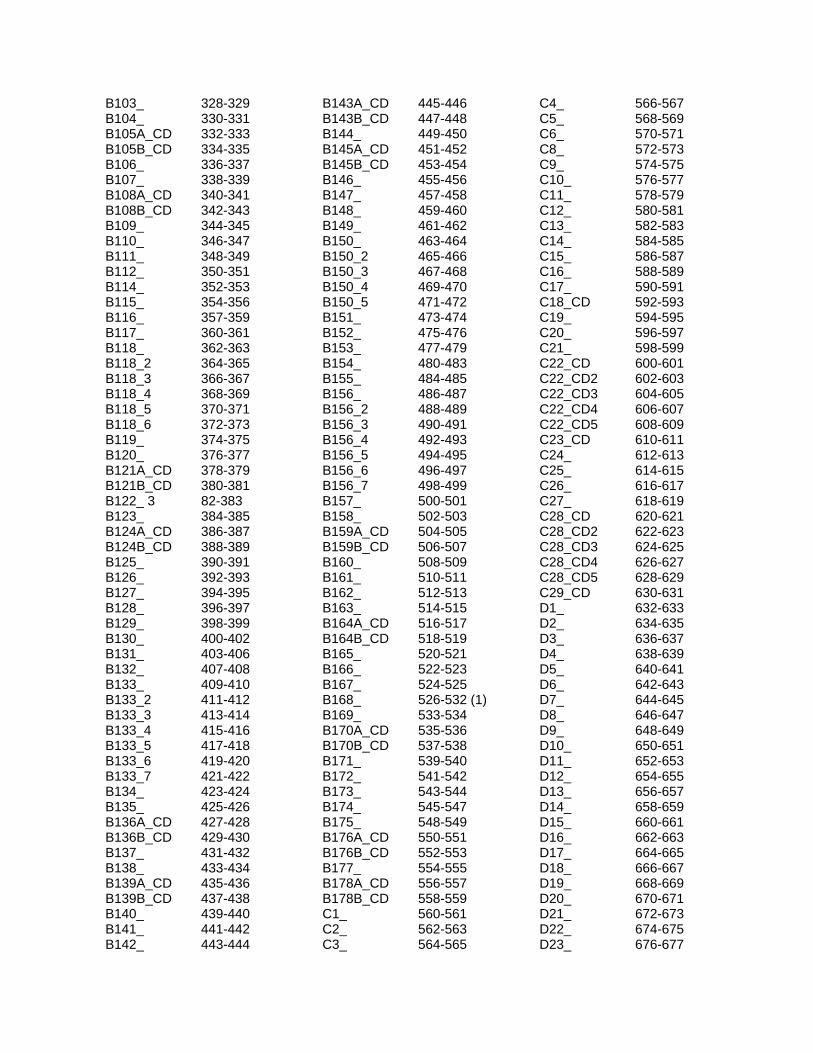
B103_ 328-329 B104_ 330-331 B105A_CD 332-333 B105B_CD 334-335 B106_ 336-337 B107_ 338-339 B108A_CD 340-341 B108B_CD 342-343 B109_ 344-345 B110_ 346-347 B111_ 348-349 B112_ 350-351 B114_ 352-353 B115_ 354-356 B116_ 357-359 B117_ 360-361 B118_ 362-363 B118_2 364-365 B118_3 366-367 B118_4 368-369 B118_5 370-371 B118_6 372-373 B119_ 374-375 B120_ 376-377 B121A_CD 378-379 B121B_CD 380-381 B122_ 3 82-383 B123_ 384-385 B124A_CD 386-387 B124B_CD 388-389 B125_ 390-391 B126_ 392-393 B127_ 394-395 B128_ 396-397 B129_ 398-399 B130_ 400-402 B131_ 403-406 B132_ 407-408 B133_ 409-410 B133_2 411-412 B133_3 413-414 B133_4 415-416 B133_5 417-418 B133_6 419-420 B133_7 421-422 B134_ 423-424 B135_ 425-426 B136A_CD 427-428 B136B_CD 429-430 B137_ 431-432 B138_ 433-434 B139A_CD 435-436 B139B_CD 437-438 B140_ 439-440 B141_ 441-442 B142_ 443-444
B143A_CD 445-446 B143B_CD 447-448 B144_ 449-450 B145A_CD 451-452 B145B_CD 453-454 B146_ 455-456 B147_ 457-458 B148_ 459-460 B149_ 461-462 B150_ 463-464 B150_2 465-466 B150_3 467-468 B150_4 469-470 B150_5 471-472 B151_ 473-474 B152_ 475-476 B153_ 477-479 B154_ 480-483 B155_ 484-485 B156_ 486-487 B156_2 488-489 B156_3 490-491 B156_4 492-493 B156_5 494-495 B156_6 496-497 B156_7 498-499 B157_ 500-501 B158_ 502-503 B159A_CD 504-505 B159B_CD 506-507 B160_ 508-509 B161_ 510-511 B162_ 512-513 B163_ 514-515 B164A_CD 516-517 B164B_CD 518-519 B165_ 520-521 B166_ 522-523 B167_ 524-525 B168_ 526-532 (1) B169_ 533-534 B170A_CD 535-536 B170B_CD 537-538 B171_ 539-540 B172_ 541-542 B173_ 543-544 B174_ 545-547 B175_ 548-549 B176A_CD 550-551 B176B_CD 552-553 B177_ 554-555 B178A_CD 556-557 B178B_CD 558-559 C1_ 560-561 C2_ 562-563 C3_ 564-565
C4_ 566-567 C5_ 568-569 C6_ 570-571 C8_ 572-573 C9_ 574-575 C10_ 576-577 C11_ 578-579 C12_ 580-581 C13_ 582-583 C14_ 584-585 C15_ 586-587 C16_ 588-589 C17_ 590-591 C18_CD 592-593 C19_ 594-595 C20_ 596-597 C21_ 598-599 C22_CD 600-601 C22_CD2 602-603 C22_CD3 604-605 C22_CD4 606-607 C22_CD5 608-609 C23_CD 610-611 C24_ 612-613 C25_ 614-615 C26_ 616-617 C27_ 618-619 C28_CD 620-621 C28_CD2 622-623 C28_CD3 624-625 C28_CD4 626-627 C28_CD5 628-629 C29_CD 630-631 D1_ 632-633 D2_ 634-635 D3_ 636-637 D4_ 638-639 D5_ 640-641 D6_ 642-643 D7_ 644-645 D8_ 646-647 D9_ 648-649 D10_ 650-651 D11_ 652-653 D12_ 654-655 D13_ 656-657 D14_ 658-659 D15_ 660-661 D16_ 662-663 D17_ 664-665 D18_ 666-667 D19_ 668-669 D20_ 670-671 D21_ 672-673 D22_ 674-675 D23_ 676-677
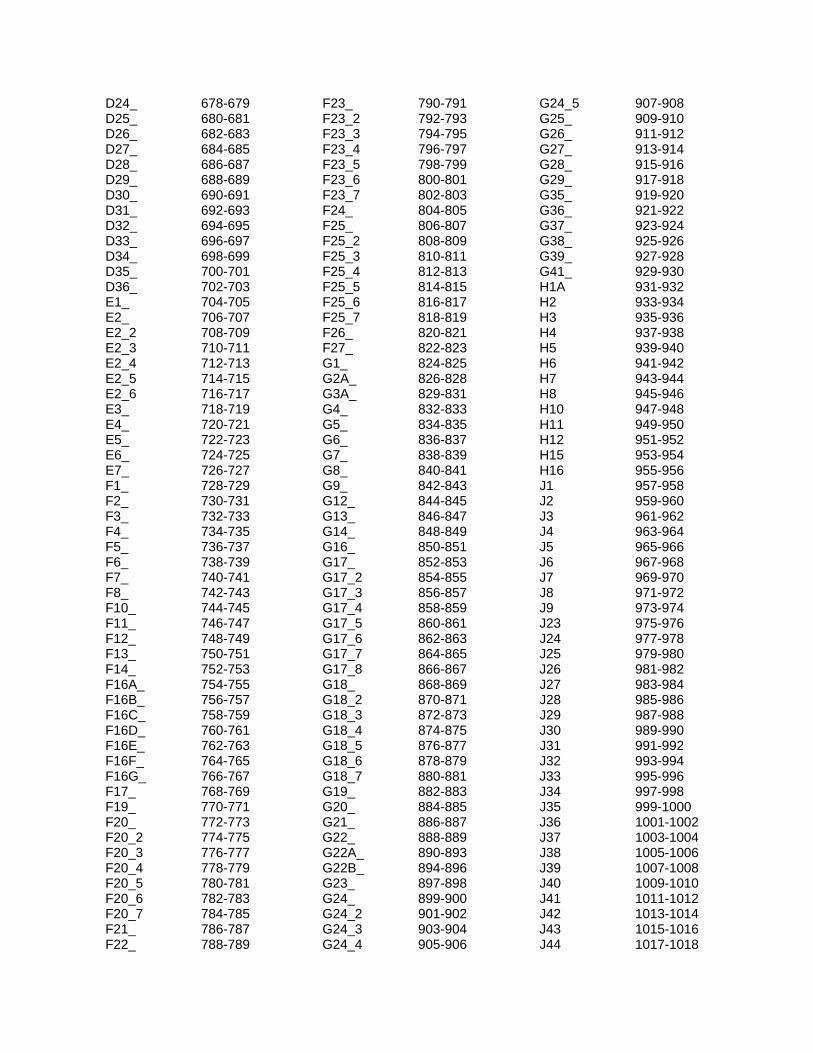
D24_ 678-679 D25_ 680-681 D26_ 682-683 D27_ 684-685 D28_ 686-687 D29_ 688-689 D30_ 690-691 D31_ 692-693 D32_ 694-695 D33_ 696-697 D34_ 698-699 D35_ 700-701 D36_ 702-703 E1_ 704-705 E2_ 706-707 E2_2 708-709 E2_3 710-711 E2_4 712-713 E2_5 714-715 E2_6 716-717 E3_ 718-719 E4_ 720-721 E5_ 722-723 E6_ 724-725 E7_ 726-727 F1_ 728-729 F2_ 730-731 F3_ 732-733 F4_ 734-735 F5_ 736-737 F6_ 738-739 F7_ 740-741 F8_ 742-743 F10_ 744-745 F11_ 746-747 F12_ 748-749 F13_ 750-751 F14_ 752-753 F16A_ 754-755 F16B_ 756-757 F16C_ 758-759 F16D_ 760-761 F16E_ 762-763 F16F_ 764-765 F16G_ 766-767 F17_ 768-769 F19_ 770-771 F20_ 772-773 F20_2 774-775 F20_3 776-777 F20_4 778-779 F20_5 780-781 F20_6 782-783 F20_7 784-785 F21_ 786-787 F22_ 788-789
F23_ 790-791 F23_2 792-793 F23_3 794-795 F23_4 796-797 F23_5 798-799 F23_6 800-801 F23_7 802-803 F24_ 804-805 F25_ 806-807 F25_2 808-809 F25_3 810-811 F25_4 812-813 F25_5 814-815 F25_6 816-817 F25_7 818-819 F26_ 820-821 F27_ 822-823 G1_ 824-825 G2A_ 826-828 G3A_ 829-831 G4_ 832-833 G5_ 834-835 G6_ 836-837 G7_ 838-839 G8_ 840-841 G9_ 842-843 G12_ 844-845 G13_ 846-847 G14_ 848-849 G16_ 850-851 G17_ 852-853 G17_2 854-855 G17_3 856-857 G17_4 858-859 G17_5 860-861 G17_6 862-863 G17_7 864-865 G17_8 866-867 G18_ 868-869 G18_2 870-871 G18_3 872-873 G18_4 874-875 G18_5 876-877 G18_6 878-879 G18_7 880-881 G19_ 882-883 G20_ 884-885 G21_ 886-887 G22_ 888-889 G22A_ 890-893 G22B_ 894-896 G23_ 897-898 G24_ 899-900 G24_2 901-902 G24_3 903-904 G24_4 905-906
G24_5 907-908 G25_ 909-910 G26_ 911-912 G27_ 913-914 G28_ 915-916 G29_ 917-918 G35_ 919-920 G36_ 921-922 G37_ 923-924 G38_ 925-926 G39_ 927-928 G41_ 929-930 H1A 931-932 H2 933-934 H3 935-936 H4 937-938 H5 939-940 H6 941-942 H7 943-944 H8 945-946 H10 947-948 H11 949-950 H12 951-952 H15 953-954 H16 955-956 J1 957-958 J2 959-960 J3 961-962 J4 963-964 J5 965-966 J6 967-968 J7 969-970 J8 971-972 J9 973-974 J23 975-976 J24 977-978 J25 979-980 J26 981-982 J27 983-984 J28 985-986 J29 987-988 J30 989-990 J31 991-992 J32 993-994 J33 995-996 J34 997-998 J35 999-1000 J36 1001-1002 J37 1003-1004 J38 1005-1006 J39 1007-1008 J40 1009-1010 J41 1011-1012 J42 1013-1014 J43 1015-1016 J44 1017-1018
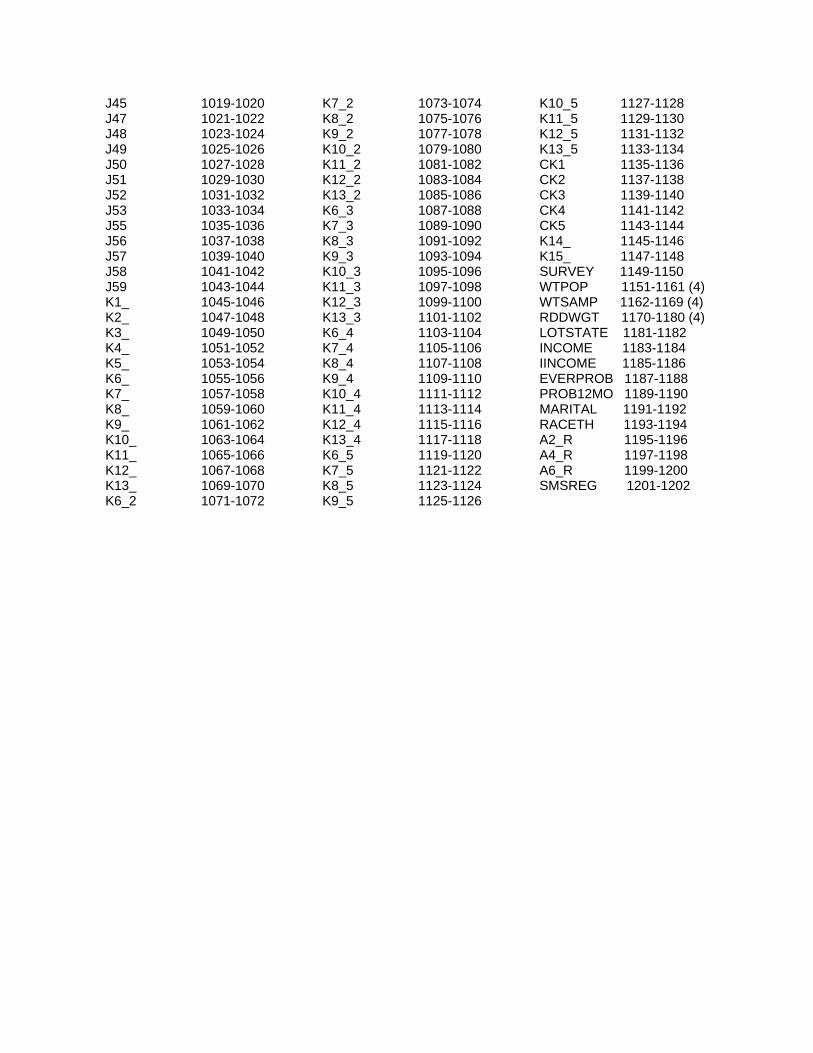
J45 1019-1020 J47 1021-1022 J48 1023-1024 J49 1025-1026 J50 1027-1028 J51 1029-1030 J52 1031-1032 J53 1033-1034 J55 1035-1036 J56 1037-1038 J57 1039-1040 J58 1041-1042 J59 1043-1044 K1_ 1045-1046 K2_ 1047-1048 K3_ 1049-1050 K4_ 1051-1052 K5_ 1053-1054 K6_ 1055-1056 K7_ 1057-1058 K8_ 1059-1060 K9_ 1061-1062 K10_ 1063-1064 K11_ 1065-1066 K12_ 1067-1068 K13_ 1069-1070 K6_2 1071-1072
K7_2 1073-1074 K8_2 1075-1076 K9_2 1077-1078 K10_2 1079-1080 K11_2 1081-1082 K12_2 1083-1084 K13_2 1085-1086 K6_3 1087-1088 K7_3 1089-1090 K8_3 1091-1092 K9_3 1093-1094 K10_3 1095-1096 K11_3 1097-1098 K12_3 1099-1100 K13_3 1101-1102 K6_4 1103-1104 K7_4 1105-1106 K8_4 1107-1108 K9_4 1109-1110 K10_4 1111-1112 K11_4 1113-1114 K12_4 1115-1116 K13_4 1117-1118 K6_5 1119-1120 K7_5 1121-1122 K8_5 1123-1124 K9_5 1125-1126
K10_5 1127-1128 K11_5 1129-1130 K12_5 1131-1132 K13_5 1133-1134 CK1 1135-1136 CK2 1137-1138 CK3 1139-1140 CK4 1141-1142 CK5 1143-1144 K14_ 1145-1146 K15_ 1147-1148 SURVEY 1149-1150 WTPOP 1151-1161 (4) WTSAMP 1162-1169 (4) RDDWGT 1170-1180 (4) LOTSTATE 1181-1182 INCOME 1183-1184 IINCOME 1185-1186 EVERPROB 1187-1188 PROB12MO 1189-1190 MARITAL 1191-1192 RACETH 1193-1194 A2_R 1195-1196 A4_R 1197-1198 A6_R 1199-1200 SMSREG 1201-1202

CODEBOOK
FOR THE GAMBLING IMPACT AND BEHAVIOR STUDY
ADULT SURVEYS
Editors:
Dean Gerstein Marianna Toce
National Opinion Research Center at the University of Chicago 1155 East 60th Street
Chicago, Illinois 60637 http://www.norc.uchicago.edu
This research was performed under contract to the National Gambling Impact Study Commission
Washington, D.C.
June 1999

Gambling Impact and Behavior Study Page i Fast Track Codebook for the Public Use File
TABLE OF CONTENTS
LIST OF TABLES .........................................................................................................................iii
1. INTRODUCTION......................................................................................................................1
2. RDD ADULT SURVEY: SAMPLING AND WEIGHTING ............................................3
SAMPLING OF TELEPHONE HOUSEHOLDS......................................................................................3 Plan .........................................................................................................................................5 Sampling execution..................................................................................................................6
SAMPLING ONE ADULT RESPONDENT PER HOUSEHOLD ...............................................................7 Sampling plan..........................................................................................................................7 Sampling execution................................................................................................................10
WEIGHT COMPUTATION FOR RDD DATA ...................................................................................10 Population data .....................................................................................................................10 Sample ...................................................................................................................................13 Missing values: Imputation ..................................................................................................14 Collapsing sparse cells..........................................................................................................15 Weighting steps .....................................................................................................................16 Final household weights WT_4 .............................................................................................17 Person weights WT_5............................................................................................................17 Poststratified person weights WT_7......................................................................................17
SAMPLING FOR THE PILOT STUDY...............................................................................................18 REFERENCES ...............................................................................................................................19
3. SAMPLING REPORT FOR THE SURVEY OF ADULT PATRONS OF GAMBLING FACILITIES..........................................................................................................21
FACILITY SAMPLE.......................................................................................................................21 INTERVIEWING............................................................................................................................22
4. COMBINING THE RDD AND PATRON SURVEY DATA ...............................................25
DATA FILE COMBINING RDD AND PATRON SURVEY RECORDS..................................................25 KEY ASSUMPTION IN COMBINING SURVEYS ...............................................................................25 CONSTRUCTION OF WEIGHTS: POSTSTRATIFICATION ADJUSTMENT CELLS ...............................25
Heterogeneity of cells ............................................................................................................26 Cell sample sizes ...................................................................................................................26
PROPERTIES OF THE WEIGHTS.....................................................................................................27
5. DEVELOPMENT OF THE QUESTIONNAIRES ...............................................................29
INITIAL STAGES OF DEVELOPMENT.............................................................................................29 ORGANIZATION OF THE INSTRUMENT .........................................................................................31
Section A: Demographic Information...................................................................................33 Section B: Gambling Behavior.............................................................................................33 Section C: Gambling-Related Attitudes, Motivations, and History......................................36 Section D: Problem Gambling Diagnostic Assessment........................................................37 Section E: Gambling Treatment Experience ........................................................................39 Section F: Family/Marital Status and Issues........................................................................39 Section G: Income and Financial Information.....................................................................39 Section H: Criminal Activity and Status...............................................................................39
Page ii Gambling Impact and Behavior Study Fast Track Codebook for the Public Use File
Section J: Mental and General Health............................................................................... 40 Section K: Substance Use................................................................................................... 40
GAMBLING FACILITY PATRON QUESTIONNAIRE AND SELF-ADMINISTERED QUESTIONNAIRE .. 41 REFERENCES............................................................................................................................. 42
6. CONSOLIDATED QUESTIONNAIRE .............................................................................. 45
7. VARIABLES AND FREQUENCIES................................................................................. 113
8. SAS CODE FOR CONSTRUCTED VARIABLES .......................................................... 411
Gambling Impact and Behavior Study Page iii Codebook for the Public Use File
LIST OF TABLES
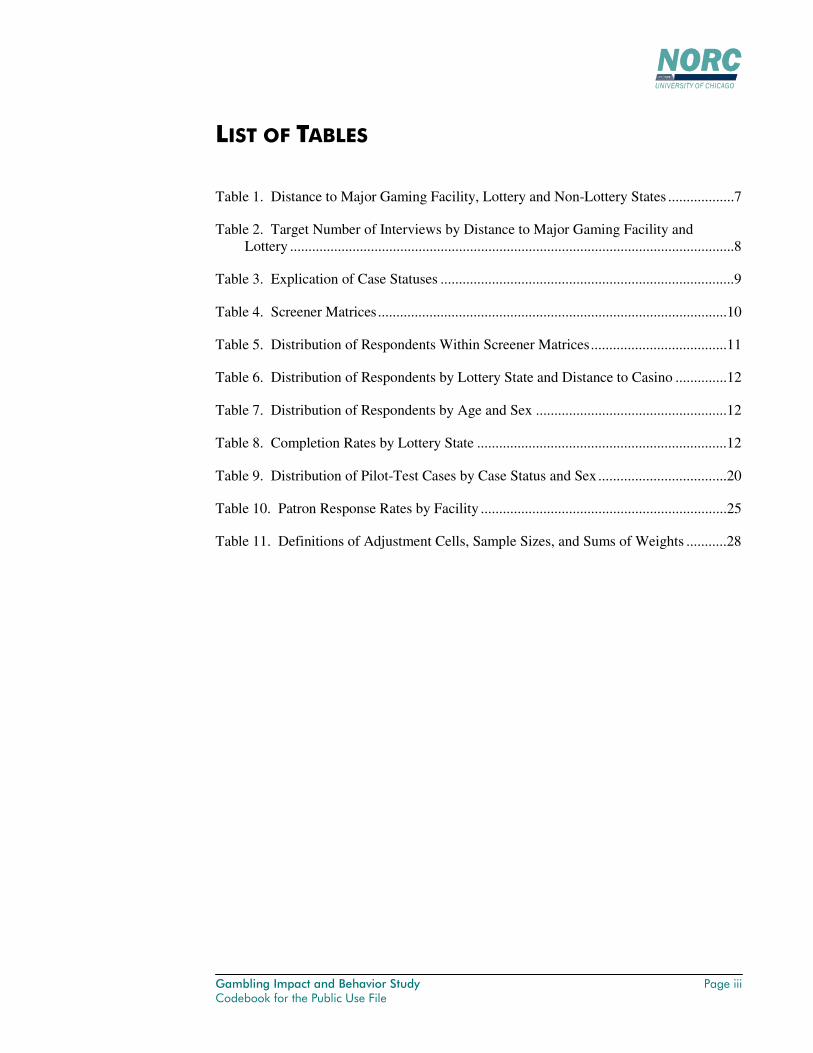
Table 1. Distance to Major Gaming Facility, Lottery and Non-Lottery States ..................7
Table 2. Target Number of Interviews by Distance to Major Gaming Facility and Lottery .........................................................................................................................8
Table 3. Explication of Case Statuses ................................................................................9
Table 4. Screener Matrices...............................................................................................10
Table 5. Distribution of Respondents Within Screener Matrices.....................................11
Table 6. Distribution of Respondents by Lottery State and Distance to Casino ..............12
Table 7. Distribution of Respondents by Age and Sex ....................................................12
Table 8. Completion Rates by Lottery State ....................................................................12
Table 9. Distribution of Pilot-Test Cases by Case Status and Sex...................................20
Table 10. Patron Response Rates by Facility ...................................................................25
Table 11. Definitions of Adjustment Cells, Sample Sizes, and Sums of Weights ...........28

Page iv Gambling Impact and Behavior Study Codebook for the Public Use File
Gambling Impact and Behavior Study Page 1 Codebook for the Public Use File
1. INTRODUCTION Dean Gerstein
This volume comprises codebook information for the Public Use File of the Gambling Impact and Behavior Study’s Adult Surveys. The adult survey combined data file incorporates all 2,967 cases from the adult random-digit-dial sample of households (telephone interviews plus a small number of self-administered questionnaires) and the in–person sample survey of patrons of gaming facilities. This codebook is comprised of the sampling and weighting reports for the two surveys separately and as a combined sample; a detailed discussion of the questionnaire design and development process, a consolidatd questionnaire redacted to specify the contents of the adult public use file, unweighted frequencies for all items in the public use file, and the SAS editing and imputation codes used to define new public use variables from the original questionnaire items.
For further documentation of this survey, including pretests, validity and reliability results, copies of the original questionnaires, and the results of analyses of the adult survey by the NORC contract group, please consult the study archive at the NORC website, http://www.norc.uchicago.edu. The NORC study archive also makes available descriptions and analyses of all other data collected in the Gambling Impact and Behavior Study as well as selected public use data files from other survey components: the 100-Community Data Base, the ten Community Case Studies, the Casino Survey, and the Youth Survey of 16-17 year olds. These materials will also be deposited with the National Archives and Records Administration, Washington D.C., along with other records of the work of the National Gambling Impact Study Commission (1997-1999, http://www.ngisc.gov), for which the Gambling Impact and Behavior Study was performed.

Page 2 Gambling Impact and Behavior Study Codebook for the Public Use File
Gambling Impact and Behavior Study Page 3 Codebook for the Public Use File
2. RDD ADULT SURVEY: SAMPLING AND WEIGHTING Laszlo Engelmann & Kirk Wolter
The universe for the national study of gambling behavior consisted of the civilian, household population of the United States, aged 18 and older (i.e., adults). The study did not include group quarters, institutional, or military populations. The Census Bureau’s usual place of residence concept governed sampling decisions throughout the project.
Sampling of Telephone Households
As of this writing, there are about 100,000,000 households in the United States, and about 95 percent of them have at least one telephone line, thereby leaving about 5 percent that have no telephone. The telephone subuniverse consists of all persons in the study universe who live in a household with at least one telephone line, while the nontelephone subuniverse consists of all who live in a household with no telephone. Because telephone interviewing is time-efficient and relatively cost-effective, we chose to sample the telephone universe only, using a national, random-digit dial (RDD) design with approximately 2,400 completed interviews.
A principal concern with RDD sampling is that so many telephone numbers are not working residential numbers (WRNs). Many are business numbers, nonworking numbers, or something else. In fact, if we were to select a simple random sample from a conceptual list of all telephone numbers in working area codes, only about 25 to 27 percent of the numbers would turn out to be WRNs. To increase the “hit” rate of WRNs, statisticians typically employ either the Waksberg-Mitofsky method or some form of list-assisted sampling.
NORC’s standard for RDD surveysand, indeed, the approach we employed for the gambling studyis the list-assisted approach. Our list-assisted designs are more statistically efficient than, and are as operationally efficient as, the Waksberg-Mitofsky design. The list-assisted method yields at least as high a proportion of WRNs as the Waksberg-Mitofsky method, depending on the number of listings required per bank. Unlike the Waksberg-Mitofsky method, the list-assisted approach also produces an unclustered sample. As a result, statistics from this design tend to achieve a smaller design effect and to be more precise than statistics from a Waksberg-Mitofsky sample.
For our list-assisted approach, we divide all telephone numbers in working exchanges into clusters of 100, called 100-banks or simply banks (e.g., 312-759-4100 to 312-759-4199). We typically eliminate from the sampling universe all banks with zero listed telephone numbers, called zero-banks, and sample only from banks with one or more listed numbers, called one+-banks. Such sampling is called one+ sampling. Formally, one+ sampling provides complete coverage of all listed and unlisted numbers in banks with at least one listed number and omits unlisted numbers in banks with no listed numbers.
Page 4 Gambling Impact and Behavior Study Codebook for the Public Use File
One+ sampling covers almost 98 percent of the universe of telephone households, implying that unlisted numbers in zero-banks account for the remaining 2 percent. About 50 percent of telephone numbers selected randomly from one+-banks will turn out to be WRNs.
Moreover, for many surveys, noncoverage bias1 associated with this method tends to be small. The uncovered WRNs do not appear to differ systematically from the rest of the telephone population. We believe this to be the case for the national gambling study. It is difficult to see how there might be differential gambling behavior in WRNs in zero-banks versus in one+-banks.
NORC purchased the sample of telephone numbers from Survey Sampling, Inc. (SSI), a well-known supplier of telephone samples with whom NORC has a long-standing relationship. To select the sample, SSI relied on information from the Bellcore file of active area codes and exchanges, and on information from the Donnelley Quality Index, which gives the number of residential listings within each bank. Under NORC’s careful direction, SSI implemented the above-described one+ sampling design.
To meet the objectives of the national study of gambling behavior, NORC directed SSI to stratify the RDD sample by lottery status (states with lottery, states without lottery). The lottery stratum included telephone numbers in Arizona, California, Colorado, Connecticut, Delaware, the District of Columbia, Florida, Georgia, Idaho, Illinois, Indiana, Iowa, Kansas, Kentucky, Louisiana, Maine, Maryland, Massachusetts, Michigan, Minnesota, Missouri, Montana, Nebraska, New Hampshire, New Jersey, New Mexico, New York, Ohio, Oregon, Pennsylvania, Rhode Island, South Dakota, Texas, Vermont, Virginia, Washington, West Virginia, and Wisconsin, while the no-lottery stratum included Alabama, Alaska, Arkansas, Hawaii, Mississippi, Nevada, North Carolina, North Dakota, Oklahoma, South Carolina, Tennessee, Utah, and Wyoming.
NORC had the selected sample screened by SSI for unassigned and nonworking numbers. In the same process, SSI screened for fax and modem numbers. The screening identified approximately one-half of the nonworking and nonvoice numbers in the sample.
In addition, NORC directed SSI to match the sample to their database of business telephone numbers and to flag all matches. Typically an RDD sample is 12- to 15-percent business numbers. Approximately one-half of these (6 to 8 percent of sample numbers) were identified through the matching process.
NORC’s standard practiceand the one followed hereis to order 20-percent more telephone numbers than we think we will need. The extra 20 percent is inexpensive to acquire, but highly cost-effective. It provides us with considerable flexibility when dealing with unforeseen circumstances.
Furthermore, NORC’s standard practice is to divide the overall sample into a large number of random replicates, each of a relatively small size. Normally, we release only 100 percent of what we think we need to our telephone centers for interviewing
1We refer to lack of coverage of zero-banks, not to noncoverage of nontelephone households (see Brick et al.,
1995).
Gambling Impact and Behavior Study Page 5 Codebook for the Public Use File
operations. The balance—the 20-percent safety margin—we hold in reserve until needed, and then we release only enough further replicates to achieve our objectives. We never plan to release more sample than needed, which would unnecessarily increase costs.
We used all of these practices as we carefully controlled the instant samples.
For the national survey of gambling behavior, we actually ordered and obtained from SSI an RDD sample of 11,500. Of the total sample, 10,000 numbers were selected in the lottery stratum and 1,500 were selected in the no-lottery stratum. Sampling was independent in the two strata. We calculated that we would only need 9,200 numbers to support the needs of the study; therefore, we released this number to our telephone center for data-collection operations. The residual 2,300 cases comprised the 20-percent safety margin. As the data collection progressed, we determined that we would achieve our sampling objectives without the safety margin; thus, we never released these cases.
Plan
Our estimates for the number of telephone numbers to order was based on many factors:
• Rates obtained from the CPS for the number of households with adult females, and adult males;
• Population of lottery / no-lottery states;
• Expected number of pathological and problem gamblers amongst males and females;
• Distance to major gambling facilities;
• Expected number of completed interviews.
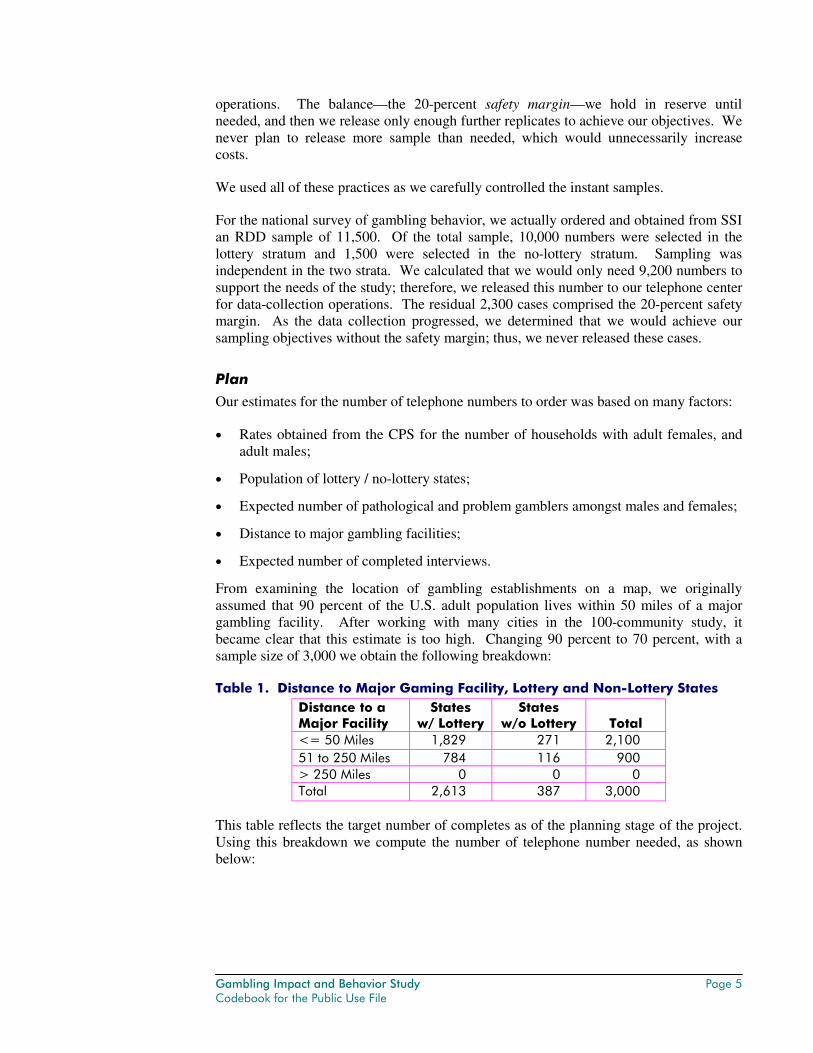
From examining the location of gambling establishments on a map, we originally assumed that 90 percent of the U.S. adult population lives within 50 miles of a major gambling facility. After working with many cities in the 100-community study, it became clear that this estimate is too high. Changing 90 percent to 70 percent, with a sample size of 3,000 we obtain the following breakdown:
Table 1. Distance to Major Gaming Facility, Lottery and Non-Lottery States Distance to a Major Facility
States w/ Lottery
States w/o Lottery Total
<= 50 Miles 1,829 271 2,100 51 to 250 Miles 784 116 900 > 250 Miles 0 0 0 Total 2,613 387 3,000
This table reflects the target number of completes as of the planning stage of the project. Using this breakdown we compute the number of telephone number needed, as shown below:
Page 6 Gambling Impact and Behavior Study Codebook for the Public Use File
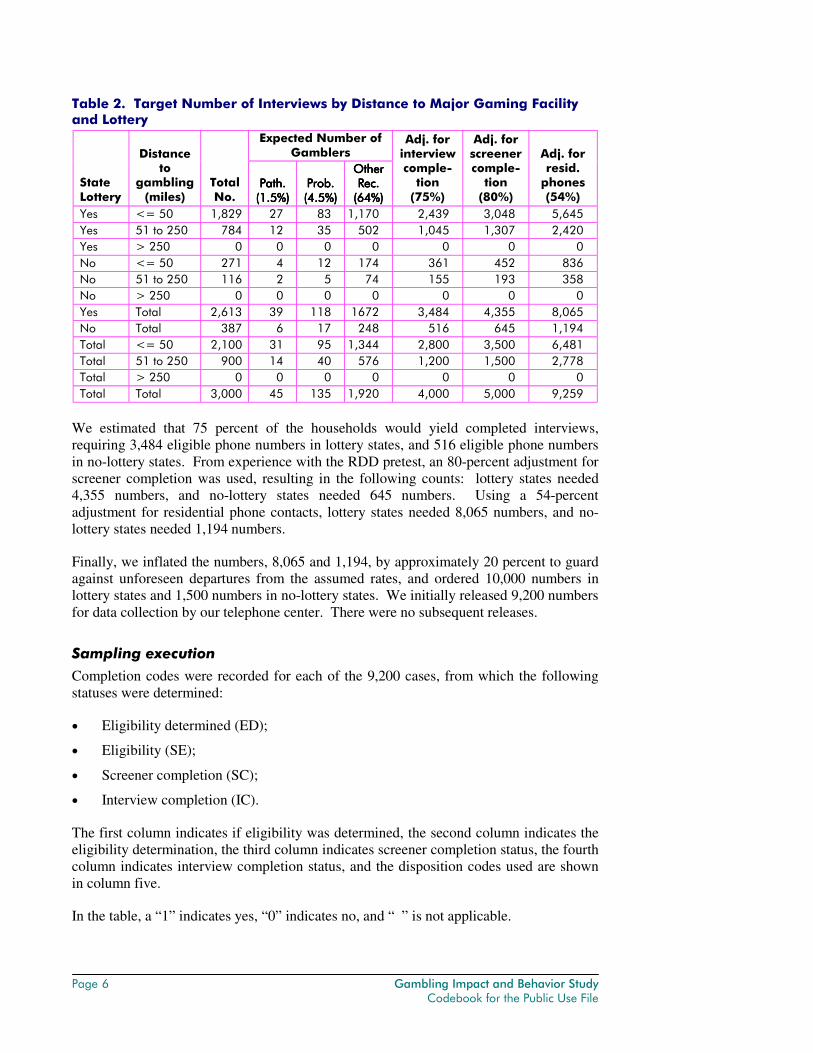
Table 2. Target Number of Interviews by Distance to Major Gaming Facility and Lottery
Expected Number of Gamblers
State Lottery
Distance to
gambling (miles)
Total No.
Path. Path. Path. Path. (1.5%)(1.5%)(1.5%)(1.5%)
Prob. Prob. Prob. Prob. (4.5%)(4.5%)(4.5%)(4.5%)
Other Other Other Other Rec. Rec. Rec. Rec.
(64%)(64%)(64%)(64%)
Adj. for interview comple-
tion (75%)
Adj. for screener comple-
tion (80%)
Adj. for resid.
phones (54%)
Yes <= 50 1,829 27 83 1,170 2,439 3,048 5,645 Yes 51 to 250 784 12 35 502 1,045 1,307 2,420 Yes > 250 0 0 0 0 0 0 0 No <= 50 271 4 12 174 361 452 836 No 51 to 250 116 2 5 74 155 193 358 No > 250 0 0 0 0 0 0 0 Yes Total 2,613 39 118 1672 3,484 4,355 8,065 No Total 387 6 17 248 516 645 1,194 Total <= 50 2,100 31 95 1,344 2,800 3,500 6,481 Total 51 to 250 900 14 40 576 1,200 1,500 2,778 Total > 250 0 0 0 0 0 0 0 Total Total 3,000 45 135 1,920 4,000 5,000 9,259
We estimated that 75 percent of the households would yield completed interviews, requiring 3,484 eligible phone numbers in lottery states, and 516 eligible phone numbers in no-lottery states. From experience with the RDD pretest, an 80-percent adjustment for screener completion was used, resulting in the following counts: lottery states needed 4,355 numbers, and no-lottery states needed 645 numbers. Using a 54-percent adjustment for residential phone contacts, lottery states needed 8,065 numbers, and no-lottery states needed 1,194 numbers.
Finally, we inflated the numbers, 8,065 and 1,194, by approximately 20 percent to guard against unforeseen departures from the assumed rates, and ordered 10,000 numbers in lottery states and 1,500 numbers in no-lottery states. We initially released 9,200 numbers for data collection by our telephone center. There were no subsequent releases.
Sampling execution
Completion codes were recorded for each of the 9,200 cases, from which the following statuses were determined:
• Eligibility determined (ED);
• Eligibility (SE);
• Screener completion (SC);
• Interview completion (IC).
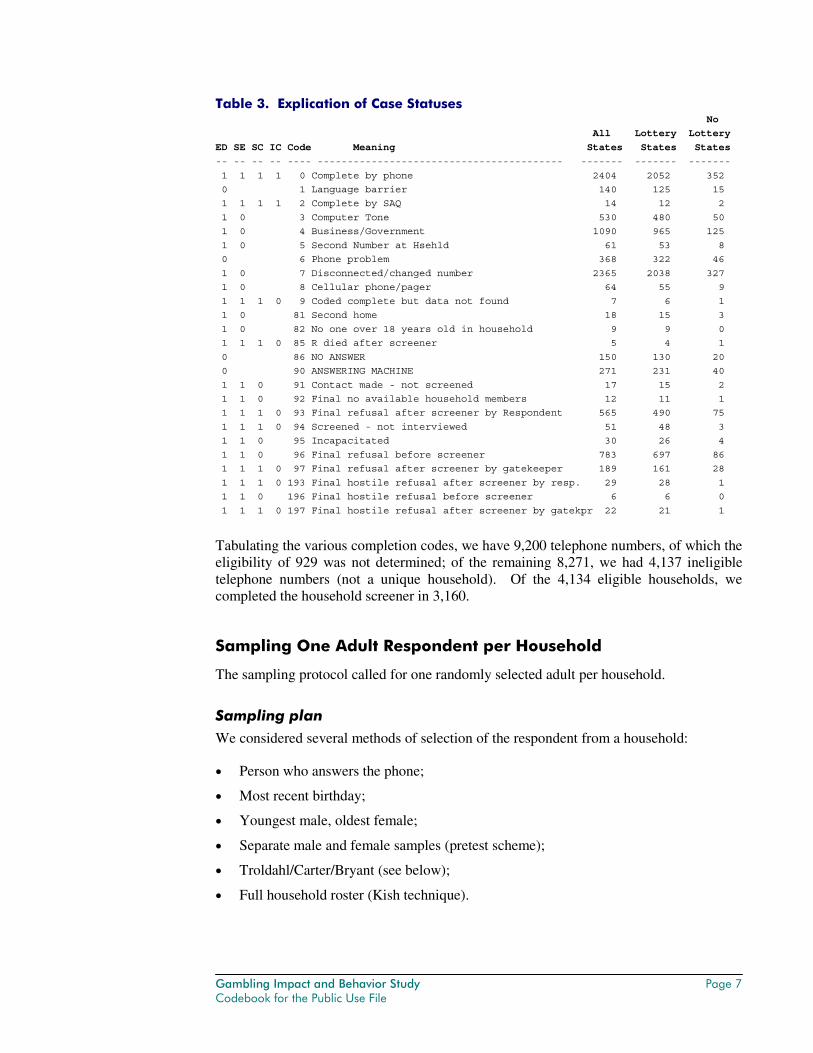
The first column indicates if eligibility was determined, the second column indicates the eligibility determination, the third column indicates screener completion status, the fourth column indicates interview completion status, and the disposition codes used are shown in column five.
In the table, a “1” indicates yes, “0” indicates no, and “ ” is not applicable.
Gambling Impact and Behavior Study Page 7 Codebook for the Public Use File
Table 3. Explication of Case Statuses No
All Lottery Lottery
ED SE SC IC Code Meaning States States States
-- -- -- -- ---- ----------------------------------------- ------- ------- -------
1 1 1 1 0 Complete by phone 2404 2052 352
0 1 Language barrier 140 125 15
1 1 1 1 2 Complete by SAQ 14 12 2
1 0 3 Computer Tone 530 480 50
1 0 4 Business/Government 1090 965 125
1 0 5 Second Number at Hsehld 61 53 8
0 6 Phone problem 368 322 46
1 0 7 Disconnected/changed number 2365 2038 327
1 0 8 Cellular phone/pager 64 55 9
1 1 1 0 9 Coded complete but data not found 7 6 1
1 0 81 Second home 18 15 3
1 0 82 No one over 18 years old in household 9 9 0
1 1 1 0 85 R died after screener 5 4 1
0 86 NO ANSWER 150 130 20
0 90 ANSWERING MACHINE 271 231 40
1 1 0 91 Contact made - not screened 17 15 2
1 1 0 92 Final no available household members 12 11 1
1 1 1 0 93 Final refusal after screener by Respondent 565 490 75
1 1 1 0 94 Screened - not interviewed 51 48 3
1 1 0 95 Incapacitated 30 26 4
1 1 0 96 Final refusal before screener 783 697 86
1 1 1 0 97 Final refusal after screener by gatekeeper 189 161 28
1 1 1 0 193 Final hostile refusal after screener by resp. 29 28 1
1 1 0 196 Final hostile refusal before screener 6 6 0
1 1 1 0 197 Final hostile refusal after screener by gatekpr 22 21 1
Tabulating the various completion codes, we have 9,200 telephone numbers, of which the eligibility of 929 was not determined; of the remaining 8,271, we had 4,137 ineligible telephone numbers (not a unique household). Of the 4,134 eligible households, we completed the household screener in 3,160.
Sampling One Adult Respondent per Household
The sampling protocol called for one randomly selected adult per household.
Sampling plan
We considered several methods of selection of the respondent from a household:
• Person who answers the phone;
• Most recent birthday;
• Youngest male, oldest female;
• Separate male and female samples (pretest scheme);
• Troldahl/Carter/Bryant (see below);
• Full household roster (Kish technique).
Page 8 Gambling Impact and Behavior Study Codebook for the Public Use File
Keeter and Fisher (1997) compare the last birthday and youngest male, oldest female (YMOF) methods. The latter method performed better in terms of gender distribution, but the proportion of young males was significantly larger than that in the Current Population Survey.
Czaja, Blair, and Sebestik (1982) compared the Kish and Troldahl/Carter/Bryant (T-C-B) methods, finding that, in terms of interview and refusal rates, the T-C-B procedure produced better results than the Kish procedure. In fact, these authors used two variations of the T-C-B procedure; in one, where the interviewer asks for the count of adult females living in the household, and in the other, a count of the adult males. The procedure querying the number of females produced the best results, the Kish method, the second best, and the male variation, the worst. Consequently, we decided to use a variant of the T-C-B procedure.
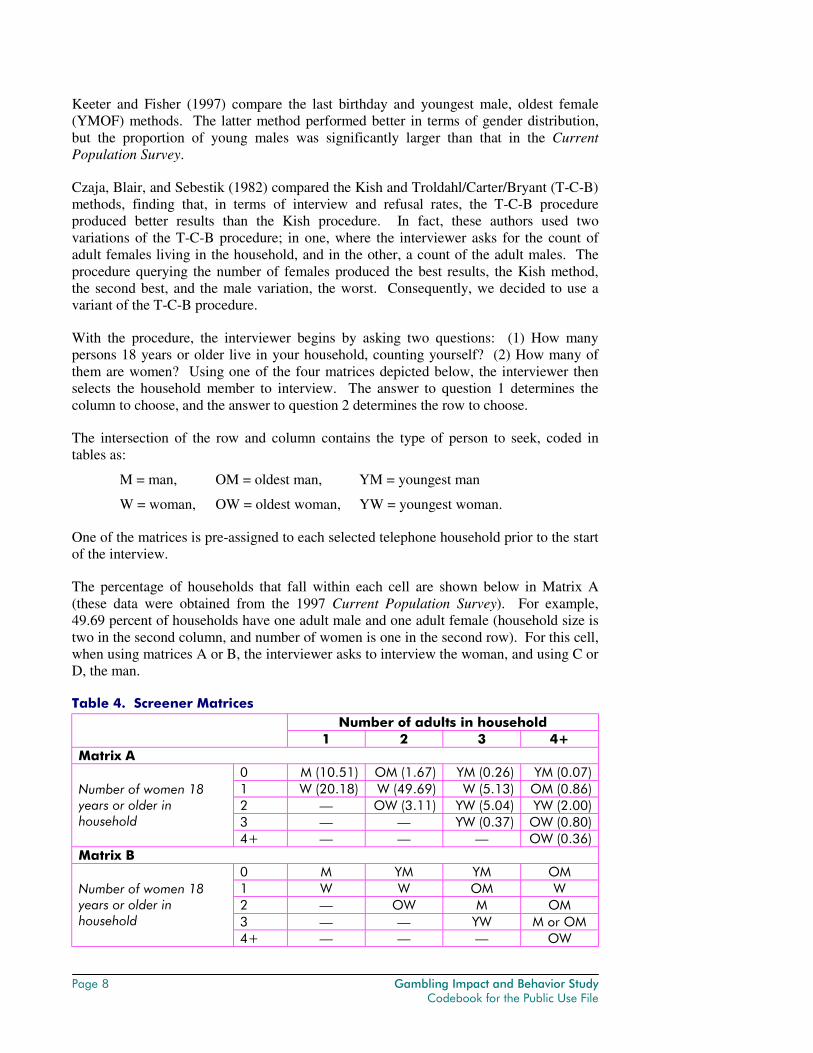
With the procedure, the interviewer begins by asking two questions: (1) How many persons 18 years or older live in your household, counting yourself? (2) How many of them are women? Using one of the four matrices depicted below, the interviewer then selects the household member to interview. The answer to question 1 determines the column to choose, and the answer to question 2 determines the row to choose.
The intersection of the row and column contains the type of person to seek, coded in tables as:
M = man, OM = oldest man, YM = youngest man
W = woman, OW = oldest woman, YW = youngest woman.
One of the matrices is pre-assigned to each selected telephone household prior to the start of the interview.
The percentage of households that fall within each cell are shown below in Matrix A (these data were obtained from the 1997 Current Population Survey). For example, 49.69 percent of households have one adult male and one adult female (household size is two in the second column, and number of women is one in the second row). For this cell, when using matrices A or B, the interviewer asks to interview the woman, and using C or D, the man.
Table 4. Screener Matrices Number of adults in household
1 2 3 4+ Matrix A
0 M (10.51) OM (1.67) YM (0.26) YM (0.07) 1 W (20.18) W (49.69) W (5.13) OM (0.86) 2 � OW (3.11) YW (5.04) YW (2.00) 3 � � YW (0.37) OW (0.80)
Number of women 18 years or older in household
4+ � � � OW (0.36) Matrix B
0 M YM YM OM 1 W W OM W 2 � OW M OM 3 � � YW M or OM
Number of women 18 years or older in household
4+ � � � OW
Gambling Impact and Behavior Study Page 9 Codebook for the Public Use File
Number of adults in household 1 2 3 4+ Matrix C
0 M YM OM OM 1 W M W YM 2 � YW OW OW 3 � � OW YW
Number of women 18 years or older in household
4+ � � � YW Matrix D
0 M OM OM YM 1 W M YM W 2 � YW M YM 3 � � OW M or YM
Number of women 18 years or older in household
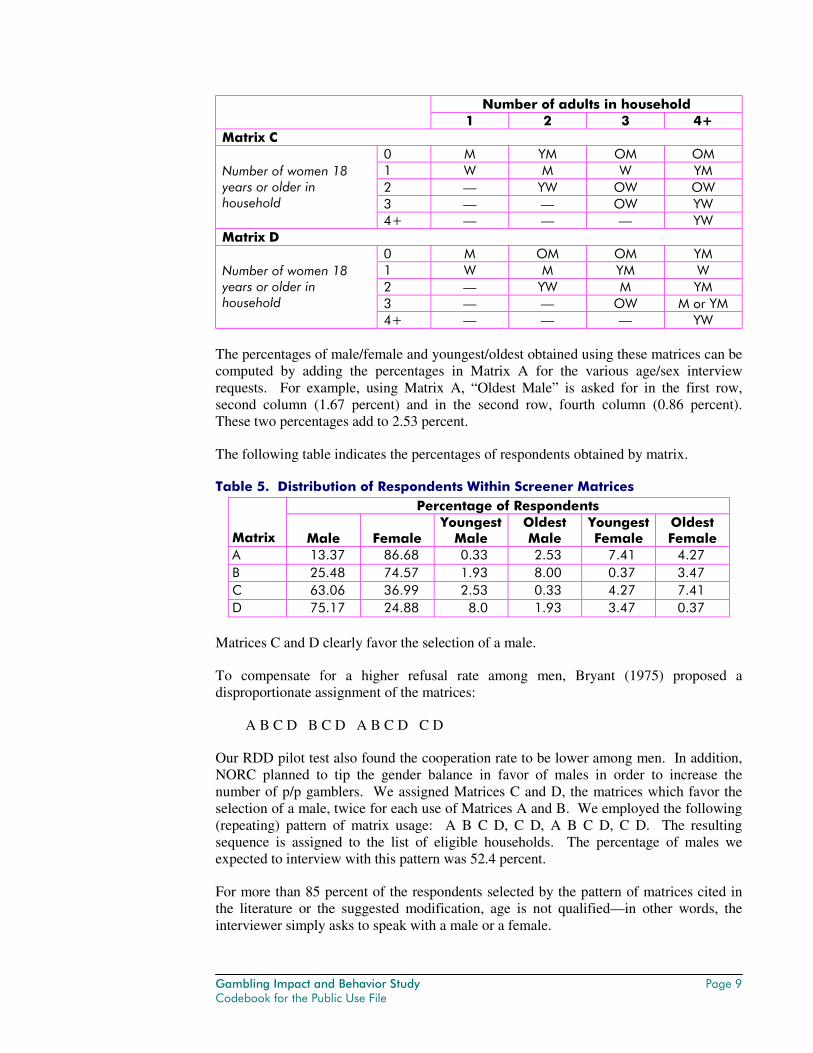
4+ � � � YW The percentages of male/female and youngest/oldest obtained using these matrices can be computed by adding the percentages in Matrix A for the various age/sex interview requests. For example, using Matrix A, “Oldest Male” is asked for in the first row, second column (1.67 percent) and in the second row, fourth column (0.86 percent). These two percentages add to 2.53 percent.
The following table indicates the percentages of respondents obtained by matrix.
Table 5. Distribution of Respondents Within Screener Matrices Percentage of Respondents
Matrix Male Female Youngest
Male Oldest Male
Youngest Female
Oldest Female
A 13.37 86.68 0.33 2.53 7.41 4.27 B 25.48 74.57 1.93 8.00 0.37 3.47 C 63.06 36.99 2.53 0.33 4.27 7.41 D 75.17 24.88 8.0 1.93 3.47 0.37
Matrices C and D clearly favor the selection of a male.
To compensate for a higher refusal rate among men, Bryant (1975) proposed a disproportionate assignment of the matrices:
A B C D B C D A B C D C D
Our RDD pilot test also found the cooperation rate to be lower among men. In addition, NORC planned to tip the gender balance in favor of males in order to increase the number of p/p gamblers. We assigned Matrices C and D, the matrices which favor the selection of a male, twice for each use of Matrices A and B. We employed the following (repeating) pattern of matrix usage: A B C D, C D, A B C D, C D. The resulting sequence is assigned to the list of eligible households. The percentage of males we expected to interview with this pattern was 52.4 percent.
For more than 85 percent of the respondents selected by the pattern of matrices cited in the literature or the suggested modification, age is not qualified—in other words, the interviewer simply asks to speak with a male or a female.
Page 10 Gambling Impact and Behavior Study Codebook for the Public Use File
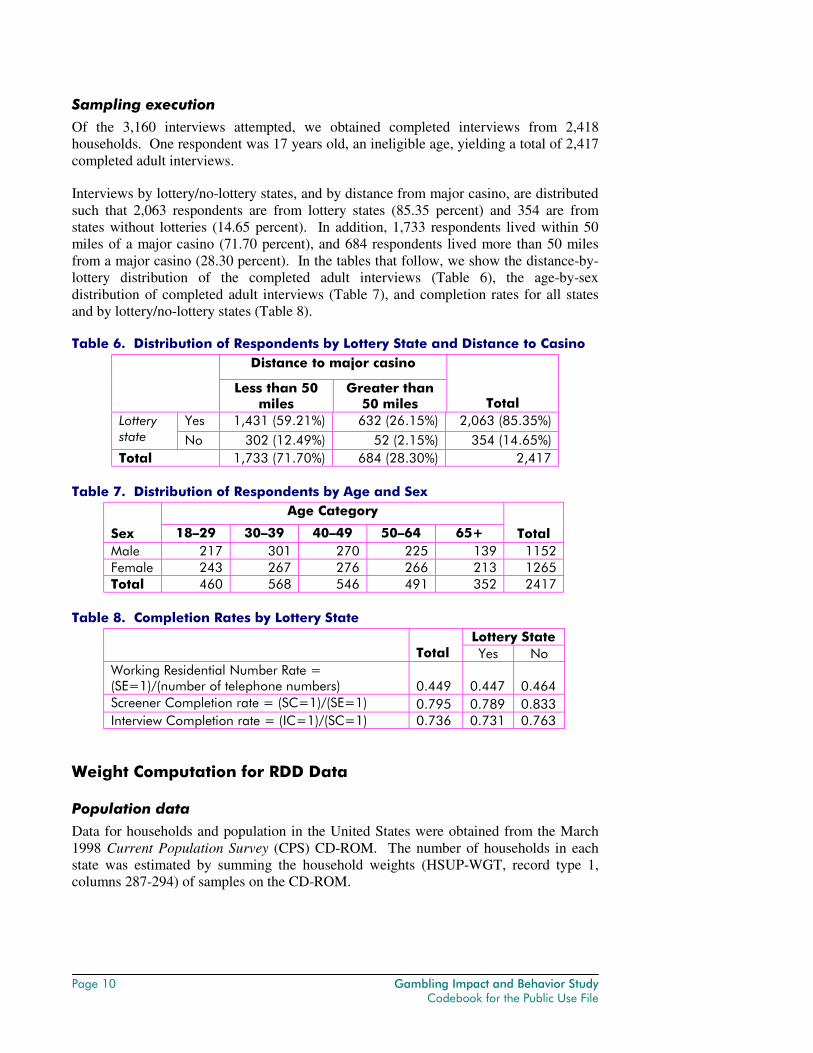
Sampling execution
Of the 3,160 interviews attempted, we obtained completed interviews from 2,418 households. One respondent was 17 years old, an ineligible age, yielding a total of 2,417 completed adult interviews.
Interviews by lottery/no-lottery states, and by distance from major casino, are distributed such that 2,063 respondents are from lottery states (85.35 percent) and 354 are from states without lotteries (14.65 percent). In addition, 1,733 respondents lived within 50 miles of a major casino (71.70 percent), and 684 respondents lived more than 50 miles from a major casino (28.30 percent). In the tables that follow, we show the distance-by-lottery distribution of the completed adult interviews (Table 6), the age-by-sex distribution of completed adult interviews (Table 7), and completion rates for all states and by lottery/no-lottery states (Table 8).
Table 6. Distribution of Respondents by Lottery State and Distance to Casino Distance to major casino
Less than 50 miles
Greater than 50 miles Total
Yes 1,431 (59.21%) 632 (26.15%) 2,063 (85.35%) Lottery state No 302 (12.49%) 52 (2.15%) 354 (14.65%) Total 1,733 (71.70%) 684 (28.30%) 2,417
Table 7. Distribution of Respondents by Age and Sex
Age Category
Sex 18�29 30�39 40�49 50�64 65+ Total Male 217 301 270 225 139 1152 Female 243 267 276 266 213 1265 Total 460 568 546 491 352 2417
Table 8. Completion Rates by Lottery State
Lottery State Total Yes No
Working Residential Number Rate = (SE=1)/(number of telephone numbers) 0.449 0.447 0.464 Screener Completion rate = (SC=1)/(SE=1) 0.795 0.789 0.833 Interview Completion rate = (IC=1)/(SC=1) 0.736 0.731 0.763
Weight Computation for RDD Data
Population data
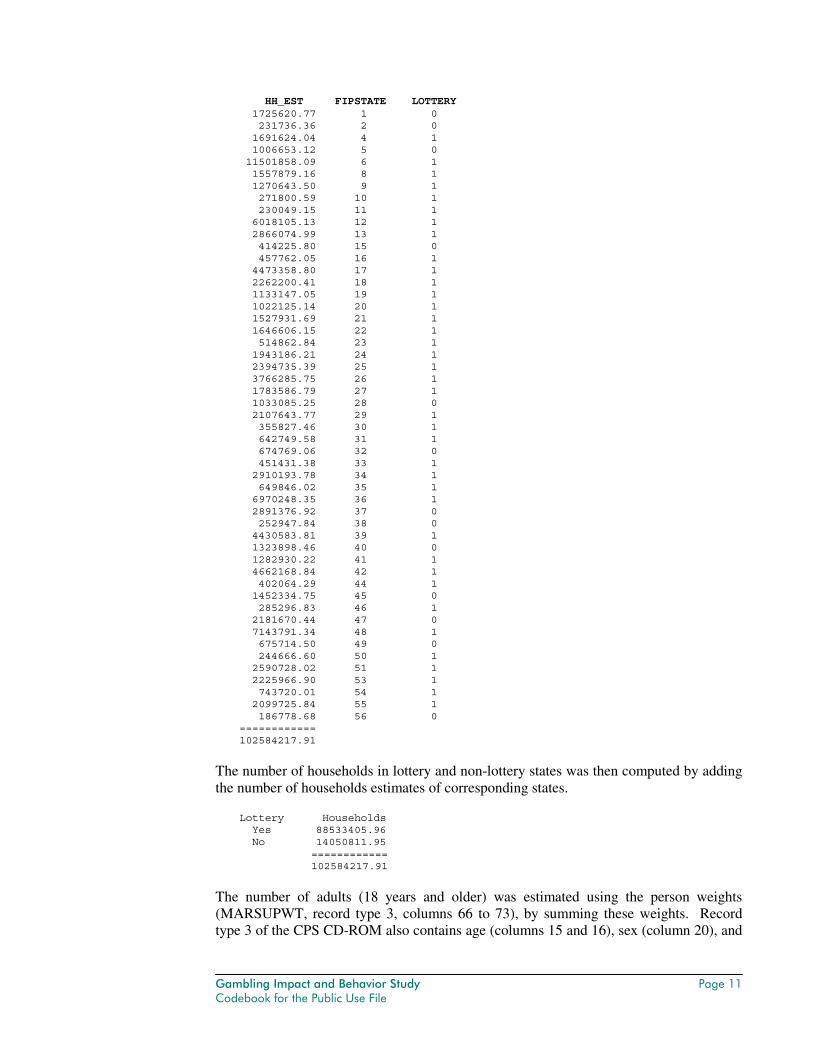
Data for households and population in the United States were obtained from the March 1998 Current Population Survey (CPS) CD-ROM. The number of households in each state was estimated by summing the household weights (HSUP-WGT, record type 1, columns 287-294) of samples on the CD-ROM.
Gambling Impact and Behavior Study Page 11 Codebook for the Public Use File
HH_EST FIPSTATE LOTTERY 1725620.77 1 0 231736.36 2 0 1691624.04 4 1 1006653.12 5 0 11501858.09 6 1 1557879.16 8 1 1270643.50 9 1 271800.59 10 1 230049.15 11 1 6018105.13 12 1 2866074.99 13 1 414225.80 15 0 457762.05 16 1 4473358.80 17 1 2262200.41 18 1 1133147.05 19 1 1022125.14 20 1 1527931.69 21 1 1646606.15 22 1 514862.84 23 1 1943186.21 24 1 2394735.39 25 1 3766285.75 26 1 1783586.79 27 1 1033085.25 28 0 2107643.77 29 1 355827.46 30 1 642749.58 31 1 674769.06 32 0 451431.38 33 1 2910193.78 34 1 649846.02 35 1 6970248.35 36 1 2891376.92 37 0 252947.84 38 0 4430583.81 39 1 1323898.46 40 0 1282930.22 41 1 4662168.84 42 1 402064.29 44 1 1452334.75 45 0 285296.83 46 1 2181670.44 47 0 7143791.34 48 1 675714.50 49 0 244666.60 50 1 2590728.02 51 1 2225966.90 53 1 743720.01 54 1 2099725.84 55 1 186778.68 56 0 ============ 102584217.91
The number of households in lottery and non-lottery states was then computed by adding the number of households estimates of corresponding states.
Lottery Households Yes 88533405.96 No 14050811.95
============ 102584217.91
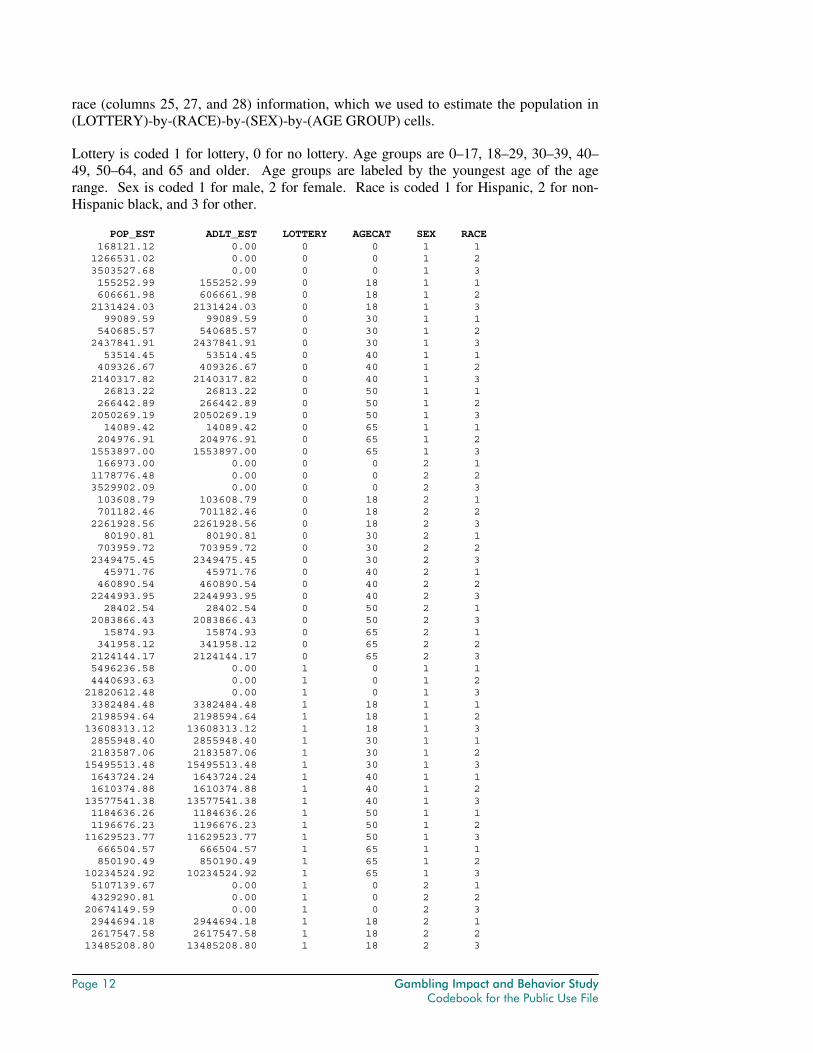
The number of adults (18 years and older) was estimated using the person weights (MARSUPWT, record type 3, columns 66 to 73), by summing these weights. Record type 3 of the CPS CD-ROM also contains age (columns 15 and 16), sex (column 20), and
Page 12 Gambling Impact and Behavior Study Codebook for the Public Use File
race (columns 25, 27, and 28) information, which we used to estimate the population in (LOTTERY)-by-(RACE)-by-(SEX)-by-(AGE GROUP) cells.
Lottery is coded 1 for lottery, 0 for no lottery. Age groups are 0–17, 18–29, 30–39, 40–49, 50–64, and 65 and older. Age groups are labeled by the youngest age of the age range. Sex is coded 1 for male, 2 for female. Race is coded 1 for Hispanic, 2 for non-Hispanic black, and 3 for other.
POP_EST ADLT_EST LOTTERY AGECAT SEX RACE 168121.12 0.00 0 0 1 1 1266531.02 0.00 0 0 1 2 3503527.68 0.00 0 0 1 3 155252.99 155252.99 0 18 1 1 606661.98 606661.98 0 18 1 2 2131424.03 2131424.03 0 18 1 3 99089.59 99089.59 0 30 1 1 540685.57 540685.57 0 30 1 2 2437841.91 2437841.91 0 30 1 3 53514.45 53514.45 0 40 1 1 409326.67 409326.67 0 40 1 2 2140317.82 2140317.82 0 40 1 3 26813.22 26813.22 0 50 1 1 266442.89 266442.89 0 50 1 2 2050269.19 2050269.19 0 50 1 3 14089.42 14089.42 0 65 1 1 204976.91 204976.91 0 65 1 2 1553897.00 1553897.00 0 65 1 3 166973.00 0.00 0 0 2 1 1178776.48 0.00 0 0 2 2 3529902.09 0.00 0 0 2 3 103608.79 103608.79 0 18 2 1 701182.46 701182.46 0 18 2 2 2261928.56 2261928.56 0 18 2 3 80190.81 80190.81 0 30 2 1 703959.72 703959.72 0 30 2 2 2349475.45 2349475.45 0 30 2 3 45971.76 45971.76 0 40 2 1 460890.54 460890.54 0 40 2 2 2244993.95 2244993.95 0 40 2 3 28402.54 28402.54 0 50 2 1 2083866.43 2083866.43 0 50 2 3 15874.93 15874.93 0 65 2 1 341958.12 341958.12 0 65 2 2 2124144.17 2124144.17 0 65 2 3 5496236.58 0.00 1 0 1 1 4440693.63 0.00 1 0 1 2 21820612.48 0.00 1 0 1 3 3382484.48 3382484.48 1 18 1 1 2198594.64 2198594.64 1 18 1 2 13608313.12 13608313.12 1 18 1 3 2855948.40 2855948.40 1 30 1 1 2183587.06 2183587.06 1 30 1 2 15495513.48 15495513.48 1 30 1 3 1643724.24 1643724.24 1 40 1 1 1610374.88 1610374.88 1 40 1 2 13577541.38 13577541.38 1 40 1 3 1184636.26 1184636.26 1 50 1 1 1196676.23 1196676.23 1 50 1 2 11629523.77 11629523.77 1 50 1 3 666504.57 666504.57 1 65 1 1 850190.49 850190.49 1 65 1 2 10234524.92 10234524.92 1 65 1 3 5107139.67 0.00 1 0 2 1 4329290.81 0.00 1 0 2 2 20674149.59 0.00 1 0 2 3 2944694.18 2944694.18 1 18 2 1 2617547.58 2617547.58 1 18 2 2 13485208.80 13485208.80 1 18 2 3
Gambling Impact and Behavior Study Page 13 Codebook for the Public Use File
2603476.23 2603476.23 1 30 2 1 2529686.09 2529686.09 1 30 2 2 15576788.57 15576788.57 1 30 2 3 1714978.18 1714978.18 1 40 2 1 1989764.51 1989764.51 1 40 2 2 13805137.21 13805137.21 1 40 2 3 1294676.05 1294676.05 1 50 2 1 1527584.39 1527584.39 1 50 2 2 12325994.39 12325994.39 1 50 2 3 920920.40 920920.40 1 65 2 1 1247294.85 1247294.85 1 65 2 2 13907984.56 13907984.56 1 65 2 3 ============ ============ 269093735.74 197411781.59
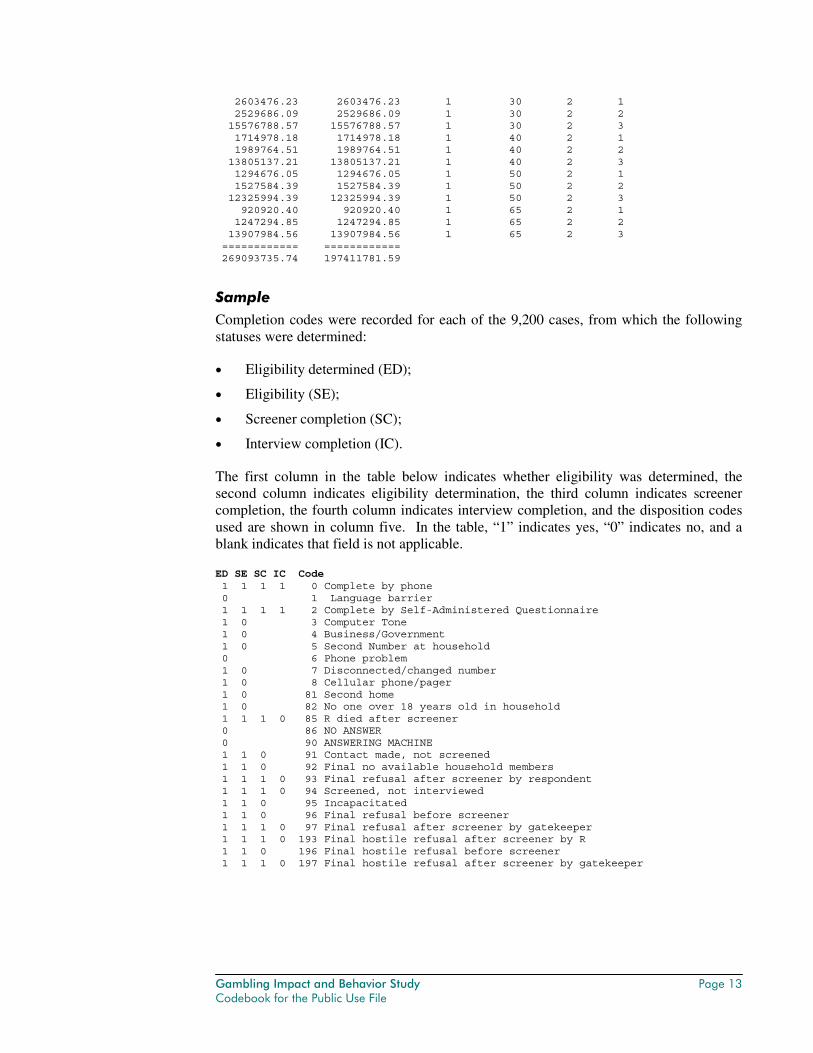
Sample
Completion codes were recorded for each of the 9,200 cases, from which the following statuses were determined:
• Eligibility determined (ED);
• Eligibility (SE);
• Screener completion (SC);
• Interview completion (IC).
The first column in the table below indicates whether eligibility was determined, the second column indicates eligibility determination, the third column indicates screener completion, the fourth column indicates interview completion, and the disposition codes used are shown in column five. In the table, “1” indicates yes, “0” indicates no, and a blank indicates that field is not applicable.
ED SE SC IC Code 1 1 1 1 0 Complete by phone 0 1 Language barrier 1 1 1 1 2 Complete by Self-Administered Questionnaire 1 0 3 Computer Tone 1 0 4 Business/Government 1 0 5 Second Number at household 0 6 Phone problem 1 0 7 Disconnected/changed number 1 0 8 Cellular phone/pager 1 0 81 Second home 1 0 82 No one over 18 years old in household 1 1 1 0 85 R died after screener 0 86 NO ANSWER 0 90 ANSWERING MACHINE 1 1 0 91 Contact made, not screened 1 1 0 92 Final no available household members 1 1 1 0 93 Final refusal after screener by respondent 1 1 1 0 94 Screened, not interviewed 1 1 0 95 Incapacitated 1 1 0 96 Final refusal before screener 1 1 1 0 97 Final refusal after screener by gatekeeper 1 1 1 0 193 Final hostile refusal after screener by R 1 1 0 196 Final hostile refusal before screener 1 1 1 0 197 Final hostile refusal after screener by gatekeeper
Page 14 Gambling Impact and Behavior Study Codebook for the Public Use File
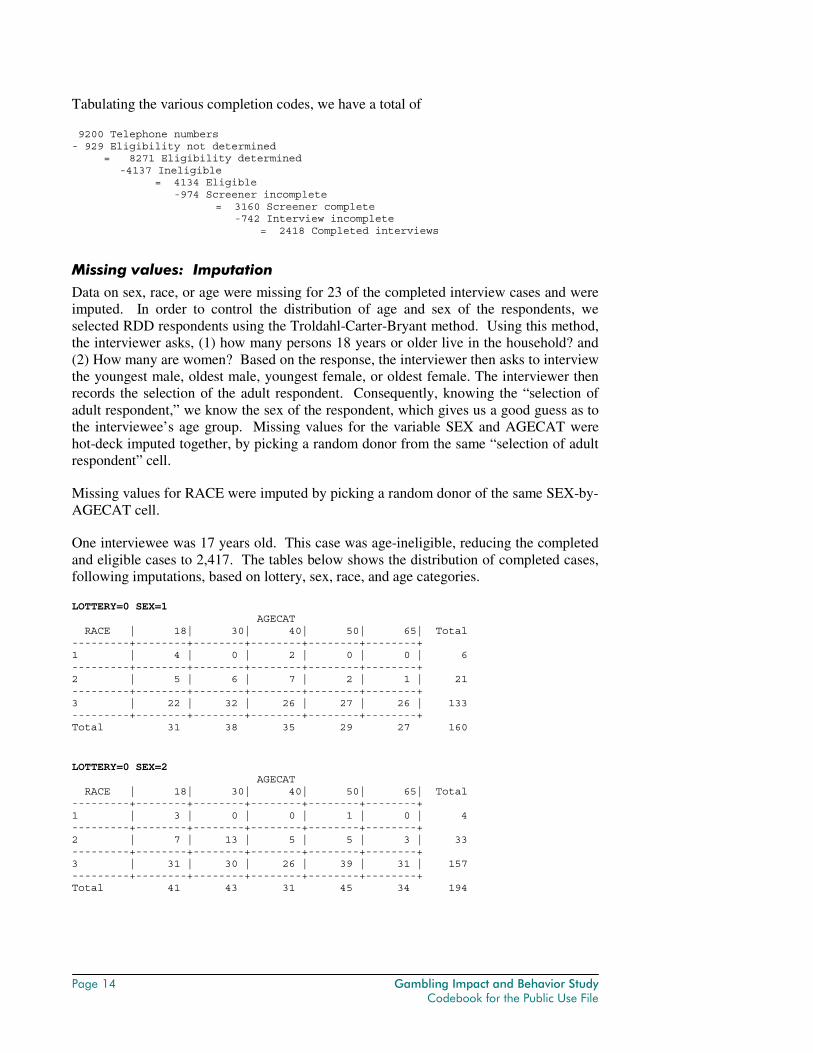
Tabulating the various completion codes, we have a total of
9200 Telephone numbers - 929 Eligibility not determined = 8271 Eligibility determined
-4137 Ineligible = 4134 Eligible
-974 Screener incomplete = 3160 Screener complete
-742 Interview incomplete = 2418 Completed interviews
Missing values: Imputation
Data on sex, race, or age were missing for 23 of the completed interview cases and were imputed. In order to control the distribution of age and sex of the respondents, we selected RDD respondents using the Troldahl-Carter-Bryant method. Using this method, the interviewer asks, (1) how many persons 18 years or older live in the household? and (2) How many are women? Based on the response, the interviewer then asks to interview the youngest male, oldest male, youngest female, or oldest female. The interviewer then records the selection of the adult respondent. Consequently, knowing the “selection of adult respondent,” we know the sex of the respondent, which gives us a good guess as to the interviewee’s age group. Missing values for the variable SEX and AGECAT were hot-deck imputed together, by picking a random donor from the same “selection of adult respondent” cell.
Missing values for RACE were imputed by picking a random donor of the same SEX-by-AGECAT cell.
One interviewee was 17 years old. This case was age-ineligible, reducing the completed and eligible cases to 2,417. The tables below shows the distribution of completed cases, following imputations, based on lottery, sex, race, and age categories.
LOTTERY=0 SEX=1 AGECAT RACE | 18| 30| 40| 50| 65| Total ---------+--------+--------+--------+--------+--------+ 1 | 4 | 0 | 2 | 0 | 0 | 6 ---------+--------+--------+--------+--------+--------+ 2 | 5 | 6 | 7 | 2 | 1 | 21 ---------+--------+--------+--------+--------+--------+ 3 | 22 | 32 | 26 | 27 | 26 | 133 ---------+--------+--------+--------+--------+--------+ Total 31 38 35 29 27 160
LOTTERY=0 SEX=2 AGECAT RACE | 18| 30| 40| 50| 65| Total ---------+--------+--------+--------+--------+--------+ 1 | 3 | 0 | 0 | 1 | 0 | 4 ---------+--------+--------+--------+--------+--------+ 2 | 7 | 13 | 5 | 5 | 3 | 33 ---------+--------+--------+--------+--------+--------+ 3 | 31 | 30 | 26 | 39 | 31 | 157 ---------+--------+--------+--------+--------+--------+ Total 41 43 31 45 34 194
Gambling Impact and Behavior Study Page 15 Codebook for the Public Use File
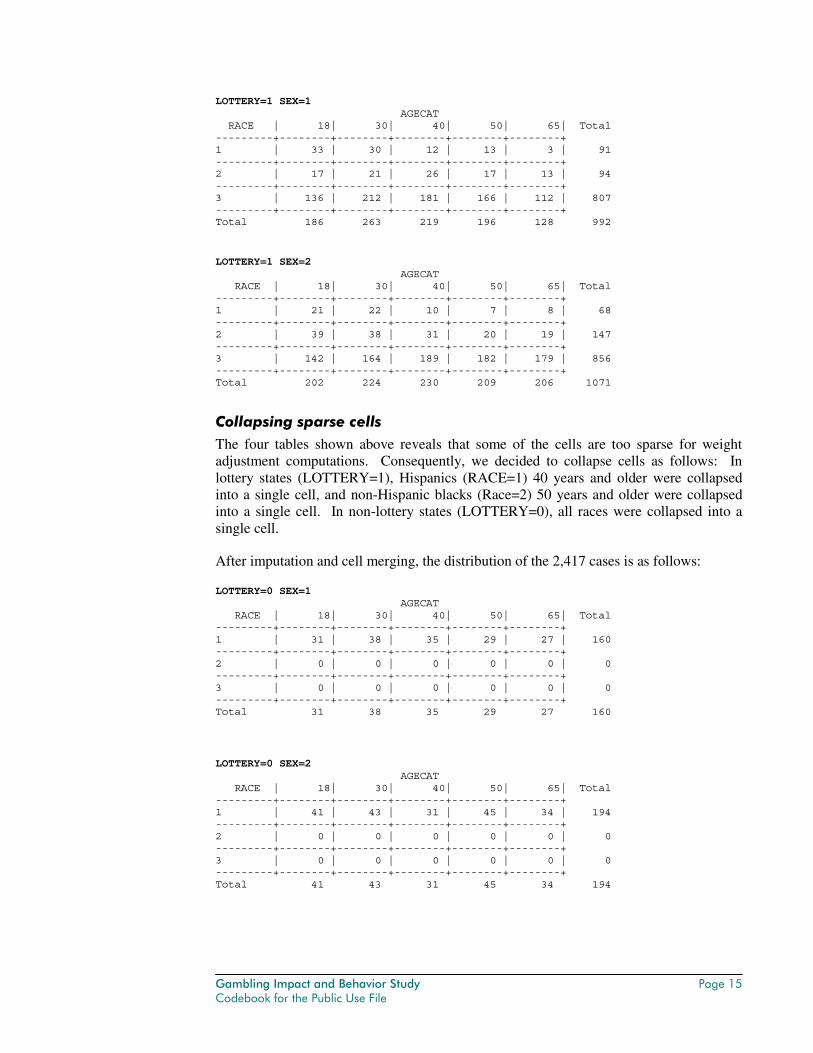
LOTTERY=1 SEX=1 AGECAT RACE | 18| 30| 40| 50| 65| Total ---------+--------+--------+--------+--------+--------+ 1 | 33 | 30 | 12 | 13 | 3 | 91 ---------+--------+--------+--------+--------+--------+ 2 | 17 | 21 | 26 | 17 | 13 | 94 ---------+--------+--------+--------+--------+--------+ 3 | 136 | 212 | 181 | 166 | 112 | 807 ---------+--------+--------+--------+--------+--------+ Total 186 263 219 196 128 992
LOTTERY=1 SEX=2 AGECAT RACE | 18| 30| 40| 50| 65| Total ---------+--------+--------+--------+--------+--------+ 1 | 21 | 22 | 10 | 7 | 8 | 68 ---------+--------+--------+--------+--------+--------+ 2 | 39 | 38 | 31 | 20 | 19 | 147 ---------+--------+--------+--------+--------+--------+ 3 | 142 | 164 | 189 | 182 | 179 | 856 ---------+--------+--------+--------+--------+--------+ Total 202 224 230 209 206 1071
Collapsing sparse cells
The four tables shown above reveals that some of the cells are too sparse for weight adjustment computations. Consequently, we decided to collapse cells as follows: In lottery states (LOTTERY=1), Hispanics (RACE=1) 40 years and older were collapsed into a single cell, and non-Hispanic blacks (Race=2) 50 years and older were collapsed into a single cell. In non-lottery states (LOTTERY=0), all races were collapsed into a single cell.
After imputation and cell merging, the distribution of the 2,417 cases is as follows:
LOTTERY=0 SEX=1 AGECAT RACE | 18| 30| 40| 50| 65| Total ---------+--------+--------+--------+--------+--------+ 1 | 31 | 38 | 35 | 29 | 27 | 160 ---------+--------+--------+--------+--------+--------+ 2 | 0 | 0 | 0 | 0 | 0 | 0 ---------+--------+--------+--------+--------+--------+ 3 | 0 | 0 | 0 | 0 | 0 | 0 ---------+--------+--------+--------+--------+--------+ Total 31 38 35 29 27 160
LOTTERY=0 SEX=2 AGECAT RACE | 18| 30| 40| 50| 65| Total ---------+--------+--------+--------+--------+--------+ 1 | 41 | 43 | 31 | 45 | 34 | 194 ---------+--------+--------+--------+--------+--------+ 2 | 0 | 0 | 0 | 0 | 0 | 0 ---------+--------+--------+--------+--------+--------+ 3 | 0 | 0 | 0 | 0 | 0 | 0 ---------+--------+--------+--------+--------+--------+ Total 41 43 31 45 34 194
Page 16 Gambling Impact and Behavior Study Codebook for the Public Use File
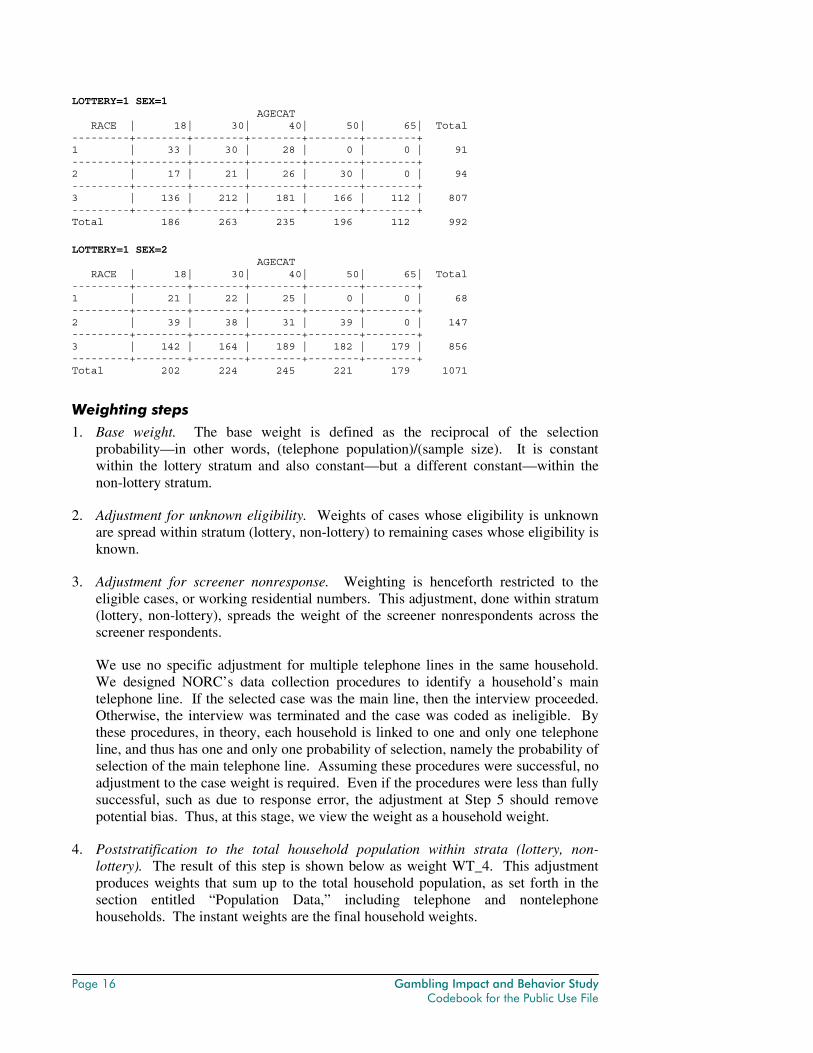
LOTTERY=1 SEX=1 AGECAT RACE | 18| 30| 40| 50| 65| Total ---------+--------+--------+--------+--------+--------+ 1 | 33 | 30 | 28 | 0 | 0 | 91 ---------+--------+--------+--------+--------+--------+ 2 | 17 | 21 | 26 | 30 | 0 | 94 ---------+--------+--------+--------+--------+--------+ 3 | 136 | 212 | 181 | 166 | 112 | 807 ---------+--------+--------+--------+--------+--------+ Total 186 263 235 196 112 992
LOTTERY=1 SEX=2 AGECAT RACE | 18| 30| 40| 50| 65| Total ---------+--------+--------+--------+--------+--------+ 1 | 21 | 22 | 25 | 0 | 0 | 68 ---------+--------+--------+--------+--------+--------+ 2 | 39 | 38 | 31 | 39 | 0 | 147 ---------+--------+--------+--------+--------+--------+ 3 | 142 | 164 | 189 | 182 | 179 | 856 ---------+--------+--------+--------+--------+--------+ Total 202 224 245 221 179 1071
Weighting steps
1. Base weight. The base weight is defined as the reciprocal of the selection probability—in other words, (telephone population)/(sample size). It is constant within the lottery stratum and also constant—but a different constant—within the non-lottery stratum.
2. Adjustment for unknown eligibility. Weights of cases whose eligibility is unknown are spread within stratum (lottery, non-lottery) to remaining cases whose eligibility is known.
3. Adjustment for screener nonresponse. Weighting is henceforth restricted to the eligible cases, or working residential numbers. This adjustment, done within stratum (lottery, non-lottery), spreads the weight of the screener nonrespondents across the screener respondents.
We use no specific adjustment for multiple telephone lines in the same household. We designed NORC’s data collection procedures to identify a household’s main telephone line. If the selected case was the main line, then the interview proceeded. Otherwise, the interview was terminated and the case was coded as ineligible. By these procedures, in theory, each household is linked to one and only one telephone line, and thus has one and only one probability of selection, namely the probability of selection of the main telephone line. Assuming these procedures were successful, no adjustment to the case weight is required. Even if the procedures were less than fully successful, such as due to response error, the adjustment at Step 5 should remove potential bias. Thus, at this stage, we view the weight as a household weight.
4. Poststratification to the total household population within strata (lottery, non-lottery). The result of this step is shown below as weight WT_4. This adjustment produces weights that sum up to the total household population, as set forth in the section entitled “Population Data,” including telephone and nontelephone households. The instant weights are the final household weights.
Gambling Impact and Behavior Study Page 17 Codebook for the Public Use File
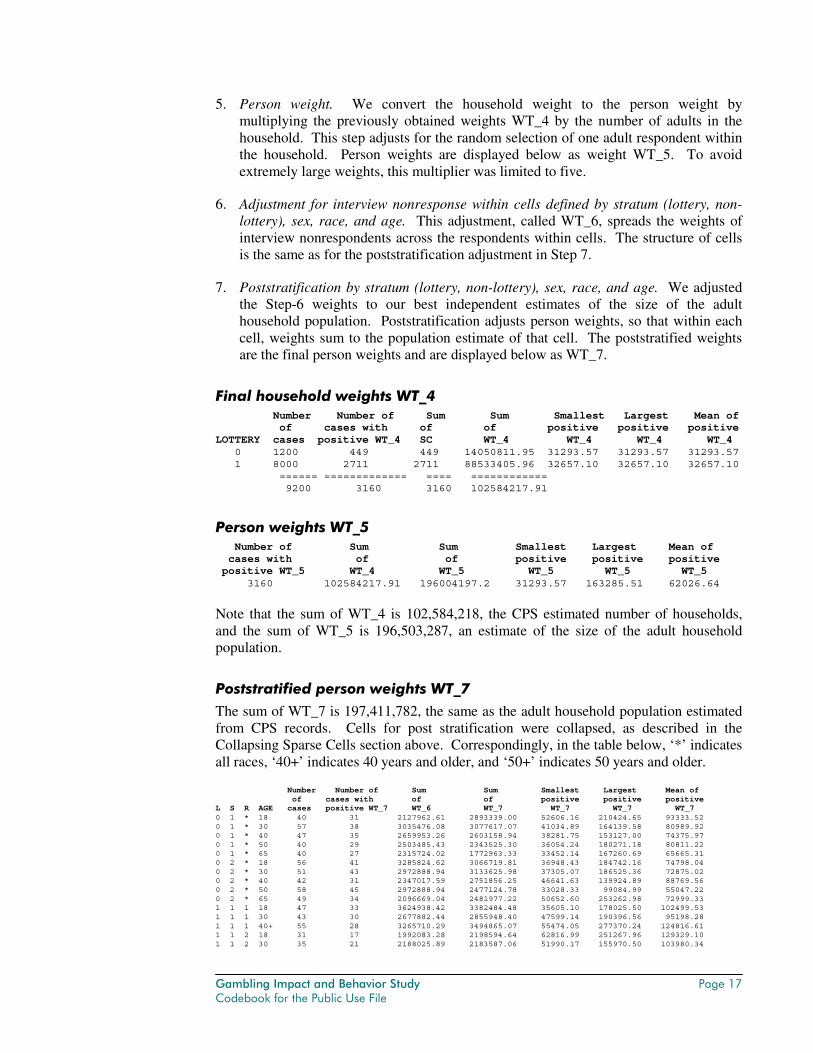
5. Person weight. We convert the household weight to the person weight by multiplying the previously obtained weights WT_4 by the number of adults in the household. This step adjusts for the random selection of one adult respondent within the household. Person weights are displayed below as weight WT_5. To avoid extremely large weights, this multiplier was limited to five.
6. Adjustment for interview nonresponse within cells defined by stratum (lottery, non-lottery), sex, race, and age. This adjustment, called WT_6, spreads the weights of interview nonrespondents across the respondents within cells. The structure of cells is the same as for the poststratification adjustment in Step 7.
7. Poststratification by stratum (lottery, non-lottery), sex, race, and age. We adjusted the Step-6 weights to our best independent estimates of the size of the adult household population. Poststratification adjusts person weights, so that within each cell, weights sum to the population estimate of that cell. The poststratified weights are the final person weights and are displayed below as WT_7.
Final household weights WT_4 Number Number of Sum Sum Smallest Largest Mean of of cases with of of positive positive positive LOTTERY cases positive WT_4 SC WT_4 WT_4 WT_4 WT_4 0 1200 449 449 14050811.95 31293.57 31293.57 31293.57 1 8000 2711 2711 88533405.96 32657.10 32657.10 32657.10 ====== ============= ==== ============ 9200 3160 3160 102584217.91
Person weights WT_5 Number of Sum Sum Smallest Largest Mean of cases with of of positive positive positive positive WT_5 WT_4 WT_5 WT_5 WT_5 WT_5 3160 102584217.91 196004197.2 31293.57 163285.51 62026.64
Note that the sum of WT_4 is 102,584,218, the CPS estimated number of households, and the sum of WT_5 is 196,503,287, an estimate of the size of the adult household population.
Poststratified person weights WT_7
The sum of WT_7 is 197,411,782, the same as the adult household population estimated from CPS records. Cells for post stratification were collapsed, as described in the Collapsing Sparse Cells section above. Correspondingly, in the table below, ‘*’ indicates all races, ‘40+’ indicates 40 years and older, and ‘50+’ indicates 50 years and older.
Number Number of Sum Sum Smallest Largest Mean of of cases with of of positive positive positive L S R AGE cases positive WT_7 WT_6 WT_7 WT_7 WT_7 WT_7 0 1 * 18 40 31 2127962.61 2893339.00 52606.16 210424.65 93333.52 0 1 * 30 57 38 3035476.08 3077617.07 41034.89 164139.58 80989.92 0 1 * 40 47 35 2659953.26 2603158.94 38281.75 153127.00 74375.97 0 1 * 50 40 29 2503485.43 2343525.30 36054.24 180271.18 80811.22 0 1 * 65 40 27 2315724.02 1772963.33 33452.14 167260.69 65665.31 0 2 * 18 56 41 3285824.62 3066719.81 36948.43 184742.16 74798.04 0 2 * 30 51 43 2972888.94 3133625.98 37305.07 186525.36 72875.02 0 2 * 40 42 31 2347017.59 2751856.25 46641.63 139924.89 88769.56 0 2 * 50 58 45 2972888.94 2477124.78 33028.33 99084.99 55047.22 0 2 * 65 49 34 2096669.04 2481977.22 50652.60 253262.98 72999.33 1 1 1 18 47 33 3624938.42 3382484.48 35605.10 178025.50 102499.53 1 1 1 30 43 30 2677882.44 2855948.40 47599.14 190396.56 95198.28 1 1 1 40+ 55 28 3265710.29 3494865.07 55474.05 277370.24 124816.61 1 1 2 18 31 17 1992083.28 2198594.64 62816.99 251267.96 129329.10 1 1 2 30 35 21 2188025.89 2183587.06 51990.17 155970.50 103980.34
Page 18 Gambling Impact and Behavior Study Codebook for the Public Use File
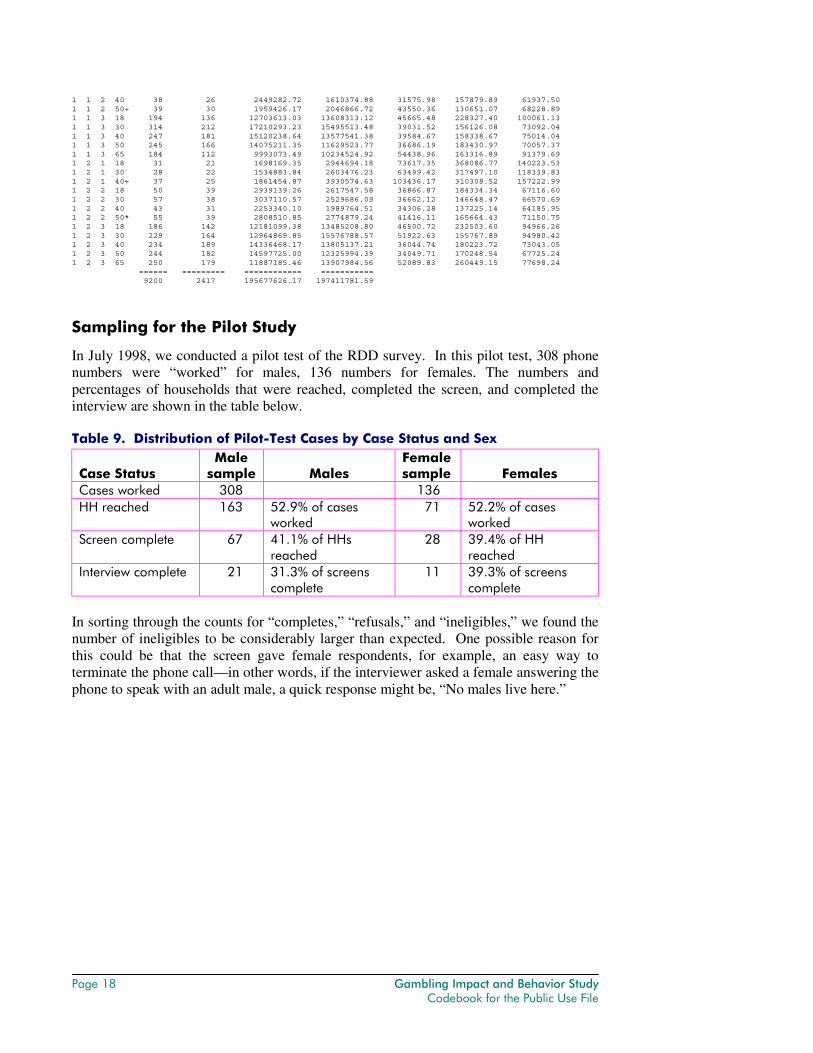
1 1 2 40 38 26 2449282.72 1610374.88 31575.98 157879.89 61937.50 1 1 2 50+ 39 30 1959426.17 2046866.72 43550.36 130651.07 68228.89 1 1 3 18 194 136 12703613.03 13608313.12 45665.48 228327.40 100061.13 1 1 3 30 314 212 17210293.23 15495513.48 39031.52 156126.08 73092.04 1 1 3 40 247 181 15120238.64 13577541.38 39584.67 158338.67 75014.04 1 1 3 50 245 166 14075211.35 11629523.77 36686.19 183430.97 70057.37 1 1 3 65 184 112 9993073.49 10234524.92 54438.96 163316.89 91379.69 1 2 1 18 31 21 1698169.35 2944694.18 73617.35 368086.77 140223.53 1 2 1 30 28 22 1534883.84 2603476.23 63499.42 317497.10 118339.83 1 2 1 40+ 37 25 1861454.87 3930574.63 103436.17 310308.52 157222.99 1 2 2 18 50 39 2939139.26 2617547.58 36866.87 184334.34 67116.60 1 2 2 30 57 38 3037110.57 2529686.09 36662.12 146648.47 66570.69 1 2 2 40 43 31 2253340.10 1989764.51 34306.28 137225.14 64185.95 1 2 2 50* 55 39 2808510.85 2774879.24 41416.11 165664.43 71150.75 1 2 3 18 186 142 12181099.38 13485208.80 46500.72 232503.60 94966.26 1 2 3 30 229 164 12964869.85 15576788.57 51922.63 155767.89 94980.42 1 2 3 40 234 189 14336468.17 13805137.21 36044.74 180223.72 73043.05 1 2 3 50 244 182 14597725.00 12325994.39 34049.71 170248.54 67725.24 1 2 3 65 250 179 11887185.46 13907984.56 52089.83 260449.15 77698.24 ====== ========= ============ =========== 9200 2417 195677626.17 197411781.59
Sampling for the Pilot Study
In July 1998, we conducted a pilot test of the RDD survey. In this pilot test, 308 phone numbers were “worked” for males, 136 numbers for females. The numbers and percentages of households that were reached, completed the screen, and completed the interview are shown in the table below.
Table 9. Distribution of Pilot-Test Cases by Case Status and Sex
Case Status Male
sample Males Female sample Females
Cases worked 308 136 HH reached 163 52.9% of cases
worked 71 52.2% of cases
worked Screen complete 67 41.1% of HHs
reached 28 39.4% of HH
reached Interview complete 21 31.3% of screens
complete 11 39.3% of screens
complete In sorting through the counts for “completes,” “refusals,” and “ineligibles,” we found the number of ineligibles to be considerably larger than expected. One possible reason for this could be that the screen gave female respondents, for example, an easy way to terminate the phone call—in other words, if the interviewer asked a female answering the phone to speak with an adult male, a quick response might be, “No males live here.”
Gambling Impact and Behavior Study Page 19 Codebook for the Public Use File
References
Brick, M.J., Waksberg, J., Kulp, D., and Starer, A. (1995). “Bias in List-Assisted Telephone Surveys.” Public Opinion Quarterly 59(2), 218–235.
Bryant, B.E. (1975). “Respondent Selection in a Time of Changing Household Composition.” Journal of Marketing Research, Vol. XII, 129–35.
Cochran, W. (1977). Sampling Techniques. New York: Wiley.
Czaja, R., Blair, J., and Sebestik, J.P. (1982). “Respondent Selection in a Telephone Survey: A Comparison of Three Techniques.” Journal of Marketing Research, Vol. XIX, 381–85.
Keeter, S., and Fisher, K. (1997). “A Comparison of ‘Last Birthday’ and ‘Youngest Male/Oldest Female’ Respondent Selection Procedures.” Paper presented at the annual meeting of the American Association for Public Opinion Research, Norfolk, Virginia, May 1997.
Lessler, J., and Kalsbeek, W. (1992). Nonsampling Error in Surveys. New York: Wiley

Page 20 Gambling Impact and Behavior Study Codebook for the Public Use File
Gambling Impact and Behavior Study Page 21 Codebook for the Public Use File
3. SAMPLING REPORT FOR THE SURVEY OF ADULT PATRONS OF GAMBLING FACILITIES Amanda Palmer & Dean Gerstein
Facility Sample
The plan initially proposed by NORC for the main patron survey had been to draw a multistage probability sample of casino and pari-mutuel patrons, using revenue-based (or revenue-correlated) measures of size to select 6 pari-mutuel and 26 casino facilities at random, with probability proportional to size, from a geographically dispersed sample of states. The number of patrons to be interviewed was set at 512 (16 per facility), based on assuming problem and pathological gambling rates of approximately 20 percent of patrons after calculations using the previous literature. This approach also assumed that we would be able to begin facility recruitment in August and schedule the field interviewing period from September 15 to December 15 (concurrent with the adult RDD survey effort).
Subsequent to completion of the patron pilot survey, the Commission’s research subcommittee was unable to reach unanimous agreement on whether to proceed with the main survey, and the Research Subcommittee asked the Commission to convene a special meeting to consider the majority’s recommendation to proceed and the minority’s recommendation not to proceed. In October,1999, the Commission decided by a vote of six to two (one member not present) for NORC to proceed with the patron survey in accordance with a sample design described in the Majority Report of the Research Subcommittee and in cooperation with an independent observer selected by the Commission.
The Majority Report set the targets for the main patron survey at approximately 500 interviews in 30 gambling facilities in different regions of the country, with categorical targets (compared with completed interviews actually achieved) as follows:
• Lotteries: 170 interviews;
• NV & NJ casinos: 125 interviews;
• Riverboats: 65 interviews;
• Tribal casinos: 65 interviews;
• Pari-mutuel: 40 interviews;
• VLT/noncasino EGD: 40 interviews.
Along with the changes in design, there were changes in schedule. The delay in approval of the patron survey meant that the field period had to be postponed and shortened. The
Page 22 Gambling Impact and Behavior Study Codebook for the Public Use File
first patron interviews were not able to be performed until November 20, 1998, and the last had to be completed no later than January 15, 1999.
In order to carry out the required design under the new time contraints, NORC selected two Western states, three Mississippi River states, and three Northeastern states in which to collect data, and then, within them, drew random samples of gambling facilities as follows:
• 13 Southern and 4 Northern casinos in Nevada;
• 4 casinos in New Jersey;
• A lower Mississippi state: 7 riverboat casinos;
• An upper Mississippi state: 5 riverboat casinos;
• Indian casinos: 2 in a Western state, 2 in a Northeastern state, in a Mississippi state;
• Racetracks: 2 Eastern, 1 Midwestern, 1 Western;
• Lottery outlets: 8 in a Midwestern state (primary and alternate from each ZIP income quartile);
• Lottery and VLT: 13 in a Western state (primary and 2 alternates from each ZIP income quartile, 1 extra in highest quartile).
Although some facilities were selected as a backup wave, in view of the time constraints all 63 of the facilities were recruited from the outset. Nevertheless, due to the relatively slow rate of response to the request for cooperation and the need to schedule interviewing around holidays and other seasonal obstacles, we determined about midway through the field period that the target of 30 sites would be difficult to reach by the close of data collection and this would threaten the more critical target of 500 cases. Therefore, beginning in mid-December we increased the number of targeted cases per facility visited from 20 to 30; the average finally achieved was 25 interviews per facility.
Interviewing
Interviewing was accomplished at 21 of 61 facilities sampled (two of the sampled facilities turned out to be closed); most of which required three or more contacts to successfully recruit. Sixteen facilities refused to participate and recruitment of the others was discontinued at the point that we achieved the required number of interviews in the category and location to which the facility belonged. Completed interviews on a facility-by-facility basis were as follows:
Casinos Southwest (NV) 30 at Facility A 30 at Facility B 30 at Facility C Northeast (NJ) 30 at Facility D 29 at Facility E
Gambling Impact and Behavior Study Page 23 Codebook for the Public Use File
Riverboats 20 North Central 24 North Central 20 South Tribal 40 North Central 27 Northeast
Lottery Ticket Outlets, by income level of ZIP code (quartiles) 43 West (1Qt) 19 North Central (1Q) 21 North Central (1Q) 26 West (3Q) 29 North Central (3Q) 25 West (4Q)
VLT/EGD 19 West (2Q) 12 West (3Q)
Pari-mutuel 16 North Central 20 Northeast 20 West TOTAL for 21 facilities: 530 interviews
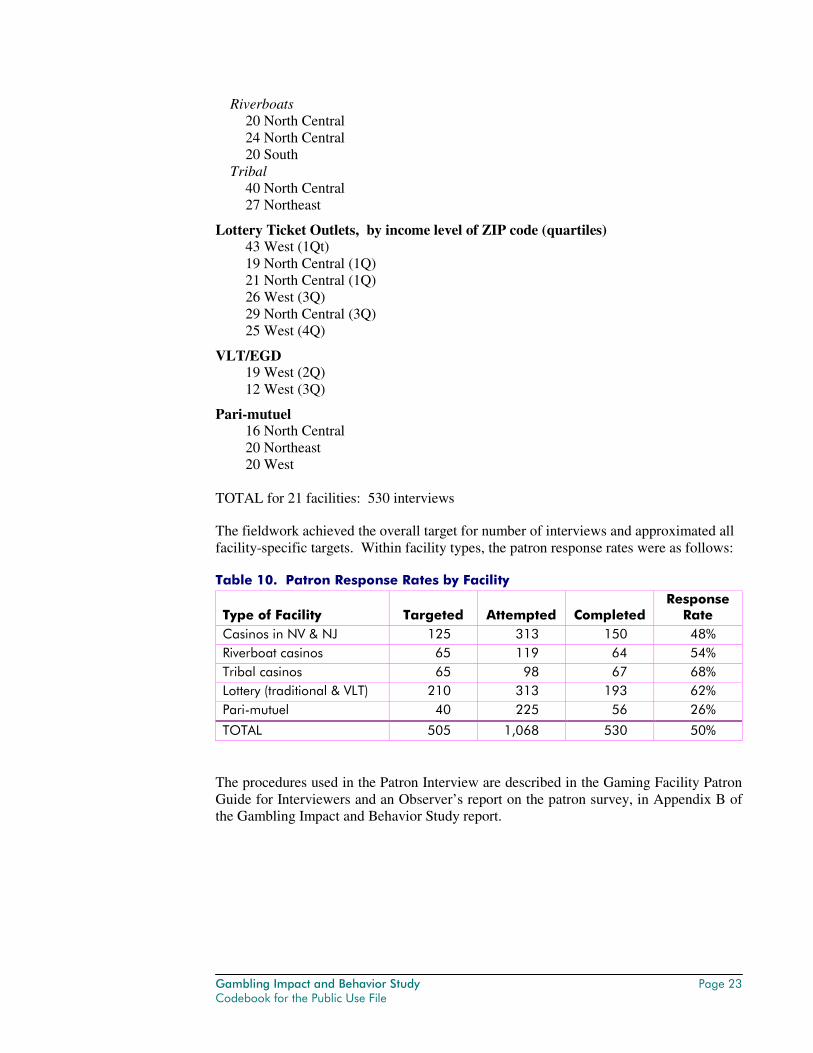
The fieldwork achieved the overall target for number of interviews and approximated all facility-specific targets. Within facility types, the patron response rates were as follows:
Table 10. Patron Response Rates by Facility
Type of Facility Targeted Attempted Completed Response
Rate Casinos in NV & NJ 125 313 150 48% Riverboat casinos 65 119 64 54% Tribal casinos 65 98 67 68% Lottery (traditional & VLT) 210 313 193 62% Pari-mutuel 40 225 56 26%
TOTAL 505 1,068 530 50%
The procedures used in the Patron Interview are described in the Gaming Facility Patron Guide for Interviewers and an Observer’s report on the patron survey, in Appendix B of the Gambling Impact and Behavior Study report.

Page 24 Gambling Impact and Behavior Study Codebook for the Public Use File
Gambling Impact and Behavior Study Page 25 Codebook for the Public Use File
4. COMBINING THE RDD AND PATRON SURVEY DATA Robert Johnson &Cindy Larison
Data File Combining RDD and Patron Survey Records
The SAS data file COMBOPUF.SD2 includes all records from the RDD survey (n = 2,417) together with the subset of “players”—individuals who gambled at a casino during the past year and/or were weekly lottery gamblers—from the Patron survey (n = 450). Thus, the total number of records equals 2,417 + 450 = 2,867. The variable SURVEY is coded 1 = RDD or 2 = Patron. There are 2,417 cases coded SURVEY = 1, and there are 450 cases coded SURVEY = 2. The remaining 80 cases in the Patron survey are also included, and are coded SURVEY=3. This brings the total sample size of this file to 2,947.
The combined file includes three weights: WTPOP is for use with the combined Patron plus RDD file (SURVEY=1 and 2; n=2,867) and is standardized to add up to the population size, i.e., about 197 million. WTSAMP is also for use with the combined Patron plus RDD file (SURVEY=1 and 2) and is standardized to add up to the sample size, or 2,867. The combined file represents about 197 million U.S. individuals aged 18 and older. RDDWGT is the weight for use with the RDD sample only (SURVEY=1; n=2,417). When using only the Patron survey cases (SURVEY= 2 and 3; n=530), no weight is needed.
Key Assumption in Combining Surveys
The key assumption is that the two surveys represent the same population, namely adults aged 18 and older in the U.S. In particular, the gambling and related behaviors and attributes of Patron survey respondents—individuals who were sampled at a small number of purposively selected locations in the U.S.—are assumed to be typical of persons with similar levels of casino and lottery gambling frequency in the U.S. general population. This assumption implies that—at least within strata defined by gambling frequency and other relevant variables—the weights already computed for respondents to the RDD survey (Engleman, L., “Weight computation for gambling RDD data,” 2/19/99) are also appropriate for respondents to the Patron survey.
To evaluate the key assumption, NORC will analyze differences in measured characteristics between RDD and Patron survey player respondents.
Construction of Weights: Poststratification Adjustment Cells
Another variable on COMBOPUF.SD2 is CELL, which is the “poststratification adjustment cell,” coded 1 to 23 and 69, for the combined Patron plus RDD file (SURVEY=1 and 2) only. 1641 of the 2417 RDD cases are coded 69, which means
Page 26 Gambling Impact and Behavior Study Codebook for the Public Use File
"nonplayer," i.e., neither gambled in a casino during past year nor gambled weekly in a lottery. None of the 450 Patron cases on the file are coded 69. The 80 patron survey cases that were nonplayers (i.e., 530–450) are not intended for use with this combined file, because these cases are probably not representative of nonplayers in the U.S.
We used three steps to construct weights (“WTPOP”) for cases in the combined file: First, the weights of the 1641 RDD nonplayers were not changed. Second, separately within each of the 23 player adjustment cells (codes 1 to 23), we assigned the mean weight of RDD respondents to each Patron survey respondent in the same cell. Third, separately within each of the 23 player adjustment cells (codes 1 to 23), we multiplied the weight of each RDD and Patron survey case by a constant equal to the population size of the cell—estimated using the RDD survey—divided by the sum of the weights within the cell.
These three steps ensured that Patron survey cases were weighted similarly to RDD cases within each adjustment cell and that the sum of the weights (“WTPOP”) equaled the estimated population size both within each adjustment cell and in the total sample. To compute the sample-standardized version of the weights (“WTSAMP”), we divided the weights of all cases by the mean weight across the total sample of 2867 cases.
The key decision in the construction of weights pertained to the definition of poststratification adjustment cells (“CELL”). The 23 subsamples or cells were defined based on two statistical criteria (e.g., Cochran, 1977; Lessler and Kalsbeek, 1992)—heterogeneity of cells and cell sample sizes.
Heterogeneity of cells The cells should be defined to be as dissimilar as possible with respect to the mean values of key response variables. Thus, we defined the 23 adjustment cells based primarily based on measures of past-year casino and lottery gambling frequencies—variables known to be distributed differently in the RDD and Patron surveys—and secondarily based on age and sex of respondent.
Cell sample sizes
Each cell should contain at least about 15 sample cases in the survey that is being adjusted, i.e., the Patron survey.
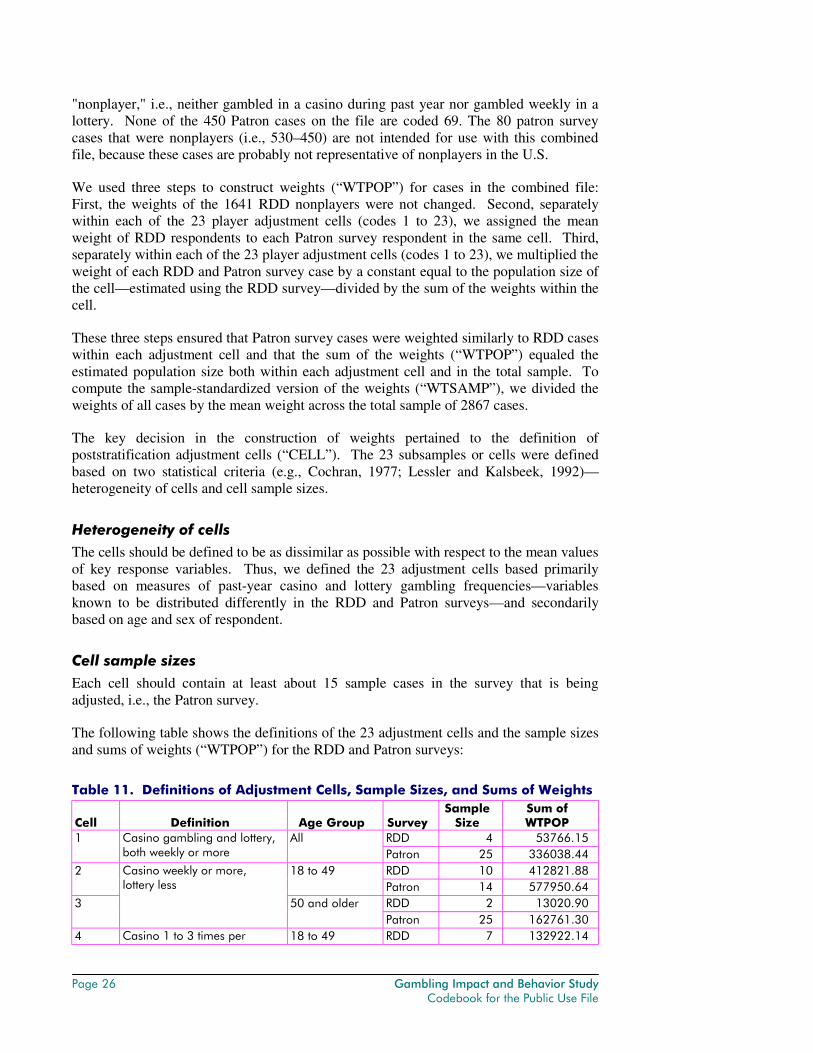
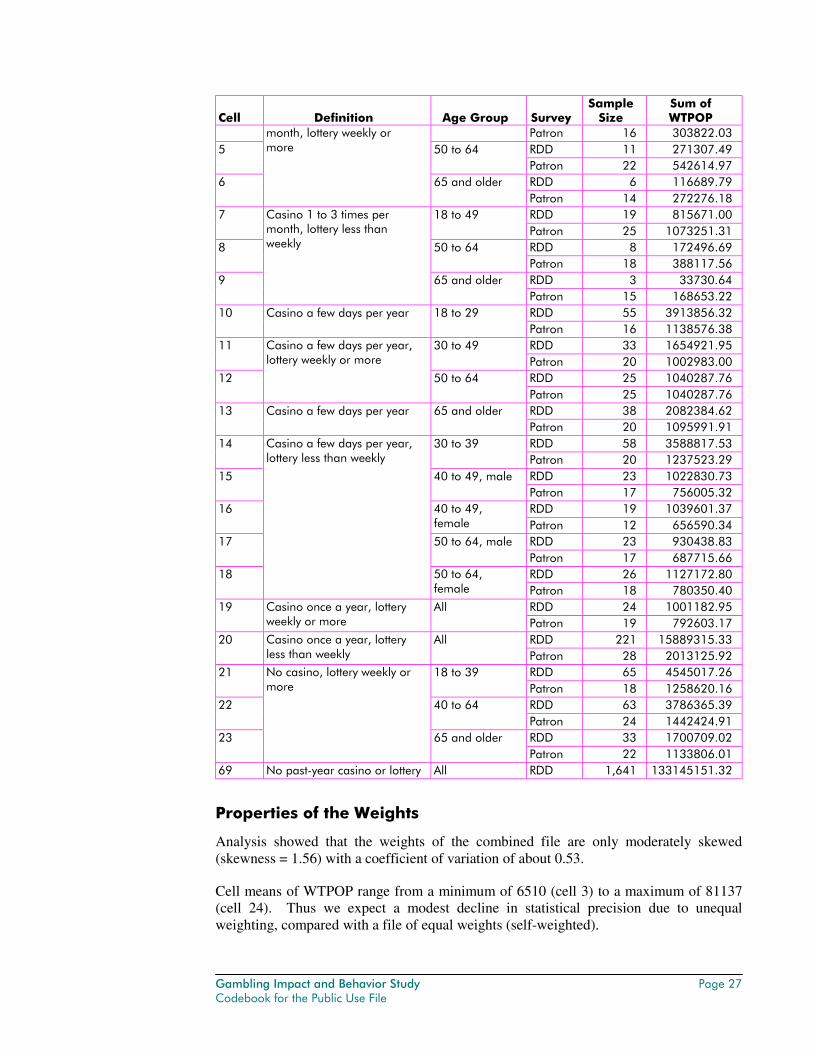
The following table shows the definitions of the 23 adjustment cells and the sample sizes and sums of weights (“WTPOP”) for the RDD and Patron surveys:
Table 11. Definitions of Adjustment Cells, Sample Sizes, and Sums of Weights
Cell Definition Age Group Survey Sample
Size Sum of WTPOP
RDD 4 53766.15 1 Casino gambling and lottery, both weekly or more
All Patron 25 336038.44 RDD 10 412821.88 2 18 to 49 Patron 14 577950.64 RDD 2 13020.90 3
Casino weekly or more, lottery less
50 and older Patron 25 162761.30
4 Casino 1 to 3 times per 18 to 49 RDD 7 132922.14
Gambling Impact and Behavior Study Page 27 Codebook for the Public Use File
Cell Definition Age Group Survey Sample
Size Sum of WTPOP
Patron 16 303822.03 RDD 11 271307.49 5 50 to 64 Patron 22 542614.97 RDD 6 116689.79 6
month, lottery weekly or more
65 and older Patron 14 272276.18 RDD 19 815671.00 7 18 to 49 Patron 25 1073251.31 RDD 8 172496.69 8 50 to 64 Patron 18 388117.56 RDD 3 33730.64 9
Casino 1 to 3 times per month, lottery less than weekly
65 and older Patron 15 168653.22 RDD 55 3913856.32 10 Casino a few days per year 18 to 29 Patron 16 1138576.38 RDD 33 1654921.95 11 30 to 49 Patron 20 1002983.00 RDD 25 1040287.76 12
Casino a few days per year, lottery weekly or more
50 to 64 Patron 25 1040287.76 RDD 38 2082384.62 13 Casino a few days per year 65 and older Patron 20 1095991.91 RDD 58 3588817.53 14 30 to 39 Patron 20 1237523.29 RDD 23 1022830.73 15 40 to 49, male Patron 17 756005.32 RDD 19 1039601.37 16 40 to 49,
female Patron 12 656590.34 RDD 23 930438.83 17 50 to 64, male Patron 17 687715.66 RDD 26 1127172.80 18
Casino a few days per year, lottery less than weekly
50 to 64, female Patron 18 780350.40
RDD 24 1001182.95 19 Casino once a year, lottery weekly or more
All Patron 19 792603.17 RDD 221 15889315.33 20 Casino once a year, lottery
less than weekly All
Patron 28 2013125.92 RDD 65 4545017.26 21 18 to 39 Patron 18 1258620.16 RDD 63 3786365.39 22 40 to 64 Patron 24 1442424.91 RDD 33 1700709.02 23
No casino, lottery weekly or more
65 and older Patron 22 1133806.01
69 No past-year casino or lottery All RDD 1,641 133145151.32
Properties of the Weights
Analysis showed that the weights of the combined file are only moderately skewed (skewness = 1.56) with a coefficient of variation of about 0.53.
Cell means of WTPOP range from a minimum of 6510 (cell 3) to a maximum of 81137 (cell 24). Thus we expect a modest decline in statistical precision due to unequal weighting, compared with a file of equal weights (self-weighted).

Page 28 Gambling Impact and Behavior Study Codebook for the Public Use File
Gambling Impact and Behavior Study Page 29 Codebook for the Public Use File
5. DEVELOPMENT OF THE QUESTIONNAIRES Dean Gerstein & Marianna Toce
The specific data NORC collected in the course of the Gambling Impact and Behavior Study were driven by a number of considerations: (1) the needs laid out by the National Gambling Impact Study Commission (NGISC) in its Request for Proposals; (2) a desire to collect data comparable in important dimensions to the 1975 national survey as well as other surveys of gambling behavior and attitudes; (3) the needs of other agencies working with NGISC to collect data pertinent to their research interests, namely, the National Institute on Drug Abuse (NIDA), the National Institute of Mental Health (NIMH), and the Department of Treasury; (4) needs in the field noted by NORC as well as our research partners and consultants, including Rachel Volberg, Henry Lesieur, William Thompson, Peter Reuter, Charles Clotfelter, Philip Cook, Randy Stinchfield, Howard Shaffer, and I. Nelson Rose; and (5) additional discussions with the Commission regarding its areas of interest, based on further review of the literature in the field and identification of gaps in the existing body of research.
Initial Stages of Development
The following survey instruments were reviewed by NORC and had some influence on the development of the our questionnaire:
• Commission on the Review of the National Policy Toward Gambling, 1976. Gambling in the United States. Part I: National Sample.
• R. Volberg, University of Montana, Missoula, 1998. Montana Gambling Questionnaire.
• H. Lesieur, 1993. The South Oaks Gambling Screen, Revised Edition.
• A. Cosby, Mississippi State University. 1995 U.S. Gaming and Gambling Survey.
• R. Stinchfield, 1997. DSM-IV Screen for Gambling Severity.
• National Opinion Research Center, 1998. General Social Survey.
• National Opinion Research Center, 1993. National Treatment Improvement Evaluation Study, Research Intake Questionnaire.
• Office of Applied Studies, Substance Abuse and Mental Health Services Administration. 1997 National Household Survey on Drug Abuse.
• University of Michigan, 1992. Composite International Diagnostic Interview. National Comorbidity Survey.
NORC first developed the questionnaire to be used in the random-digit dial (RDD) telephone survey (in English, translated, after finalization, into Spanish by a questionnaire translation specialist). This was designed as computer-assisted telephone interview (CATI) instrument, administered over the telephone by interviewers at
Page 30 Gambling Impact and Behavior Study Codebook for the Public Use File
computer workstations in NORC’s Lake Park Survey Data Center in Chicago. A CATI questionnaire, although developed initially on paper, is actually implemented as a computer program which generates screens of fixed text from which interviewers read questions and then key in response codes based on the answers. The program as developed on NORC’s Instrument Development System was designed to carry out simple or complex logical instructions, such as inserting or modifying question text to reflect specific answers to previous questions, monitoring responses in order to determine what to display to the interviewer within the sequence of potential questions (the alternative branches are usually called “skip patterns” or “pathing”), and assuring that responses from a question fit within accepted limits and was consistent with earlier responses.
We then developed two condensed and revised versions of the main survey instrument for use with paper and pencil. The data elements of these versions was identical, and included a subset of about two-thirds of the main survey items. The first of these modified instruments was a self-administered questionnaire for two types of respondents: those who were not able or willing to respond to the telephone survey but were willing to fill out a questionnaire on paper; and individuals in the non-telephone households, who were identified from a list of such known households maintained by NORC from our 1998 General Social Survey. The self-administered questions and instructions were reworded appropriately for this format, and the skip patterns were greatly simplified to minimize errors and make the survey easier and quicker to complete.
The second scaled-back version was for use in the patron-intercept survey, and was written for trained interviewers to administer in person to patrons of gaming facilities, which included casinos, lottery ticket sales and video lottery outlets, and race tracks. The simplified skip patterns and item content of the patron instrument were identical to the self-administered version, but this instrument retained the question wordings and interviewer instruction sets of the CATI instrument.
We designed the instruments to provide clear, unambiguous, and interpretable data on the measures of interest, including sociodemographic information, attitudes towards gambling, gambling history and related behaviors, and other relevant concerns, which we describe in detail below. In constructing the total instrument, the questionnaire development team considered sensitivity to context, potential order effects, the proper sequencing of chronological questions, means of avoiding primacy and recency effects for long lists of response options, the need for clear transitions between themes, the logic of filter and dependent questions, and minimization of response set biases.
NORC also designed the instrument to be respondent-friendly, with content, structure, and length designed to maximize cooperation and minimize questioning of no meaning to the respondent, while still collecting all of the information needed. The question items were designed to be clearly and unambiguously understood by persons with an eighth-grade level of education and vocabulary, with or without experience as a gambler. We invested substantial attention to details of item construction, pathing logic, and minimization of respondent burden, in the expectation that our respondents would be more likely to invest their own effort in giving thoughtful and accurate responses if they experienced the interview as a meaningful, logical, and constructive task.
One critical goal was that the telephone survey instrument would not take more than 60 minutes to complete even for persons responding to virtually all of the questions due to their very extensive gambling behavior and other pertinent experiences and conditions.
Gambling Impact and Behavior Study Page 31 Codebook for the Public Use File
We planned that most respondents would be able to skip over substantial parts of the instrument as inapplicable or redundant to their particular experience, and we found this to be the case. Our target time for the administration of the telephone questionnaire for those who did not gamble frequently was 30 minutes or less. We monitored timing carefully during our testing of the main instrument and during the initial stages of administration (discussed further below) to ensure that these time targets were met. The ease and speed with which respondents finished the questionnaire was even better than expected. The average administration time for all respondents was 25 minutes, and problem and pathological gamblers had a combined average timing of 40 minutes.
To field-test the instrument, we selected senior telephone interviewers to conduct 35 pilot interviews (32 adults and 3 youth) using our draft CATI instrument. In the past, we have found that experienced interviewing staff are particularly quick to identify and articulate the nature of problem questions, response choices, and procedures, and construct, critique, and test options for resolving these problems. To tap into this expertise, we involved them fully throughout the field-testing phase. We also sought input from the respondents themselves; interviewers asked respondents at the end of each pilot interview to comment on the questionnaire’s introduction, item wordings, and the content and flow of the instrument. The interviewers wrote out their results, summarizing the respondents’ comments during the interview and identifying problem questions and errors in the computerized instrument.
Following the completion of the pilot data collection, NORC conducted a debriefing with the Project Director, Telephone Center Coordinator, Telephone Center Supervisors, questionnaire writers, programming staff, and the interviewers who participated in the field test. During the debriefing, these personnel went through the questionnaire section by section, discussing the performance of each question during the field test. For example, we examined response frequencies to find items with high rates of missing or implausible responses. The interviewers provided many valuable insights into respondents’ reactions to, and uncertainty about, certain items.
Organization of the Instrument
We organized the questionnaire into the following sections:
• A. Demographic Information;
• B. Gambling Behavior (focusing on past year/last visit);
• C. Gambling-Related Attitudes, Motivations, and History;
• D. Problem Gambling Diagnostic Assessment;
• E. Gambling Treatment Experience;
• F. Family/Marital Status and Issues;
• G. Income and Financial Information;
• H. Criminal Activity and Status;
• J. Mental and General Health;
• K. Substance Use.
Page 32 Gambling Impact and Behavior Study Codebook for the Public Use File
This ordering of sections was determined for a number of reasons. First, it is important to ask very basic demographic information such as age, sex, and race/ethnicity immediately in case the interviewee breaks off from the interview before it is complete. These simple questions also serve to put the respondent at ease, and into a “question-answering mode” before sensitive topic areas are broached. The second section, Gambling Behavior, was the most complex section of the interview. In this section, we asked questions regarding games played, distance traveled, length of time spent gambling, details of gambling expenditures, and so forth, all of which we describe in detail below. Section B was followed by a complementary section—Gambling-Related Attitudes, Motivations, and History—which was less complex and more subjective, giving respondents a “breather” before the next, section which delved into gambling problems.
Depending on how much money respondents reported ever losing on wagers on any one day or over the course of a year, selected interviewees were then taken through Section D, the Problem Gambling Diagnostic Assessment. This instrument determined whether these interviewees had ever had gambling problems conforming to the definitions advanced by the DSM-IV criteria of the American Psychiatric Association. Section E, Gambling Treatment Experience, was asked of respondents who indicated having had one or more of these problems in their lifetimes. The section queried about whether the interviewee had ever been in gambling treatment and if so, the kind of treatment they received.
All respondents were then taken through Section F, Family/Marital Status and Issues, and Section G, Income and Financial Information. These sections were placed after Section D, since we asked certain gambling-focused questions in these sections only of respondents who had indicated some kind of gambling problems. Based on pilot test experience, we knew that some questions would be inappropriate and irritating to ask of nongambling or low-risk gamblers—for example, whether their gambling problems contributed to the divorce or separation of those respondents who reported such events in their lifetimes. Sections F and G were ordered as they were for no reason other than our finding that this placement allowed us to streamline the questionnaire to a certain extent; in other words, certain responses to items in Section F allowed us to skip respondents over certain questions in Section G, more so than if the sections were reversed.
The final three sections dealt with topics of a very sensitive nature, not always as obvious in relevance to the main topic of the survey; and we therefore placed these in the latter part of the questionnaire. Although we risked asking fewer respondents these questions due to break-offs during the course of an interview (which proved to be rare, partly as a result of meeting the timing objectives), we placed these sections where we did to take advantage of gradual trust-building that ordinarily develops between a skilled interviewer and their interviewee. Questions became more sensitive gradually—for example, we asked about money spent gambling in Sections B and C; divorce in Section F; income, debt, and bankruptcy in Section G; and trouble with the law, including arrests, incarceration, and probation or parole, in Section H.
Section J asked about physical and mental health problems, particularly signs of depression and mania, including (for some respondents) questions about levels of sexual desire and suicidal thoughts and actions. All respondents were asked the two screening questions for the depression instrument, but of those who responded affirmatively to one of these questions, only respondents who reported one or more gambling problems in their lives were asked the full instrument. Finally, Section K queries respondents on their
Gambling Impact and Behavior Study Page 33 Codebook for the Public Use File
use of alcohol and drugs; respondents indicating use beyond certain thresholds would then be asked questions to diagnose the presence of drug or alcohol dependence. We discuss each of these sections in detail below.
Section A: Demographic Information
For Section A, we asked most respondents 10 items seeking very basic personal information. Items were formulated to be as compatible as possible with the 1974 survey, including age, gender, race, education, importance of faith, and others. Most of these questions were taken from NORC’s General Social Survey, so that we could test for the representativeness of our sample population against this much larger sample. More detailed demographic information regarding marital status/history, household composition, and income were saved for later sections, so as not to probe into potentially sensitive areas before a level of trust has had a chance to develop between the interviewer and interviewee.
Section B: Gambling Behavior
Section B is the most lengthy and complicated of the instrument. In this section, we asked respondents in a modular fashion, by type of game, about their experiences with gambling, including particular games played and preferred; frequency of play; distance traveled from home; money taken and/or budgeted for; amounts spent, won, and lost; use of credit cards, ATM machines, and other sources of gambling funds; and other specific matters depending on the particular form of gambling being discussed.
We defined “gambling” as placing a bet on the outcome of a race or game of skill or chance, or playing a game—including for charity—in which one might win or lose money. Based on discussions with the Commission about its sphere of interest, we asked each respondent to include gambling within the United States only, including the District of Columbia and Puerto Rico, and to exclude gambling in territories such as Guam and the Virgin Islands, as well as on cruise ships, ferries, and other venues in international waters. We reminded respondents at various points throughout the section to include U.S. gaming only.
We began by developing a consecutive series of gate questions asking respondents whether they had played a particular type of game in their lifetimes, and if so, whether in the past year. Once the respondent completed the gate questions, she or he would then be asked about each game played in the past year. We wanted to be comparable to the 1974 survey; however, the dramatic changes the industry has undergone in the past 25 years obliged us to introduce a number of modifications. For example, most kinds of gambling were illegal in 1974, whereas today, most games are legal. In addition, and more significantly for the purposes of our questionnaire, the lines between various types of gaming have blurred, with hybrids being introduced on a regular basis (e.g., keno and video poker) and traditional types of gambling becoming available in a greater variety of venues (e.g., bingo can be played for money in churches, commercial bingo parlors, casinos, and on the Internet, and video gaming machines can be found in casinos, small businesses, racetracks, and on the Internet). Few games are exclusive to one venue, and similarly, seldom does a venue offer only one type of game. If we pursued the structure used in the 1974 survey too slavishly, we risked confusing participants or miring down in minute, obsolete, and somewhat trivial detail, as well as partially completed interviews due to an overlong questionnaire.
Page 34 Gambling Impact and Behavior Study Codebook for the Public Use File
The NORC team concluded that the best approach would first be to sort game types into the most readily distinguishable and policy-relevant types in 1998. We began with the game types of greatest stated interest to the Commission, namely, casinos and lotteries. However, even here, the boundaries are less than perfectly clear. We needed to decide whether to break out recent inventions that could be better categorized elsewhere, such as truck stops with 20 slot machines (which can legally hang a shingle identifying themselves as “casinos”) or the Internet-based U.S. Lottery run by the Coeur D’Alene Tribe of Idaho. Accessing a broad knowledge base regarding the exceptions and inclusions which might come up during the course of an interview was critical to this task.
We developed the modules by focusing on the largest reasonable grouping, while still asking for as much detail within that grouping as possible. This approach allowed us to keep the questionnaire from becoming too unwieldy, since we could keep the number of modules we took the respondent through to a minimum, while still allowing us to cover as many subtypes as we wished. However, what appeared at first glance to be a “largest reasonable grouping” often turned out not to be. Consequently, no precise logic could be utilized in categorizing games. In retrospect, we can say that the following logic was generally applied:
• If a type of gambling venue could be clearly defined and had a variety of types of games, we used this venue or facility for a module (e.g., casino, Internet, small business).
• If a clearly definable style of game could take place virtually anywhere, we used the style of game (e.g., private games of skill, unlicensed gambling, charitable gambling).
• If a clearly definable style of game could take place in a variety of locations and had a number of permutations that were individually of interest to us, we used the style of game (e.g., lottery, pari-mutuel).
• If a clearly definable style of game could take place in more than one clearly definable facility, and we ask about one or more of these facilities in another module, we chose to ask about the style of game in different modules (e.g., bingo).
• If a clearly definable style of game had a number of permutations and/or could be played in a variety of venues (such as slot machines or card games), OR if a clearly definable type of facility had several possible subtypes of facilities at which one can play a variety of games (e.g., “small business”), we placed the module strategically within the section so as to take advantage of the “filtering effect” of the prior modules. We used this technique for our cardroom, bingo, and small business modules.
If we chose to focus on a particular game type, but found that the facilities these game types are usually played in also incorporate types of games found in other, more traditional venues (such as pari-mutuel betting at racetracks, which can also have slot machines), we still wanted to know about respondents’ participation in these auxiliary games. Of course, this then raised the issue of how to ensure that respondents do not answer questions in a later module with information about the same gaming experience (e.g., answering questions about charitable bingo play in both the charitable and bingo modules). To minimize this risk, we reminded respondents frequently not to include any games they had already told us about.
Gambling Impact and Behavior Study Page 35 Codebook for the Public Use File
Because of this approach, as we mention above, the ordering of a number of the modules was critical, allowing a certain module to “catch” a subtype of gaming first, before the respondent could discuss it in another module. For example, due to the relatively rare occurrence of casino bingo play, and our belief that casinos patrons are characteristically different from bingo patrons, we decided to keep casino bingo in the casino module, and put all other types of bingo in a bingo module. Therefore, respondents were asked the casino module first, along with a question about casino bingo; they were then were asked in a later module about all other kinds of bingo play. The bingo module also acted as a filter, “catching” charitable bingo before the respondent was asked the charitable gaming module. In fact, we found very few games that could not be classified in a variety of ways. We do not argue that our chosen method of grouping the various kinds of gambling is the most desirable, and we wish to emphasize that while a great deal of effort was put forth by our highly knowledgeable and experienced research team in determining the most preferable method for doing this, we ultimately found that this exercise involved more art than science.
We chose to group our questions in the following modules, in the order indicated:
• Casino gaming, meaning gambling in a large hall with many different kinds of games (e.g., table games, machines, keno, bingo) on a riverboat or in a resort hotel.
• Parimutuel wagering at horse and dog tracks and jai alai frontons, as well as in off-track betting parlors/teletheaters. We also asked if respondents played other games in these venues, such as card games or slot machines. Respondents were asked about placing bets with a bookmaker in the section on unlicensed gambling, below.
• Lottery products such as Lotto and Powerball (multi-state games), daily numbers (pick-3, pick-4), and instant lottery scratch-off tickets. The 1974 survey asked about illegal numbers gambling, alternately called numbers, bolita, or policy. Since these forms are still available, we asked about them as well, but in the current survey they were included in our section on unlicensed gaming. We chose not to include video lottery terminals in this section since players often may not know if the machine they are playing is actually maintained by the state lottery board. Finally, respondents were asked not to include internet or other non-state-run lotteries in this battery of questions.
• Bingo, including charitable and commercial. Respondents were asked not to include bingo played at a casino.
• Charitable gaming, including pull-tabs and Las Vegas Nights. We indicated that respondents were not to include bingo or raffles for prizes other than money.
• Cardrooms, or any business with premises devoted to playing card games for money. Respondents were asked not to include casinos, racetracks, or charitable operations.
• Private games, including games of skill, such as dice, dominos, poker in someone’s home, pool, golf, or bowling.
• Small businesses such as stores, bars, restaurants, or similar locations with one or two kinds of games (usually slot machines, pull-tabs, video lottery machines, or video poker). Respondents were asked not to include places they have already told us about, such as cardrooms, casinos, or places that only sell lottery tickets; they were asked to include if they played such a game in a bingo hall, whether or not they played bingo there.
Page 36 Gambling Impact and Behavior Study Codebook for the Public Use File
• Unlicensed games, or types of gambling that are run like a business but probably without a license (not including any cases the respondent may have already told the interviewer about). Examples of these types of unlicensed gambling include participating in sports pools, buying a policy or playing unlicensed numbers games, playing in an unlicensed casino, or betting with a bookmaker.
• Internet gambling on sports, casino games, bingo, lottery, and others.
Finally, we asked respondents about Indian gaming, although these questions were not grouped into their own module. Early in the questionnaire development stage, we did include a separate module on Indian casinos, in response to the Commission’s explicit interest in the topic of Indian gaming. At the recommendation of one of the Research Subcommittee members, we looked into the possibility of expanding this module further to inquire about differences between Class II and Class III facilities (meaning Indian casinos versus other types of facilities, such as bingo halls). NORC’s research revealed that these “classes” of Indian gaming actually categorized types of games, not facilities. According to the Indian Gaming Regulatory Act (IGRA), Class II games include bingo and card games which are either permitted by the state or not explicitly prohibited, excluding banked card games such as baccarat and blackjack (generally, the common thread for Class II games is that the players are playing against one another for a common pot). Class III games include “electronic or electromechanical facsimiles of any game of chance or slot machines of any kind,” including “banking” games where the player plays against the house.
We became concerned about both the length and complication entailed by a revised “two-class” Indian module, and the subsequent burden on our respondents; NORC consulted Indian gaming expert I. Nelson Rose on the issue. Dr. Rose provided many useful comments and suggestions regarding the Class II/Class III distinction, particularly with regard to the many variations one finds in the real world among Indian facilities. It quickly became clear that to make a true distinction between these two classes of games, we would need to repeat every module individually, just focusing on Indian-run games. Our solution was to integrate a question about tribal sponsorship into the questions concerning last play in each of the appropriate modules (i.e., casino, bingo, charitable, cardroom, and small business), such that persons who played at one of these locations in the past year were asked whether the last time they played, the game was sponsored by an Indian tribe. In this way, we would later be able to separate for analytic purposes data about last play by Indian-sponsored games and non-Indian sponsored games.
Section C: Gambling-Related Attitudes, Motivations, and History
In Section C, we ask respondents for their opinion of the overall effect of legalized gambling on society, the importance of various factors in why they do or do not gamble, their favorite game, whom they gamble with, how they have spent their winnings, how they would have spent their losses, among others. We recognize that in spite of the game preferences noted by gamblers, Types D and E in particular, many engage in multiple forms of gambling. These forms are so interdependent that it is very difficult to fully separate out the influence of one form of gambling on the overall problem for some gamblers. However, we nonetheless asked respondents to voice their preference, which was cross-referenced with their spending patterns reported in Section B
Gambling Impact and Behavior Study Page 37 Codebook for the Public Use File
Section D: Problem Gambling Diagnostic Assessment
In 1976 the Commission on the Review of the National Policy Toward Gambling reported, based on a survey conducted the year before, that 0.77 percent of a national sample were “probable compulsive gamblers,” while 2.33 percent were “potential compulsive gamblers” (Commission, 1976). One important concern with comparing these rates with those of other studies is that the original survey’s findings were based on an 18-item instrument developed from a discriminant analysis comparing 274 members of Gamblers Anonymous and 239 church members” (Kallick, Suits, Dielman & Hybels, 1976). The items discriminated quite well between these two groups, but the membership of Gamblers Anonymous has changed considerably since 1974, when this analysis was conducted, and the control group, church members, is a difficult one to evaluate for continuity over time. Six years after the 1976 Commission report, the American Psychiatric Association first recognized pathological gambling as a disorder of impulse control in the revised third edition of its Diagnostic and Statistical Manual (DSM-III-R), and it was on these later criteria that the surveys discussed in the Shaffer et al. meta-analysis were based. It is not clear whether the 1974 instrument would yield comparable findings if administered today (Lesieur, 1998).
Most recently, rates of pathological gambling have been formulated using the South Oaks Gambling Screen (SOGS), the DSM-IV criteria, and the Diagnostic Interview Schedule (DIS). The South Oaks Gambling Screen (Lesieur & Blume, 1987; 1993) is a validated and reliable measure of pathological gambling. The original version of the SOGS was highly correlated with the DSM-III-R criteria and showed high internal consistency and high test-retest reliability. Originally developed to screen psychoactive substance abuse disorder patients for a gambling problem, it is the most commonly used instrument in epidemiological surveys of problem and pathological gambling. The more recent, revised SOGS-R is highly correlated with the DSM-IV criteria for adults seeking treatment for pathological gambling (Winters, Specker & Stinchfield, 1997, June). In its revised form, it has continued to be used in studies in Michigan (The Evaluation Center, 1997) and Connecticut (The WEFA Group, 1997).
The SOGS is not without critics. Some have found that, when compared with the DSM-IV criteria, the former overestimates the rate of problem gambling in the general population (Volberg, 1996). This is given support in the Shaffer et al. meta-analysis (1997), as studies using the SOGS had higher rates of pathological gambling than studies using the DSM-IV criteria. However, according to Volberg’s analysis (1996)of a survey based on the DSM-IV criteria developed for a survey of British casino patrons (Fisher, 1996), it is possible that the diagnostic threshold for pathological gambling defined in the DSM-IV may be too stringent for the purposes of a general epidemiological survey.
The DSM-IV identifies ten signs that may be present in gambling, and requires that five be present to permit the individual to be designated as a pathological gambler; this is usually called a “cutoff score” of five. The data on which these criteria and the cutoff score of five is based were generated in field trials using a clinical population of 453 pathological gamblers and substance abusers (Lesieur & Rosenthal, 1998). That study found there was no difference in disciminant power between a cutoff score of four or five, and its authors suggested that, if a cutoff score of five were to be adopted for pathological gambling, an additional category of problem gamblers be designated comprising individuals who met three or four of the DSM-IV criteria.. The DSM-IV Task Force of the American Psychiatric Association took a conservative stance and
Page 38 Gambling Impact and Behavior Study Codebook for the Public Use File
adopted the cutoff score of five or more criteria for diagnosis, but it did not act on the proposed problem gambling” criteria.
The guidelines from the National Gambling Impact Study Commission specified that the DSM-IV criteria be used, and that we explore the use of the recommended lower threshold to define gambling that is problematic to the individual. At the time we began our search for a suitable set of questions to implement the criteria (that is, to ask questions that would decide which and therefore how many of the DSM-IV criteria the respondent met), there were four instruments based on the DSM-IV. Fisher (1996), for example, read respondents each of the DSM-IV definitions of criteria with slight word changes and offered a five-point scale for agreement or disagreement with the self-applicability each item. This revision demonstrated highly significant item discriminations, good internal consistency, and significant construct validity. Volberg (1997) used a similar procedure (with a four-point scale) in Oregon, again showing good internal consistency, good criterion validity when compared with the SOGS, and significant construct validity.
A second instrument considered was the Diagnostic Interview Survey (DIS), suggested to us by NIMH partly because the instrument was based on criteria laid out in the DSM-IV. The entire DIS for DSM-IV had been recently field-tested in the general population, but the DIS version of the pathological gambling criteria had not been examined against a known group of pathological gamblers; hence, the psychometric properties of this measure were not known (Dhana Broser, Department of Psychiatry, Washington University School of Medicine, personal communication, February 8, 1998).
The third measure of pathological gambling, the Diagnostic Interview for Gambling Severity (DIGS) (Winters, Specker and Stinchfield, 1997), included a 21-item DSM-IV screen (two items per criterion). These items had higher internal consistency than the Fisher instrument, and both lifetime and past-year versions had undergone testing. Like the British and Volberg’s version, it demonstrates significant construct validity. In addition, it is highly correlated with the SOGS in the treatment population. However, the DIGS had not been tested on a general population sample; only a modified version had been tested.
The fourth instrument was a modified version of the DSM-IV (with 19 questions instead of 10 and modified for use over the telephone); this instrument had been compared with the SOGS in three populations: a treatment sample, a telephone hotline sample, and a general population sample (Stinchfield, 1997). Stinchfield determined that a 19-item version of the DSM-IV criteria had a higher Cronbach’s alpha than the 10-item DSM-IV screen in all three samples. Furthermore, this 19-question instrument was deemed to be more internally consistent than the SOGS in general population samples. Given the higher coefficient alpha of Stinchfield’s 19-item version of the DSM-IV criteria than the 10-item version, we proposed to use this in the general population survey.
As we explored this instrument further once we began constructing our general questionnaire, we found that some of the questions in this instrument appeared to have a timeframe of the past 12 months, while others appeared to refer to lifetime issues, and some were completely nonspecific. There was concern that using this instrument might lead to the same criticisms that were raised of the original SOGS. We decided to revise the questionnaire, framing each question in terms of “lifetime” or “ever,” and for those questions receiving a positive response, asking an additional question for past year. We
Gambling Impact and Behavior Study Page 39 Codebook for the Public Use File
made other refinements, such as adding a time specifier indicating that the problem has had a duration of at least 2 weeks, for many of the items. Since the instrument was no longer identical to that tested by Randy Stinchfield and colleagues, we field-tested the new instrument (the NODS; see Attachment B) for reliability and validity (see Attachment C for the Reliability Test Questionnaire used for the NODS, and Chapter 2 of the main volume of this report for discussion of the reliability and validity tests and results).
Section E: Gambling Treatment Experience
Respondents completed Section E if it was determined that in their lifetimes, they have had one or more of the DSM-IV-related problems discussed above. This section queried about whether the interviewee had ever been in gambling treatment, the kind of treatment received, age respondent first received help, and a couple questions regarding participation in Gamblers Anonymous.
Section F: Family/Marital Status and Issues
All respondents, regardless of gambling status, were then taken through Section F, which asked about marital status, marital history (e.g., divorces, separations, and whether gambling played a role in such events for persons who indicated gambling problems), household composition, if gambling by others in the household has troubled or bothered the interviewee in the last 12 months, and if anyone else in the household has complained about the interviewee’s gambling in the past year.
Section G: Income and Financial Information
All of our respondents then went on to Section G, where they were asked about their employment status, occupational, personal and household income, use of sick time and vacation time to gamble, past-year job loss, and questions about household budget, including amount spent on housing and gambling, household debt, and bankruptcy. Respondents who had indicated having one or more problems in their lifetimes were also asked whether their gambling had played in role in their missing nonvacation time from work or losing a job, and all respondents were asked whether their gambling, or the gambling of anyone in their household, has played a role in their debt or bankruptcy filing. Part of NORC’s originally contract was to estimate a cost to society from problem and pathological gambling using these and other related questions throughout the survey; the Commission determined that with the resources allotted, this would not be feasible, and asked that we simply determine the prevalence of these various dimensions of problems.
Section H: Criminal Activity and Status
Section H queries interviewees regarding any trouble they may have had with the law, including arrests, incarceration, and probation or parole. Questions about involvement with the criminal justice and mental health systems were partially based on the 1993 National Treatment Improvement Evaluation Study’s Research Intake Questionnaire, developed by NORC.
Page 40 Gambling Impact and Behavior Study Codebook for the Public Use File
Section J: Mental and General Health
Section J queried respondents about their general health, mental health, and use of mental health treatment in the past year. Respondents were then asked questions regarding symptoms of depression and mania, depending on certain criteria. All respondents were asked the two screening questions for the depression instrument. However, a respondent was only asked the mania screening questions if she or he had reported one or more gambling problems ever; similarly, only these respondents were asked the full depression instrument, provided they responded affirmatively to one or both of the two depression screening questions. We asked the two depression screening questions of the entire sample to obtain a baseline rate of depression in our sample; we only asked those persons who reported one or more gambling problems the entire depression instrument, as NIMH and the Commission were interested in correlating depression with gambling problems. Pathological gambling has been associated with major depression in the gambling literature (e.g., McCormick, Russo, Ramirez & Taber 1984; Specker et al. 1996).
The mania questions were only asked of persons who reported one or more gambling problems due to the DSM-IV exclusion that the gambling problems not be counted if they are the result of a manic episode. NORC developed a mania diagnostic instrument based on Kessler’s CIDI-UM. Unfortunately, due to a programming error in the computerized version of the instrument, all respondents who answered the mania screen—regardless of their responses—were then skipped over the remainder of the diagnostic instrument and on to the following section. However, it should be noted here that no empirical support exists for the mania exclusion. Furthermore, none of the 106 studies reviewed by Shaffer, Hall, and Vander Bilt (1997) considered the exclusion as part of their epidemiological study of pathological gambling. Although NORC collected limited data on manic signs, our view is that it is not methodologically sound to implement the manic episode exclusion until the absence of empirical support with clinical populations has been addressed.
Section K: Substance Use
Finally, Section K queries interviewees about their use of alcohol and drugs. Respondents indicating a certain threshold level of use of an individual drug were then asked questions, based on DSM-IV criteria as implemented in the National Household Survey on Drug Abuse, to evaluate to determine dependence on that drug. the prevalence of past-year dependence on alcohol, marijuana/hashish, cocaine/crack, stimulants (such as methamphetamine or amphetamines, used for non-medical purposes), and tranquilizers (such as Valium and Xanax, used for non-medical purposes). Nonmedical use of a substance on more than 5 days in the past 12 months was the “gate” to determine who would be asked dependence questions. We believed that a stricter gate would be appropriate for alcohol; to test this, we examined data from the National Household Survey on Drug Abuse, cross-tabulating dependent and nondependent persons against their past-year frequency of usage to determine the most appropriate cutoff. Our goal was to capture most of our alcohol-dependent respondents, while minimizing respondent burden. As a result, we modified the gate for alcohol to ask whether the respondent has used alcohol on at least 12 days in the past 12 months.
Gambling Impact and Behavior Study Page 41 Codebook for the Public Use File
Gambling Facility Patron Questionnaire and Self-Administered Questionnaire
Patron interviews were conducted at gambling sites via face-to-face interviews. The interviewer asked respondents questions from a paper questionnaire and filled in the responses. We developed the Patron Questionnaire (see Attachment E), as well as the Self-Administered Questionnaire (see Attachment D), to contain a subset of the RDD interview questions; the two instruments are virtually identical in terms of the information solicited, but differ in terms of who is administering the questionnaire. The length of the patron instrument is shorter than the RDD interview so as to be more suitable for administration on an intercept basis. where we would not have a second chance(as can readily happen in a telephone interview) to interview at a later time the respondent who might be willing but short of time Our goal was to produce a survey that averaged no longer than 20 minutes in length, and we obtained an average of 19 minutes
The reductions we implemented for these questionnaires are as follows:
• A. Demographic Information: We took out some education questions and items on religion.
• B. Gambling Behavior: In this section we chose to ask about the forms of greatest interest—namely, casinos, pari-mutuel betting, lottery play, and gaming in small business settings.
• C. Gambling-Related Attitudes, Motivations, and History: We ask respondents’ reasons for gambling, their favorite game, and their largest win or loss in a day.
• D. Problem Gambling Diagnostic Assessment: This section is critical to our questionnaire and was cut the least. We eliminated two questions concerning gambling problems that were not part of the DSM-IV scoring.
• E. Gambling Treatment Experience: We ask whether the respondent has ever received help for their gambling and where this help was received.
• F. Family/Marital Status and Issues: This section was cut substantially. We asked respondents’ marital status, and if they have ever been divorced, we asked if gambling played a role; we also asked respondents if they were living with a spouse, child(ren), and/or anyone with a gambling problem.
• G. Income and Financial Information This section was also cut substantially; we asked about respondents’ employment status, main job, months worked in the past year, past-year income, whether they have ever missed work to gamble, and if they have been fired, whether this was due to gambling. We also asked about additional income such as welfare or pension, their household size, monthly housing and gambling expenditures, and whether they have any gambling debts.
• H. Criminal Activity and Status: We ask about amount of money stolen, if any, and past arrests.
• J. Mental and General Health: We limited this section to general health, mental health treatment, and the gate questions for manic and depressive episodes.
• K. Substance Use: We asked frequency questions only (no dependence questions).
Page 42 Gambling Impact and Behavior Study Codebook for the Public Use File
References
American Psychiatric Association (1994). Diagnostic and Statistical Manual of Mental Disorders, Fourth Edition. Washington, DC: Author.
Breiling, J. (May 8, 1998). Email communication. On file with author.
Broser, D. (February 8, 1998.) Personal communication. Department of Psychiatry, Washington University School of Medicine.
Commission on the Review of the National Policy Toward Gambling (1976). Gambling in America. Washington, DC: US Government Printing Office.
Feigelman, W., Wallisch, L. & Lesieur, H.R. (1998). “Pathological Gambling and Substance Abuse.” American Journal of Public Health.
Fisher, S. (1996). “Gambling and Problem Gambling Among Casino Patrons.” Report to the British Casino Industry Consortium. Faculty of Human Sciences, University of Plymouth.
Kallick, M., Suits, D., Dielman, T. & Hybels, J. (1979). A Survey of American Gambling Attitudes and Behavior. Survey Research Center, Institute for Social Research, The University of Michigan.
Lesieur, H.R. (February 12, 1998). Personal communication via email; on file with author.
Lesieur, H.R. & Blume, S.B. (1993). “Revising the South Oaks Gambling Screen in different settings.” Journal of Gambling Studies, 9, 213-223.
Lesieur, H.R. & Blume, S.B. (1987). “The South Oaks Gambling Screen (the SOGS): A New Instrument for the Identification of Pathological Gamblers.” American Journal of Psychiatry, 144, 1184-1188.
Lesieur, H.R. & Rosenthal, R.J. (in press). “Analysis of pathological gambling.” In T.A. Widiger, A. Frances, H. Pincus & R. Ross (Eds.) Source book for the diagnostic and statistical manual, fourth edition: Volume four. Washington, D.C.: American Psychiatric Association.
McCormick, R.A., Russo, A.M., Ramirez, L.F. & Taber, J.I. (1984). “Affective disorders among pathological gamblers seeking treatment.” American Journal of Psychiatry, 141, 215-218.
Shaffer, H.J., Hall, M.N. & Vander Bilt, J. (1997). Estimating the prevalence of disordered gambling behavior in the United States and Canada: A meta-analysis. Cambridge, Mass: Division on Addiction, Harvard Medical School.
Stinchfield, R. (1997, May-June). “Reliability, validity, and classification accuracy of the South Oaks Gambling Screen (SOGS).” Paper presented at the 10th International Conference on Gambling and Risk-Taking, Montreal.
Volberg, R.A. (1997). Gambling and problem gambling in Oregon. Report to the Oregon Gambling Addiction Treatment Foundation, Roaring Spring, PA: Gemini Research.
Volberg, R.A. (1996). Gambling and problem gambling in New York: A 10-year replication survey, 1986 to 1996. Report to the New York Council on Problem Gambling. Roaring Spring, PA: Gemini Research.
The WEFA Group (1997). “A study concerning the effects of legalized gambling on the citizens of the state of Connecticut.” Prepared for the Division of Special Revenue, Department of Revenue Services, State of Connecticut.
Gambling Impact and Behavior Study Page 43 Codebook for the Public Use File
Winters, K., Specker, S., & Stinchfield, R. (1997, June). “Measuring DSM-IV symptoms for pathological gambling.” Paper presented at the 10th International Conference on Gambling and Risk-Taking, Montreal.

Page 44 Gambling Impact and Behavior Study Codebook for the Public Use File
Gambling Impact and Behavior Study Page 45 Codebook for the Public Use File
6. CONSOLIDATED QUESTIONNAIRE Marianna Toce, Dean Gerstein, and Angie Brittingham
A. DEMOGRAPHICS
A0_ Before we begin the interview, I need to ask you a few questions about yourself. The information you provide will help us give the National Commission a good understanding of how closely our respondents represent the U.S. population as a whole. First,
A1_ CODE WITHOUT ASKING QUESTION, UNLESS NOT OBVIOUS: I am required to ask whether you are male or female. Are you...
Male Female
A3_ Are you of Mexican, Puerto Rican, Cuban or any other Spanish-speaking
background? YES
NO A5_ Are you now attending any type of school?
YES NO GO TO A7_
A7_ What is the highest grade or year of school you have ever attended, even if
you did not complete that grade or year? NEVER ATTENDED SCHOOL 1ST THRU 8TH GRADE 9TH THRU 11TH GRADE 12TH GRADE TECHNICAL SCHOOL 1 THROUGH 3 YEARS COLLEGE 4 YEARS COLLEGE GRADUATE / PROFESSIONAL SCHOOL
A8_ ASK IF R IS NOT IN HIGH SCHOOL OR GED PROGRAM (A6_)
AND HIGHEST GRADE WAS 12 OR LESS: Did you ever receive either a high school diploma or a GED?
YES NO
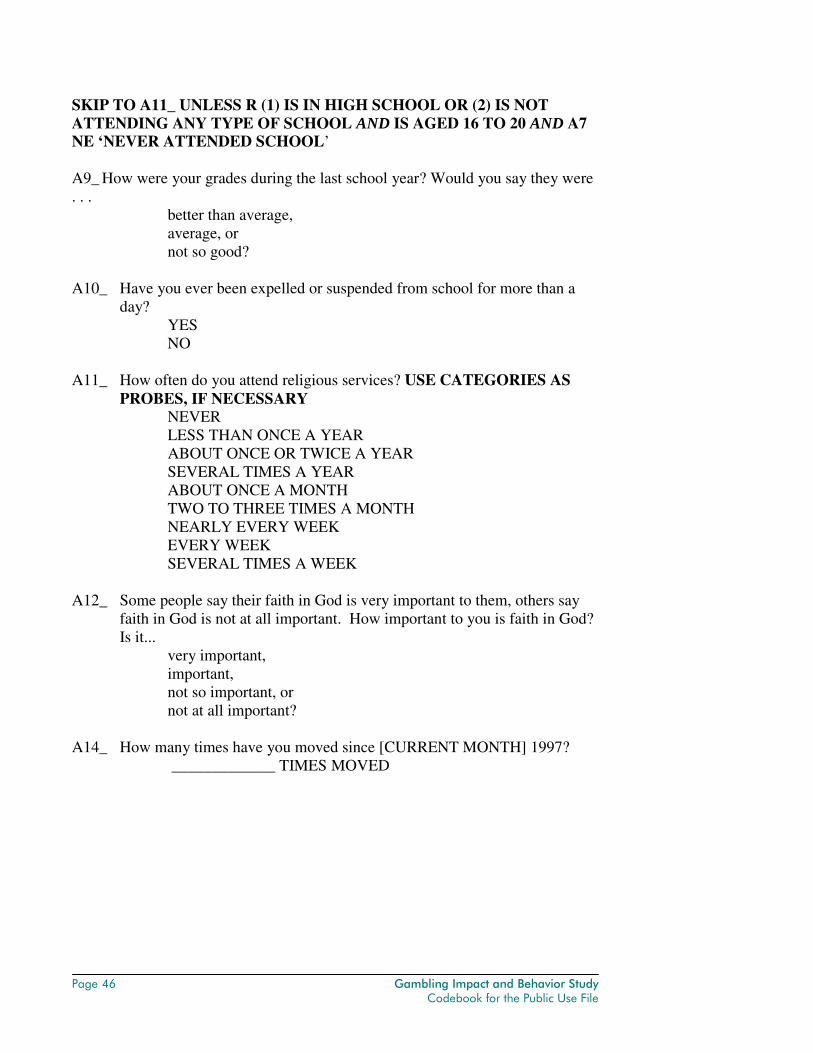
Page 46 Gambling Impact and Behavior Study Codebook for the Public Use File
SKIP TO A11_ UNLESS R (1) IS IN HIGH SCHOOL OR (2) IS NOT ATTENDING ANY TYPE OF SCHOOL AND IS AGED 16 TO 20 AND A7 NE ‘NEVER ATTENDED SCHOOL’ A9_ How were your grades during the last school year? Would you say they were . . .
better than average, average, or not so good?
A10_ Have you ever been expelled or suspended from school for more than a
day? YES NO
A11_ How often do you attend religious services? USE CATEGORIES AS
PROBES, IF NECESSARY NEVER LESS THAN ONCE A YEAR ABOUT ONCE OR TWICE A YEAR SEVERAL TIMES A YEAR ABOUT ONCE A MONTH TWO TO THREE TIMES A MONTH NEARLY EVERY WEEK EVERY WEEK SEVERAL TIMES A WEEK
A12_ Some people say their faith in God is very important to them, others say
faith in God is not at all important. How important to you is faith in God? Is it...
very important, important, not so important, or not at all important?
A14_ How many times have you moved since [CURRENT MONTH] 1997?
_____________ TIMES MOVED
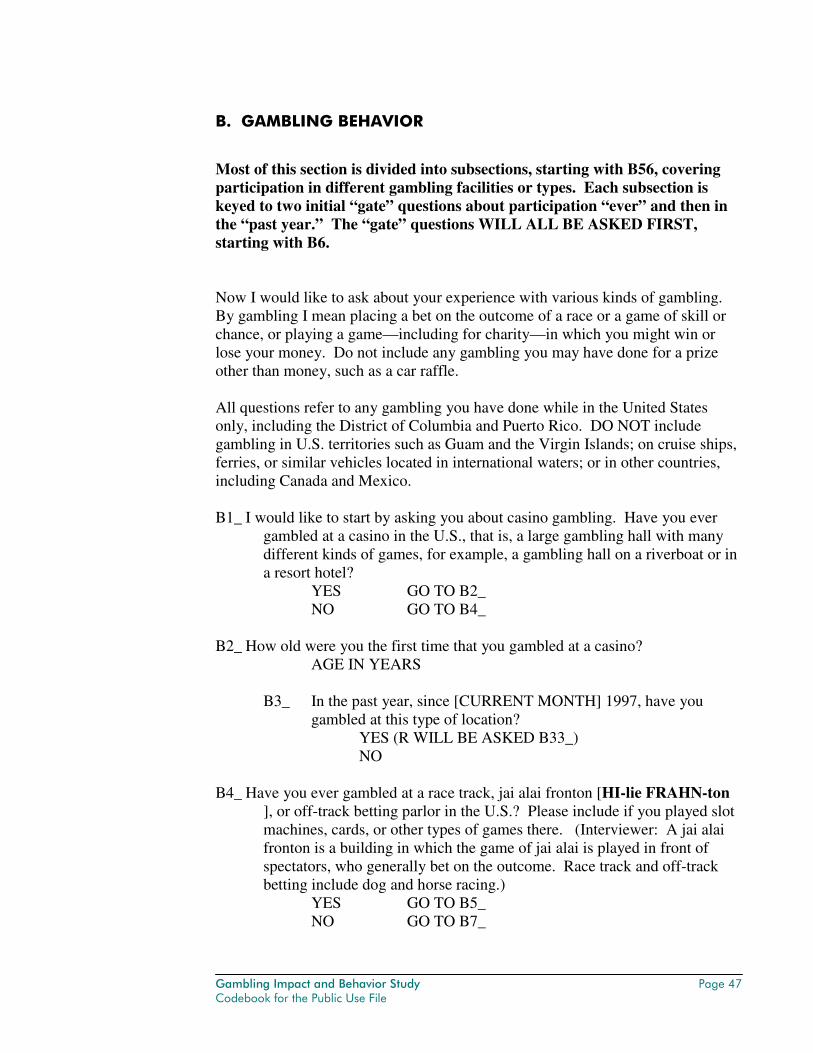
Gambling Impact and Behavior Study Page 47 Codebook for the Public Use File
B. GAMBLING BEHAVIOR
Most of this section is divided into subsections, starting with B56, covering participation in different gambling facilities or types. Each subsection is keyed to two initial “gate” questions about participation “ever” and then in the “past year.” The “gate” questions WILL ALL BE ASKED FIRST, starting with B6. Now I would like to ask about your experience with various kinds of gambling. By gambling I mean placing a bet on the outcome of a race or a game of skill or chance, or playing a game—including for charity—in which you might win or lose your money. Do not include any gambling you may have done for a prize other than money, such as a car raffle. All questions refer to any gambling you have done while in the United States only, including the District of Columbia and Puerto Rico. DO NOT include gambling in U.S. territories such as Guam and the Virgin Islands; on cruise ships, ferries, or similar vehicles located in international waters; or in other countries, including Canada and Mexico. B1_ I would like to start by asking you about casino gambling. Have you ever
gambled at a casino in the U.S., that is, a large gambling hall with many different kinds of games, for example, a gambling hall on a riverboat or in a resort hotel?
YES GO TO B2_ NO GO TO B4_
B2_ How old were you the first time that you gambled at a casino?
AGE IN YEARS
B3_ In the past year, since [CURRENT MONTH] 1997, have you gambled at this type of location?
YES (R WILL BE ASKED B33_) NO
B4_ Have you ever gambled at a race track, jai alai fronton [HI-lie FRAHN-ton
], or off-track betting parlor in the U.S.? Please include if you played slot machines, cards, or other types of games there. (Interviewer: A jai alai fronton is a building in which the game of jai alai is played in front of spectators, who generally bet on the outcome. Race track and off-track betting include dog and horse racing.)
YES GO TO B5_ NO GO TO B7_
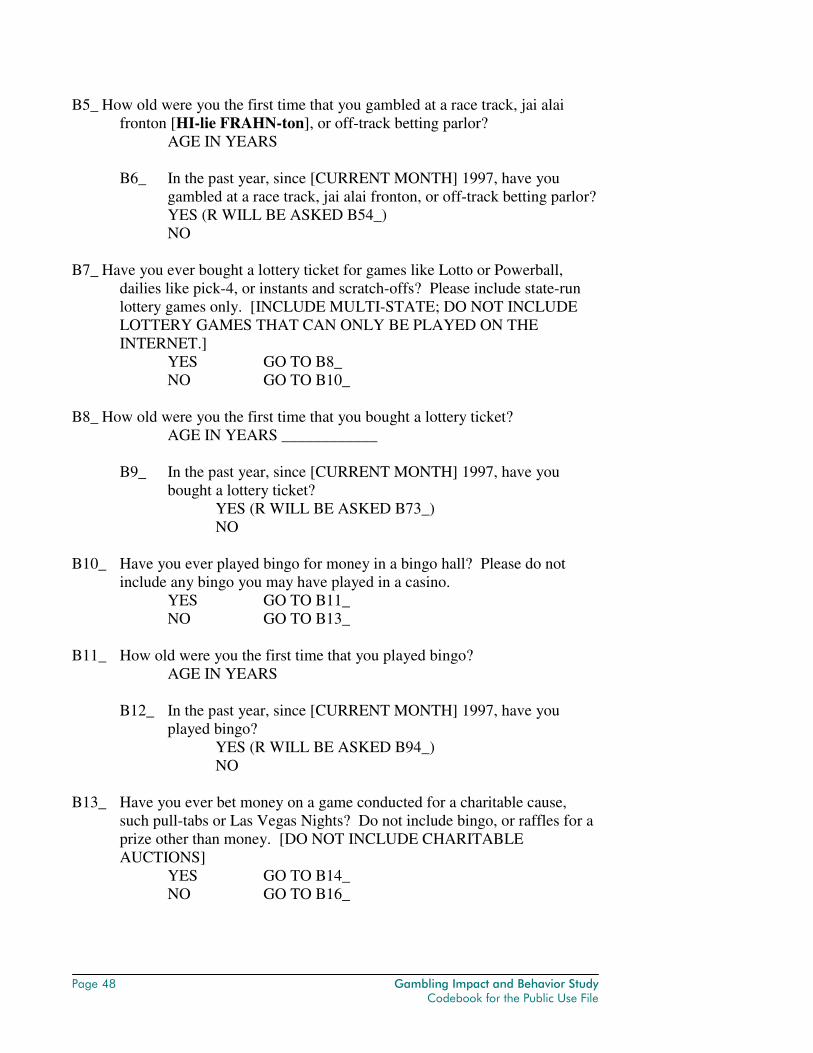
Page 48 Gambling Impact and Behavior Study Codebook for the Public Use File
B5_ How old were you the first time that you gambled at a race track, jai alai fronton [HI-lie FRAHN-ton], or off-track betting parlor?
AGE IN YEARS
B6_ In the past year, since [CURRENT MONTH] 1997, have you gambled at a race track, jai alai fronton, or off-track betting parlor? YES (R WILL BE ASKED B54_) NO
B7_ Have you ever bought a lottery ticket for games like Lotto or Powerball,
dailies like pick-4, or instants and scratch-offs? Please include state-run lottery games only. [INCLUDE MULTI-STATE; DO NOT INCLUDE LOTTERY GAMES THAT CAN ONLY BE PLAYED ON THE INTERNET.]
YES GO TO B8_ NO GO TO B10_
B8_ How old were you the first time that you bought a lottery ticket?
AGE IN YEARS ____________
B9_ In the past year, since [CURRENT MONTH] 1997, have you bought a lottery ticket?
YES (R WILL BE ASKED B73_) NO
B10_ Have you ever played bingo for money in a bingo hall? Please do not
include any bingo you may have played in a casino. YES GO TO B11_ NO GO TO B13_
B11_ How old were you the first time that you played bingo?
AGE IN YEARS
B12_ In the past year, since [CURRENT MONTH] 1997, have you played bingo?
YES (R WILL BE ASKED B94_) NO
B13_ Have you ever bet money on a game conducted for a charitable cause,
such pull-tabs or Las Vegas Nights? Do not include bingo, or raffles for a prize other than money. [DO NOT INCLUDE CHARITABLE AUCTIONS]
YES GO TO B14_ NO GO TO B16_
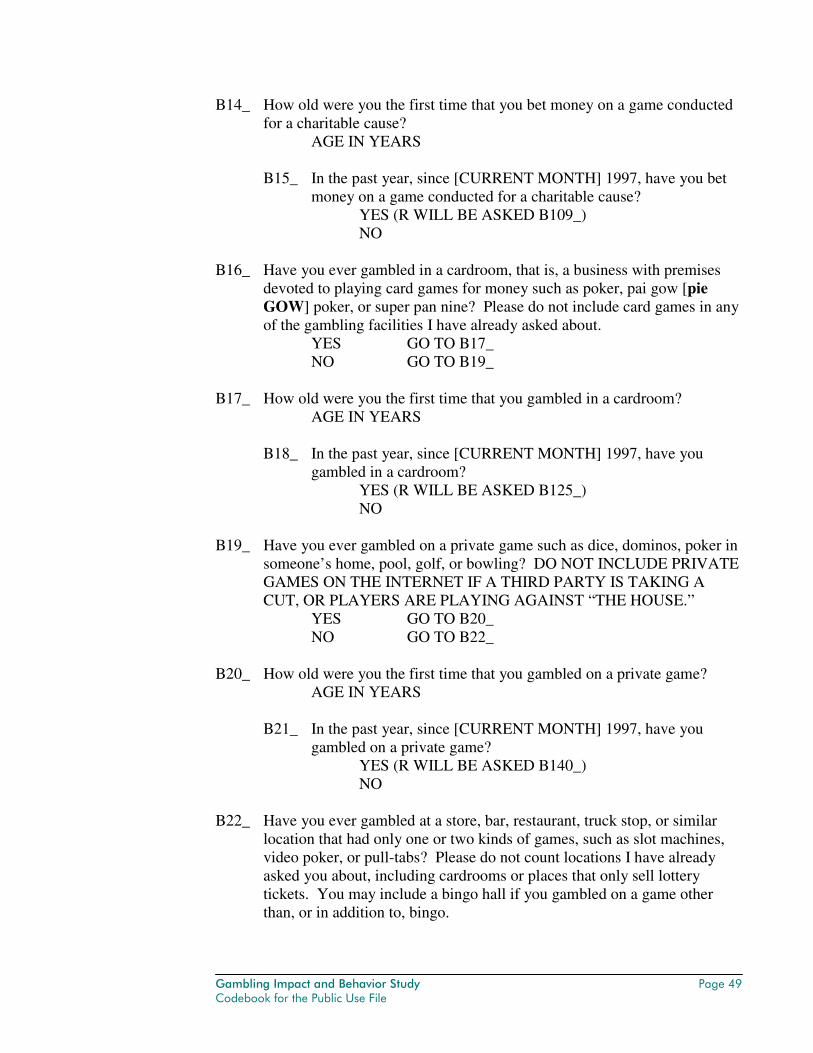
Gambling Impact and Behavior Study Page 49 Codebook for the Public Use File
B14_ How old were you the first time that you bet money on a game conducted for a charitable cause?
AGE IN YEARS
B15_ In the past year, since [CURRENT MONTH] 1997, have you bet money on a game conducted for a charitable cause?
YES (R WILL BE ASKED B109_) NO
B16_ Have you ever gambled in a cardroom, that is, a business with premises
devoted to playing card games for money such as poker, pai gow [pie GOW] poker, or super pan nine? Please do not include card games in any of the gambling facilities I have already asked about.
YES GO TO B17_ NO GO TO B19_
B17_ How old were you the first time that you gambled in a cardroom?
AGE IN YEARS
B18_ In the past year, since [CURRENT MONTH] 1997, have you gambled in a cardroom?
YES (R WILL BE ASKED B125_) NO
B19_ Have you ever gambled on a private game such as dice, dominos, poker in
someone’s home, pool, golf, or bowling? DO NOT INCLUDE PRIVATE GAMES ON THE INTERNET IF A THIRD PARTY IS TAKING A CUT, OR PLAYERS ARE PLAYING AGAINST “THE HOUSE.”
YES GO TO B20_ NO GO TO B22_
B20_ How old were you the first time that you gambled on a private game?
AGE IN YEARS
B21_ In the past year, since [CURRENT MONTH] 1997, have you gambled on a private game?
YES (R WILL BE ASKED B140_) NO
B22_ Have you ever gambled at a store, bar, restaurant, truck stop, or similar
location that had only one or two kinds of games, such as slot machines, video poker, or pull-tabs? Please do not count locations I have already asked you about, including cardrooms or places that only sell lottery tickets. You may include a bingo hall if you gambled on a game other than, or in addition to, bingo.
Page 50 Gambling Impact and Behavior Study Codebook for the Public Use File
YES GO TO B23_ NO GO TO B25_
B23_ How old were you the first time that you gambled at one of these locations
that had only one or two kinds of games? AGE IN YEARS
B24_ In the past year, since [CURRENT MONTH] 1997, have you
gambled at such a location that had only one or two kinds of games?
YES (R WILL BE ASKED B146_) NO
B25_ Now I’d like to talk with you about types of gambling that are run like a
business but probably without a license. Please do not include any gambling you’ve done that you’ve already told me about. Have you ever participated in a sports pool, placed a bet with a bookmaker, bought a policy or played nonlicensed numbers games, or played in a nonlicensed casino or “blind pig”?
YES GO TO B26_ NO GO TO B28_
B26_ How old were you the first time that you participated in one of these
gambling activities? AGE IN YEARS
B27_ In the past year, since [CURRENT MONTH] 1997, have you
participated in a sports pool, placed a bet with a bookmaker, bought a policy or played nonlicensed numbers games, or played in a nonlicensed casino or “blind pig”?
YES (R WILL BE ASKED B165_) NO
B28_ Next I’d like to ask you about placing wagers via computer on the Internet
and World Wide Web. Please include lottery games that can only be played in this fashion. Have you ever gambled on the Internet or World Wide Web? INCLUDE ALL WAGERS AND BETS PLACED WHILE R WAS PHYSICALLY IN THE U.S., REGARDLESS OF LOCATION OF THE GAMING COMPANY OR ITS COMPUTER SERVER. INCLUDE TRIBALLY RUN INTERNET GAMBLING. DO NOT INCLUDE GAMES PLAYED AMONG ACQUAINTANCES UNLESS A FEE IS CHARGED BY THE BUSINESS THAT IS HOSTING THE GAME.
YES GO TO B29_ NO GO TO B30_
Gambling Impact and Behavior Study Page 51 Codebook for the Public Use File
B29_ In the past year, since [CURRENT MONTH] 1997, have you gambled on the Internet or World-Wide-Web?
YES (R WILL BE ASKED B171_) NO
B30_ Lastly, I’d like to ask you about Indian or tribal gaming. We’d like to
learn about your experience in tribally run casinos, cardrooms, and bingo halls, as well as charitable gambling in places like a tribally run school. We’d also like you to include tribally sponsored games that you might find in a non-Indian facility in some states, for example, paper pull-tab dispensers in a bar or restaurant. Have you ever wagered or placed a bet on a tribally sponsored game or in a facility that you know was run by an Indian tribe?
YES GO TO B31_ NO GO TO B32_
B31_ In the past year, since [CURRENT MONTH] 1997, have you
gambled at an Indian or Tribal facility or on a tribally sponsored game?
YES NO
IF R HAS NEVER GAMBLED OR HAS NOT GAMBLED IN PAST YEAR, SKIP TO SECTION C B32_ Do you consider yourself a professional gambler?
YES NO
Casino Module IF B3=YES, ELSE GO TO NEXT MODULE B33_ In the past year, since [CURRENT MONTH] 1997, think about how often
you gambled at a casino in the U.S., that is, a large gambling hall with many different kinds of games, for example the kind of casino that you might find on a riverboat or in a resort hotel. Did you play...
about every day, one to three times a week, once or twice a month, a few days all year, only one day in the past year? GO TO B50_
B34_ ASK IF B31=YES In the past year, since [CURRENT MONTH] 1997,
did you gamble at a casino you knew to be owned by an Indian tribe? YES NO
Page 52 Gambling Impact and Behavior Study Codebook for the Public Use File
B35_ Now please think about the last time, the most recent day, when you
gambled at a casino. Was it located in Nevada, in Atlantic City, in Biloxi/Gulf Coast, Mississippi, on an Indian reservation, or in another location?
NEVADA GO TO B36_ ATLANTIC CITY GO TO B36_ BILOXI/GULF COAST, MISSISSIPPI GO TO B36_ ANOTHER LOCATION GO TO B35O_
B35O_ B36_ How far did you have to travel from home to get there: Was it less than
10 miles, between 10 and 50 miles, more than 50 but not more than 250 miles, or more than 250 miles?
LESS THAN 10 MILES BETWEEN 10 AND 50 MILES MORE THAN 50 MILES BUT NOT MORE THAN 250 MILES MORE THAN 250 MILES
B37_ On that day, did you gamble there for
less than two hours, two to four hours, five to ten hours, or more than ten hours?
B38_ Did you spend most of your time on one kind of game or gambling
activity? YES GO TO B39_ NO GO TO B40_
B39_ Was the game you spent most of your time at a table game like blackjack
or craps, a machine game like a slot machine or video poker, a keno-type game, a sports event, a horse or dog race, or something else?
TABLE GAME MACHINE KENO TYPE SPORTS DOG/HORSE RACE BETTING (OFF-TRACK BETTING) BINGO PULL-TABS
B40_ On that last day that you gambled at a casino, did you budget beforehand a
certain amount of money that was the most you were willing to lose? YES GO TO B41_ NO GO TO B42_
Gambling Impact and Behavior Study Page 53 Codebook for the Public Use File
B41_ How many dollars were the most you were willing to lose? $$ ________ I’ve written down $XXXX--is that correct?
B42_ On that day, how much money did you take to gamble with?
$$ ________ I’ve written down $XXXX--is that correct?
B43_ And on that day, after you started gambling, did you acquire more money to gamble with, for example, by using an ATM, credit card, or cashing a check? [DONOT INCLUDE WINNINGS]
YES GO TO B44_ NO GO TO B45_
B44_ Please tell me which of the following ways you got more money to
continue gambling. Did you ... CHECK ALL THAT APPLY cash a check? take money from a bank account using an ATM machine? buy chips with a credit card? get a credit card cash advance? use a line of credit from the casino? borrow money from a family member or friend?
B45_ IF GOT MONEY FROM AN ATM: Where was the ATM machine that you used? Was it
in the place where you were gambling, within walking distance of where you were gambling, or would someone have to drive to get there?
B46_ Did you come out ahead or behind on the money you wagered?
AHEAD GO TO B47A_ BEHIND GO TO B47B_ BROKE EVEN GO TO B48_
B47A_CD How much did you come out ahead? INTERVIEWER: CODE CATEGORY WITHOUT READING
under $100 $100 to $500 $501 to $1,000 $1,001 to $5,000 $5,001 to $10,000 $10,001 to $50,000 $50,001 to $100,000 $100,001 to $1 million over $1 million
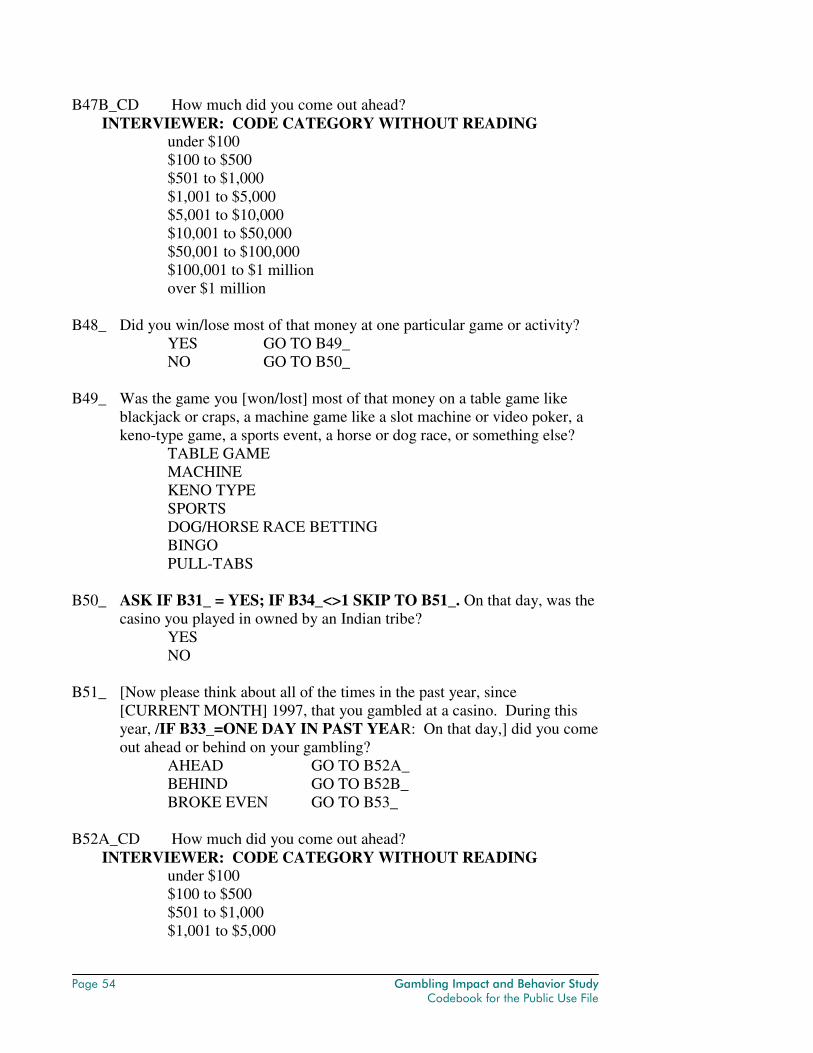
Page 54 Gambling Impact and Behavior Study Codebook for the Public Use File
B47B_CD How much did you come out ahead? INTERVIEWER: CODE CATEGORY WITHOUT READING
under $100 $100 to $500 $501 to $1,000 $1,001 to $5,000 $5,001 to $10,000 $10,001 to $50,000 $50,001 to $100,000 $100,001 to $1 million over $1 million
B48_ Did you win/lose most of that money at one particular game or activity?
YES GO TO B49_ NO GO TO B50_
B49_ Was the game you [won/lost] most of that money on a table game like
blackjack or craps, a machine game like a slot machine or video poker, a keno-type game, a sports event, a horse or dog race, or something else?
TABLE GAME MACHINE KENO TYPE SPORTS DOG/HORSE RACE BETTING BINGO PULL-TABS
B50_ ASK IF B31_ = YES; IF B34_<>1 SKIP TO B51_. On that day, was the
casino you played in owned by an Indian tribe? YES NO
B51_ [Now please think about all of the times in the past year, since
[CURRENT MONTH] 1997, that you gambled at a casino. During this year, /IF B33_=ONE DAY IN PAST YEAR: On that day,] did you come out ahead or behind on your gambling?
AHEAD GO TO B52A_ BEHIND GO TO B52B_ BROKE EVEN GO TO B53_
B52A_CD How much did you come out ahead? INTERVIEWER: CODE CATEGORY WITHOUT READING
under $100 $100 to $500 $501 to $1,000 $1,001 to $5,000
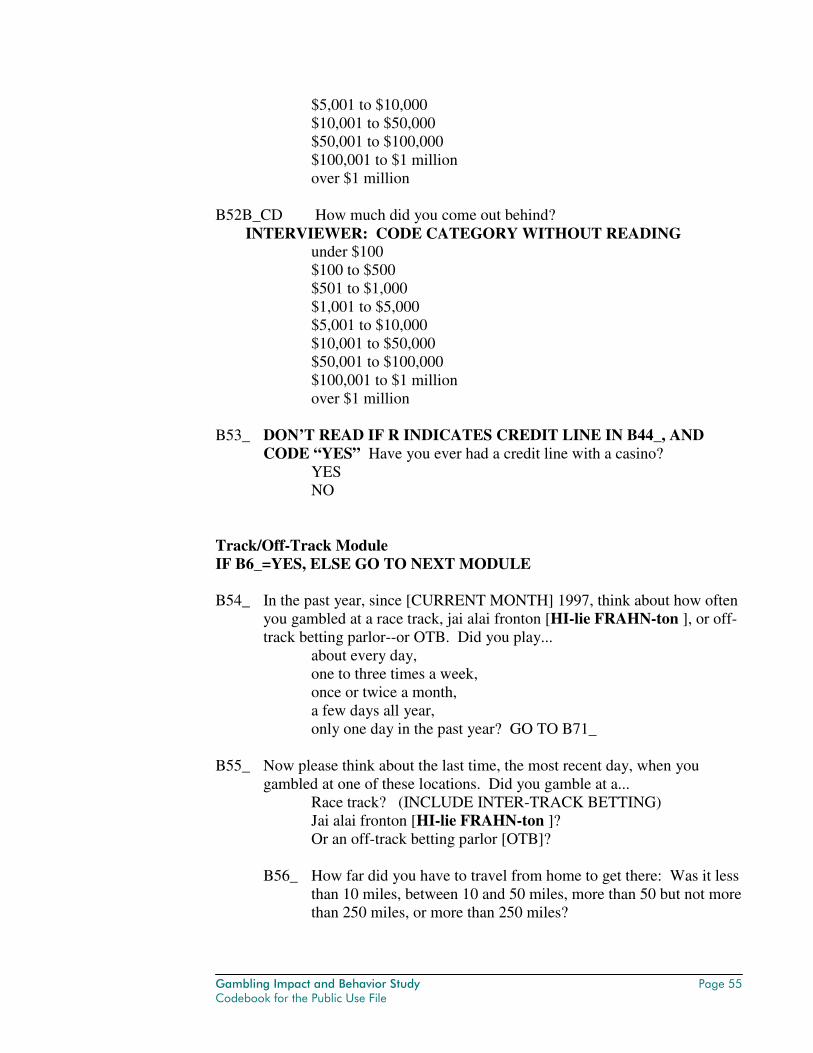
Gambling Impact and Behavior Study Page 55 Codebook for the Public Use File
$5,001 to $10,000 $10,001 to $50,000 $50,001 to $100,000 $100,001 to $1 million over $1 million
B52B_CD How much did you come out behind? INTERVIEWER: CODE CATEGORY WITHOUT READING
under $100 $100 to $500 $501 to $1,000 $1,001 to $5,000 $5,001 to $10,000 $10,001 to $50,000 $50,001 to $100,000 $100,001 to $1 million over $1 million
B53_ DON’T READ IF R INDICATES CREDIT LINE IN B44_, AND
CODE “YES” Have you ever had a credit line with a casino? YES NO
Track/Off-Track Module IF B6_=YES, ELSE GO TO NEXT MODULE B54_ In the past year, since [CURRENT MONTH] 1997, think about how often
you gambled at a race track, jai alai fronton [HI-lie FRAHN-ton ], or off-track betting parlor--or OTB. Did you play...
about every day, one to three times a week, once or twice a month, a few days all year, only one day in the past year? GO TO B71_
B55_ Now please think about the last time, the most recent day, when you
gambled at one of these locations. Did you gamble at a... Race track? (INCLUDE INTER-TRACK BETTING) Jai alai fronton [HI-lie FRAHN-ton ]? Or an off-track betting parlor [OTB]?
B56_ How far did you have to travel from home to get there: Was it less
than 10 miles, between 10 and 50 miles, more than 50 but not more than 250 miles, or more than 250 miles?
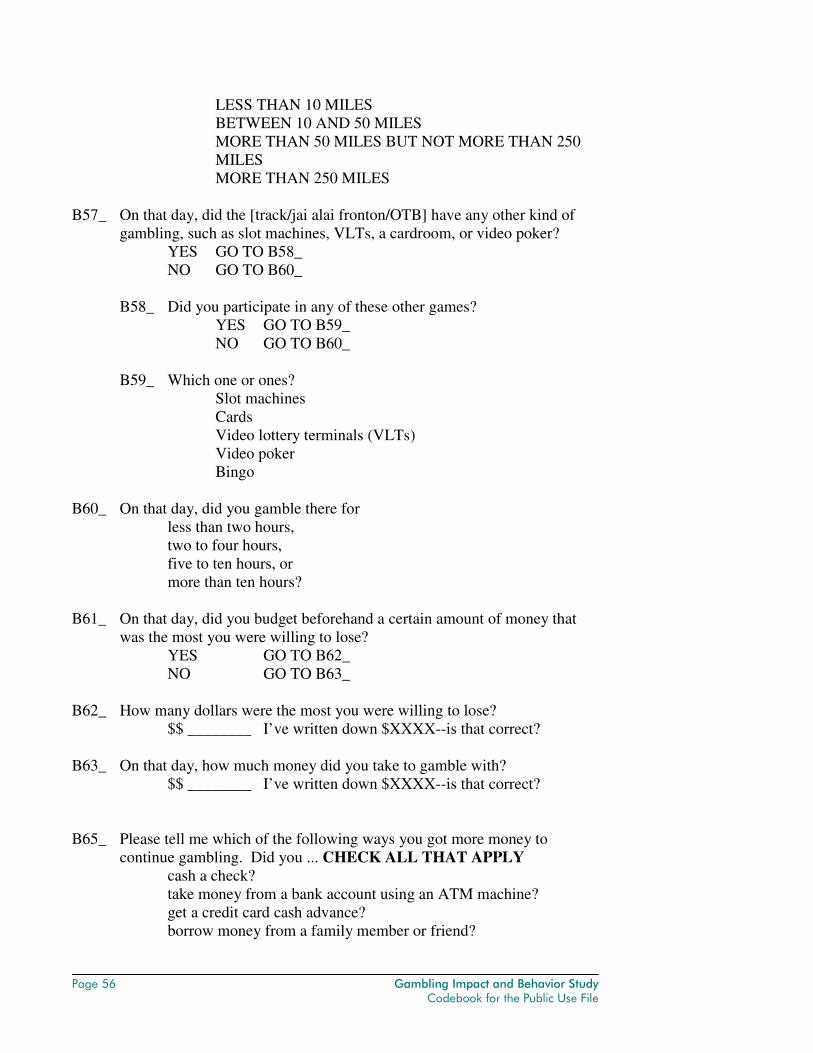
Page 56 Gambling Impact and Behavior Study Codebook for the Public Use File
LESS THAN 10 MILES BETWEEN 10 AND 50 MILES MORE THAN 50 MILES BUT NOT MORE THAN 250 MILES MORE THAN 250 MILES
B57_ On that day, did the [track/jai alai fronton/OTB] have any other kind of
gambling, such as slot machines, VLTs, a cardroom, or video poker? YES GO TO B58_ NO GO TO B60_
B58_ Did you participate in any of these other games?
YES GO TO B59_ NO GO TO B60_
B59_ Which one or ones?
Slot machines Cards Video lottery terminals (VLTs) Video poker Bingo
B60_ On that day, did you gamble there for
less than two hours, two to four hours, five to ten hours, or more than ten hours?
B61_ On that day, did you budget beforehand a certain amount of money that
was the most you were willing to lose? YES GO TO B62_ NO GO TO B63_
B62_ How many dollars were the most you were willing to lose?
$$ ________ I’ve written down $XXXX--is that correct? B63_ On that day, how much money did you take to gamble with?
$$ ________ I’ve written down $XXXX--is that correct?
B65_ Please tell me which of the following ways you got more money to
continue gambling. Did you ... CHECK ALL THAT APPLY cash a check? take money from a bank account using an ATM machine? get a credit card cash advance? borrow money from a family member or friend?
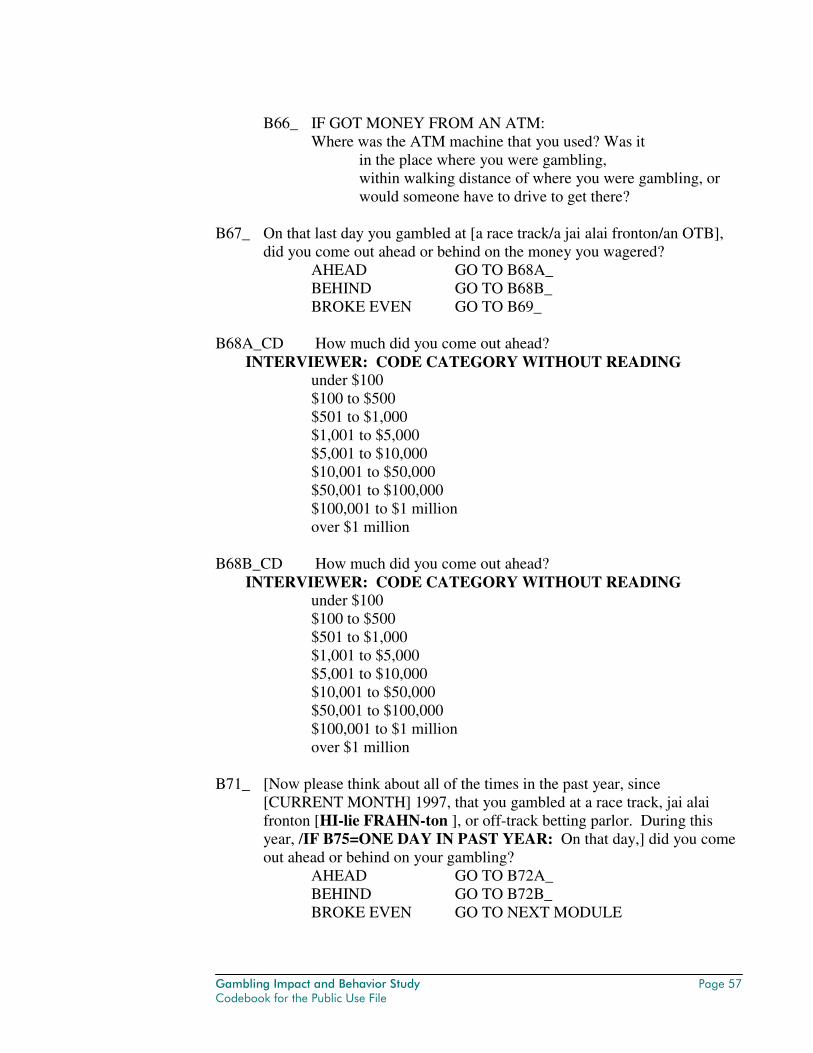
Gambling Impact and Behavior Study Page 57 Codebook for the Public Use File
B66_ IF GOT MONEY FROM AN ATM:
Where was the ATM machine that you used? Was it in the place where you were gambling, within walking distance of where you were gambling, or would someone have to drive to get there?
B67_ On that last day you gambled at [a race track/a jai alai fronton/an OTB],
did you come out ahead or behind on the money you wagered? AHEAD GO TO B68A_ BEHIND GO TO B68B_ BROKE EVEN GO TO B69_
B68A_CD How much did you come out ahead? INTERVIEWER: CODE CATEGORY WITHOUT READING
under $100 $100 to $500 $501 to $1,000 $1,001 to $5,000 $5,001 to $10,000 $10,001 to $50,000 $50,001 to $100,000 $100,001 to $1 million over $1 million
B68B_CD How much did you come out ahead? INTERVIEWER: CODE CATEGORY WITHOUT READING
under $100 $100 to $500 $501 to $1,000 $1,001 to $5,000 $5,001 to $10,000 $10,001 to $50,000 $50,001 to $100,000 $100,001 to $1 million over $1 million
B71_ [Now please think about all of the times in the past year, since
[CURRENT MONTH] 1997, that you gambled at a race track, jai alai fronton [HI-lie FRAHN-ton ], or off-track betting parlor. During this year, /IF B75=ONE DAY IN PAST YEAR: On that day,] did you come out ahead or behind on your gambling?
AHEAD GO TO B72A_ BEHIND GO TO B72B_ BROKE EVEN GO TO NEXT MODULE
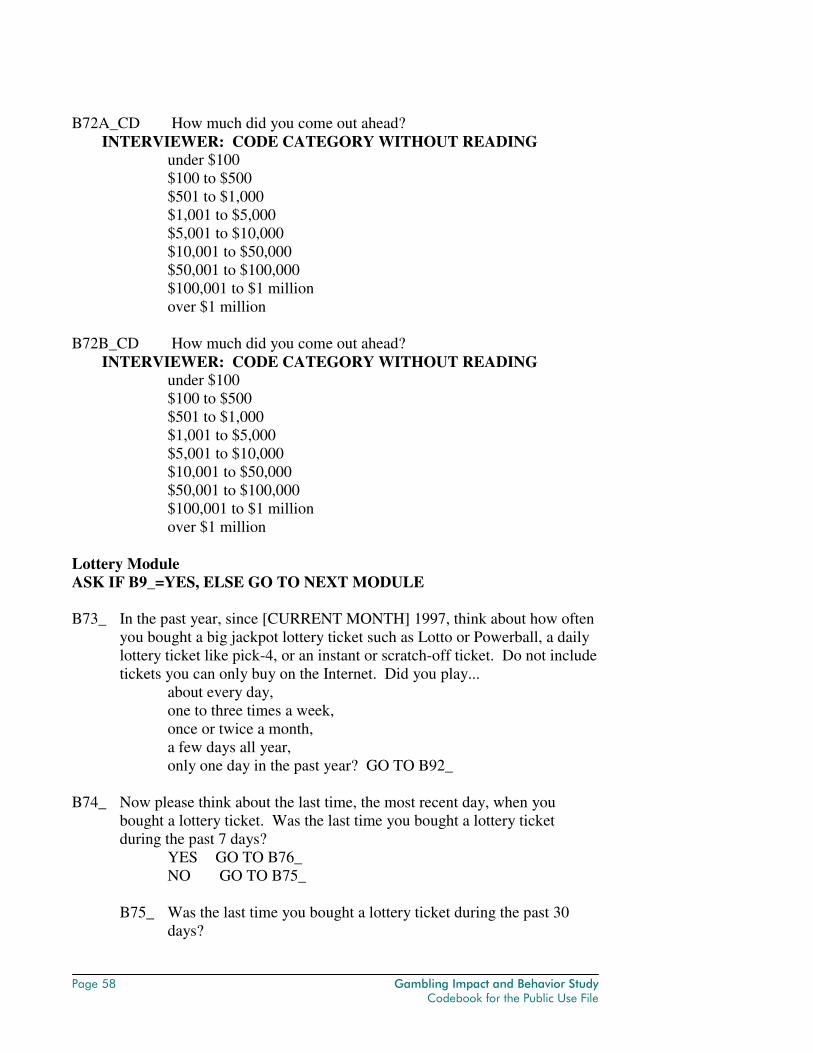
Page 58 Gambling Impact and Behavior Study Codebook for the Public Use File
B72A_CD How much did you come out ahead? INTERVIEWER: CODE CATEGORY WITHOUT READING
under $100 $100 to $500 $501 to $1,000 $1,001 to $5,000 $5,001 to $10,000 $10,001 to $50,000 $50,001 to $100,000 $100,001 to $1 million over $1 million
B72B_CD How much did you come out ahead? INTERVIEWER: CODE CATEGORY WITHOUT READING
under $100 $100 to $500 $501 to $1,000 $1,001 to $5,000 $5,001 to $10,000 $10,001 to $50,000 $50,001 to $100,000 $100,001 to $1 million over $1 million
Lottery Module ASK IF B9_=YES, ELSE GO TO NEXT MODULE B73_ In the past year, since [CURRENT MONTH] 1997, think about how often
you bought a big jackpot lottery ticket such as Lotto or Powerball, a daily lottery ticket like pick-4, or an instant or scratch-off ticket. Do not include tickets you can only buy on the Internet. Did you play...
about every day, one to three times a week, once or twice a month, a few days all year, only one day in the past year? GO TO B92_
B74_ Now please think about the last time, the most recent day, when you
bought a lottery ticket. Was the last time you bought a lottery ticket during the past 7 days?
YES GO TO B76_ NO GO TO B75_
B75_ Was the last time you bought a lottery ticket during the past 30
days?
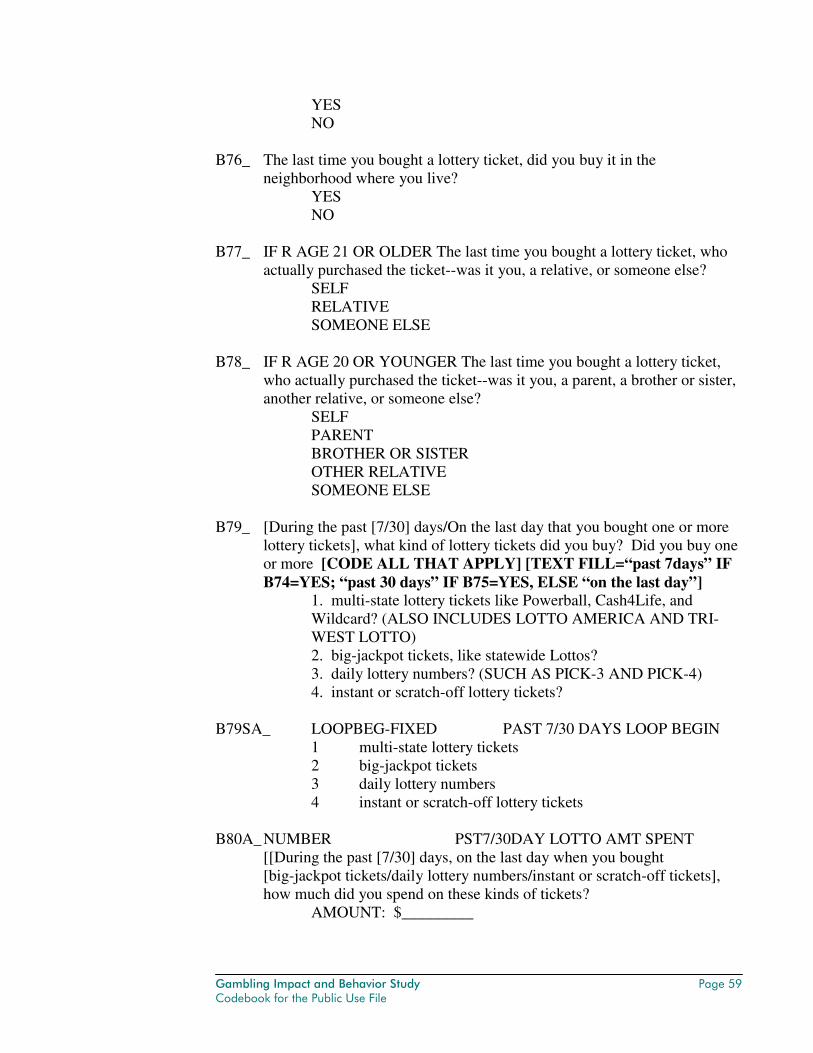
Gambling Impact and Behavior Study Page 59 Codebook for the Public Use File
YES NO
B76_ The last time you bought a lottery ticket, did you buy it in the
neighborhood where you live? YES NO
B77_ IF R AGE 21 OR OLDER The last time you bought a lottery ticket, who
actually purchased the ticket--was it you, a relative, or someone else? SELF RELATIVE SOMEONE ELSE
B78_ IF R AGE 20 OR YOUNGER The last time you bought a lottery ticket,
who actually purchased the ticket--was it you, a parent, a brother or sister, another relative, or someone else?
SELF PARENT BROTHER OR SISTER OTHER RELATIVE SOMEONE ELSE
B79_ [During the past [7/30] days/On the last day that you bought one or more
lottery tickets], what kind of lottery tickets did you buy? Did you buy one or more [CODE ALL THAT APPLY] [TEXT FILL=“past 7days” IF B74=YES; “past 30 days” IF B75=YES, ELSE “on the last day”]
1. multi-state lottery tickets like Powerball, Cash4Life, and Wildcard? (ALSO INCLUDES LOTTO AMERICA AND TRI-WEST LOTTO) 2. big-jackpot tickets, like statewide Lottos? 3. daily lottery numbers? (SUCH AS PICK-3 AND PICK-4) 4. instant or scratch-off lottery tickets?
B79SA_ LOOPBEG-FIXED PAST 7/30 DAYS LOOP BEGIN 1 multi-state lottery tickets 2 big-jackpot tickets 3 daily lottery numbers 4 instant or scratch-off lottery tickets B80A_ NUMBER PST7/30DAY LOTTO AMT SPENT
[[During the past [7/30] days, on the last day when you bought [big-jackpot tickets/daily lottery numbers/instant or scratch-off tickets], how much did you spend on these kinds of tickets?
AMOUNT: $_________
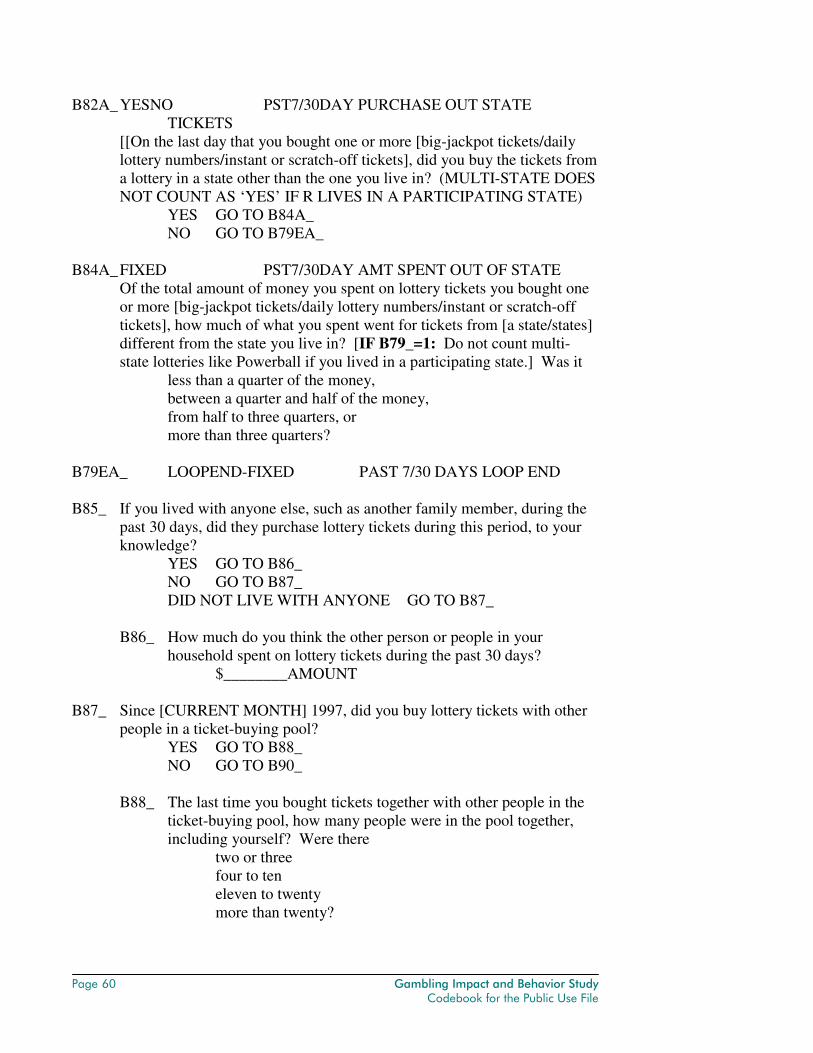
Page 60 Gambling Impact and Behavior Study Codebook for the Public Use File
B82A_ YESNO PST7/30DAY PURCHASE OUT STATE TICKETS
[[On the last day that you bought one or more [big-jackpot tickets/daily lottery numbers/instant or scratch-off tickets], did you buy the tickets from a lottery in a state other than the one you live in? (MULTI-STATE DOES NOT COUNT AS ‘YES’ IF R LIVES IN A PARTICIPATING STATE)
YES GO TO B84A_ NO GO TO B79EA_
B84A_ FIXED PST7/30DAY AMT SPENT OUT OF STATE
Of the total amount of money you spent on lottery tickets you bought one or more [big-jackpot tickets/daily lottery numbers/instant or scratch-off tickets], how much of what you spent went for tickets from [a state/states] different from the state you live in? [IF B79_=1: Do not count multi-state lotteries like Powerball if you lived in a participating state.] Was it
less than a quarter of the money, between a quarter and half of the money, from half to three quarters, or more than three quarters?
B79EA_ LOOPEND-FIXED PAST 7/30 DAYS LOOP END B85_ If you lived with anyone else, such as another family member, during the
past 30 days, did they purchase lottery tickets during this period, to your knowledge?
YES GO TO B86_ NO GO TO B87_ DID NOT LIVE WITH ANYONE GO TO B87_
B86_ How much do you think the other person or people in your
household spent on lottery tickets during the past 30 days? $________AMOUNT
B87_ Since [CURRENT MONTH] 1997, did you buy lottery tickets with other
people in a ticket-buying pool? YES GO TO B88_ NO GO TO B90_
B88_ The last time you bought tickets together with other people in the
ticket-buying pool, how many people were in the pool together, including yourself? Were there
two or three four to ten eleven to twenty more than twenty?
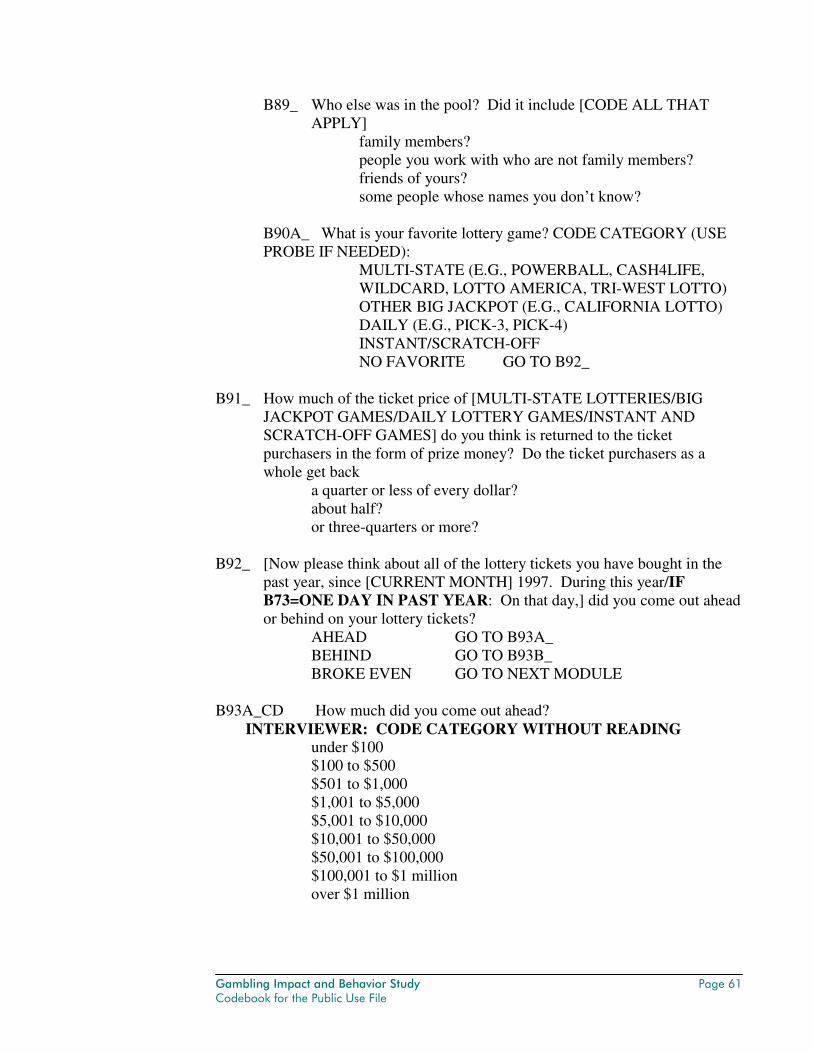
Gambling Impact and Behavior Study Page 61 Codebook for the Public Use File
B89_ Who else was in the pool? Did it include [CODE ALL THAT APPLY]
family members? people you work with who are not family members? friends of yours? some people whose names you don’t know?
B90A_ What is your favorite lottery game? CODE CATEGORY (USE PROBE IF NEEDED):
MULTI-STATE (E.G., POWERBALL, CASH4LIFE, WILDCARD, LOTTO AMERICA, TRI-WEST LOTTO) OTHER BIG JACKPOT (E.G., CALIFORNIA LOTTO) DAILY (E.G., PICK-3, PICK-4) INSTANT/SCRATCH-OFF NO FAVORITE GO TO B92_
B91_ How much of the ticket price of [MULTI-STATE LOTTERIES/BIG
JACKPOT GAMES/DAILY LOTTERY GAMES/INSTANT AND SCRATCH-OFF GAMES] do you think is returned to the ticket purchasers in the form of prize money? Do the ticket purchasers as a whole get back
a quarter or less of every dollar? about half? or three-quarters or more?
B92_ [Now please think about all of the lottery tickets you have bought in the
past year, since [CURRENT MONTH] 1997. During this year/IF B73=ONE DAY IN PAST YEAR: On that day,] did you come out ahead or behind on your lottery tickets?
AHEAD GO TO B93A_ BEHIND GO TO B93B_ BROKE EVEN GO TO NEXT MODULE
B93A_CD How much did you come out ahead? INTERVIEWER: CODE CATEGORY WITHOUT READING
under $100 $100 to $500 $501 to $1,000 $1,001 to $5,000 $5,001 to $10,000 $10,001 to $50,000 $50,001 to $100,000 $100,001 to $1 million over $1 million
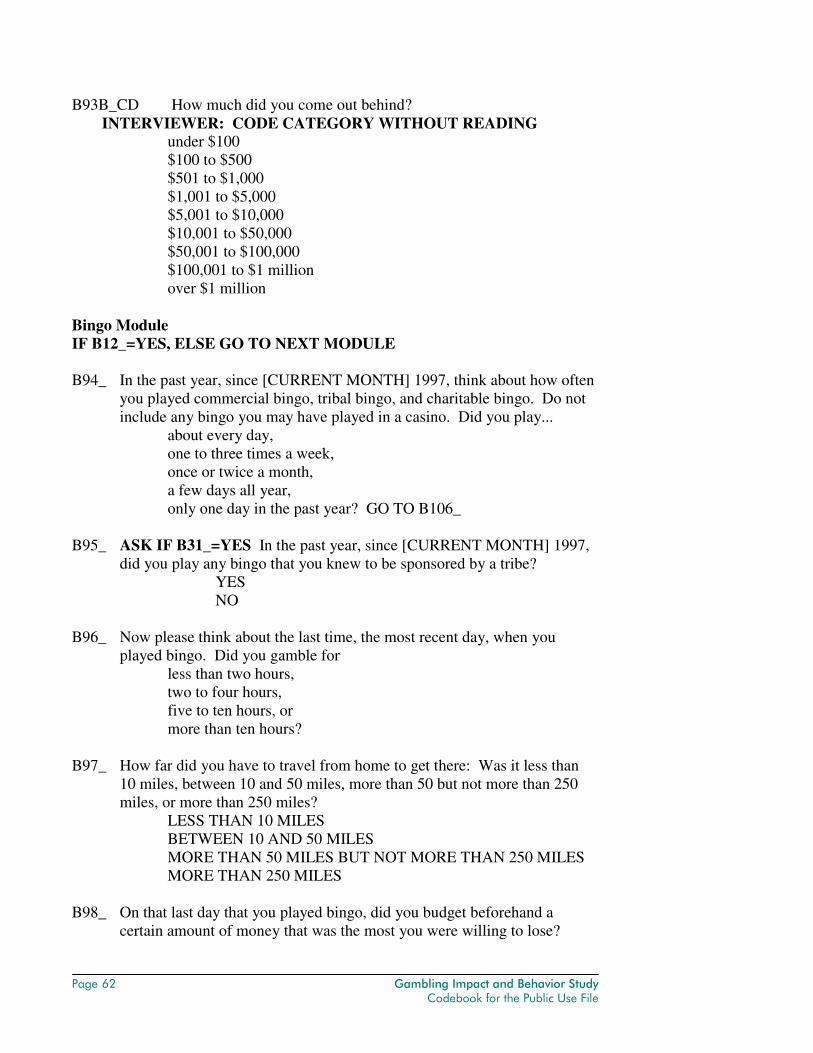
Page 62 Gambling Impact and Behavior Study Codebook for the Public Use File
B93B_CD How much did you come out behind? INTERVIEWER: CODE CATEGORY WITHOUT READING
under $100 $100 to $500 $501 to $1,000 $1,001 to $5,000 $5,001 to $10,000 $10,001 to $50,000 $50,001 to $100,000 $100,001 to $1 million over $1 million
Bingo Module IF B12_=YES, ELSE GO TO NEXT MODULE B94_ In the past year, since [CURRENT MONTH] 1997, think about how often
you played commercial bingo, tribal bingo, and charitable bingo. Do not include any bingo you may have played in a casino. Did you play...
about every day, one to three times a week, once or twice a month, a few days all year, only one day in the past year? GO TO B106_
B95_ ASK IF B31_=YES In the past year, since [CURRENT MONTH] 1997,
did you play any bingo that you knew to be sponsored by a tribe? YES NO
B96_ Now please think about the last time, the most recent day, when you
played bingo. Did you gamble for less than two hours, two to four hours, five to ten hours, or more than ten hours?
B97_ How far did you have to travel from home to get there: Was it less than
10 miles, between 10 and 50 miles, more than 50 but not more than 250 miles, or more than 250 miles?
LESS THAN 10 MILES BETWEEN 10 AND 50 MILES MORE THAN 50 MILES BUT NOT MORE THAN 250 MILES MORE THAN 250 MILES
B98_ On that last day that you played bingo, did you budget beforehand a
certain amount of money that was the most you were willing to lose?
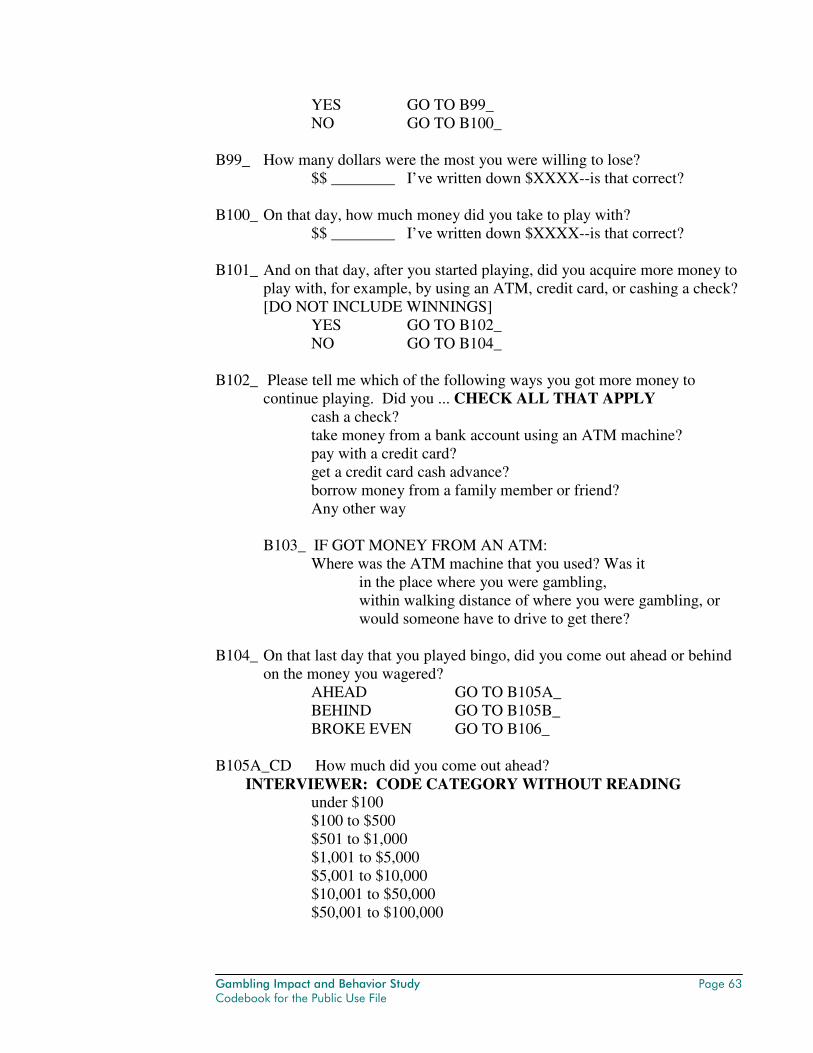
Gambling Impact and Behavior Study Page 63 Codebook for the Public Use File
YES GO TO B99_ NO GO TO B100_
B99_ How many dollars were the most you were willing to lose?
$$ ________ I’ve written down $XXXX--is that correct? B100_ On that day, how much money did you take to play with?
$$ ________ I’ve written down $XXXX--is that correct? B101_ And on that day, after you started playing, did you acquire more money to
play with, for example, by using an ATM, credit card, or cashing a check? [DO NOT INCLUDE WINNINGS]
YES GO TO B102_ NO GO TO B104_
B102_ Please tell me which of the following ways you got more money to
continue playing. Did you ... CHECK ALL THAT APPLY cash a check? take money from a bank account using an ATM machine? pay with a credit card? get a credit card cash advance? borrow money from a family member or friend? Any other way
B103_ IF GOT MONEY FROM AN ATM:
Where was the ATM machine that you used? Was it in the place where you were gambling, within walking distance of where you were gambling, or would someone have to drive to get there?
B104_ On that last day that you played bingo, did you come out ahead or behind
on the money you wagered? AHEAD GO TO B105A_ BEHIND GO TO B105B_ BROKE EVEN GO TO B106_
B105A_CD How much did you come out ahead? INTERVIEWER: CODE CATEGORY WITHOUT READING
under $100 $100 to $500 $501 to $1,000 $1,001 to $5,000 $5,001 to $10,000 $10,001 to $50,000 $50,001 to $100,000
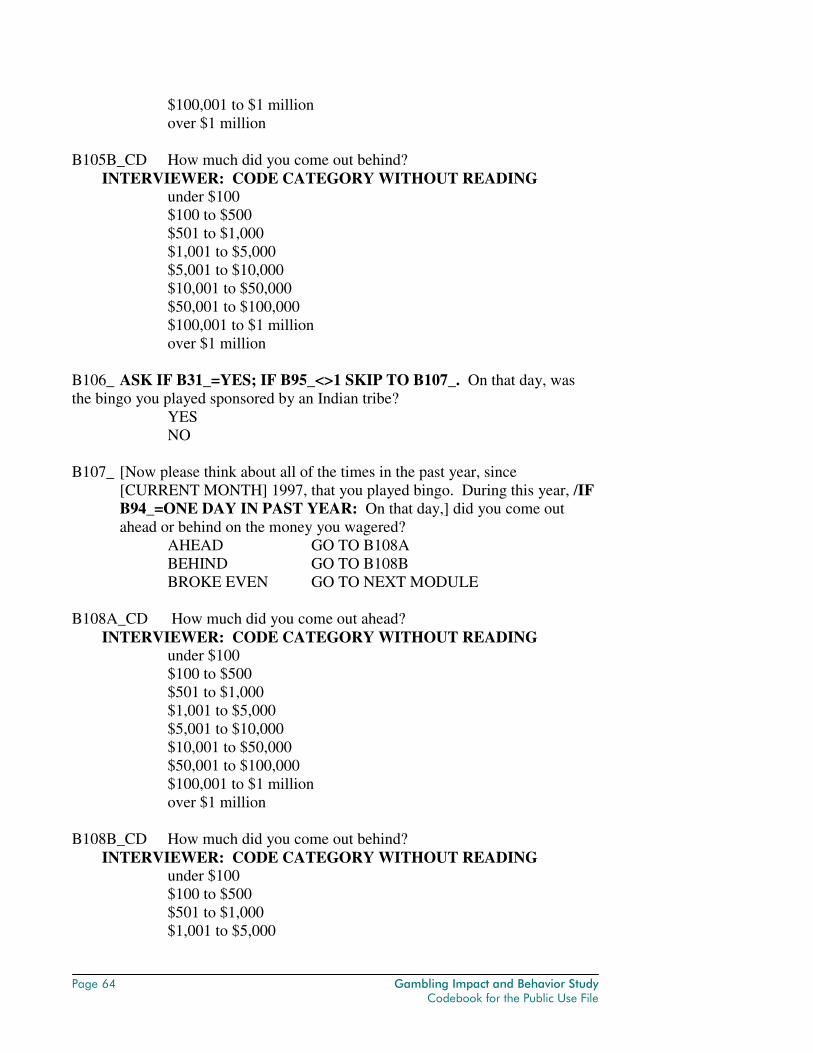
Page 64 Gambling Impact and Behavior Study Codebook for the Public Use File
$100,001 to $1 million over $1 million
B105B_CD How much did you come out behind? INTERVIEWER: CODE CATEGORY WITHOUT READING
under $100 $100 to $500 $501 to $1,000 $1,001 to $5,000 $5,001 to $10,000 $10,001 to $50,000 $50,001 to $100,000 $100,001 to $1 million over $1 million
B106_ ASK IF B31_=YES; IF B95_<>1 SKIP TO B107_. On that day, was the bingo you played sponsored by an Indian tribe?
YES NO
B107_ [Now please think about all of the times in the past year, since
[CURRENT MONTH] 1997, that you played bingo. During this year, /IF B94_=ONE DAY IN PAST YEAR: On that day,] did you come out ahead or behind on the money you wagered?
AHEAD GO TO B108A BEHIND GO TO B108B BROKE EVEN GO TO NEXT MODULE
B108A_CD How much did you come out ahead? INTERVIEWER: CODE CATEGORY WITHOUT READING
under $100 $100 to $500 $501 to $1,000 $1,001 to $5,000 $5,001 to $10,000 $10,001 to $50,000 $50,001 to $100,000 $100,001 to $1 million over $1 million
B108B_CD How much did you come out behind? INTERVIEWER: CODE CATEGORY WITHOUT READING
under $100 $100 to $500 $501 to $1,000 $1,001 to $5,000
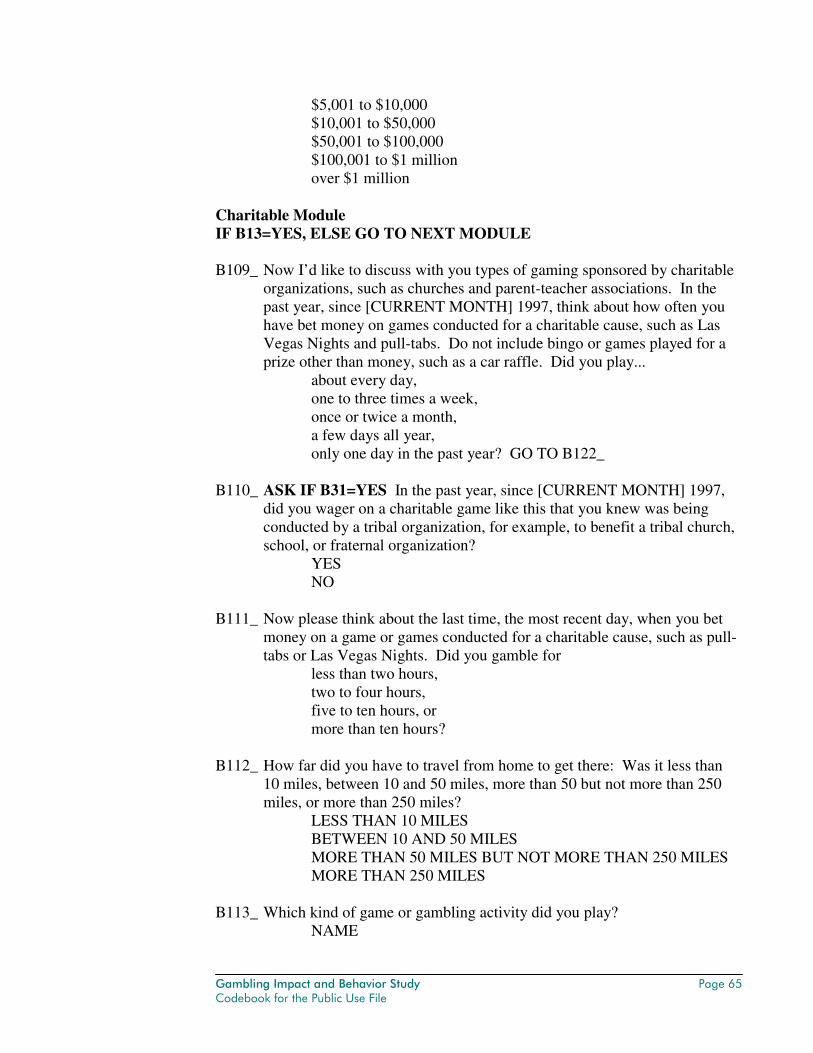
Gambling Impact and Behavior Study Page 65 Codebook for the Public Use File
$5,001 to $10,000 $10,001 to $50,000 $50,001 to $100,000 $100,001 to $1 million over $1 million
Charitable Module IF B13=YES, ELSE GO TO NEXT MODULE B109_ Now I’d like to discuss with you types of gaming sponsored by charitable
organizations, such as churches and parent-teacher associations. In the past year, since [CURRENT MONTH] 1997, think about how often you have bet money on games conducted for a charitable cause, such as Las Vegas Nights and pull-tabs. Do not include bingo or games played for a prize other than money, such as a car raffle. Did you play...
about every day, one to three times a week, once or twice a month, a few days all year, only one day in the past year? GO TO B122_
B110_ ASK IF B31=YES In the past year, since [CURRENT MONTH] 1997,
did you wager on a charitable game like this that you knew was being conducted by a tribal organization, for example, to benefit a tribal church, school, or fraternal organization?
YES NO
B111_ Now please think about the last time, the most recent day, when you bet
money on a game or games conducted for a charitable cause, such as pull-tabs or Las Vegas Nights. Did you gamble for
less than two hours, two to four hours, five to ten hours, or more than ten hours?
B112_ How far did you have to travel from home to get there: Was it less than
10 miles, between 10 and 50 miles, more than 50 but not more than 250 miles, or more than 250 miles?
LESS THAN 10 MILES BETWEEN 10 AND 50 MILES MORE THAN 50 MILES BUT NOT MORE THAN 250 MILES MORE THAN 250 MILES
B113_ Which kind of game or gambling activity did you play?
NAME
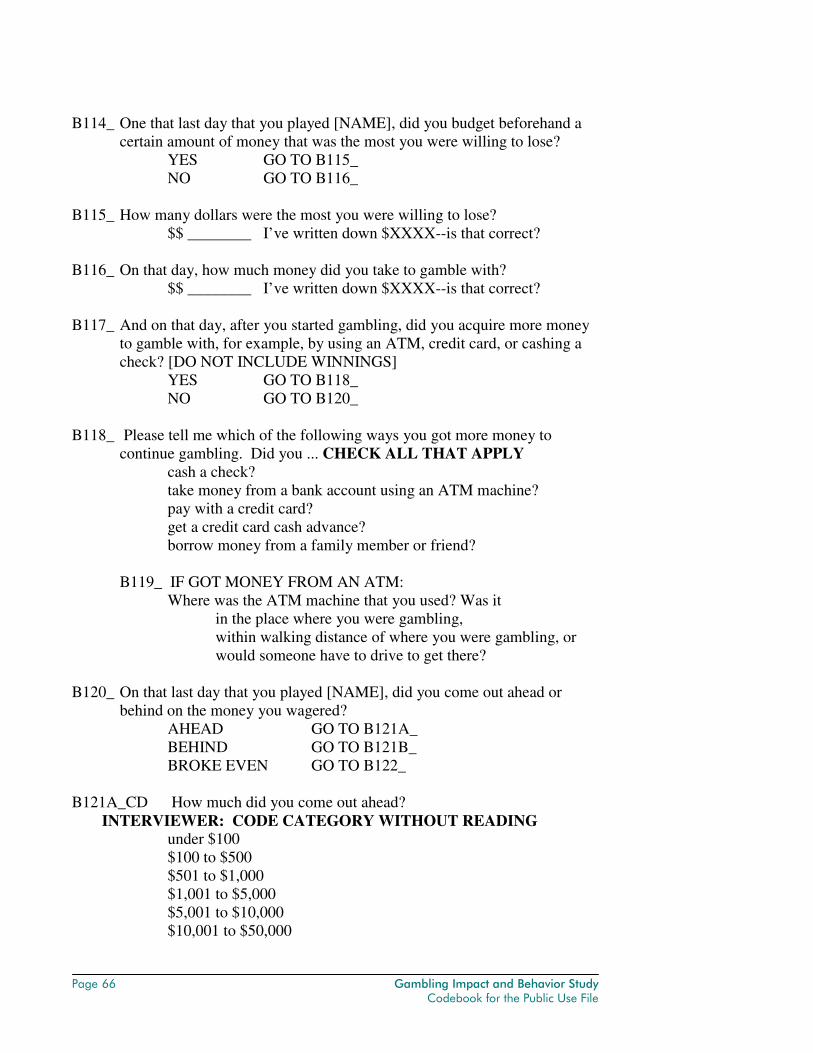
Page 66 Gambling Impact and Behavior Study Codebook for the Public Use File
B114_ One that last day that you played [NAME], did you budget beforehand a
certain amount of money that was the most you were willing to lose? YES GO TO B115_ NO GO TO B116_
B115_ How many dollars were the most you were willing to lose?
$$ ________ I’ve written down $XXXX--is that correct? B116_ On that day, how much money did you take to gamble with?
$$ ________ I’ve written down $XXXX--is that correct? B117_ And on that day, after you started gambling, did you acquire more money
to gamble with, for example, by using an ATM, credit card, or cashing a check? [DO NOT INCLUDE WINNINGS]
YES GO TO B118_ NO GO TO B120_
B118_ Please tell me which of the following ways you got more money to
continue gambling. Did you ... CHECK ALL THAT APPLY cash a check? take money from a bank account using an ATM machine? pay with a credit card? get a credit card cash advance? borrow money from a family member or friend?
B119_ IF GOT MONEY FROM AN ATM:
Where was the ATM machine that you used? Was it in the place where you were gambling, within walking distance of where you were gambling, or would someone have to drive to get there?
B120_ On that last day that you played [NAME], did you come out ahead or
behind on the money you wagered? AHEAD GO TO B121A_ BEHIND GO TO B121B_ BROKE EVEN GO TO B122_
B121A_CD How much did you come out ahead? INTERVIEWER: CODE CATEGORY WITHOUT READING
under $100 $100 to $500 $501 to $1,000 $1,001 to $5,000 $5,001 to $10,000 $10,001 to $50,000
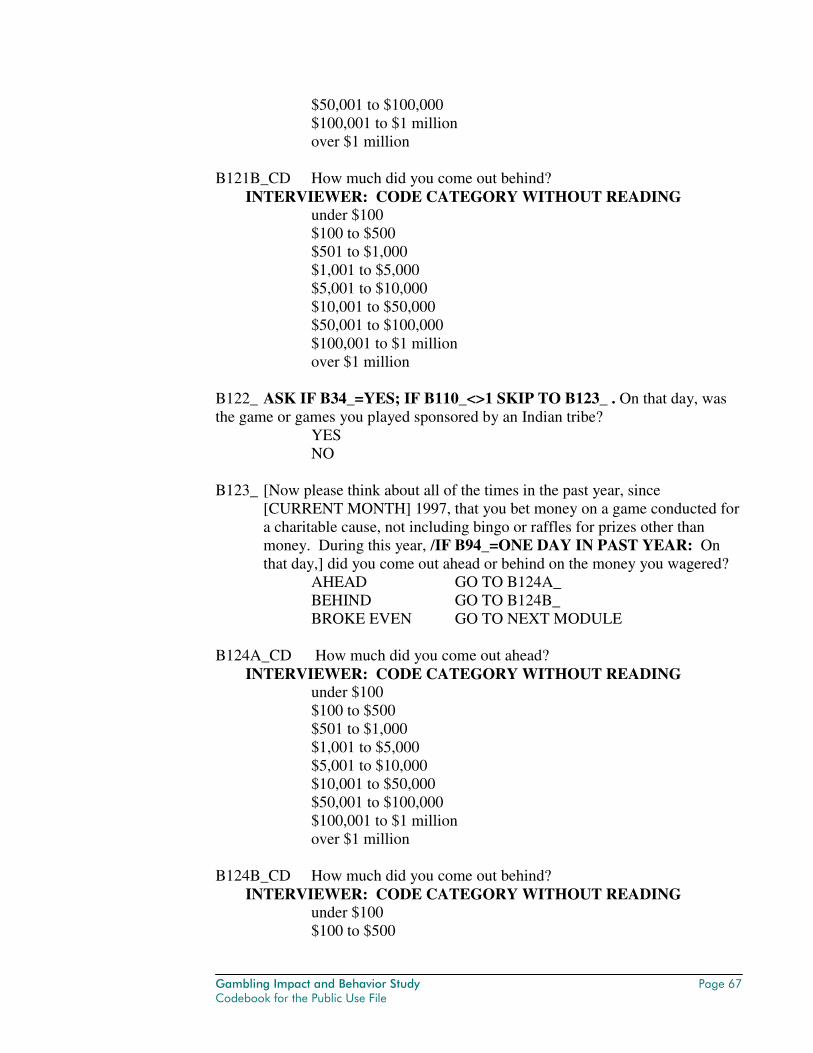
Gambling Impact and Behavior Study Page 67 Codebook for the Public Use File
$50,001 to $100,000 $100,001 to $1 million over $1 million
B121B_CD How much did you come out behind? INTERVIEWER: CODE CATEGORY WITHOUT READING
under $100 $100 to $500 $501 to $1,000 $1,001 to $5,000 $5,001 to $10,000 $10,001 to $50,000 $50,001 to $100,000 $100,001 to $1 million over $1 million
B122_ ASK IF B34_=YES; IF B110_<>1 SKIP TO B123_ . On that day, was the game or games you played sponsored by an Indian tribe?
YES NO
B123_ [Now please think about all of the times in the past year, since
[CURRENT MONTH] 1997, that you bet money on a game conducted for a charitable cause, not including bingo or raffles for prizes other than money. During this year, /IF B94_=ONE DAY IN PAST YEAR: On that day,] did you come out ahead or behind on the money you wagered?
AHEAD GO TO B124A_ BEHIND GO TO B124B_ BROKE EVEN GO TO NEXT MODULE
B124A_CD How much did you come out ahead? INTERVIEWER: CODE CATEGORY WITHOUT READING
under $100 $100 to $500 $501 to $1,000 $1,001 to $5,000 $5,001 to $10,000 $10,001 to $50,000 $50,001 to $100,000 $100,001 to $1 million over $1 million
B124B_CD How much did you come out behind? INTERVIEWER: CODE CATEGORY WITHOUT READING
under $100 $100 to $500
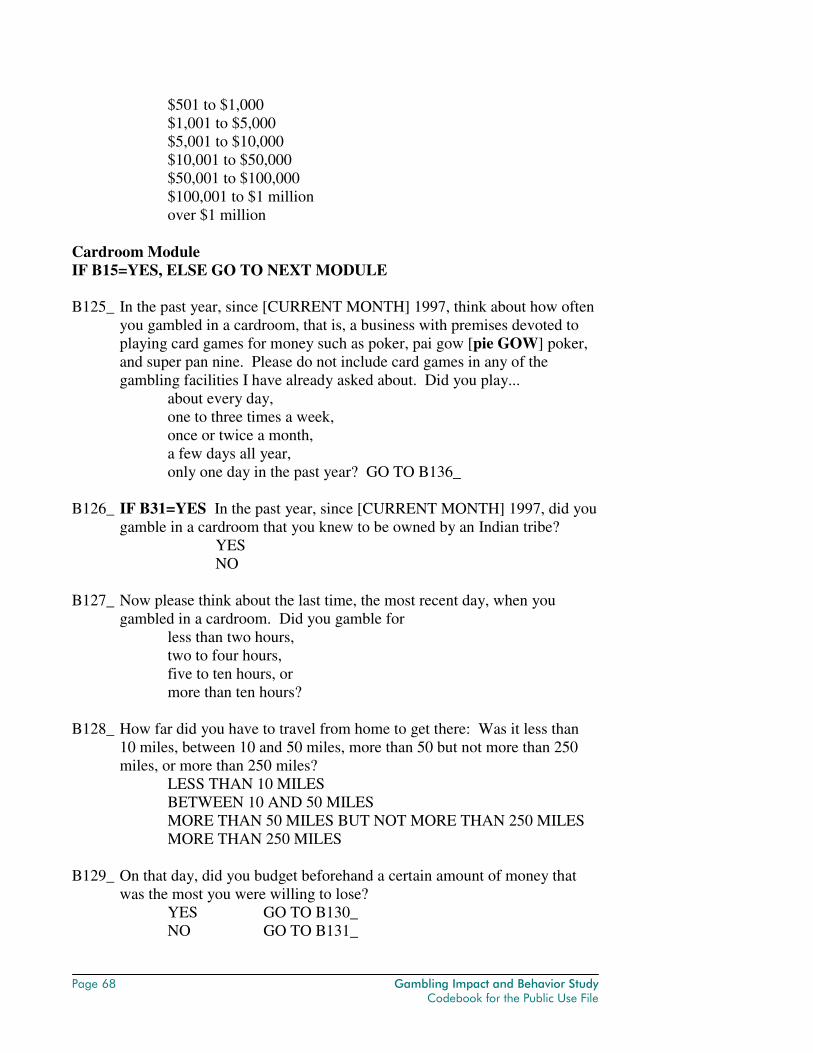
Page 68 Gambling Impact and Behavior Study Codebook for the Public Use File
$501 to $1,000 $1,001 to $5,000 $5,001 to $10,000 $10,001 to $50,000 $50,001 to $100,000 $100,001 to $1 million over $1 million
Cardroom Module IF B15=YES, ELSE GO TO NEXT MODULE B125_ In the past year, since [CURRENT MONTH] 1997, think about how often
you gambled in a cardroom, that is, a business with premises devoted to playing card games for money such as poker, pai gow [pie GOW] poker, and super pan nine. Please do not include card games in any of the gambling facilities I have already asked about. Did you play...
about every day, one to three times a week, once or twice a month, a few days all year, only one day in the past year? GO TO B136_
B126_ IF B31=YES In the past year, since [CURRENT MONTH] 1997, did you
gamble in a cardroom that you knew to be owned by an Indian tribe? YES NO
B127_ Now please think about the last time, the most recent day, when you
gambled in a cardroom. Did you gamble for less than two hours, two to four hours, five to ten hours, or more than ten hours?
B128_ How far did you have to travel from home to get there: Was it less than
10 miles, between 10 and 50 miles, more than 50 but not more than 250 miles, or more than 250 miles?
LESS THAN 10 MILES BETWEEN 10 AND 50 MILES MORE THAN 50 MILES BUT NOT MORE THAN 250 MILES MORE THAN 250 MILES
B129_ On that day, did you budget beforehand a certain amount of money that
was the most you were willing to lose? YES GO TO B130_ NO GO TO B131_
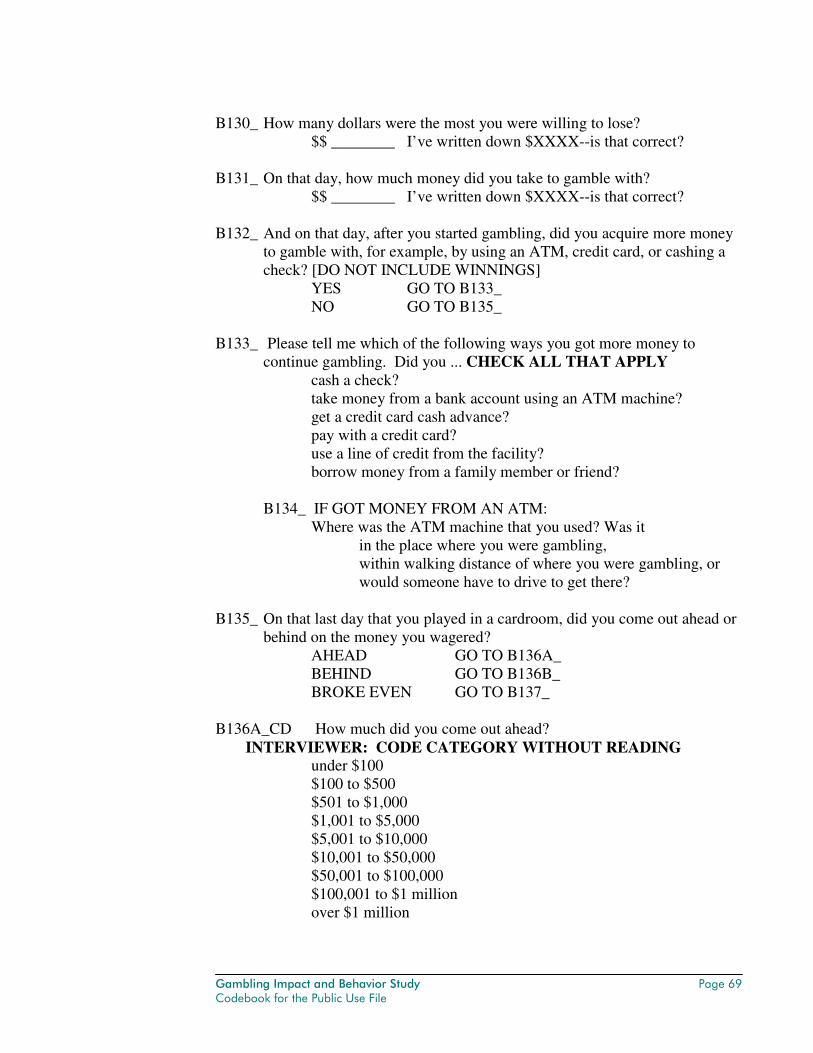
Gambling Impact and Behavior Study Page 69 Codebook for the Public Use File
B130_ How many dollars were the most you were willing to lose?
$$ ________ I’ve written down $XXXX--is that correct? B131_ On that day, how much money did you take to gamble with?
$$ ________ I’ve written down $XXXX--is that correct?
B132_ And on that day, after you started gambling, did you acquire more money to gamble with, for example, by using an ATM, credit card, or cashing a check? [DO NOT INCLUDE WINNINGS]
YES GO TO B133_ NO GO TO B135_
B133_ Please tell me which of the following ways you got more money to
continue gambling. Did you ... CHECK ALL THAT APPLY cash a check? take money from a bank account using an ATM machine? get a credit card cash advance? pay with a credit card? use a line of credit from the facility? borrow money from a family member or friend?
B134_ IF GOT MONEY FROM AN ATM:
Where was the ATM machine that you used? Was it in the place where you were gambling, within walking distance of where you were gambling, or would someone have to drive to get there?
B135_ On that last day that you played in a cardroom, did you come out ahead or
behind on the money you wagered? AHEAD GO TO B136A_ BEHIND GO TO B136B_ BROKE EVEN GO TO B137_
B136A_CD How much did you come out ahead? INTERVIEWER: CODE CATEGORY WITHOUT READING
under $100 $100 to $500 $501 to $1,000 $1,001 to $5,000 $5,001 to $10,000 $10,001 to $50,000 $50,001 to $100,000 $100,001 to $1 million over $1 million
Page 70 Gambling Impact and Behavior Study Codebook for the Public Use File
B136B_CD How much did you come out behind? INTERVIEWER: CODE CATEGORY WITHOUT READING
under $100 $100 to $500 $501 to $1,000 $1,001 to $5,000 $5,001 to $10,000 $10,001 to $50,000 $50,001 to $100,000 $100,001 to $1 million over $1 million
B137_ ASK IF B31_=YES; IF B126_<>1 SKIP TO B138_. On that day, was
the cardroom you played in run by an Indian tribe? YES NO
B138_ [Now please think about all of the times in the past year, since
[CURRENT MONTH] 1997, that you gambled in a cardroom. During this year, /IF B125_=ONE DAY IN PAST YEAR: On that day,] did you come out ahead or behind on the money you wagered?
AHEAD GO TO B139A_ BEHIND GO TO B139B_ BROKE EVEN GO TO NEXT MODULE
B139A_CD How much did you come out ahead? INTERVIEWER: CODE CATEGORY WITHOUT READING
under $100 $100 to $500 $501 to $1,000 $1,001 to $5,000 $5,001 to $10,000 $10,001 to $50,000 $50,001 to $100,000 $100,001 to $1 million over $1 million
B139B_CD How much did you come out behind? INTERVIEWER: CODE CATEGORY WITHOUT READING
under $100 $100 to $500 $501 to $1,000 $1,001 to $5,000 $5,001 to $10,000 $10,001 to $50,000
Gambling Impact and Behavior Study Page 71 Codebook for the Public Use File
$50,001 to $100,000 $100,001 to $1 million over $1 million
Private Module IF B117=YES, ELSE GO TO NEXT MODULE B140_ In the past year, since [CURRENT MONTH] 1997, think about how often
you gambled for money in a private game such as dice, dominos, poker in someone’s home, pool, golf, or bowling. Did you play...
about every day, one to three times a week, once or twice a month, a few days all year, only one day in the past year? GO TO B144_
B141_ Now please think about the last time, the most recent day, when you
gambled in a private game such as dice, dominos, poker in someone’s home, pool, golf, or bowling. Did you gamble there for
less than two hours, two to four hours, five to ten hours, or more than ten hours?
B142_ On that day, did you come out ahead or behind on the money you
wagered? AHEAD GO TO B143A_ BEHIND GO TO B143B_ BROKE EVEN GO TO B144_
B143A_CD How much did you come out ahead? INTERVIEWER: CODE CATEGORY WITHOUT READING
under $100 $100 to $500 $501 to $1,000 $1,001 to $5,000 $5,001 to $10,000 $10,001 to $50,000 $50,001 to $100,000 $100,001 to $1 million over $1 million
B143B_CD How much did you come out behind? INTERVIEWER: CODE CATEGORY WITHOUT READING
under $100 $100 to $500
Page 72 Gambling Impact and Behavior Study Codebook for the Public Use File
$501 to $1,000 $1,001 to $5,000 $5,001 to $10,000 $10,001 to $50,000 $50,001 to $100,000 $100,001 to $1 million over $1 million
B144_ [Now please think about all of the times in the past year, since
[CURRENT MONTH] 1997, that you gambled in a private game such as dice, dominos, poker in someone’s home, pool, golf, or bowling. During this year, /IF B140=ONE DAY IN PAST YEAR: On that day,] did you come out ahead or behind on the money you wagered?
AHEAD GO TO B145A_ BEHIND GO TO B145B_ BROKE EVEN GO TO NEXT MODULE
B145A_CD How much did you come out ahead? INTERVIEWER: CODE CATEGORY WITHOUT READING
under $100 $100 to $500 $501 to $1,000 $1,001 to $5,000 $5,001 to $10,000 $10,001 to $50,000 $50,001 to $100,000 $100,001 to $1 million over $1 million
B145B_CD How much did you come out behind? INTERVIEWER: CODE CATEGORY WITHOUT READING
under $100 $100 to $500 $501 to $1,000 $1,001 to $5,000 $5,001 to $10,000 $10,001 to $50,000 $50,001 to $100,000 $100,001 to $1 million over $1 million
Store/Bar/Restaurant/Truck Stop Module IF B119=YES, ELSE GO TO NEXT MODULE B146_ In the past year, since [CURRENT MONTH] 1997, think about how often
you gambled at a store, bar, restaurant, truck stop, or similar location that
Gambling Impact and Behavior Study Page 73 Codebook for the Public Use File
had only one or two kinds of games, such as slot machines, video poker, or pull tabs. Please do not include gambling in locations that we have already talked about, or betting with a bookmaker. Did you play...
about every day, one to three times a week, once or twice a month, a few days all year, only one day in the past year? GO TO B162_
B147_ IF B31_=YES In the past year, since [CURRENT MONTH] 1997, did
you gamble at a store, bar, restaurant, truck stop, or similar location that you knew to be owned by an Indian tribe?
YES NO
B148_ Now please think about the last time, the most recent day, when you
gambled at one of these locations. Which kind of location was this? Was it CHECK ONE ONLY
a bar or restaurant? a truck stop or gas station? a convenience store? a supermarket?
B149_ How far did you have to travel from home to get there: Was it less than 10 miles,
between 10 and 50 miles, more than 50 but not more than 250 miles, or more than 250 miles?
LESS THAN 10 MILES BETWEEN 10 AND 50 MILES MORE THAN 50 MILES BUT NOT MORE THAN 250 MILES MORE THAN 250 MILES
B150_ Which kind of game or games did you play? Did you play... CHECK
ALL THAT APPLY slot machines? a video lottery machine? some other kind of electronic game? pull tabs?
B151_ Did you gamble there for
less than two hours, two to four hours, five to ten hours, or more than ten hours?
B152_ On that day, did you budget beforehand a certain amount of money that
was the most you were willing to lose?
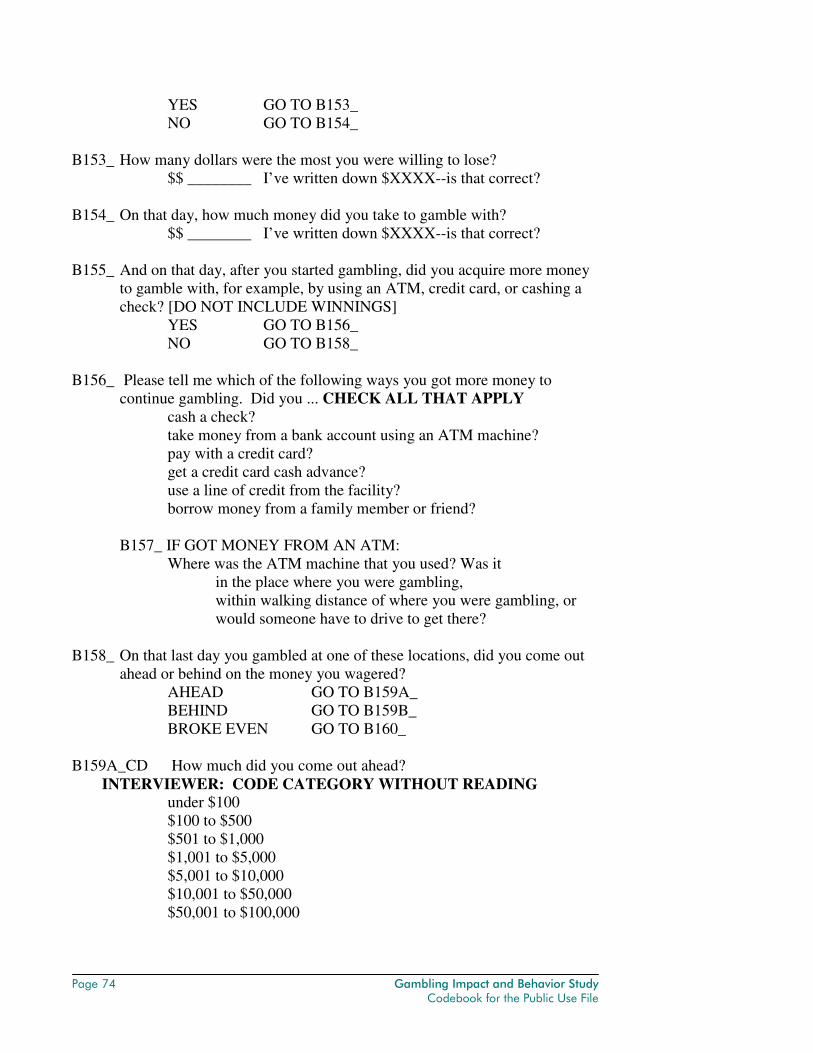
Page 74 Gambling Impact and Behavior Study Codebook for the Public Use File
YES GO TO B153_ NO GO TO B154_
B153_ How many dollars were the most you were willing to lose?
$$ ________ I’ve written down $XXXX--is that correct? B154_ On that day, how much money did you take to gamble with?
$$ ________ I’ve written down $XXXX--is that correct?
B155_ And on that day, after you started gambling, did you acquire more money to gamble with, for example, by using an ATM, credit card, or cashing a check? [DO NOT INCLUDE WINNINGS]
YES GO TO B156_ NO GO TO B158_
B156_ Please tell me which of the following ways you got more money to
continue gambling. Did you ... CHECK ALL THAT APPLY cash a check? take money from a bank account using an ATM machine? pay with a credit card? get a credit card cash advance? use a line of credit from the facility? borrow money from a family member or friend?
B157_ IF GOT MONEY FROM AN ATM:
Where was the ATM machine that you used? Was it in the place where you were gambling, within walking distance of where you were gambling, or would someone have to drive to get there?
B158_ On that last day you gambled at one of these locations, did you come out
ahead or behind on the money you wagered? AHEAD GO TO B159A_ BEHIND GO TO B159B_ BROKE EVEN GO TO B160_
B159A_CD How much did you come out ahead? INTERVIEWER: CODE CATEGORY WITHOUT READING
under $100 $100 to $500 $501 to $1,000 $1,001 to $5,000 $5,001 to $10,000 $10,001 to $50,000 $50,001 to $100,000
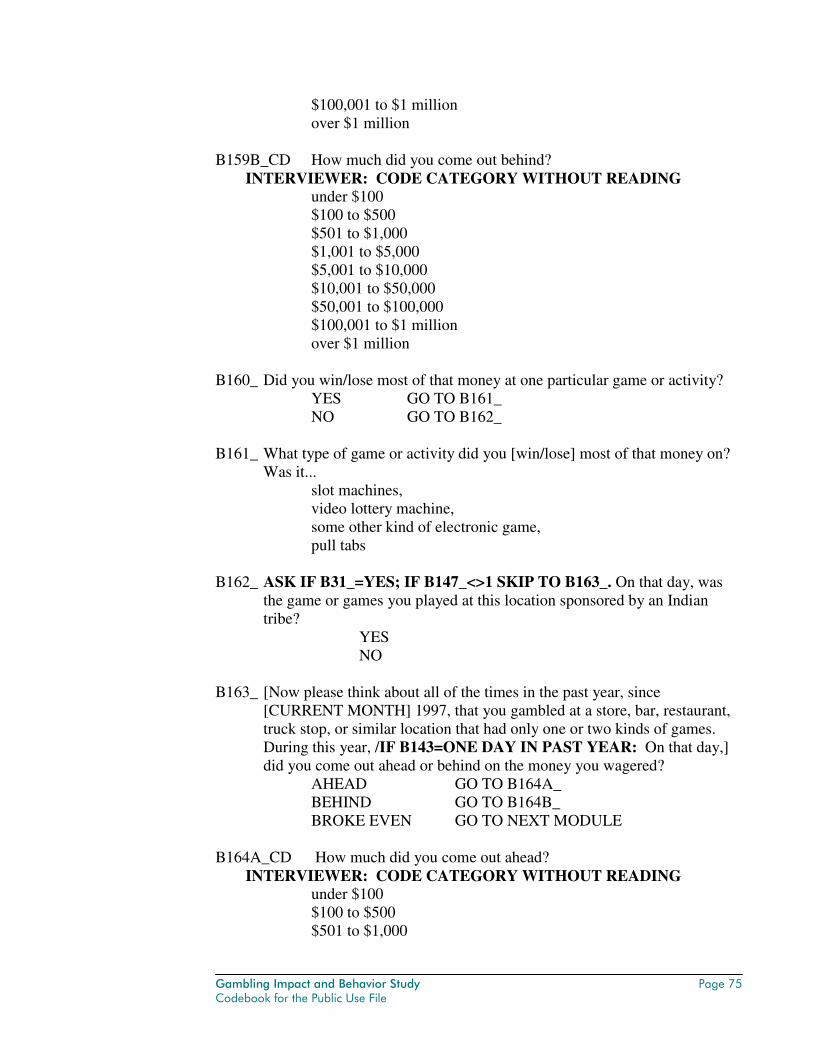
Gambling Impact and Behavior Study Page 75 Codebook for the Public Use File
$100,001 to $1 million over $1 million
B159B_CD How much did you come out behind? INTERVIEWER: CODE CATEGORY WITHOUT READING
under $100 $100 to $500 $501 to $1,000 $1,001 to $5,000 $5,001 to $10,000 $10,001 to $50,000 $50,001 to $100,000 $100,001 to $1 million over $1 million
B160_ Did you win/lose most of that money at one particular game or activity?
YES GO TO B161_ NO GO TO B162_
B161_ What type of game or activity did you [win/lose] most of that money on?
Was it... slot machines, video lottery machine, some other kind of electronic game, pull tabs
B162_ ASK IF B31_=YES; IF B147_<>1 SKIP TO B163_. On that day, was
the game or games you played at this location sponsored by an Indian tribe?
YES NO
B163_ [Now please think about all of the times in the past year, since
[CURRENT MONTH] 1997, that you gambled at a store, bar, restaurant, truck stop, or similar location that had only one or two kinds of games. During this year, /IF B143=ONE DAY IN PAST YEAR: On that day,] did you come out ahead or behind on the money you wagered?
AHEAD GO TO B164A_ BEHIND GO TO B164B_ BROKE EVEN GO TO NEXT MODULE
B164A_CD How much did you come out ahead? INTERVIEWER: CODE CATEGORY WITHOUT READING
under $100 $100 to $500 $501 to $1,000
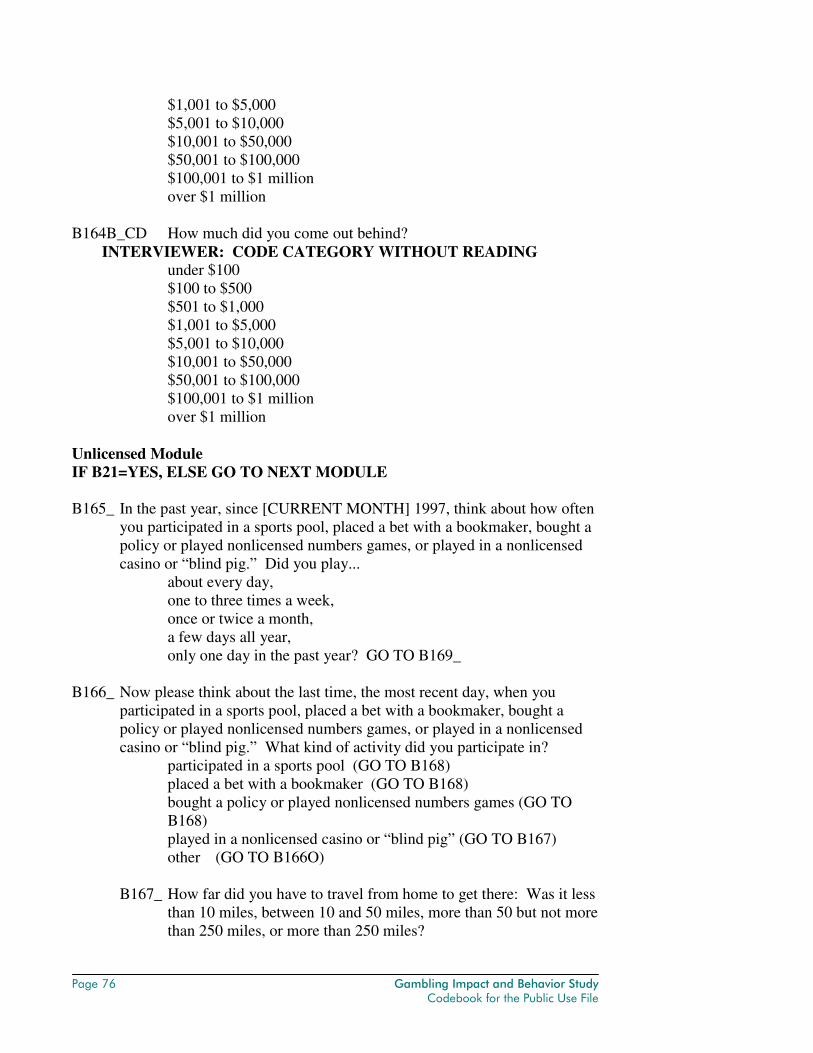
Page 76 Gambling Impact and Behavior Study Codebook for the Public Use File
$1,001 to $5,000 $5,001 to $10,000 $10,001 to $50,000 $50,001 to $100,000 $100,001 to $1 million over $1 million
B164B_CD How much did you come out behind? INTERVIEWER: CODE CATEGORY WITHOUT READING
under $100 $100 to $500 $501 to $1,000 $1,001 to $5,000 $5,001 to $10,000 $10,001 to $50,000 $50,001 to $100,000 $100,001 to $1 million over $1 million
Unlicensed Module IF B21=YES, ELSE GO TO NEXT MODULE B165_ In the past year, since [CURRENT MONTH] 1997, think about how often
you participated in a sports pool, placed a bet with a bookmaker, bought a policy or played nonlicensed numbers games, or played in a nonlicensed casino or “blind pig.” Did you play...
about every day, one to three times a week, once or twice a month, a few days all year, only one day in the past year? GO TO B169_
B166_ Now please think about the last time, the most recent day, when you
participated in a sports pool, placed a bet with a bookmaker, bought a policy or played nonlicensed numbers games, or played in a nonlicensed casino or “blind pig.” What kind of activity did you participate in?
participated in a sports pool (GO TO B168) placed a bet with a bookmaker (GO TO B168) bought a policy or played nonlicensed numbers games (GO TO B168) played in a nonlicensed casino or “blind pig” (GO TO B167) other (GO TO B166O)
B167_ How far did you have to travel from home to get there: Was it less
than 10 miles, between 10 and 50 miles, more than 50 but not more than 250 miles, or more than 250 miles?
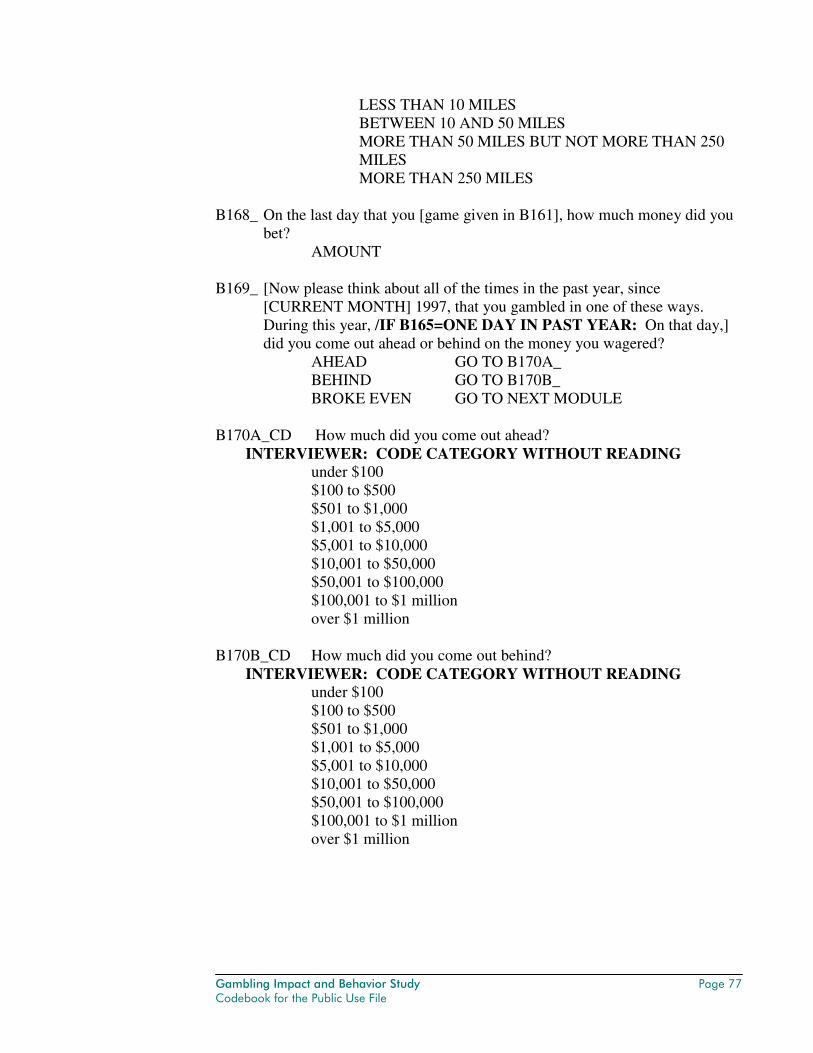
Gambling Impact and Behavior Study Page 77 Codebook for the Public Use File
LESS THAN 10 MILES BETWEEN 10 AND 50 MILES MORE THAN 50 MILES BUT NOT MORE THAN 250 MILES MORE THAN 250 MILES
B168_ On the last day that you [game given in B161], how much money did you
bet? AMOUNT
B169_ [Now please think about all of the times in the past year, since
[CURRENT MONTH] 1997, that you gambled in one of these ways. During this year, /IF B165=ONE DAY IN PAST YEAR: On that day,] did you come out ahead or behind on the money you wagered?
AHEAD GO TO B170A_ BEHIND GO TO B170B_ BROKE EVEN GO TO NEXT MODULE
B170A_CD How much did you come out ahead? INTERVIEWER: CODE CATEGORY WITHOUT READING
under $100 $100 to $500 $501 to $1,000 $1,001 to $5,000 $5,001 to $10,000 $10,001 to $50,000 $50,001 to $100,000 $100,001 to $1 million over $1 million
B170B_CD How much did you come out behind? INTERVIEWER: CODE CATEGORY WITHOUT READING
under $100 $100 to $500 $501 to $1,000 $1,001 to $5,000 $5,001 to $10,000 $10,001 to $50,000 $50,001 to $100,000 $100,001 to $1 million over $1 million
Page 78 Gambling Impact and Behavior Study Codebook for the Public Use File
Internet Module IF B23=YES, ELSE GO TO SECTION C B171_ In the past year, since [CURRENT MONTH] 1997, think about how often
you gambled for actual money on the Internet or World Wide Web. Please include lottery games that can only be played on the Internet. Did you play...
about every day, one to three times a week, once or twice a month, a few days all year, only one day in the past year? GO TO B177
B172_ Now please think about the last time, the most recent day, when you
gambled on the Internet or World-Wide-Web. Did you gamble for less than two hours, two to four hours, five to ten hours, or more than ten hours?
B173_ On that day, did you budget beforehand a certain amount of money that
was the most you were willing to lose? YES GO TO B174 NO GO TO B175
B174_ How many dollars were the most you were willing to lose?
$$ ________ I’ve written down $XXXX--is that correct? B175_ On the last day that you gambled on the Internet or World-Wide-Web, did
you come out ahead or behind on the money you wagered? AHEAD GO TO B176A_ BEHIND GO TO B176B_ BROKE EVEN GO TO B177_
B176A_CD How much did you come out ahead? INTERVIEWER: CODE CATEGORY WITHOUT READING
under $100 $100 to $500 $501 to $1,000 $1,001 to $5,000 $5,001 to $10,000 $10,001 to $50,000 $50,001 to $100,000 $100,001 to $1 million over $1 million
Gambling Impact and Behavior Study Page 79 Codebook for the Public Use File
B176B_CD How much did you come out behind? INTERVIEWER: CODE CATEGORY WITHOUT READING
under $100 $100 to $500 $501 to $1,000 $1,001 to $5,000 $5,001 to $10,000 $10,001 to $50,000 $50,001 to $100,000 $100,001 to $1 million over $1 million
B177_ [Now please think about all of the times in the past year, since
[CURRENT MONTH] 1997, that you gambled on the Internet or World Wide Web. During this year, /IF B171=ONE DAY IN PAST YEAR: On that day,] did you come out ahead or behind on the money you wagered?
AHEAD GO TO B178A_ BEHIND GO TO B178B_ BROKE EVEN GO TO NEXT MODULE
B178A_CD How much did you come out ahead? INTERVIEWER: CODE CATEGORY WITHOUT READING
under $100 $100 to $500 $501 to $1,000 $1,001 to $5,000 $5,001 to $10,000 $10,001 to $50,000 $50,001 to $100,000 $100,001 to $1 million over $1 million
B178B_CD How much did you come out behind? INTERVIEWER: CODE CATEGORY WITHOUT READING
under $100 $100 to $500 $501 to $1,000 $1,001 to $5,000 $5,001 to $10,000 $10,001 to $50,000 $50,001 to $100,000 $100,001 to $1 million over $1 million
Page 80 Gambling Impact and Behavior Study Codebook for the Public Use File
C. GENERAL GAMBLING QUESTIONS
C1_ People have different beliefs about the overall effects of legalized gambling on society. Some people consider that legalized gambling is mostly a good thing for society, others think it is mostly a bad thing, and still others think it has an equal combination of good and bad effects on society. Would you say that the overall effect of legalized gambling on society is...
very good, good, about equally bad and good, bad, or very bad?
IF R HAS GAMBLED IN THE PAST YEAR, GO TO C8 IF RESPONDENT HAS NOT GAMBLED IN PAST YEAR, GO TO C2 IF RESPONDENT HAS NEVER GAMBLED, GO TO C2 C2_ You have indicated that you have not gambled at all in the past year, since [CURRENT MONTH] 1997. Now I would like to ask you how important some possible reasons might have been for your [never gambling/not gambling or placing any bets in the past year].
C3_ Would you say that inconvenience or distance from gambling opportunities was very important, important, not so important, or not at all important in your not gambling [in the past year]?
VERY IMPORTANT IMPORTANT NOT SO IMPORTANT NOT AT ALL IMPORTANT
C4_ Would you say that moral or ethical concerns were very important,
important, not so important, or not at all important in your not gambling?
VERY IMPORTANT IMPORTANT NOT SO IMPORTANT NOT AT ALL IMPORTANT
C5_ Would you say that the possibility of losing money was very
important, important, not so important, or not at all important in your not gambling?
VERY IMPORTANT IMPORTANT NOT SO IMPORTANT NOT AT ALL IMPORTANT
Gambling Impact and Behavior Study Page 81 Codebook for the Public Use File
C6_ Were there any [other] important or very important reason why you [have never gambled/didn’t gamble in the past year]?
YES NO
IF RESPONDENT HAS NEVER GAMBLED, GO TO SECTION F IF RESPONDENT HAS GAMBLED BUT NOT IN THE PAST YEAR, GO TO C15 C8_ I would like to ask you about reasons you may have had for gambling or placing a bet in the past year. Please tell me whether each of the following reasons was very important, important, not so important, or not at all important to you as a reason for gambling:
C9_ Socializing with friends or family VERY IMPORTANT IMPORTANT NOT SO IMPORTANT NOT AT ALL IMPORTANT
C10_ Personal service from the staff
VERY IMPORTANT IMPORTANT NOT SO IMPORTANT NOT AT ALL IMPORTANT
C11_ To be around other people
VERY IMPORTANT IMPORTANT NOT SO IMPORTANT NOT AT ALL IMPORTANT
C12_ The excitement or challenge of gambling [PROBE IF
NECESSARY: “Does gambling wake you up and keep your attention? How important is that for you to gamble?]
VERY IMPORTANT IMPORTANT NOT SO IMPORTANT NOT AT ALL IMPORTANT
C13_ To win money
VERY IMPORTANT IMPORTANT NOT SO IMPORTANT NOT AT ALL IMPORTANT
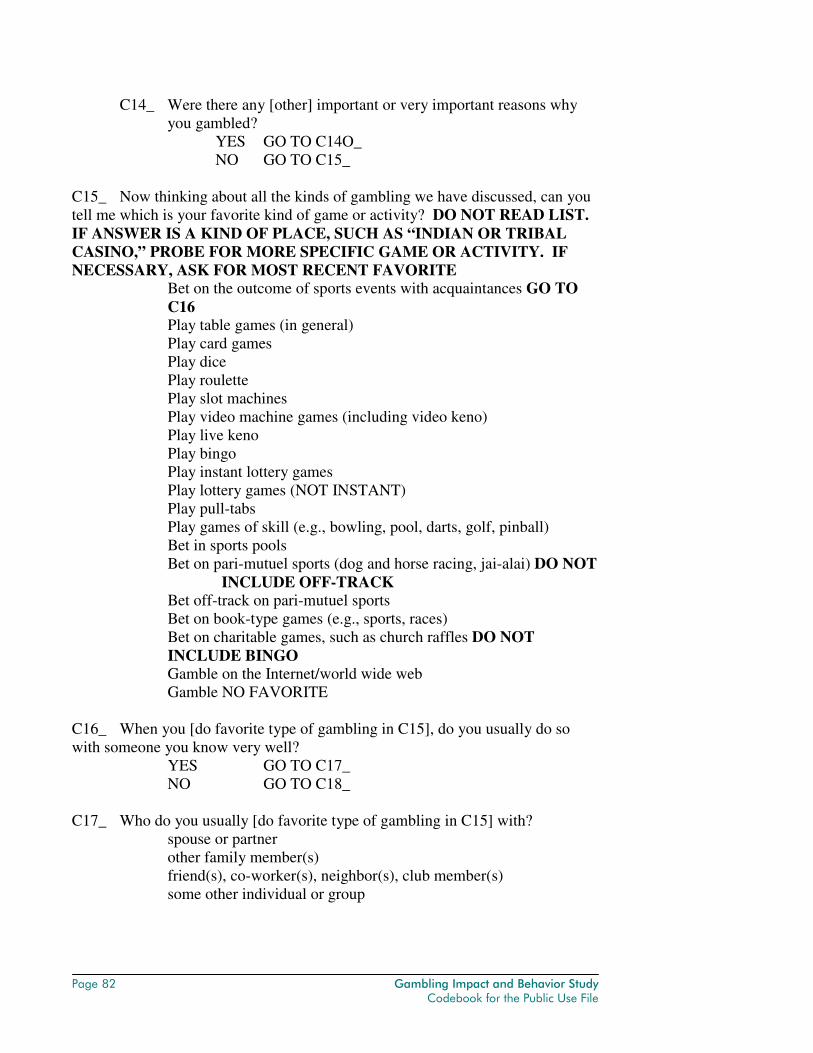
Page 82 Gambling Impact and Behavior Study Codebook for the Public Use File
C14_ Were there any [other] important or very important reasons why you gambled?
YES GO TO C14O_ NO GO TO C15_
C15_ Now thinking about all the kinds of gambling we have discussed, can you tell me which is your favorite kind of game or activity? DO NOT READ LIST. IF ANSWER IS A KIND OF PLACE, SUCH AS “INDIAN OR TRIBAL CASINO,” PROBE FOR MORE SPECIFIC GAME OR ACTIVITY. IF NECESSARY, ASK FOR MOST RECENT FAVORITE
Bet on the outcome of sports events with acquaintances GO TO C16 Play table games (in general) Play card games Play dice Play roulette Play slot machines Play video machine games (including video keno) Play live keno Play bingo Play instant lottery games Play lottery games (NOT INSTANT) Play pull-tabs Play games of skill (e.g., bowling, pool, darts, golf, pinball) Bet in sports pools Bet on pari-mutuel sports (dog and horse racing, jai-alai) DO NOT
INCLUDE OFF-TRACK Bet off-track on pari-mutuel sports Bet on book-type games (e.g., sports, races) Bet on charitable games, such as church raffles DO NOT INCLUDE BINGO Gamble on the Internet/world wide web Gamble NO FAVORITE
C16_ When you [do favorite type of gambling in C15], do you usually do so with someone you know very well?
YES GO TO C17_ NO GO TO C18_
C17_ Who do you usually [do favorite type of gambling in C15] with?
spouse or partner other family member(s) friend(s), co-worker(s), neighbor(s), club member(s) some other individual or group
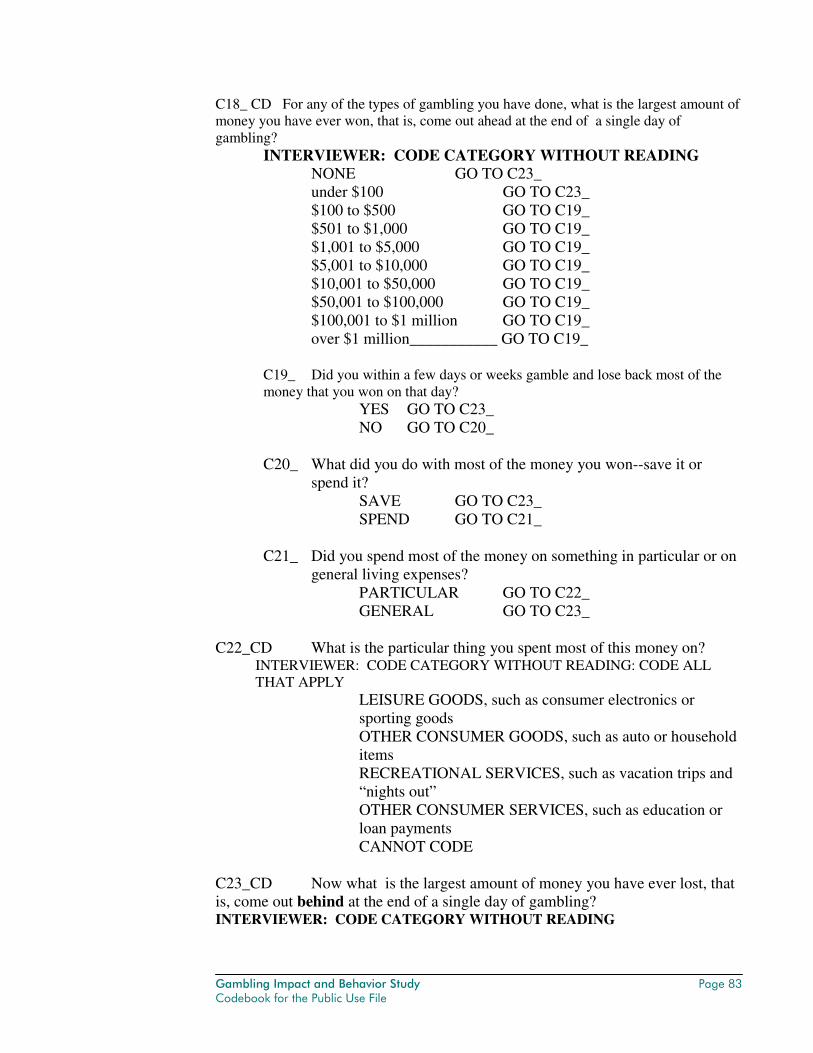
Gambling Impact and Behavior Study Page 83 Codebook for the Public Use File
C18_ CD For any of the types of gambling you have done, what is the largest amount of money you have ever won, that is, come out ahead at the end of a single day of gambling?
INTERVIEWER: CODE CATEGORY WITHOUT READING NONE GO TO C23_
under $100 GO TO C23_ $100 to $500 GO TO C19_ $501 to $1,000 GO TO C19_ $1,001 to $5,000 GO TO C19_ $5,001 to $10,000 GO TO C19_ $10,001 to $50,000 GO TO C19_ $50,001 to $100,000 GO TO C19_ $100,001 to $1 million GO TO C19_ over $1 million___________ GO TO C19_
C19_ Did you within a few days or weeks gamble and lose back most of the money that you won on that day?
YES GO TO C23_ NO GO TO C20_
C20_ What did you do with most of the money you won--save it or
spend it? SAVE GO TO C23_ SPEND GO TO C21_
C21_ Did you spend most of the money on something in particular or on
general living expenses? PARTICULAR GO TO C22_ GENERAL GO TO C23_
C22_CD What is the particular thing you spent most of this money on?
INTERVIEWER: CODE CATEGORY WITHOUT READING: CODE ALL THAT APPLY
LEISURE GOODS, such as consumer electronics or sporting goods OTHER CONSUMER GOODS, such as auto or household items RECREATIONAL SERVICES, such as vacation trips and “nights out” OTHER CONSUMER SERVICES, such as education or loan payments CANNOT CODE
C23_CD Now what is the largest amount of money you have ever lost, that is, come out behind at the end of a single day of gambling? INTERVIEWER: CODE CATEGORY WITHOUT READING
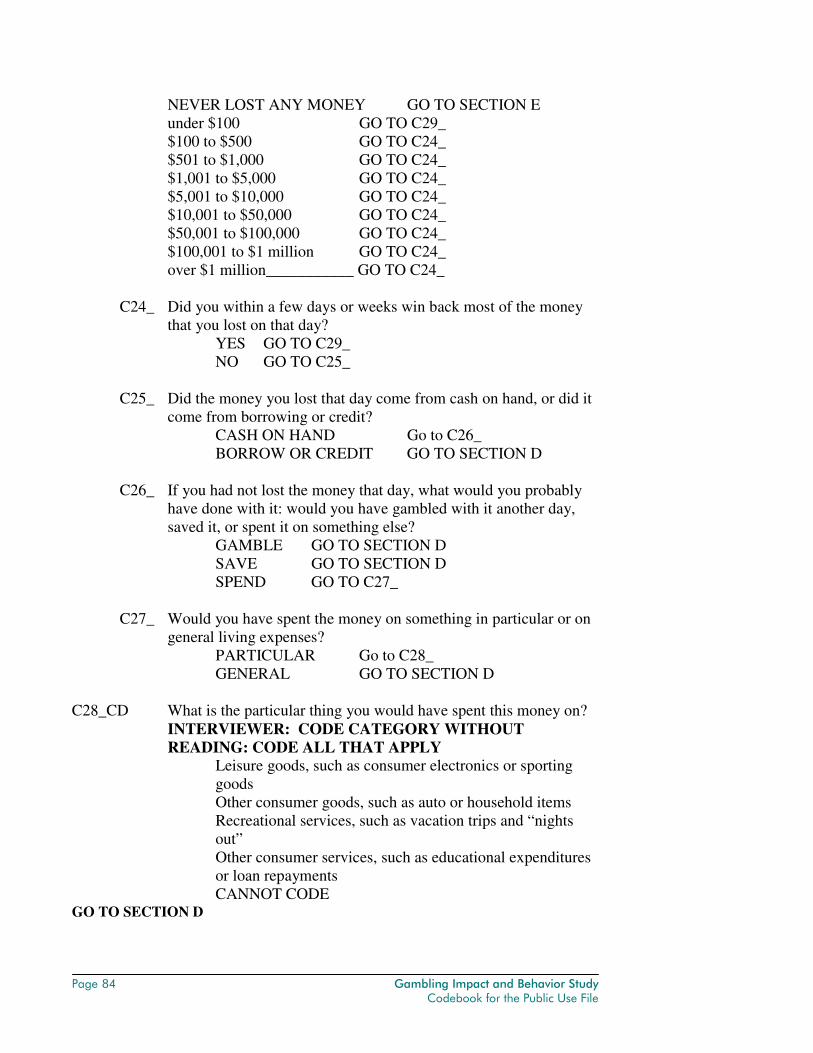
Page 84 Gambling Impact and Behavior Study Codebook for the Public Use File
NEVER LOST ANY MONEY GO TO SECTION E under $100 GO TO C29_ $100 to $500 GO TO C24_ $501 to $1,000 GO TO C24_ $1,001 to $5,000 GO TO C24_ $5,001 to $10,000 GO TO C24_ $10,001 to $50,000 GO TO C24_ $50,001 to $100,000 GO TO C24_ $100,001 to $1 million GO TO C24_ over $1 million___________ GO TO C24_
C24_ Did you within a few days or weeks win back most of the money
that you lost on that day? YES GO TO C29_ NO GO TO C25_
C25_ Did the money you lost that day come from cash on hand, or did it
come from borrowing or credit? CASH ON HAND Go to C26_ BORROW OR CREDIT GO TO SECTION D
C26_ If you had not lost the money that day, what would you probably have done with it: would you have gambled with it another day, saved it, or spent it on something else?
GAMBLE GO TO SECTION D SAVE GO TO SECTION D SPEND GO TO C27_
C27_ Would you have spent the money on something in particular or on
general living expenses? PARTICULAR Go to C28_ GENERAL GO TO SECTION D
C28_CD What is the particular thing you would have spent this money on?
INTERVIEWER: CODE CATEGORY WITHOUT READING: CODE ALL THAT APPLY
Leisure goods, such as consumer electronics or sporting goods Other consumer goods, such as auto or household items Recreational services, such as vacation trips and “nights out” Other consumer services, such as educational expenditures or loan repayments CANNOT CODE
GO TO SECTION D
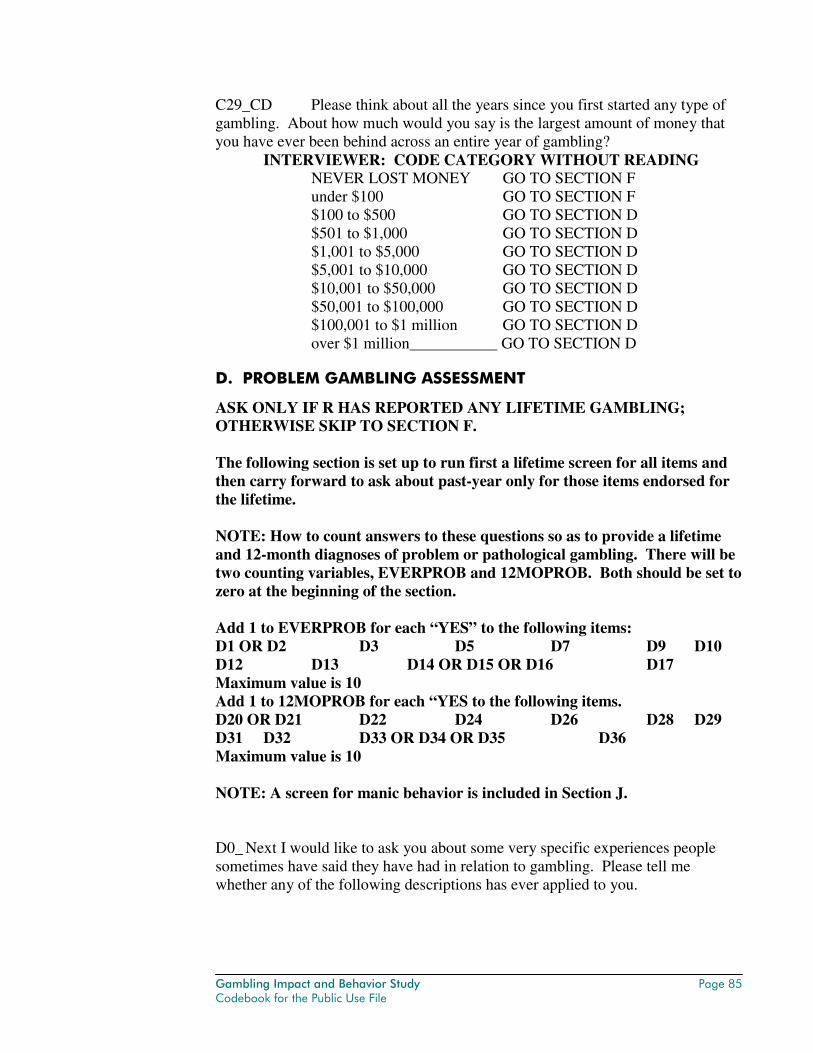
Gambling Impact and Behavior Study Page 85 Codebook for the Public Use File
C29_CD Please think about all the years since you first started any type of gambling. About how much would you say is the largest amount of money that you have ever been behind across an entire year of gambling?
INTERVIEWER: CODE CATEGORY WITHOUT READING NEVER LOST MONEY GO TO SECTION F
under $100 GO TO SECTION F $100 to $500 GO TO SECTION D $501 to $1,000 GO TO SECTION D $1,001 to $5,000 GO TO SECTION D $5,001 to $10,000 GO TO SECTION D $10,001 to $50,000 GO TO SECTION D $50,001 to $100,000 GO TO SECTION D $100,001 to $1 million GO TO SECTION D over $1 million___________ GO TO SECTION D
D. PROBLEM GAMBLING ASSESSMENT
ASK ONLY IF R HAS REPORTED ANY LIFETIME GAMBLING; OTHERWISE SKIP TO SECTION F. The following section is set up to run first a lifetime screen for all items and then carry forward to ask about past-year only for those items endorsed for the lifetime. NOTE: How to count answers to these questions so as to provide a lifetime and 12-month diagnoses of problem or pathological gambling. There will be two counting variables, EVERPROB and 12MOPROB. Both should be set to zero at the beginning of the section. Add 1 to EVERPROB for each “YES” to the following items: D1 OR D2 D3 D5 D7 D9 D10 D12 D13 D14 OR D15 OR D16 D17 Maximum value is 10 Add 1 to 12MOPROB for each “YES to the following items. D20 OR D21 D22 D24 D26 D28 D29 D31 D32 D33 OR D34 OR D35 D36 Maximum value is 10 NOTE: A screen for manic behavior is included in Section J. D0_ Next I would like to ask you about some very specific experiences people sometimes have said they have had in relation to gambling. Please tell me whether any of the following descriptions has ever applied to you.
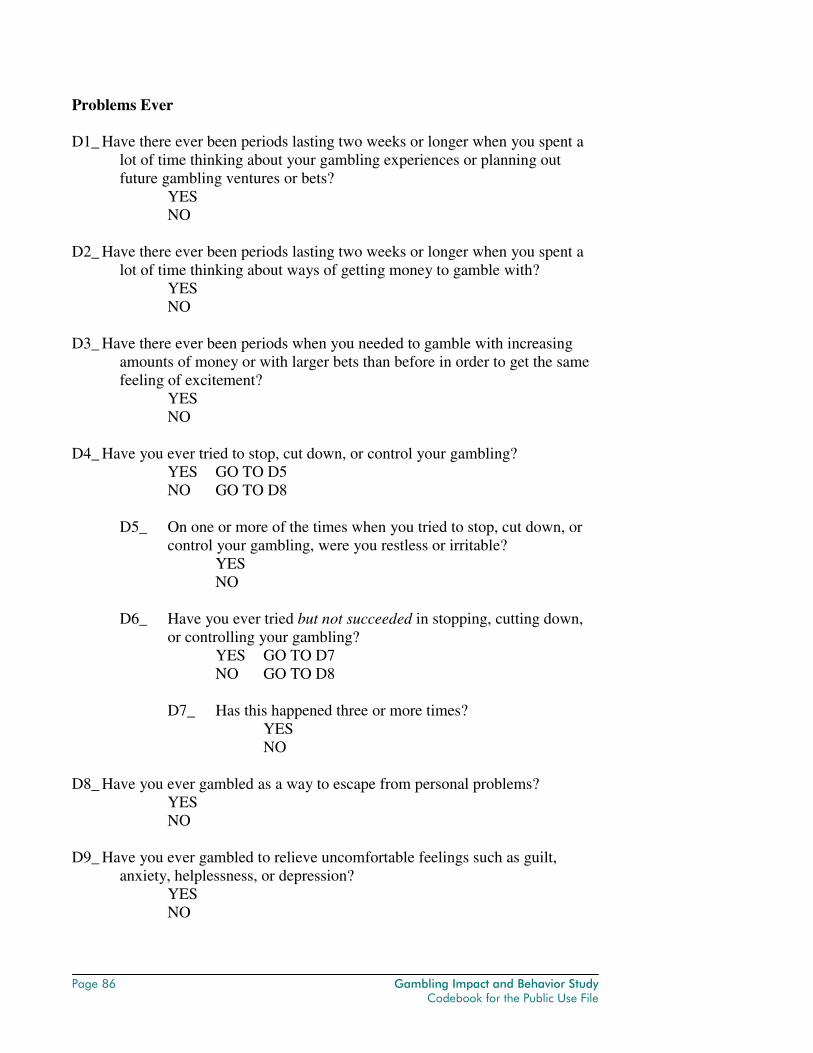
Page 86 Gambling Impact and Behavior Study Codebook for the Public Use File
Problems Ever D1_ Have there ever been periods lasting two weeks or longer when you spent a
lot of time thinking about your gambling experiences or planning out future gambling ventures or bets?
YES NO
D2_ Have there ever been periods lasting two weeks or longer when you spent a
lot of time thinking about ways of getting money to gamble with? YES NO
D3_ Have there ever been periods when you needed to gamble with increasing
amounts of money or with larger bets than before in order to get the same feeling of excitement?
YES NO
D4_ Have you ever tried to stop, cut down, or control your gambling? YES GO TO D5 NO GO TO D8
D5_ On one or more of the times when you tried to stop, cut down, or
control your gambling, were you restless or irritable? YES NO
D6_ Have you ever tried but not succeeded in stopping, cutting down,
or controlling your gambling? YES GO TO D7 NO GO TO D8
D7_ Has this happened three or more times?
YES NO
D8_ Have you ever gambled as a way to escape from personal problems?
YES NO
D9_ Have you ever gambled to relieve uncomfortable feelings such as guilt,
anxiety, helplessness, or depression? YES NO
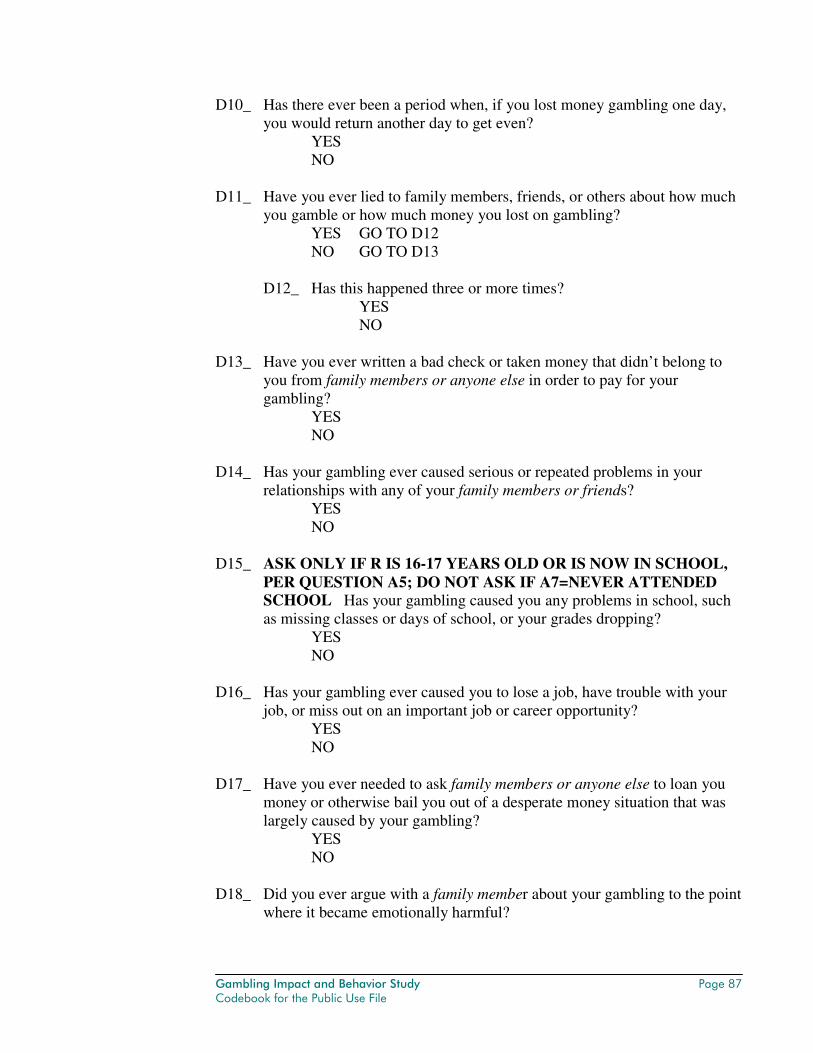
Gambling Impact and Behavior Study Page 87 Codebook for the Public Use File
D10_ Has there ever been a period when, if you lost money gambling one day, you would return another day to get even?
YES NO
D11_ Have you ever lied to family members, friends, or others about how much
you gamble or how much money you lost on gambling? YES GO TO D12 NO GO TO D13
D12_ Has this happened three or more times?
YES NO
D13_ Have you ever written a bad check or taken money that didn’t belong to
you from family members or anyone else in order to pay for your gambling?
YES NO
D14_ Has your gambling ever caused serious or repeated problems in your relationships with any of your family members or friends?
YES NO
D15_ ASK ONLY IF R IS 16-17 YEARS OLD OR IS NOW IN SCHOOL,
PER QUESTION A5; DO NOT ASK IF A7=NEVER ATTENDED SCHOOL Has your gambling caused you any problems in school, such as missing classes or days of school, or your grades dropping?
YES NO
D16_ Has your gambling ever caused you to lose a job, have trouble with your
job, or miss out on an important job or career opportunity? YES NO
D17_ Have you ever needed to ask family members or anyone else to loan you
money or otherwise bail you out of a desperate money situation that was largely caused by your gambling?
YES NO
D18_ Did you ever argue with a family member about your gambling to the point
where it became emotionally harmful?
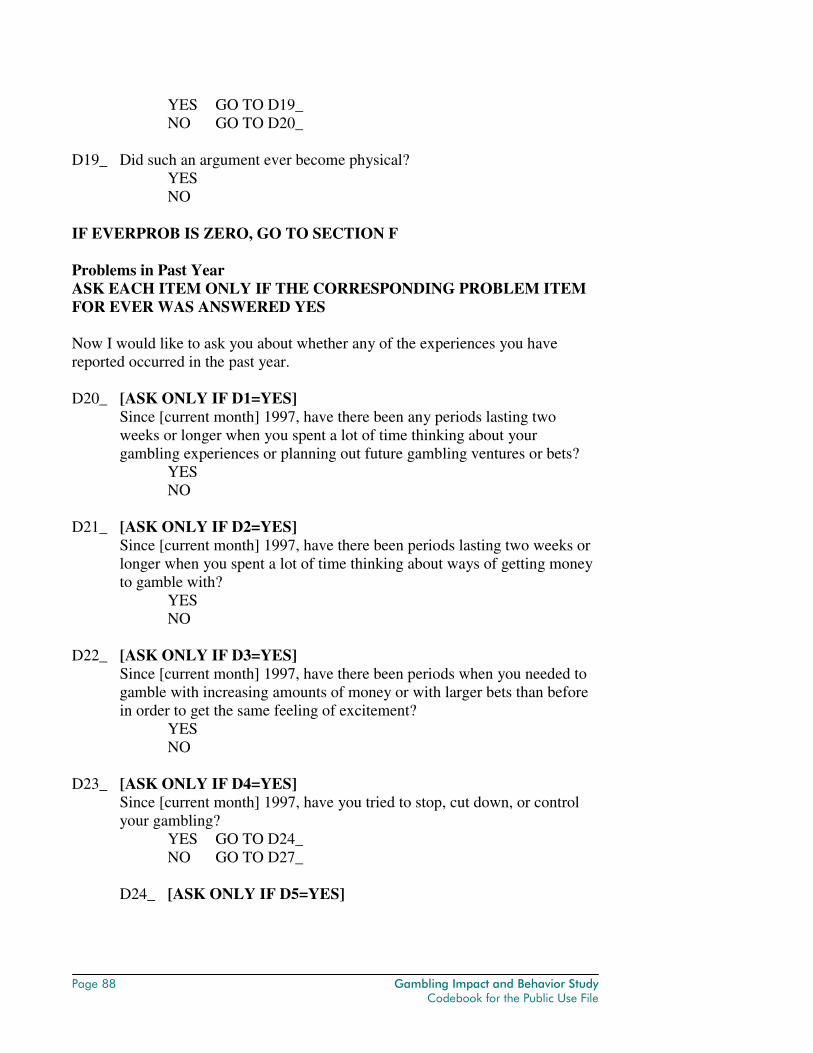
Page 88 Gambling Impact and Behavior Study Codebook for the Public Use File
YES GO TO D19_ NO GO TO D20_
D19_ Did such an argument ever become physical?
YES NO
IF EVERPROB IS ZERO, GO TO SECTION F Problems in Past Year ASK EACH ITEM ONLY IF THE CORRESPONDING PROBLEM ITEM FOR EVER WAS ANSWERED YES Now I would like to ask you about whether any of the experiences you have reported occurred in the past year. D20_ [ASK ONLY IF D1=YES]
Since [current month] 1997, have there been any periods lasting two weeks or longer when you spent a lot of time thinking about your gambling experiences or planning out future gambling ventures or bets?
YES NO
D21_ [ASK ONLY IF D2=YES]
Since [current month] 1997, have there been periods lasting two weeks or longer when you spent a lot of time thinking about ways of getting money to gamble with?
YES NO
D22_ [ASK ONLY IF D3=YES]
Since [current month] 1997, have there been periods when you needed to gamble with increasing amounts of money or with larger bets than before in order to get the same feeling of excitement?
YES NO
D23_ [ASK ONLY IF D4=YES]
Since [current month] 1997, have you tried to stop, cut down, or control your gambling?
YES GO TO D24_ NO GO TO D27_
D24_ [ASK ONLY IF D5=YES]
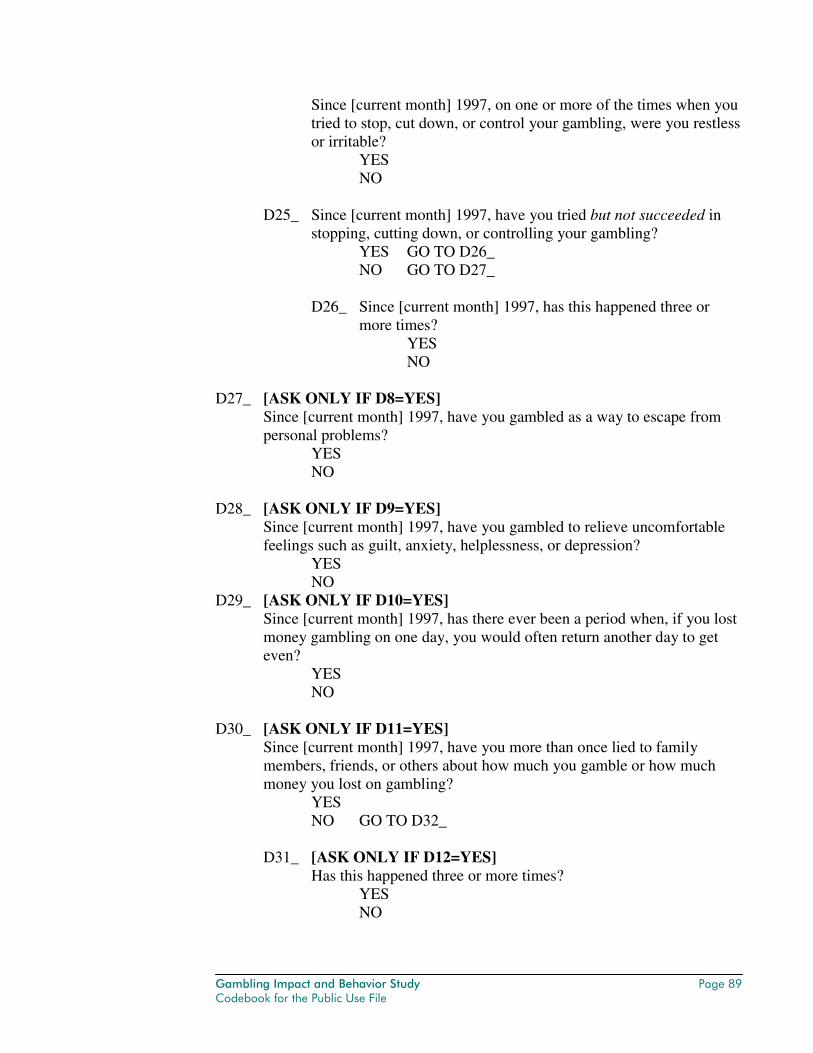
Gambling Impact and Behavior Study Page 89 Codebook for the Public Use File
Since [current month] 1997, on one or more of the times when you tried to stop, cut down, or control your gambling, were you restless or irritable?
YES NO
D25_ Since [current month] 1997, have you tried but not succeeded in
stopping, cutting down, or controlling your gambling? YES GO TO D26_ NO GO TO D27_
D26_ Since [current month] 1997, has this happened three or
more times? YES NO
D27_ [ASK ONLY IF D8=YES]
Since [current month] 1997, have you gambled as a way to escape from personal problems?
YES NO
D28_ [ASK ONLY IF D9=YES]
Since [current month] 1997, have you gambled to relieve uncomfortable feelings such as guilt, anxiety, helplessness, or depression?
YES NO
D29_ [ASK ONLY IF D10=YES] Since [current month] 1997, has there ever been a period when, if you lost money gambling on one day, you would often return another day to get even?
YES NO
D30_ [ASK ONLY IF D11=YES]
Since [current month] 1997, have you more than once lied to family members, friends, or others about how much you gamble or how much money you lost on gambling?
YES NO GO TO D32_
D31_ [ASK ONLY IF D12=YES]
Has this happened three or more times? YES NO
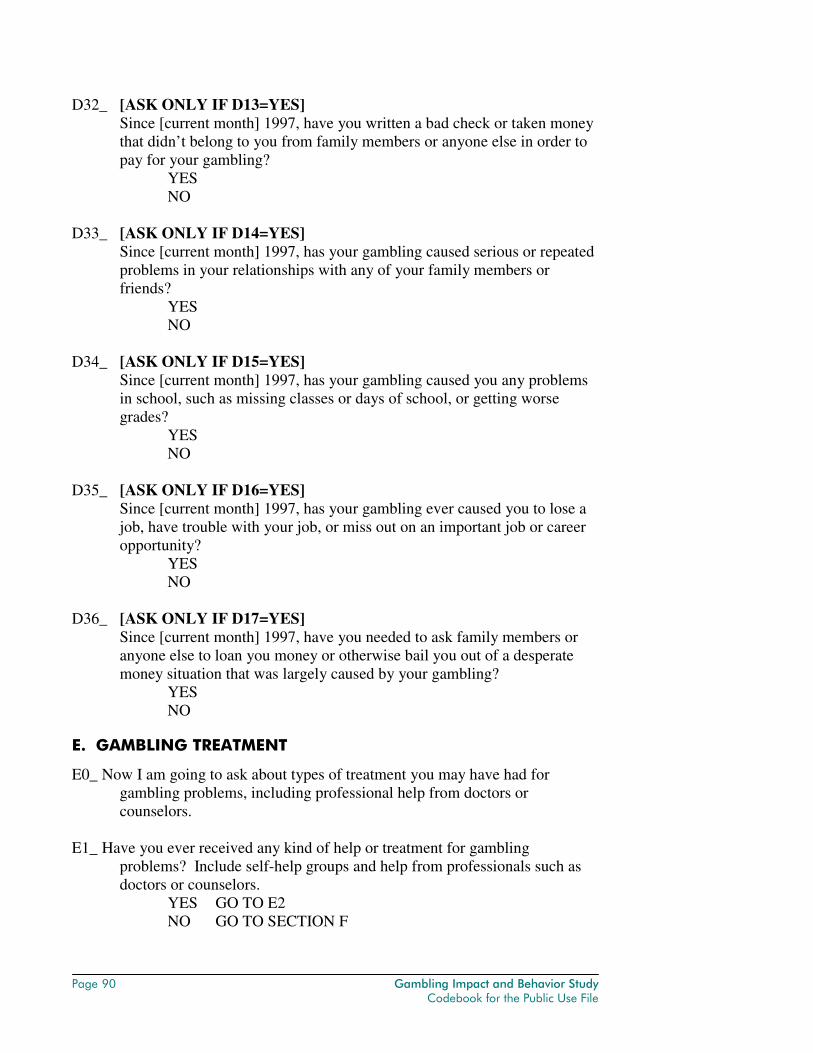
Page 90 Gambling Impact and Behavior Study Codebook for the Public Use File
D32_ [ASK ONLY IF D13=YES] Since [current month] 1997, have you written a bad check or taken money that didn’t belong to you from family members or anyone else in order to pay for your gambling?
YES NO
D33_ [ASK ONLY IF D14=YES]
Since [current month] 1997, has your gambling caused serious or repeated problems in your relationships with any of your family members or friends?
YES NO
D34_ [ASK ONLY IF D15=YES]
Since [current month] 1997, has your gambling caused you any problems in school, such as missing classes or days of school, or getting worse grades?
YES NO
D35_ [ASK ONLY IF D16=YES]
Since [current month] 1997, has your gambling ever caused you to lose a job, have trouble with your job, or miss out on an important job or career opportunity?
YES NO
D36_ [ASK ONLY IF D17=YES]
Since [current month] 1997, have you needed to ask family members or anyone else to loan you money or otherwise bail you out of a desperate money situation that was largely caused by your gambling?
YES NO
E. GAMBLING TREATMENT
E0_ Now I am going to ask about types of treatment you may have had for gambling problems, including professional help from doctors or counselors.
E1_ Have you ever received any kind of help or treatment for gambling
problems? Include self-help groups and help from professionals such as doctors or counselors.
YES GO TO E2 NO GO TO SECTION F
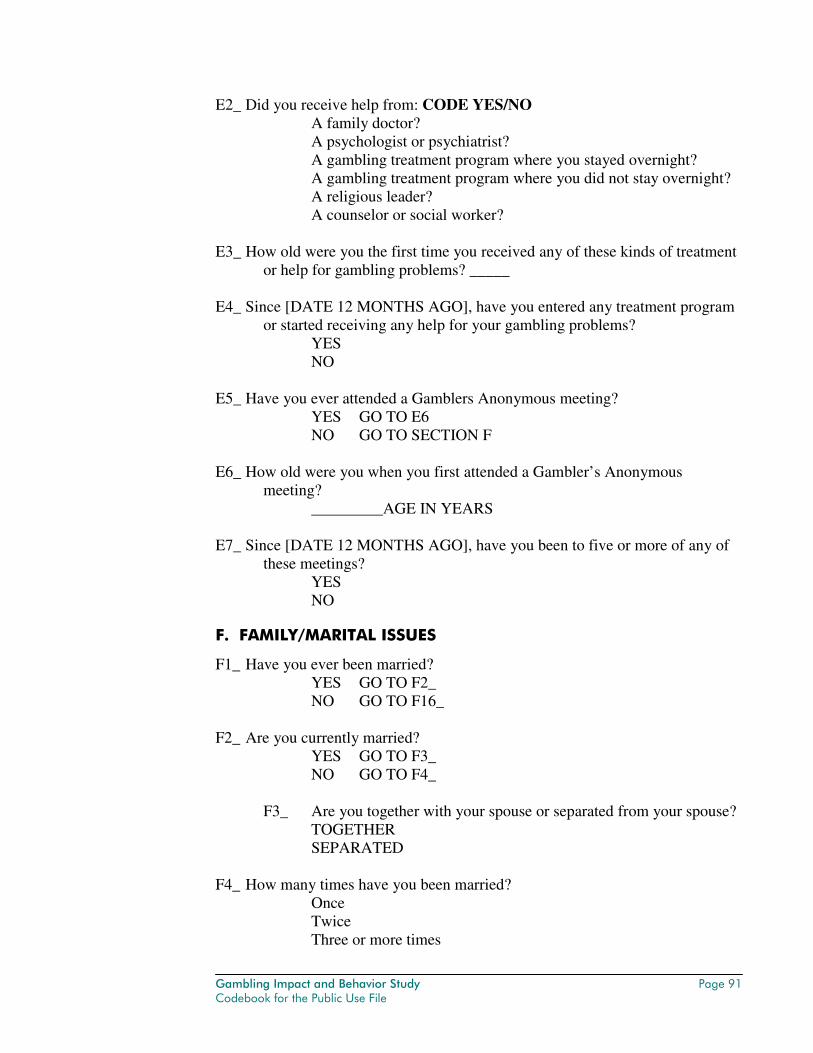
Gambling Impact and Behavior Study Page 91 Codebook for the Public Use File
E2_ Did you receive help from: CODE YES/NO A family doctor? A psychologist or psychiatrist? A gambling treatment program where you stayed overnight? A gambling treatment program where you did not stay overnight? A religious leader? A counselor or social worker?
E3_ How old were you the first time you received any of these kinds of treatment
or help for gambling problems? _____ E4_ Since [DATE 12 MONTHS AGO], have you entered any treatment program
or started receiving any help for your gambling problems? YES NO
E5_ Have you ever attended a Gamblers Anonymous meeting?
YES GO TO E6 NO GO TO SECTION F
E6_ How old were you when you first attended a Gambler’s Anonymous
meeting? _________AGE IN YEARS
E7_ Since [DATE 12 MONTHS AGO], have you been to five or more of any of
these meetings? YES NO
F. FAMILY/MARITAL ISSUES
F1_ Have you ever been married? YES GO TO F2_ NO GO TO F16_
F2_ Are you currently married?
YES GO TO F3_ NO GO TO F4_
F3_ Are you together with your spouse or separated from your spouse?
TOGETHER SEPARATED
F4_ How many times have you been married?
Once Twice Three or more times
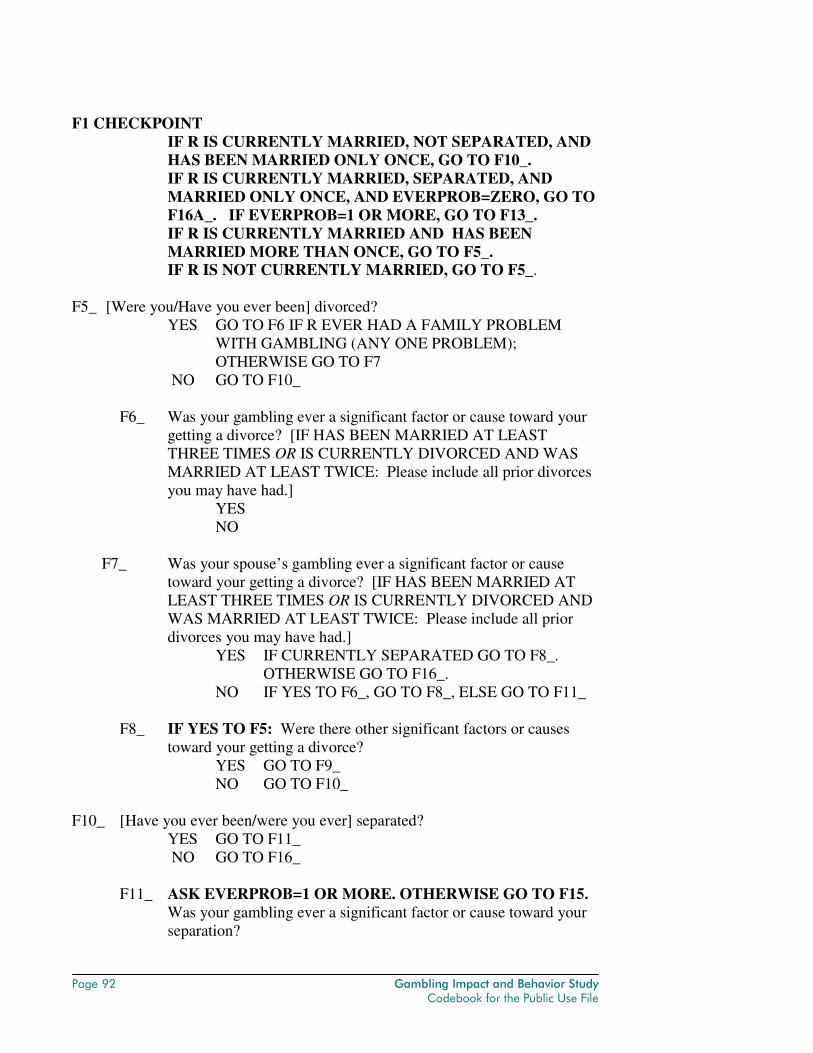
Page 92 Gambling Impact and Behavior Study Codebook for the Public Use File
F1 CHECKPOINT
IF R IS CURRENTLY MARRIED, NOT SEPARATED, AND HAS BEEN MARRIED ONLY ONCE, GO TO F10_. IF R IS CURRENTLY MARRIED, SEPARATED, AND MARRIED ONLY ONCE, AND EVERPROB=ZERO, GO TO F16A_. IF EVERPROB=1 OR MORE, GO TO F13_. IF R IS CURRENTLY MARRIED AND HAS BEEN MARRIED MORE THAN ONCE, GO TO F5_. IF R IS NOT CURRENTLY MARRIED, GO TO F5_.
F5_ [Were you/Have you ever been] divorced?
YES GO TO F6 IF R EVER HAD A FAMILY PROBLEM WITH GAMBLING (ANY ONE PROBLEM); OTHERWISE GO TO F7
NO GO TO F10_
F6_ Was your gambling ever a significant factor or cause toward your getting a divorce? [IF HAS BEEN MARRIED AT LEAST THREE TIMES OR IS CURRENTLY DIVORCED AND WAS MARRIED AT LEAST TWICE: Please include all prior divorces you may have had.]
YES NO
F7_ Was your spouse’s gambling ever a significant factor or cause
toward your getting a divorce? [IF HAS BEEN MARRIED AT LEAST THREE TIMES OR IS CURRENTLY DIVORCED AND WAS MARRIED AT LEAST TWICE: Please include all prior divorces you may have had.]
YES IF CURRENTLY SEPARATED GO TO F8_. OTHERWISE GO TO F16_.
NO IF YES TO F6_, GO TO F8_, ELSE GO TO F11_
F8_ IF YES TO F5: Were there other significant factors or causes toward your getting a divorce?
YES GO TO F9_ NO GO TO F10_
F10_ [Have you ever been/were you ever] separated?
YES GO TO F11_ NO GO TO F16_
F11_ ASK EVERPROB=1 OR MORE. OTHERWISE GO TO F15.
Was your gambling ever a significant factor or cause toward your separation?
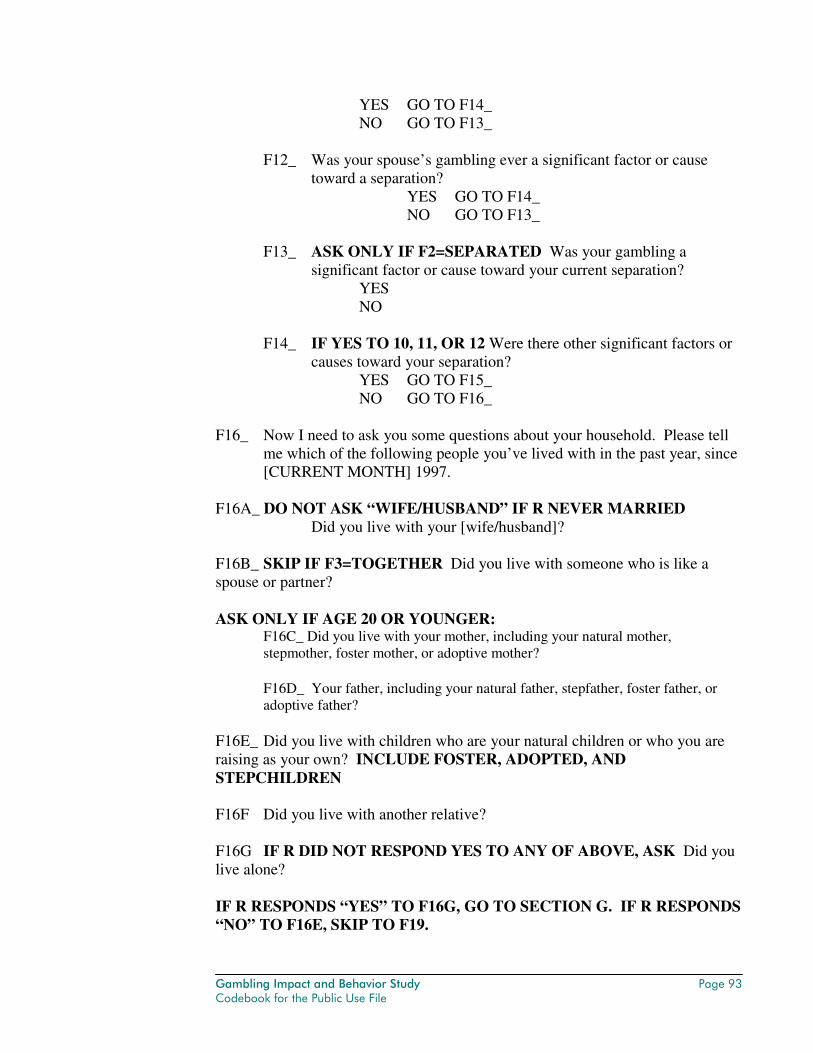
Gambling Impact and Behavior Study Page 93 Codebook for the Public Use File
YES GO TO F14_ NO GO TO F13_
F12_ Was your spouse’s gambling ever a significant factor or cause
toward a separation? YES GO TO F14_ NO GO TO F13_
F13_ ASK ONLY IF F2=SEPARATED Was your gambling a
significant factor or cause toward your current separation? YES NO
F14_ IF YES TO 10, 11, OR 12 Were there other significant factors or
causes toward your separation? YES GO TO F15_ NO GO TO F16_
F16_ Now I need to ask you some questions about your household. Please tell
me which of the following people you’ve lived with in the past year, since [CURRENT MONTH] 1997.
F16A_ DO NOT ASK “WIFE/HUSBAND” IF R NEVER MARRIED
Did you live with your [wife/husband]?
F16B_ SKIP IF F3=TOGETHER Did you live with someone who is like a spouse or partner?
ASK ONLY IF AGE 20 OR YOUNGER:
F16C_ Did you live with your mother, including your natural mother, stepmother, foster mother, or adoptive mother?
F16D_ Your father, including your natural father, stepfather, foster father, or adoptive father?
F16E_ Did you live with children who are your natural children or who you are raising as your own? INCLUDE FOSTER, ADOPTED, AND STEPCHILDREN F16F Did you live with another relative? F16G IF R DID NOT RESPOND YES TO ANY OF ABOVE, ASK Did you live alone? IF R RESPONDS “YES” TO F16G, GO TO SECTION G. IF R RESPONDS “NO” TO F16E, SKIP TO F19.
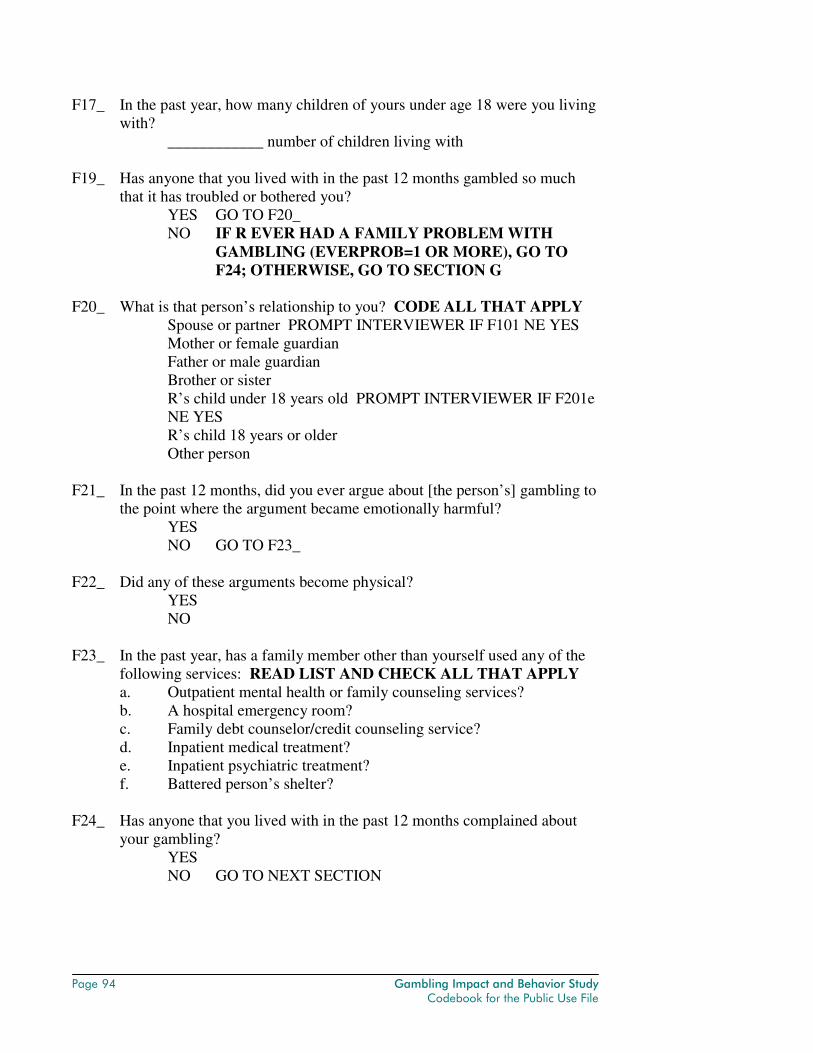
Page 94 Gambling Impact and Behavior Study Codebook for the Public Use File
F17_ In the past year, how many children of yours under age 18 were you living with?
____________ number of children living with F19_ Has anyone that you lived with in the past 12 months gambled so much
that it has troubled or bothered you? YES GO TO F20_ NO IF R EVER HAD A FAMILY PROBLEM WITH
GAMBLING (EVERPROB=1 OR MORE), GO TO F24; OTHERWISE, GO TO SECTION G
F20_ What is that person’s relationship to you? CODE ALL THAT APPLY
Spouse or partner PROMPT INTERVIEWER IF F101 NE YES Mother or female guardian Father or male guardian Brother or sister R’s child under 18 years old PROMPT INTERVIEWER IF F201e NE YES R’s child 18 years or older Other person
F21_ In the past 12 months, did you ever argue about [the person’s] gambling to
the point where the argument became emotionally harmful? YES NO GO TO F23_
F22_ Did any of these arguments become physical?
YES NO
F23_ In the past year, has a family member other than yourself used any of the
following services: READ LIST AND CHECK ALL THAT APPLY a. Outpatient mental health or family counseling services? b. A hospital emergency room? c. Family debt counselor/credit counseling service? d. Inpatient medical treatment? e. Inpatient psychiatric treatment? f. Battered person’s shelter?
F24_ Has anyone that you lived with in the past 12 months complained about
your gambling? YES NO GO TO NEXT SECTION
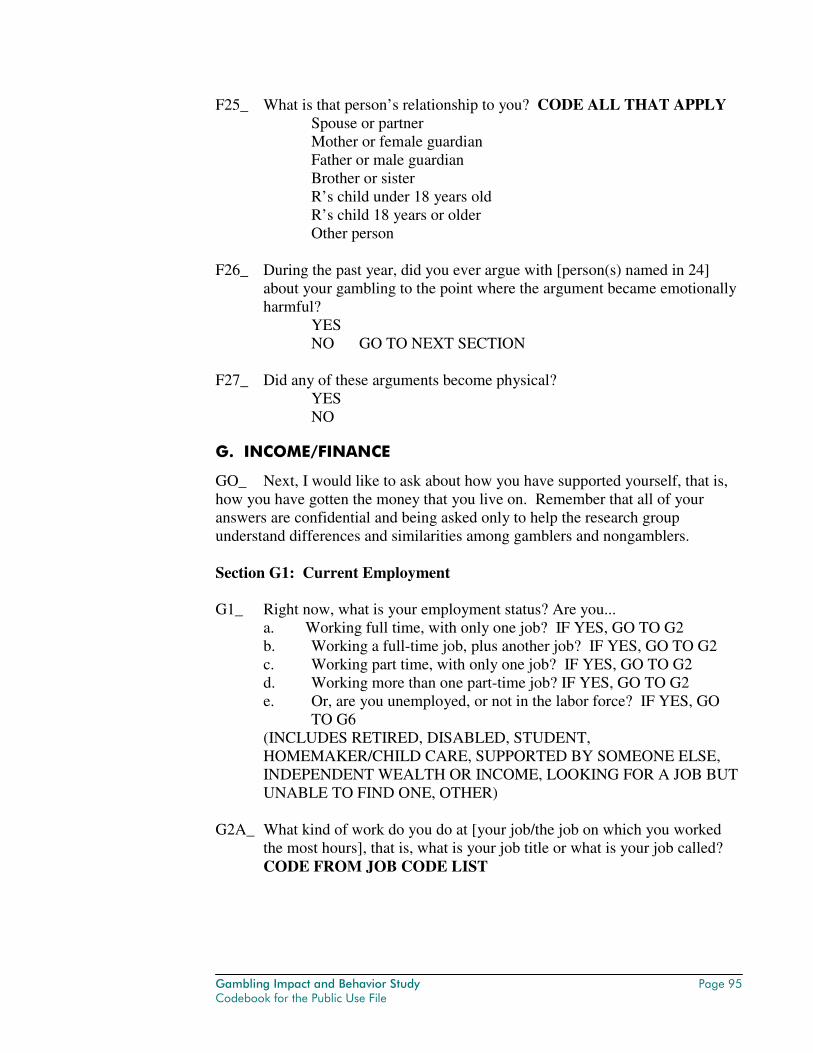
Gambling Impact and Behavior Study Page 95 Codebook for the Public Use File
F25_ What is that person’s relationship to you? CODE ALL THAT APPLY Spouse or partner Mother or female guardian Father or male guardian Brother or sister R’s child under 18 years old R’s child 18 years or older Other person
F26_ During the past year, did you ever argue with [person(s) named in 24]
about your gambling to the point where the argument became emotionally harmful?
YES NO GO TO NEXT SECTION
F27_ Did any of these arguments become physical?
YES NO
G. INCOME/FINANCE
GO_ Next, I would like to ask about how you have supported yourself, that is, how you have gotten the money that you live on. Remember that all of your answers are confidential and being asked only to help the research group understand differences and similarities among gamblers and nongamblers. Section G1: Current Employment G1_ Right now, what is your employment status? Are you...
a. Working full time, with only one job? IF YES, GO TO G2 b. Working a full-time job, plus another job? IF YES, GO TO G2 c. Working part time, with only one job? IF YES, GO TO G2 d. Working more than one part-time job? IF YES, GO TO G2 e. Or, are you unemployed, or not in the labor force? IF YES, GO
TO G6 (INCLUDES RETIRED, DISABLED, STUDENT, HOMEMAKER/CHILD CARE, SUPPORTED BY SOMEONE ELSE, INDEPENDENT WEALTH OR INCOME, LOOKING FOR A JOB BUT UNABLE TO FIND ONE, OTHER)
G2A_ What kind of work do you do at [your job/the job on which you worked
the most hours], that is, what is your job title or what is your job called? CODE FROM JOB CODE LIST
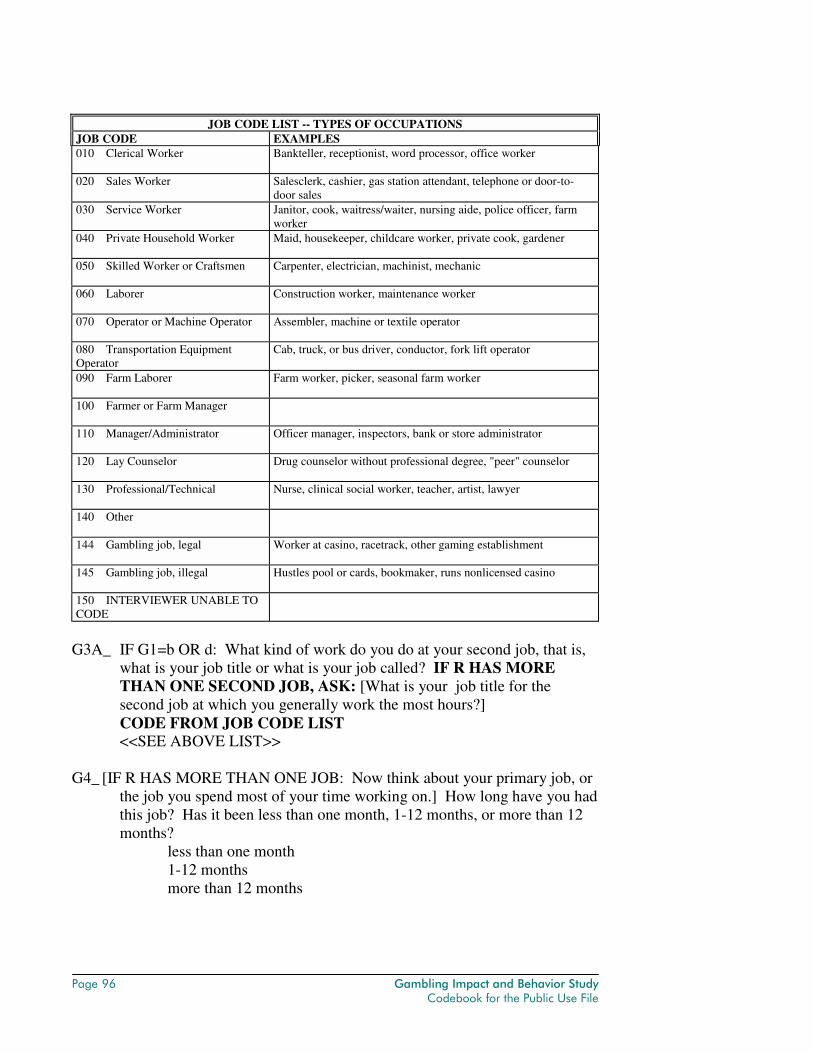
Page 96 Gambling Impact and Behavior Study Codebook for the Public Use File
JOB CODE LIST -- TYPES OF OCCUPATIONS
JOB CODE EXAMPLES 010 Clerical Worker Bankteller, receptionist, word processor, office worker
020 Sales Worker Salesclerk, cashier, gas station attendant, telephone or door-to-door sales
030 Service Worker Janitor, cook, waitress/waiter, nursing aide, police officer, farm worker
040 Private Household Worker Maid, housekeeper, childcare worker, private cook, gardener
050 Skilled Worker or Craftsmen Carpenter, electrician, machinist, mechanic
060 Laborer Construction worker, maintenance worker
070 Operator or Machine Operator Assembler, machine or textile operator
080 Transportation Equipment Operator
Cab, truck, or bus driver, conductor, fork lift operator
090 Farm Laborer Farm worker, picker, seasonal farm worker
100 Farmer or Farm Manager
110 Manager/Administrator Officer manager, inspectors, bank or store administrator
120 Lay Counselor Drug counselor without professional degree, "peer" counselor
130 Professional/Technical Nurse, clinical social worker, teacher, artist, lawyer
140 Other
144 Gambling job, legal Worker at casino, racetrack, other gaming establishment
145 Gambling job, illegal Hustles pool or cards, bookmaker, runs nonlicensed casino
150 INTERVIEWER UNABLE TO CODE
G3A_ IF G1=b OR d: What kind of work do you do at your second job, that is,
what is your job title or what is your job called? IF R HAS MORE THAN ONE SECOND JOB, ASK: [What is your job title for the second job at which you generally work the most hours?]
CODE FROM JOB CODE LIST <<SEE ABOVE LIST>>
G4_ [IF R HAS MORE THAN ONE JOB: Now think about your primary job, or
the job you spend most of your time working on.] How long have you had this job? Has it been less than one month, 1-12 months, or more than 12 months?
less than one month 1-12 months more than 12 months
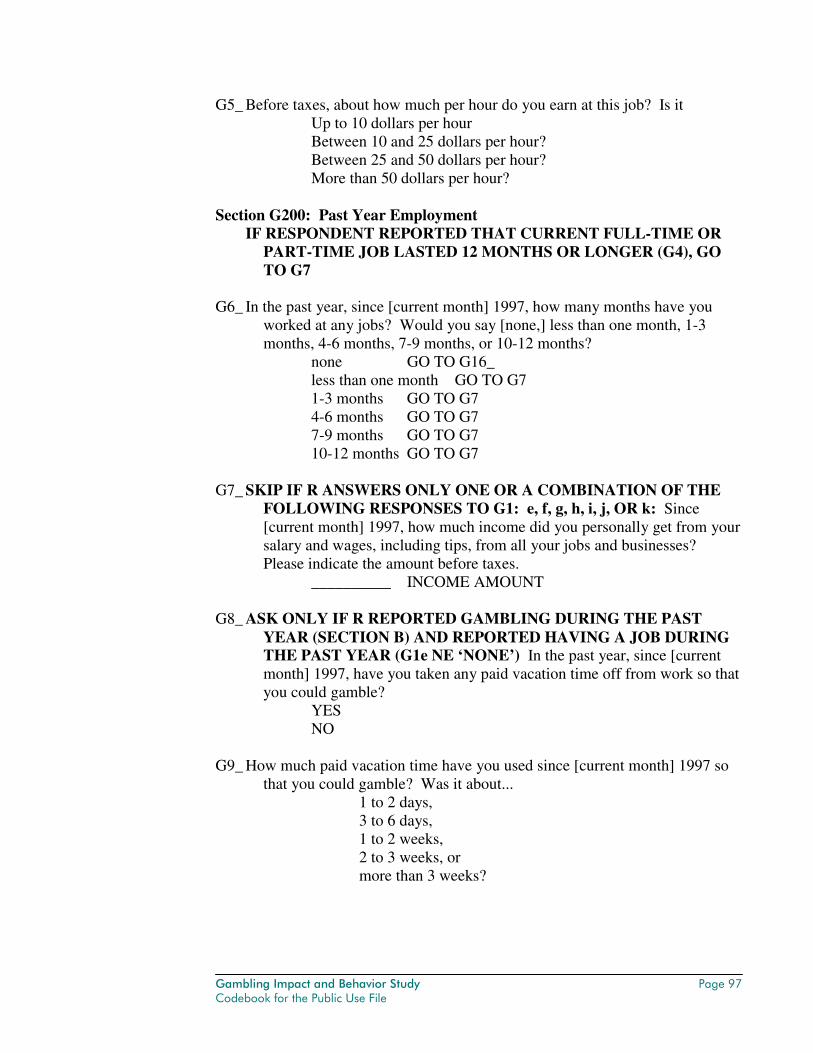
Gambling Impact and Behavior Study Page 97 Codebook for the Public Use File
G5_ Before taxes, about how much per hour do you earn at this job? Is it Up to 10 dollars per hour Between 10 and 25 dollars per hour? Between 25 and 50 dollars per hour? More than 50 dollars per hour?
Section G200: Past Year Employment IF RESPONDENT REPORTED THAT CURRENT FULL-TIME OR
PART-TIME JOB LASTED 12 MONTHS OR LONGER (G4), GO TO G7
G6_ In the past year, since [current month] 1997, how many months have you
worked at any jobs? Would you say [none,] less than one month, 1-3 months, 4-6 months, 7-9 months, or 10-12 months?
none GO TO G16_ less than one month GO TO G7 1-3 months GO TO G7 4-6 months GO TO G7 7-9 months GO TO G7 10-12 months GO TO G7
G7_ SKIP IF R ANSWERS ONLY ONE OR A COMBINATION OF THE
FOLLOWING RESPONSES TO G1: e, f, g, h, i, j, OR k: Since [current month] 1997, how much income did you personally get from your salary and wages, including tips, from all your jobs and businesses? Please indicate the amount before taxes.
__________ INCOME AMOUNT G8_ ASK ONLY IF R REPORTED GAMBLING DURING THE PAST
YEAR (SECTION B) AND REPORTED HAVING A JOB DURING THE PAST YEAR (G1e NE ‘NONE’) In the past year, since [current month] 1997, have you taken any paid vacation time off from work so that you could gamble?
YES NO
G9_ How much paid vacation time have you used since [current month] 1997 so
that you could gamble? Was it about... 1 to 2 days, 3 to 6 days, 1 to 2 weeks, 2 to 3 weeks, or more than 3 weeks?
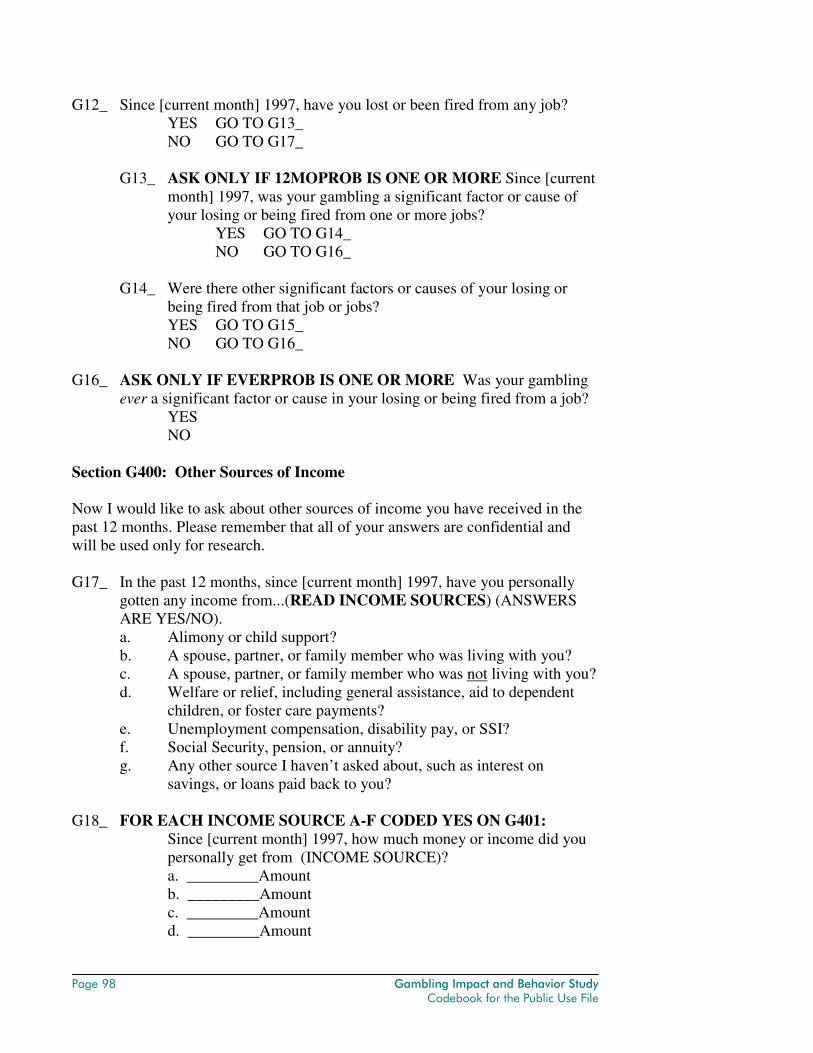
Page 98 Gambling Impact and Behavior Study Codebook for the Public Use File
G12_ Since [current month] 1997, have you lost or been fired from any job? YES GO TO G13_ NO GO TO G17_
G13_ ASK ONLY IF 12MOPROB IS ONE OR MORE Since [current
month] 1997, was your gambling a significant factor or cause of your losing or being fired from one or more jobs?
YES GO TO G14_ NO GO TO G16_
G14_ Were there other significant factors or causes of your losing or
being fired from that job or jobs? YES GO TO G15_ NO GO TO G16_
G16_ ASK ONLY IF EVERPROB IS ONE OR MORE Was your gambling
ever a significant factor or cause in your losing or being fired from a job? YES NO
Section G400: Other Sources of Income Now I would like to ask about other sources of income you have received in the past 12 months. Please remember that all of your answers are confidential and will be used only for research. G17_ In the past 12 months, since [current month] 1997, have you personally
gotten any income from...(READ INCOME SOURCES) (ANSWERS ARE YES/NO). a. Alimony or child support? b. A spouse, partner, or family member who was living with you? c. A spouse, partner, or family member who was not living with you? d. Welfare or relief, including general assistance, aid to dependent
children, or foster care payments? e. Unemployment compensation, disability pay, or SSI? f. Social Security, pension, or annuity? g. Any other source I haven’t asked about, such as interest on
savings, or loans paid back to you? G18_ FOR EACH INCOME SOURCE A-F CODED YES ON G401:
Since [current month] 1997, how much money or income did you personally get from (INCOME SOURCE)? a. _________Amount b. _________Amount c. _________Amount d. _________Amount
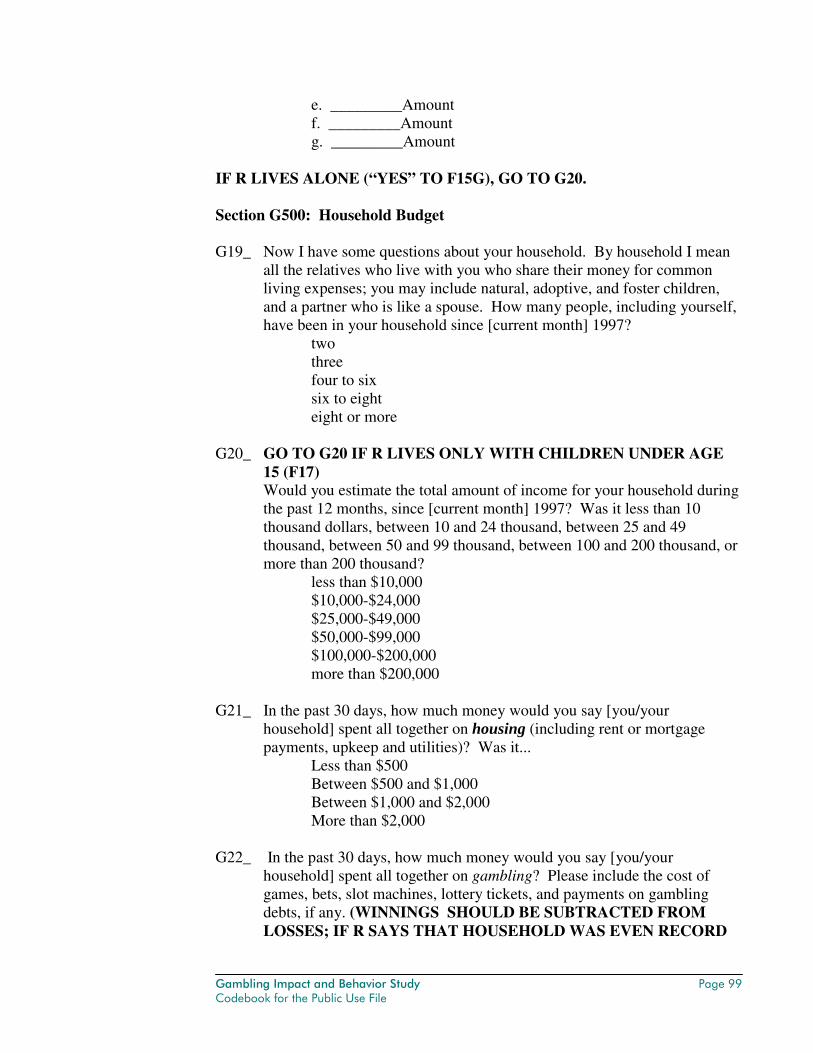
Gambling Impact and Behavior Study Page 99 Codebook for the Public Use File
e. _________Amount f. _________Amount g. _________Amount
IF R LIVES ALONE (“YES” TO F15G), GO TO G20. Section G500: Household Budget G19_ Now I have some questions about your household. By household I mean
all the relatives who live with you who share their money for common living expenses; you may include natural, adoptive, and foster children, and a partner who is like a spouse. How many people, including yourself, have been in your household since [current month] 1997?
two three four to six six to eight eight or more
G20_ GO TO G20 IF R LIVES ONLY WITH CHILDREN UNDER AGE
15 (F17) Would you estimate the total amount of income for your household during the past 12 months, since [current month] 1997? Was it less than 10 thousand dollars, between 10 and 24 thousand, between 25 and 49 thousand, between 50 and 99 thousand, between 100 and 200 thousand, or more than 200 thousand?
less than $10,000 $10,000-$24,000 $25,000-$49,000 $50,000-$99,000 $100,000-$200,000 more than $200,000
G21_ In the past 30 days, how much money would you say [you/your
household] spent all together on housing (including rent or mortgage payments, upkeep and utilities)? Was it...
Less than $500 Between $500 and $1,000 Between $1,000 and $2,000 More than $2,000
G22_ In the past 30 days, how much money would you say [you/your
household] spent all together on gambling? Please include the cost of games, bets, slot machines, lottery tickets, and payments on gambling debts, if any. (WINNINGS SHOULD BE SUBTRACTED FROM LOSSES; IF R SAYS THAT HOUSEHOLD WAS EVEN RECORD
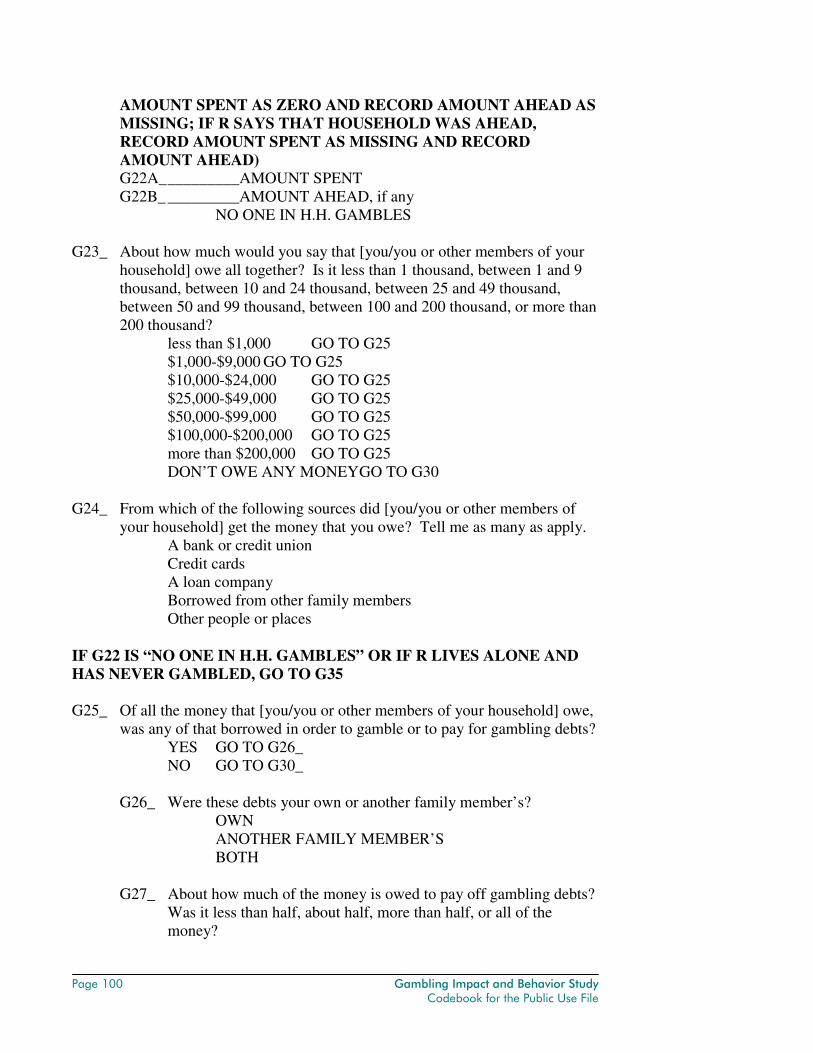
Page 100 Gambling Impact and Behavior Study Codebook for the Public Use File
AMOUNT SPENT AS ZERO AND RECORD AMOUNT AHEAD AS MISSING; IF R SAYS THAT HOUSEHOLD WAS AHEAD, RECORD AMOUNT SPENT AS MISSING AND RECORD AMOUNT AHEAD) G22A_ _________AMOUNT SPENT G22B_ _________AMOUNT AHEAD, if any
NO ONE IN H.H. GAMBLES G23_ About how much would you say that [you/you or other members of your
household] owe all together? Is it less than 1 thousand, between 1 and 9 thousand, between 10 and 24 thousand, between 25 and 49 thousand, between 50 and 99 thousand, between 100 and 200 thousand, or more than 200 thousand?
less than $1,000 GO TO G25 $1,000-$9,000 GO TO G25 $10,000-$24,000 GO TO G25 $25,000-$49,000 GO TO G25 $50,000-$99,000 GO TO G25 $100,000-$200,000 GO TO G25 more than $200,000 GO TO G25 DON’T OWE ANY MONEY GO TO G30
G24_ From which of the following sources did [you/you or other members of your household] get the money that you owe? Tell me as many as apply.
A bank or credit union Credit cards A loan company
Borrowed from other family members Other people or places
IF G22 IS “NO ONE IN H.H. GAMBLES” OR IF R LIVES ALONE AND HAS NEVER GAMBLED, GO TO G35 G25_ Of all the money that [you/you or other members of your household] owe,
was any of that borrowed in order to gamble or to pay for gambling debts? YES GO TO G26_ NO GO TO G30_
G26_ Were these debts your own or another family member’s?
OWN ANOTHER FAMILY MEMBER’S BOTH
G27_ About how much of the money is owed to pay off gambling debts?
Was it less than half, about half, more than half, or all of the money?
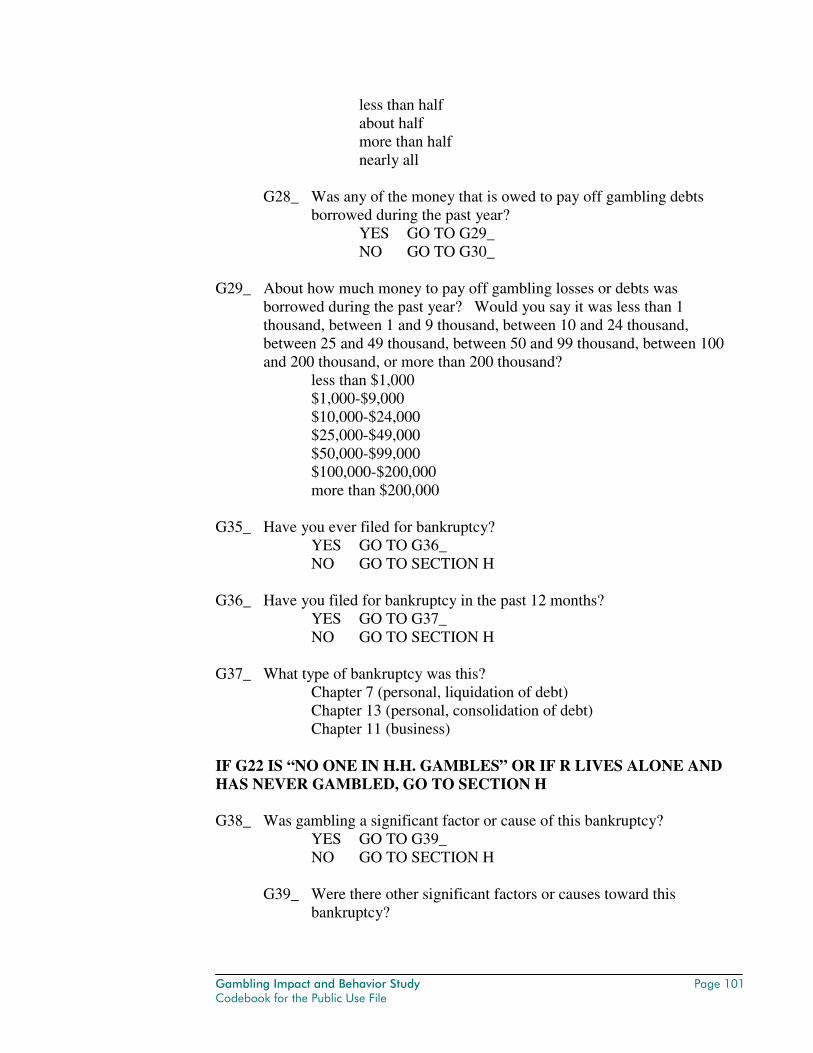
Gambling Impact and Behavior Study Page 101 Codebook for the Public Use File
less than half about half more than half nearly all
G28_ Was any of the money that is owed to pay off gambling debts
borrowed during the past year? YES GO TO G29_ NO GO TO G30_
G29_ About how much money to pay off gambling losses or debts was
borrowed during the past year? Would you say it was less than 1 thousand, between 1 and 9 thousand, between 10 and 24 thousand, between 25 and 49 thousand, between 50 and 99 thousand, between 100 and 200 thousand, or more than 200 thousand?
less than $1,000 $1,000-$9,000 $10,000-$24,000 $25,000-$49,000 $50,000-$99,000 $100,000-$200,000 more than $200,000
G35_ Have you ever filed for bankruptcy?
YES GO TO G36_ NO GO TO SECTION H
G36_ Have you filed for bankruptcy in the past 12 months?
YES GO TO G37_ NO GO TO SECTION H
G37_ What type of bankruptcy was this?
Chapter 7 (personal, liquidation of debt) Chapter 13 (personal, consolidation of debt) Chapter 11 (business)
IF G22 IS “NO ONE IN H.H. GAMBLES” OR IF R LIVES ALONE AND HAS NEVER GAMBLED, GO TO SECTION H G38_ Was gambling a significant factor or cause of this bankruptcy?
YES GO TO G39_ NO GO TO SECTION H
G39_ Were there other significant factors or causes toward this
bankruptcy?
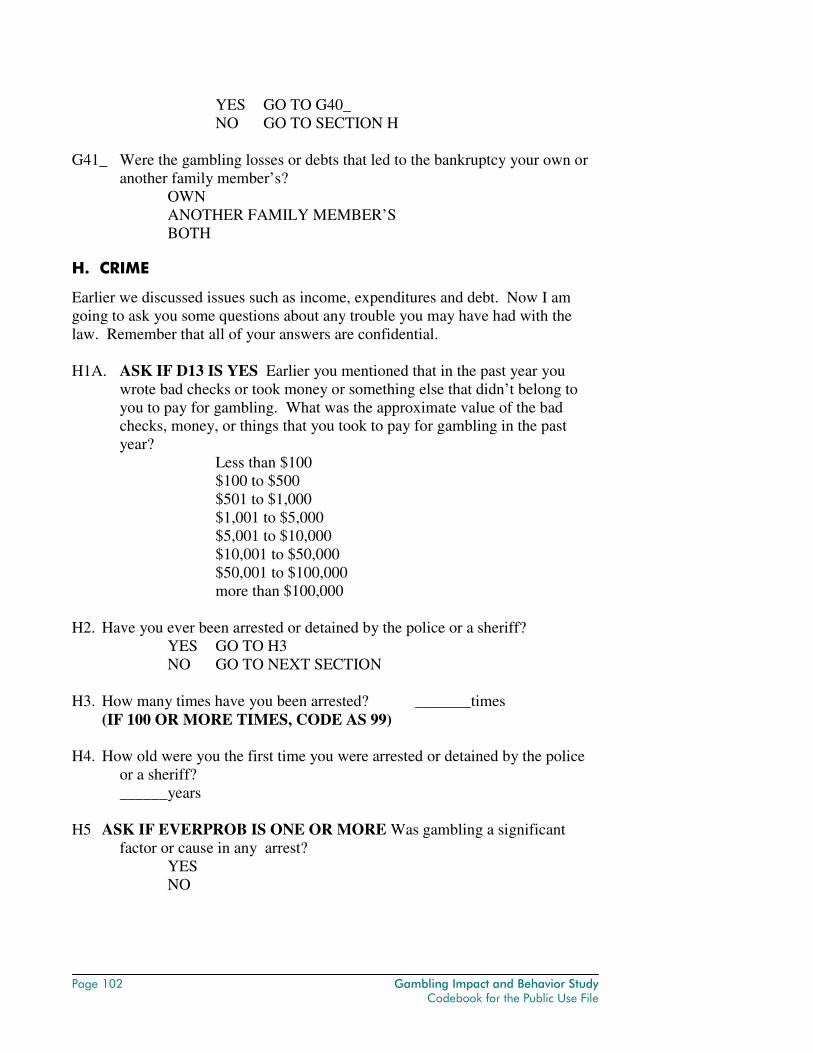
Page 102 Gambling Impact and Behavior Study Codebook for the Public Use File
YES GO TO G40_ NO GO TO SECTION H
G41_ Were the gambling losses or debts that led to the bankruptcy your own or
another family member’s? OWN ANOTHER FAMILY MEMBER’S BOTH
H. CRIME
Earlier we discussed issues such as income, expenditures and debt. Now I am going to ask you some questions about any trouble you may have had with the law. Remember that all of your answers are confidential. H1A. ASK IF D13 IS YES Earlier you mentioned that in the past year you
wrote bad checks or took money or something else that didn’t belong to you to pay for gambling. What was the approximate value of the bad checks, money, or things that you took to pay for gambling in the past year?
Less than $100 $100 to $500 $501 to $1,000 $1,001 to $5,000 $5,001 to $10,000 $10,001 to $50,000 $50,001 to $100,000 more than $100,000
H2. Have you ever been arrested or detained by the police or a sheriff?
YES GO TO H3 NO GO TO NEXT SECTION
H3. How many times have you been arrested? _______times (IF 100 OR MORE TIMES, CODE AS 99) H4. How old were you the first time you were arrested or detained by the police
or a sheriff? ______years
H5 ASK IF EVERPROB IS ONE OR MORE Was gambling a significant
factor or cause in any arrest? YES NO
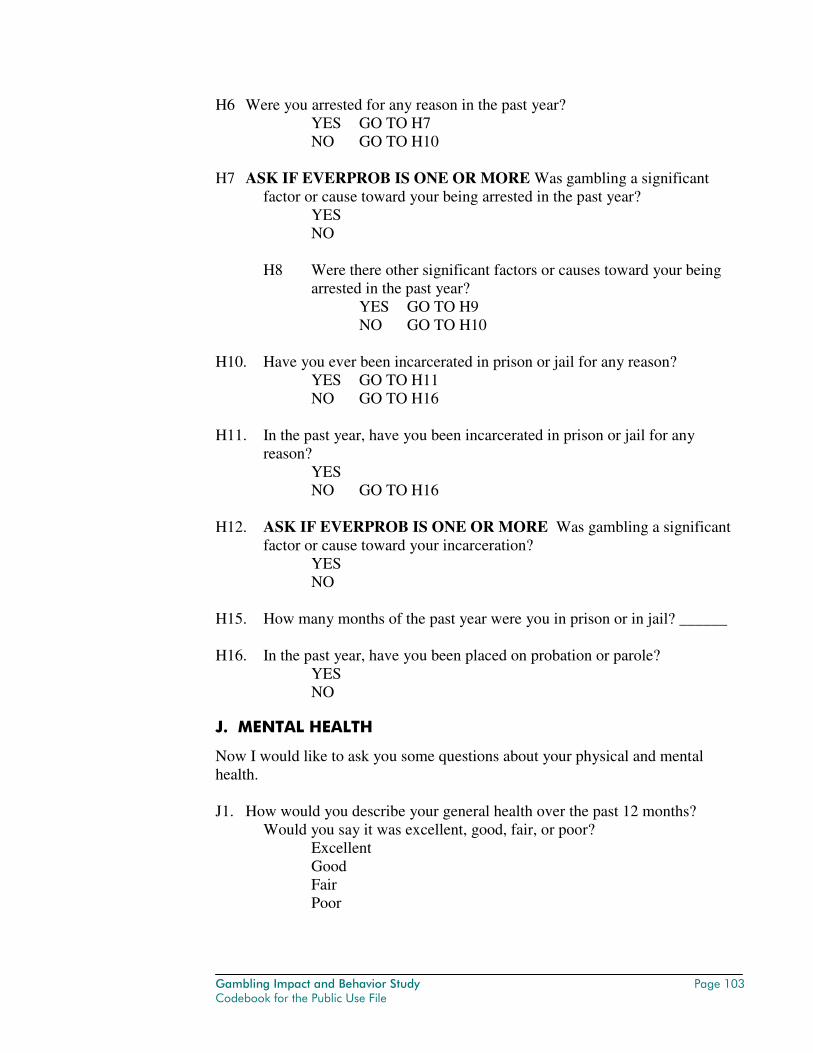
Gambling Impact and Behavior Study Page 103 Codebook for the Public Use File
H6 Were you arrested for any reason in the past year? YES GO TO H7 NO GO TO H10
H7 ASK IF EVERPROB IS ONE OR MORE Was gambling a significant
factor or cause toward your being arrested in the past year? YES NO
H8 Were there other significant factors or causes toward your being
arrested in the past year? YES GO TO H9 NO GO TO H10
H10. Have you ever been incarcerated in prison or jail for any reason?
YES GO TO H11 NO GO TO H16
H11. In the past year, have you been incarcerated in prison or jail for any
reason? YES NO GO TO H16
H12. ASK IF EVERPROB IS ONE OR MORE Was gambling a significant
factor or cause toward your incarceration? YES NO
H15. How many months of the past year were you in prison or in jail? ______ H16. In the past year, have you been placed on probation or parole?
YES NO
J. MENTAL HEALTH
Now I would like to ask you some questions about your physical and mental health. J1. How would you describe your general health over the past 12 months?
Would you say it was excellent, good, fair, or poor? Excellent Good Fair Poor
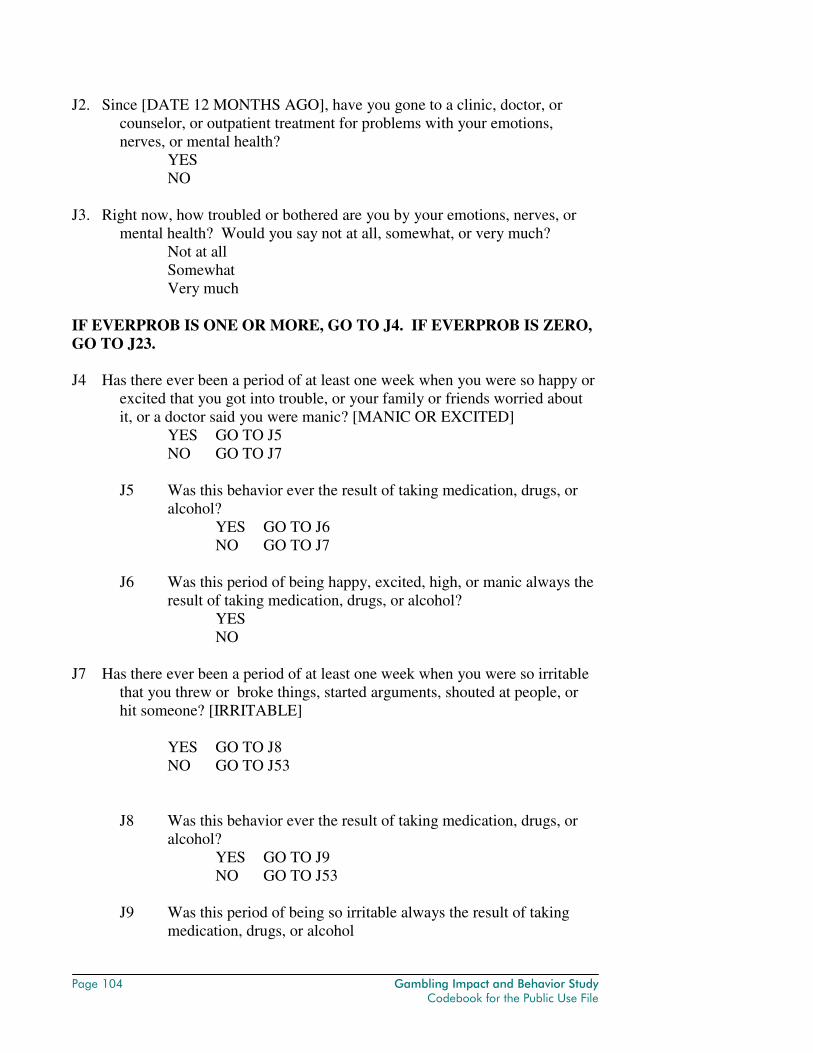
Page 104 Gambling Impact and Behavior Study Codebook for the Public Use File
J2. Since [DATE 12 MONTHS AGO], have you gone to a clinic, doctor, or counselor, or outpatient treatment for problems with your emotions, nerves, or mental health?
YES NO
J3. Right now, how troubled or bothered are you by your emotions, nerves, or
mental health? Would you say not at all, somewhat, or very much? Not at all Somewhat Very much
IF EVERPROB IS ONE OR MORE, GO TO J4. IF EVERPROB IS ZERO, GO TO J23. J4 Has there ever been a period of at least one week when you were so happy or
excited that you got into trouble, or your family or friends worried about it, or a doctor said you were manic? [MANIC OR EXCITED]
YES GO TO J5 NO GO TO J7
J5 Was this behavior ever the result of taking medication, drugs, or
alcohol? YES GO TO J6 NO GO TO J7
J6 Was this period of being happy, excited, high, or manic always the
result of taking medication, drugs, or alcohol? YES NO
J7 Has there ever been a period of at least one week when you were so irritable
that you threw or broke things, started arguments, shouted at people, or hit someone? [IRRITABLE]
YES GO TO J8 NO GO TO J53
J8 Was this behavior ever the result of taking medication, drugs, or alcohol?
YES GO TO J9 NO GO TO J53
J9 Was this period of being so irritable always the result of taking
medication, drugs, or alcohol
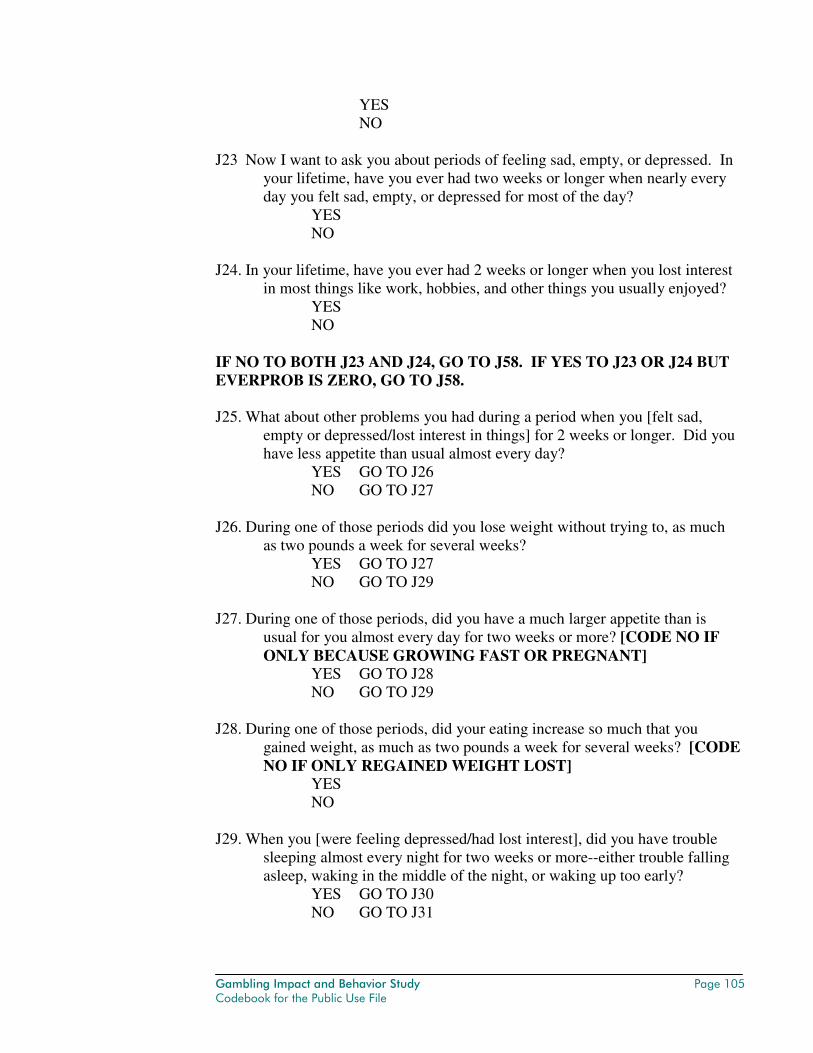
Gambling Impact and Behavior Study Page 105 Codebook for the Public Use File
YES NO
J23 Now I want to ask you about periods of feeling sad, empty, or depressed. In
your lifetime, have you ever had two weeks or longer when nearly every day you felt sad, empty, or depressed for most of the day?
YES NO
J24. In your lifetime, have you ever had 2 weeks or longer when you lost interest
in most things like work, hobbies, and other things you usually enjoyed? YES NO
IF NO TO BOTH J23 AND J24, GO TO J58. IF YES TO J23 OR J24 BUT EVERPROB IS ZERO, GO TO J58. J25. What about other problems you had during a period when you [felt sad,
empty or depressed/lost interest in things] for 2 weeks or longer. Did you have less appetite than usual almost every day?
YES GO TO J26 NO GO TO J27
J26. During one of those periods did you lose weight without trying to, as much
as two pounds a week for several weeks? YES GO TO J27 NO GO TO J29
J27. During one of those periods, did you have a much larger appetite than is
usual for you almost every day for two weeks or more? [CODE NO IF ONLY BECAUSE GROWING FAST OR PREGNANT]
YES GO TO J28 NO GO TO J29
J28. During one of those periods, did your eating increase so much that you
gained weight, as much as two pounds a week for several weeks? [CODE NO IF ONLY REGAINED WEIGHT LOST]
YES NO
J29. When you [were feeling depressed/had lost interest], did you have trouble
sleeping almost every night for two weeks or more--either trouble falling asleep, waking in the middle of the night, or waking up too early?
YES GO TO J30 NO GO TO J31
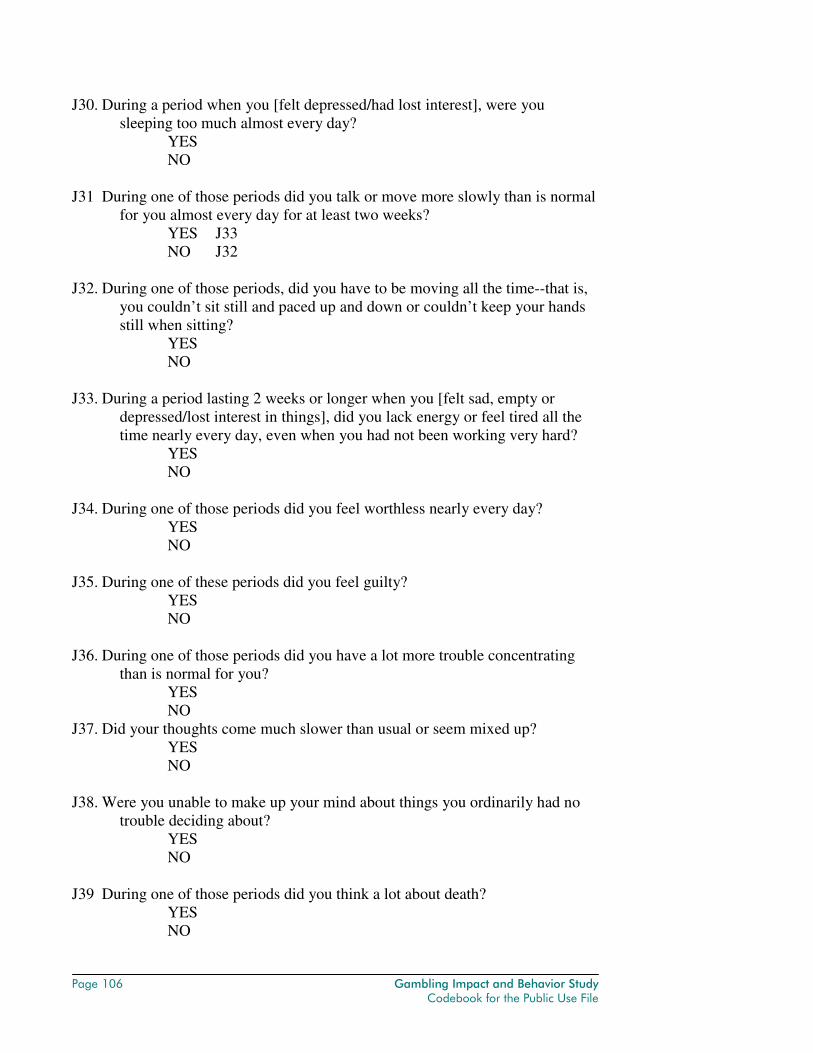
Page 106 Gambling Impact and Behavior Study Codebook for the Public Use File
J30. During a period when you [felt depressed/had lost interest], were you sleeping too much almost every day?
YES NO
J31 During one of those periods did you talk or move more slowly than is normal
for you almost every day for at least two weeks? YES J33 NO J32
J32. During one of those periods, did you have to be moving all the time--that is,
you couldn’t sit still and paced up and down or couldn’t keep your hands still when sitting?
YES NO
J33. During a period lasting 2 weeks or longer when you [felt sad, empty or
depressed/lost interest in things], did you lack energy or feel tired all the time nearly every day, even when you had not been working very hard?
YES NO
J34. During one of those periods did you feel worthless nearly every day?
YES NO
J35. During one of these periods did you feel guilty?
YES NO
J36. During one of those periods did you have a lot more trouble concentrating
than is normal for you? YES NO
J37. Did your thoughts come much slower than usual or seem mixed up? YES NO
J38. Were you unable to make up your mind about things you ordinarily had no
trouble deciding about? YES NO
J39 During one of those periods did you think a lot about death?
YES NO
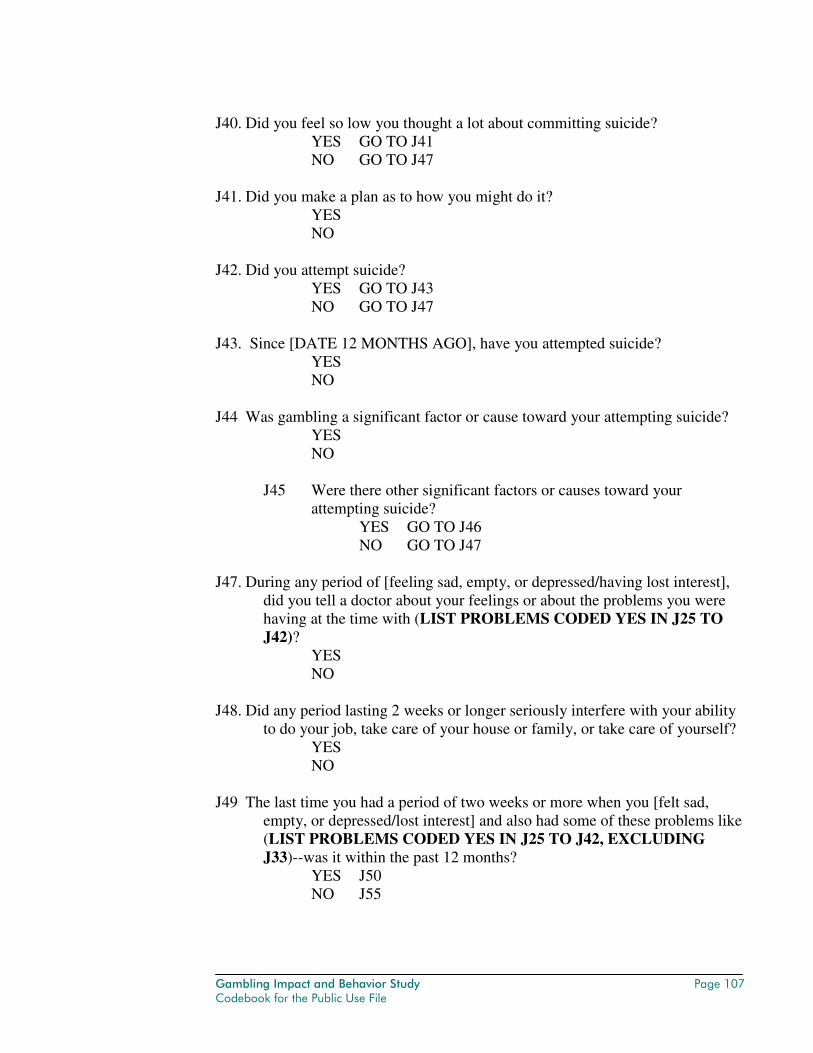
Gambling Impact and Behavior Study Page 107 Codebook for the Public Use File
J40. Did you feel so low you thought a lot about committing suicide?
YES GO TO J41 NO GO TO J47
J41. Did you make a plan as to how you might do it?
YES NO
J42. Did you attempt suicide?
YES GO TO J43 NO GO TO J47
J43. Since [DATE 12 MONTHS AGO], have you attempted suicide?
YES NO
J44 Was gambling a significant factor or cause toward your attempting suicide?
YES NO
J45 Were there other significant factors or causes toward your
attempting suicide? YES GO TO J46 NO GO TO J47
J47. During any period of [feeling sad, empty, or depressed/having lost interest],
did you tell a doctor about your feelings or about the problems you were having at the time with (LIST PROBLEMS CODED YES IN J25 TO J42)?
YES NO
J48. Did any period lasting 2 weeks or longer seriously interfere with your ability
to do your job, take care of your house or family, or take care of yourself? YES NO
J49 The last time you had a period of two weeks or more when you [felt sad,
empty, or depressed/lost interest] and also had some of these problems like (LIST PROBLEMS CODED YES IN J25 TO J42, EXCLUDING J33)--was it within the past 12 months?
YES J50 NO J55
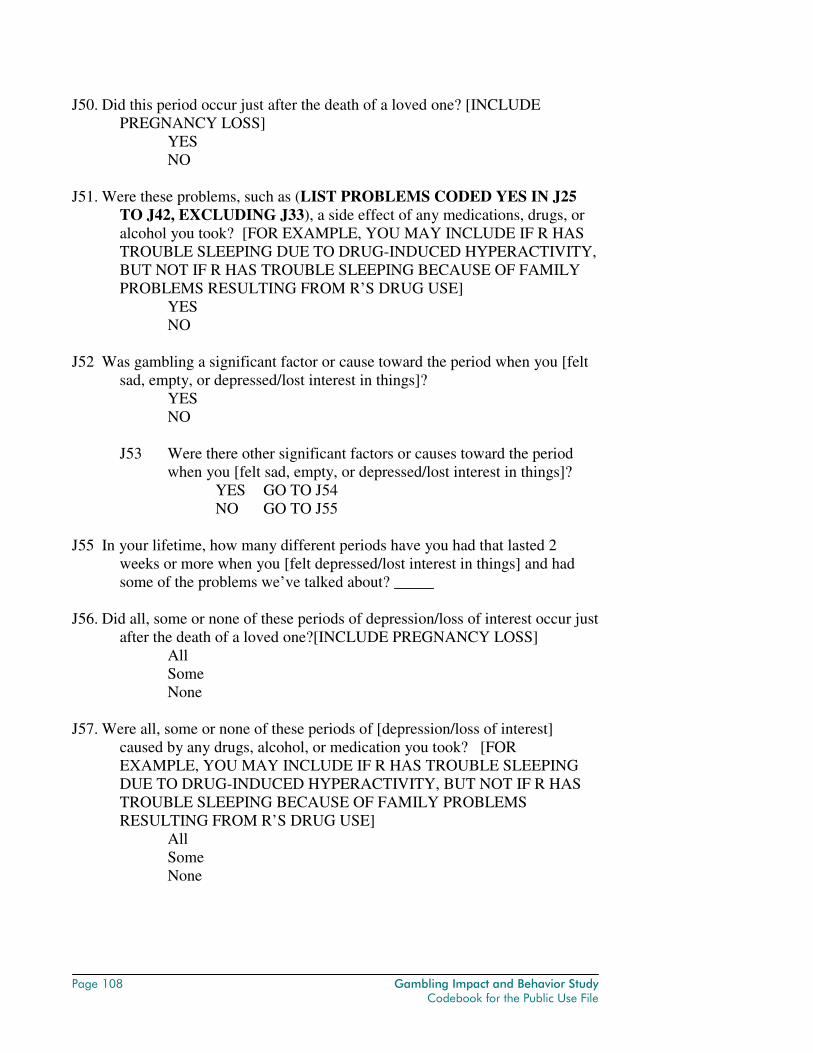
Page 108 Gambling Impact and Behavior Study Codebook for the Public Use File
J50. Did this period occur just after the death of a loved one? [INCLUDE PREGNANCY LOSS]
YES NO
J51. Were these problems, such as (LIST PROBLEMS CODED YES IN J25
TO J42, EXCLUDING J33), a side effect of any medications, drugs, or alcohol you took? [FOR EXAMPLE, YOU MAY INCLUDE IF R HAS TROUBLE SLEEPING DUE TO DRUG-INDUCED HYPERACTIVITY, BUT NOT IF R HAS TROUBLE SLEEPING BECAUSE OF FAMILY PROBLEMS RESULTING FROM R’S DRUG USE]
YES NO
J52 Was gambling a significant factor or cause toward the period when you [felt
sad, empty, or depressed/lost interest in things]? YES NO
J53 Were there other significant factors or causes toward the period
when you [felt sad, empty, or depressed/lost interest in things]? YES GO TO J54 NO GO TO J55
J55 In your lifetime, how many different periods have you had that lasted 2
weeks or more when you [felt depressed/lost interest in things] and had some of the problems we’ve talked about? _____
J56. Did all, some or none of these periods of depression/loss of interest occur just
after the death of a loved one?[INCLUDE PREGNANCY LOSS] All Some None
J57. Were all, some or none of these periods of [depression/loss of interest]
caused by any drugs, alcohol, or medication you took? [FOR EXAMPLE, YOU MAY INCLUDE IF R HAS TROUBLE SLEEPING DUE TO DRUG-INDUCED HYPERACTIVITY, BUT NOT IF R HAS TROUBLE SLEEPING BECAUSE OF FAMILY PROBLEMS RESULTING FROM R’S DRUG USE]
All Some None
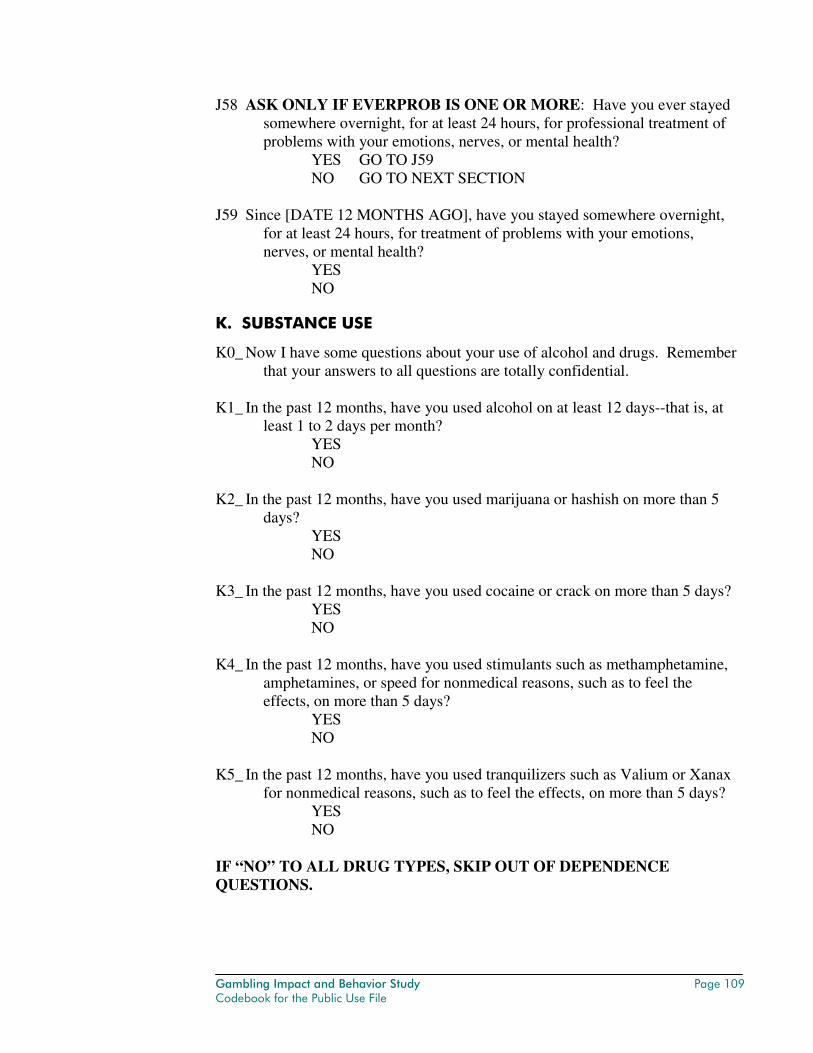
Gambling Impact and Behavior Study Page 109 Codebook for the Public Use File
J58 ASK ONLY IF EVERPROB IS ONE OR MORE: Have you ever stayed somewhere overnight, for at least 24 hours, for professional treatment of problems with your emotions, nerves, or mental health?
YES GO TO J59 NO GO TO NEXT SECTION
J59 Since [DATE 12 MONTHS AGO], have you stayed somewhere overnight,
for at least 24 hours, for treatment of problems with your emotions, nerves, or mental health?
YES NO
K. SUBSTANCE USE
K0_ Now I have some questions about your use of alcohol and drugs. Remember that your answers to all questions are totally confidential.
K1_ In the past 12 months, have you used alcohol on at least 12 days--that is, at
least 1 to 2 days per month? YES NO
K2_ In the past 12 months, have you used marijuana or hashish on more than 5
days? YES NO
K3_ In the past 12 months, have you used cocaine or crack on more than 5 days?
YES NO
K4_ In the past 12 months, have you used stimulants such as methamphetamine,
amphetamines, or speed for nonmedical reasons, such as to feel the effects, on more than 5 days?
YES NO
K5_ In the past 12 months, have you used tranquilizers such as Valium or Xanax
for nonmedical reasons, such as to feel the effects, on more than 5 days? YES NO
IF “NO” TO ALL DRUG TYPES, SKIP OUT OF DEPENDENCE QUESTIONS.
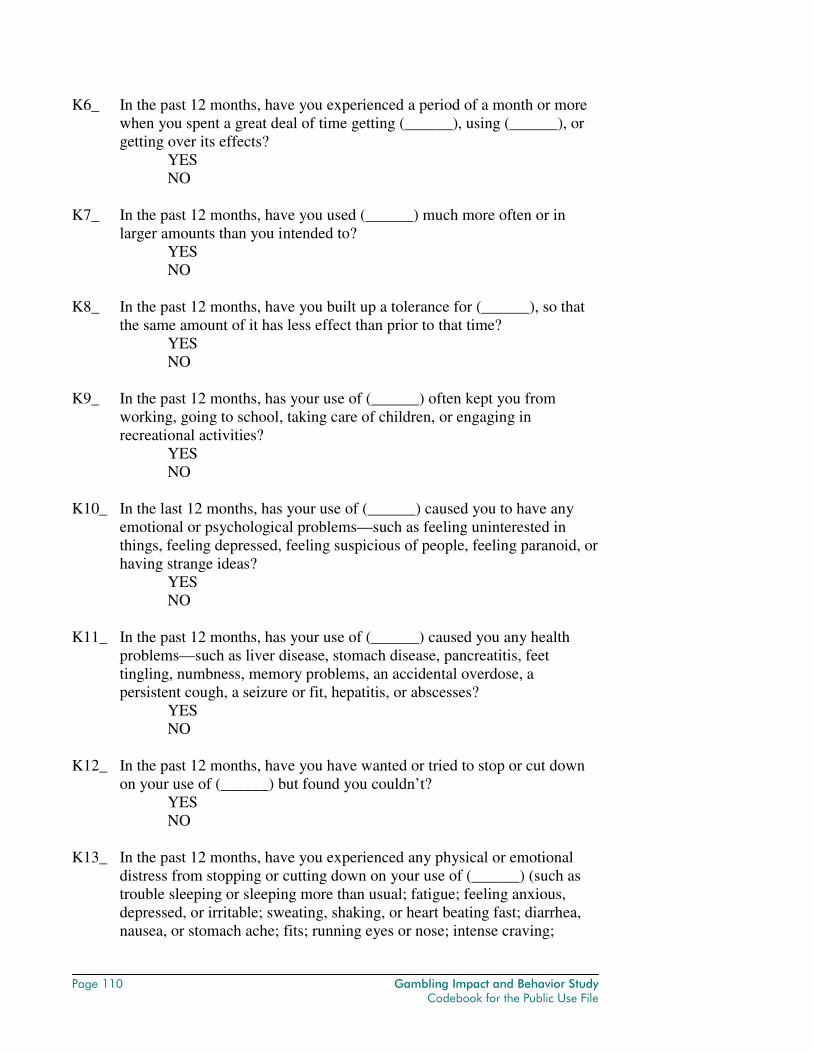
Page 110 Gambling Impact and Behavior Study Codebook for the Public Use File
K6_ In the past 12 months, have you experienced a period of a month or more when you spent a great deal of time getting (______), using (______), or getting over its effects?
YES NO
K7_ In the past 12 months, have you used (______) much more often or in
larger amounts than you intended to? YES NO
K8_ In the past 12 months, have you built up a tolerance for (______), so that
the same amount of it has less effect than prior to that time? YES NO
K9_ In the past 12 months, has your use of (______) often kept you from
working, going to school, taking care of children, or engaging in recreational activities?
YES NO
K10_ In the last 12 months, has your use of (______) caused you to have any
emotional or psychological problems—such as feeling uninterested in things, feeling depressed, feeling suspicious of people, feeling paranoid, or having strange ideas?
YES NO
K11_ In the past 12 months, has your use of (______) caused you any health
problems—such as liver disease, stomach disease, pancreatitis, feet tingling, numbness, memory problems, an accidental overdose, a persistent cough, a seizure or fit, hepatitis, or abscesses?
YES NO
K12_ In the past 12 months, have you have wanted or tried to stop or cut down
on your use of (______) but found you couldn’t? YES NO
K13_ In the past 12 months, have you experienced any physical or emotional
distress from stopping or cutting down on your use of (______) (such as trouble sleeping or sleeping more than usual; fatigue; feeling anxious, depressed, or irritable; sweating, shaking, or heart beating fast; diarrhea, nausea, or stomach ache; fits; running eyes or nose; intense craving;
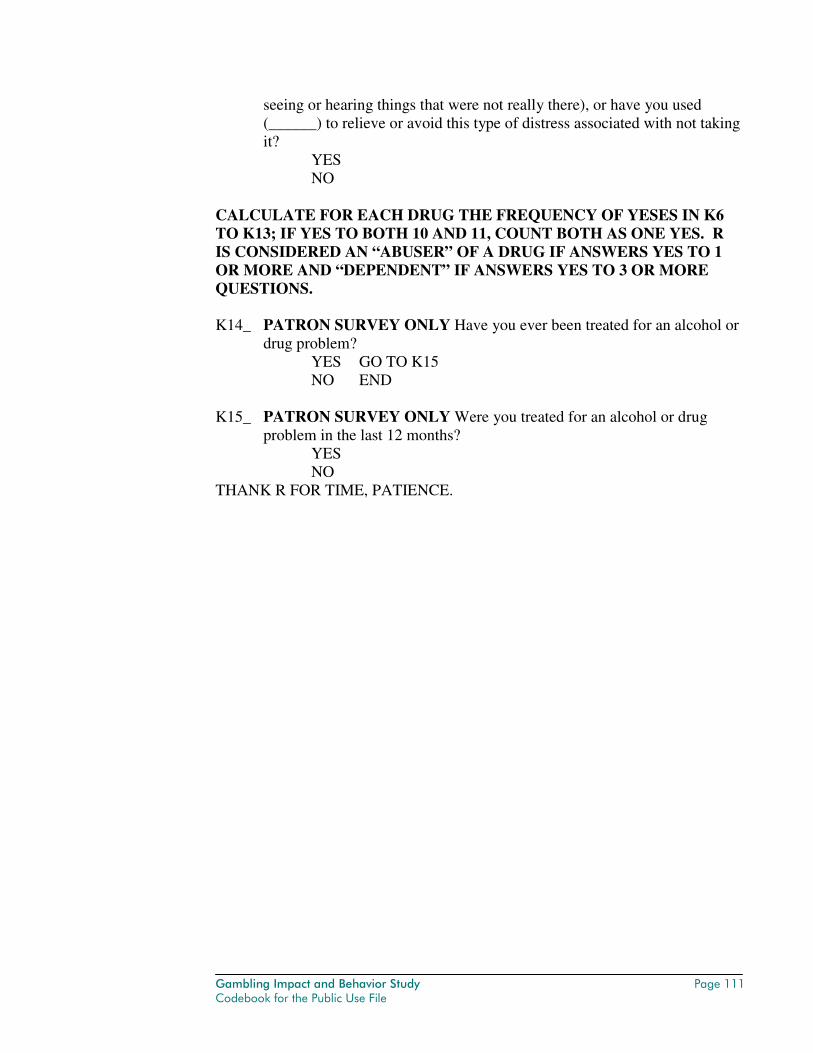
Gambling Impact and Behavior Study Page 111 Codebook for the Public Use File
seeing or hearing things that were not really there), or have you used (______) to relieve or avoid this type of distress associated with not taking it?
YES NO
CALCULATE FOR EACH DRUG THE FREQUENCY OF YESES IN K6 TO K13; IF YES TO BOTH 10 AND 11, COUNT BOTH AS ONE YES. R IS CONSIDERED AN “ABUSER” OF A DRUG IF ANSWERS YES TO 1 OR MORE AND “DEPENDENT” IF ANSWERS YES TO 3 OR MORE QUESTIONS. K14_ PATRON SURVEY ONLY Have you ever been treated for an alcohol or
drug problem? YES GO TO K15 NO END
K15_ PATRON SURVEY ONLY Were you treated for an alcohol or drug
problem in the last 12 months? YES NO
THANK R FOR TIME, PATIENCE.

Page 112 Gambling Impact and Behavior Study Codebook for the Public Use File
Gambling Impact and Behavior Study Page 113 Codebook for the Public Use File
7. VARIABLES AND FREQUENCIES Cindy Larison & Angela Brittingham
The COMBINED.PUF File is comprised of 2,947 adult cases, of which 2,417 are from the household RDD sample and 530 from the patron in-person sample.
The household sample in turn is comprised of 2,403 RDD telephone interviews and 14 self-administered questionnaires returned by individuals who were contacted as part of the household sampling frame but were unable or unwilling to respond by telephone, however, these individuals were willing to return a mail questionnaire. The patron sample is divided among 450 cases which were combined for estimation purposes with the 2417 telephone cases.
The aggregate of 2,867 cases received weights that are proportional to the sample representation of the household population: POPWGHT sums to 197.4 million, which is the estimated houshold population in the SAMPWGHT to 2,867. The remaining 80 patron cases have zero weights on these weighting variables.
The patron and self-interview cases used an abbreviated version of the telephone questionnaire. In the public use file and codebook, items not available in the patron survey are coded as “-9". Items not included in the self-administered questionnaire as well as all legitimately skipped items on the main questionnaire are coded as missing, or “.” All other codes are labelled as appropriate. Refer to the questionnaire in the previous section to explain skip patterns reflected in the frequency distributions. The final section of the codebook contains the SAS logic used to create the small series of constructed variables that appear at the end of all the intrinsic variables in sections A-K.
A table of CONTENTS listing all the variables in their order of appearance on the file and in the frequency tables follows this introduction. Frequency tables for each variable follow the CONTENTS list. All tables are titled with a variable label. The first column of each table is headed by the variable name corresponding to the numbering used in the questionnaire, and comprised of the response codes available for the variable. subsequent columns record the unweighted frequency (how often the particular code response was recorded), percent of the nonmissing cases, cumulative frquency, and cumulative percent of the nonmissing cases (where nonmissing includes reserve codes such as “don't know” and “refused” as well as the explicit “-9 patron: logically missing" code. For some variables, the table is split in two, with the cumulative frequency and percentage presented below rather than alongside of the the separately enumerated frequencies and percentages.

Page 114 Gambling Impact and Behavior Study Codebook for the Public Use File
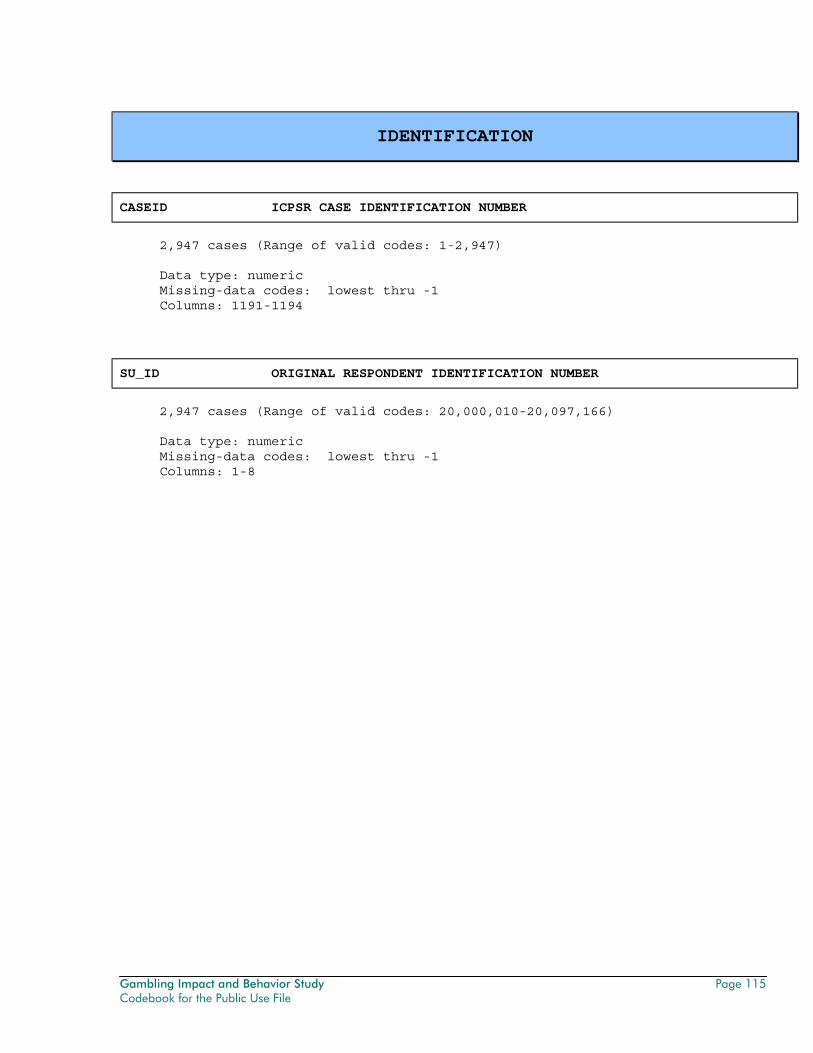
Gambling Impact and Behavior Study Page 115 Codebook for the Public Use File
IDENTIFICATION
CASEID ICPSR CASE IDENTIFICATION NUMBER
2,947 cases (Range of valid codes: 1-2,947) Data type: numeric Missing-data codes: lowest thru -1 Columns: 1191-1194
SU_ID ORIGINAL RESPONDENT IDENTIFICATION NUMBER
2,947 cases (Range of valid codes: 20,000,010-20,097,166) Data type: numeric Missing-data codes: lowest thru -1 Columns: 1-8
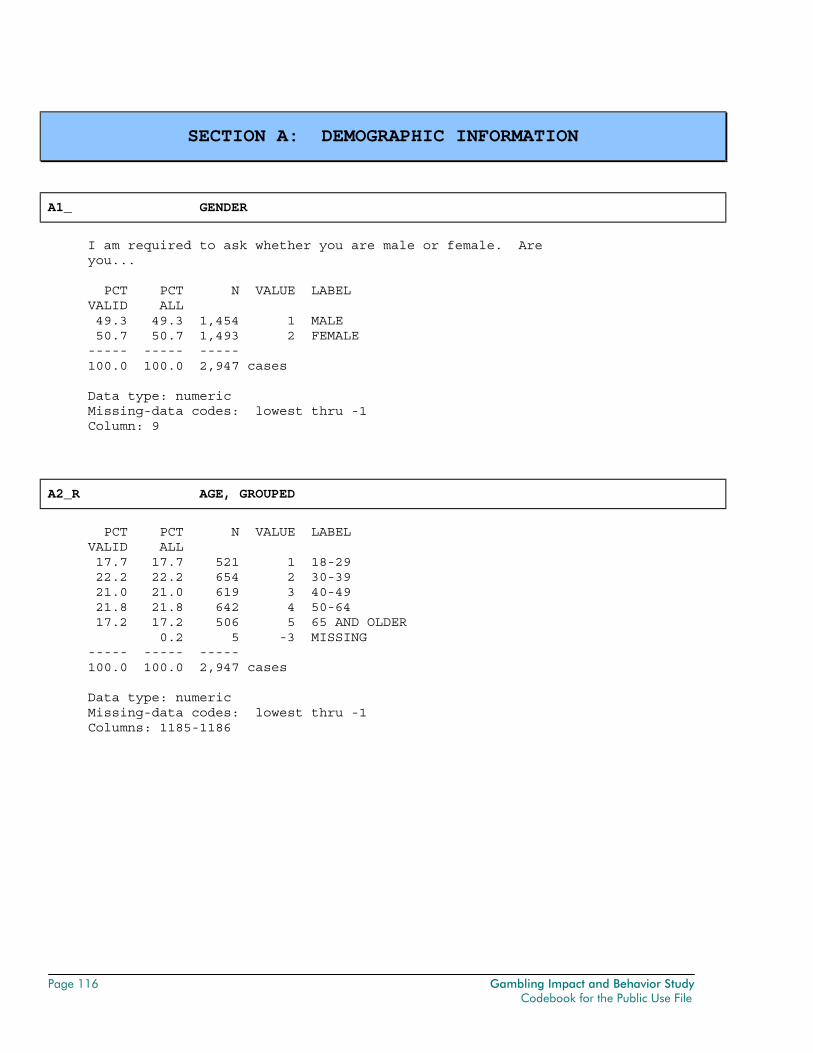
Page 116 Gambling Impact and Behavior Study Codebook for the Public Use File
SECTION A: DEMOGRAPHIC INFORMATION
A1_ GENDER
I am required to ask whether you are male or female. Are you... PCT PCT N VALUE LABEL VALID ALL 49.3 49.3 1,454 1 MALE 50.7 50.7 1,493 2 FEMALE ----- ----- ----- 100.0 100.0 2,947 cases Data type: numeric Missing-data codes: lowest thru -1 Column: 9
A2_R AGE, GROUPED
PCT PCT N VALUE LABEL VALID ALL 17.7 17.7 521 1 18-29 22.2 22.2 654 2 30-39 21.0 21.0 619 3 40-49 21.8 21.8 642 4 50-64 17.2 17.2 506 5 65 AND OLDER 0.2 5 -3 MISSING ----- ----- ----- 100.0 100.0 2,947 cases Data type: numeric Missing-data codes: lowest thru -1 Columns: 1185-1186
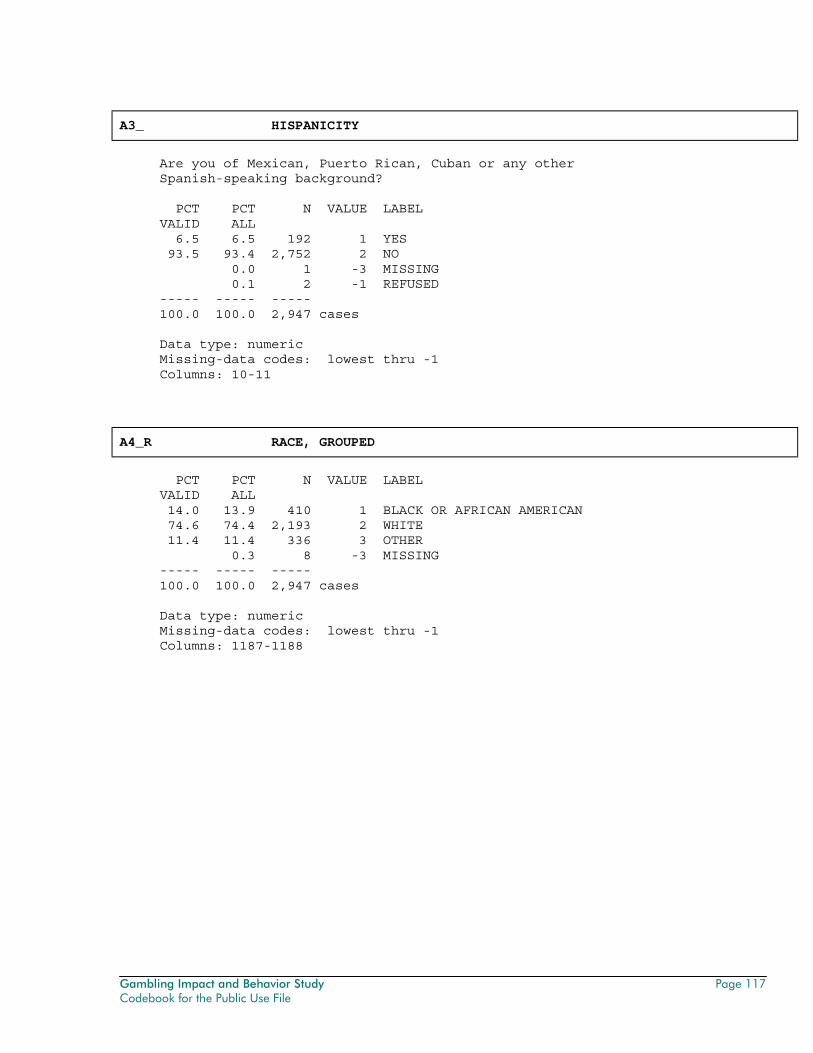
Gambling Impact and Behavior Study Page 117 Codebook for the Public Use File
A3_ HISPANICITY
Are you of Mexican, Puerto Rican, Cuban or any other Spanish-speaking background? PCT PCT N VALUE LABEL VALID ALL 6.5 6.5 192 1 YES 93.5 93.4 2,752 2 NO 0.0 1 -3 MISSING 0.1 2 -1 REFUSED ----- ----- ----- 100.0 100.0 2,947 cases Data type: numeric Missing-data codes: lowest thru -1 Columns: 10-11
A4_R RACE, GROUPED
PCT PCT N VALUE LABEL VALID ALL 14.0 13.9 410 1 BLACK OR AFRICAN AMERICAN 74.6 74.4 2,193 2 WHITE 11.4 11.4 336 3 OTHER 0.3 8 -3 MISSING ----- ----- ----- 100.0 100.0 2,947 cases Data type: numeric Missing-data codes: lowest thru -1 Columns: 1187-1188
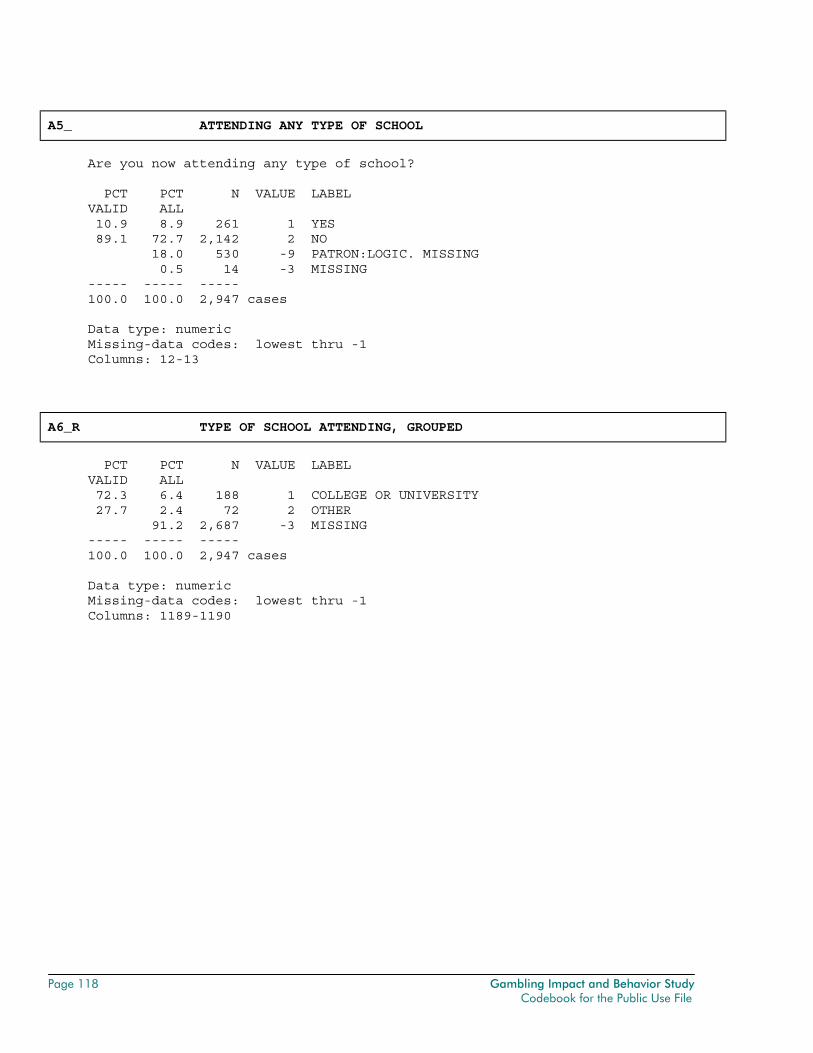
Page 118 Gambling Impact and Behavior Study Codebook for the Public Use File
A5_ ATTENDING ANY TYPE OF SCHOOL
Are you now attending any type of school? PCT PCT N VALUE LABEL VALID ALL 10.9 8.9 261 1 YES 89.1 72.7 2,142 2 NO 18.0 530 -9 PATRON:LOGIC. MISSING 0.5 14 -3 MISSING ----- ----- ----- 100.0 100.0 2,947 cases Data type: numeric Missing-data codes: lowest thru -1 Columns: 12-13
A6_R TYPE OF SCHOOL ATTENDING, GROUPED
PCT PCT N VALUE LABEL VALID ALL 72.3 6.4 188 1 COLLEGE OR UNIVERSITY 27.7 2.4 72 2 OTHER 91.2 2,687 -3 MISSING ----- ----- ----- 100.0 100.0 2,947 cases Data type: numeric Missing-data codes: lowest thru -1 Columns: 1189-1190
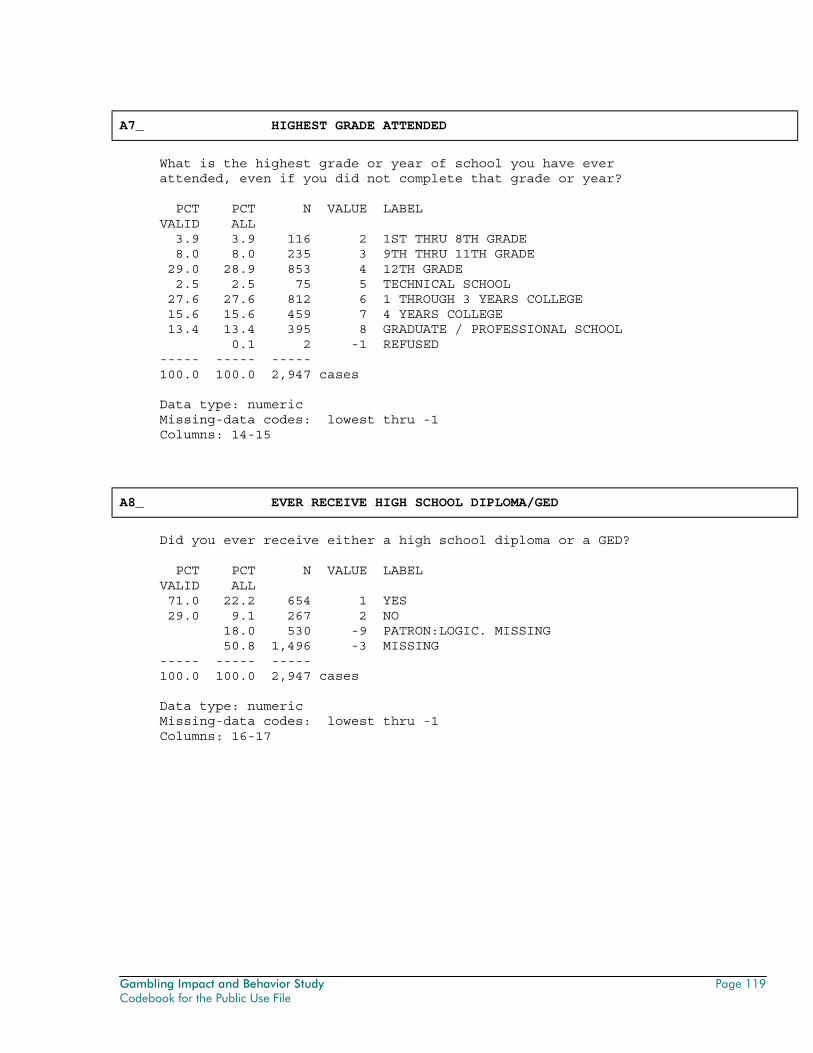
Gambling Impact and Behavior Study Page 119 Codebook for the Public Use File
A7_ HIGHEST GRADE ATTENDED
What is the highest grade or year of school you have ever attended, even if you did not complete that grade or year? PCT PCT N VALUE LABEL VALID ALL 3.9 3.9 116 2 1ST THRU 8TH GRADE 8.0 8.0 235 3 9TH THRU 11TH GRADE 29.0 28.9 853 4 12TH GRADE 2.5 2.5 75 5 TECHNICAL SCHOOL 27.6 27.6 812 6 1 THROUGH 3 YEARS COLLEGE 15.6 15.6 459 7 4 YEARS COLLEGE 13.4 13.4 395 8 GRADUATE / PROFESSIONAL SCHOOL 0.1 2 -1 REFUSED ----- ----- ----- 100.0 100.0 2,947 cases Data type: numeric Missing-data codes: lowest thru -1 Columns: 14-15
A8_ EVER RECEIVE HIGH SCHOOL DIPLOMA/GED
Did you ever receive either a high school diploma or a GED? PCT PCT N VALUE LABEL VALID ALL 71.0 22.2 654 1 YES 29.0 9.1 267 2 NO 18.0 530 -9 PATRON:LOGIC. MISSING 50.8 1,496 -3 MISSING ----- ----- ----- 100.0 100.0 2,947 cases Data type: numeric Missing-data codes: lowest thru -1 Columns: 16-17
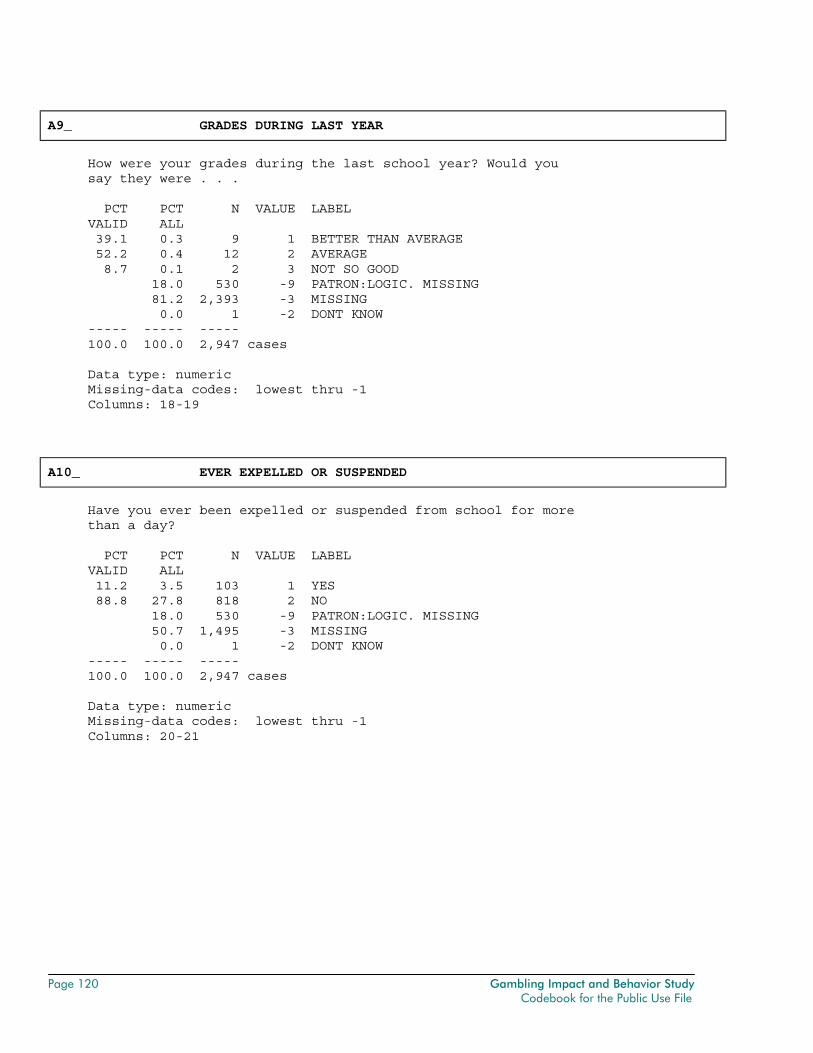
Page 120 Gambling Impact and Behavior Study Codebook for the Public Use File
A9_ GRADES DURING LAST YEAR
How were your grades during the last school year? Would you say they were . . . PCT PCT N VALUE LABEL VALID ALL 39.1 0.3 9 1 BETTER THAN AVERAGE 52.2 0.4 12 2 AVERAGE 8.7 0.1 2 3 NOT SO GOOD 18.0 530 -9 PATRON:LOGIC. MISSING 81.2 2,393 -3 MISSING 0.0 1 -2 DONT KNOW ----- ----- ----- 100.0 100.0 2,947 cases Data type: numeric Missing-data codes: lowest thru -1 Columns: 18-19
A10_ EVER EXPELLED OR SUSPENDED
Have you ever been expelled or suspended from school for more than a day? PCT PCT N VALUE LABEL VALID ALL 11.2 3.5 103 1 YES 88.8 27.8 818 2 NO 18.0 530 -9 PATRON:LOGIC. MISSING 50.7 1,495 -3 MISSING 0.0 1 -2 DONT KNOW ----- ----- ----- 100.0 100.0 2,947 cases Data type: numeric Missing-data codes: lowest thru -1 Columns: 20-21
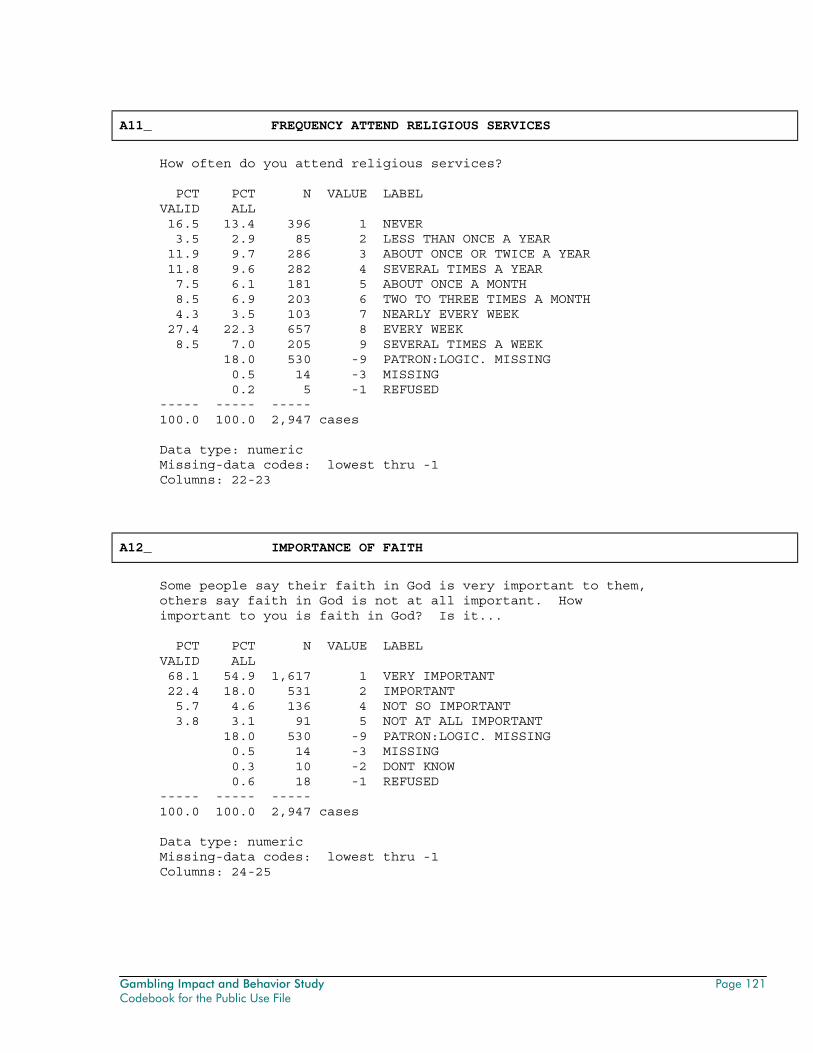
Gambling Impact and Behavior Study Page 121 Codebook for the Public Use File
A11_ FREQUENCY ATTEND RELIGIOUS SERVICES
How often do you attend religious services? PCT PCT N VALUE LABEL VALID ALL 16.5 13.4 396 1 NEVER 3.5 2.9 85 2 LESS THAN ONCE A YEAR 11.9 9.7 286 3 ABOUT ONCE OR TWICE A YEAR 11.8 9.6 282 4 SEVERAL TIMES A YEAR 7.5 6.1 181 5 ABOUT ONCE A MONTH 8.5 6.9 203 6 TWO TO THREE TIMES A MONTH 4.3 3.5 103 7 NEARLY EVERY WEEK 27.4 22.3 657 8 EVERY WEEK 8.5 7.0 205 9 SEVERAL TIMES A WEEK 18.0 530 -9 PATRON:LOGIC. MISSING 0.5 14 -3 MISSING 0.2 5 -1 REFUSED ----- ----- ----- 100.0 100.0 2,947 cases Data type: numeric Missing-data codes: lowest thru -1 Columns: 22-23
A12_ IMPORTANCE OF FAITH
Some people say their faith in God is very important to them, others say faith in God is not at all important. How important to you is faith in God? Is it... PCT PCT N VALUE LABEL VALID ALL 68.1 54.9 1,617 1 VERY IMPORTANT 22.4 18.0 531 2 IMPORTANT 5.7 4.6 136 4 NOT SO IMPORTANT 3.8 3.1 91 5 NOT AT ALL IMPORTANT 18.0 530 -9 PATRON:LOGIC. MISSING 0.5 14 -3 MISSING 0.3 10 -2 DONT KNOW 0.6 18 -1 REFUSED ----- ----- ----- 100.0 100.0 2,947 cases Data type: numeric Missing-data codes: lowest thru -1 Columns: 24-25
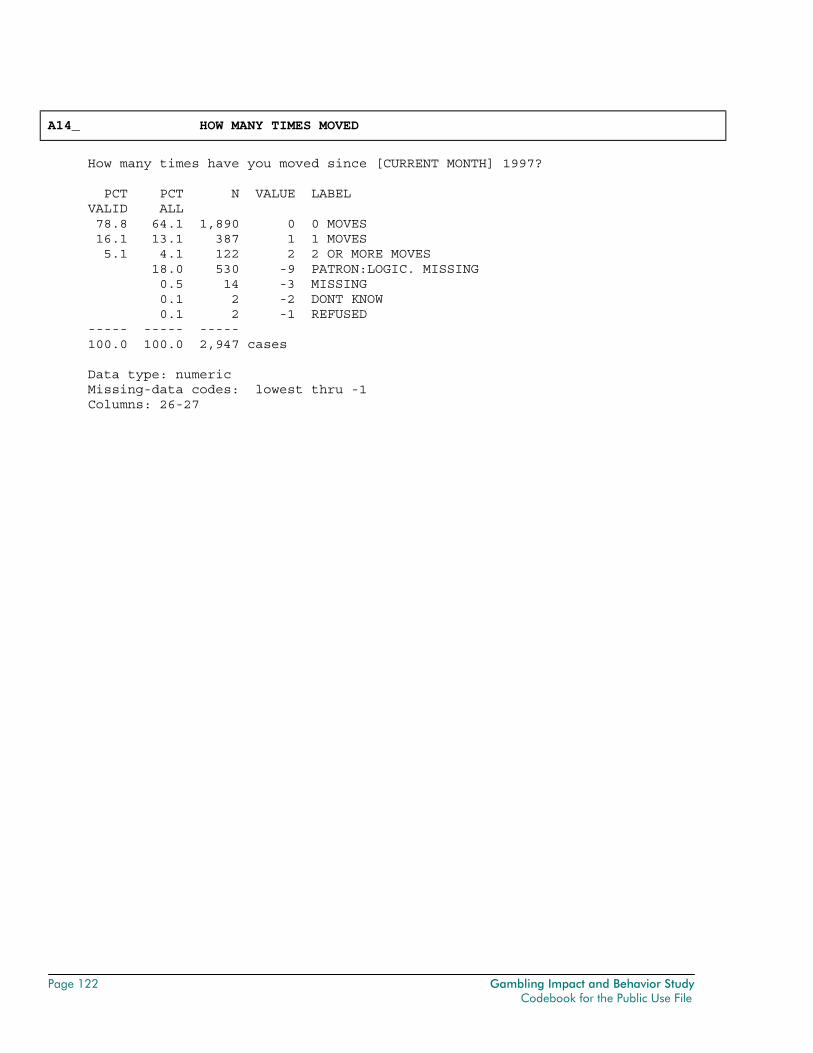
Page 122 Gambling Impact and Behavior Study Codebook for the Public Use File
A14_ HOW MANY TIMES MOVED
How many times have you moved since [CURRENT MONTH] 1997? PCT PCT N VALUE LABEL VALID ALL 78.8 64.1 1,890 0 0 MOVES 16.1 13.1 387 1 1 MOVES 5.1 4.1 122 2 2 OR MORE MOVES 18.0 530 -9 PATRON:LOGIC. MISSING 0.5 14 -3 MISSING 0.1 2 -2 DONT KNOW 0.1 2 -1 REFUSED ----- ----- ----- 100.0 100.0 2,947 cases Data type: numeric Missing-data codes: lowest thru -1 Columns: 26-27
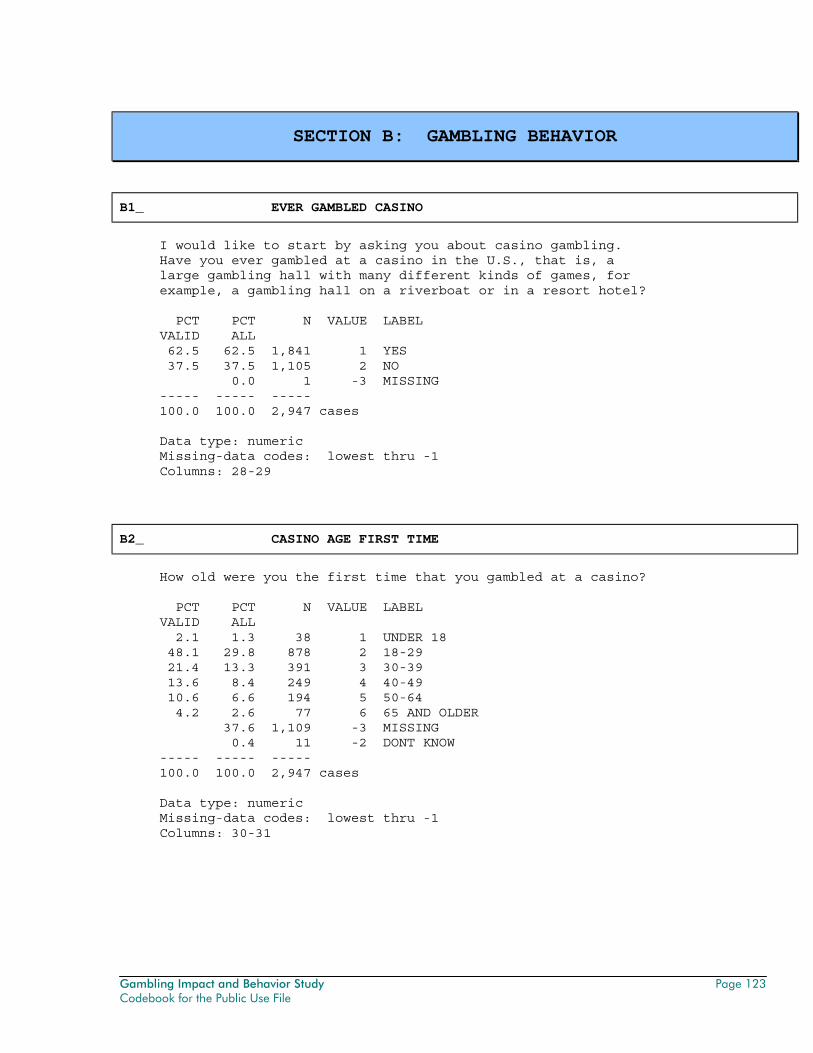
Gambling Impact and Behavior Study Page 123 Codebook for the Public Use File
SECTION B: GAMBLING BEHAVIOR
B1_ EVER GAMBLED CASINO
I would like to start by asking you about casino gambling. Have you ever gambled at a casino in the U.S., that is, a large gambling hall with many different kinds of games, for example, a gambling hall on a riverboat or in a resort hotel? PCT PCT N VALUE LABEL VALID ALL 62.5 62.5 1,841 1 YES 37.5 37.5 1,105 2 NO 0.0 1 -3 MISSING ----- ----- ----- 100.0 100.0 2,947 cases Data type: numeric Missing-data codes: lowest thru -1 Columns: 28-29
B2_ CASINO AGE FIRST TIME
How old were you the first time that you gambled at a casino? PCT PCT N VALUE LABEL VALID ALL 2.1 1.3 38 1 UNDER 18 48.1 29.8 878 2 18-29 21.4 13.3 391 3 30-39 13.6 8.4 249 4 40-49 10.6 6.6 194 5 50-64 4.2 2.6 77 6 65 AND OLDER 37.6 1,109 -3 MISSING 0.4 11 -2 DONT KNOW ----- ----- ----- 100.0 100.0 2,947 cases Data type: numeric Missing-data codes: lowest thru -1 Columns: 30-31
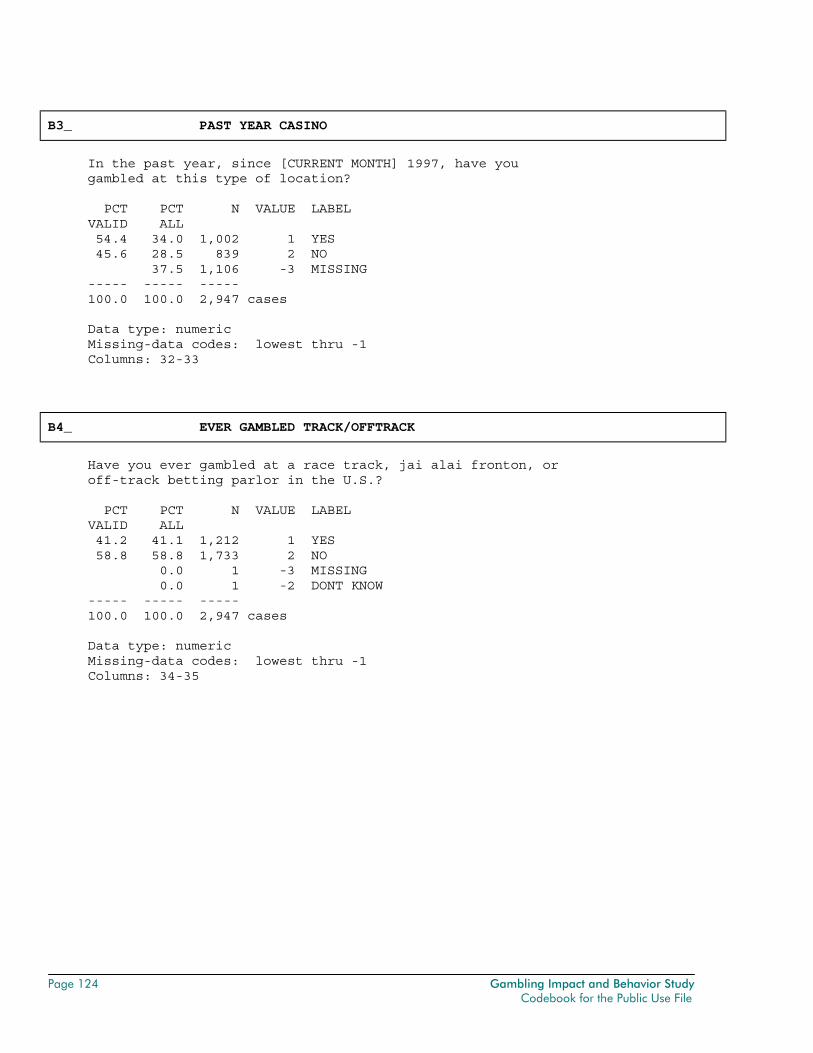
Page 124 Gambling Impact and Behavior Study Codebook for the Public Use File
B3_ PAST YEAR CASINO
In the past year, since [CURRENT MONTH] 1997, have you gambled at this type of location? PCT PCT N VALUE LABEL VALID ALL 54.4 34.0 1,002 1 YES 45.6 28.5 839 2 NO 37.5 1,106 -3 MISSING ----- ----- ----- 100.0 100.0 2,947 cases Data type: numeric Missing-data codes: lowest thru -1 Columns: 32-33
B4_ EVER GAMBLED TRACK/OFFTRACK
Have you ever gambled at a race track, jai alai fronton, or off-track betting parlor in the U.S.? PCT PCT N VALUE LABEL VALID ALL 41.2 41.1 1,212 1 YES 58.8 58.8 1,733 2 NO 0.0 1 -3 MISSING 0.0 1 -2 DONT KNOW ----- ----- ----- 100.0 100.0 2,947 cases Data type: numeric Missing-data codes: lowest thru -1 Columns: 34-35
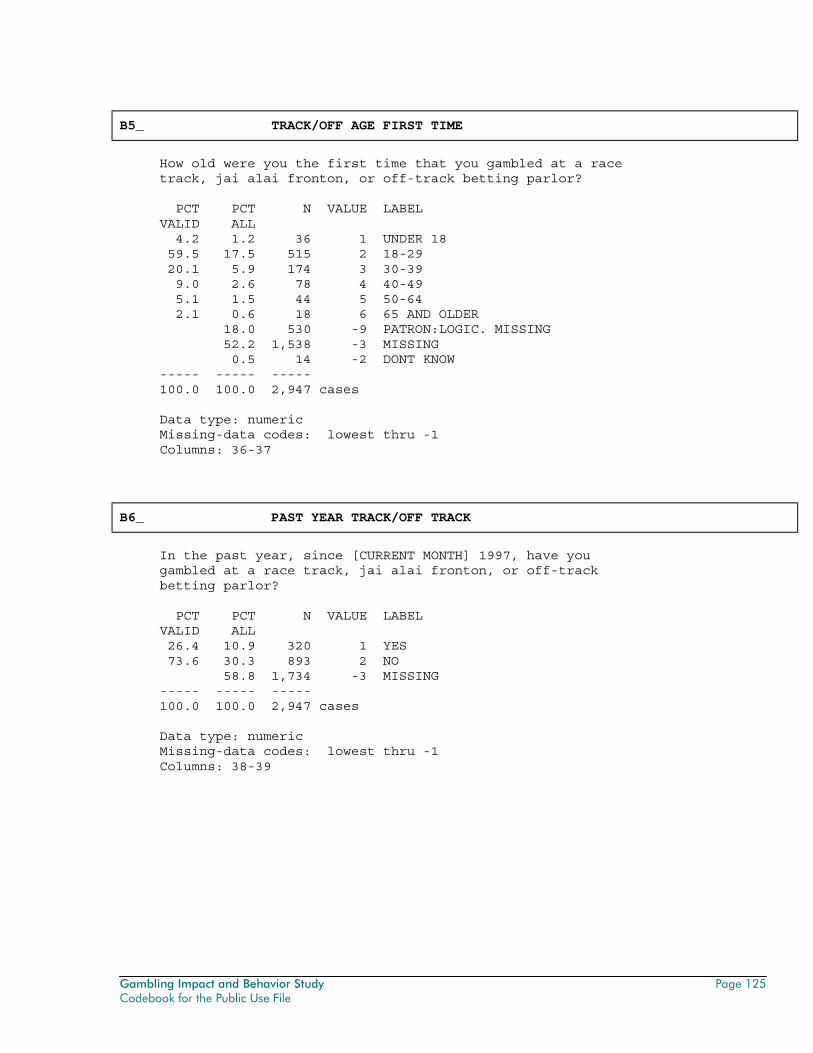
Gambling Impact and Behavior Study Page 125 Codebook for the Public Use File
B5_ TRACK/OFF AGE FIRST TIME
How old were you the first time that you gambled at a race track, jai alai fronton, or off-track betting parlor? PCT PCT N VALUE LABEL VALID ALL 4.2 1.2 36 1 UNDER 18 59.5 17.5 515 2 18-29 20.1 5.9 174 3 30-39 9.0 2.6 78 4 40-49 5.1 1.5 44 5 50-64 2.1 0.6 18 6 65 AND OLDER 18.0 530 -9 PATRON:LOGIC. MISSING 52.2 1,538 -3 MISSING 0.5 14 -2 DONT KNOW ----- ----- ----- 100.0 100.0 2,947 cases Data type: numeric Missing-data codes: lowest thru -1 Columns: 36-37
B6_ PAST YEAR TRACK/OFF TRACK
In the past year, since [CURRENT MONTH] 1997, have you gambled at a race track, jai alai fronton, or off-track betting parlor? PCT PCT N VALUE LABEL VALID ALL 26.4 10.9 320 1 YES 73.6 30.3 893 2 NO 58.8 1,734 -3 MISSING ----- ----- ----- 100.0 100.0 2,947 cases Data type: numeric Missing-data codes: lowest thru -1 Columns: 38-39
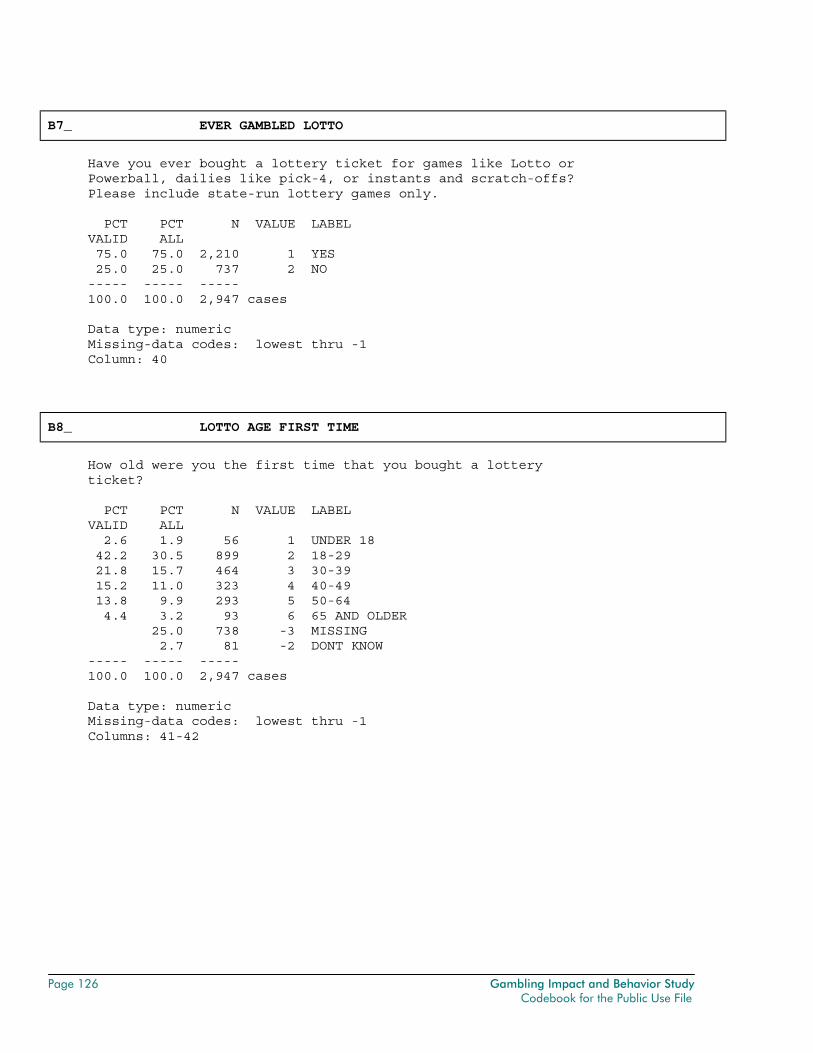
Page 126 Gambling Impact and Behavior Study Codebook for the Public Use File
B7_ EVER GAMBLED LOTTO
Have you ever bought a lottery ticket for games like Lotto or Powerball, dailies like pick-4, or instants and scratch-offs? Please include state-run lottery games only. PCT PCT N VALUE LABEL VALID ALL 75.0 75.0 2,210 1 YES 25.0 25.0 737 2 NO ----- ----- ----- 100.0 100.0 2,947 cases Data type: numeric Missing-data codes: lowest thru -1 Column: 40
B8_ LOTTO AGE FIRST TIME
How old were you the first time that you bought a lottery ticket? PCT PCT N VALUE LABEL VALID ALL 2.6 1.9 56 1 UNDER 18 42.2 30.5 899 2 18-29 21.8 15.7 464 3 30-39 15.2 11.0 323 4 40-49 13.8 9.9 293 5 50-64 4.4 3.2 93 6 65 AND OLDER 25.0 738 -3 MISSING 2.7 81 -2 DONT KNOW ----- ----- ----- 100.0 100.0 2,947 cases Data type: numeric Missing-data codes: lowest thru -1 Columns: 41-42
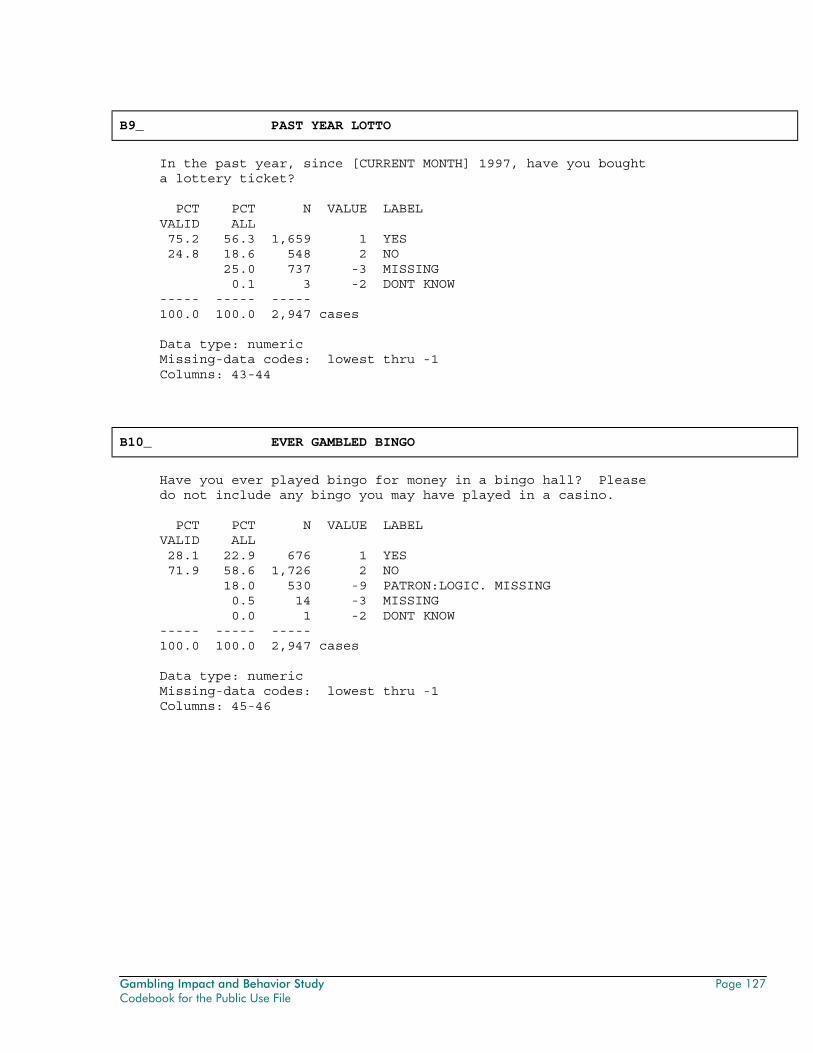
Gambling Impact and Behavior Study Page 127 Codebook for the Public Use File
B9_ PAST YEAR LOTTO
In the past year, since [CURRENT MONTH] 1997, have you bought a lottery ticket? PCT PCT N VALUE LABEL VALID ALL 75.2 56.3 1,659 1 YES 24.8 18.6 548 2 NO 25.0 737 -3 MISSING 0.1 3 -2 DONT KNOW ----- ----- ----- 100.0 100.0 2,947 cases Data type: numeric Missing-data codes: lowest thru -1 Columns: 43-44
B10_ EVER GAMBLED BINGO
Have you ever played bingo for money in a bingo hall? Please do not include any bingo you may have played in a casino. PCT PCT N VALUE LABEL VALID ALL 28.1 22.9 676 1 YES 71.9 58.6 1,726 2 NO 18.0 530 -9 PATRON:LOGIC. MISSING 0.5 14 -3 MISSING 0.0 1 -2 DONT KNOW ----- ----- ----- 100.0 100.0 2,947 cases Data type: numeric Missing-data codes: lowest thru -1 Columns: 45-46
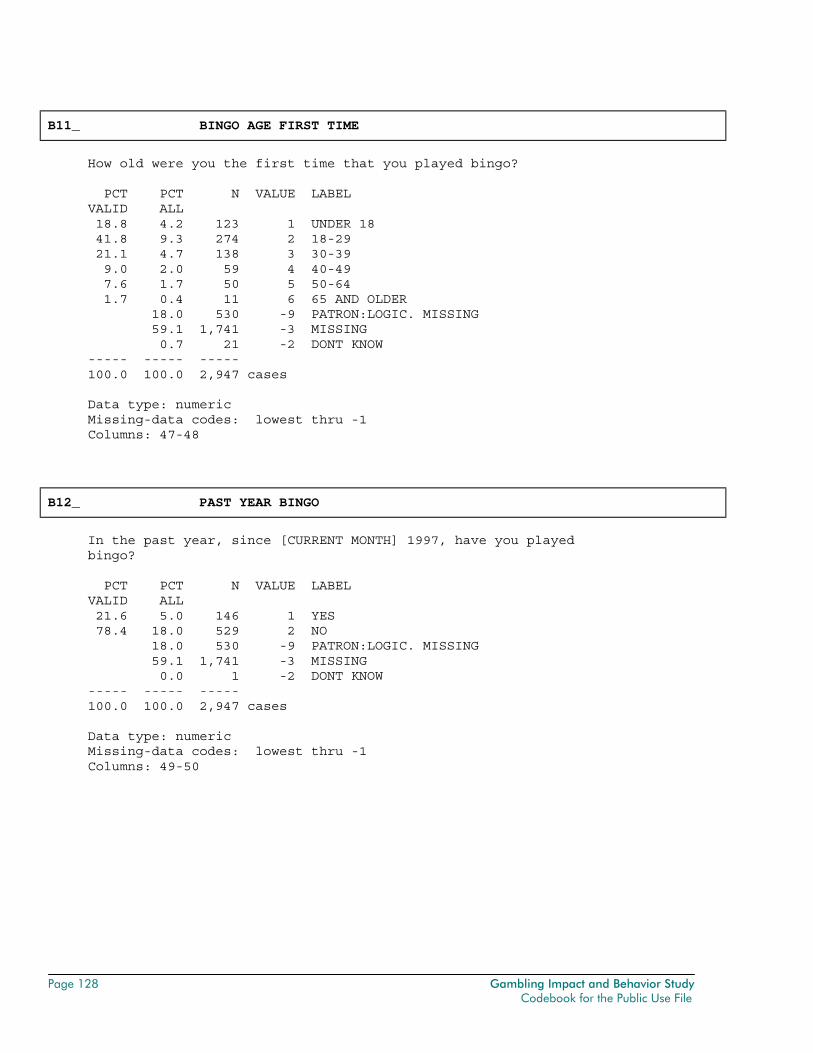
Page 128 Gambling Impact and Behavior Study Codebook for the Public Use File
B11_ BINGO AGE FIRST TIME
How old were you the first time that you played bingo? PCT PCT N VALUE LABEL VALID ALL 18.8 4.2 123 1 UNDER 18 41.8 9.3 274 2 18-29 21.1 4.7 138 3 30-39 9.0 2.0 59 4 40-49 7.6 1.7 50 5 50-64 1.7 0.4 11 6 65 AND OLDER 18.0 530 -9 PATRON:LOGIC. MISSING 59.1 1,741 -3 MISSING 0.7 21 -2 DONT KNOW ----- ----- ----- 100.0 100.0 2,947 cases Data type: numeric Missing-data codes: lowest thru -1 Columns: 47-48
B12_ PAST YEAR BINGO
In the past year, since [CURRENT MONTH] 1997, have you played bingo? PCT PCT N VALUE LABEL VALID ALL 21.6 5.0 146 1 YES 78.4 18.0 529 2 NO 18.0 530 -9 PATRON:LOGIC. MISSING 59.1 1,741 -3 MISSING 0.0 1 -2 DONT KNOW ----- ----- ----- 100.0 100.0 2,947 cases Data type: numeric Missing-data codes: lowest thru -1 Columns: 49-50
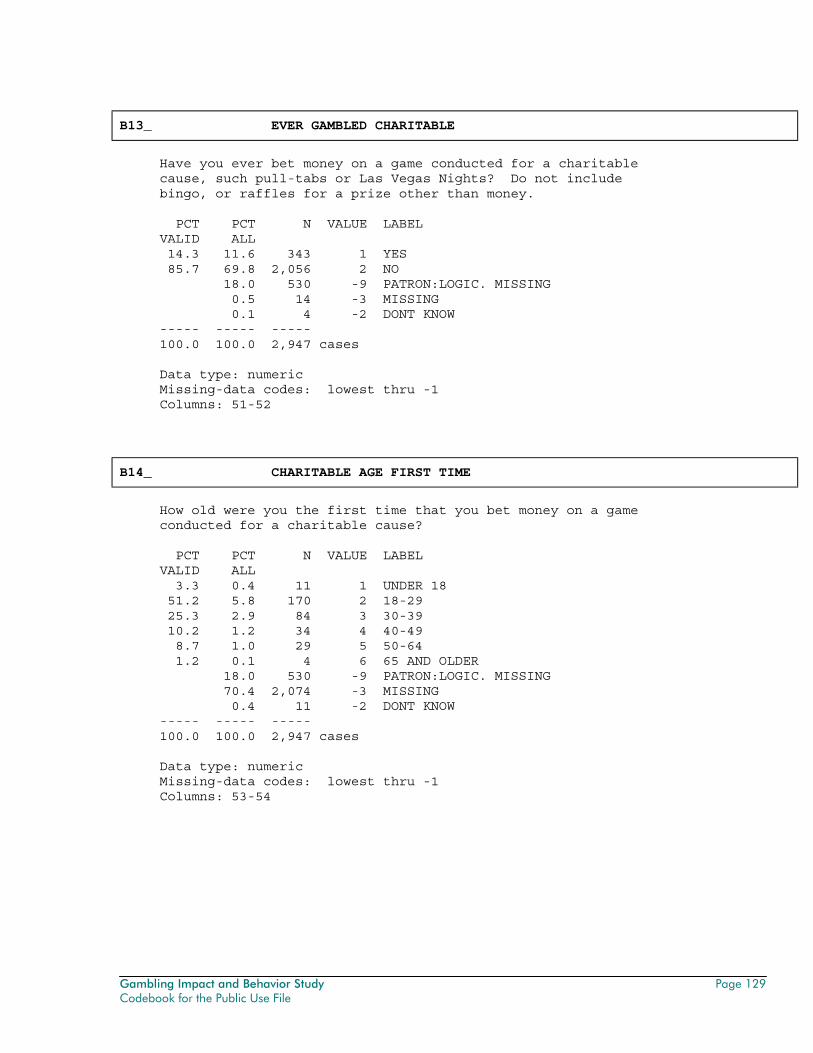
Gambling Impact and Behavior Study Page 129 Codebook for the Public Use File
B13_ EVER GAMBLED CHARITABLE
Have you ever bet money on a game conducted for a charitable cause, such pull-tabs or Las Vegas Nights? Do not include bingo, or raffles for a prize other than money. PCT PCT N VALUE LABEL VALID ALL 14.3 11.6 343 1 YES 85.7 69.8 2,056 2 NO 18.0 530 -9 PATRON:LOGIC. MISSING 0.5 14 -3 MISSING 0.1 4 -2 DONT KNOW ----- ----- ----- 100.0 100.0 2,947 cases Data type: numeric Missing-data codes: lowest thru -1 Columns: 51-52
B14_ CHARITABLE AGE FIRST TIME
How old were you the first time that you bet money on a game conducted for a charitable cause? PCT PCT N VALUE LABEL VALID ALL 3.3 0.4 11 1 UNDER 18 51.2 5.8 170 2 18-29 25.3 2.9 84 3 30-39 10.2 1.2 34 4 40-49 8.7 1.0 29 5 50-64 1.2 0.1 4 6 65 AND OLDER 18.0 530 -9 PATRON:LOGIC. MISSING 70.4 2,074 -3 MISSING 0.4 11 -2 DONT KNOW ----- ----- ----- 100.0 100.0 2,947 cases Data type: numeric Missing-data codes: lowest thru -1 Columns: 53-54
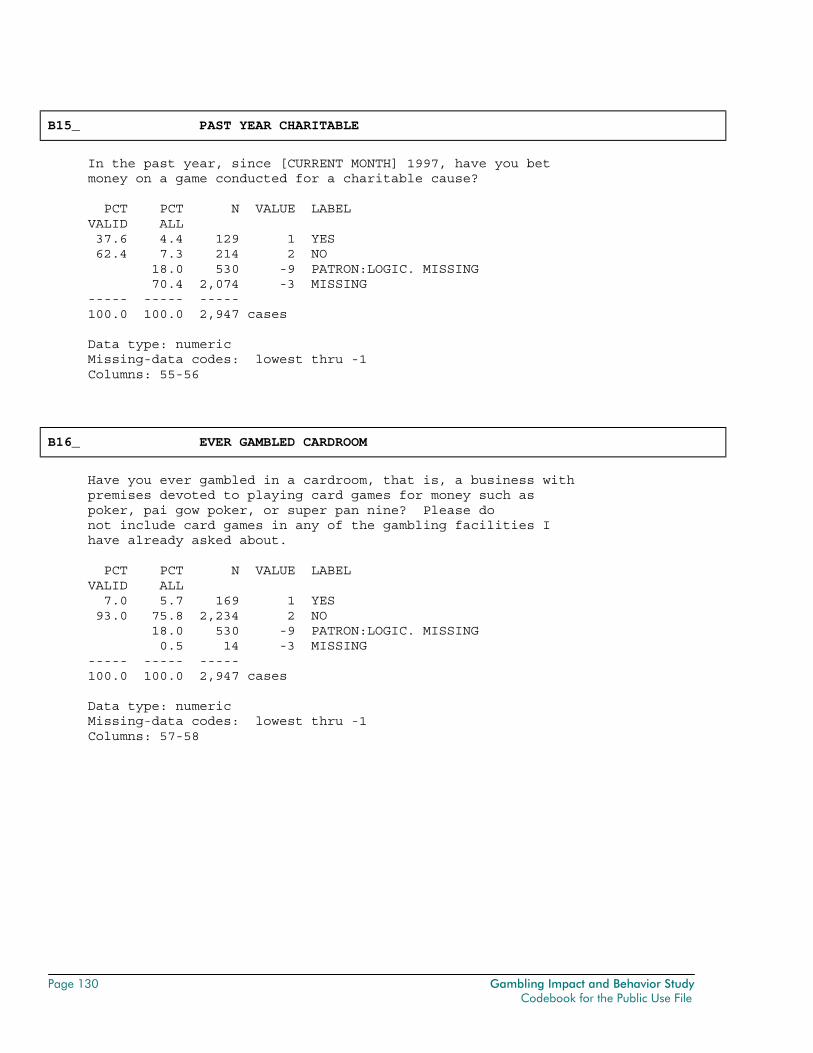
Page 130 Gambling Impact and Behavior Study Codebook for the Public Use File
B15_ PAST YEAR CHARITABLE
In the past year, since [CURRENT MONTH] 1997, have you bet money on a game conducted for a charitable cause? PCT PCT N VALUE LABEL VALID ALL 37.6 4.4 129 1 YES 62.4 7.3 214 2 NO 18.0 530 -9 PATRON:LOGIC. MISSING 70.4 2,074 -3 MISSING ----- ----- ----- 100.0 100.0 2,947 cases Data type: numeric Missing-data codes: lowest thru -1 Columns: 55-56
B16_ EVER GAMBLED CARDROOM
Have you ever gambled in a cardroom, that is, a business with premises devoted to playing card games for money such as poker, pai gow poker, or super pan nine? Please do not include card games in any of the gambling facilities I have already asked about. PCT PCT N VALUE LABEL VALID ALL 7.0 5.7 169 1 YES 93.0 75.8 2,234 2 NO 18.0 530 -9 PATRON:LOGIC. MISSING 0.5 14 -3 MISSING ----- ----- ----- 100.0 100.0 2,947 cases Data type: numeric Missing-data codes: lowest thru -1 Columns: 57-58
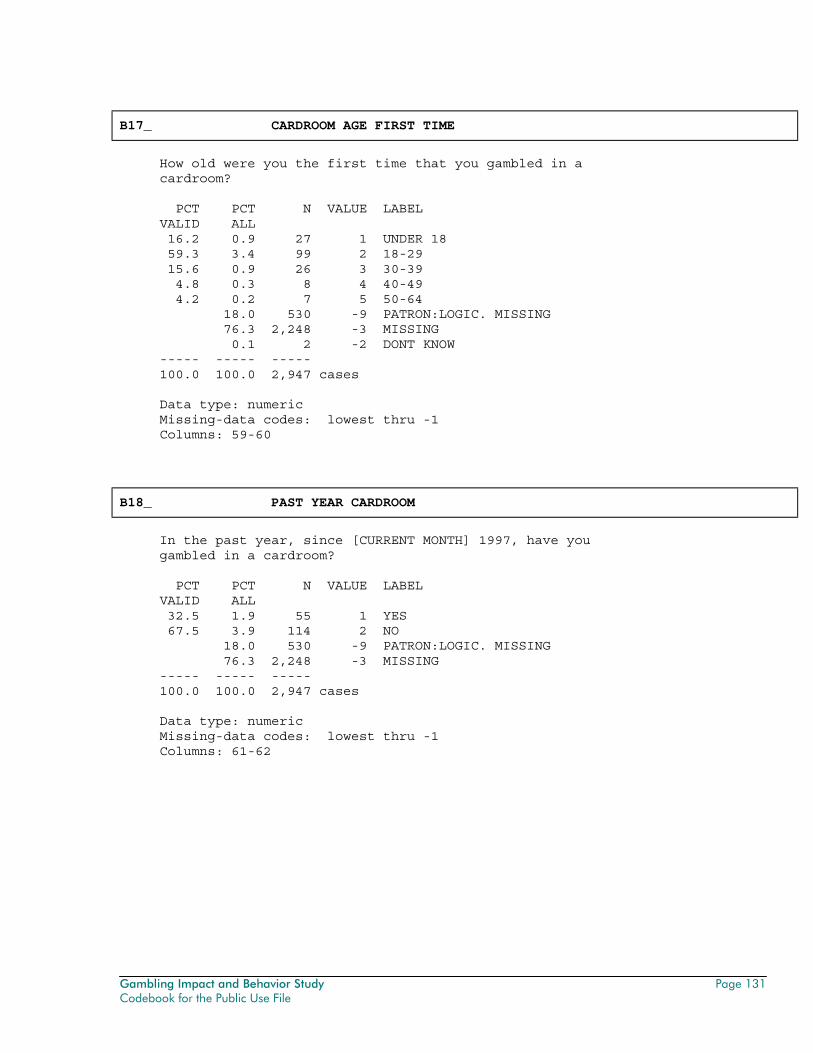
Gambling Impact and Behavior Study Page 131 Codebook for the Public Use File
B17_ CARDROOM AGE FIRST TIME
How old were you the first time that you gambled in a cardroom? PCT PCT N VALUE LABEL VALID ALL 16.2 0.9 27 1 UNDER 18 59.3 3.4 99 2 18-29 15.6 0.9 26 3 30-39 4.8 0.3 8 4 40-49 4.2 0.2 7 5 50-64 18.0 530 -9 PATRON:LOGIC. MISSING 76.3 2,248 -3 MISSING 0.1 2 -2 DONT KNOW ----- ----- ----- 100.0 100.0 2,947 cases Data type: numeric Missing-data codes: lowest thru -1 Columns: 59-60
B18_ PAST YEAR CARDROOM
In the past year, since [CURRENT MONTH] 1997, have you gambled in a cardroom? PCT PCT N VALUE LABEL VALID ALL 32.5 1.9 55 1 YES 67.5 3.9 114 2 NO 18.0 530 -9 PATRON:LOGIC. MISSING 76.3 2,248 -3 MISSING ----- ----- ----- 100.0 100.0 2,947 cases Data type: numeric Missing-data codes: lowest thru -1 Columns: 61-62
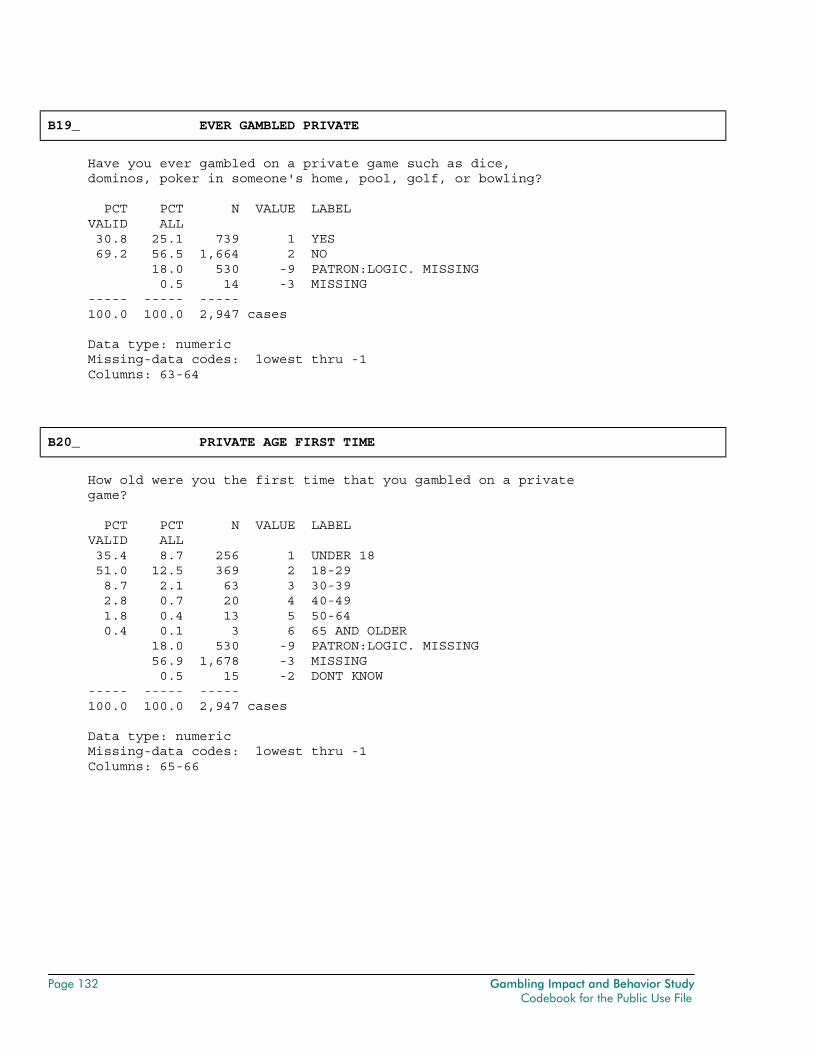
Page 132 Gambling Impact and Behavior Study Codebook for the Public Use File
B19_ EVER GAMBLED PRIVATE
Have you ever gambled on a private game such as dice, dominos, poker in someone's home, pool, golf, or bowling? PCT PCT N VALUE LABEL VALID ALL 30.8 25.1 739 1 YES 69.2 56.5 1,664 2 NO 18.0 530 -9 PATRON:LOGIC. MISSING 0.5 14 -3 MISSING ----- ----- ----- 100.0 100.0 2,947 cases Data type: numeric Missing-data codes: lowest thru -1 Columns: 63-64
B20_ PRIVATE AGE FIRST TIME
How old were you the first time that you gambled on a private game? PCT PCT N VALUE LABEL VALID ALL 35.4 8.7 256 1 UNDER 18 51.0 12.5 369 2 18-29 8.7 2.1 63 3 30-39 2.8 0.7 20 4 40-49 1.8 0.4 13 5 50-64 0.4 0.1 3 6 65 AND OLDER 18.0 530 -9 PATRON:LOGIC. MISSING 56.9 1,678 -3 MISSING 0.5 15 -2 DONT KNOW ----- ----- ----- 100.0 100.0 2,947 cases Data type: numeric Missing-data codes: lowest thru -1 Columns: 65-66
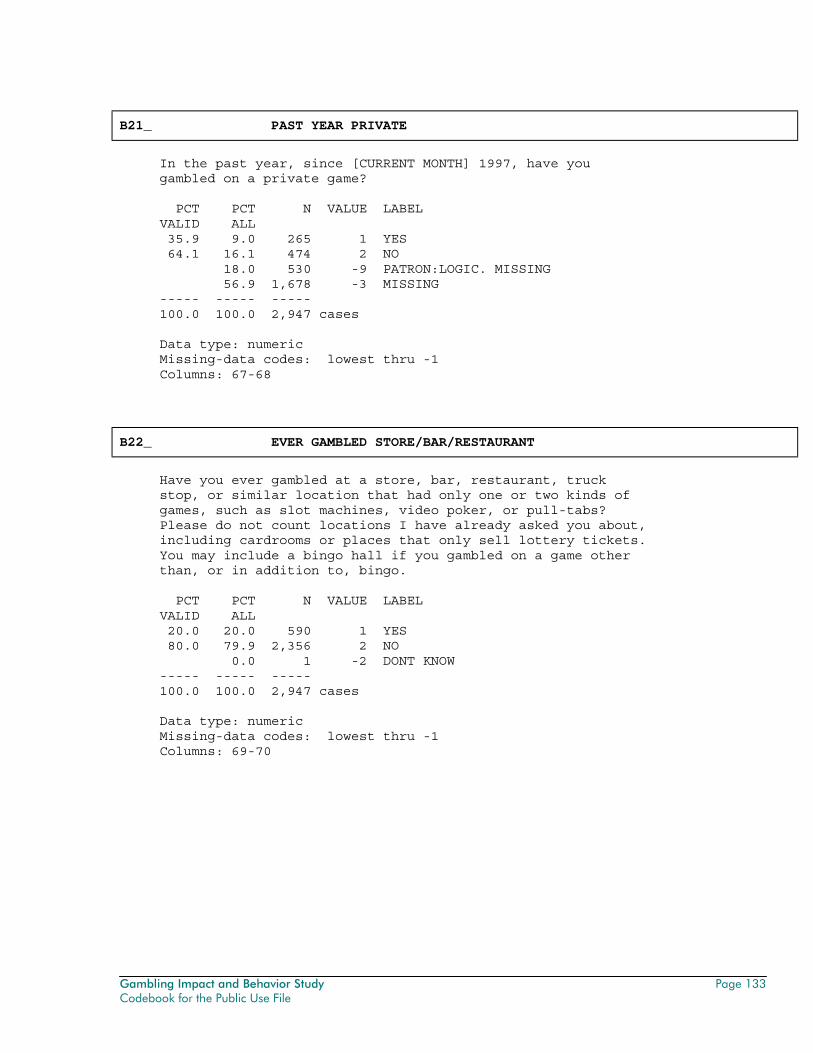
Gambling Impact and Behavior Study Page 133 Codebook for the Public Use File
B21_ PAST YEAR PRIVATE
In the past year, since [CURRENT MONTH] 1997, have you gambled on a private game? PCT PCT N VALUE LABEL VALID ALL 35.9 9.0 265 1 YES 64.1 16.1 474 2 NO 18.0 530 -9 PATRON:LOGIC. MISSING 56.9 1,678 -3 MISSING ----- ----- ----- 100.0 100.0 2,947 cases Data type: numeric Missing-data codes: lowest thru -1 Columns: 67-68
B22_ EVER GAMBLED STORE/BAR/RESTAURANT
Have you ever gambled at a store, bar, restaurant, truck stop, or similar location that had only one or two kinds of games, such as slot machines, video poker, or pull-tabs? Please do not count locations I have already asked you about, including cardrooms or places that only sell lottery tickets. You may include a bingo hall if you gambled on a game other than, or in addition to, bingo. PCT PCT N VALUE LABEL VALID ALL 20.0 20.0 590 1 YES 80.0 79.9 2,356 2 NO 0.0 1 -2 DONT KNOW ----- ----- ----- 100.0 100.0 2,947 cases Data type: numeric Missing-data codes: lowest thru -1 Columns: 69-70
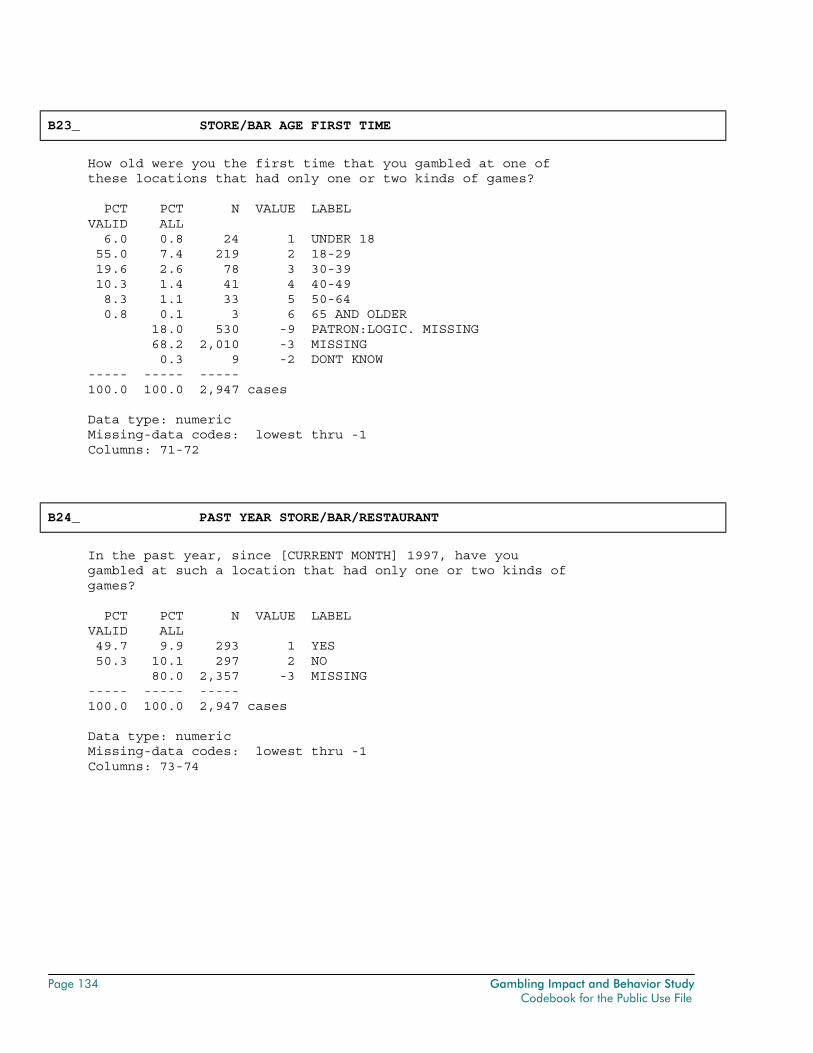
Page 134 Gambling Impact and Behavior Study Codebook for the Public Use File
B23_ STORE/BAR AGE FIRST TIME
How old were you the first time that you gambled at one of these locations that had only one or two kinds of games? PCT PCT N VALUE LABEL VALID ALL 6.0 0.8 24 1 UNDER 18 55.0 7.4 219 2 18-29 19.6 2.6 78 3 30-39 10.3 1.4 41 4 40-49 8.3 1.1 33 5 50-64 0.8 0.1 3 6 65 AND OLDER 18.0 530 -9 PATRON:LOGIC. MISSING 68.2 2,010 -3 MISSING 0.3 9 -2 DONT KNOW ----- ----- ----- 100.0 100.0 2,947 cases Data type: numeric Missing-data codes: lowest thru -1 Columns: 71-72
B24_ PAST YEAR STORE/BAR/RESTAURANT
In the past year, since [CURRENT MONTH] 1997, have you gambled at such a location that had only one or two kinds of games? PCT PCT N VALUE LABEL VALID ALL 49.7 9.9 293 1 YES 50.3 10.1 297 2 NO 80.0 2,357 -3 MISSING ----- ----- ----- 100.0 100.0 2,947 cases Data type: numeric Missing-data codes: lowest thru -1 Columns: 73-74
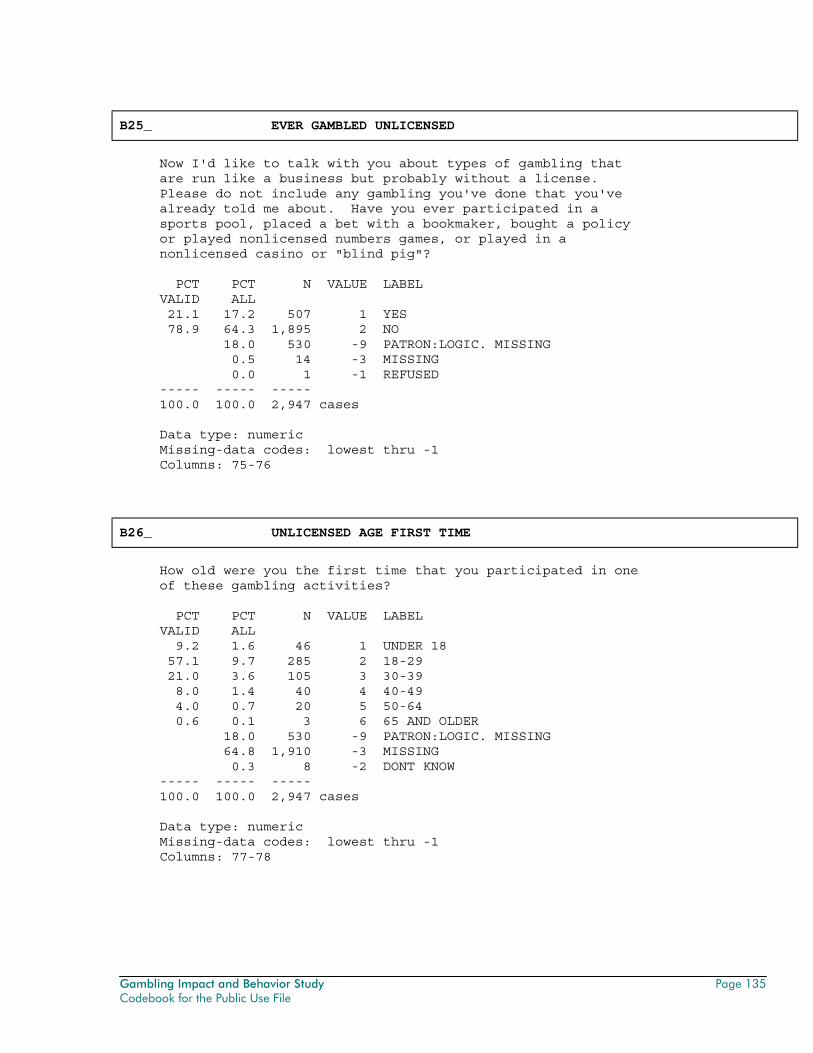
Gambling Impact and Behavior Study Page 135 Codebook for the Public Use File
B25_ EVER GAMBLED UNLICENSED
Now I'd like to talk with you about types of gambling that are run like a business but probably without a license. Please do not include any gambling you've done that you've already told me about. Have you ever participated in a sports pool, placed a bet with a bookmaker, bought a policy or played nonlicensed numbers games, or played in a nonlicensed casino or "blind pig"? PCT PCT N VALUE LABEL VALID ALL 21.1 17.2 507 1 YES 78.9 64.3 1,895 2 NO 18.0 530 -9 PATRON:LOGIC. MISSING 0.5 14 -3 MISSING 0.0 1 -1 REFUSED ----- ----- ----- 100.0 100.0 2,947 cases Data type: numeric Missing-data codes: lowest thru -1 Columns: 75-76
B26_ UNLICENSED AGE FIRST TIME
How old were you the first time that you participated in one of these gambling activities? PCT PCT N VALUE LABEL VALID ALL 9.2 1.6 46 1 UNDER 18 57.1 9.7 285 2 18-29 21.0 3.6 105 3 30-39 8.0 1.4 40 4 40-49 4.0 0.7 20 5 50-64 0.6 0.1 3 6 65 AND OLDER 18.0 530 -9 PATRON:LOGIC. MISSING 64.8 1,910 -3 MISSING 0.3 8 -2 DONT KNOW ----- ----- ----- 100.0 100.0 2,947 cases Data type: numeric Missing-data codes: lowest thru -1 Columns: 77-78
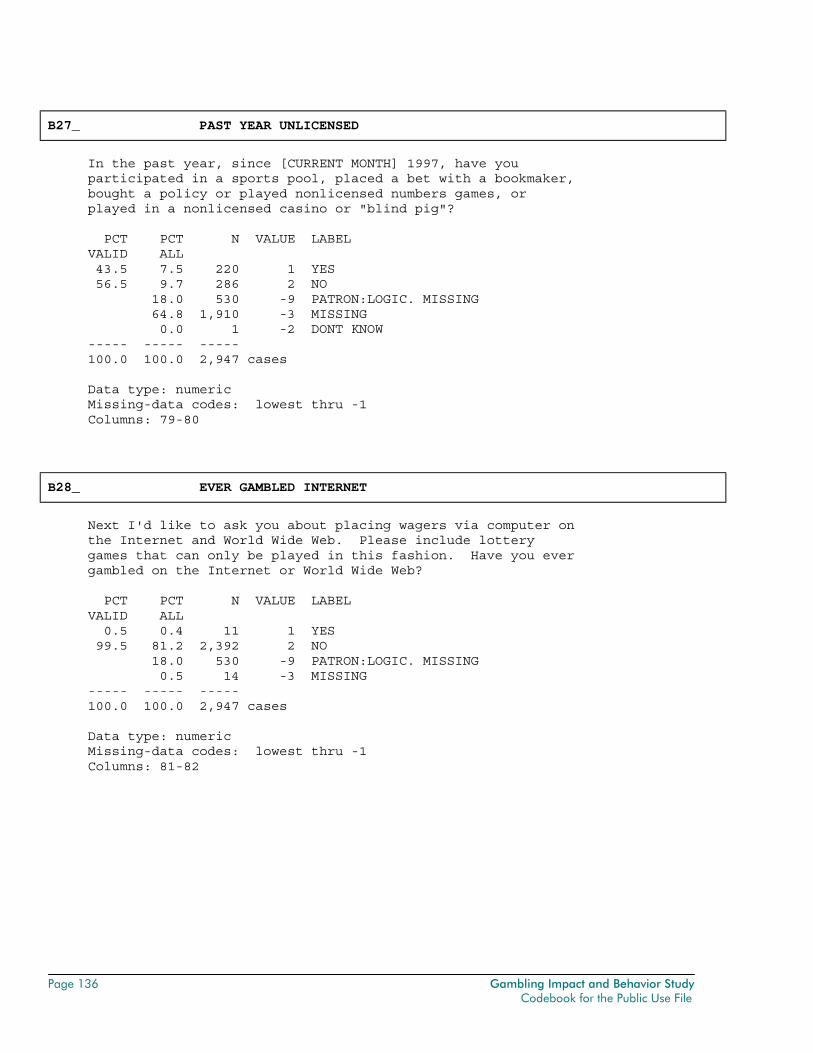
Page 136 Gambling Impact and Behavior Study Codebook for the Public Use File
B27_ PAST YEAR UNLICENSED
In the past year, since [CURRENT MONTH] 1997, have you participated in a sports pool, placed a bet with a bookmaker, bought a policy or played nonlicensed numbers games, or played in a nonlicensed casino or "blind pig"? PCT PCT N VALUE LABEL VALID ALL 43.5 7.5 220 1 YES 56.5 9.7 286 2 NO 18.0 530 -9 PATRON:LOGIC. MISSING 64.8 1,910 -3 MISSING 0.0 1 -2 DONT KNOW ----- ----- ----- 100.0 100.0 2,947 cases Data type: numeric Missing-data codes: lowest thru -1 Columns: 79-80
B28_ EVER GAMBLED INTERNET
Next I'd like to ask you about placing wagers via computer on the Internet and World Wide Web. Please include lottery games that can only be played in this fashion. Have you ever gambled on the Internet or World Wide Web? PCT PCT N VALUE LABEL VALID ALL 0.5 0.4 11 1 YES 99.5 81.2 2,392 2 NO 18.0 530 -9 PATRON:LOGIC. MISSING 0.5 14 -3 MISSING ----- ----- ----- 100.0 100.0 2,947 cases Data type: numeric Missing-data codes: lowest thru -1 Columns: 81-82
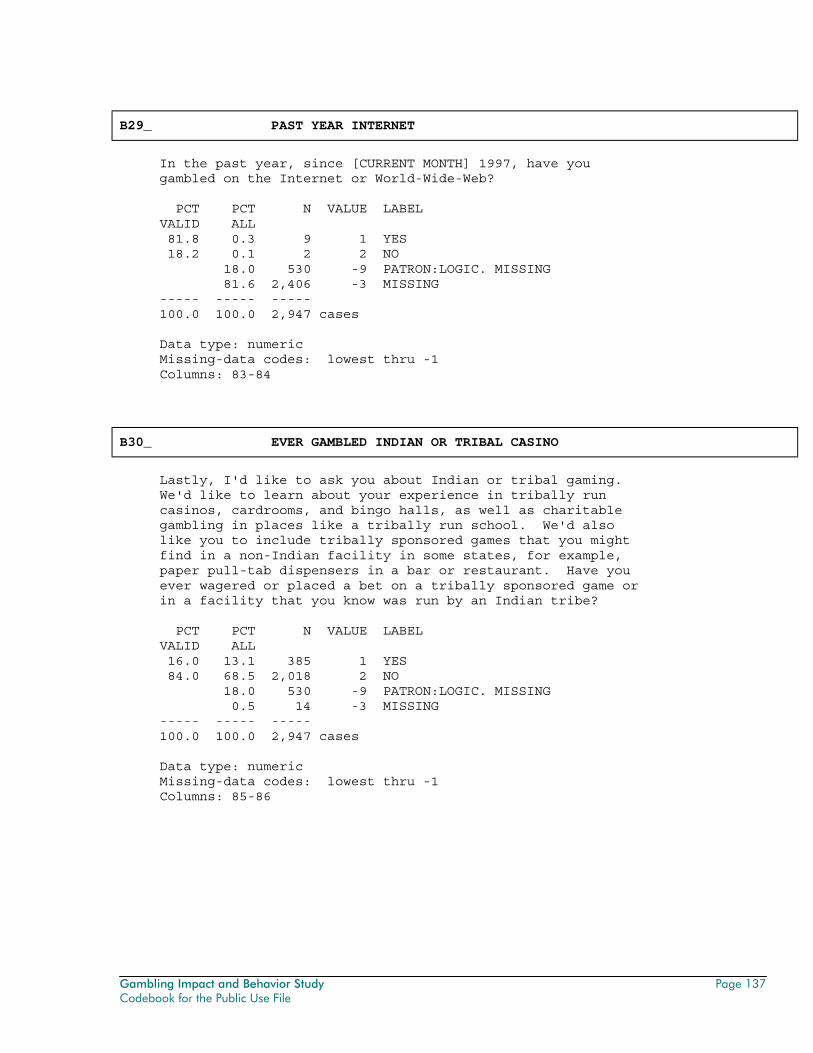
Gambling Impact and Behavior Study Page 137 Codebook for the Public Use File
B29_ PAST YEAR INTERNET
In the past year, since [CURRENT MONTH] 1997, have you gambled on the Internet or World-Wide-Web? PCT PCT N VALUE LABEL VALID ALL 81.8 0.3 9 1 YES 18.2 0.1 2 2 NO 18.0 530 -9 PATRON:LOGIC. MISSING 81.6 2,406 -3 MISSING ----- ----- ----- 100.0 100.0 2,947 cases Data type: numeric Missing-data codes: lowest thru -1 Columns: 83-84
B30_ EVER GAMBLED INDIAN OR TRIBAL CASINO
Lastly, I'd like to ask you about Indian or tribal gaming. We'd like to learn about your experience in tribally run casinos, cardrooms, and bingo halls, as well as charitable gambling in places like a tribally run school. We'd also like you to include tribally sponsored games that you might find in a non-Indian facility in some states, for example, paper pull-tab dispensers in a bar or restaurant. Have you ever wagered or placed a bet on a tribally sponsored game or in a facility that you know was run by an Indian tribe? PCT PCT N VALUE LABEL VALID ALL 16.0 13.1 385 1 YES 84.0 68.5 2,018 2 NO 18.0 530 -9 PATRON:LOGIC. MISSING 0.5 14 -3 MISSING ----- ----- ----- 100.0 100.0 2,947 cases Data type: numeric Missing-data codes: lowest thru -1 Columns: 85-86
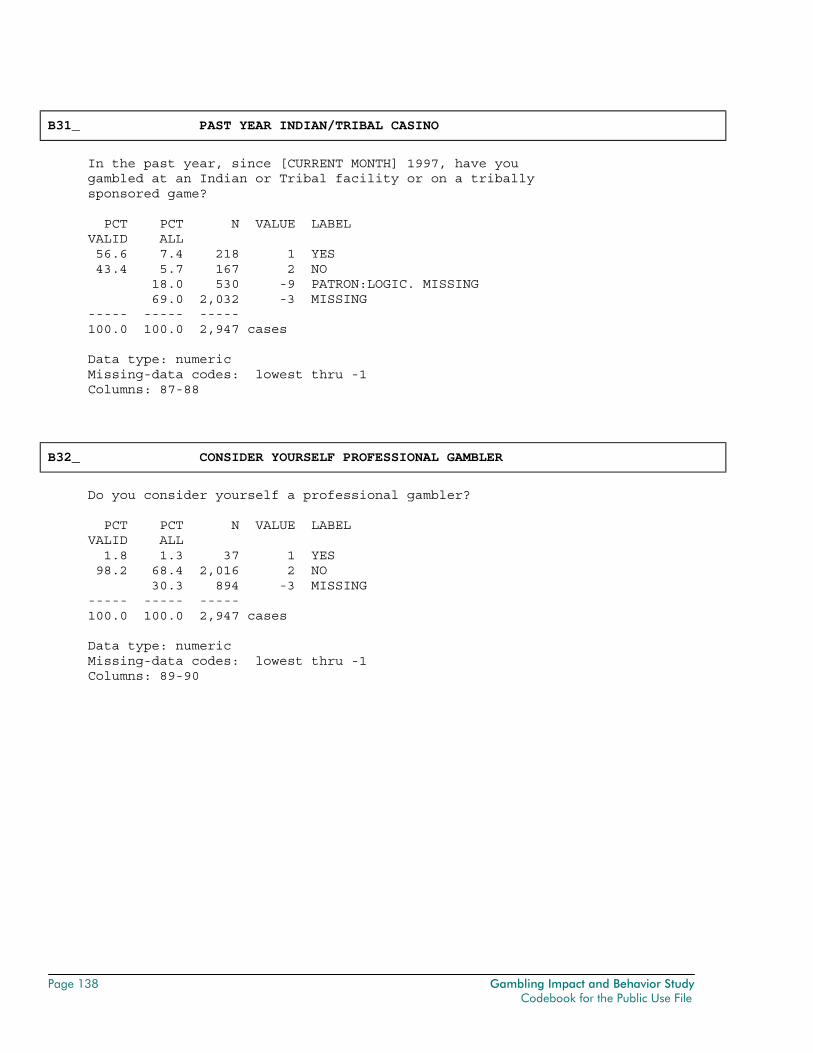
Page 138 Gambling Impact and Behavior Study Codebook for the Public Use File
B31_ PAST YEAR INDIAN/TRIBAL CASINO
In the past year, since [CURRENT MONTH] 1997, have you gambled at an Indian or Tribal facility or on a tribally sponsored game? PCT PCT N VALUE LABEL VALID ALL 56.6 7.4 218 1 YES 43.4 5.7 167 2 NO 18.0 530 -9 PATRON:LOGIC. MISSING 69.0 2,032 -3 MISSING ----- ----- ----- 100.0 100.0 2,947 cases Data type: numeric Missing-data codes: lowest thru -1 Columns: 87-88
B32_ CONSIDER YOURSELF PROFESSIONAL GAMBLER
Do you consider yourself a professional gambler? PCT PCT N VALUE LABEL VALID ALL 1.8 1.3 37 1 YES 98.2 68.4 2,016 2 NO 30.3 894 -3 MISSING ----- ----- ----- 100.0 100.0 2,947 cases Data type: numeric Missing-data codes: lowest thru -1 Columns: 89-90
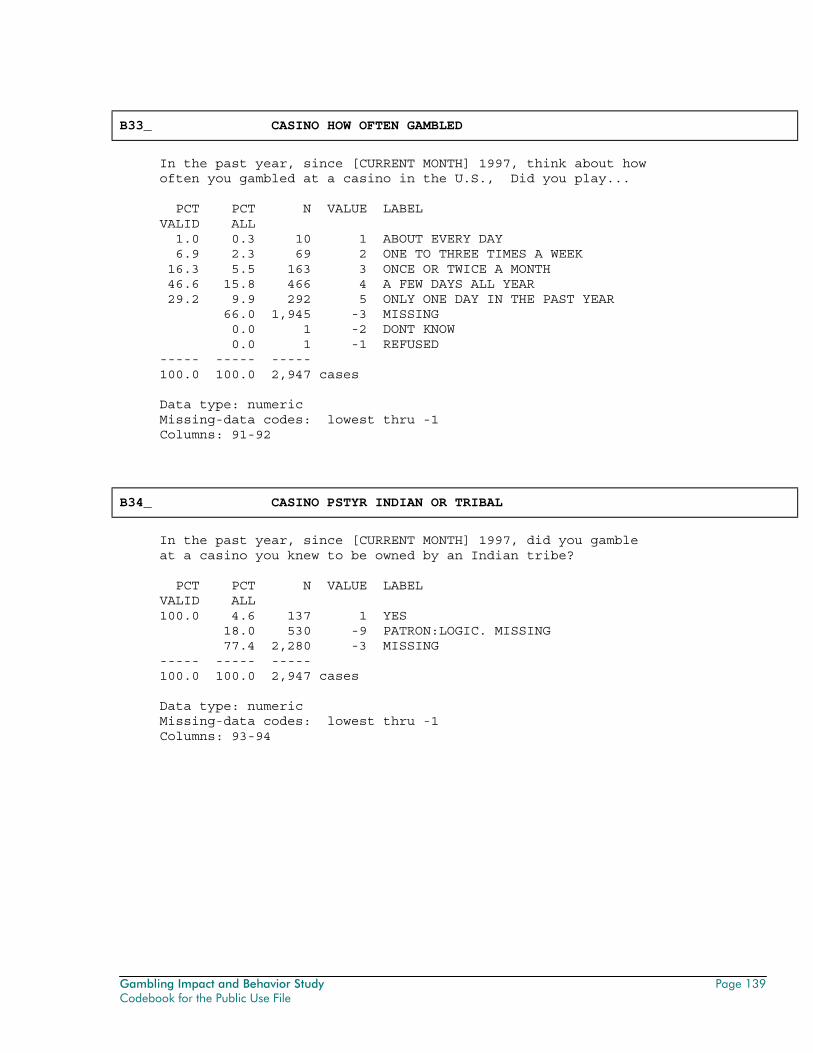
Gambling Impact and Behavior Study Page 139 Codebook for the Public Use File
B33_ CASINO HOW OFTEN GAMBLED
In the past year, since [CURRENT MONTH] 1997, think about how often you gambled at a casino in the U.S., Did you play... PCT PCT N VALUE LABEL VALID ALL 1.0 0.3 10 1 ABOUT EVERY DAY 6.9 2.3 69 2 ONE TO THREE TIMES A WEEK 16.3 5.5 163 3 ONCE OR TWICE A MONTH 46.6 15.8 466 4 A FEW DAYS ALL YEAR 29.2 9.9 292 5 ONLY ONE DAY IN THE PAST YEAR 66.0 1,945 -3 MISSING 0.0 1 -2 DONT KNOW 0.0 1 -1 REFUSED ----- ----- ----- 100.0 100.0 2,947 cases Data type: numeric Missing-data codes: lowest thru -1 Columns: 91-92
B34_ CASINO PSTYR INDIAN OR TRIBAL
In the past year, since [CURRENT MONTH] 1997, did you gamble at a casino you knew to be owned by an Indian tribe? PCT PCT N VALUE LABEL VALID ALL 100.0 4.6 137 1 YES 18.0 530 -9 PATRON:LOGIC. MISSING 77.4 2,280 -3 MISSING ----- ----- ----- 100.0 100.0 2,947 cases Data type: numeric Missing-data codes: lowest thru -1 Columns: 93-94
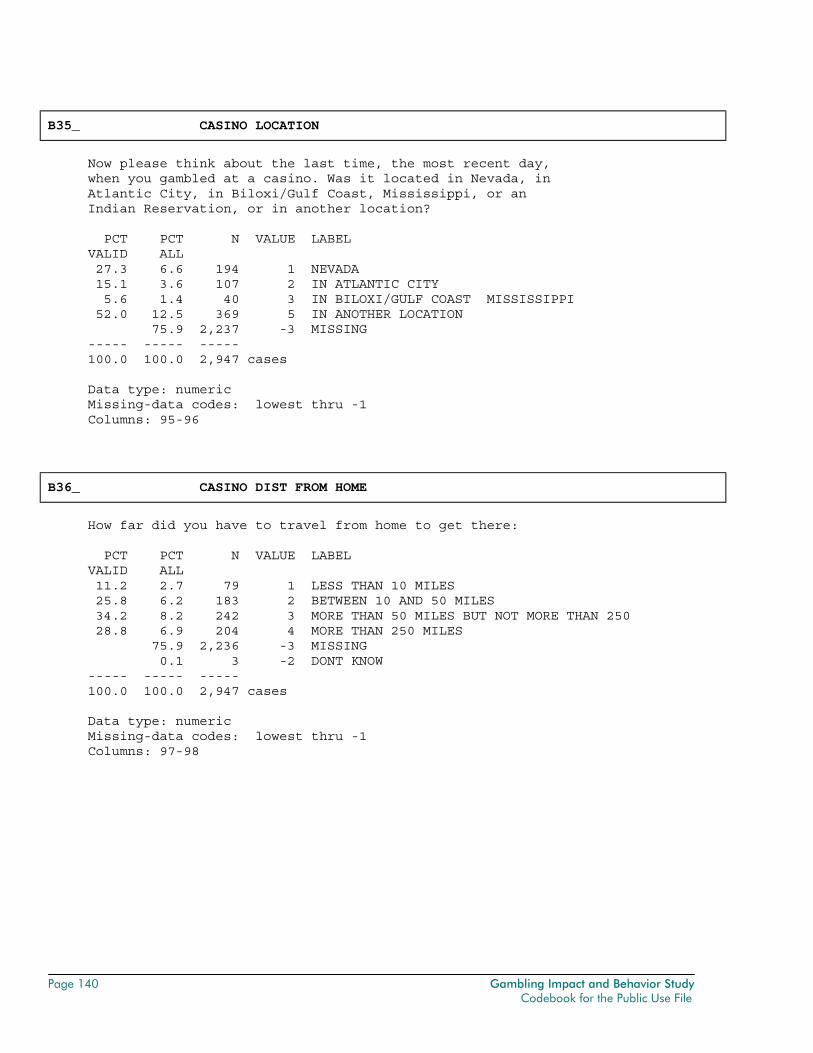
Page 140 Gambling Impact and Behavior Study Codebook for the Public Use File
B35_ CASINO LOCATION
Now please think about the last time, the most recent day, when you gambled at a casino. Was it located in Nevada, in Atlantic City, in Biloxi/Gulf Coast, Mississippi, or an Indian Reservation, or in another location? PCT PCT N VALUE LABEL VALID ALL 27.3 6.6 194 1 NEVADA 15.1 3.6 107 2 IN ATLANTIC CITY 5.6 1.4 40 3 IN BILOXI/GULF COAST MISSISSIPPI 52.0 12.5 369 5 IN ANOTHER LOCATION 75.9 2,237 -3 MISSING ----- ----- ----- 100.0 100.0 2,947 cases Data type: numeric Missing-data codes: lowest thru -1 Columns: 95-96
B36_ CASINO DIST FROM HOME
How far did you have to travel from home to get there: PCT PCT N VALUE LABEL VALID ALL 11.2 2.7 79 1 LESS THAN 10 MILES 25.8 6.2 183 2 BETWEEN 10 AND 50 MILES 34.2 8.2 242 3 MORE THAN 50 MILES BUT NOT MORE THAN 250 28.8 6.9 204 4 MORE THAN 250 MILES 75.9 2,236 -3 MISSING 0.1 3 -2 DONT KNOW ----- ----- ----- 100.0 100.0 2,947 cases Data type: numeric Missing-data codes: lowest thru -1 Columns: 97-98
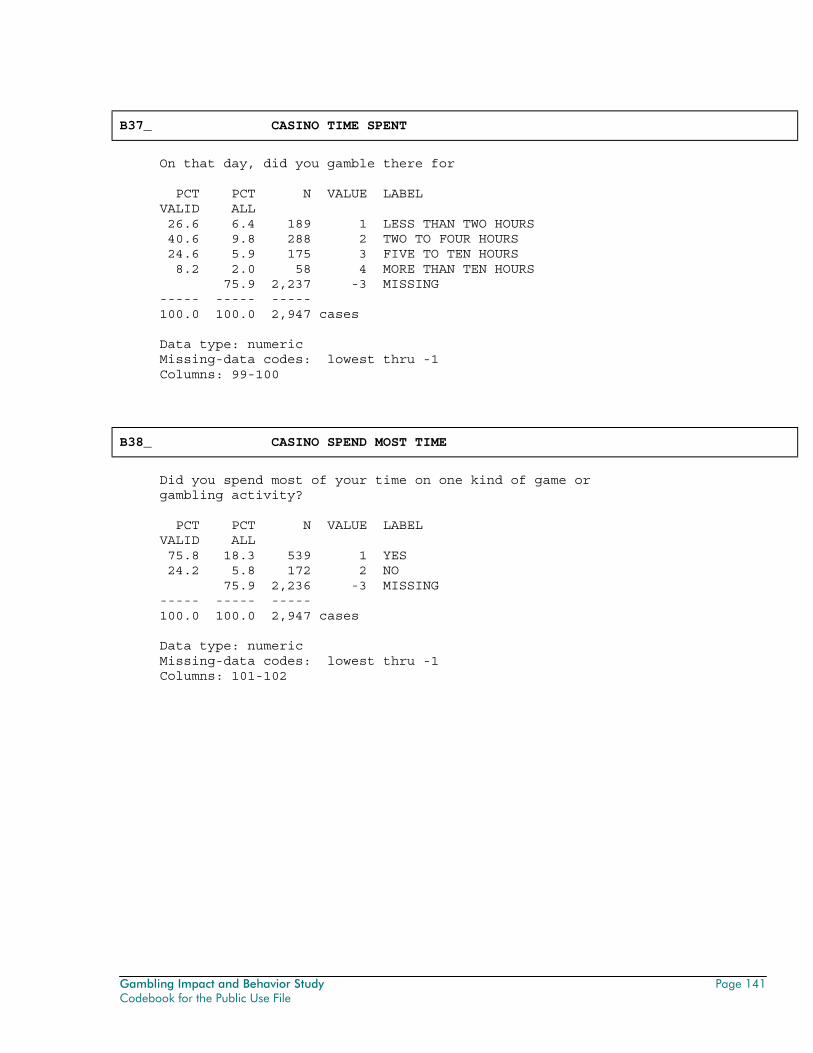
Gambling Impact and Behavior Study Page 141 Codebook for the Public Use File
B37_ CASINO TIME SPENT
On that day, did you gamble there for PCT PCT N VALUE LABEL VALID ALL 26.6 6.4 189 1 LESS THAN TWO HOURS 40.6 9.8 288 2 TWO TO FOUR HOURS 24.6 5.9 175 3 FIVE TO TEN HOURS 8.2 2.0 58 4 MORE THAN TEN HOURS 75.9 2,237 -3 MISSING ----- ----- ----- 100.0 100.0 2,947 cases Data type: numeric Missing-data codes: lowest thru -1 Columns: 99-100
B38_ CASINO SPEND MOST TIME
Did you spend most of your time on one kind of game or gambling activity? PCT PCT N VALUE LABEL VALID ALL 75.8 18.3 539 1 YES 24.2 5.8 172 2 NO 75.9 2,236 -3 MISSING ----- ----- ----- 100.0 100.0 2,947 cases Data type: numeric Missing-data codes: lowest thru -1 Columns: 101-102
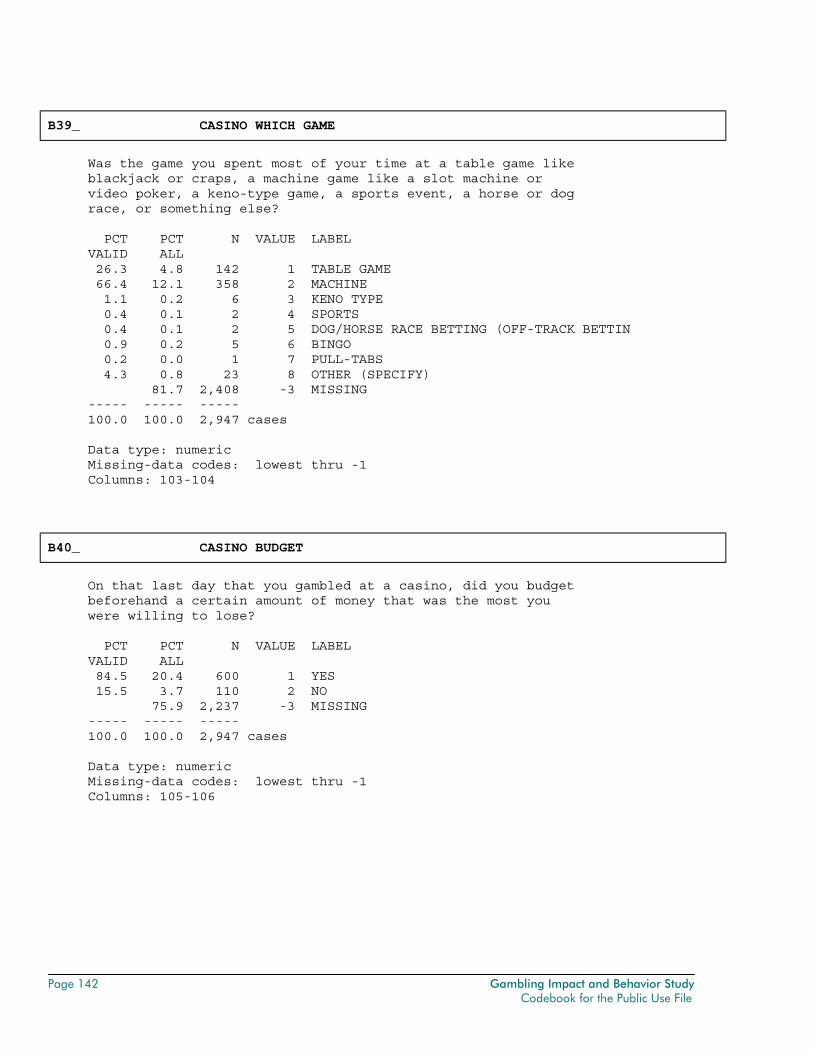
Page 142 Gambling Impact and Behavior Study Codebook for the Public Use File
B39_ CASINO WHICH GAME
Was the game you spent most of your time at a table game like blackjack or craps, a machine game like a slot machine or video poker, a keno-type game, a sports event, a horse or dog race, or something else? PCT PCT N VALUE LABEL VALID ALL 26.3 4.8 142 1 TABLE GAME 66.4 12.1 358 2 MACHINE 1.1 0.2 6 3 KENO TYPE 0.4 0.1 2 4 SPORTS 0.4 0.1 2 5 DOG/HORSE RACE BETTING (OFF-TRACK BETTIN 0.9 0.2 5 6 BINGO 0.2 0.0 1 7 PULL-TABS 4.3 0.8 23 8 OTHER (SPECIFY) 81.7 2,408 -3 MISSING ----- ----- ----- 100.0 100.0 2,947 cases Data type: numeric Missing-data codes: lowest thru -1 Columns: 103-104
B40_ CASINO BUDGET
On that last day that you gambled at a casino, did you budget beforehand a certain amount of money that was the most you were willing to lose? PCT PCT N VALUE LABEL VALID ALL 84.5 20.4 600 1 YES 15.5 3.7 110 2 NO 75.9 2,237 -3 MISSING ----- ----- ----- 100.0 100.0 2,947 cases Data type: numeric Missing-data codes: lowest thru -1 Columns: 105-106
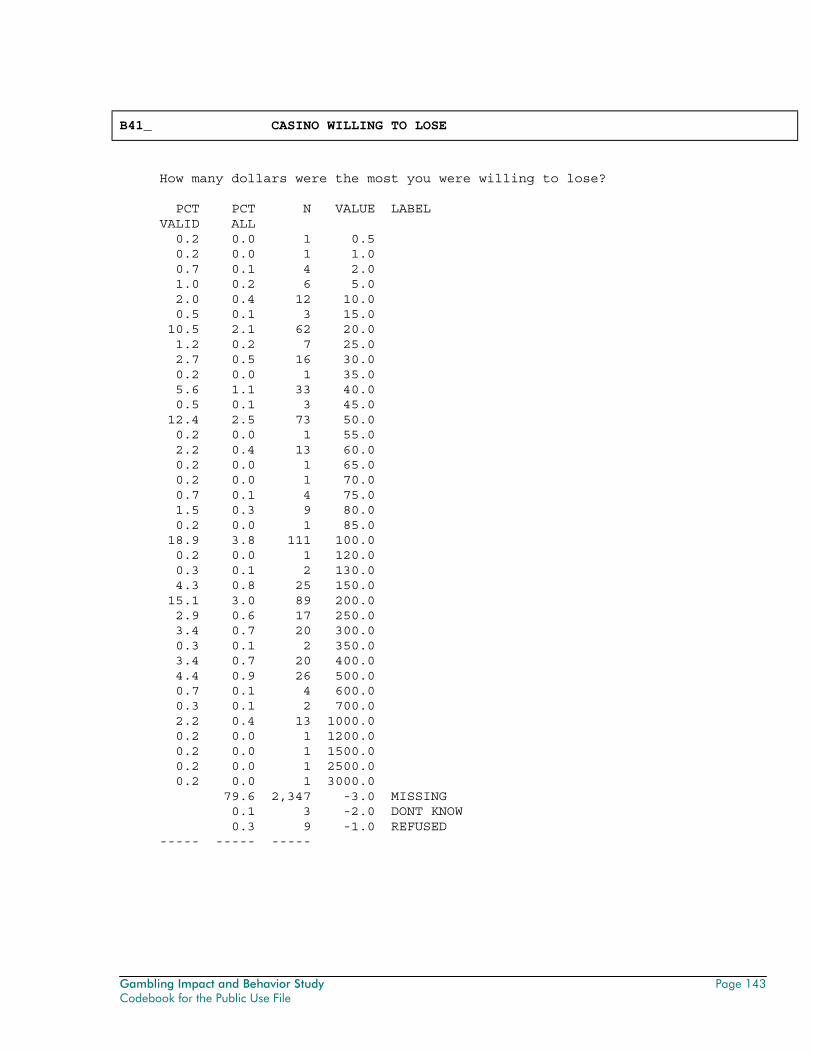
Gambling Impact and Behavior Study Page 143 Codebook for the Public Use File
B41_ CASINO WILLING TO LOSE
How many dollars were the most you were willing to lose? PCT PCT N VALUE LABEL VALID ALL 0.2 0.0 1 0.5 0.2 0.0 1 1.0 0.7 0.1 4 2.0 1.0 0.2 6 5.0 2.0 0.4 12 10.0 0.5 0.1 3 15.0 10.5 2.1 62 20.0 1.2 0.2 7 25.0 2.7 0.5 16 30.0 0.2 0.0 1 35.0 5.6 1.1 33 40.0 0.5 0.1 3 45.0 12.4 2.5 73 50.0 0.2 0.0 1 55.0 2.2 0.4 13 60.0 0.2 0.0 1 65.0 0.2 0.0 1 70.0 0.7 0.1 4 75.0 1.5 0.3 9 80.0 0.2 0.0 1 85.0 18.9 3.8 111 100.0 0.2 0.0 1 120.0 0.3 0.1 2 130.0 4.3 0.8 25 150.0 15.1 3.0 89 200.0 2.9 0.6 17 250.0 3.4 0.7 20 300.0 0.3 0.1 2 350.0 3.4 0.7 20 400.0 4.4 0.9 26 500.0 0.7 0.1 4 600.0 0.3 0.1 2 700.0 2.2 0.4 13 1000.0 0.2 0.0 1 1200.0 0.2 0.0 1 1500.0 0.2 0.0 1 2500.0 0.2 0.0 1 3000.0 79.6 2,347 -3.0 MISSING 0.1 3 -2.0 DONT KNOW 0.3 9 -1.0 REFUSED ----- ----- -----
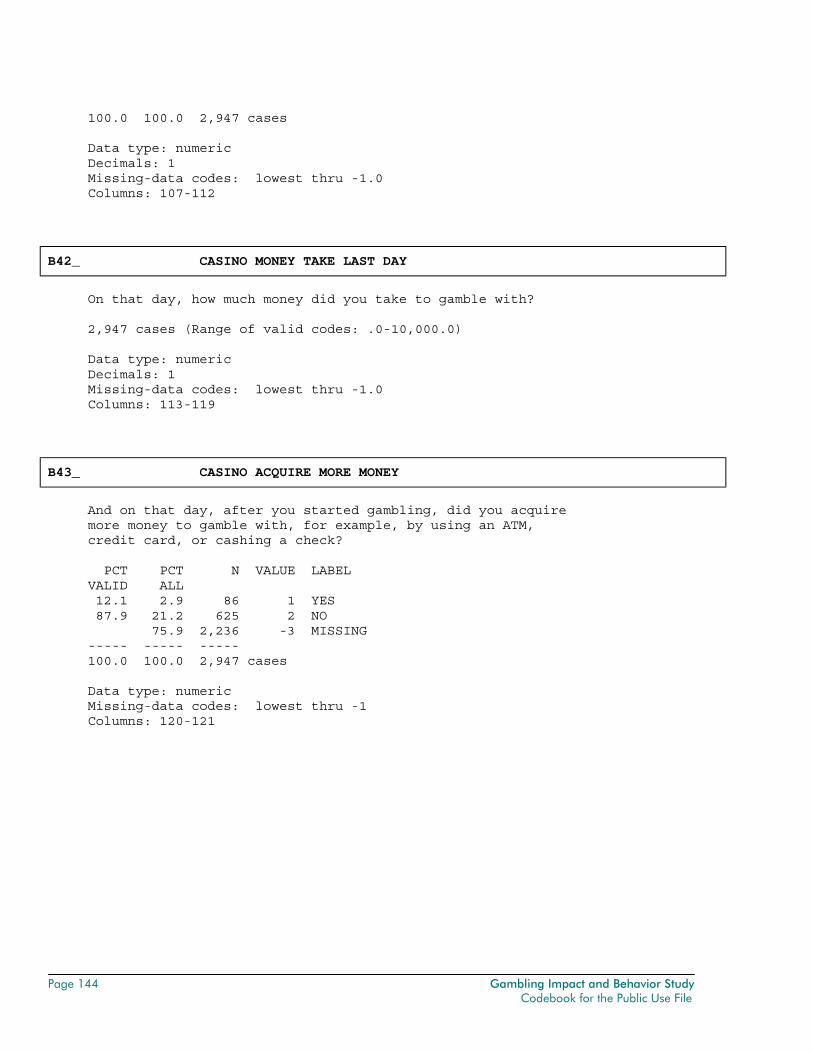
Page 144 Gambling Impact and Behavior Study Codebook for the Public Use File
100.0 100.0 2,947 cases Data type: numeric Decimals: 1 Missing-data codes: lowest thru -1.0 Columns: 107-112
B42_ CASINO MONEY TAKE LAST DAY
On that day, how much money did you take to gamble with? 2,947 cases (Range of valid codes: .0-10,000.0) Data type: numeric Decimals: 1 Missing-data codes: lowest thru -1.0 Columns: 113-119
B43_ CASINO ACQUIRE MORE MONEY
And on that day, after you started gambling, did you acquire more money to gamble with, for example, by using an ATM, credit card, or cashing a check? PCT PCT N VALUE LABEL VALID ALL 12.1 2.9 86 1 YES 87.9 21.2 625 2 NO 75.9 2,236 -3 MISSING ----- ----- ----- 100.0 100.0 2,947 cases Data type: numeric Missing-data codes: lowest thru -1 Columns: 120-121
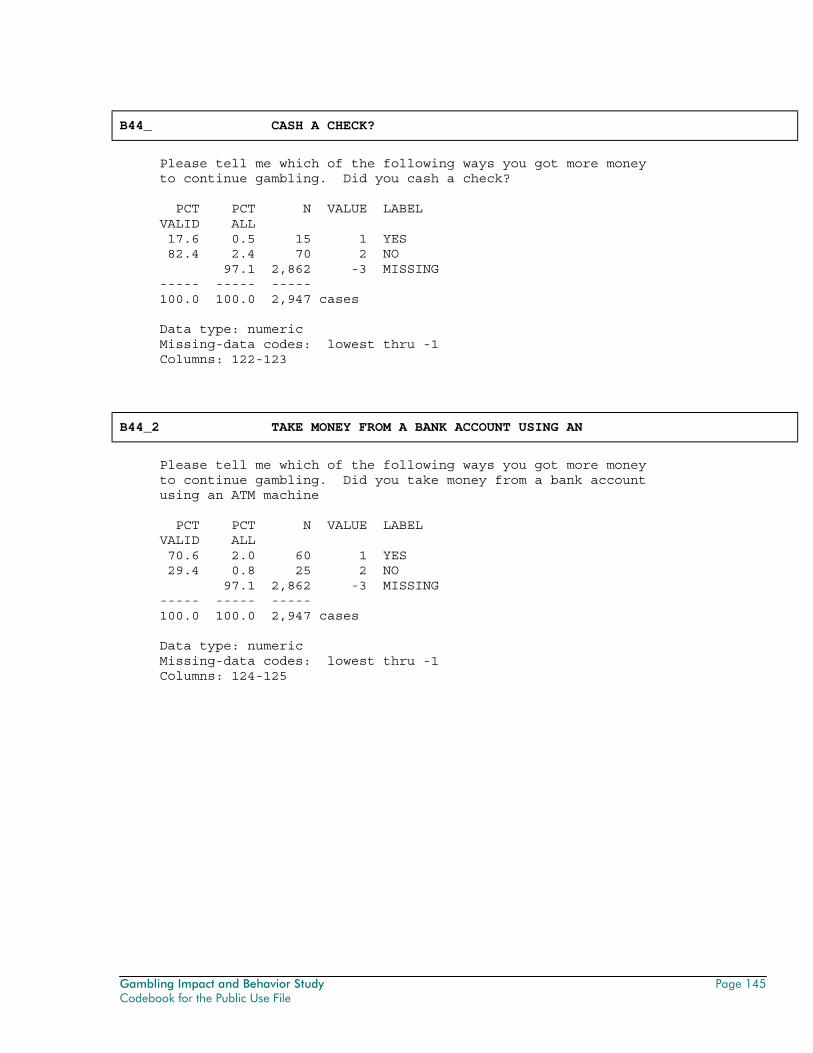
Gambling Impact and Behavior Study Page 145 Codebook for the Public Use File
B44_ CASH A CHECK?
Please tell me which of the following ways you got more money to continue gambling. Did you cash a check? PCT PCT N VALUE LABEL VALID ALL 17.6 0.5 15 1 YES 82.4 2.4 70 2 NO 97.1 2,862 -3 MISSING ----- ----- ----- 100.0 100.0 2,947 cases Data type: numeric Missing-data codes: lowest thru -1 Columns: 122-123
B44_2 TAKE MONEY FROM A BANK ACCOUNT USING AN
Please tell me which of the following ways you got more money to continue gambling. Did you take money from a bank account using an ATM machine PCT PCT N VALUE LABEL VALID ALL 70.6 2.0 60 1 YES 29.4 0.8 25 2 NO 97.1 2,862 -3 MISSING ----- ----- ----- 100.0 100.0 2,947 cases Data type: numeric Missing-data codes: lowest thru -1 Columns: 124-125
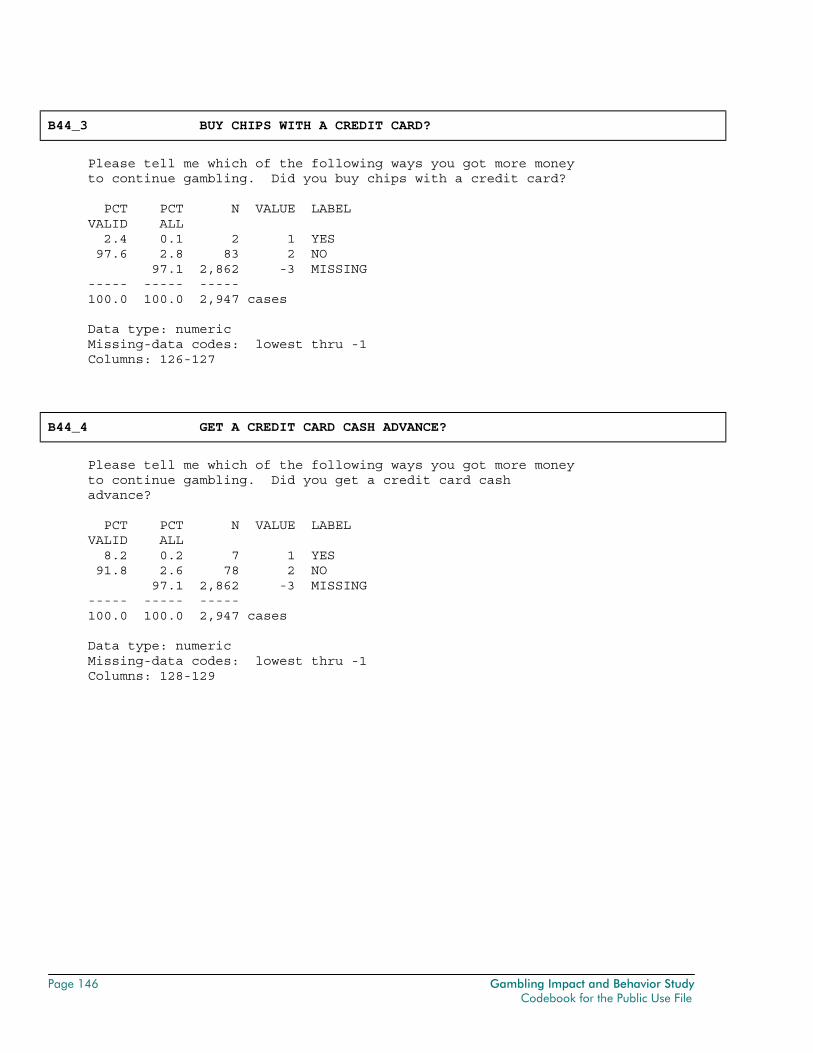
Page 146 Gambling Impact and Behavior Study Codebook for the Public Use File
B44_3 BUY CHIPS WITH A CREDIT CARD?
Please tell me which of the following ways you got more money to continue gambling. Did you buy chips with a credit card? PCT PCT N VALUE LABEL VALID ALL 2.4 0.1 2 1 YES 97.6 2.8 83 2 NO 97.1 2,862 -3 MISSING ----- ----- ----- 100.0 100.0 2,947 cases Data type: numeric Missing-data codes: lowest thru -1 Columns: 126-127
B44_4 GET A CREDIT CARD CASH ADVANCE?
Please tell me which of the following ways you got more money to continue gambling. Did you get a credit card cash advance? PCT PCT N VALUE LABEL VALID ALL 8.2 0.2 7 1 YES 91.8 2.6 78 2 NO 97.1 2,862 -3 MISSING ----- ----- ----- 100.0 100.0 2,947 cases Data type: numeric Missing-data codes: lowest thru -1 Columns: 128-129
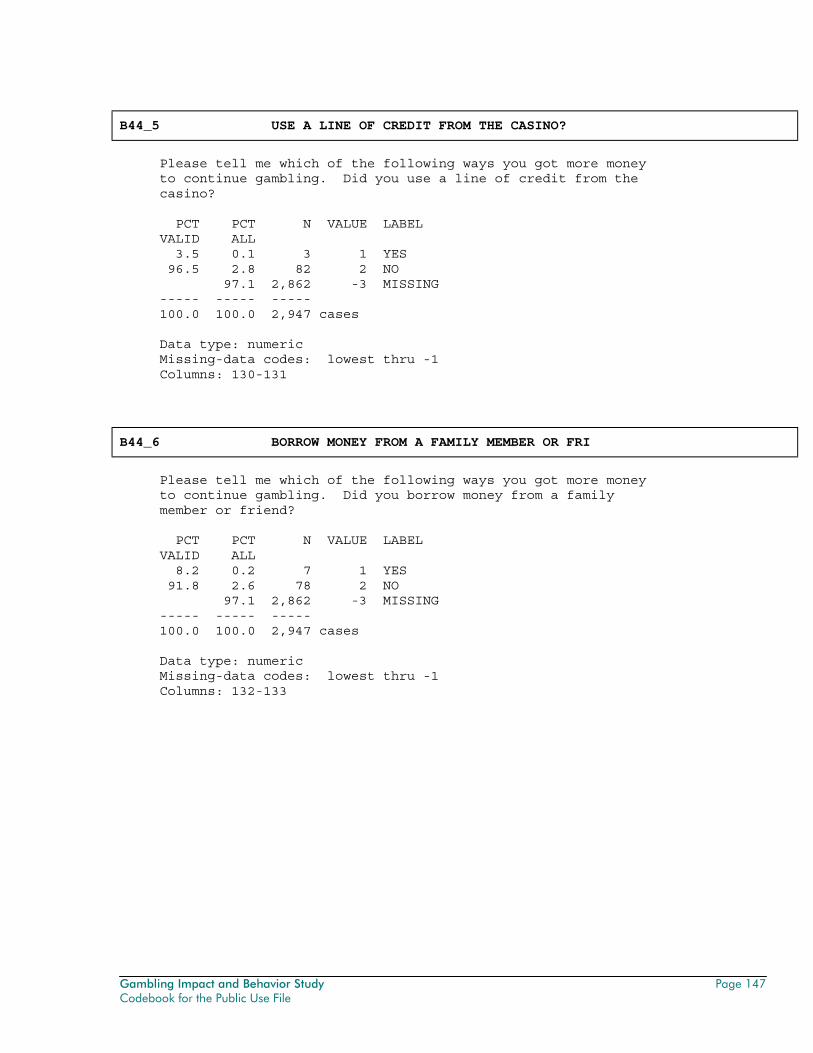
Gambling Impact and Behavior Study Page 147 Codebook for the Public Use File
B44_5 USE A LINE OF CREDIT FROM THE CASINO?
Please tell me which of the following ways you got more money to continue gambling. Did you use a line of credit from the casino? PCT PCT N VALUE LABEL VALID ALL 3.5 0.1 3 1 YES 96.5 2.8 82 2 NO 97.1 2,862 -3 MISSING ----- ----- ----- 100.0 100.0 2,947 cases Data type: numeric Missing-data codes: lowest thru -1 Columns: 130-131
B44_6 BORROW MONEY FROM A FAMILY MEMBER OR FRI
Please tell me which of the following ways you got more money to continue gambling. Did you borrow money from a family member or friend? PCT PCT N VALUE LABEL VALID ALL 8.2 0.2 7 1 YES 91.8 2.6 78 2 NO 97.1 2,862 -3 MISSING ----- ----- ----- 100.0 100.0 2,947 cases Data type: numeric Missing-data codes: lowest thru -1 Columns: 132-133

Page 148 Gambling Impact and Behavior Study Codebook for the Public Use File
B44_7 ANY OTHER WAY (SPECIFY)?
Please tell me which of the following ways you got more money to continue gambling. Did you get money any other way? PCT PCT N VALUE LABEL VALID ALL 4.7 0.1 4 1 YES 95.3 2.7 81 2 NO 97.1 2,862 -3 MISSING ----- ----- ----- 100.0 100.0 2,947 cases Data type: numeric Missing-data codes: lowest thru -1 Columns: 134-135
B45_ CASINO ATM
Where was the ATM machine that you used? Was it PCT PCT N VALUE LABEL VALID ALL 84.7 1.7 50 1 IN THE PLACE WHERE YOU WERE GAMBLING 11.9 0.2 7 2 WITHIN WALKING DISTANCE OF WHERE YOU WERE 3.4 0.1 2 3 WOULD SOMEONE HAVE TO DRIVE TO GET THERE? 98.0 2,888 -3 MISSING ----- ----- ----- 100.0 100.0 2,947 cases Data type: numeric Missing-data codes: lowest thru -1 Columns: 136-137
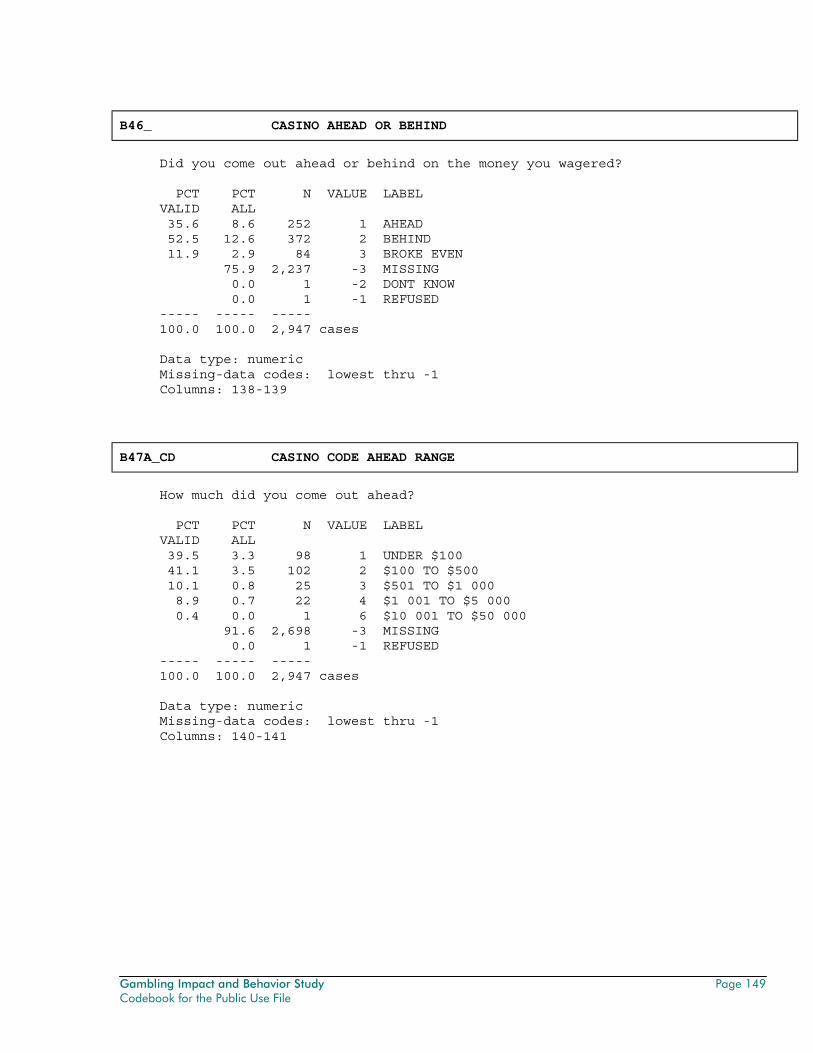
Gambling Impact and Behavior Study Page 149 Codebook for the Public Use File
B46_ CASINO AHEAD OR BEHIND
Did you come out ahead or behind on the money you wagered? PCT PCT N VALUE LABEL VALID ALL 35.6 8.6 252 1 AHEAD 52.5 12.6 372 2 BEHIND 11.9 2.9 84 3 BROKE EVEN 75.9 2,237 -3 MISSING 0.0 1 -2 DONT KNOW 0.0 1 -1 REFUSED ----- ----- ----- 100.0 100.0 2,947 cases Data type: numeric Missing-data codes: lowest thru -1 Columns: 138-139
B47A_CD CASINO CODE AHEAD RANGE
How much did you come out ahead? PCT PCT N VALUE LABEL VALID ALL 39.5 3.3 98 1 UNDER $100 41.1 3.5 102 2 $100 TO $500 10.1 0.8 25 3 $501 TO $1 000 8.9 0.7 22 4 $1 001 TO $5 000 0.4 0.0 1 6 $10 001 TO $50 000 91.6 2,698 -3 MISSING 0.0 1 -1 REFUSED ----- ----- ----- 100.0 100.0 2,947 cases Data type: numeric Missing-data codes: lowest thru -1 Columns: 140-141
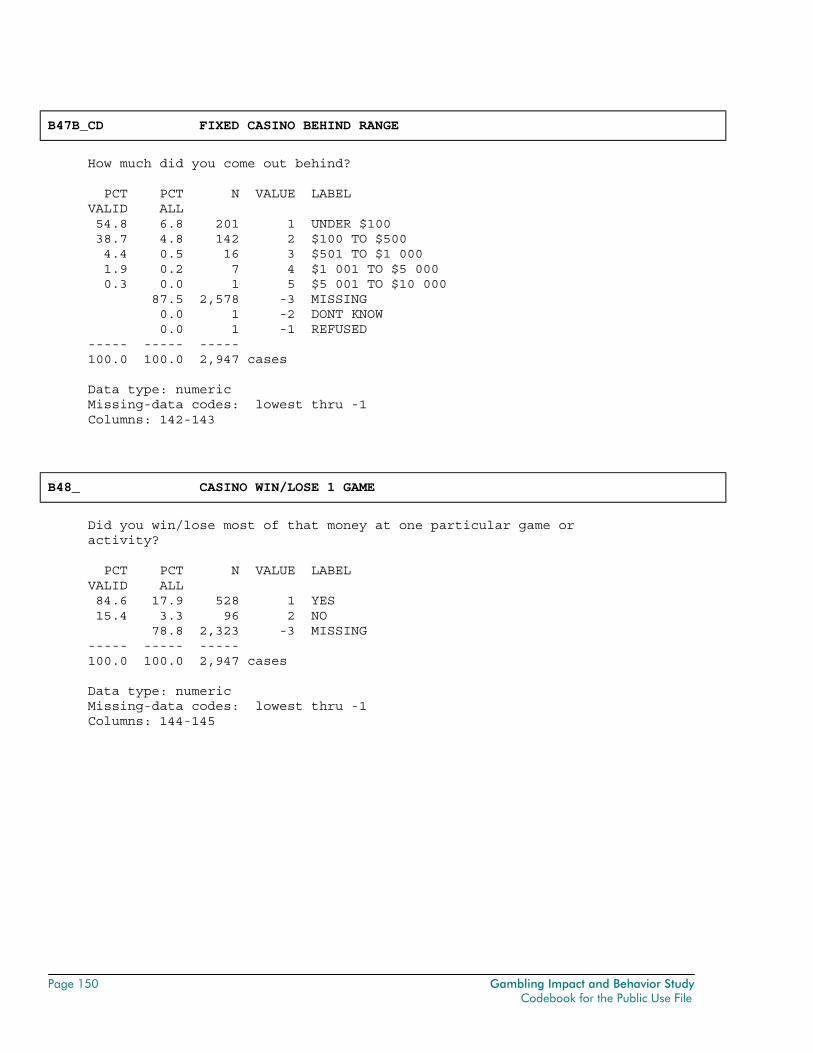
Page 150 Gambling Impact and Behavior Study Codebook for the Public Use File
B47B_CD FIXED CASINO BEHIND RANGE
How much did you come out behind? PCT PCT N VALUE LABEL VALID ALL 54.8 6.8 201 1 UNDER $100 38.7 4.8 142 2 $100 TO $500 4.4 0.5 16 3 $501 TO $1 000 1.9 0.2 7 4 $1 001 TO $5 000 0.3 0.0 1 5 $5 001 TO $10 000 87.5 2,578 -3 MISSING 0.0 1 -2 DONT KNOW 0.0 1 -1 REFUSED ----- ----- ----- 100.0 100.0 2,947 cases Data type: numeric Missing-data codes: lowest thru -1 Columns: 142-143
B48_ CASINO WIN/LOSE 1 GAME
Did you win/lose most of that money at one particular game or activity? PCT PCT N VALUE LABEL VALID ALL 84.6 17.9 528 1 YES 15.4 3.3 96 2 NO 78.8 2,323 -3 MISSING ----- ----- ----- 100.0 100.0 2,947 cases Data type: numeric Missing-data codes: lowest thru -1 Columns: 144-145
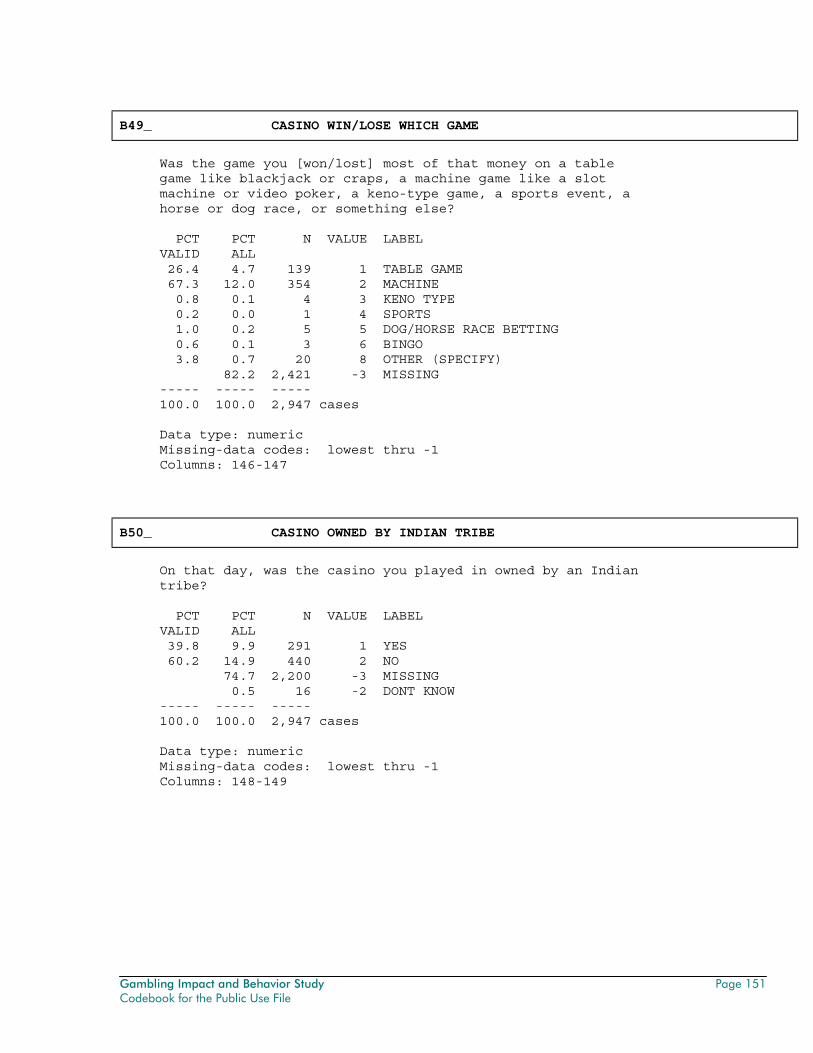
Gambling Impact and Behavior Study Page 151 Codebook for the Public Use File
B49_ CASINO WIN/LOSE WHICH GAME
Was the game you [won/lost] most of that money on a table game like blackjack or craps, a machine game like a slot machine or video poker, a keno-type game, a sports event, a horse or dog race, or something else? PCT PCT N VALUE LABEL VALID ALL 26.4 4.7 139 1 TABLE GAME 67.3 12.0 354 2 MACHINE 0.8 0.1 4 3 KENO TYPE 0.2 0.0 1 4 SPORTS 1.0 0.2 5 5 DOG/HORSE RACE BETTING 0.6 0.1 3 6 BINGO 3.8 0.7 20 8 OTHER (SPECIFY) 82.2 2,421 -3 MISSING ----- ----- ----- 100.0 100.0 2,947 cases Data type: numeric Missing-data codes: lowest thru -1 Columns: 146-147
B50_ CASINO OWNED BY INDIAN TRIBE
On that day, was the casino you played in owned by an Indian tribe? PCT PCT N VALUE LABEL VALID ALL 39.8 9.9 291 1 YES 60.2 14.9 440 2 NO 74.7 2,200 -3 MISSING 0.5 16 -2 DONT KNOW ----- ----- ----- 100.0 100.0 2,947 cases Data type: numeric Missing-data codes: lowest thru -1 Columns: 148-149
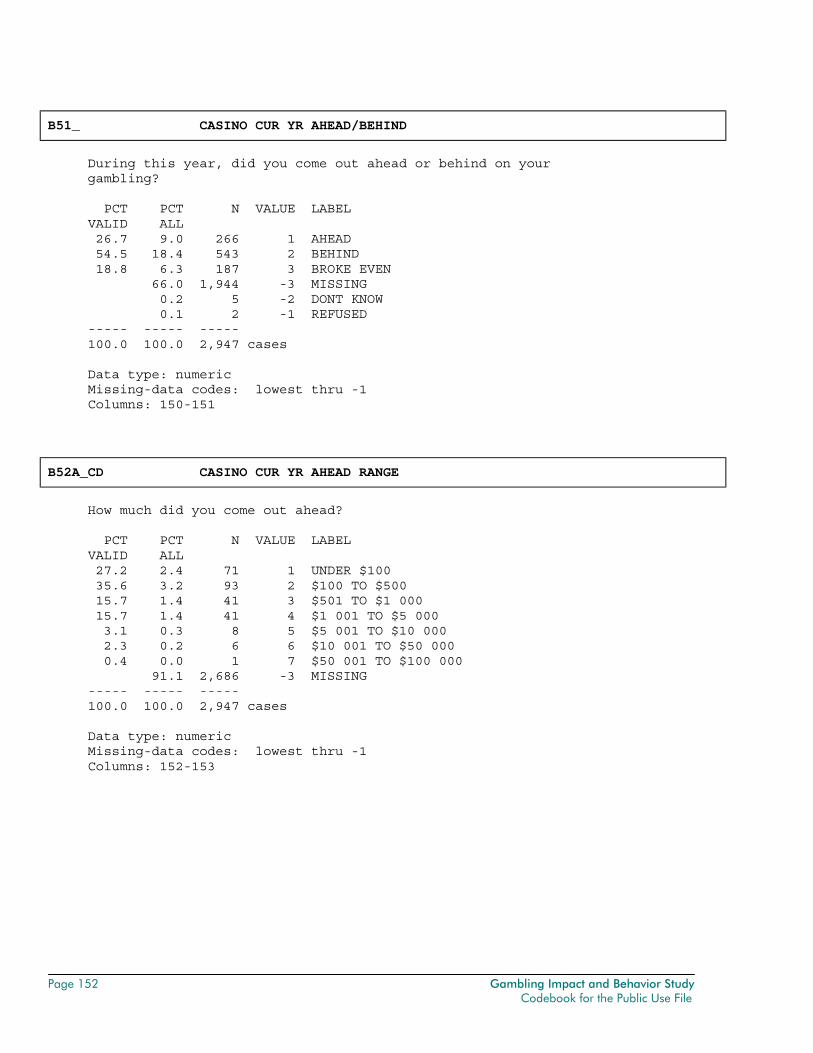
Page 152 Gambling Impact and Behavior Study Codebook for the Public Use File
B51_ CASINO CUR YR AHEAD/BEHIND
During this year, did you come out ahead or behind on your gambling? PCT PCT N VALUE LABEL VALID ALL 26.7 9.0 266 1 AHEAD 54.5 18.4 543 2 BEHIND 18.8 6.3 187 3 BROKE EVEN 66.0 1,944 -3 MISSING 0.2 5 -2 DONT KNOW 0.1 2 -1 REFUSED ----- ----- ----- 100.0 100.0 2,947 cases Data type: numeric Missing-data codes: lowest thru -1 Columns: 150-151
B52A_CD CASINO CUR YR AHEAD RANGE
How much did you come out ahead? PCT PCT N VALUE LABEL VALID ALL 27.2 2.4 71 1 UNDER $100 35.6 3.2 93 2 $100 TO $500 15.7 1.4 41 3 $501 TO $1 000 15.7 1.4 41 4 $1 001 TO $5 000 3.1 0.3 8 5 $5 001 TO $10 000 2.3 0.2 6 6 $10 001 TO $50 000 0.4 0.0 1 7 $50 001 TO $100 000 91.1 2,686 -3 MISSING ----- ----- ----- 100.0 100.0 2,947 cases Data type: numeric Missing-data codes: lowest thru -1 Columns: 152-153
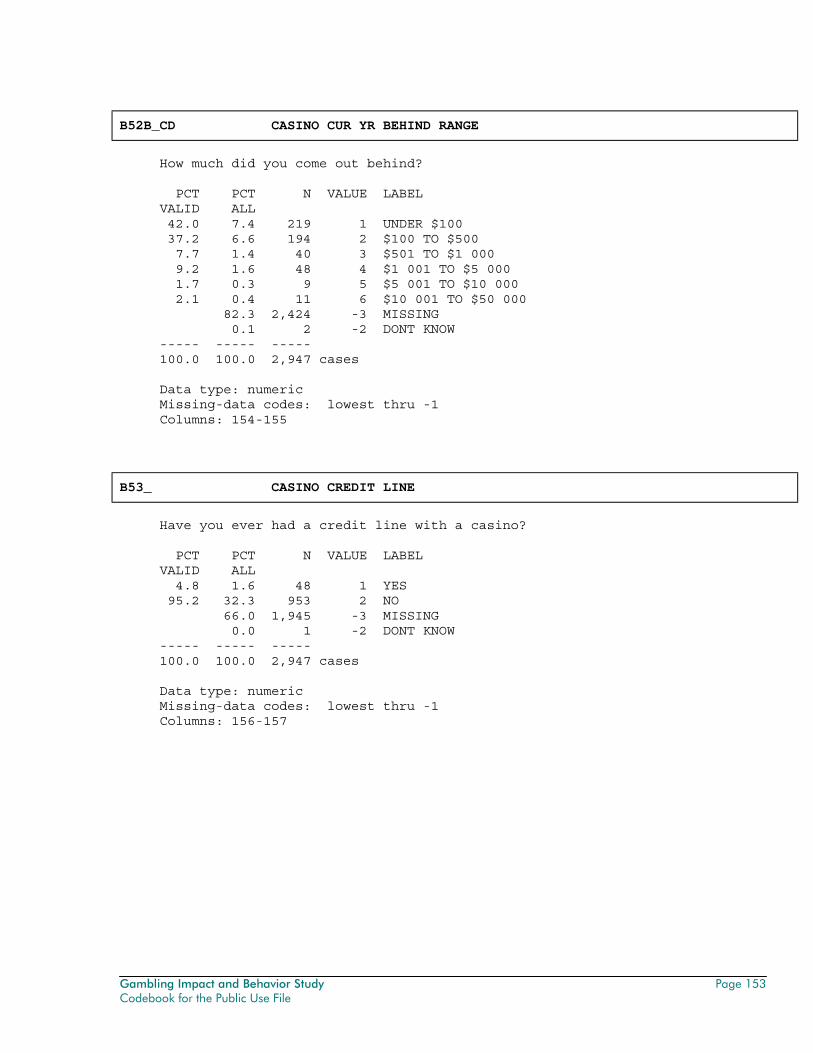
Gambling Impact and Behavior Study Page 153 Codebook for the Public Use File
B52B_CD CASINO CUR YR BEHIND RANGE
How much did you come out behind? PCT PCT N VALUE LABEL VALID ALL 42.0 7.4 219 1 UNDER $100 37.2 6.6 194 2 $100 TO $500 7.7 1.4 40 3 $501 TO $1 000 9.2 1.6 48 4 $1 001 TO $5 000 1.7 0.3 9 5 $5 001 TO $10 000 2.1 0.4 11 6 $10 001 TO $50 000 82.3 2,424 -3 MISSING 0.1 2 -2 DONT KNOW ----- ----- ----- 100.0 100.0 2,947 cases Data type: numeric Missing-data codes: lowest thru -1 Columns: 154-155
B53_ CASINO CREDIT LINE
Have you ever had a credit line with a casino? PCT PCT N VALUE LABEL VALID ALL 4.8 1.6 48 1 YES 95.2 32.3 953 2 NO 66.0 1,945 -3 MISSING 0.0 1 -2 DONT KNOW ----- ----- ----- 100.0 100.0 2,947 cases Data type: numeric Missing-data codes: lowest thru -1 Columns: 156-157
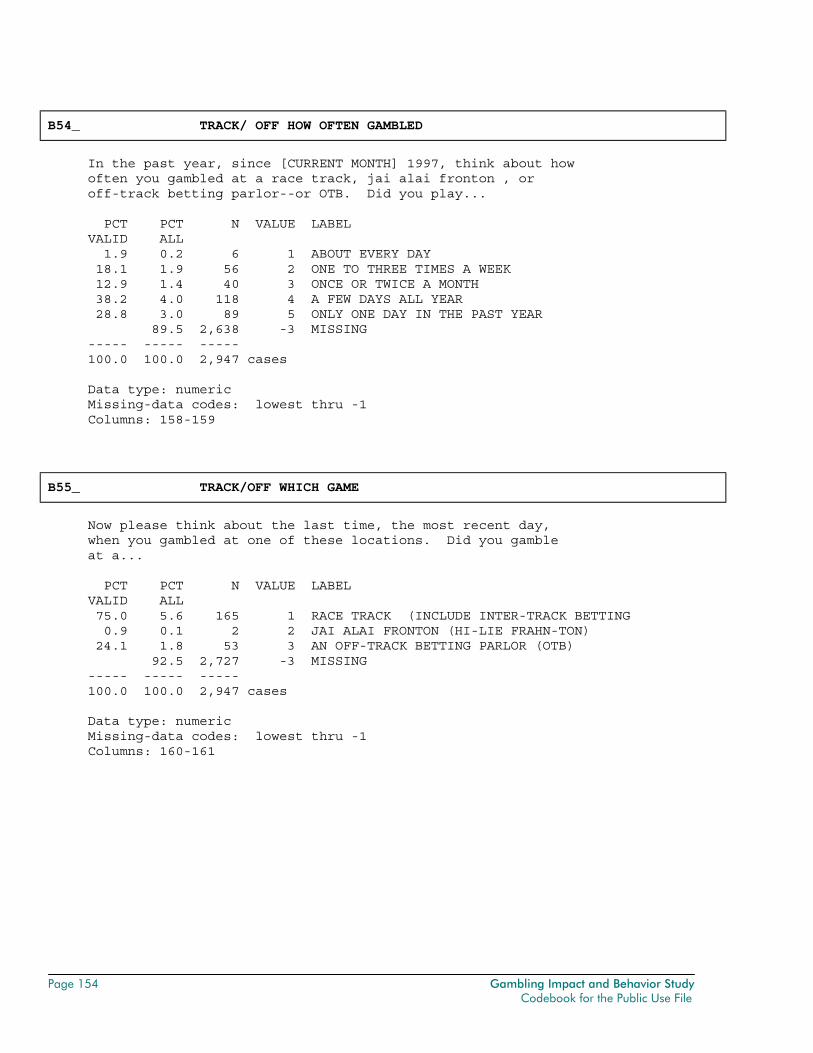
Page 154 Gambling Impact and Behavior Study Codebook for the Public Use File
B54_ TRACK/ OFF HOW OFTEN GAMBLED
In the past year, since [CURRENT MONTH] 1997, think about how often you gambled at a race track, jai alai fronton , or off-track betting parlor--or OTB. Did you play... PCT PCT N VALUE LABEL VALID ALL 1.9 0.2 6 1 ABOUT EVERY DAY 18.1 1.9 56 2 ONE TO THREE TIMES A WEEK 12.9 1.4 40 3 ONCE OR TWICE A MONTH 38.2 4.0 118 4 A FEW DAYS ALL YEAR 28.8 3.0 89 5 ONLY ONE DAY IN THE PAST YEAR 89.5 2,638 -3 MISSING ----- ----- ----- 100.0 100.0 2,947 cases Data type: numeric Missing-data codes: lowest thru -1 Columns: 158-159
B55_ TRACK/OFF WHICH GAME
Now please think about the last time, the most recent day, when you gambled at one of these locations. Did you gamble at a... PCT PCT N VALUE LABEL VALID ALL 75.0 5.6 165 1 RACE TRACK (INCLUDE INTER-TRACK BETTING 0.9 0.1 2 2 JAI ALAI FRONTON (HI-LIE FRAHN-TON) 24.1 1.8 53 3 AN OFF-TRACK BETTING PARLOR (OTB) 92.5 2,727 -3 MISSING ----- ----- ----- 100.0 100.0 2,947 cases Data type: numeric Missing-data codes: lowest thru -1 Columns: 160-161
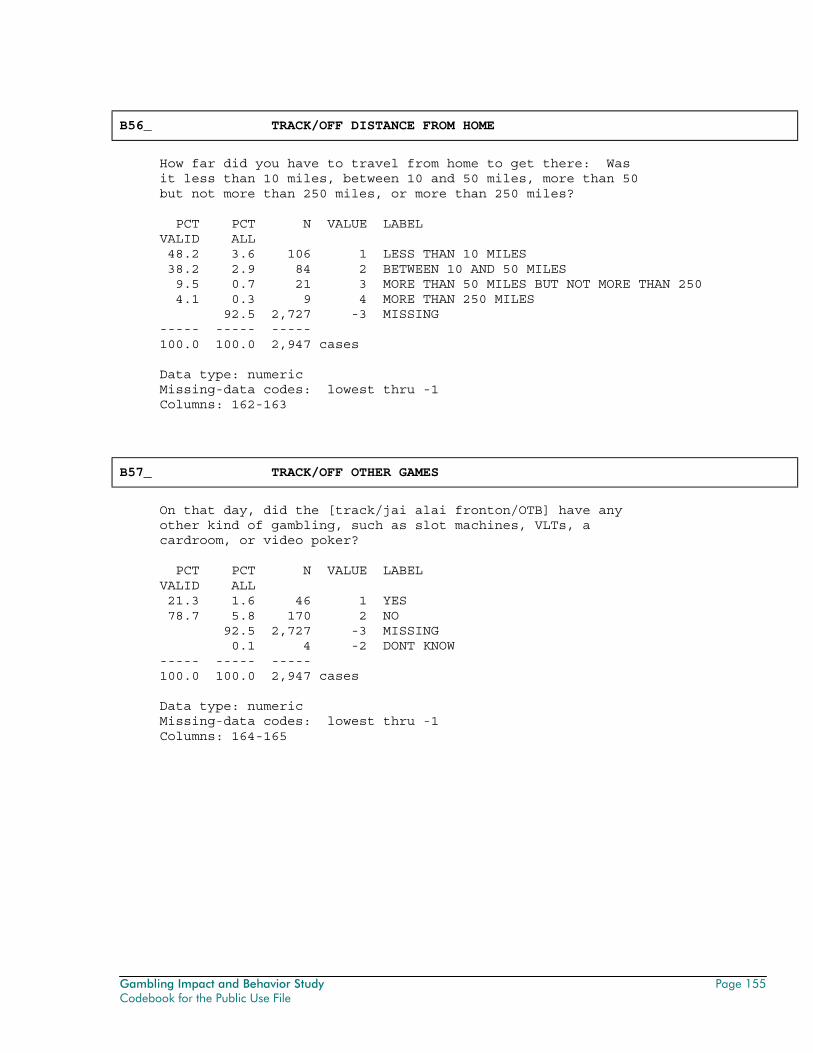
Gambling Impact and Behavior Study Page 155 Codebook for the Public Use File
B56_ TRACK/OFF DISTANCE FROM HOME
How far did you have to travel from home to get there: Was it less than 10 miles, between 10 and 50 miles, more than 50 but not more than 250 miles, or more than 250 miles? PCT PCT N VALUE LABEL VALID ALL 48.2 3.6 106 1 LESS THAN 10 MILES 38.2 2.9 84 2 BETWEEN 10 AND 50 MILES 9.5 0.7 21 3 MORE THAN 50 MILES BUT NOT MORE THAN 250 4.1 0.3 9 4 MORE THAN 250 MILES 92.5 2,727 -3 MISSING ----- ----- ----- 100.0 100.0 2,947 cases Data type: numeric Missing-data codes: lowest thru -1 Columns: 162-163
B57_ TRACK/OFF OTHER GAMES
On that day, did the [track/jai alai fronton/OTB] have any other kind of gambling, such as slot machines, VLTs, a cardroom, or video poker? PCT PCT N VALUE LABEL VALID ALL 21.3 1.6 46 1 YES 78.7 5.8 170 2 NO 92.5 2,727 -3 MISSING 0.1 4 -2 DONT KNOW ----- ----- ----- 100.0 100.0 2,947 cases Data type: numeric Missing-data codes: lowest thru -1 Columns: 164-165
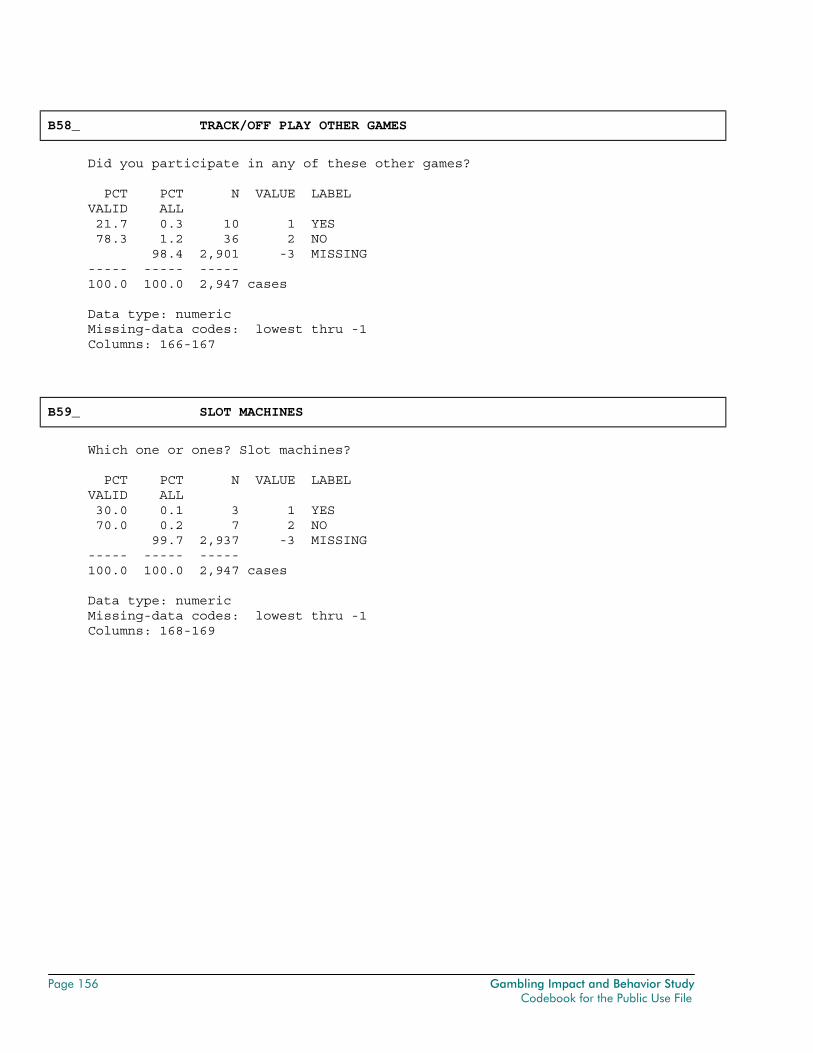
Page 156 Gambling Impact and Behavior Study Codebook for the Public Use File
B58_ TRACK/OFF PLAY OTHER GAMES
Did you participate in any of these other games? PCT PCT N VALUE LABEL VALID ALL 21.7 0.3 10 1 YES 78.3 1.2 36 2 NO 98.4 2,901 -3 MISSING ----- ----- ----- 100.0 100.0 2,947 cases Data type: numeric Missing-data codes: lowest thru -1 Columns: 166-167
B59_ SLOT MACHINES
Which one or ones? Slot machines? PCT PCT N VALUE LABEL VALID ALL 30.0 0.1 3 1 YES 70.0 0.2 7 2 NO 99.7 2,937 -3 MISSING ----- ----- ----- 100.0 100.0 2,947 cases Data type: numeric Missing-data codes: lowest thru -1 Columns: 168-169
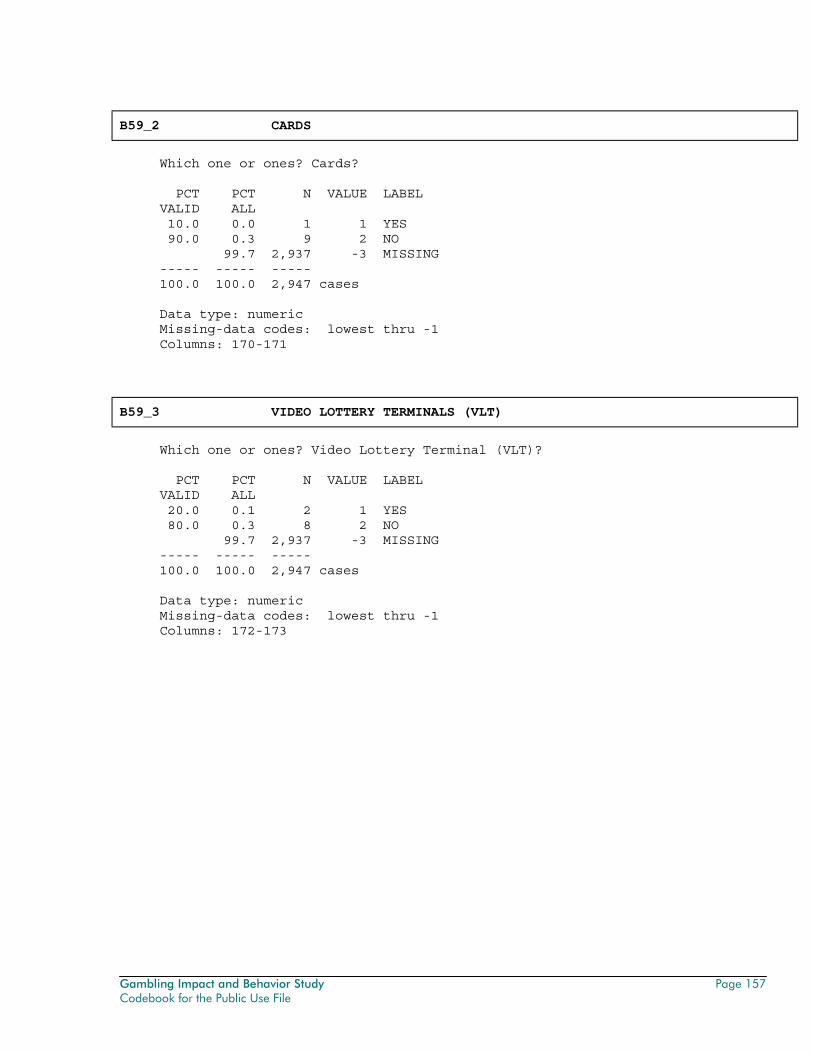
Gambling Impact and Behavior Study Page 157 Codebook for the Public Use File
B59_2 CARDS
Which one or ones? Cards? PCT PCT N VALUE LABEL VALID ALL 10.0 0.0 1 1 YES 90.0 0.3 9 2 NO 99.7 2,937 -3 MISSING ----- ----- ----- 100.0 100.0 2,947 cases Data type: numeric Missing-data codes: lowest thru -1 Columns: 170-171
B59_3 VIDEO LOTTERY TERMINALS (VLT)
Which one or ones? Video Lottery Terminal (VLT)? PCT PCT N VALUE LABEL VALID ALL 20.0 0.1 2 1 YES 80.0 0.3 8 2 NO 99.7 2,937 -3 MISSING ----- ----- ----- 100.0 100.0 2,947 cases Data type: numeric Missing-data codes: lowest thru -1 Columns: 172-173
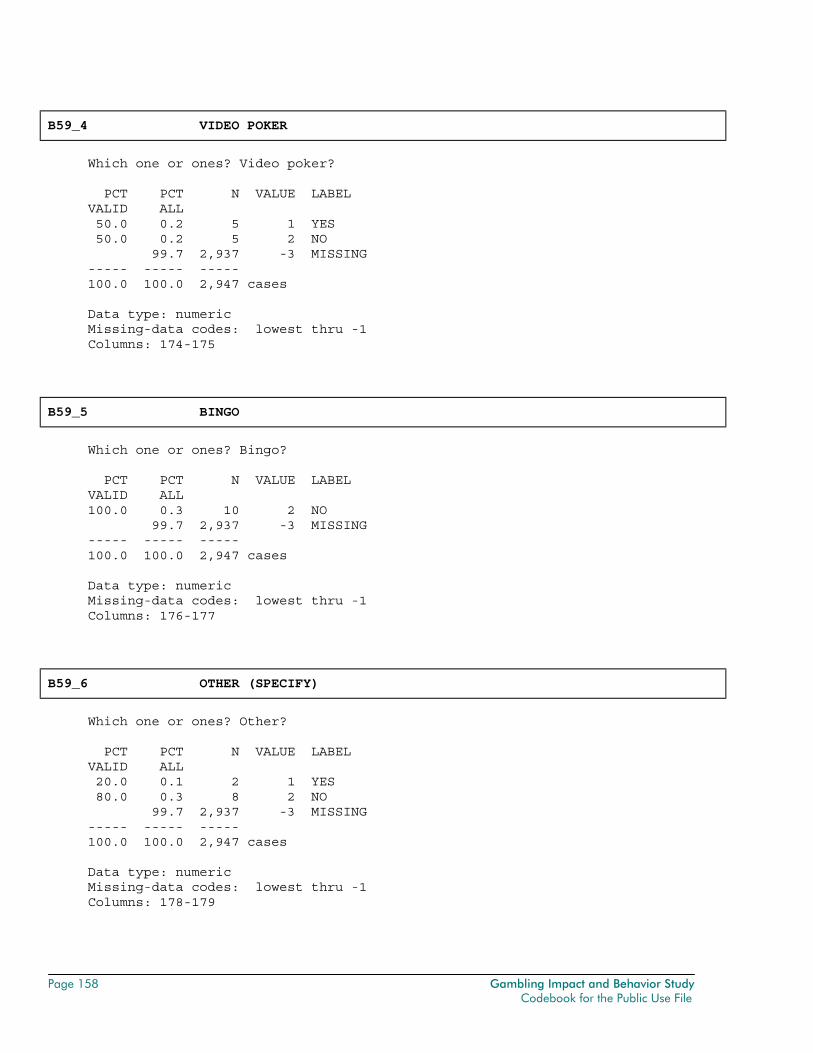
Page 158 Gambling Impact and Behavior Study Codebook for the Public Use File
B59_4 VIDEO POKER
Which one or ones? Video poker? PCT PCT N VALUE LABEL VALID ALL 50.0 0.2 5 1 YES 50.0 0.2 5 2 NO 99.7 2,937 -3 MISSING ----- ----- ----- 100.0 100.0 2,947 cases Data type: numeric Missing-data codes: lowest thru -1 Columns: 174-175
B59_5 BINGO
Which one or ones? Bingo? PCT PCT N VALUE LABEL VALID ALL 100.0 0.3 10 2 NO 99.7 2,937 -3 MISSING ----- ----- ----- 100.0 100.0 2,947 cases Data type: numeric Missing-data codes: lowest thru -1 Columns: 176-177
B59_6 OTHER (SPECIFY)
Which one or ones? Other? PCT PCT N VALUE LABEL VALID ALL 20.0 0.1 2 1 YES 80.0 0.3 8 2 NO 99.7 2,937 -3 MISSING ----- ----- ----- 100.0 100.0 2,947 cases Data type: numeric Missing-data codes: lowest thru -1 Columns: 178-179
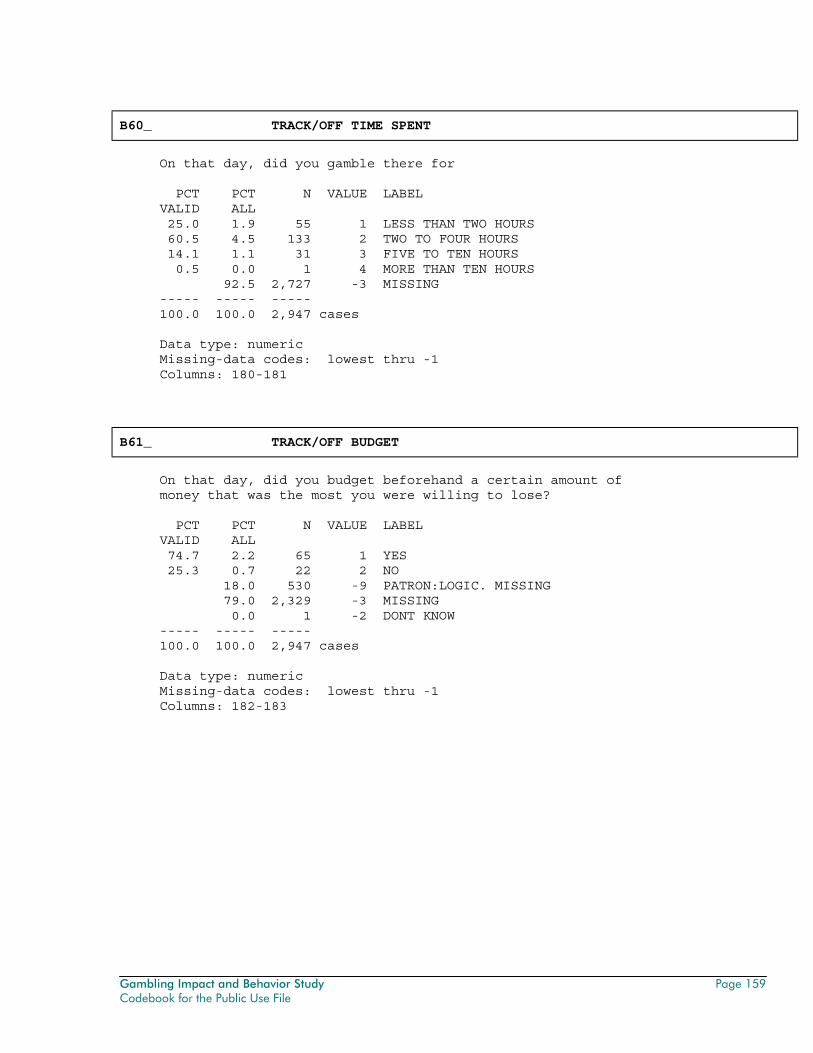
Gambling Impact and Behavior Study Page 159 Codebook for the Public Use File
B60_ TRACK/OFF TIME SPENT
On that day, did you gamble there for PCT PCT N VALUE LABEL VALID ALL 25.0 1.9 55 1 LESS THAN TWO HOURS 60.5 4.5 133 2 TWO TO FOUR HOURS 14.1 1.1 31 3 FIVE TO TEN HOURS 0.5 0.0 1 4 MORE THAN TEN HOURS 92.5 2,727 -3 MISSING ----- ----- ----- 100.0 100.0 2,947 cases Data type: numeric Missing-data codes: lowest thru -1 Columns: 180-181
B61_ TRACK/OFF BUDGET
On that day, did you budget beforehand a certain amount of money that was the most you were willing to lose? PCT PCT N VALUE LABEL VALID ALL 74.7 2.2 65 1 YES 25.3 0.7 22 2 NO 18.0 530 -9 PATRON:LOGIC. MISSING 79.0 2,329 -3 MISSING 0.0 1 -2 DONT KNOW ----- ----- ----- 100.0 100.0 2,947 cases Data type: numeric Missing-data codes: lowest thru -1 Columns: 182-183
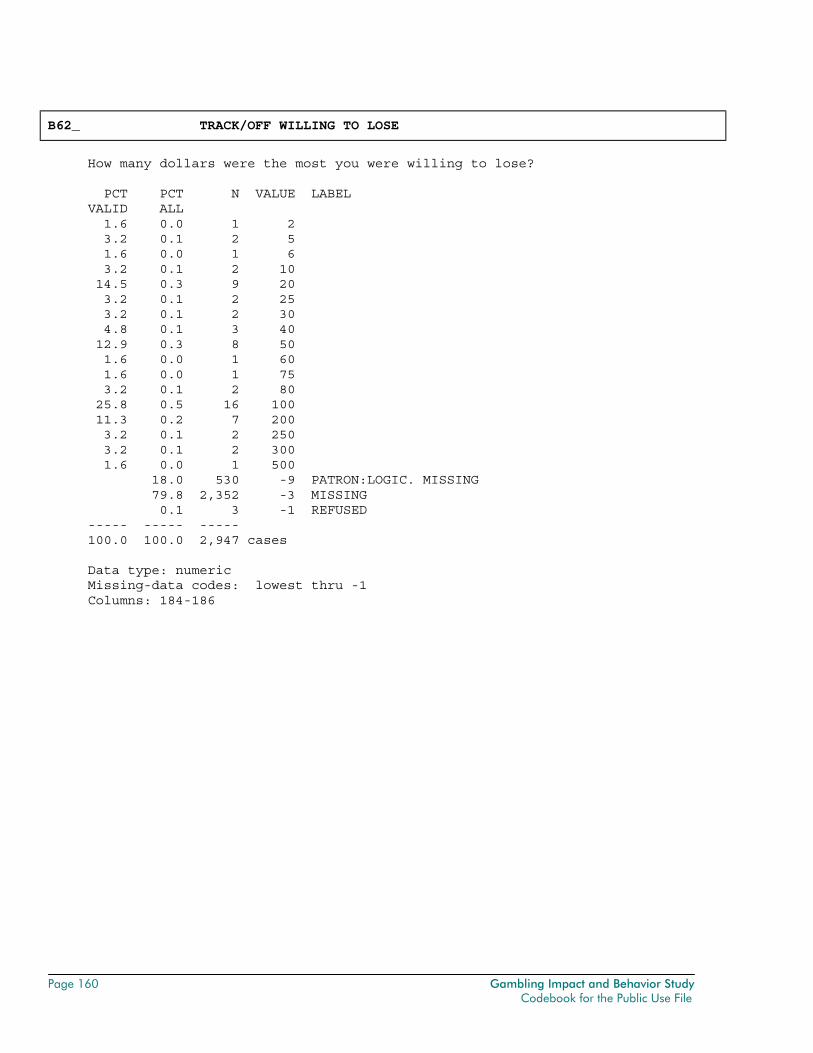
Page 160 Gambling Impact and Behavior Study Codebook for the Public Use File
B62_ TRACK/OFF WILLING TO LOSE
How many dollars were the most you were willing to lose? PCT PCT N VALUE LABEL VALID ALL 1.6 0.0 1 2 3.2 0.1 2 5 1.6 0.0 1 6 3.2 0.1 2 10 14.5 0.3 9 20 3.2 0.1 2 25 3.2 0.1 2 30 4.8 0.1 3 40 12.9 0.3 8 50 1.6 0.0 1 60 1.6 0.0 1 75 3.2 0.1 2 80 25.8 0.5 16 100 11.3 0.2 7 200 3.2 0.1 2 250 3.2 0.1 2 300 1.6 0.0 1 500 18.0 530 -9 PATRON:LOGIC. MISSING 79.8 2,352 -3 MISSING 0.1 3 -1 REFUSED ----- ----- ----- 100.0 100.0 2,947 cases Data type: numeric Missing-data codes: lowest thru -1 Columns: 184-186
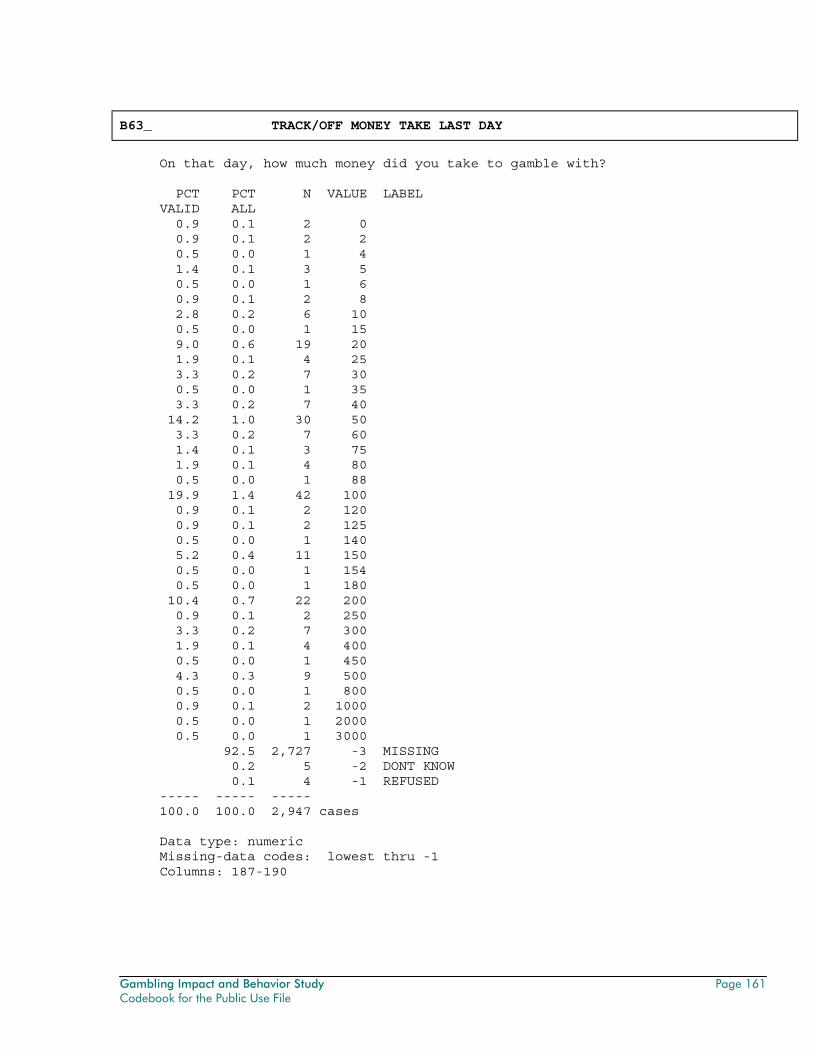
Gambling Impact and Behavior Study Page 161 Codebook for the Public Use File
B63_ TRACK/OFF MONEY TAKE LAST DAY
On that day, how much money did you take to gamble with? PCT PCT N VALUE LABEL VALID ALL 0.9 0.1 2 0 0.9 0.1 2 2 0.5 0.0 1 4 1.4 0.1 3 5 0.5 0.0 1 6 0.9 0.1 2 8 2.8 0.2 6 10 0.5 0.0 1 15 9.0 0.6 19 20 1.9 0.1 4 25 3.3 0.2 7 30 0.5 0.0 1 35 3.3 0.2 7 40 14.2 1.0 30 50 3.3 0.2 7 60 1.4 0.1 3 75 1.9 0.1 4 80 0.5 0.0 1 88 19.9 1.4 42 100 0.9 0.1 2 120 0.9 0.1 2 125 0.5 0.0 1 140 5.2 0.4 11 150 0.5 0.0 1 154 0.5 0.0 1 180 10.4 0.7 22 200 0.9 0.1 2 250 3.3 0.2 7 300 1.9 0.1 4 400 0.5 0.0 1 450 4.3 0.3 9 500 0.5 0.0 1 800 0.9 0.1 2 1000 0.5 0.0 1 2000 0.5 0.0 1 3000 92.5 2,727 -3 MISSING 0.2 5 -2 DONT KNOW 0.1 4 -1 REFUSED ----- ----- ----- 100.0 100.0 2,947 cases Data type: numeric Missing-data codes: lowest thru -1 Columns: 187-190
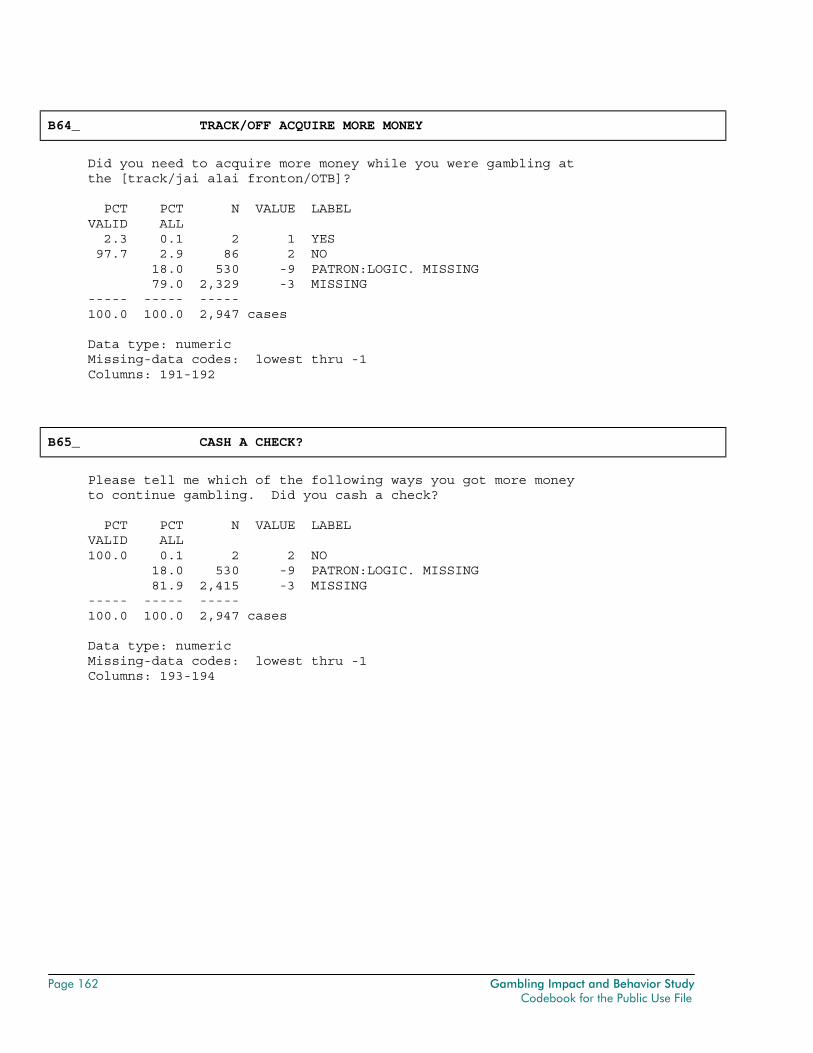
Page 162 Gambling Impact and Behavior Study Codebook for the Public Use File
B64_ TRACK/OFF ACQUIRE MORE MONEY
Did you need to acquire more money while you were gambling at the [track/jai alai fronton/OTB]? PCT PCT N VALUE LABEL VALID ALL 2.3 0.1 2 1 YES 97.7 2.9 86 2 NO 18.0 530 -9 PATRON:LOGIC. MISSING 79.0 2,329 -3 MISSING ----- ----- ----- 100.0 100.0 2,947 cases Data type: numeric Missing-data codes: lowest thru -1 Columns: 191-192
B65_ CASH A CHECK?
Please tell me which of the following ways you got more money to continue gambling. Did you cash a check? PCT PCT N VALUE LABEL VALID ALL 100.0 0.1 2 2 NO 18.0 530 -9 PATRON:LOGIC. MISSING 81.9 2,415 -3 MISSING ----- ----- ----- 100.0 100.0 2,947 cases Data type: numeric Missing-data codes: lowest thru -1 Columns: 193-194
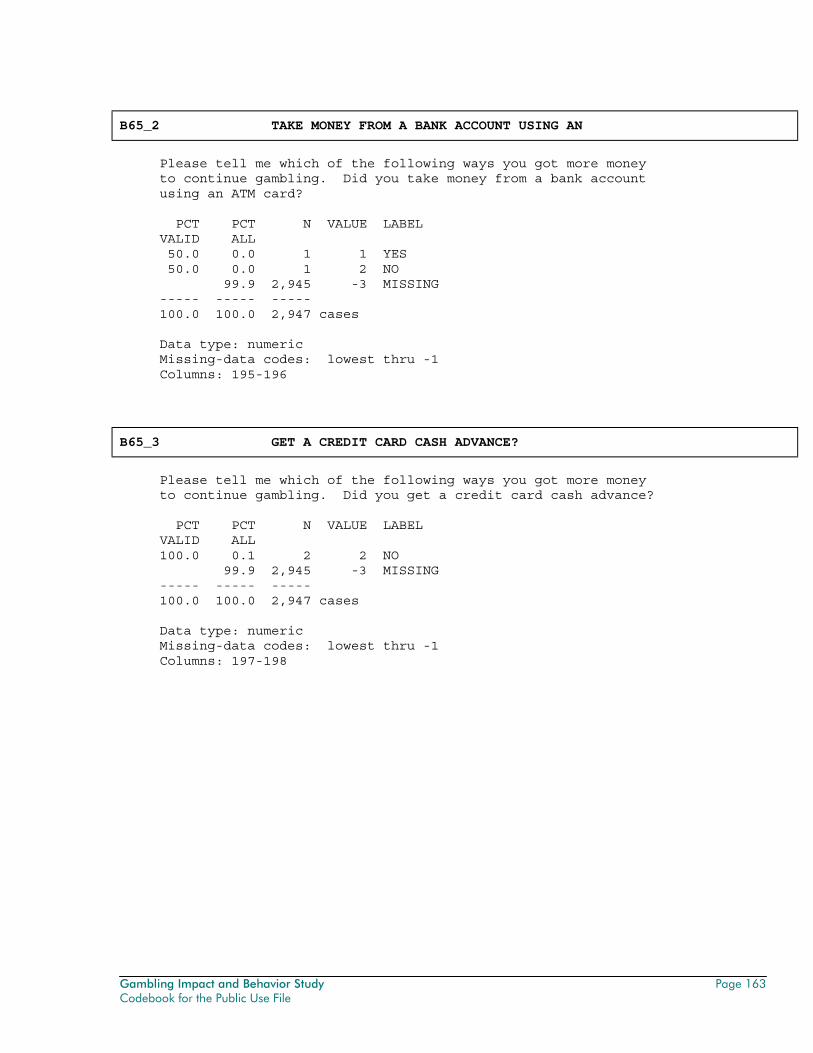
Gambling Impact and Behavior Study Page 163 Codebook for the Public Use File
B65_2 TAKE MONEY FROM A BANK ACCOUNT USING AN
Please tell me which of the following ways you got more money to continue gambling. Did you take money from a bank account using an ATM card? PCT PCT N VALUE LABEL VALID ALL 50.0 0.0 1 1 YES 50.0 0.0 1 2 NO 99.9 2,945 -3 MISSING ----- ----- ----- 100.0 100.0 2,947 cases Data type: numeric Missing-data codes: lowest thru -1 Columns: 195-196
B65_3 GET A CREDIT CARD CASH ADVANCE?
Please tell me which of the following ways you got more money to continue gambling. Did you get a credit card cash advance? PCT PCT N VALUE LABEL VALID ALL 100.0 0.1 2 2 NO 99.9 2,945 -3 MISSING ----- ----- ----- 100.0 100.0 2,947 cases Data type: numeric Missing-data codes: lowest thru -1 Columns: 197-198
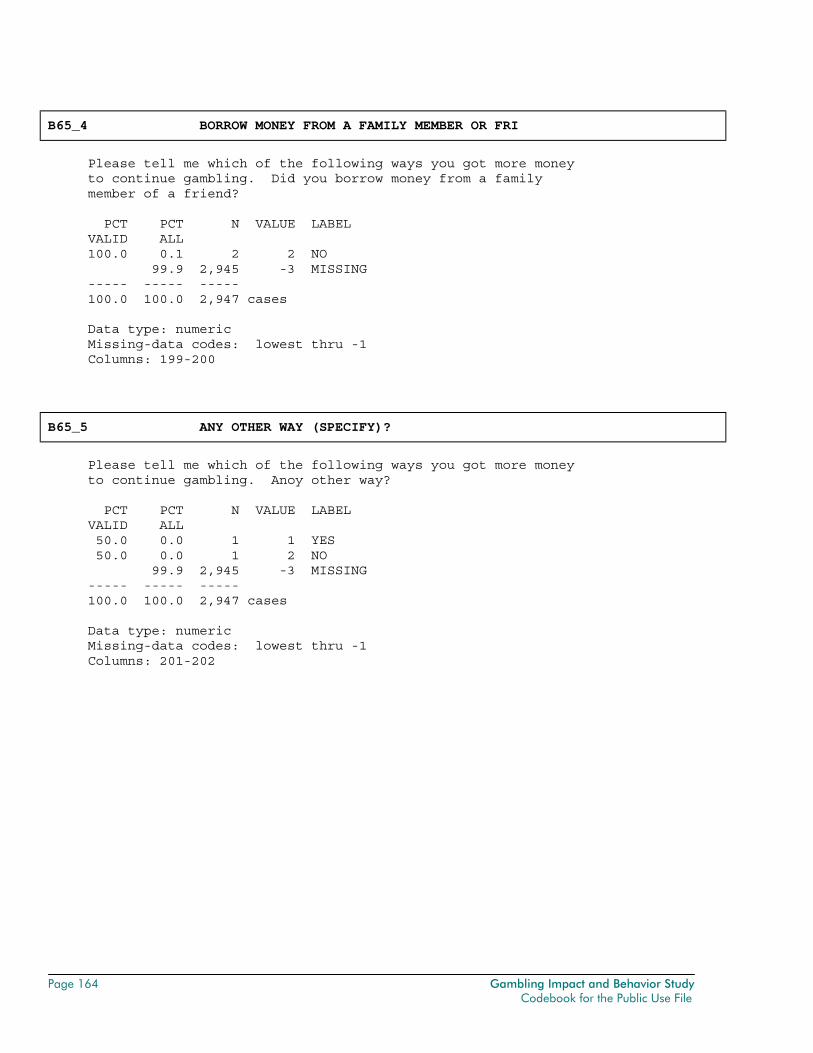
Page 164 Gambling Impact and Behavior Study Codebook for the Public Use File
B65_4 BORROW MONEY FROM A FAMILY MEMBER OR FRI
Please tell me which of the following ways you got more money to continue gambling. Did you borrow money from a family member of a friend? PCT PCT N VALUE LABEL VALID ALL 100.0 0.1 2 2 NO 99.9 2,945 -3 MISSING ----- ----- ----- 100.0 100.0 2,947 cases Data type: numeric Missing-data codes: lowest thru -1 Columns: 199-200
B65_5 ANY OTHER WAY (SPECIFY)?
Please tell me which of the following ways you got more money to continue gambling. Anoy other way? PCT PCT N VALUE LABEL VALID ALL 50.0 0.0 1 1 YES 50.0 0.0 1 2 NO 99.9 2,945 -3 MISSING ----- ----- ----- 100.0 100.0 2,947 cases Data type: numeric Missing-data codes: lowest thru -1 Columns: 201-202
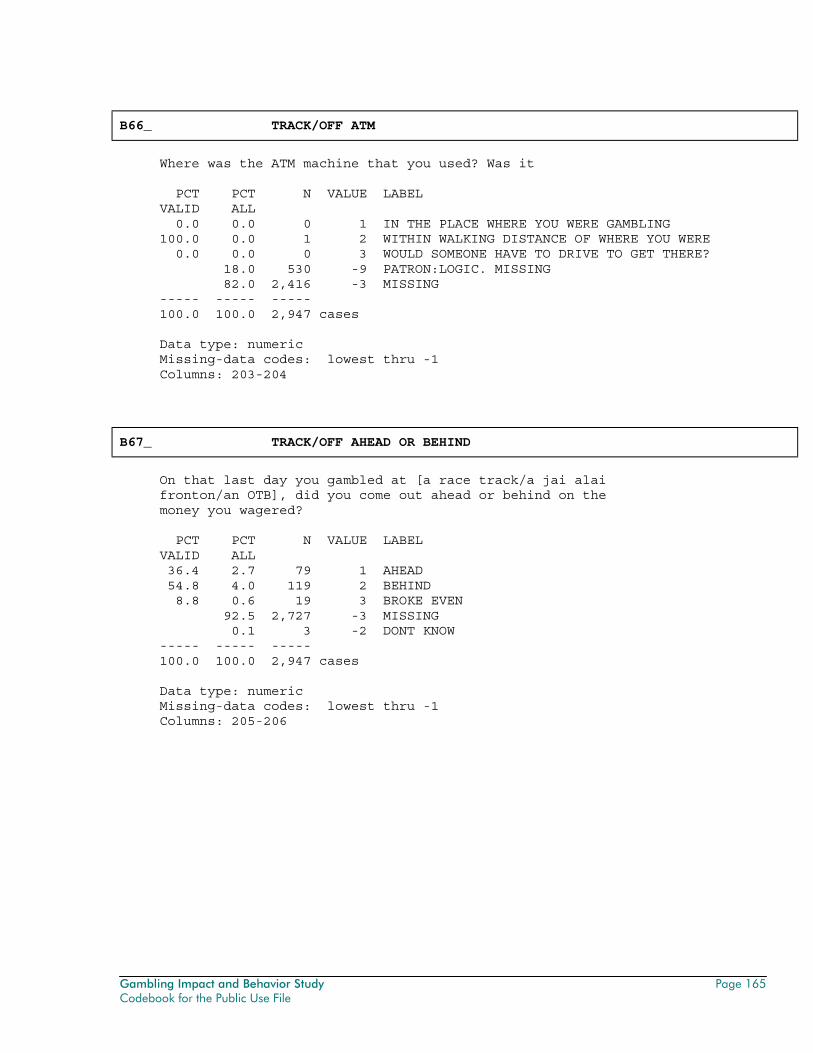
Gambling Impact and Behavior Study Page 165 Codebook for the Public Use File
B66_ TRACK/OFF ATM
Where was the ATM machine that you used? Was it PCT PCT N VALUE LABEL VALID ALL 0.0 0.0 0 1 IN THE PLACE WHERE YOU WERE GAMBLING 100.0 0.0 1 2 WITHIN WALKING DISTANCE OF WHERE YOU WERE 0.0 0.0 0 3 WOULD SOMEONE HAVE TO DRIVE TO GET THERE? 18.0 530 -9 PATRON:LOGIC. MISSING 82.0 2,416 -3 MISSING ----- ----- ----- 100.0 100.0 2,947 cases Data type: numeric Missing-data codes: lowest thru -1 Columns: 203-204
B67_ TRACK/OFF AHEAD OR BEHIND
On that last day you gambled at [a race track/a jai alai fronton/an OTB], did you come out ahead or behind on the money you wagered? PCT PCT N VALUE LABEL VALID ALL 36.4 2.7 79 1 AHEAD 54.8 4.0 119 2 BEHIND 8.8 0.6 19 3 BROKE EVEN 92.5 2,727 -3 MISSING 0.1 3 -2 DONT KNOW ----- ----- ----- 100.0 100.0 2,947 cases Data type: numeric Missing-data codes: lowest thru -1 Columns: 205-206
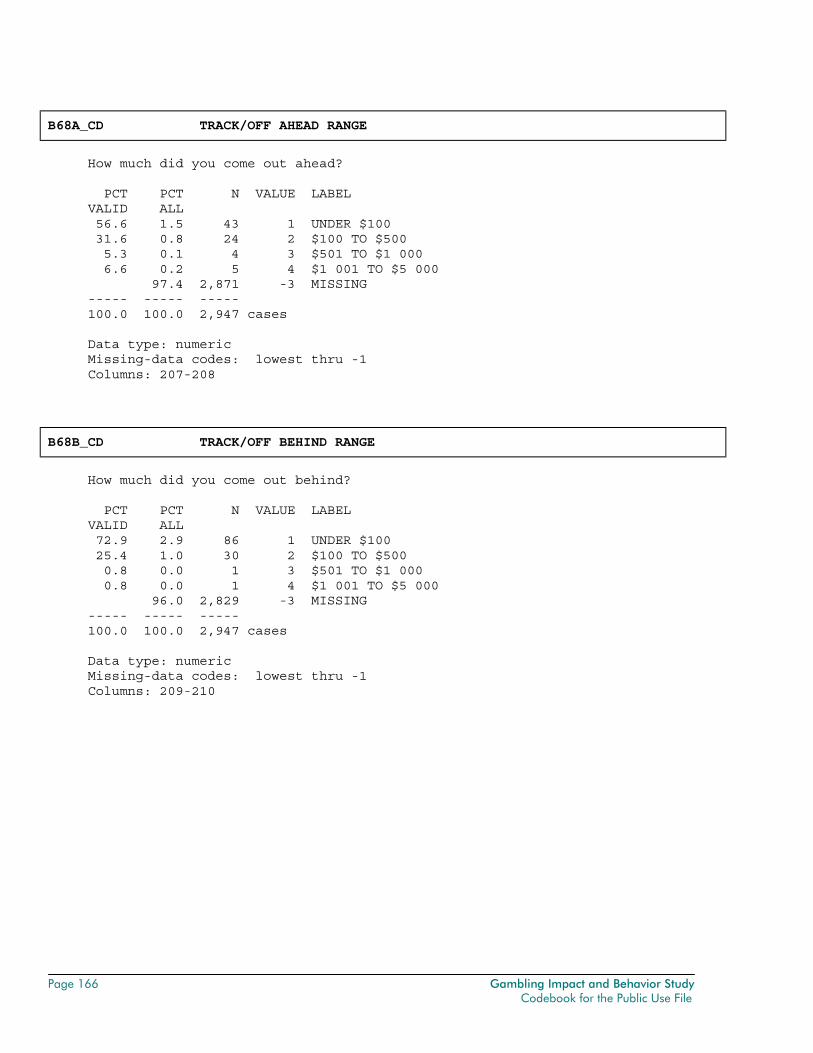
Page 166 Gambling Impact and Behavior Study Codebook for the Public Use File
B68A_CD TRACK/OFF AHEAD RANGE
How much did you come out ahead? PCT PCT N VALUE LABEL VALID ALL 56.6 1.5 43 1 UNDER $100 31.6 0.8 24 2 $100 TO $500 5.3 0.1 4 3 $501 TO $1 000 6.6 0.2 5 4 $1 001 TO $5 000 97.4 2,871 -3 MISSING ----- ----- ----- 100.0 100.0 2,947 cases Data type: numeric Missing-data codes: lowest thru -1 Columns: 207-208
B68B_CD TRACK/OFF BEHIND RANGE
How much did you come out behind? PCT PCT N VALUE LABEL VALID ALL 72.9 2.9 86 1 UNDER $100 25.4 1.0 30 2 $100 TO $500 0.8 0.0 1 3 $501 TO $1 000 0.8 0.0 1 4 $1 001 TO $5 000 96.0 2,829 -3 MISSING ----- ----- ----- 100.0 100.0 2,947 cases Data type: numeric Missing-data codes: lowest thru -1 Columns: 209-210
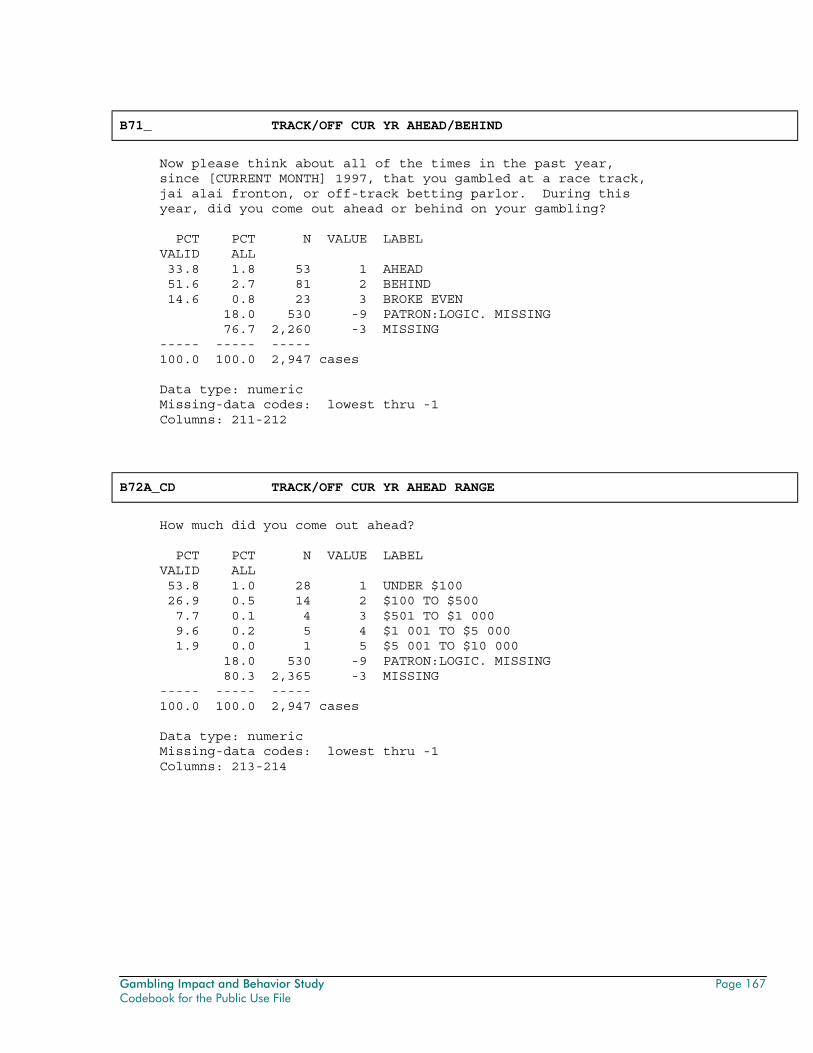
Gambling Impact and Behavior Study Page 167 Codebook for the Public Use File
B71_ TRACK/OFF CUR YR AHEAD/BEHIND
Now please think about all of the times in the past year, since [CURRENT MONTH] 1997, that you gambled at a race track, jai alai fronton, or off-track betting parlor. During this year, did you come out ahead or behind on your gambling? PCT PCT N VALUE LABEL VALID ALL 33.8 1.8 53 1 AHEAD 51.6 2.7 81 2 BEHIND 14.6 0.8 23 3 BROKE EVEN 18.0 530 -9 PATRON:LOGIC. MISSING 76.7 2,260 -3 MISSING ----- ----- ----- 100.0 100.0 2,947 cases Data type: numeric Missing-data codes: lowest thru -1 Columns: 211-212
B72A_CD TRACK/OFF CUR YR AHEAD RANGE
How much did you come out ahead? PCT PCT N VALUE LABEL VALID ALL 53.8 1.0 28 1 UNDER $100 26.9 0.5 14 2 $100 TO $500 7.7 0.1 4 3 $501 TO $1 000 9.6 0.2 5 4 $1 001 TO $5 000 1.9 0.0 1 5 $5 001 TO $10 000 18.0 530 -9 PATRON:LOGIC. MISSING 80.3 2,365 -3 MISSING ----- ----- ----- 100.0 100.0 2,947 cases Data type: numeric Missing-data codes: lowest thru -1 Columns: 213-214
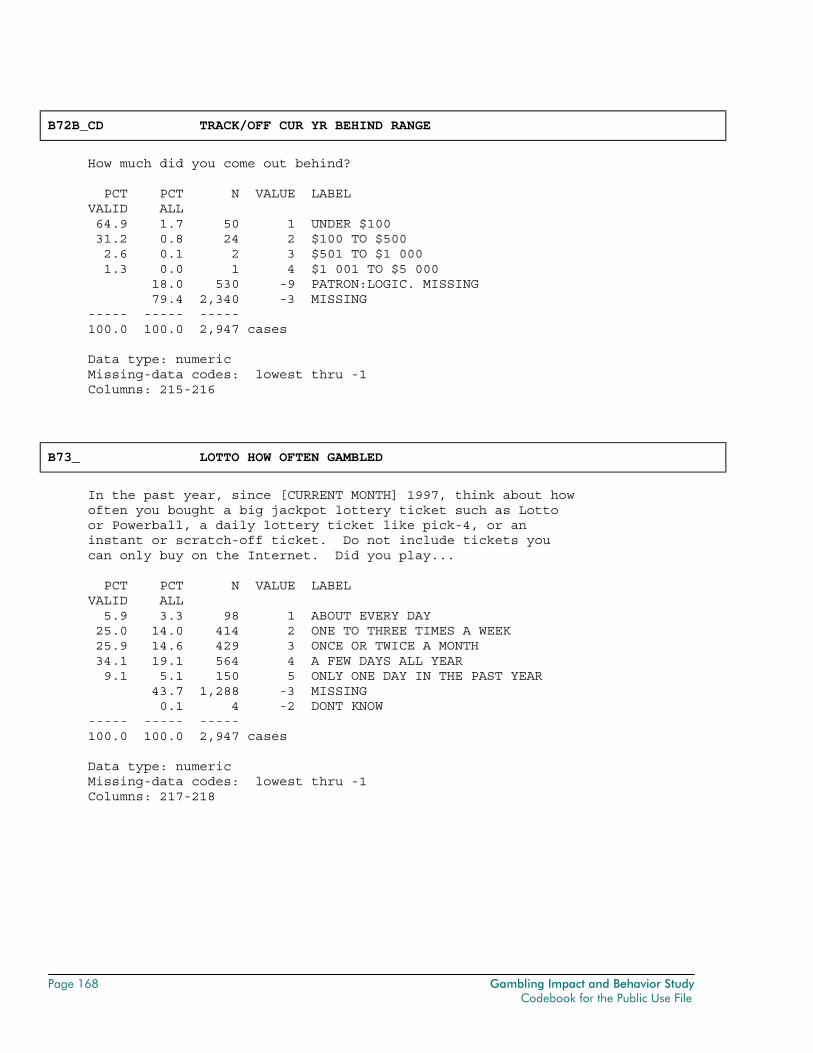
Page 168 Gambling Impact and Behavior Study Codebook for the Public Use File
B72B_CD TRACK/OFF CUR YR BEHIND RANGE
How much did you come out behind? PCT PCT N VALUE LABEL VALID ALL 64.9 1.7 50 1 UNDER $100 31.2 0.8 24 2 $100 TO $500 2.6 0.1 2 3 $501 TO $1 000 1.3 0.0 1 4 $1 001 TO $5 000 18.0 530 -9 PATRON:LOGIC. MISSING 79.4 2,340 -3 MISSING ----- ----- ----- 100.0 100.0 2,947 cases Data type: numeric Missing-data codes: lowest thru -1 Columns: 215-216
B73_ LOTTO HOW OFTEN GAMBLED
In the past year, since [CURRENT MONTH] 1997, think about how often you bought a big jackpot lottery ticket such as Lotto or Powerball, a daily lottery ticket like pick-4, or an instant or scratch-off ticket. Do not include tickets you can only buy on the Internet. Did you play... PCT PCT N VALUE LABEL VALID ALL 5.9 3.3 98 1 ABOUT EVERY DAY 25.0 14.0 414 2 ONE TO THREE TIMES A WEEK 25.9 14.6 429 3 ONCE OR TWICE A MONTH 34.1 19.1 564 4 A FEW DAYS ALL YEAR 9.1 5.1 150 5 ONLY ONE DAY IN THE PAST YEAR 43.7 1,288 -3 MISSING 0.1 4 -2 DONT KNOW ----- ----- ----- 100.0 100.0 2,947 cases Data type: numeric Missing-data codes: lowest thru -1 Columns: 217-218
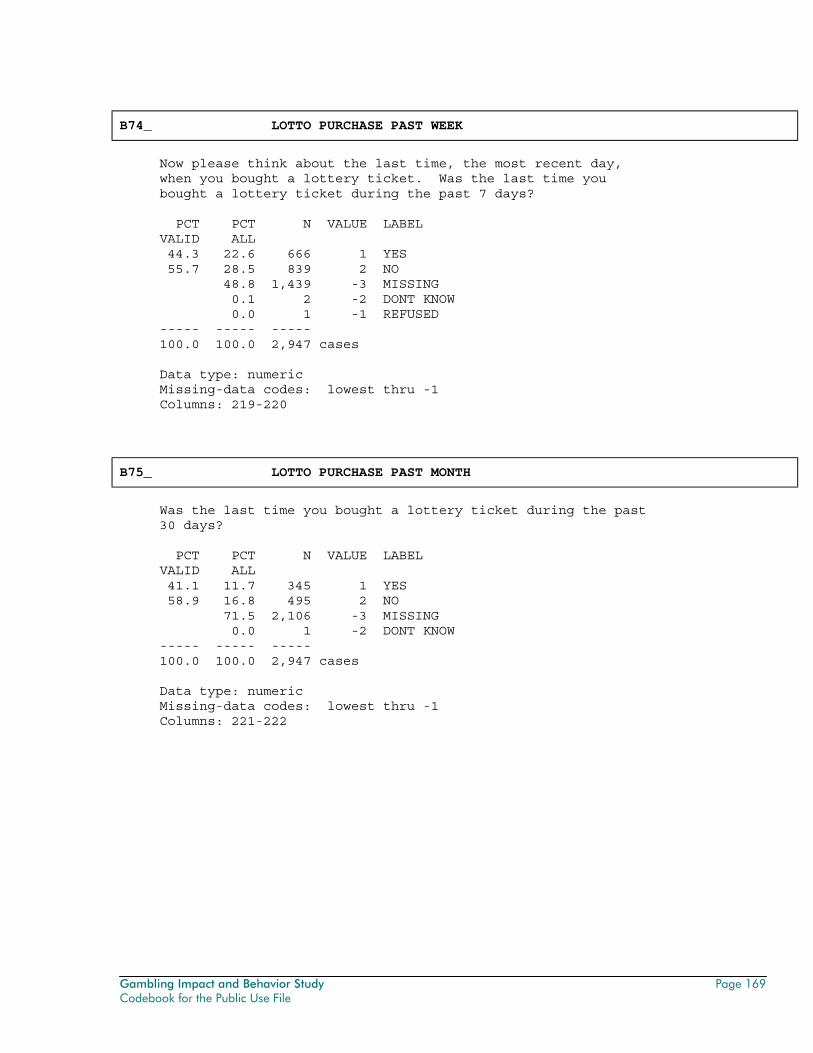
Gambling Impact and Behavior Study Page 169 Codebook for the Public Use File
B74_ LOTTO PURCHASE PAST WEEK
Now please think about the last time, the most recent day, when you bought a lottery ticket. Was the last time you bought a lottery ticket during the past 7 days? PCT PCT N VALUE LABEL VALID ALL 44.3 22.6 666 1 YES 55.7 28.5 839 2 NO 48.8 1,439 -3 MISSING 0.1 2 -2 DONT KNOW 0.0 1 -1 REFUSED ----- ----- ----- 100.0 100.0 2,947 cases Data type: numeric Missing-data codes: lowest thru -1 Columns: 219-220
B75_ LOTTO PURCHASE PAST MONTH
Was the last time you bought a lottery ticket during the past 30 days? PCT PCT N VALUE LABEL VALID ALL 41.1 11.7 345 1 YES 58.9 16.8 495 2 NO 71.5 2,106 -3 MISSING 0.0 1 -2 DONT KNOW ----- ----- ----- 100.0 100.0 2,947 cases Data type: numeric Missing-data codes: lowest thru -1 Columns: 221-222
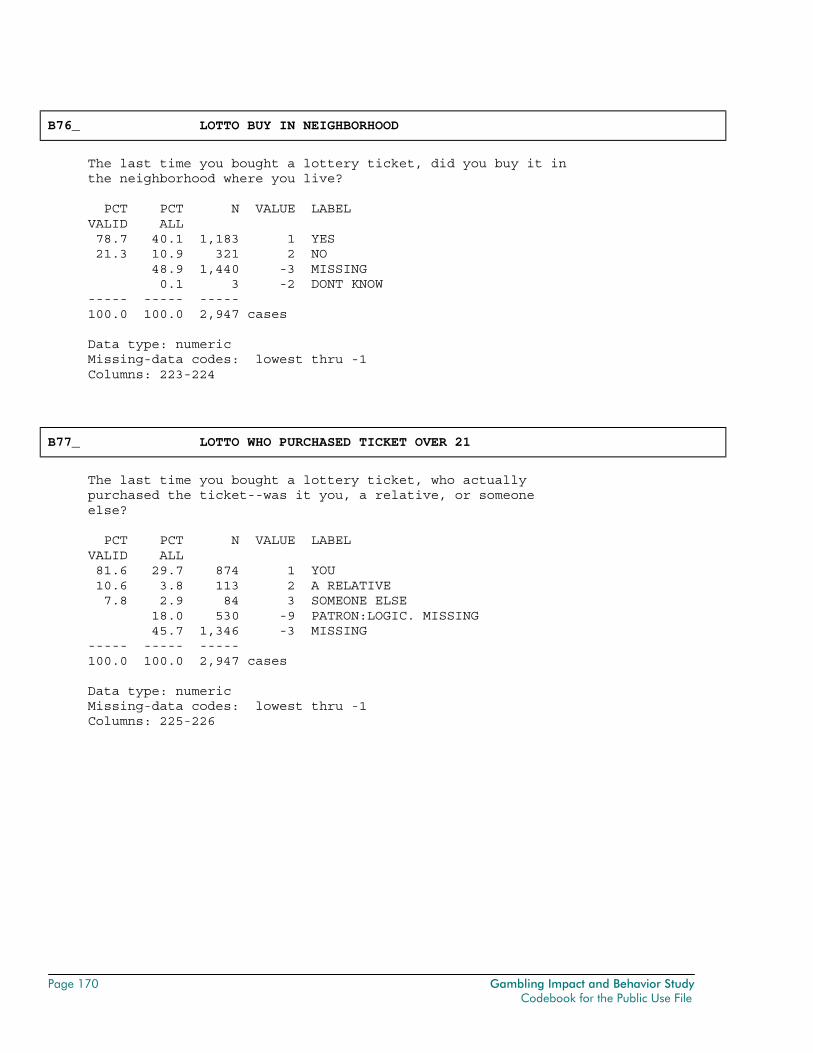
Page 170 Gambling Impact and Behavior Study Codebook for the Public Use File
B76_ LOTTO BUY IN NEIGHBORHOOD
The last time you bought a lottery ticket, did you buy it in the neighborhood where you live? PCT PCT N VALUE LABEL VALID ALL 78.7 40.1 1,183 1 YES 21.3 10.9 321 2 NO 48.9 1,440 -3 MISSING 0.1 3 -2 DONT KNOW ----- ----- ----- 100.0 100.0 2,947 cases Data type: numeric Missing-data codes: lowest thru -1 Columns: 223-224
B77_ LOTTO WHO PURCHASED TICKET OVER 21
The last time you bought a lottery ticket, who actually purchased the ticket--was it you, a relative, or someone else? PCT PCT N VALUE LABEL VALID ALL 81.6 29.7 874 1 YOU 10.6 3.8 113 2 A RELATIVE 7.8 2.9 84 3 SOMEONE ELSE 18.0 530 -9 PATRON:LOGIC. MISSING 45.7 1,346 -3 MISSING ----- ----- ----- 100.0 100.0 2,947 cases Data type: numeric Missing-data codes: lowest thru -1 Columns: 225-226
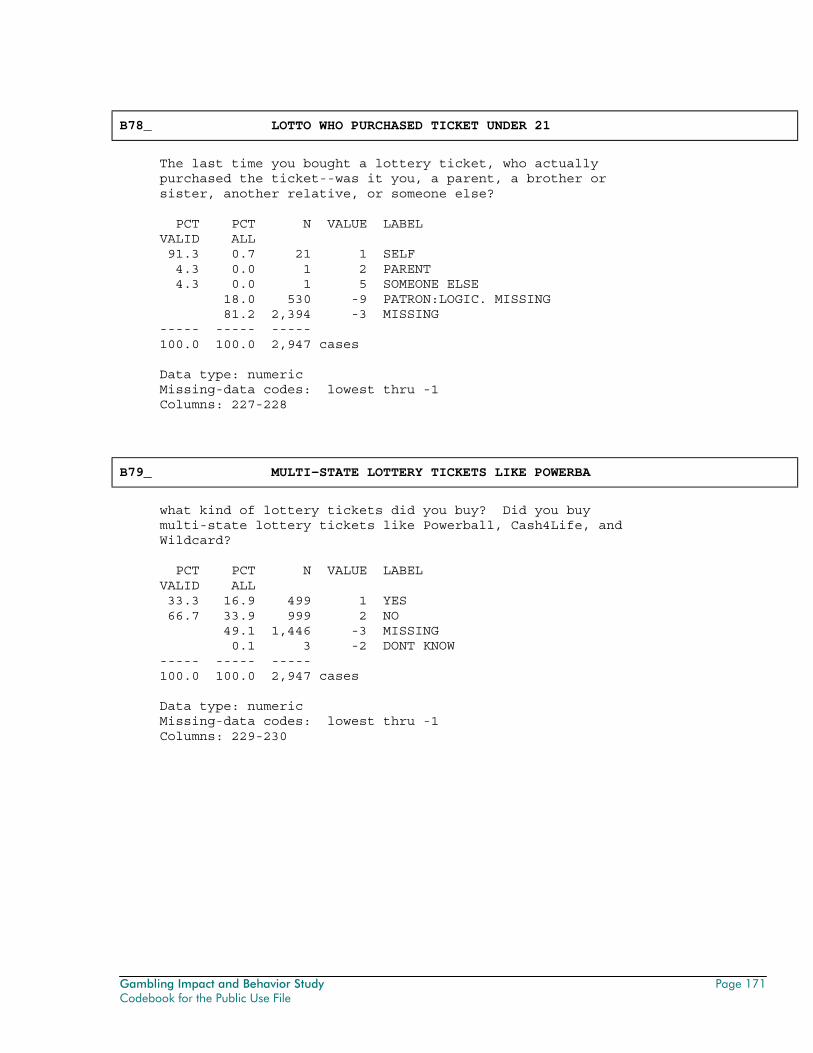
Gambling Impact and Behavior Study Page 171 Codebook for the Public Use File
B78_ LOTTO WHO PURCHASED TICKET UNDER 21
The last time you bought a lottery ticket, who actually purchased the ticket--was it you, a parent, a brother or sister, another relative, or someone else? PCT PCT N VALUE LABEL VALID ALL 91.3 0.7 21 1 SELF 4.3 0.0 1 2 PARENT 4.3 0.0 1 5 SOMEONE ELSE 18.0 530 -9 PATRON:LOGIC. MISSING 81.2 2,394 -3 MISSING ----- ----- ----- 100.0 100.0 2,947 cases Data type: numeric Missing-data codes: lowest thru -1 Columns: 227-228
B79_ MULTI-STATE LOTTERY TICKETS LIKE POWERBA
what kind of lottery tickets did you buy? Did you buy multi-state lottery tickets like Powerball, Cash4Life, and Wildcard? PCT PCT N VALUE LABEL VALID ALL 33.3 16.9 499 1 YES 66.7 33.9 999 2 NO 49.1 1,446 -3 MISSING 0.1 3 -2 DONT KNOW ----- ----- ----- 100.0 100.0 2,947 cases Data type: numeric Missing-data codes: lowest thru -1 Columns: 229-230
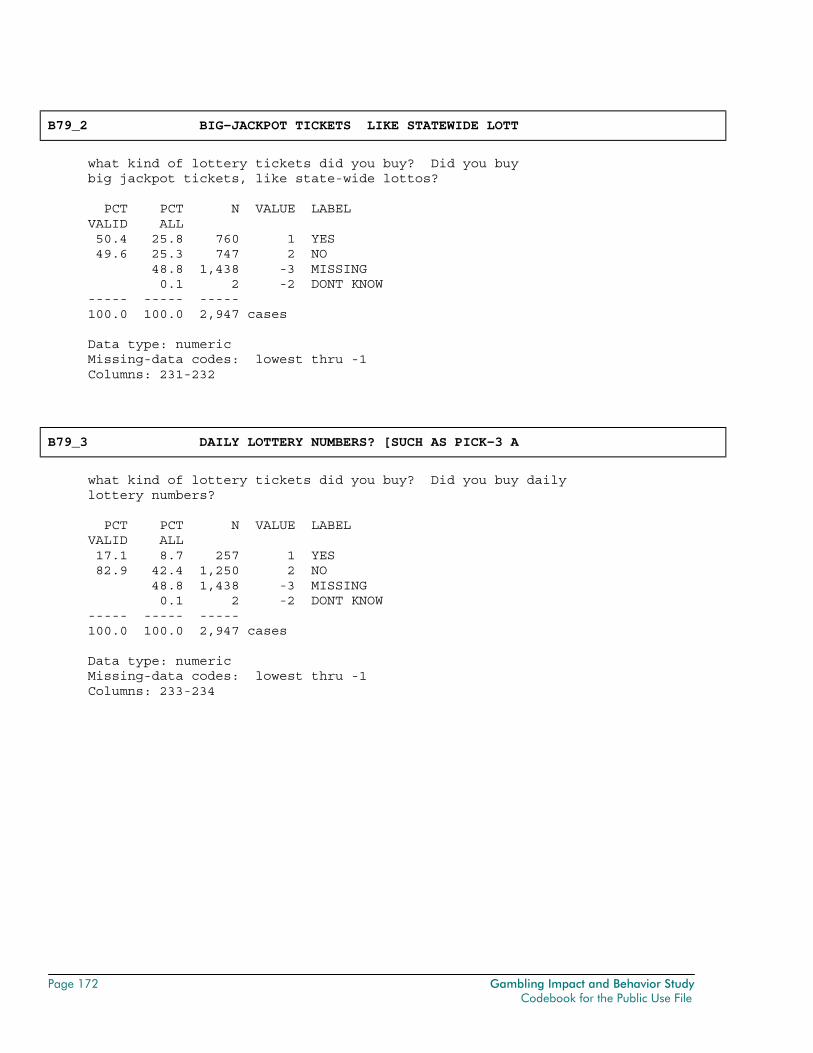
Page 172 Gambling Impact and Behavior Study Codebook for the Public Use File
B79_2 BIG-JACKPOT TICKETS LIKE STATEWIDE LOTT
what kind of lottery tickets did you buy? Did you buy big jackpot tickets, like state-wide lottos? PCT PCT N VALUE LABEL VALID ALL 50.4 25.8 760 1 YES 49.6 25.3 747 2 NO 48.8 1,438 -3 MISSING 0.1 2 -2 DONT KNOW ----- ----- ----- 100.0 100.0 2,947 cases Data type: numeric Missing-data codes: lowest thru -1 Columns: 231-232
B79_3 DAILY LOTTERY NUMBERS? [SUCH AS PICK-3 A
what kind of lottery tickets did you buy? Did you buy daily lottery numbers? PCT PCT N VALUE LABEL VALID ALL 17.1 8.7 257 1 YES 82.9 42.4 1,250 2 NO 48.8 1,438 -3 MISSING 0.1 2 -2 DONT KNOW ----- ----- ----- 100.0 100.0 2,947 cases Data type: numeric Missing-data codes: lowest thru -1 Columns: 233-234
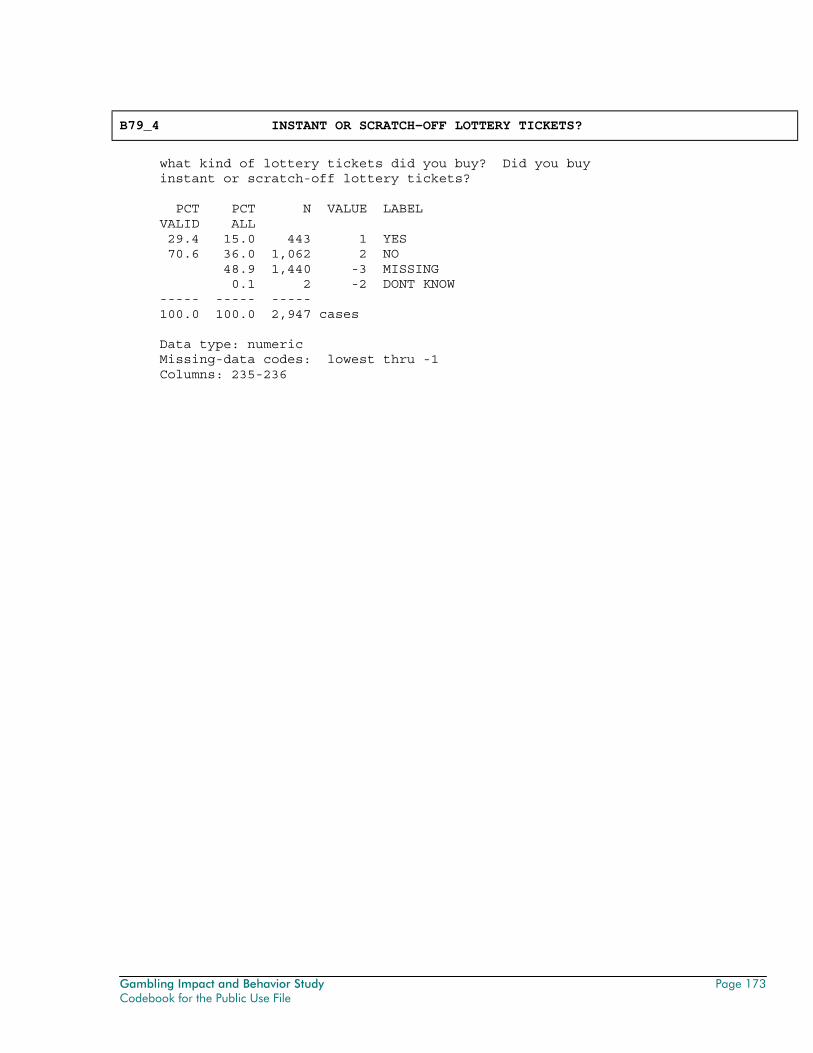
Gambling Impact and Behavior Study Page 173 Codebook for the Public Use File
B79_4 INSTANT OR SCRATCH-OFF LOTTERY TICKETS?
what kind of lottery tickets did you buy? Did you buy instant or scratch-off lottery tickets? PCT PCT N VALUE LABEL VALID ALL 29.4 15.0 443 1 YES 70.6 36.0 1,062 2 NO 48.9 1,440 -3 MISSING 0.1 2 -2 DONT KNOW ----- ----- ----- 100.0 100.0 2,947 cases Data type: numeric Missing-data codes: lowest thru -1 Columns: 235-236
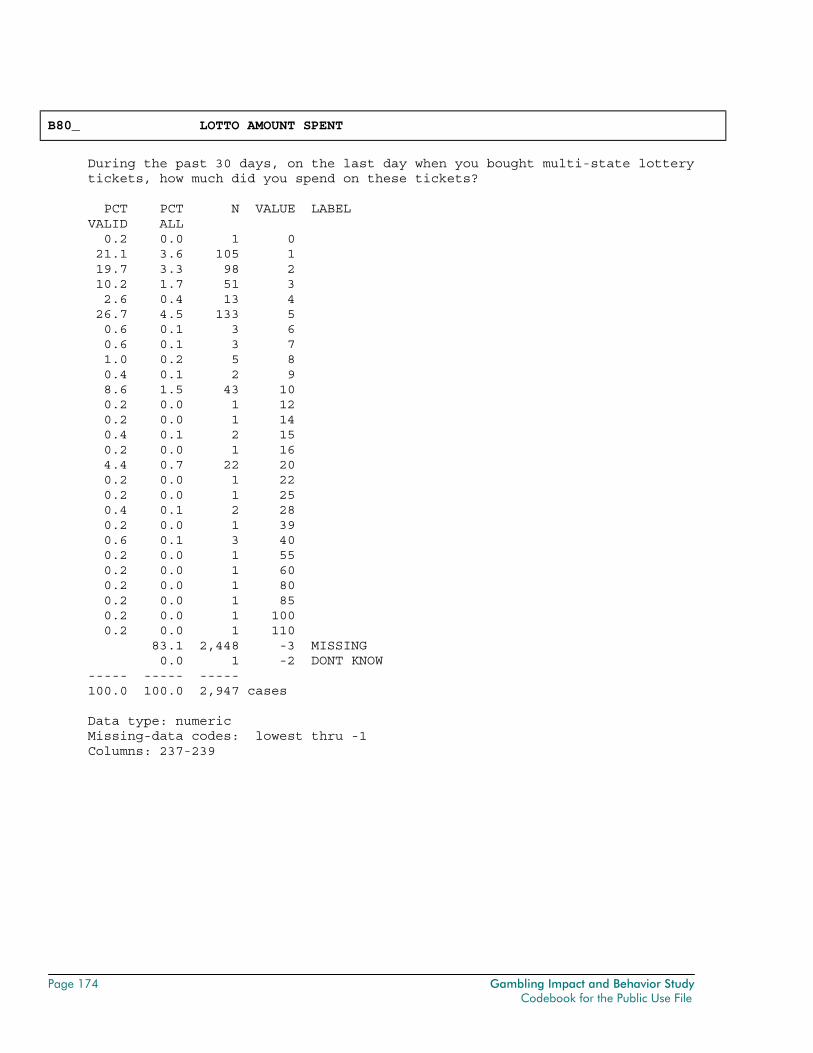
Page 174 Gambling Impact and Behavior Study Codebook for the Public Use File
B80_ LOTTO AMOUNT SPENT
During the past 30 days, on the last day when you bought multi-state lottery tickets, how much did you spend on these tickets? PCT PCT N VALUE LABEL VALID ALL 0.2 0.0 1 0 21.1 3.6 105 1 19.7 3.3 98 2 10.2 1.7 51 3 2.6 0.4 13 4 26.7 4.5 133 5 0.6 0.1 3 6 0.6 0.1 3 7 1.0 0.2 5 8 0.4 0.1 2 9 8.6 1.5 43 10 0.2 0.0 1 12 0.2 0.0 1 14 0.4 0.1 2 15 0.2 0.0 1 16 4.4 0.7 22 20 0.2 0.0 1 22 0.2 0.0 1 25 0.4 0.1 2 28 0.2 0.0 1 39 0.6 0.1 3 40 0.2 0.0 1 55 0.2 0.0 1 60 0.2 0.0 1 80 0.2 0.0 1 85 0.2 0.0 1 100 0.2 0.0 1 110 83.1 2,448 -3 MISSING 0.0 1 -2 DONT KNOW ----- ----- ----- 100.0 100.0 2,947 cases Data type: numeric Missing-data codes: lowest thru -1 Columns: 237-239
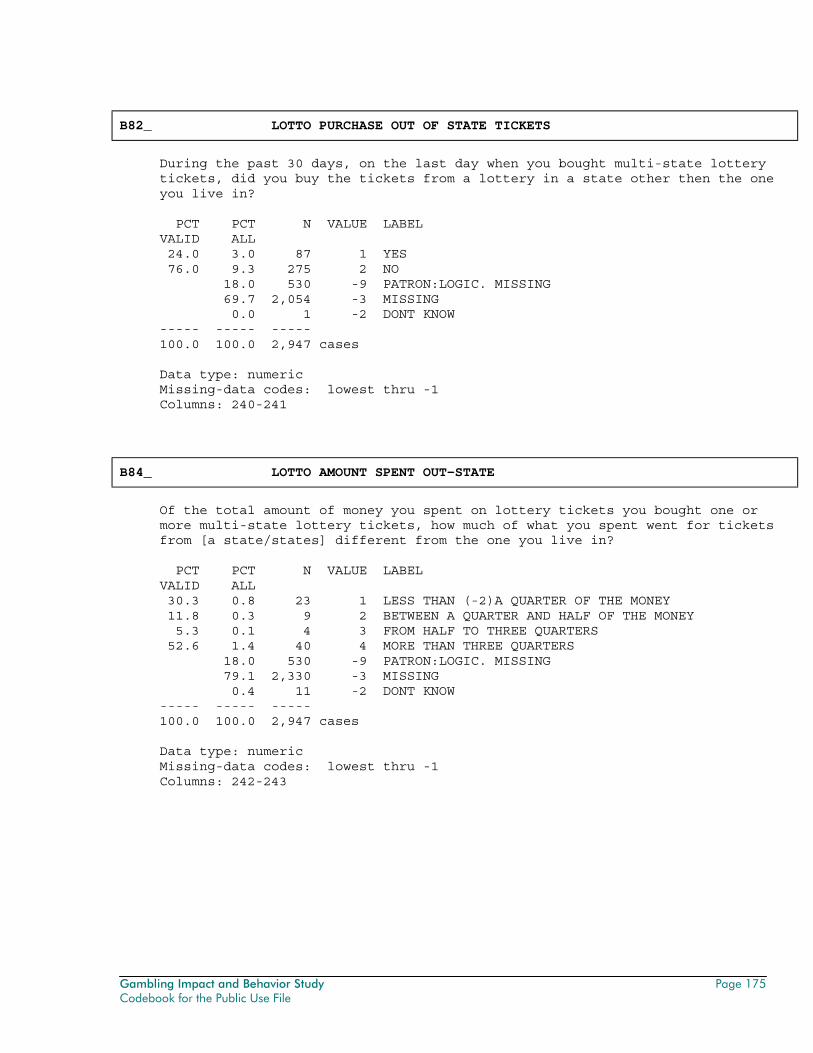
Gambling Impact and Behavior Study Page 175 Codebook for the Public Use File
B82_ LOTTO PURCHASE OUT OF STATE TICKETS
During the past 30 days, on the last day when you bought multi-state lottery tickets, did you buy the tickets from a lottery in a state other then the one you live in? PCT PCT N VALUE LABEL VALID ALL 24.0 3.0 87 1 YES 76.0 9.3 275 2 NO 18.0 530 -9 PATRON:LOGIC. MISSING 69.7 2,054 -3 MISSING 0.0 1 -2 DONT KNOW ----- ----- ----- 100.0 100.0 2,947 cases Data type: numeric Missing-data codes: lowest thru -1 Columns: 240-241
B84_ LOTTO AMOUNT SPENT OUT-STATE
Of the total amount of money you spent on lottery tickets you bought one or more multi-state lottery tickets, how much of what you spent went for tickets from [a state/states] different from the one you live in? PCT PCT N VALUE LABEL VALID ALL 30.3 0.8 23 1 LESS THAN (-2)A QUARTER OF THE MONEY 11.8 0.3 9 2 BETWEEN A QUARTER AND HALF OF THE MONEY 5.3 0.1 4 3 FROM HALF TO THREE QUARTERS 52.6 1.4 40 4 MORE THAN THREE QUARTERS 18.0 530 -9 PATRON:LOGIC. MISSING 79.1 2,330 -3 MISSING 0.4 11 -2 DONT KNOW ----- ----- ----- 100.0 100.0 2,947 cases Data type: numeric Missing-data codes: lowest thru -1 Columns: 242-243
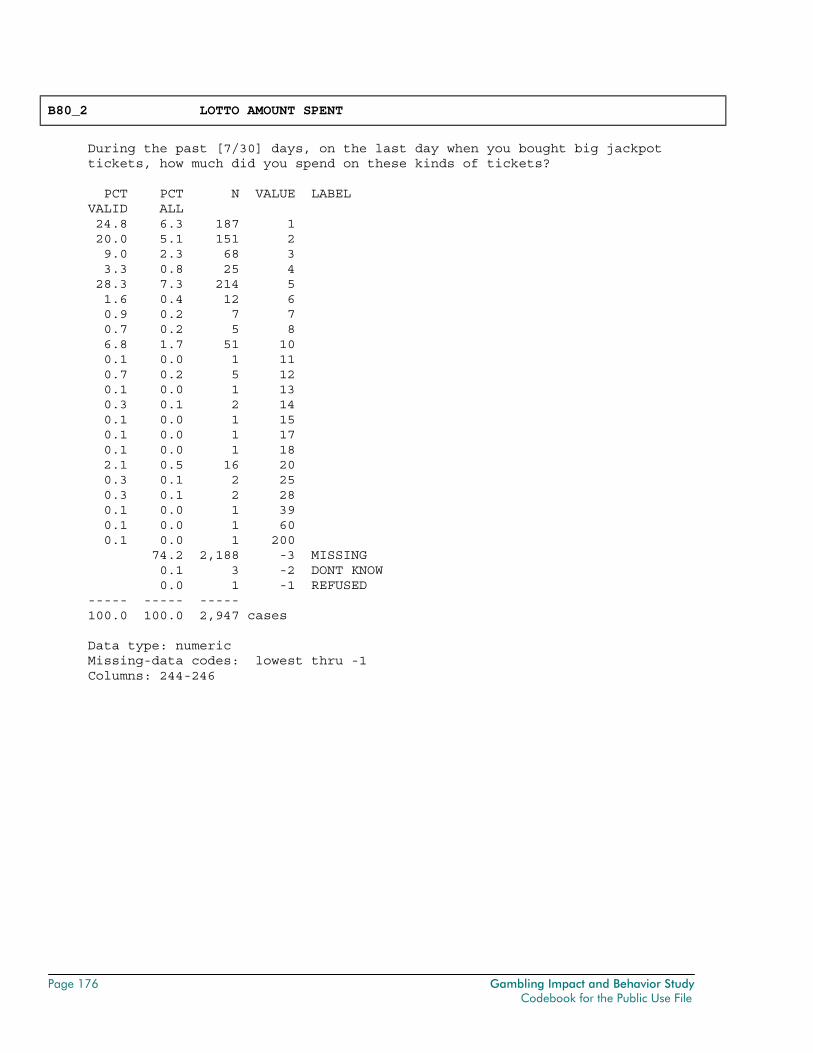
Page 176 Gambling Impact and Behavior Study Codebook for the Public Use File
B80_2 LOTTO AMOUNT SPENT
During the past [7/30] days, on the last day when you bought big jackpot tickets, how much did you spend on these kinds of tickets? PCT PCT N VALUE LABEL VALID ALL 24.8 6.3 187 1 20.0 5.1 151 2 9.0 2.3 68 3 3.3 0.8 25 4 28.3 7.3 214 5 1.6 0.4 12 6 0.9 0.2 7 7 0.7 0.2 5 8 6.8 1.7 51 10 0.1 0.0 1 11 0.7 0.2 5 12 0.1 0.0 1 13 0.3 0.1 2 14 0.1 0.0 1 15 0.1 0.0 1 17 0.1 0.0 1 18 2.1 0.5 16 20 0.3 0.1 2 25 0.3 0.1 2 28 0.1 0.0 1 39 0.1 0.0 1 60 0.1 0.0 1 200 74.2 2,188 -3 MISSING 0.1 3 -2 DONT KNOW 0.0 1 -1 REFUSED ----- ----- ----- 100.0 100.0 2,947 cases Data type: numeric Missing-data codes: lowest thru -1 Columns: 244-246
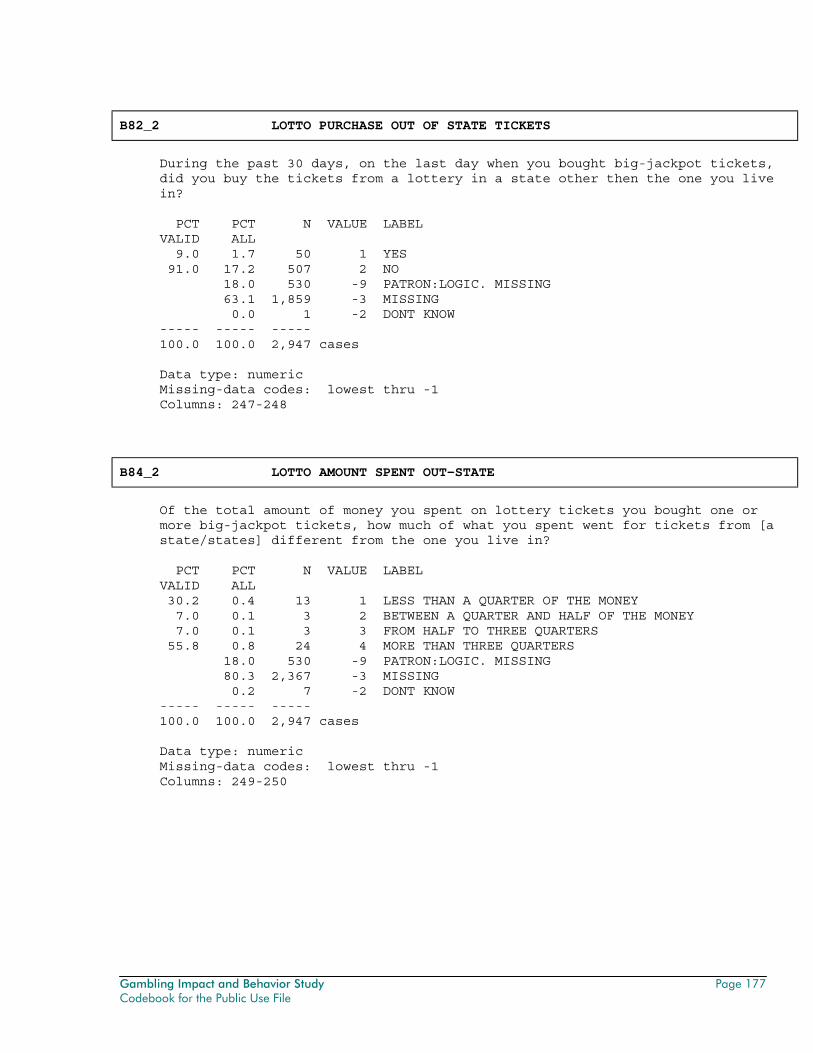
Gambling Impact and Behavior Study Page 177 Codebook for the Public Use File
B82_2 LOTTO PURCHASE OUT OF STATE TICKETS
During the past 30 days, on the last day when you bought big-jackpot tickets, did you buy the tickets from a lottery in a state other then the one you live in? PCT PCT N VALUE LABEL VALID ALL 9.0 1.7 50 1 YES 91.0 17.2 507 2 NO 18.0 530 -9 PATRON:LOGIC. MISSING 63.1 1,859 -3 MISSING 0.0 1 -2 DONT KNOW ----- ----- ----- 100.0 100.0 2,947 cases Data type: numeric Missing-data codes: lowest thru -1 Columns: 247-248
B84_2 LOTTO AMOUNT SPENT OUT-STATE
Of the total amount of money you spent on lottery tickets you bought one or more big-jackpot tickets, how much of what you spent went for tickets from [a state/states] different from the one you live in? PCT PCT N VALUE LABEL VALID ALL 30.2 0.4 13 1 LESS THAN A QUARTER OF THE MONEY 7.0 0.1 3 2 BETWEEN A QUARTER AND HALF OF THE MONEY 7.0 0.1 3 3 FROM HALF TO THREE QUARTERS 55.8 0.8 24 4 MORE THAN THREE QUARTERS 18.0 530 -9 PATRON:LOGIC. MISSING 80.3 2,367 -3 MISSING 0.2 7 -2 DONT KNOW ----- ----- ----- 100.0 100.0 2,947 cases Data type: numeric Missing-data codes: lowest thru -1 Columns: 249-250
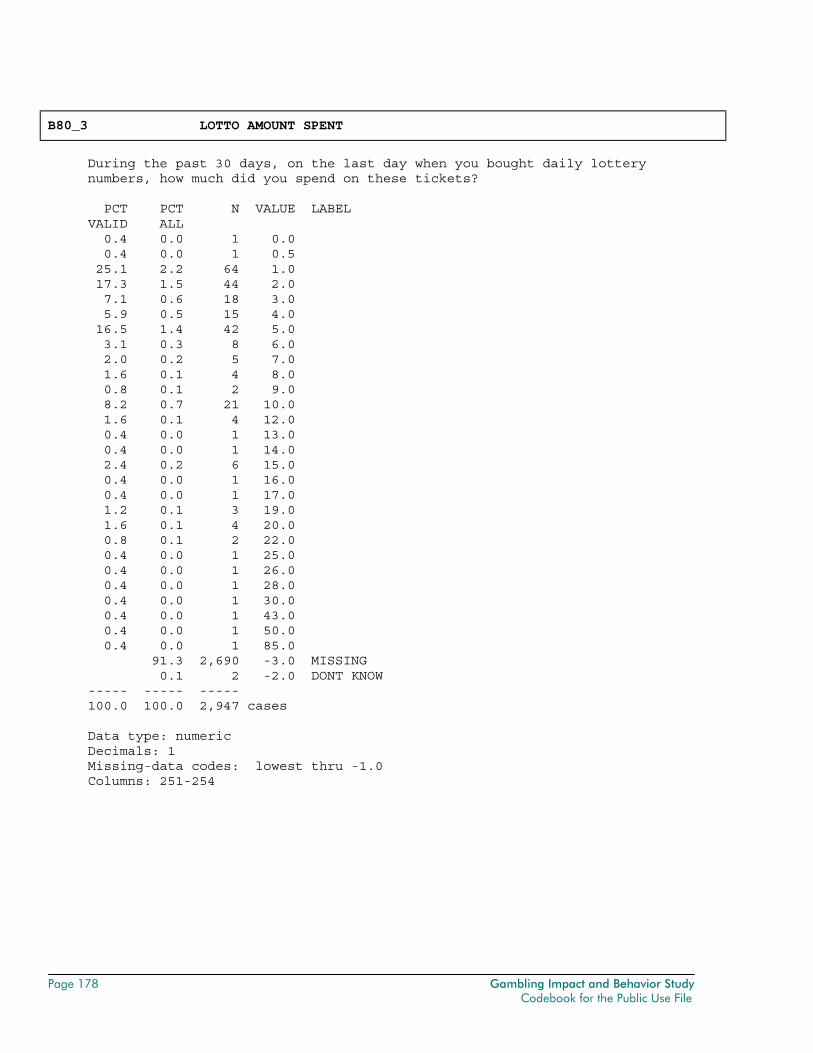
Page 178 Gambling Impact and Behavior Study Codebook for the Public Use File
B80_3 LOTTO AMOUNT SPENT
During the past 30 days, on the last day when you bought daily lottery numbers, how much did you spend on these tickets? PCT PCT N VALUE LABEL VALID ALL 0.4 0.0 1 0.0 0.4 0.0 1 0.5 25.1 2.2 64 1.0 17.3 1.5 44 2.0 7.1 0.6 18 3.0 5.9 0.5 15 4.0 16.5 1.4 42 5.0 3.1 0.3 8 6.0 2.0 0.2 5 7.0 1.6 0.1 4 8.0 0.8 0.1 2 9.0 8.2 0.7 21 10.0 1.6 0.1 4 12.0 0.4 0.0 1 13.0 0.4 0.0 1 14.0 2.4 0.2 6 15.0 0.4 0.0 1 16.0 0.4 0.0 1 17.0 1.2 0.1 3 19.0 1.6 0.1 4 20.0 0.8 0.1 2 22.0 0.4 0.0 1 25.0 0.4 0.0 1 26.0 0.4 0.0 1 28.0 0.4 0.0 1 30.0 0.4 0.0 1 43.0 0.4 0.0 1 50.0 0.4 0.0 1 85.0 91.3 2,690 -3.0 MISSING 0.1 2 -2.0 DONT KNOW ----- ----- ----- 100.0 100.0 2,947 cases Data type: numeric Decimals: 1 Missing-data codes: lowest thru -1.0 Columns: 251-254
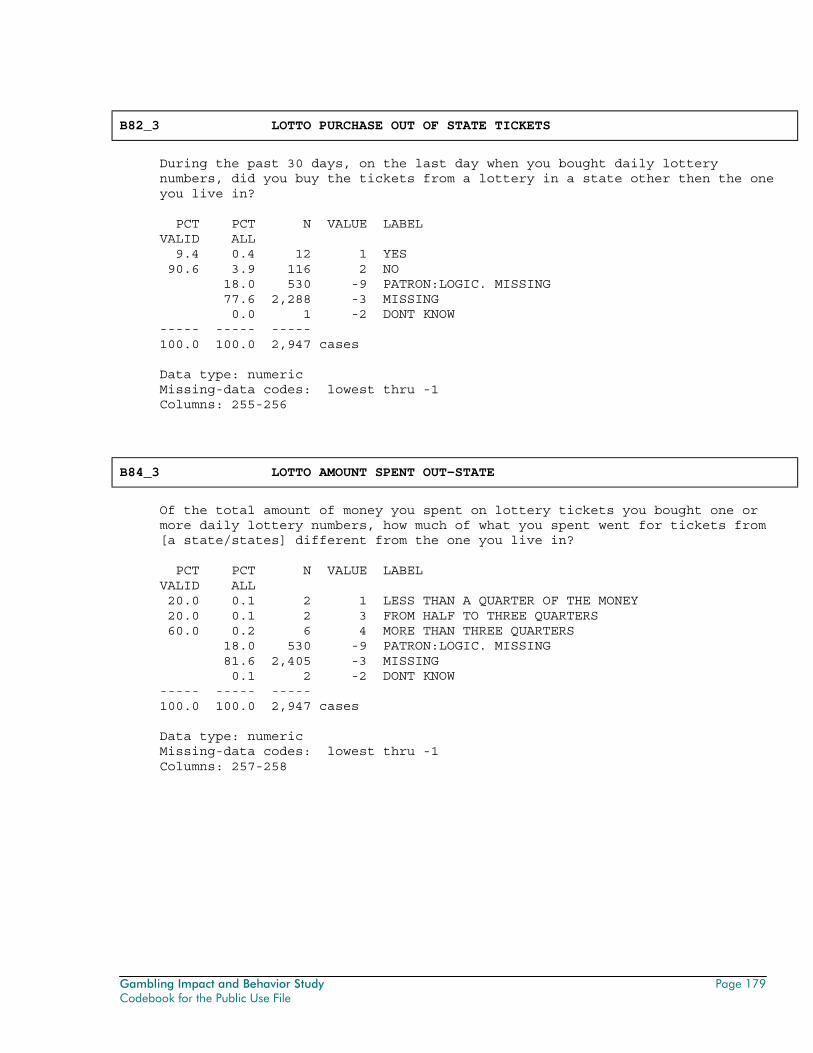
Gambling Impact and Behavior Study Page 179 Codebook for the Public Use File
B82_3 LOTTO PURCHASE OUT OF STATE TICKETS
During the past 30 days, on the last day when you bought daily lottery numbers, did you buy the tickets from a lottery in a state other then the one you live in? PCT PCT N VALUE LABEL VALID ALL 9.4 0.4 12 1 YES 90.6 3.9 116 2 NO 18.0 530 -9 PATRON:LOGIC. MISSING 77.6 2,288 -3 MISSING 0.0 1 -2 DONT KNOW ----- ----- ----- 100.0 100.0 2,947 cases Data type: numeric Missing-data codes: lowest thru -1 Columns: 255-256
B84_3 LOTTO AMOUNT SPENT OUT-STATE
Of the total amount of money you spent on lottery tickets you bought one or more daily lottery numbers, how much of what you spent went for tickets from [a state/states] different from the one you live in? PCT PCT N VALUE LABEL VALID ALL 20.0 0.1 2 1 LESS THAN A QUARTER OF THE MONEY 20.0 0.1 2 3 FROM HALF TO THREE QUARTERS 60.0 0.2 6 4 MORE THAN THREE QUARTERS 18.0 530 -9 PATRON:LOGIC. MISSING 81.6 2,405 -3 MISSING 0.1 2 -2 DONT KNOW ----- ----- ----- 100.0 100.0 2,947 cases Data type: numeric Missing-data codes: lowest thru -1 Columns: 257-258
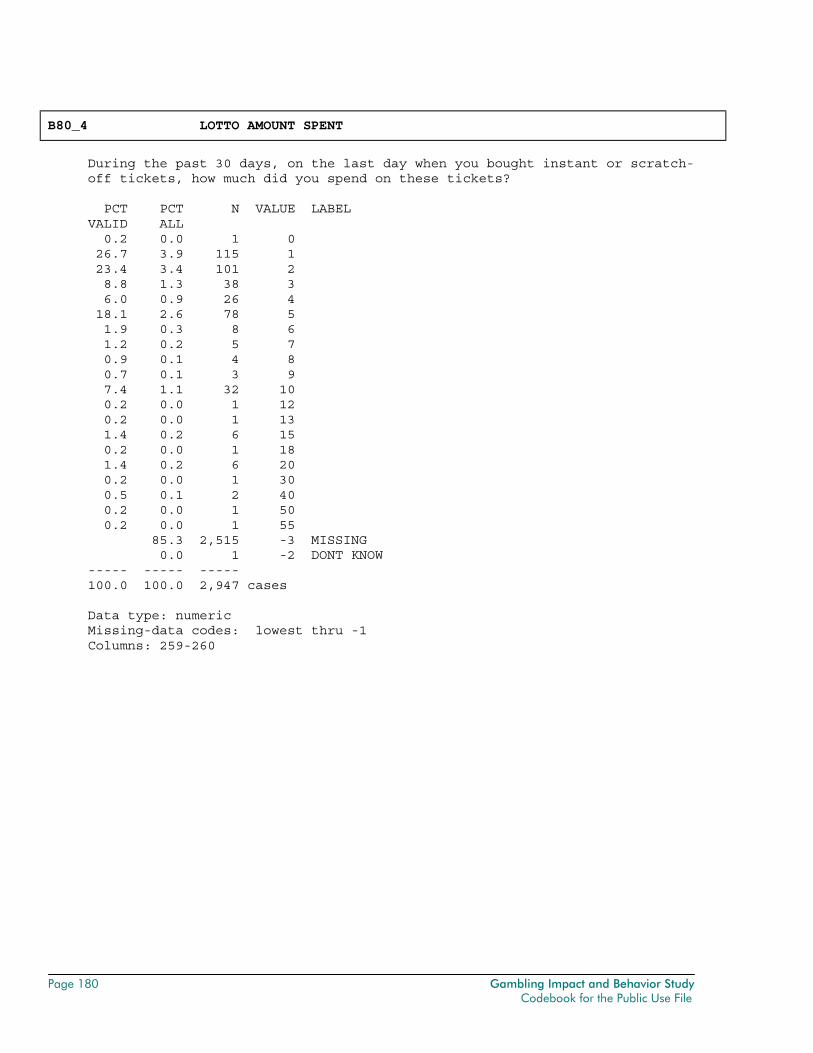
Page 180 Gambling Impact and Behavior Study Codebook for the Public Use File
B80_4 LOTTO AMOUNT SPENT
During the past 30 days, on the last day when you bought instant or scratch- off tickets, how much did you spend on these tickets? PCT PCT N VALUE LABEL VALID ALL 0.2 0.0 1 0 26.7 3.9 115 1 23.4 3.4 101 2 8.8 1.3 38 3 6.0 0.9 26 4 18.1 2.6 78 5 1.9 0.3 8 6 1.2 0.2 5 7 0.9 0.1 4 8 0.7 0.1 3 9 7.4 1.1 32 10 0.2 0.0 1 12 0.2 0.0 1 13 1.4 0.2 6 15 0.2 0.0 1 18 1.4 0.2 6 20 0.2 0.0 1 30 0.5 0.1 2 40 0.2 0.0 1 50 0.2 0.0 1 55 85.3 2,515 -3 MISSING 0.0 1 -2 DONT KNOW ----- ----- ----- 100.0 100.0 2,947 cases Data type: numeric Missing-data codes: lowest thru -1 Columns: 259-260
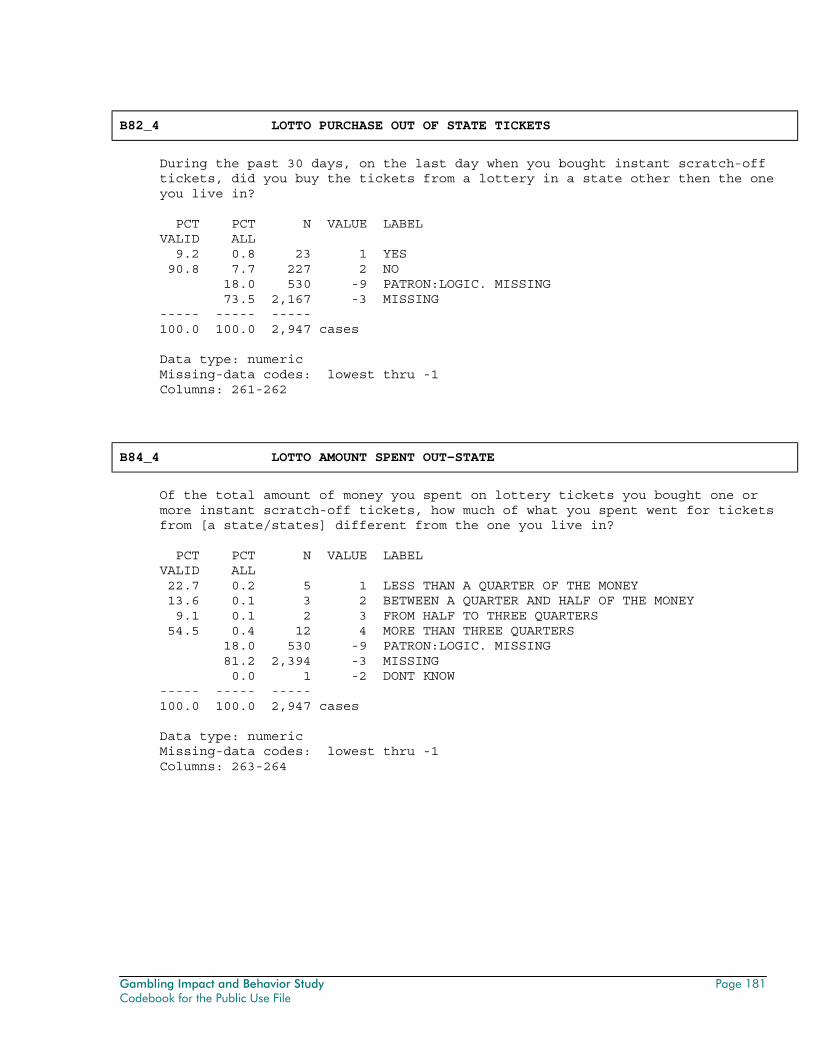
Gambling Impact and Behavior Study Page 181 Codebook for the Public Use File
B82_4 LOTTO PURCHASE OUT OF STATE TICKETS
During the past 30 days, on the last day when you bought instant scratch-off tickets, did you buy the tickets from a lottery in a state other then the one you live in? PCT PCT N VALUE LABEL VALID ALL 9.2 0.8 23 1 YES 90.8 7.7 227 2 NO 18.0 530 -9 PATRON:LOGIC. MISSING 73.5 2,167 -3 MISSING ----- ----- ----- 100.0 100.0 2,947 cases Data type: numeric Missing-data codes: lowest thru -1 Columns: 261-262
B84_4 LOTTO AMOUNT SPENT OUT-STATE
Of the total amount of money you spent on lottery tickets you bought one or more instant scratch-off tickets, how much of what you spent went for tickets from [a state/states] different from the one you live in? PCT PCT N VALUE LABEL VALID ALL 22.7 0.2 5 1 LESS THAN A QUARTER OF THE MONEY 13.6 0.1 3 2 BETWEEN A QUARTER AND HALF OF THE MONEY 9.1 0.1 2 3 FROM HALF TO THREE QUARTERS 54.5 0.4 12 4 MORE THAN THREE QUARTERS 18.0 530 -9 PATRON:LOGIC. MISSING 81.2 2,394 -3 MISSING 0.0 1 -2 DONT KNOW ----- ----- ----- 100.0 100.0 2,947 cases Data type: numeric Missing-data codes: lowest thru -1 Columns: 263-264
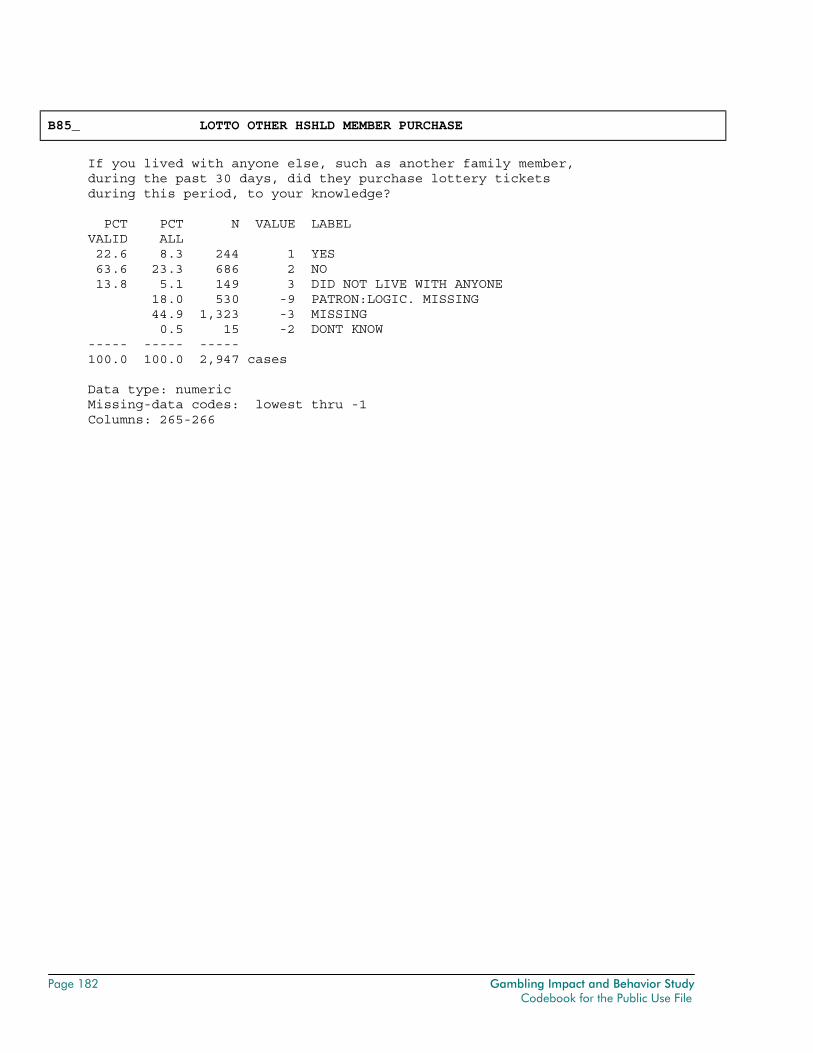
Page 182 Gambling Impact and Behavior Study Codebook for the Public Use File
B85_ LOTTO OTHER HSHLD MEMBER PURCHASE
If you lived with anyone else, such as another family member, during the past 30 days, did they purchase lottery tickets during this period, to your knowledge? PCT PCT N VALUE LABEL VALID ALL 22.6 8.3 244 1 YES 63.6 23.3 686 2 NO 13.8 5.1 149 3 DID NOT LIVE WITH ANYONE 18.0 530 -9 PATRON:LOGIC. MISSING 44.9 1,323 -3 MISSING 0.5 15 -2 DONT KNOW ----- ----- ----- 100.0 100.0 2,947 cases Data type: numeric Missing-data codes: lowest thru -1 Columns: 265-266
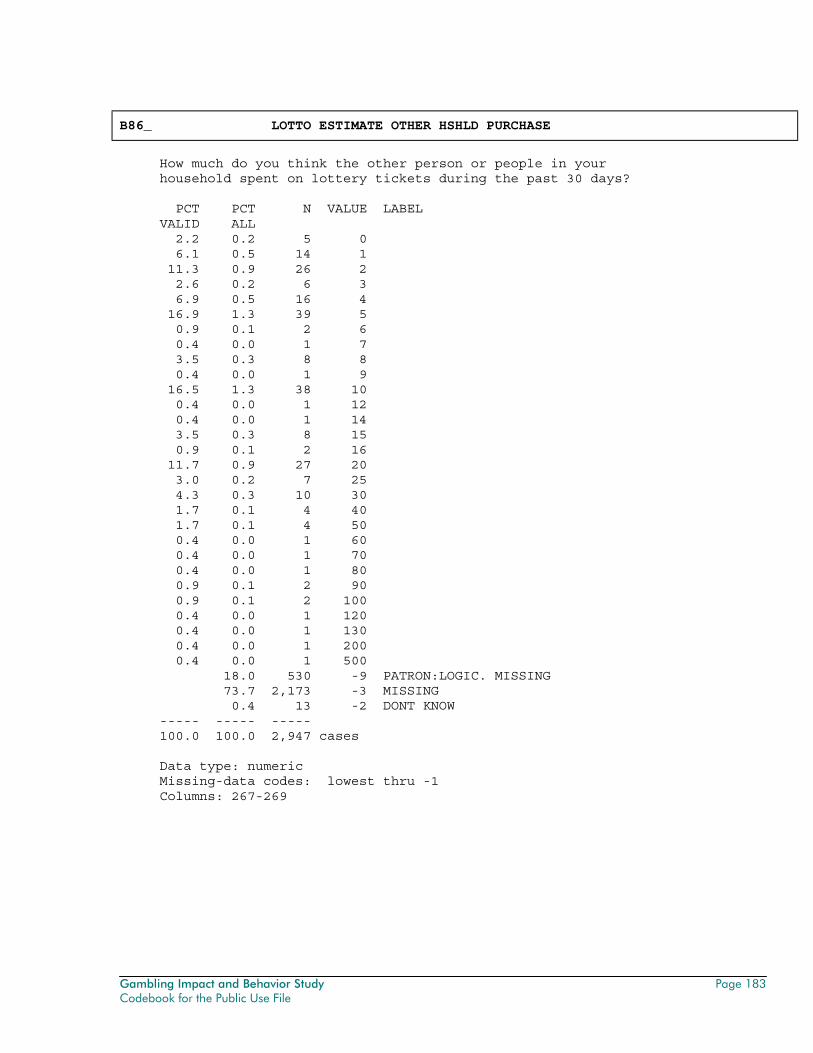
Gambling Impact and Behavior Study Page 183 Codebook for the Public Use File
B86_ LOTTO ESTIMATE OTHER HSHLD PURCHASE
How much do you think the other person or people in your household spent on lottery tickets during the past 30 days? PCT PCT N VALUE LABEL VALID ALL 2.2 0.2 5 0 6.1 0.5 14 1 11.3 0.9 26 2 2.6 0.2 6 3 6.9 0.5 16 4 16.9 1.3 39 5 0.9 0.1 2 6 0.4 0.0 1 7 3.5 0.3 8 8 0.4 0.0 1 9 16.5 1.3 38 10 0.4 0.0 1 12 0.4 0.0 1 14 3.5 0.3 8 15 0.9 0.1 2 16 11.7 0.9 27 20 3.0 0.2 7 25 4.3 0.3 10 30 1.7 0.1 4 40 1.7 0.1 4 50 0.4 0.0 1 60 0.4 0.0 1 70 0.4 0.0 1 80 0.9 0.1 2 90 0.9 0.1 2 100 0.4 0.0 1 120 0.4 0.0 1 130 0.4 0.0 1 200 0.4 0.0 1 500 18.0 530 -9 PATRON:LOGIC. MISSING 73.7 2,173 -3 MISSING 0.4 13 -2 DONT KNOW ----- ----- ----- 100.0 100.0 2,947 cases Data type: numeric Missing-data codes: lowest thru -1 Columns: 267-269
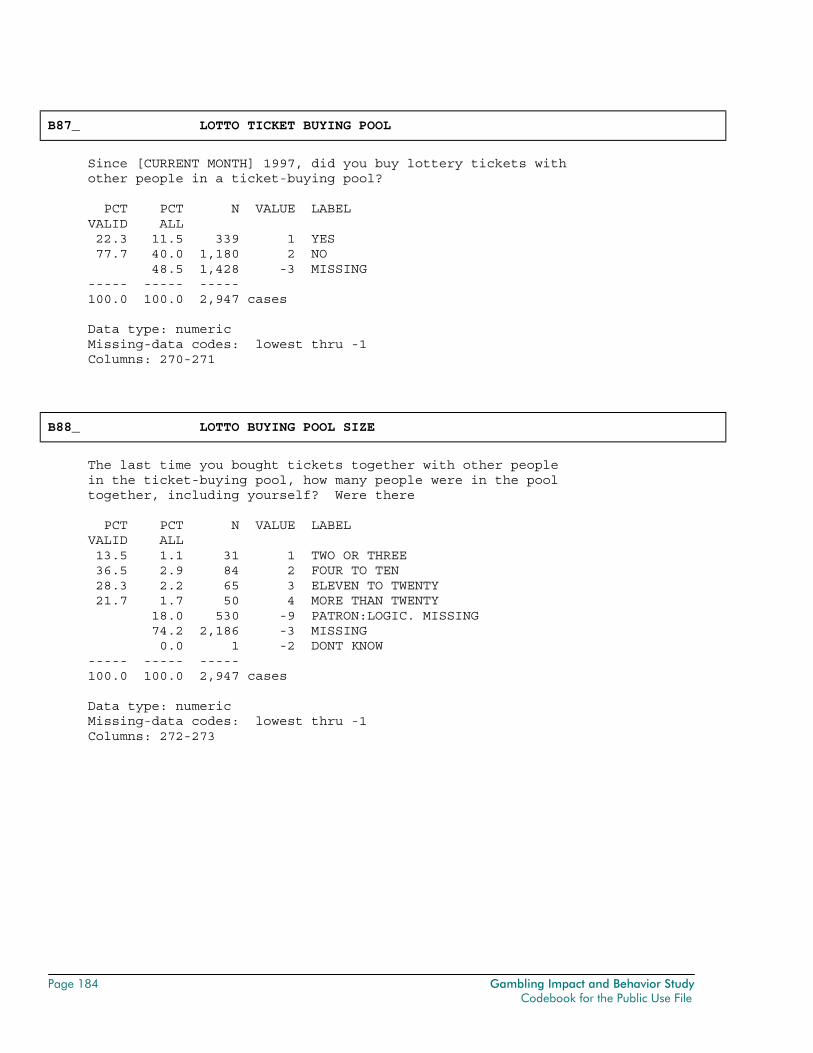
Page 184 Gambling Impact and Behavior Study Codebook for the Public Use File
B87_ LOTTO TICKET BUYING POOL
Since [CURRENT MONTH] 1997, did you buy lottery tickets with other people in a ticket-buying pool? PCT PCT N VALUE LABEL VALID ALL 22.3 11.5 339 1 YES 77.7 40.0 1,180 2 NO 48.5 1,428 -3 MISSING ----- ----- ----- 100.0 100.0 2,947 cases Data type: numeric Missing-data codes: lowest thru -1 Columns: 270-271
B88_ LOTTO BUYING POOL SIZE
The last time you bought tickets together with other people in the ticket-buying pool, how many people were in the pool together, including yourself? Were there PCT PCT N VALUE LABEL VALID ALL 13.5 1.1 31 1 TWO OR THREE 36.5 2.9 84 2 FOUR TO TEN 28.3 2.2 65 3 ELEVEN TO TWENTY 21.7 1.7 50 4 MORE THAN TWENTY 18.0 530 -9 PATRON:LOGIC. MISSING 74.2 2,186 -3 MISSING 0.0 1 -2 DONT KNOW ----- ----- ----- 100.0 100.0 2,947 cases Data type: numeric Missing-data codes: lowest thru -1 Columns: 272-273
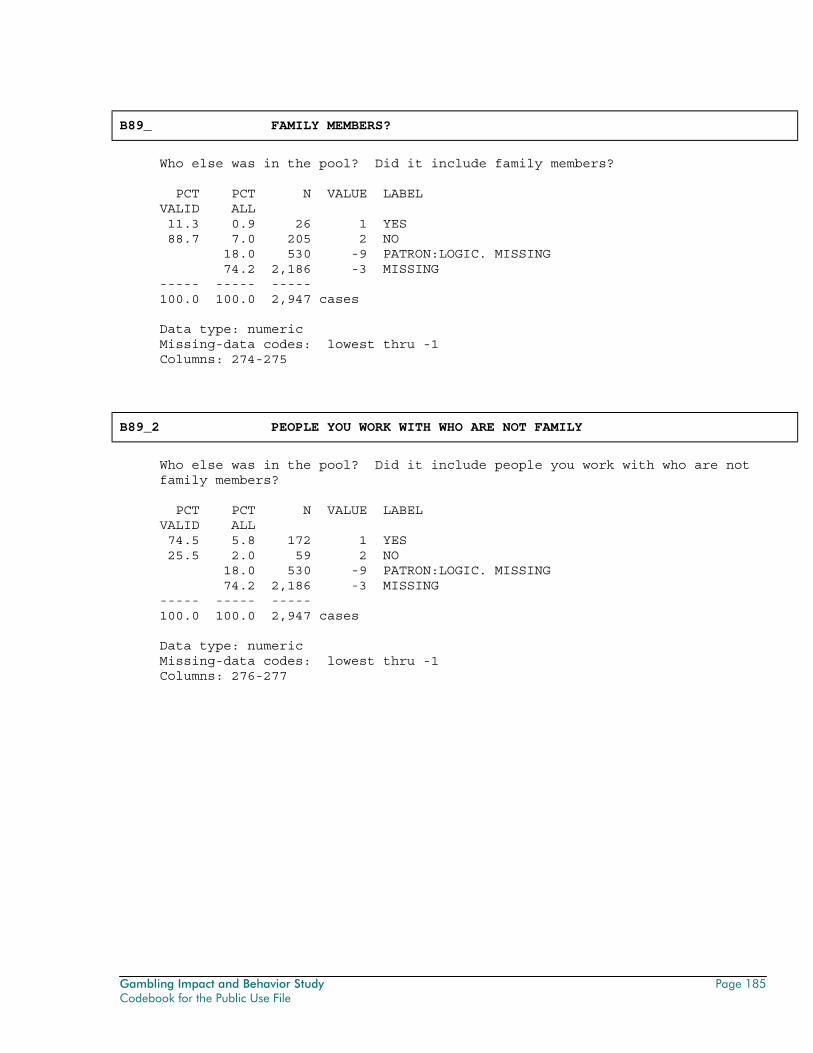
Gambling Impact and Behavior Study Page 185 Codebook for the Public Use File
B89_ FAMILY MEMBERS?
Who else was in the pool? Did it include family members? PCT PCT N VALUE LABEL VALID ALL 11.3 0.9 26 1 YES 88.7 7.0 205 2 NO 18.0 530 -9 PATRON:LOGIC. MISSING 74.2 2,186 -3 MISSING ----- ----- ----- 100.0 100.0 2,947 cases Data type: numeric Missing-data codes: lowest thru -1 Columns: 274-275
B89_2 PEOPLE YOU WORK WITH WHO ARE NOT FAMILY
Who else was in the pool? Did it include people you work with who are not family members? PCT PCT N VALUE LABEL VALID ALL 74.5 5.8 172 1 YES 25.5 2.0 59 2 NO 18.0 530 -9 PATRON:LOGIC. MISSING 74.2 2,186 -3 MISSING ----- ----- ----- 100.0 100.0 2,947 cases Data type: numeric Missing-data codes: lowest thru -1 Columns: 276-277
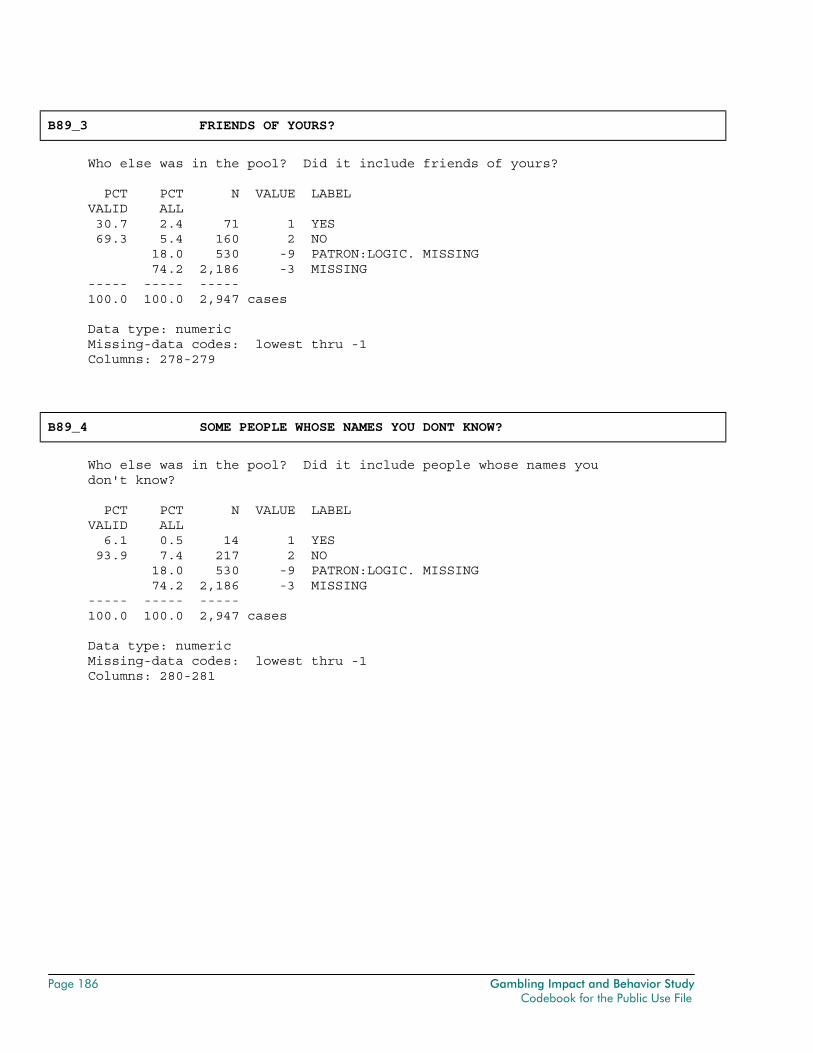
Page 186 Gambling Impact and Behavior Study Codebook for the Public Use File
B89_3 FRIENDS OF YOURS?
Who else was in the pool? Did it include friends of yours? PCT PCT N VALUE LABEL VALID ALL 30.7 2.4 71 1 YES 69.3 5.4 160 2 NO 18.0 530 -9 PATRON:LOGIC. MISSING 74.2 2,186 -3 MISSING ----- ----- ----- 100.0 100.0 2,947 cases Data type: numeric Missing-data codes: lowest thru -1 Columns: 278-279
B89_4 SOME PEOPLE WHOSE NAMES YOU DONT KNOW?
Who else was in the pool? Did it include people whose names you don't know? PCT PCT N VALUE LABEL VALID ALL 6.1 0.5 14 1 YES 93.9 7.4 217 2 NO 18.0 530 -9 PATRON:LOGIC. MISSING 74.2 2,186 -3 MISSING ----- ----- ----- 100.0 100.0 2,947 cases Data type: numeric Missing-data codes: lowest thru -1 Columns: 280-281
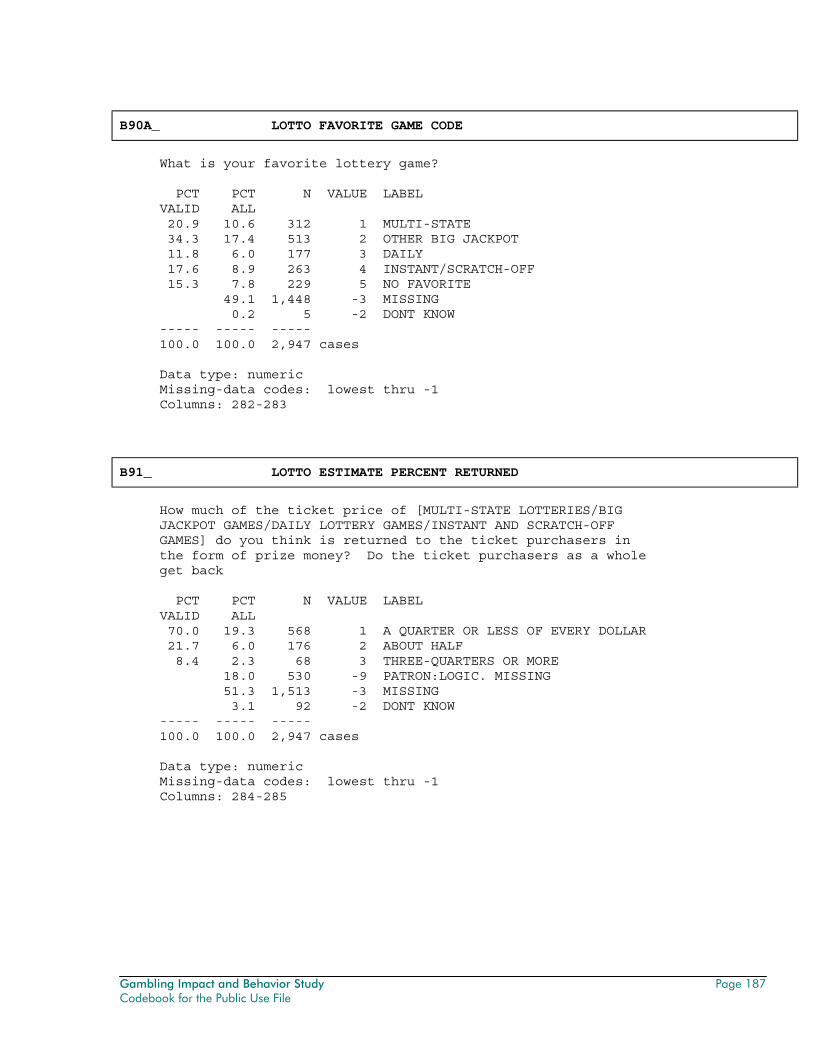
Gambling Impact and Behavior Study Page 187 Codebook for the Public Use File
B90A_ LOTTO FAVORITE GAME CODE
What is your favorite lottery game? PCT PCT N VALUE LABEL VALID ALL 20.9 10.6 312 1 MULTI-STATE 34.3 17.4 513 2 OTHER BIG JACKPOT 11.8 6.0 177 3 DAILY 17.6 8.9 263 4 INSTANT/SCRATCH-OFF 15.3 7.8 229 5 NO FAVORITE 49.1 1,448 -3 MISSING 0.2 5 -2 DONT KNOW ----- ----- ----- 100.0 100.0 2,947 cases Data type: numeric Missing-data codes: lowest thru -1 Columns: 282-283
B91_ LOTTO ESTIMATE PERCENT RETURNED
How much of the ticket price of [MULTI-STATE LOTTERIES/BIG JACKPOT GAMES/DAILY LOTTERY GAMES/INSTANT AND SCRATCH-OFF GAMES] do you think is returned to the ticket purchasers in the form of prize money? Do the ticket purchasers as a whole get back PCT PCT N VALUE LABEL VALID ALL 70.0 19.3 568 1 A QUARTER OR LESS OF EVERY DOLLAR 21.7 6.0 176 2 ABOUT HALF 8.4 2.3 68 3 THREE-QUARTERS OR MORE 18.0 530 -9 PATRON:LOGIC. MISSING 51.3 1,513 -3 MISSING 3.1 92 -2 DONT KNOW ----- ----- ----- 100.0 100.0 2,947 cases Data type: numeric Missing-data codes: lowest thru -1 Columns: 284-285
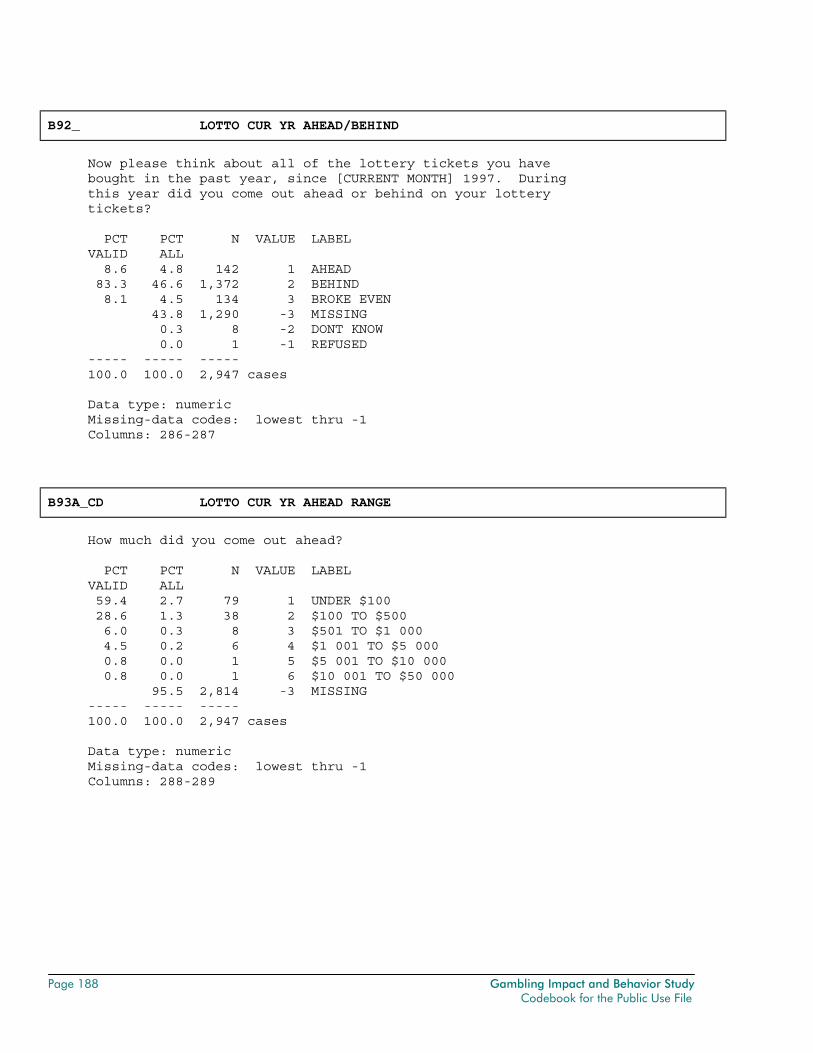
Page 188 Gambling Impact and Behavior Study Codebook for the Public Use File
B92_ LOTTO CUR YR AHEAD/BEHIND
Now please think about all of the lottery tickets you have bought in the past year, since [CURRENT MONTH] 1997. During this year did you come out ahead or behind on your lottery tickets? PCT PCT N VALUE LABEL VALID ALL 8.6 4.8 142 1 AHEAD 83.3 46.6 1,372 2 BEHIND 8.1 4.5 134 3 BROKE EVEN 43.8 1,290 -3 MISSING 0.3 8 -2 DONT KNOW 0.0 1 -1 REFUSED ----- ----- ----- 100.0 100.0 2,947 cases Data type: numeric Missing-data codes: lowest thru -1 Columns: 286-287
B93A_CD LOTTO CUR YR AHEAD RANGE
How much did you come out ahead? PCT PCT N VALUE LABEL VALID ALL 59.4 2.7 79 1 UNDER $100 28.6 1.3 38 2 $100 TO $500 6.0 0.3 8 3 $501 TO $1 000 4.5 0.2 6 4 $1 001 TO $5 000 0.8 0.0 1 5 $5 001 TO $10 000 0.8 0.0 1 6 $10 001 TO $50 000 95.5 2,814 -3 MISSING ----- ----- ----- 100.0 100.0 2,947 cases Data type: numeric Missing-data codes: lowest thru -1 Columns: 288-289
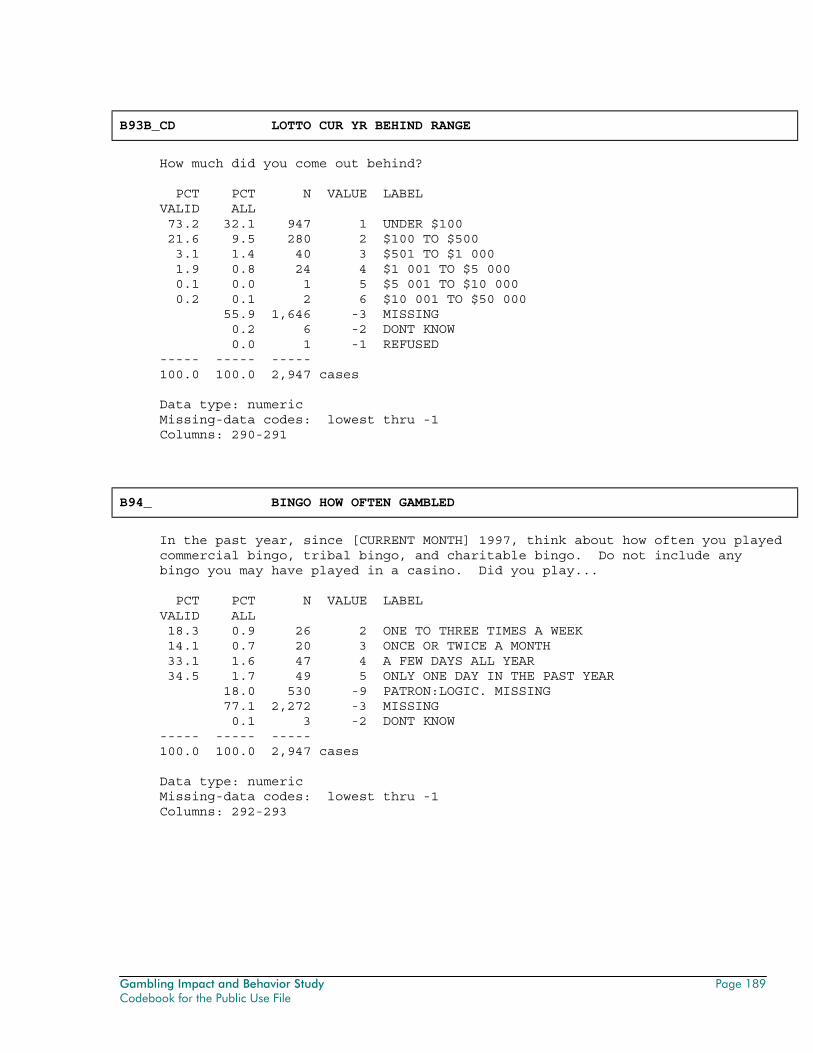
Gambling Impact and Behavior Study Page 189 Codebook for the Public Use File
B93B_CD LOTTO CUR YR BEHIND RANGE
How much did you come out behind? PCT PCT N VALUE LABEL VALID ALL 73.2 32.1 947 1 UNDER $100 21.6 9.5 280 2 $100 TO $500 3.1 1.4 40 3 $501 TO $1 000 1.9 0.8 24 4 $1 001 TO $5 000 0.1 0.0 1 5 $5 001 TO $10 000 0.2 0.1 2 6 $10 001 TO $50 000 55.9 1,646 -3 MISSING 0.2 6 -2 DONT KNOW 0.0 1 -1 REFUSED ----- ----- ----- 100.0 100.0 2,947 cases Data type: numeric Missing-data codes: lowest thru -1 Columns: 290-291
B94_ BINGO HOW OFTEN GAMBLED
In the past year, since [CURRENT MONTH] 1997, think about how often you played commercial bingo, tribal bingo, and charitable bingo. Do not include any bingo you may have played in a casino. Did you play... PCT PCT N VALUE LABEL VALID ALL 18.3 0.9 26 2 ONE TO THREE TIMES A WEEK 14.1 0.7 20 3 ONCE OR TWICE A MONTH 33.1 1.6 47 4 A FEW DAYS ALL YEAR 34.5 1.7 49 5 ONLY ONE DAY IN THE PAST YEAR 18.0 530 -9 PATRON:LOGIC. MISSING 77.1 2,272 -3 MISSING 0.1 3 -2 DONT KNOW ----- ----- ----- 100.0 100.0 2,947 cases Data type: numeric Missing-data codes: lowest thru -1 Columns: 292-293
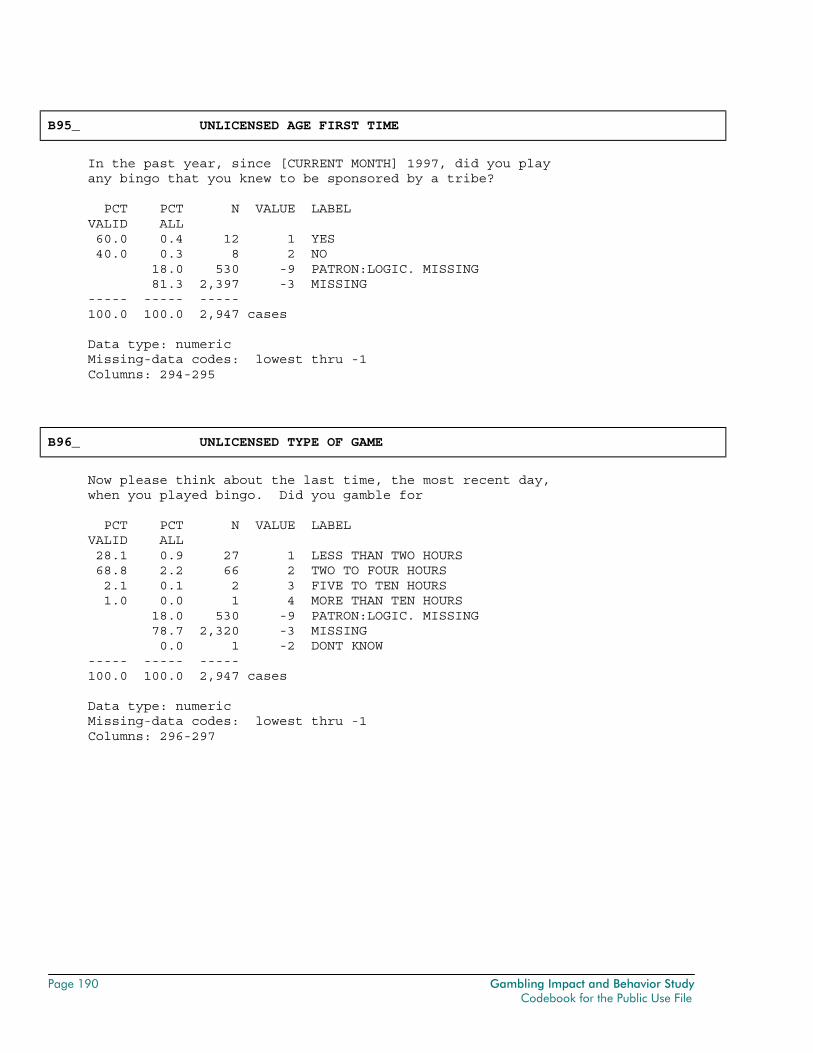
Page 190 Gambling Impact and Behavior Study Codebook for the Public Use File
B95_ UNLICENSED AGE FIRST TIME
In the past year, since [CURRENT MONTH] 1997, did you play any bingo that you knew to be sponsored by a tribe? PCT PCT N VALUE LABEL VALID ALL 60.0 0.4 12 1 YES 40.0 0.3 8 2 NO 18.0 530 -9 PATRON:LOGIC. MISSING 81.3 2,397 -3 MISSING ----- ----- ----- 100.0 100.0 2,947 cases Data type: numeric Missing-data codes: lowest thru -1 Columns: 294-295
B96_ UNLICENSED TYPE OF GAME
Now please think about the last time, the most recent day, when you played bingo. Did you gamble for PCT PCT N VALUE LABEL VALID ALL 28.1 0.9 27 1 LESS THAN TWO HOURS 68.8 2.2 66 2 TWO TO FOUR HOURS 2.1 0.1 2 3 FIVE TO TEN HOURS 1.0 0.0 1 4 MORE THAN TEN HOURS 18.0 530 -9 PATRON:LOGIC. MISSING 78.7 2,320 -3 MISSING 0.0 1 -2 DONT KNOW ----- ----- ----- 100.0 100.0 2,947 cases Data type: numeric Missing-data codes: lowest thru -1 Columns: 296-297
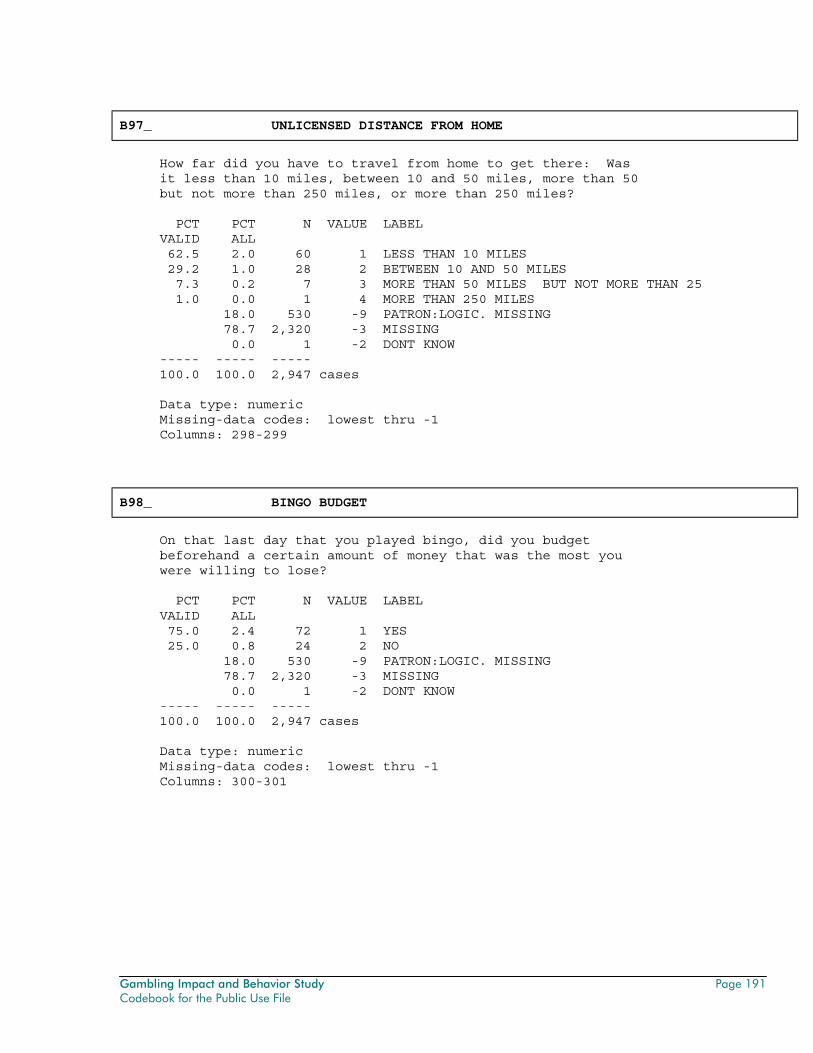
Gambling Impact and Behavior Study Page 191 Codebook for the Public Use File
B97_ UNLICENSED DISTANCE FROM HOME
How far did you have to travel from home to get there: Was it less than 10 miles, between 10 and 50 miles, more than 50 but not more than 250 miles, or more than 250 miles? PCT PCT N VALUE LABEL VALID ALL 62.5 2.0 60 1 LESS THAN 10 MILES 29.2 1.0 28 2 BETWEEN 10 AND 50 MILES 7.3 0.2 7 3 MORE THAN 50 MILES BUT NOT MORE THAN 25 1.0 0.0 1 4 MORE THAN 250 MILES 18.0 530 -9 PATRON:LOGIC. MISSING 78.7 2,320 -3 MISSING 0.0 1 -2 DONT KNOW ----- ----- ----- 100.0 100.0 2,947 cases Data type: numeric Missing-data codes: lowest thru -1 Columns: 298-299
B98_ BINGO BUDGET
On that last day that you played bingo, did you budget beforehand a certain amount of money that was the most you were willing to lose? PCT PCT N VALUE LABEL VALID ALL 75.0 2.4 72 1 YES 25.0 0.8 24 2 NO 18.0 530 -9 PATRON:LOGIC. MISSING 78.7 2,320 -3 MISSING 0.0 1 -2 DONT KNOW ----- ----- ----- 100.0 100.0 2,947 cases Data type: numeric Missing-data codes: lowest thru -1 Columns: 300-301
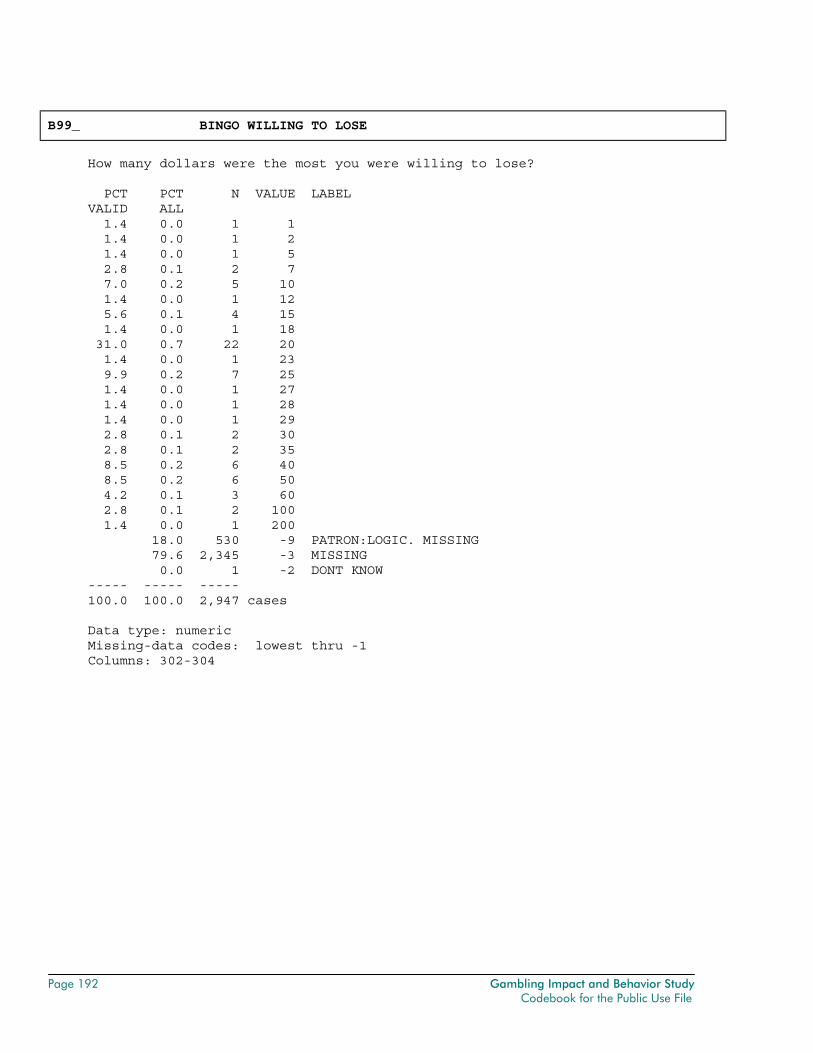
Page 192 Gambling Impact and Behavior Study Codebook for the Public Use File
B99_ BINGO WILLING TO LOSE
How many dollars were the most you were willing to lose? PCT PCT N VALUE LABEL VALID ALL 1.4 0.0 1 1 1.4 0.0 1 2 1.4 0.0 1 5 2.8 0.1 2 7 7.0 0.2 5 10 1.4 0.0 1 12 5.6 0.1 4 15 1.4 0.0 1 18 31.0 0.7 22 20 1.4 0.0 1 23 9.9 0.2 7 25 1.4 0.0 1 27 1.4 0.0 1 28 1.4 0.0 1 29 2.8 0.1 2 30 2.8 0.1 2 35 8.5 0.2 6 40 8.5 0.2 6 50 4.2 0.1 3 60 2.8 0.1 2 100 1.4 0.0 1 200 18.0 530 -9 PATRON:LOGIC. MISSING 79.6 2,345 -3 MISSING 0.0 1 -2 DONT KNOW ----- ----- ----- 100.0 100.0 2,947 cases Data type: numeric Missing-data codes: lowest thru -1 Columns: 302-304
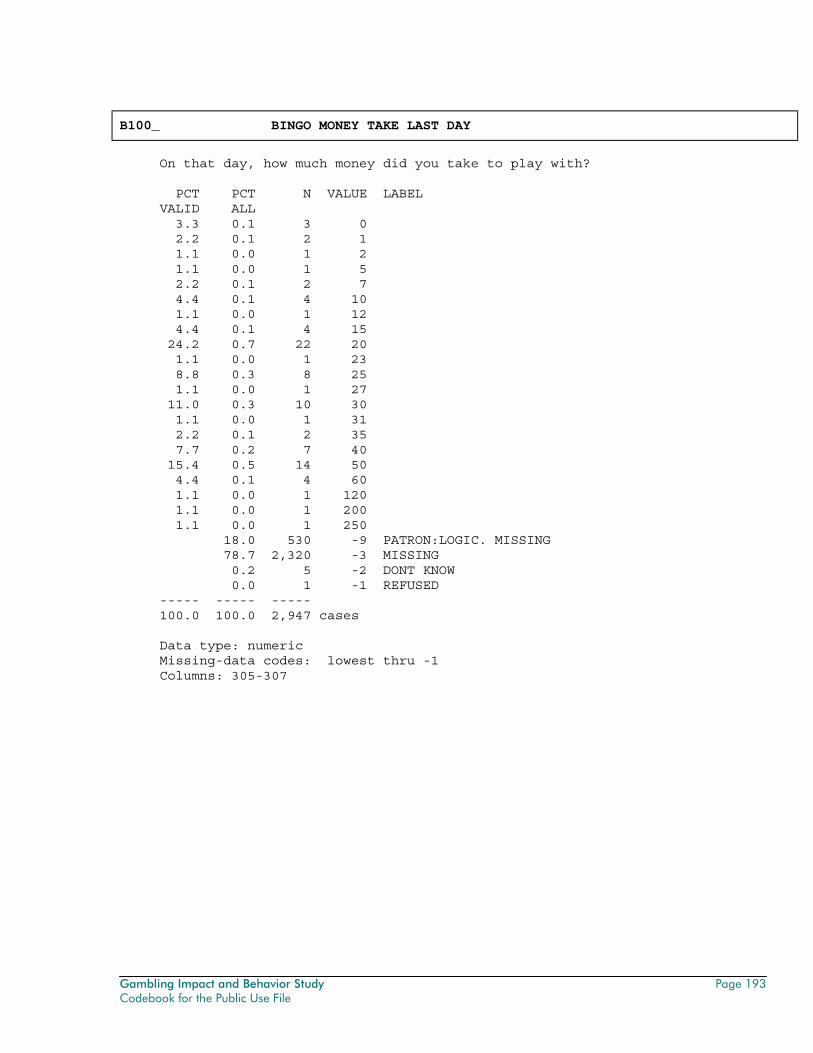
Gambling Impact and Behavior Study Page 193 Codebook for the Public Use File
B100_ BINGO MONEY TAKE LAST DAY
On that day, how much money did you take to play with? PCT PCT N VALUE LABEL VALID ALL 3.3 0.1 3 0 2.2 0.1 2 1 1.1 0.0 1 2 1.1 0.0 1 5 2.2 0.1 2 7 4.4 0.1 4 10 1.1 0.0 1 12 4.4 0.1 4 15 24.2 0.7 22 20 1.1 0.0 1 23 8.8 0.3 8 25 1.1 0.0 1 27 11.0 0.3 10 30 1.1 0.0 1 31 2.2 0.1 2 35 7.7 0.2 7 40 15.4 0.5 14 50 4.4 0.1 4 60 1.1 0.0 1 120 1.1 0.0 1 200 1.1 0.0 1 250 18.0 530 -9 PATRON:LOGIC. MISSING 78.7 2,320 -3 MISSING 0.2 5 -2 DONT KNOW 0.0 1 -1 REFUSED ----- ----- ----- 100.0 100.0 2,947 cases Data type: numeric Missing-data codes: lowest thru -1 Columns: 305-307
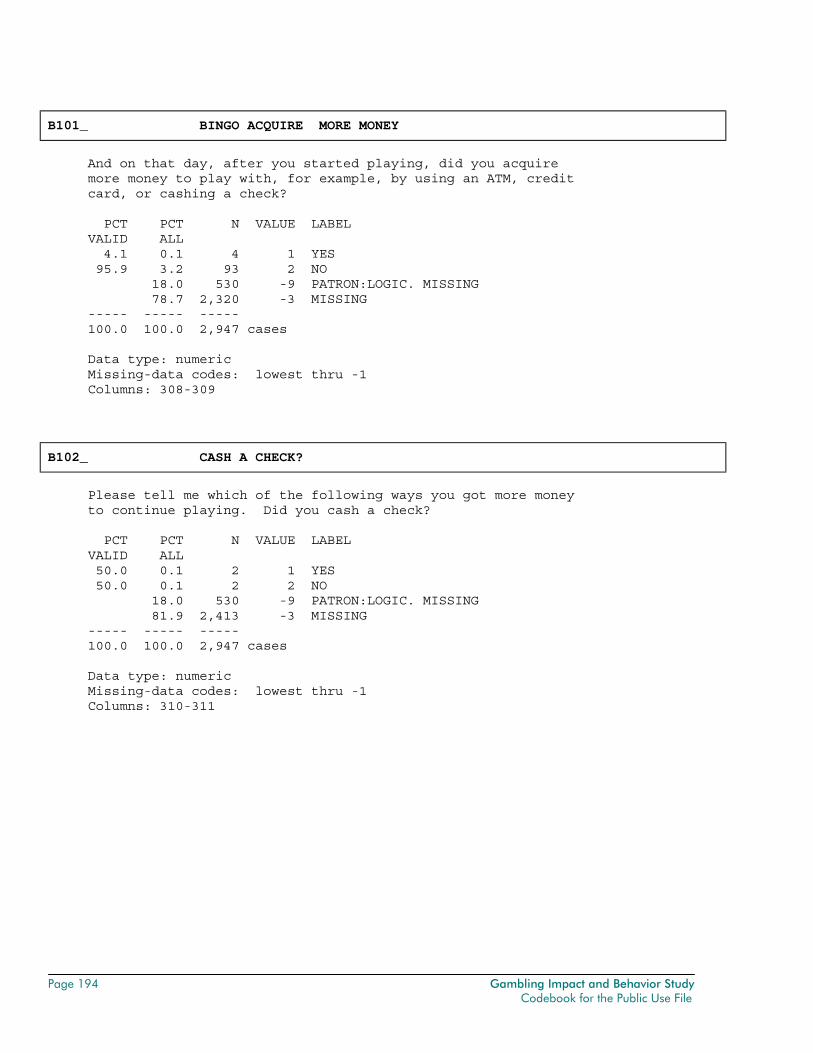
Page 194 Gambling Impact and Behavior Study Codebook for the Public Use File
B101_ BINGO ACQUIRE MORE MONEY
And on that day, after you started playing, did you acquire more money to play with, for example, by using an ATM, credit card, or cashing a check? PCT PCT N VALUE LABEL VALID ALL 4.1 0.1 4 1 YES 95.9 3.2 93 2 NO 18.0 530 -9 PATRON:LOGIC. MISSING 78.7 2,320 -3 MISSING ----- ----- ----- 100.0 100.0 2,947 cases Data type: numeric Missing-data codes: lowest thru -1 Columns: 308-309
B102_ CASH A CHECK?
Please tell me which of the following ways you got more money to continue playing. Did you cash a check? PCT PCT N VALUE LABEL VALID ALL 50.0 0.1 2 1 YES 50.0 0.1 2 2 NO 18.0 530 -9 PATRON:LOGIC. MISSING 81.9 2,413 -3 MISSING ----- ----- ----- 100.0 100.0 2,947 cases Data type: numeric Missing-data codes: lowest thru -1 Columns: 310-311

Gambling Impact and Behavior Study Page 195 Codebook for the Public Use File
B102_2 TAKE MONEY FROM A BANK ACCOUNT USING AN
Please tell me which of the following ways you got more money to continue playing. Did you take money from a bank account using an ATM? PCT PCT N VALUE LABEL VALID ALL 25.0 0.0 1 1 YES 75.0 0.1 3 2 NO 18.0 530 -9 PATRON:LOGIC. MISSING 81.9 2,413 -3 MISSING ----- ----- ----- 100.0 100.0 2,947 cases Data type: numeric Missing-data codes: lowest thru -1 Columns: 312-313
B102_3 PAY WITH A CREDIT CARD?
Please tell me which of the following ways you got more money to continue playing. Did you pay with a credit card? PCT PCT N VALUE LABEL VALID ALL 100.0 0.1 4 2 NO 18.0 530 -9 PATRON:LOGIC. MISSING 81.9 2,413 -3 MISSING ----- ----- ----- 100.0 100.0 2,947 cases Data type: numeric Missing-data codes: lowest thru -1 Columns: 314-315

Page 196 Gambling Impact and Behavior Study Codebook for the Public Use File
B102_4 GET A CREDIT CARD CASH ADVANCE?
Please tell me which of the following ways you got more money to continue playing. Did you get a credit card cash advance? PCT PCT N VALUE LABEL VALID ALL 100.0 0.1 4 2 NO 18.0 530 -9 PATRON:LOGIC. MISSING 81.9 2,413 -3 MISSING ----- ----- ----- 100.0 100.0 2,947 cases Data type: numeric Missing-data codes: lowest thru -1 Columns: 316-317
B102_5 BORROW MONEY FROM A FAMILY MEMBER OR FRI
Please tell me which of the following ways you got more money to continue playing. Did you borrow money from a family member or friend? PCT PCT N VALUE LABEL VALID ALL 25.0 0.0 1 1 YES 75.0 0.1 3 2 NO 18.0 530 -9 PATRON:LOGIC. MISSING 81.9 2,413 -3 MISSING ----- ----- ----- 100.0 100.0 2,947 cases Data type: numeric Missing-data codes: lowest thru -1 Columns: 318-319
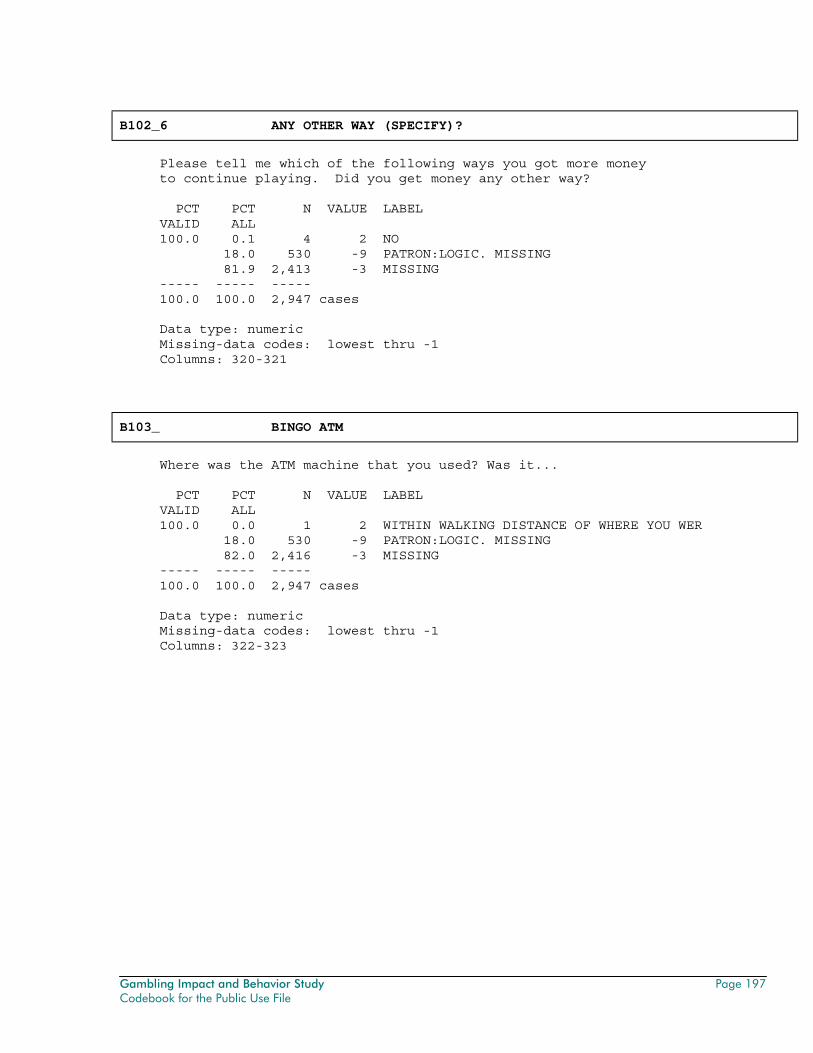
Gambling Impact and Behavior Study Page 197 Codebook for the Public Use File
B102_6 ANY OTHER WAY (SPECIFY)?
Please tell me which of the following ways you got more money to continue playing. Did you get money any other way? PCT PCT N VALUE LABEL VALID ALL 100.0 0.1 4 2 NO 18.0 530 -9 PATRON:LOGIC. MISSING 81.9 2,413 -3 MISSING ----- ----- ----- 100.0 100.0 2,947 cases Data type: numeric Missing-data codes: lowest thru -1 Columns: 320-321
B103_ BINGO ATM
Where was the ATM machine that you used? Was it... PCT PCT N VALUE LABEL VALID ALL 100.0 0.0 1 2 WITHIN WALKING DISTANCE OF WHERE YOU WER 18.0 530 -9 PATRON:LOGIC. MISSING 82.0 2,416 -3 MISSING ----- ----- ----- 100.0 100.0 2,947 cases Data type: numeric Missing-data codes: lowest thru -1 Columns: 322-323
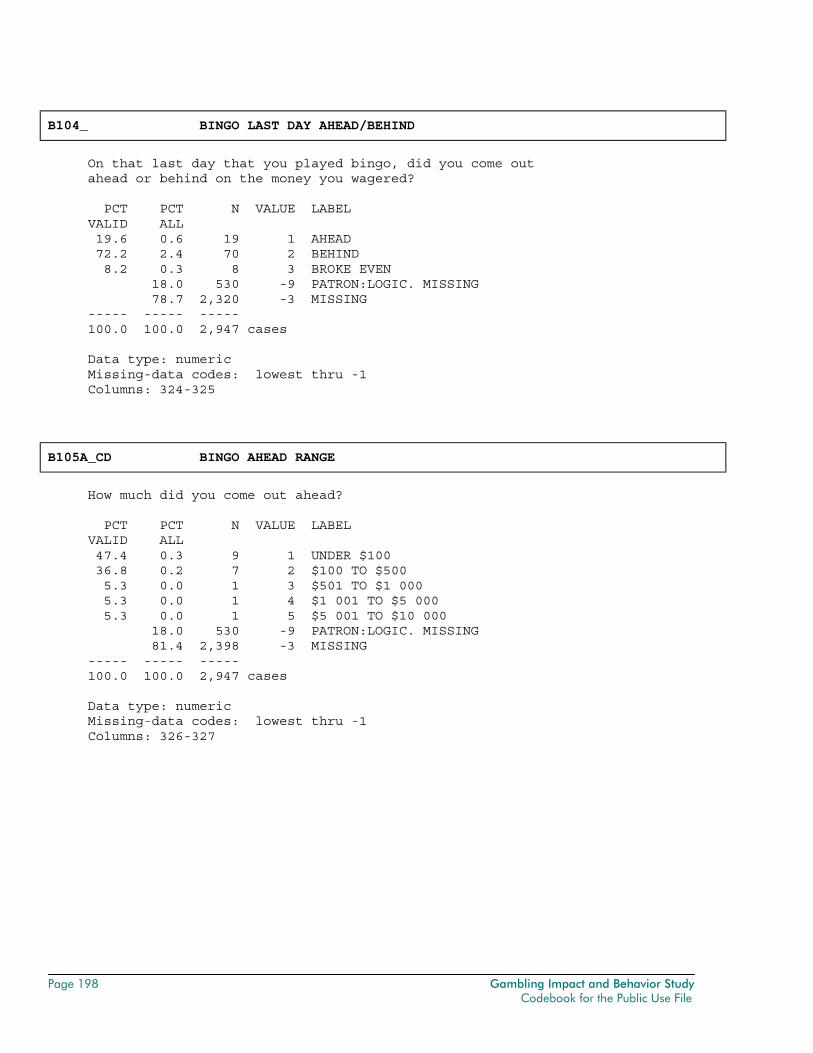
Page 198 Gambling Impact and Behavior Study Codebook for the Public Use File
B104_ BINGO LAST DAY AHEAD/BEHIND
On that last day that you played bingo, did you come out ahead or behind on the money you wagered? PCT PCT N VALUE LABEL VALID ALL 19.6 0.6 19 1 AHEAD 72.2 2.4 70 2 BEHIND 8.2 0.3 8 3 BROKE EVEN 18.0 530 -9 PATRON:LOGIC. MISSING 78.7 2,320 -3 MISSING ----- ----- ----- 100.0 100.0 2,947 cases Data type: numeric Missing-data codes: lowest thru -1 Columns: 324-325
B105A_CD BINGO AHEAD RANGE
How much did you come out ahead? PCT PCT N VALUE LABEL VALID ALL 47.4 0.3 9 1 UNDER $100 36.8 0.2 7 2 $100 TO $500 5.3 0.0 1 3 $501 TO $1 000 5.3 0.0 1 4 $1 001 TO $5 000 5.3 0.0 1 5 $5 001 TO $10 000 18.0 530 -9 PATRON:LOGIC. MISSING 81.4 2,398 -3 MISSING ----- ----- ----- 100.0 100.0 2,947 cases Data type: numeric Missing-data codes: lowest thru -1 Columns: 326-327
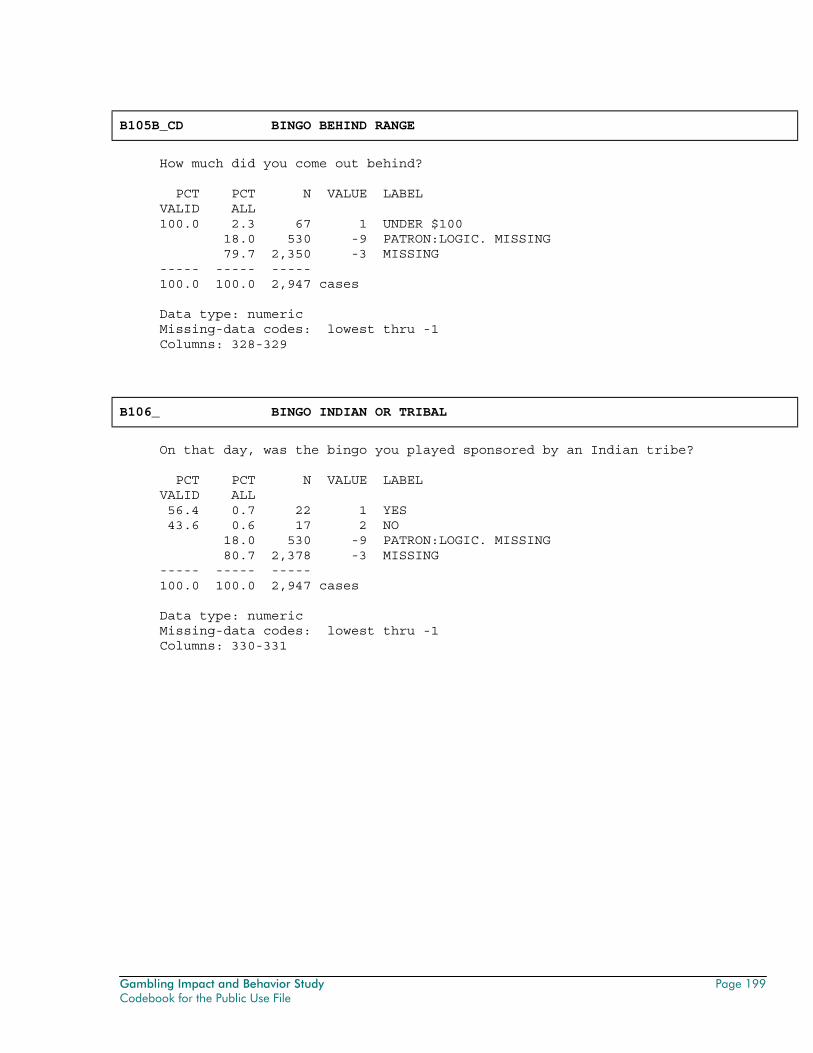
Gambling Impact and Behavior Study Page 199 Codebook for the Public Use File
B105B_CD BINGO BEHIND RANGE
How much did you come out behind? PCT PCT N VALUE LABEL VALID ALL 100.0 2.3 67 1 UNDER $100 18.0 530 -9 PATRON:LOGIC. MISSING 79.7 2,350 -3 MISSING ----- ----- ----- 100.0 100.0 2,947 cases Data type: numeric Missing-data codes: lowest thru -1 Columns: 328-329
B106_ BINGO INDIAN OR TRIBAL
On that day, was the bingo you played sponsored by an Indian tribe? PCT PCT N VALUE LABEL VALID ALL 56.4 0.7 22 1 YES 43.6 0.6 17 2 NO 18.0 530 -9 PATRON:LOGIC. MISSING 80.7 2,378 -3 MISSING ----- ----- ----- 100.0 100.0 2,947 cases Data type: numeric Missing-data codes: lowest thru -1 Columns: 330-331
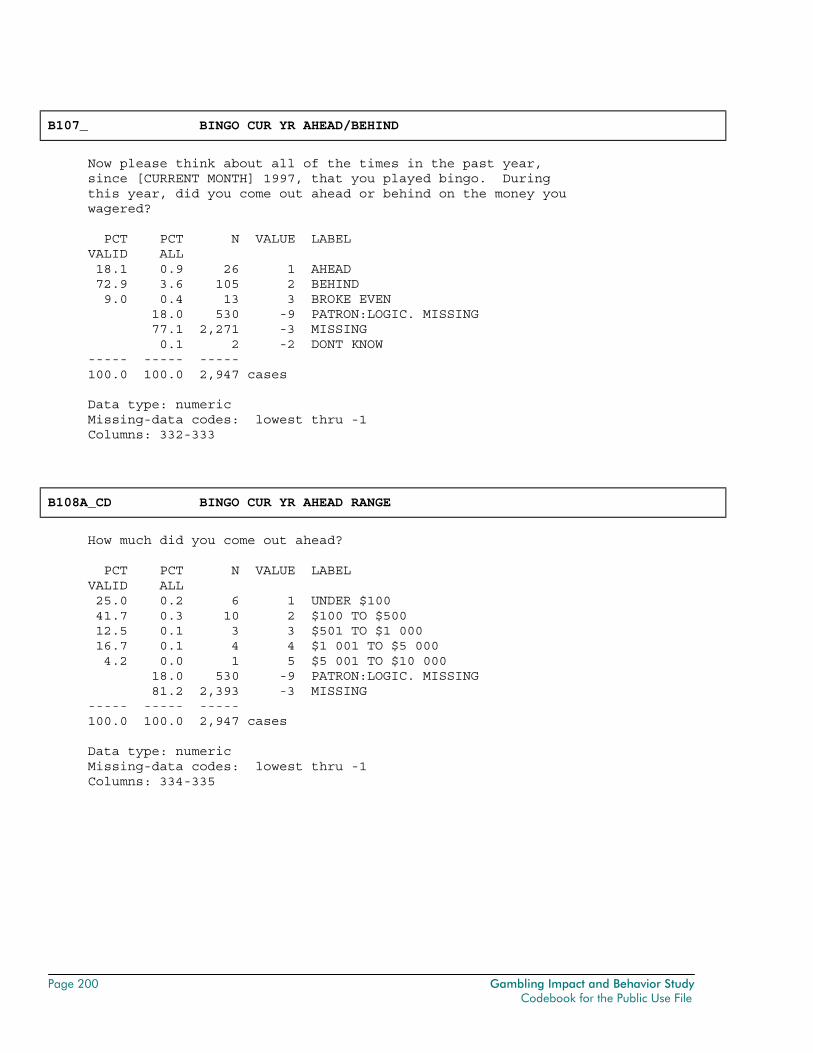
Page 200 Gambling Impact and Behavior Study Codebook for the Public Use File
B107_ BINGO CUR YR AHEAD/BEHIND
Now please think about all of the times in the past year, since [CURRENT MONTH] 1997, that you played bingo. During this year, did you come out ahead or behind on the money you wagered? PCT PCT N VALUE LABEL VALID ALL 18.1 0.9 26 1 AHEAD 72.9 3.6 105 2 BEHIND 9.0 0.4 13 3 BROKE EVEN 18.0 530 -9 PATRON:LOGIC. MISSING 77.1 2,271 -3 MISSING 0.1 2 -2 DONT KNOW ----- ----- ----- 100.0 100.0 2,947 cases Data type: numeric Missing-data codes: lowest thru -1 Columns: 332-333
B108A_CD BINGO CUR YR AHEAD RANGE
How much did you come out ahead? PCT PCT N VALUE LABEL VALID ALL 25.0 0.2 6 1 UNDER $100 41.7 0.3 10 2 $100 TO $500 12.5 0.1 3 3 $501 TO $1 000 16.7 0.1 4 4 $1 001 TO $5 000 4.2 0.0 1 5 $5 001 TO $10 000 18.0 530 -9 PATRON:LOGIC. MISSING 81.2 2,393 -3 MISSING ----- ----- ----- 100.0 100.0 2,947 cases Data type: numeric Missing-data codes: lowest thru -1 Columns: 334-335
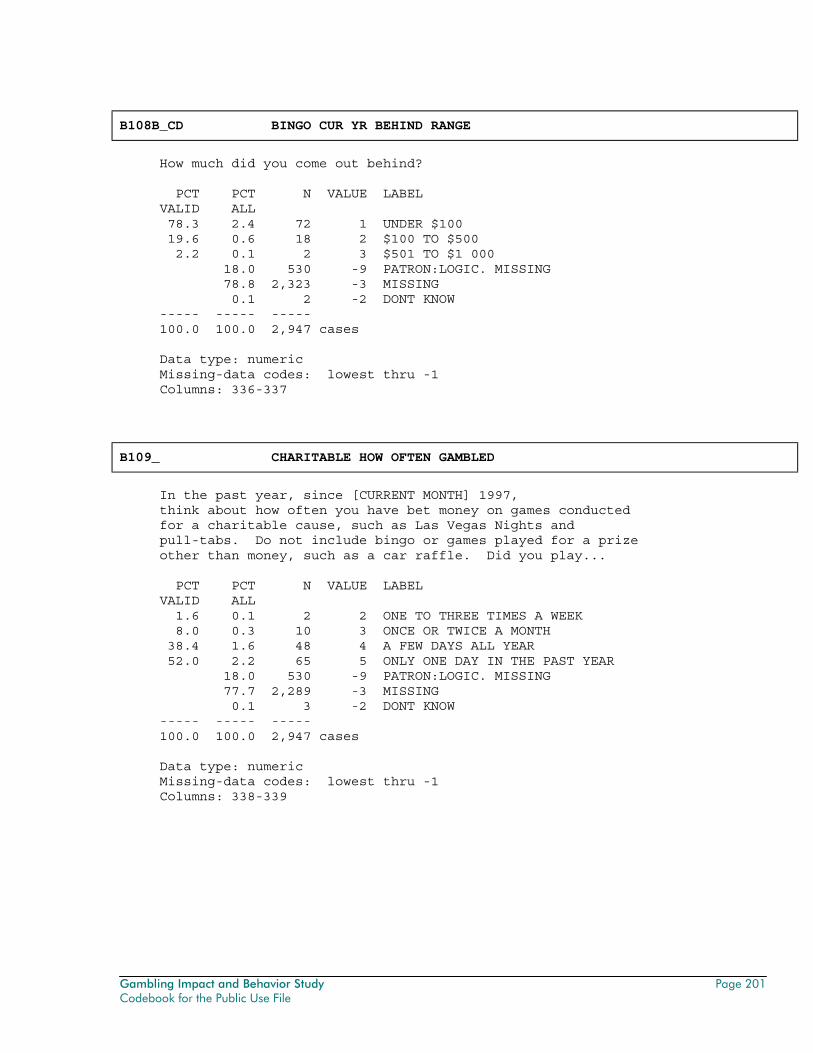
Gambling Impact and Behavior Study Page 201 Codebook for the Public Use File
B108B_CD BINGO CUR YR BEHIND RANGE
How much did you come out behind? PCT PCT N VALUE LABEL VALID ALL 78.3 2.4 72 1 UNDER $100 19.6 0.6 18 2 $100 TO $500 2.2 0.1 2 3 $501 TO $1 000 18.0 530 -9 PATRON:LOGIC. MISSING 78.8 2,323 -3 MISSING 0.1 2 -2 DONT KNOW ----- ----- ----- 100.0 100.0 2,947 cases Data type: numeric Missing-data codes: lowest thru -1 Columns: 336-337
B109_ CHARITABLE HOW OFTEN GAMBLED
In the past year, since [CURRENT MONTH] 1997, think about how often you have bet money on games conducted for a charitable cause, such as Las Vegas Nights and pull-tabs. Do not include bingo or games played for a prize other than money, such as a car raffle. Did you play... PCT PCT N VALUE LABEL VALID ALL 1.6 0.1 2 2 ONE TO THREE TIMES A WEEK 8.0 0.3 10 3 ONCE OR TWICE A MONTH 38.4 1.6 48 4 A FEW DAYS ALL YEAR 52.0 2.2 65 5 ONLY ONE DAY IN THE PAST YEAR 18.0 530 -9 PATRON:LOGIC. MISSING 77.7 2,289 -3 MISSING 0.1 3 -2 DONT KNOW ----- ----- ----- 100.0 100.0 2,947 cases Data type: numeric Missing-data codes: lowest thru -1 Columns: 338-339
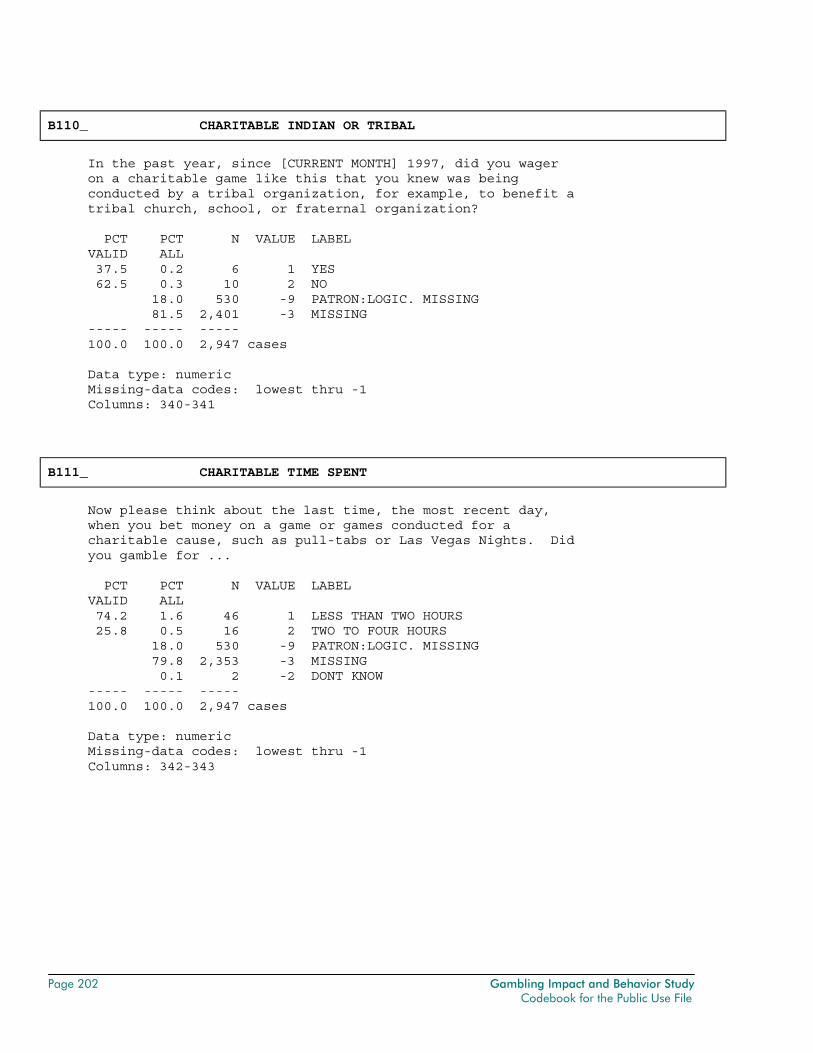
Page 202 Gambling Impact and Behavior Study Codebook for the Public Use File
B110_ CHARITABLE INDIAN OR TRIBAL
In the past year, since [CURRENT MONTH] 1997, did you wager on a charitable game like this that you knew was being conducted by a tribal organization, for example, to benefit a tribal church, school, or fraternal organization? PCT PCT N VALUE LABEL VALID ALL 37.5 0.2 6 1 YES 62.5 0.3 10 2 NO 18.0 530 -9 PATRON:LOGIC. MISSING 81.5 2,401 -3 MISSING ----- ----- ----- 100.0 100.0 2,947 cases Data type: numeric Missing-data codes: lowest thru -1 Columns: 340-341
B111_ CHARITABLE TIME SPENT
Now please think about the last time, the most recent day, when you bet money on a game or games conducted for a charitable cause, such as pull-tabs or Las Vegas Nights. Did you gamble for ... PCT PCT N VALUE LABEL VALID ALL 74.2 1.6 46 1 LESS THAN TWO HOURS 25.8 0.5 16 2 TWO TO FOUR HOURS 18.0 530 -9 PATRON:LOGIC. MISSING 79.8 2,353 -3 MISSING 0.1 2 -2 DONT KNOW ----- ----- ----- 100.0 100.0 2,947 cases Data type: numeric Missing-data codes: lowest thru -1 Columns: 342-343
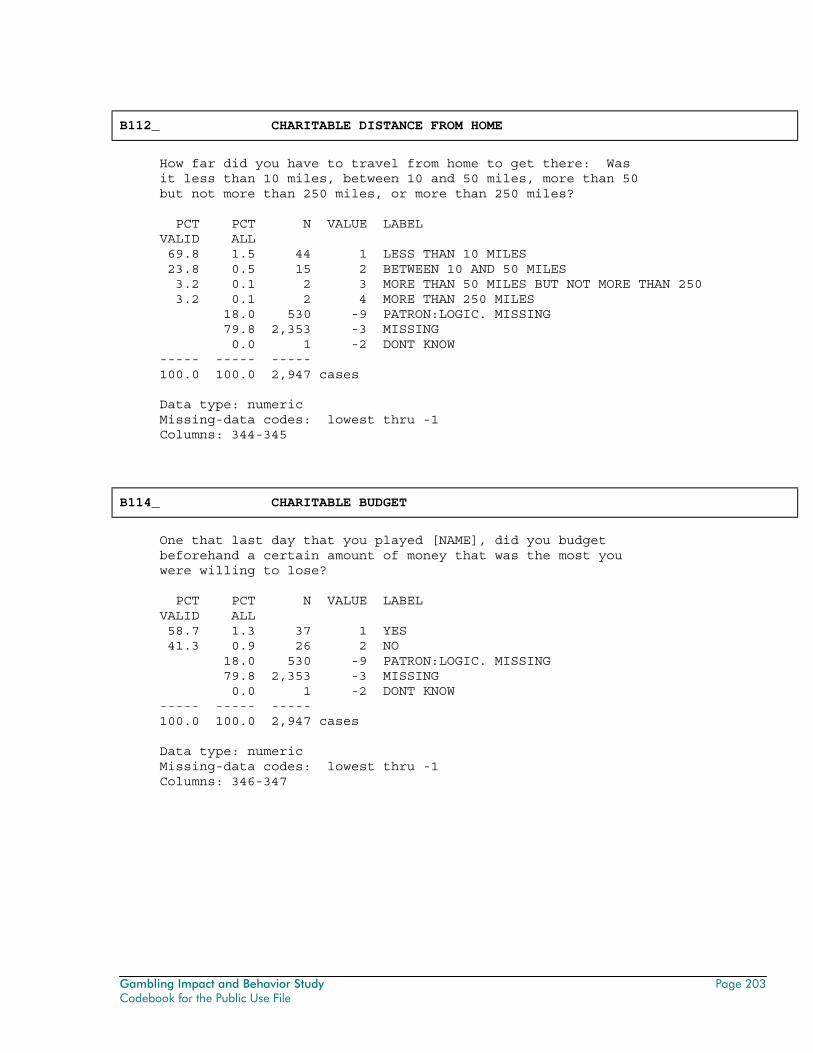
Gambling Impact and Behavior Study Page 203 Codebook for the Public Use File
B112_ CHARITABLE DISTANCE FROM HOME
How far did you have to travel from home to get there: Was it less than 10 miles, between 10 and 50 miles, more than 50 but not more than 250 miles, or more than 250 miles? PCT PCT N VALUE LABEL VALID ALL 69.8 1.5 44 1 LESS THAN 10 MILES 23.8 0.5 15 2 BETWEEN 10 AND 50 MILES 3.2 0.1 2 3 MORE THAN 50 MILES BUT NOT MORE THAN 250 3.2 0.1 2 4 MORE THAN 250 MILES 18.0 530 -9 PATRON:LOGIC. MISSING 79.8 2,353 -3 MISSING 0.0 1 -2 DONT KNOW ----- ----- ----- 100.0 100.0 2,947 cases Data type: numeric Missing-data codes: lowest thru -1 Columns: 344-345
B114_ CHARITABLE BUDGET
One that last day that you played [NAME], did you budget beforehand a certain amount of money that was the most you were willing to lose? PCT PCT N VALUE LABEL VALID ALL 58.7 1.3 37 1 YES 41.3 0.9 26 2 NO 18.0 530 -9 PATRON:LOGIC. MISSING 79.8 2,353 -3 MISSING 0.0 1 -2 DONT KNOW ----- ----- ----- 100.0 100.0 2,947 cases Data type: numeric Missing-data codes: lowest thru -1 Columns: 346-347
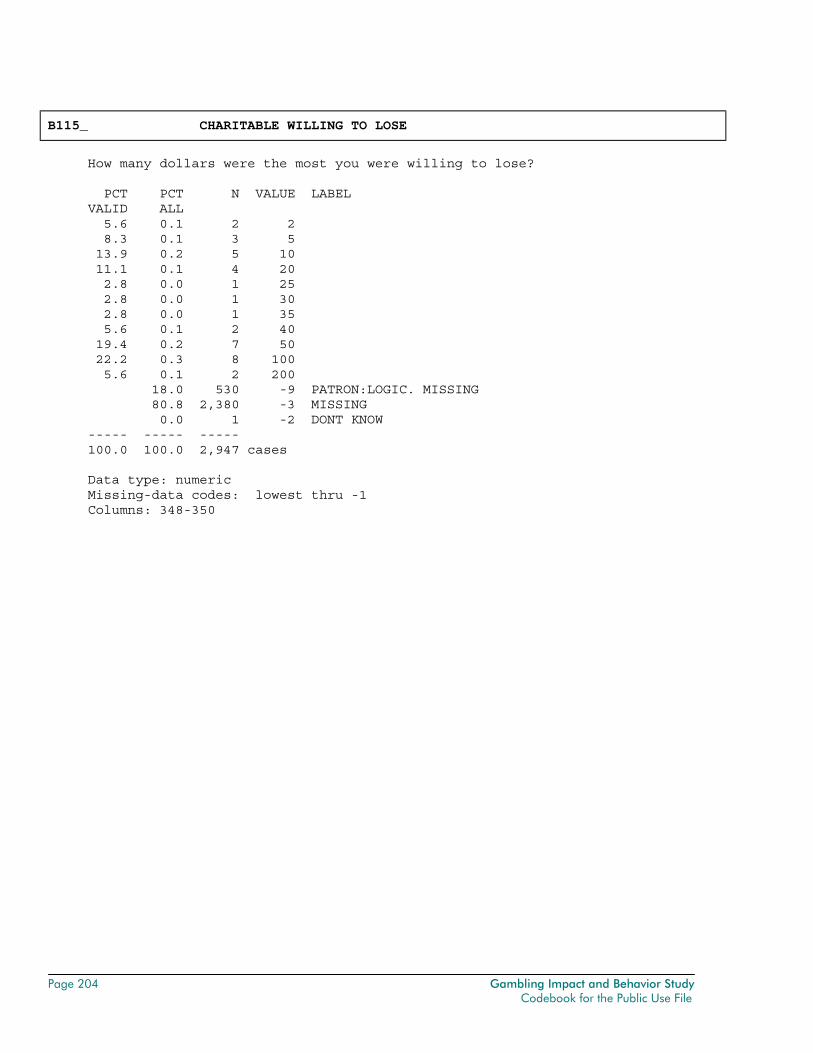
Page 204 Gambling Impact and Behavior Study Codebook for the Public Use File
B115_ CHARITABLE WILLING TO LOSE
How many dollars were the most you were willing to lose? PCT PCT N VALUE LABEL VALID ALL 5.6 0.1 2 2 8.3 0.1 3 5 13.9 0.2 5 10 11.1 0.1 4 20 2.8 0.0 1 25 2.8 0.0 1 30 2.8 0.0 1 35 5.6 0.1 2 40 19.4 0.2 7 50 22.2 0.3 8 100 5.6 0.1 2 200 18.0 530 -9 PATRON:LOGIC. MISSING 80.8 2,380 -3 MISSING 0.0 1 -2 DONT KNOW ----- ----- ----- 100.0 100.0 2,947 cases Data type: numeric Missing-data codes: lowest thru -1 Columns: 348-350
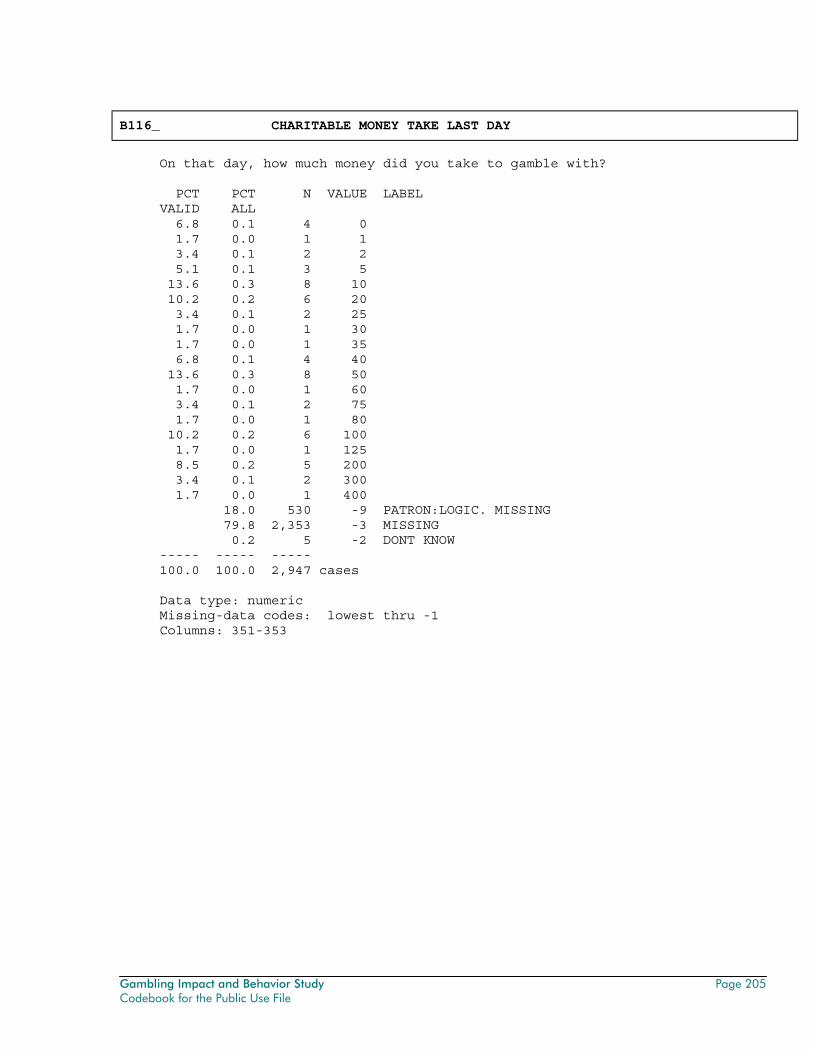
Gambling Impact and Behavior Study Page 205 Codebook for the Public Use File
B116_ CHARITABLE MONEY TAKE LAST DAY
On that day, how much money did you take to gamble with? PCT PCT N VALUE LABEL VALID ALL 6.8 0.1 4 0 1.7 0.0 1 1 3.4 0.1 2 2 5.1 0.1 3 5 13.6 0.3 8 10 10.2 0.2 6 20 3.4 0.1 2 25 1.7 0.0 1 30 1.7 0.0 1 35 6.8 0.1 4 40 13.6 0.3 8 50 1.7 0.0 1 60 3.4 0.1 2 75 1.7 0.0 1 80 10.2 0.2 6 100 1.7 0.0 1 125 8.5 0.2 5 200 3.4 0.1 2 300 1.7 0.0 1 400 18.0 530 -9 PATRON:LOGIC. MISSING 79.8 2,353 -3 MISSING 0.2 5 -2 DONT KNOW ----- ----- ----- 100.0 100.0 2,947 cases Data type: numeric Missing-data codes: lowest thru -1 Columns: 351-353
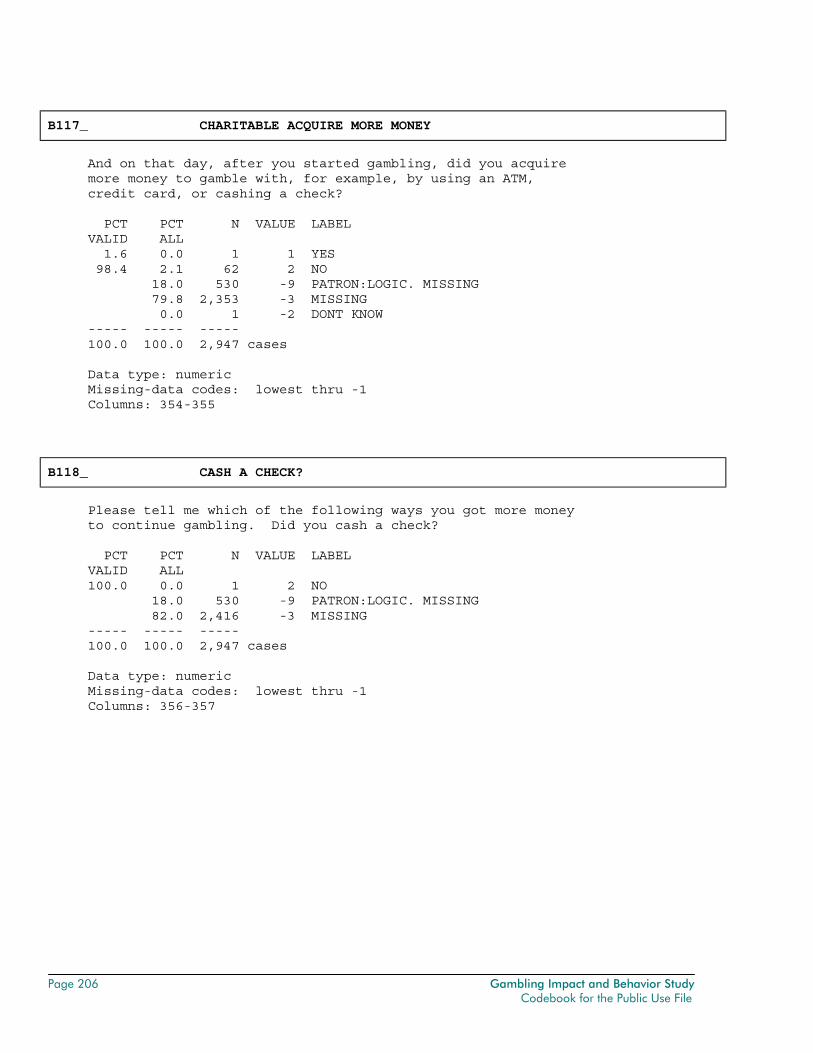
Page 206 Gambling Impact and Behavior Study Codebook for the Public Use File
B117_ CHARITABLE ACQUIRE MORE MONEY
And on that day, after you started gambling, did you acquire more money to gamble with, for example, by using an ATM, credit card, or cashing a check? PCT PCT N VALUE LABEL VALID ALL 1.6 0.0 1 1 YES 98.4 2.1 62 2 NO 18.0 530 -9 PATRON:LOGIC. MISSING 79.8 2,353 -3 MISSING 0.0 1 -2 DONT KNOW ----- ----- ----- 100.0 100.0 2,947 cases Data type: numeric Missing-data codes: lowest thru -1 Columns: 354-355
B118_ CASH A CHECK?
Please tell me which of the following ways you got more money to continue gambling. Did you cash a check? PCT PCT N VALUE LABEL VALID ALL 100.0 0.0 1 2 NO 18.0 530 -9 PATRON:LOGIC. MISSING 82.0 2,416 -3 MISSING ----- ----- ----- 100.0 100.0 2,947 cases Data type: numeric Missing-data codes: lowest thru -1 Columns: 356-357
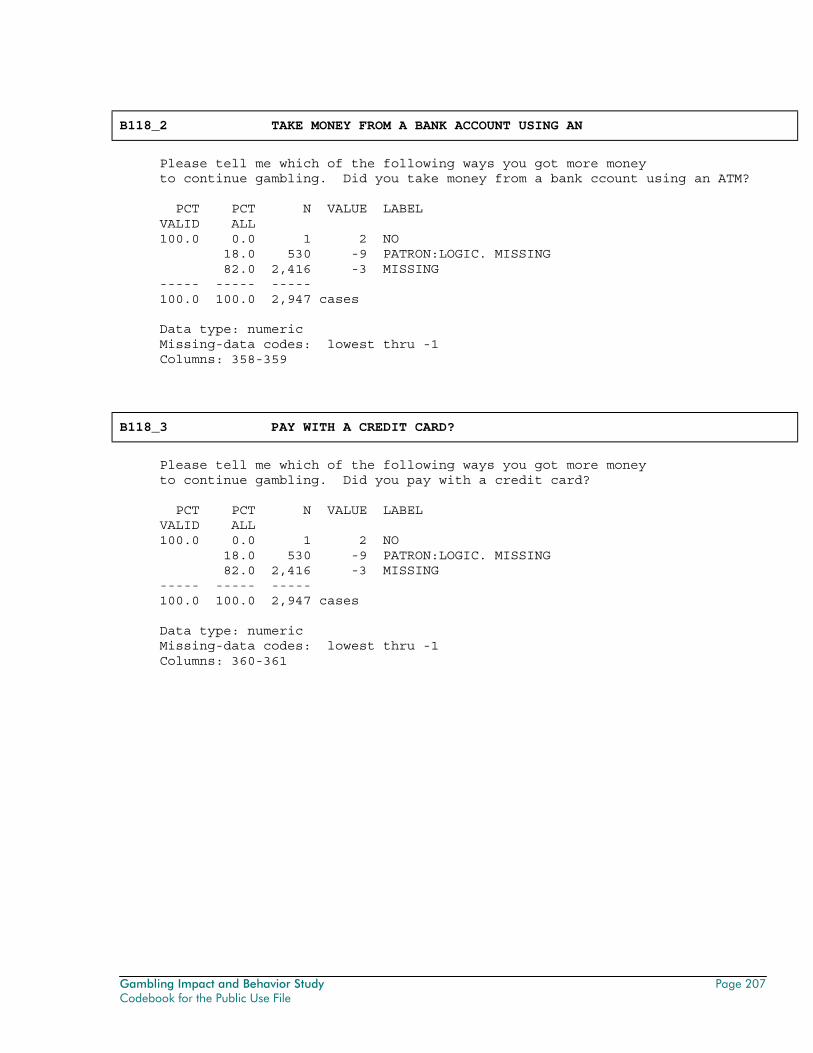
Gambling Impact and Behavior Study Page 207 Codebook for the Public Use File
B118_2 TAKE MONEY FROM A BANK ACCOUNT USING AN
Please tell me which of the following ways you got more money to continue gambling. Did you take money from a bank ccount using an ATM? PCT PCT N VALUE LABEL VALID ALL 100.0 0.0 1 2 NO 18.0 530 -9 PATRON:LOGIC. MISSING 82.0 2,416 -3 MISSING ----- ----- ----- 100.0 100.0 2,947 cases Data type: numeric Missing-data codes: lowest thru -1 Columns: 358-359
B118_3 PAY WITH A CREDIT CARD?
Please tell me which of the following ways you got more money to continue gambling. Did you pay with a credit card? PCT PCT N VALUE LABEL VALID ALL 100.0 0.0 1 2 NO 18.0 530 -9 PATRON:LOGIC. MISSING 82.0 2,416 -3 MISSING ----- ----- ----- 100.0 100.0 2,947 cases Data type: numeric Missing-data codes: lowest thru -1 Columns: 360-361

Page 208 Gambling Impact and Behavior Study Codebook for the Public Use File
B118_4 GET A CREDIT CARD CASH ADVANCE?
Please tell me which of the following ways you got more money to continue gambling. Did you get a credit card cash advance? PCT PCT N VALUE LABEL VALID ALL 100.0 0.0 1 2 NO 18.0 530 -9 PATRON:LOGIC. MISSING 82.0 2,416 -3 MISSING ----- ----- ----- 100.0 100.0 2,947 cases Data type: numeric Missing-data codes: lowest thru -1 Columns: 362-363
B118_5 BORROW MONEY FROM A FAMILY MEMBER OR FRI
Please tell me which of the following ways you got more money to continue gambling. Did you borrow money from a family member or friend? PCT PCT N VALUE LABEL VALID ALL 100.0 0.0 1 1 YES 18.0 530 -9 PATRON:LOGIC. MISSING 82.0 2,416 -3 MISSING ----- ----- ----- 100.0 100.0 2,947 cases Data type: numeric Missing-data codes: lowest thru -1 Columns: 364-365
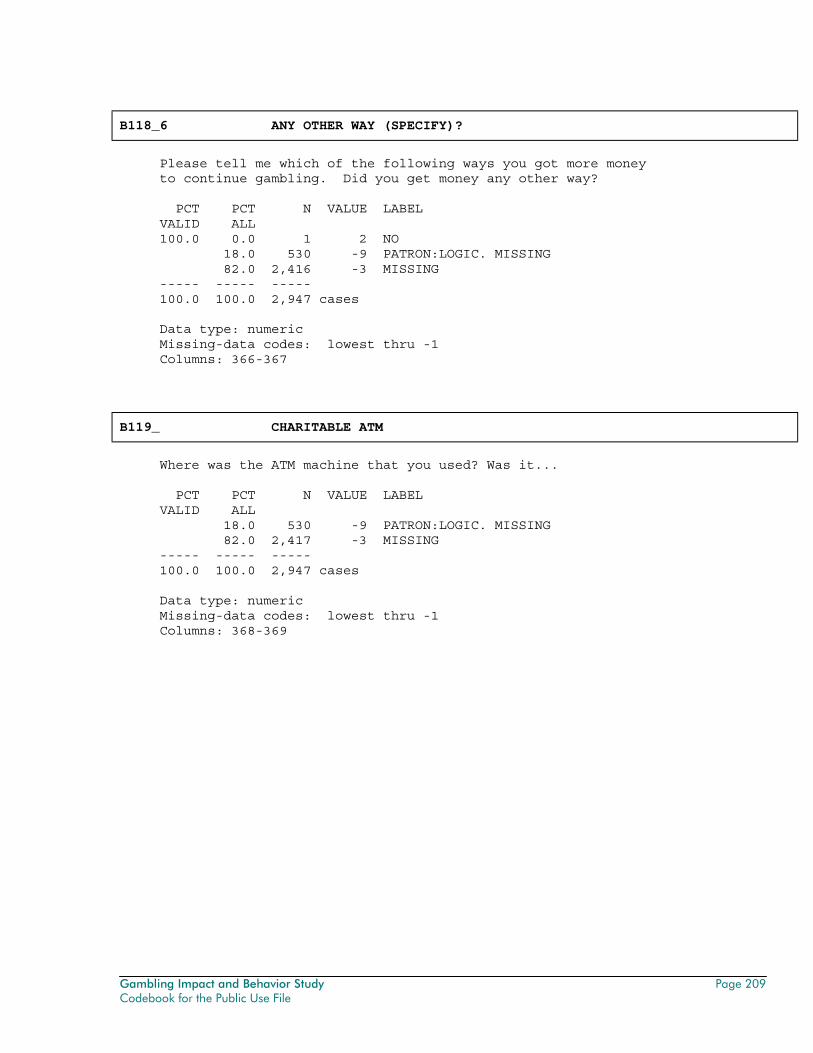
Gambling Impact and Behavior Study Page 209 Codebook for the Public Use File
B118_6 ANY OTHER WAY (SPECIFY)?
Please tell me which of the following ways you got more money to continue gambling. Did you get money any other way? PCT PCT N VALUE LABEL VALID ALL 100.0 0.0 1 2 NO 18.0 530 -9 PATRON:LOGIC. MISSING 82.0 2,416 -3 MISSING ----- ----- ----- 100.0 100.0 2,947 cases Data type: numeric Missing-data codes: lowest thru -1 Columns: 366-367
B119_ CHARITABLE ATM
Where was the ATM machine that you used? Was it... PCT PCT N VALUE LABEL VALID ALL 18.0 530 -9 PATRON:LOGIC. MISSING 82.0 2,417 -3 MISSING ----- ----- ----- 100.0 100.0 2,947 cases Data type: numeric Missing-data codes: lowest thru -1 Columns: 368-369
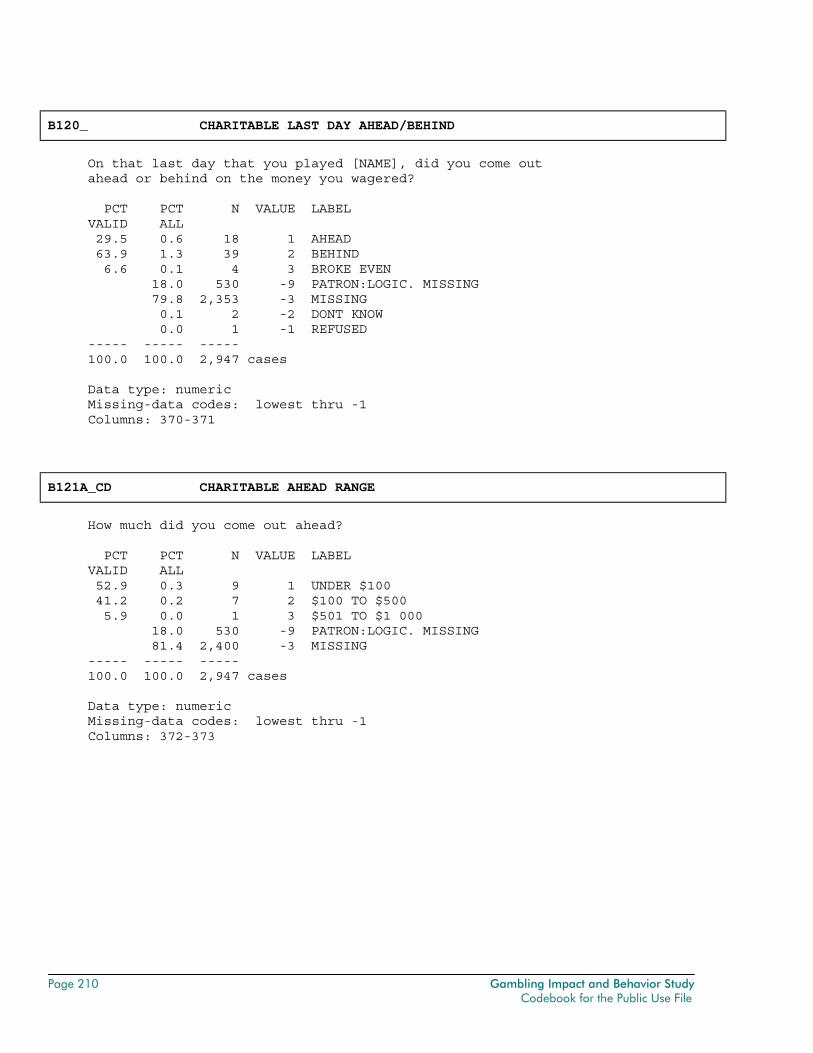
Page 210 Gambling Impact and Behavior Study Codebook for the Public Use File
B120_ CHARITABLE LAST DAY AHEAD/BEHIND
On that last day that you played [NAME], did you come out ahead or behind on the money you wagered? PCT PCT N VALUE LABEL VALID ALL 29.5 0.6 18 1 AHEAD 63.9 1.3 39 2 BEHIND 6.6 0.1 4 3 BROKE EVEN 18.0 530 -9 PATRON:LOGIC. MISSING 79.8 2,353 -3 MISSING 0.1 2 -2 DONT KNOW 0.0 1 -1 REFUSED ----- ----- ----- 100.0 100.0 2,947 cases Data type: numeric Missing-data codes: lowest thru -1 Columns: 370-371
B121A_CD CHARITABLE AHEAD RANGE
How much did you come out ahead? PCT PCT N VALUE LABEL VALID ALL 52.9 0.3 9 1 UNDER $100 41.2 0.2 7 2 $100 TO $500 5.9 0.0 1 3 $501 TO $1 000 18.0 530 -9 PATRON:LOGIC. MISSING 81.4 2,400 -3 MISSING ----- ----- ----- 100.0 100.0 2,947 cases Data type: numeric Missing-data codes: lowest thru -1 Columns: 372-373
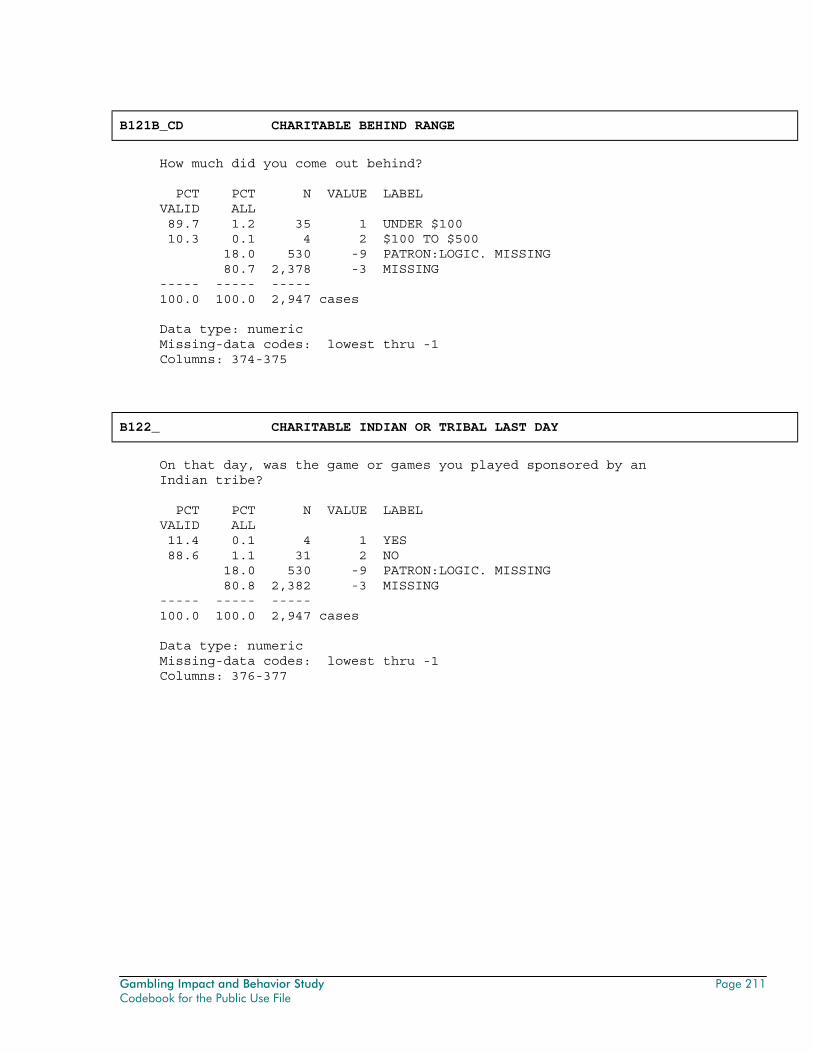
Gambling Impact and Behavior Study Page 211 Codebook for the Public Use File
B121B_CD CHARITABLE BEHIND RANGE
How much did you come out behind? PCT PCT N VALUE LABEL VALID ALL 89.7 1.2 35 1 UNDER $100 10.3 0.1 4 2 $100 TO $500 18.0 530 -9 PATRON:LOGIC. MISSING 80.7 2,378 -3 MISSING ----- ----- ----- 100.0 100.0 2,947 cases Data type: numeric Missing-data codes: lowest thru -1 Columns: 374-375
B122_ CHARITABLE INDIAN OR TRIBAL LAST DAY
On that day, was the game or games you played sponsored by an Indian tribe? PCT PCT N VALUE LABEL VALID ALL 11.4 0.1 4 1 YES 88.6 1.1 31 2 NO 18.0 530 -9 PATRON:LOGIC. MISSING 80.8 2,382 -3 MISSING ----- ----- ----- 100.0 100.0 2,947 cases Data type: numeric Missing-data codes: lowest thru -1 Columns: 376-377
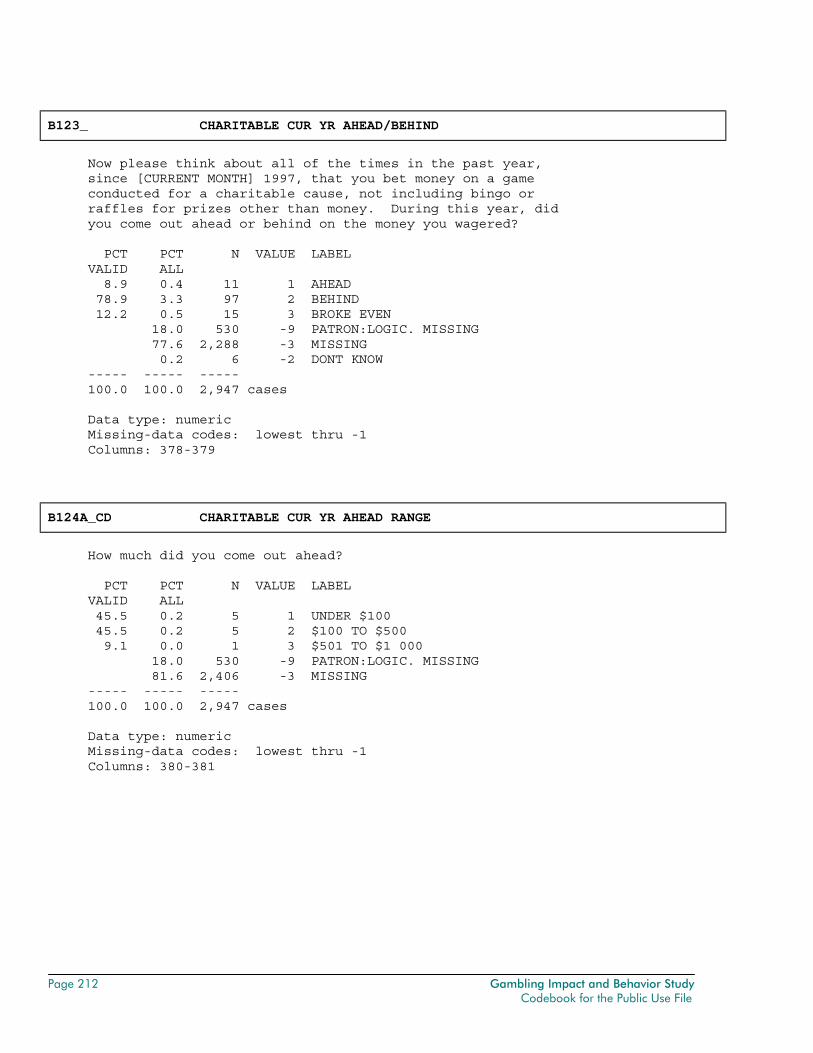
Page 212 Gambling Impact and Behavior Study Codebook for the Public Use File
B123_ CHARITABLE CUR YR AHEAD/BEHIND
Now please think about all of the times in the past year, since [CURRENT MONTH] 1997, that you bet money on a game conducted for a charitable cause, not including bingo or raffles for prizes other than money. During this year, did you come out ahead or behind on the money you wagered? PCT PCT N VALUE LABEL VALID ALL 8.9 0.4 11 1 AHEAD 78.9 3.3 97 2 BEHIND 12.2 0.5 15 3 BROKE EVEN 18.0 530 -9 PATRON:LOGIC. MISSING 77.6 2,288 -3 MISSING 0.2 6 -2 DONT KNOW ----- ----- ----- 100.0 100.0 2,947 cases Data type: numeric Missing-data codes: lowest thru -1 Columns: 378-379
B124A_CD CHARITABLE CUR YR AHEAD RANGE
How much did you come out ahead? PCT PCT N VALUE LABEL VALID ALL 45.5 0.2 5 1 UNDER $100 45.5 0.2 5 2 $100 TO $500 9.1 0.0 1 3 $501 TO $1 000 18.0 530 -9 PATRON:LOGIC. MISSING 81.6 2,406 -3 MISSING ----- ----- ----- 100.0 100.0 2,947 cases Data type: numeric Missing-data codes: lowest thru -1 Columns: 380-381
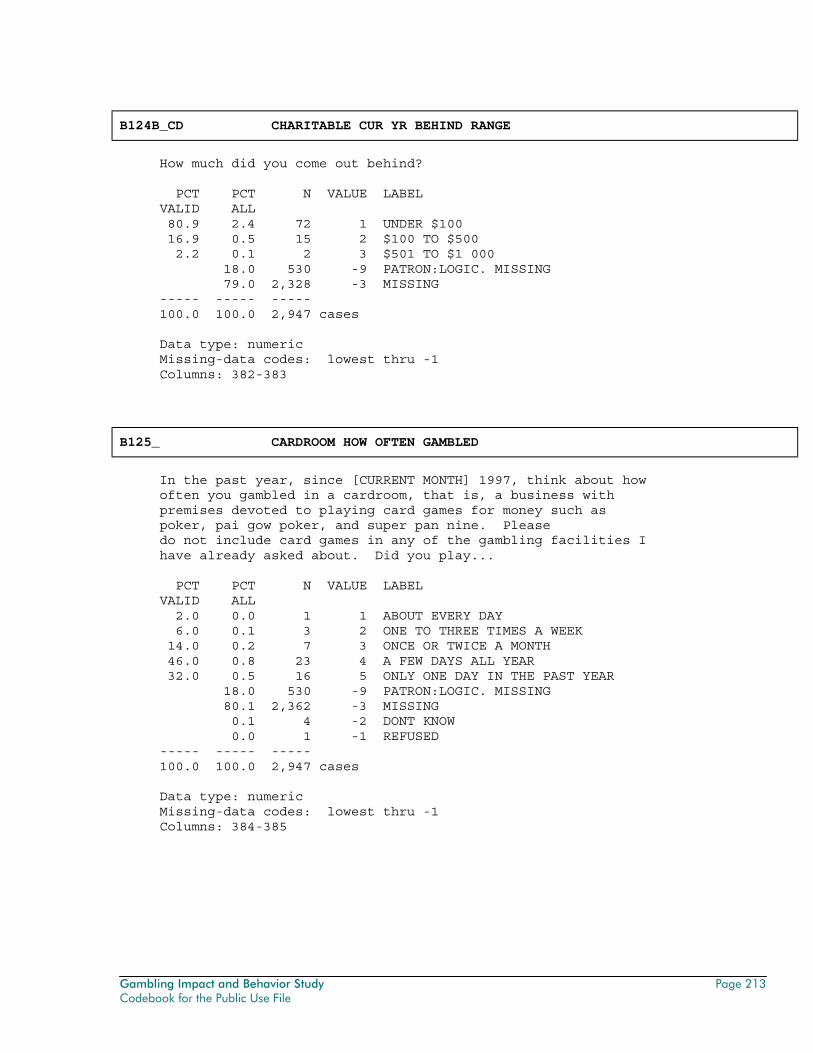
Gambling Impact and Behavior Study Page 213 Codebook for the Public Use File
B124B_CD CHARITABLE CUR YR BEHIND RANGE
How much did you come out behind? PCT PCT N VALUE LABEL VALID ALL 80.9 2.4 72 1 UNDER $100 16.9 0.5 15 2 $100 TO $500 2.2 0.1 2 3 $501 TO $1 000 18.0 530 -9 PATRON:LOGIC. MISSING 79.0 2,328 -3 MISSING ----- ----- ----- 100.0 100.0 2,947 cases Data type: numeric Missing-data codes: lowest thru -1 Columns: 382-383
B125_ CARDROOM HOW OFTEN GAMBLED
In the past year, since [CURRENT MONTH] 1997, think about how often you gambled in a cardroom, that is, a business with premises devoted to playing card games for money such as poker, pai gow poker, and super pan nine. Please do not include card games in any of the gambling facilities I have already asked about. Did you play... PCT PCT N VALUE LABEL VALID ALL 2.0 0.0 1 1 ABOUT EVERY DAY 6.0 0.1 3 2 ONE TO THREE TIMES A WEEK 14.0 0.2 7 3 ONCE OR TWICE A MONTH 46.0 0.8 23 4 A FEW DAYS ALL YEAR 32.0 0.5 16 5 ONLY ONE DAY IN THE PAST YEAR 18.0 530 -9 PATRON:LOGIC. MISSING 80.1 2,362 -3 MISSING 0.1 4 -2 DONT KNOW 0.0 1 -1 REFUSED ----- ----- ----- 100.0 100.0 2,947 cases Data type: numeric Missing-data codes: lowest thru -1 Columns: 384-385
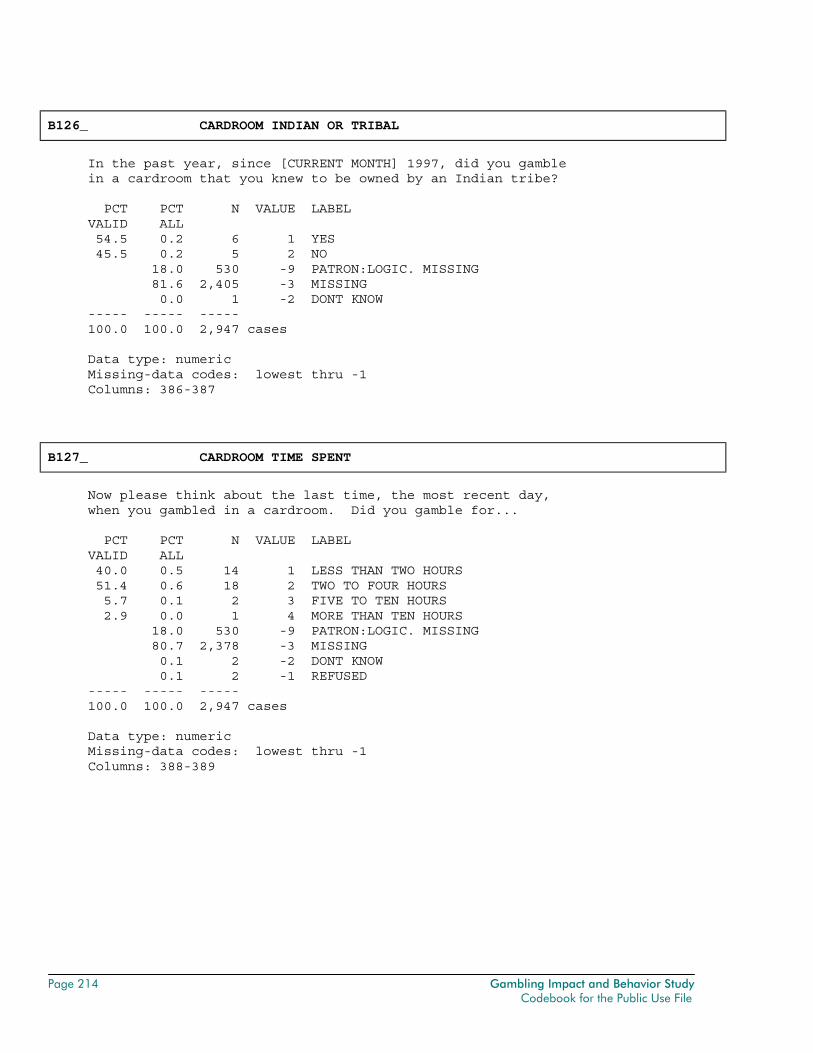
Page 214 Gambling Impact and Behavior Study Codebook for the Public Use File
B126_ CARDROOM INDIAN OR TRIBAL
In the past year, since [CURRENT MONTH] 1997, did you gamble in a cardroom that you knew to be owned by an Indian tribe? PCT PCT N VALUE LABEL VALID ALL 54.5 0.2 6 1 YES 45.5 0.2 5 2 NO 18.0 530 -9 PATRON:LOGIC. MISSING 81.6 2,405 -3 MISSING 0.0 1 -2 DONT KNOW ----- ----- ----- 100.0 100.0 2,947 cases Data type: numeric Missing-data codes: lowest thru -1 Columns: 386-387
B127_ CARDROOM TIME SPENT
Now please think about the last time, the most recent day, when you gambled in a cardroom. Did you gamble for... PCT PCT N VALUE LABEL VALID ALL 40.0 0.5 14 1 LESS THAN TWO HOURS 51.4 0.6 18 2 TWO TO FOUR HOURS 5.7 0.1 2 3 FIVE TO TEN HOURS 2.9 0.0 1 4 MORE THAN TEN HOURS 18.0 530 -9 PATRON:LOGIC. MISSING 80.7 2,378 -3 MISSING 0.1 2 -2 DONT KNOW 0.1 2 -1 REFUSED ----- ----- ----- 100.0 100.0 2,947 cases Data type: numeric Missing-data codes: lowest thru -1 Columns: 388-389
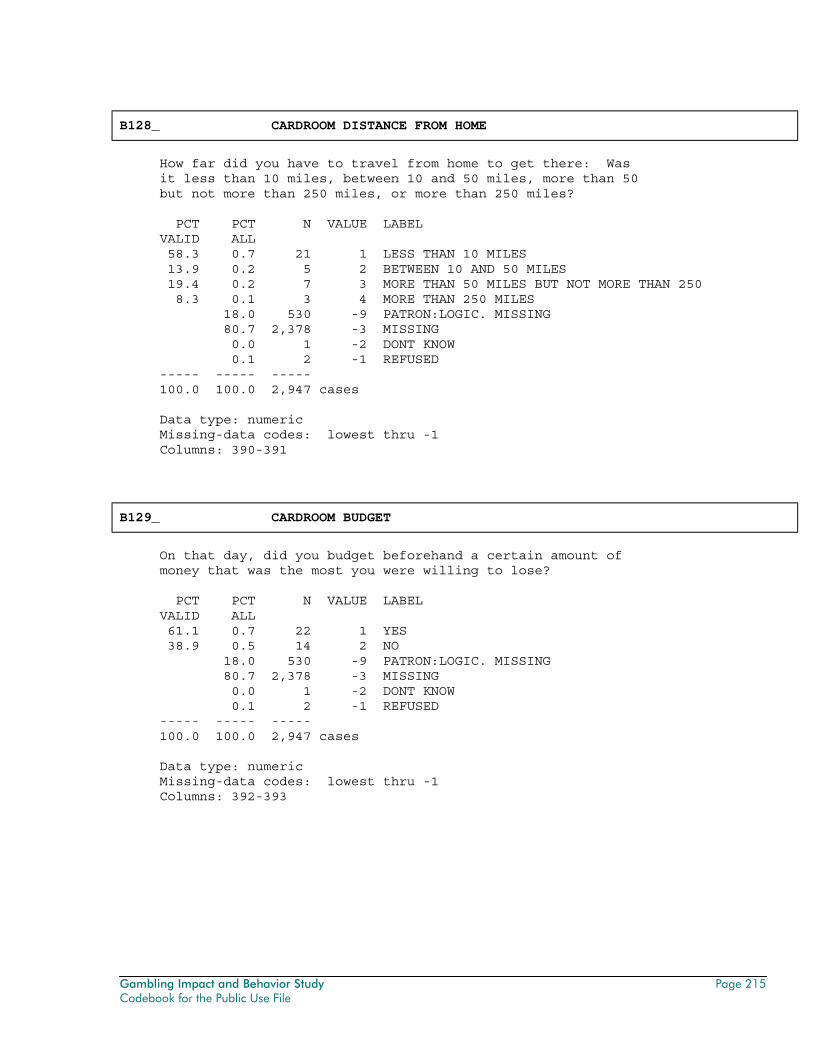
Gambling Impact and Behavior Study Page 215 Codebook for the Public Use File
B128_ CARDROOM DISTANCE FROM HOME
How far did you have to travel from home to get there: Was it less than 10 miles, between 10 and 50 miles, more than 50 but not more than 250 miles, or more than 250 miles? PCT PCT N VALUE LABEL VALID ALL 58.3 0.7 21 1 LESS THAN 10 MILES 13.9 0.2 5 2 BETWEEN 10 AND 50 MILES 19.4 0.2 7 3 MORE THAN 50 MILES BUT NOT MORE THAN 250 8.3 0.1 3 4 MORE THAN 250 MILES 18.0 530 -9 PATRON:LOGIC. MISSING 80.7 2,378 -3 MISSING 0.0 1 -2 DONT KNOW 0.1 2 -1 REFUSED ----- ----- ----- 100.0 100.0 2,947 cases Data type: numeric Missing-data codes: lowest thru -1 Columns: 390-391
B129_ CARDROOM BUDGET
On that day, did you budget beforehand a certain amount of money that was the most you were willing to lose? PCT PCT N VALUE LABEL VALID ALL 61.1 0.7 22 1 YES 38.9 0.5 14 2 NO 18.0 530 -9 PATRON:LOGIC. MISSING 80.7 2,378 -3 MISSING 0.0 1 -2 DONT KNOW 0.1 2 -1 REFUSED ----- ----- ----- 100.0 100.0 2,947 cases Data type: numeric Missing-data codes: lowest thru -1 Columns: 392-393
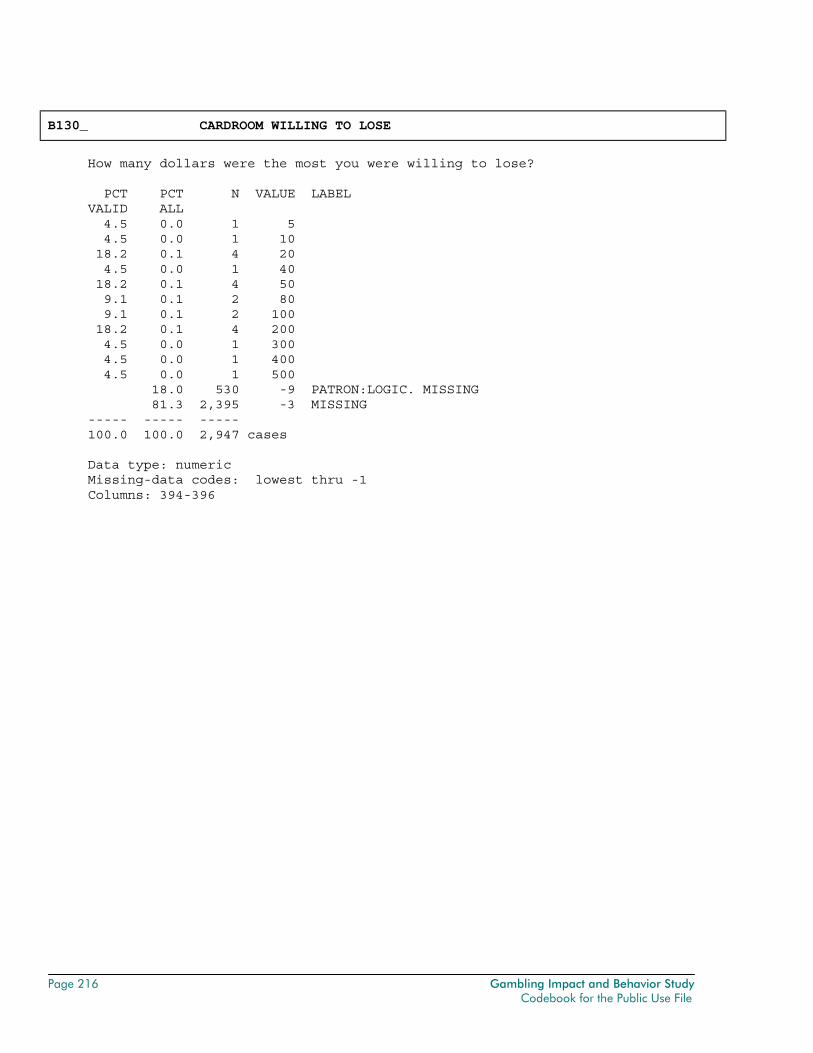
Page 216 Gambling Impact and Behavior Study Codebook for the Public Use File
B130_ CARDROOM WILLING TO LOSE
How many dollars were the most you were willing to lose? PCT PCT N VALUE LABEL VALID ALL 4.5 0.0 1 5 4.5 0.0 1 10 18.2 0.1 4 20 4.5 0.0 1 40 18.2 0.1 4 50 9.1 0.1 2 80 9.1 0.1 2 100 18.2 0.1 4 200 4.5 0.0 1 300 4.5 0.0 1 400 4.5 0.0 1 500 18.0 530 -9 PATRON:LOGIC. MISSING 81.3 2,395 -3 MISSING ----- ----- ----- 100.0 100.0 2,947 cases Data type: numeric Missing-data codes: lowest thru -1 Columns: 394-396
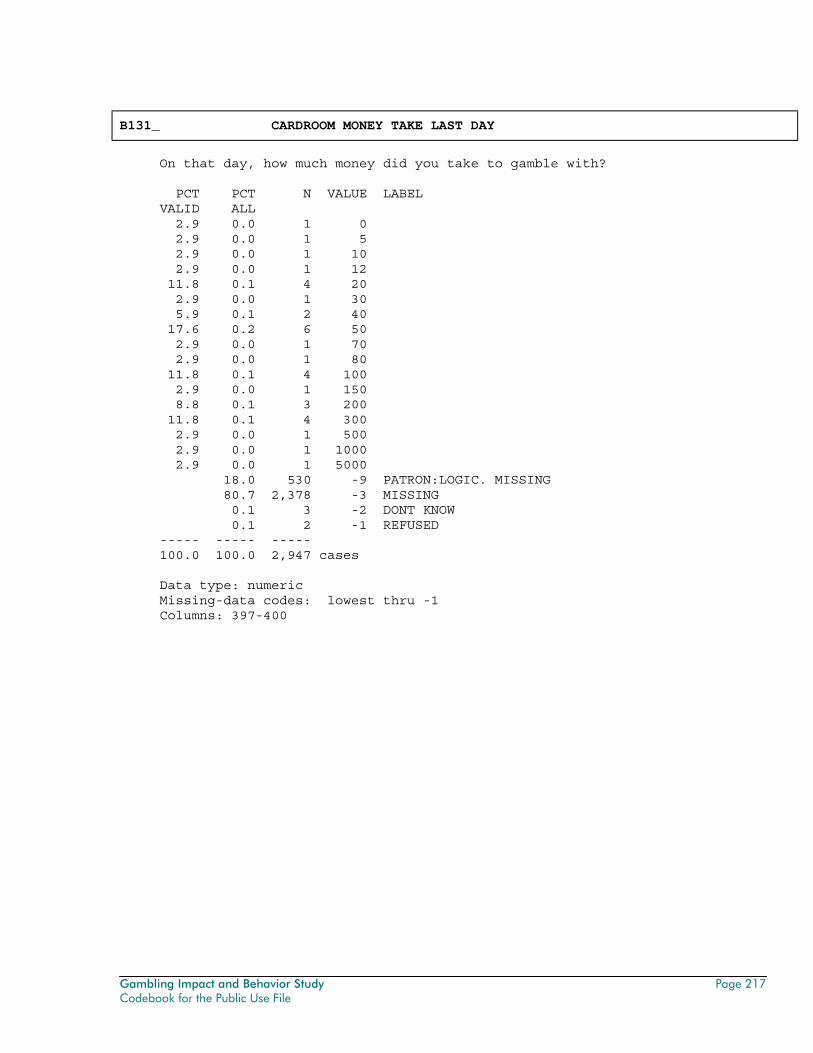
Gambling Impact and Behavior Study Page 217 Codebook for the Public Use File
B131_ CARDROOM MONEY TAKE LAST DAY
On that day, how much money did you take to gamble with? PCT PCT N VALUE LABEL VALID ALL 2.9 0.0 1 0 2.9 0.0 1 5 2.9 0.0 1 10 2.9 0.0 1 12 11.8 0.1 4 20 2.9 0.0 1 30 5.9 0.1 2 40 17.6 0.2 6 50 2.9 0.0 1 70 2.9 0.0 1 80 11.8 0.1 4 100 2.9 0.0 1 150 8.8 0.1 3 200 11.8 0.1 4 300 2.9 0.0 1 500 2.9 0.0 1 1000 2.9 0.0 1 5000 18.0 530 -9 PATRON:LOGIC. MISSING 80.7 2,378 -3 MISSING 0.1 3 -2 DONT KNOW 0.1 2 -1 REFUSED ----- ----- ----- 100.0 100.0 2,947 cases Data type: numeric Missing-data codes: lowest thru -1 Columns: 397-400
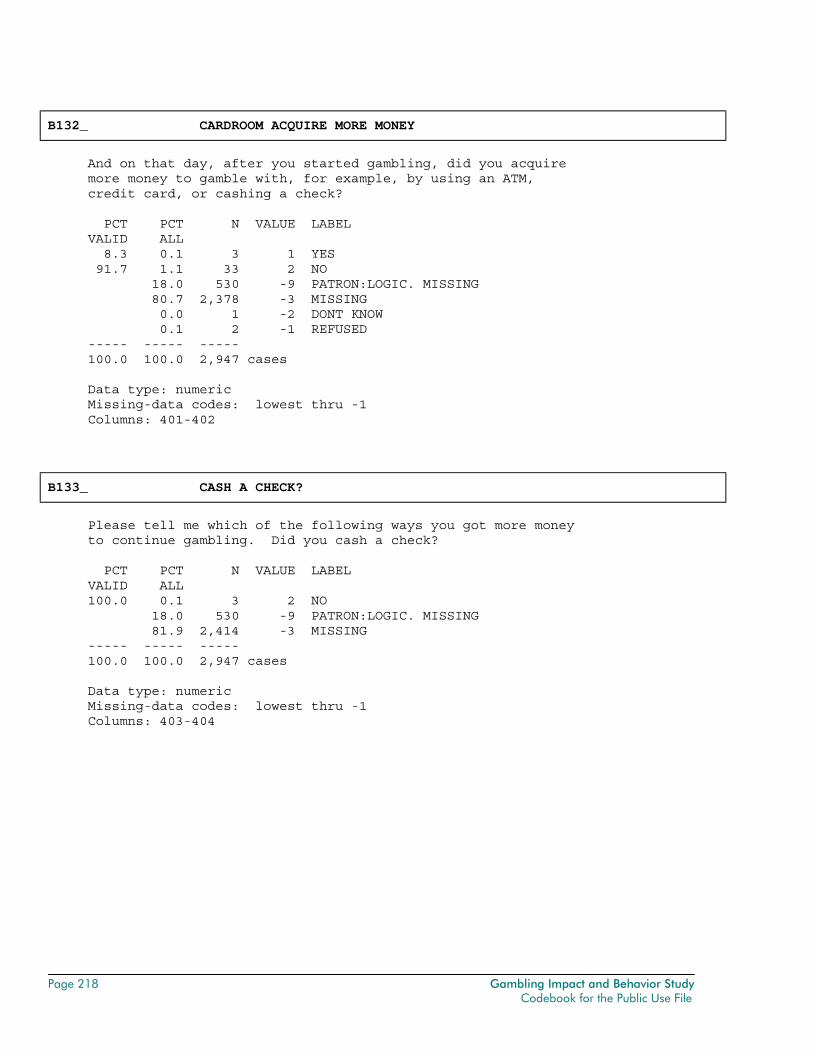
Page 218 Gambling Impact and Behavior Study Codebook for the Public Use File
B132_ CARDROOM ACQUIRE MORE MONEY
And on that day, after you started gambling, did you acquire more money to gamble with, for example, by using an ATM, credit card, or cashing a check? PCT PCT N VALUE LABEL VALID ALL 8.3 0.1 3 1 YES 91.7 1.1 33 2 NO 18.0 530 -9 PATRON:LOGIC. MISSING 80.7 2,378 -3 MISSING 0.0 1 -2 DONT KNOW 0.1 2 -1 REFUSED ----- ----- ----- 100.0 100.0 2,947 cases Data type: numeric Missing-data codes: lowest thru -1 Columns: 401-402
B133_ CASH A CHECK?
Please tell me which of the following ways you got more money to continue gambling. Did you cash a check? PCT PCT N VALUE LABEL VALID ALL 100.0 0.1 3 2 NO 18.0 530 -9 PATRON:LOGIC. MISSING 81.9 2,414 -3 MISSING ----- ----- ----- 100.0 100.0 2,947 cases Data type: numeric Missing-data codes: lowest thru -1 Columns: 403-404
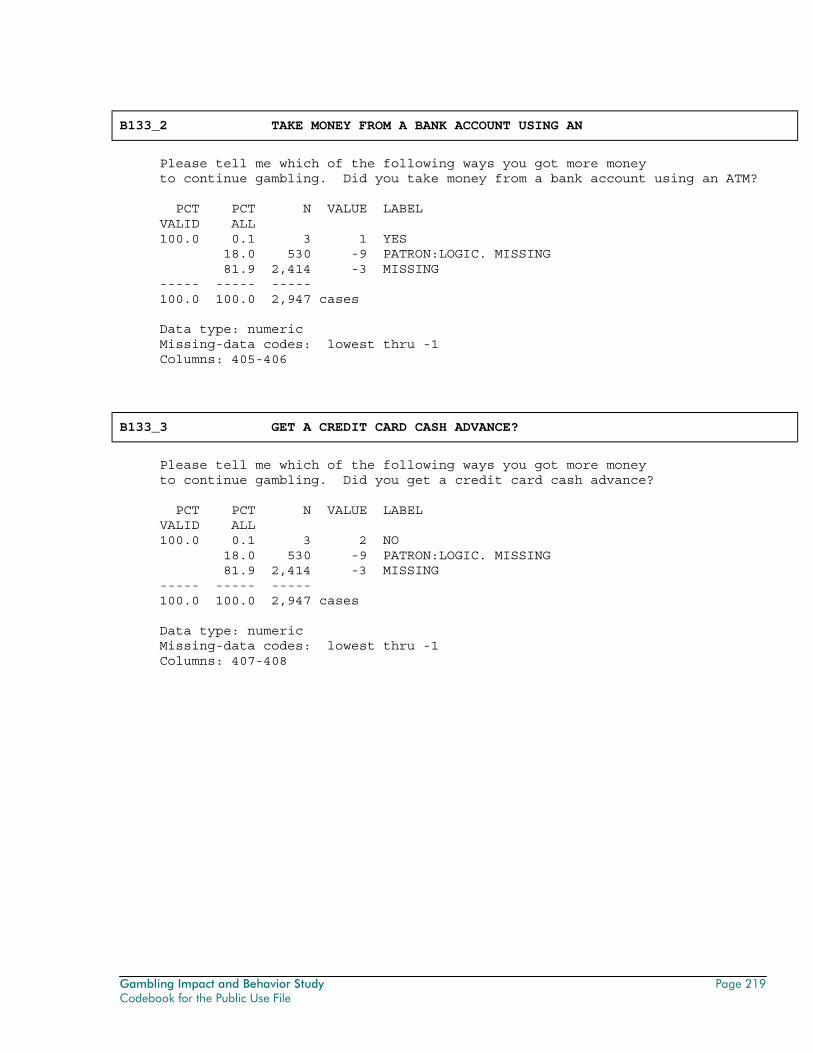
Gambling Impact and Behavior Study Page 219 Codebook for the Public Use File
B133_2 TAKE MONEY FROM A BANK ACCOUNT USING AN
Please tell me which of the following ways you got more money to continue gambling. Did you take money from a bank account using an ATM? PCT PCT N VALUE LABEL VALID ALL 100.0 0.1 3 1 YES 18.0 530 -9 PATRON:LOGIC. MISSING 81.9 2,414 -3 MISSING ----- ----- ----- 100.0 100.0 2,947 cases Data type: numeric Missing-data codes: lowest thru -1 Columns: 405-406
B133_3 GET A CREDIT CARD CASH ADVANCE?
Please tell me which of the following ways you got more money to continue gambling. Did you get a credit card cash advance? PCT PCT N VALUE LABEL VALID ALL 100.0 0.1 3 2 NO 18.0 530 -9 PATRON:LOGIC. MISSING 81.9 2,414 -3 MISSING ----- ----- ----- 100.0 100.0 2,947 cases Data type: numeric Missing-data codes: lowest thru -1 Columns: 407-408

Page 220 Gambling Impact and Behavior Study Codebook for the Public Use File
B133_4 PAY WITH A CREDIT CARD?
Please tell me which of the following ways you got more money to continue gambling. Did you pay with a credit card? PCT PCT N VALUE LABEL VALID ALL 100.0 0.1 3 2 NO 18.0 530 -9 PATRON:LOGIC. MISSING 81.9 2,414 -3 MISSING ----- ----- ----- 100.0 100.0 2,947 cases Data type: numeric Missing-data codes: lowest thru -1 Columns: 409-410
B133_5 USE A LINE OF CREDIT FROM THE FACILITY?
Please tell me which of the following ways you got more money to continue gambling. Did you use a line of credit from the facility? PCT PCT N VALUE LABEL VALID ALL 100.0 0.1 3 2 NO 18.0 530 -9 PATRON:LOGIC. MISSING 81.9 2,414 -3 MISSING ----- ----- ----- 100.0 100.0 2,947 cases Data type: numeric Missing-data codes: lowest thru -1 Columns: 411-412
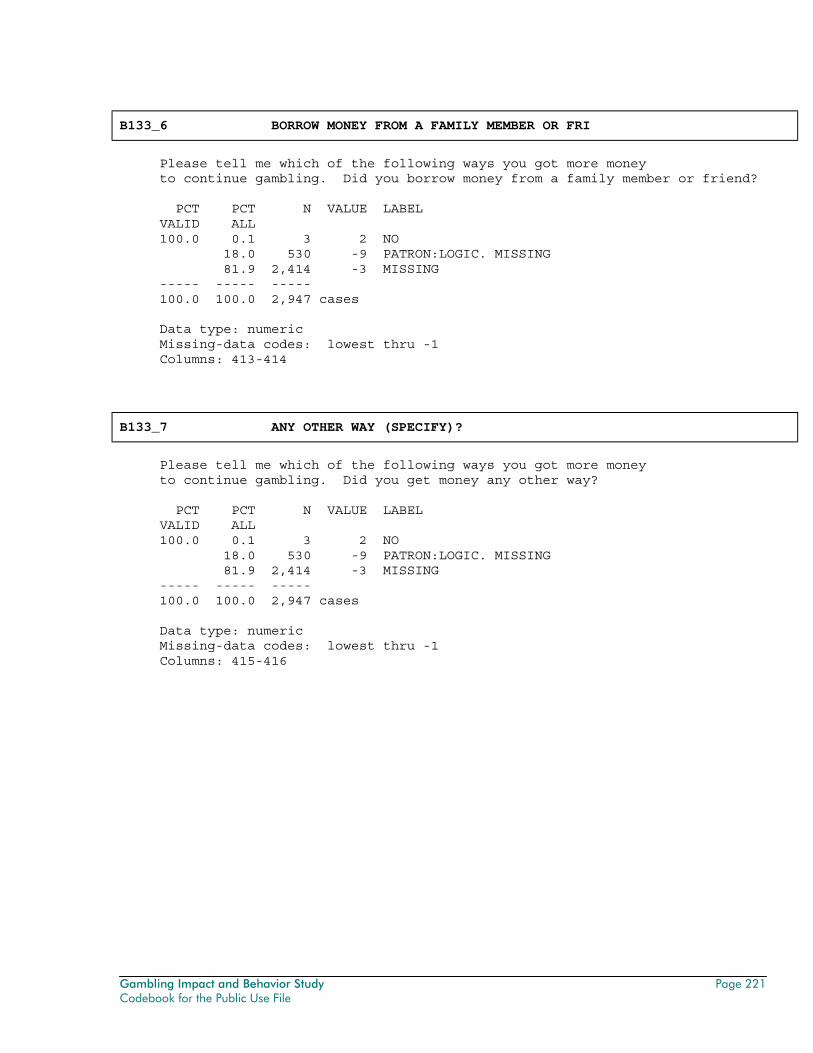
Gambling Impact and Behavior Study Page 221 Codebook for the Public Use File
B133_6 BORROW MONEY FROM A FAMILY MEMBER OR FRI
Please tell me which of the following ways you got more money to continue gambling. Did you borrow money from a family member or friend? PCT PCT N VALUE LABEL VALID ALL 100.0 0.1 3 2 NO 18.0 530 -9 PATRON:LOGIC. MISSING 81.9 2,414 -3 MISSING ----- ----- ----- 100.0 100.0 2,947 cases Data type: numeric Missing-data codes: lowest thru -1 Columns: 413-414
B133_7 ANY OTHER WAY (SPECIFY)?
Please tell me which of the following ways you got more money to continue gambling. Did you get money any other way? PCT PCT N VALUE LABEL VALID ALL 100.0 0.1 3 2 NO 18.0 530 -9 PATRON:LOGIC. MISSING 81.9 2,414 -3 MISSING ----- ----- ----- 100.0 100.0 2,947 cases Data type: numeric Missing-data codes: lowest thru -1 Columns: 415-416
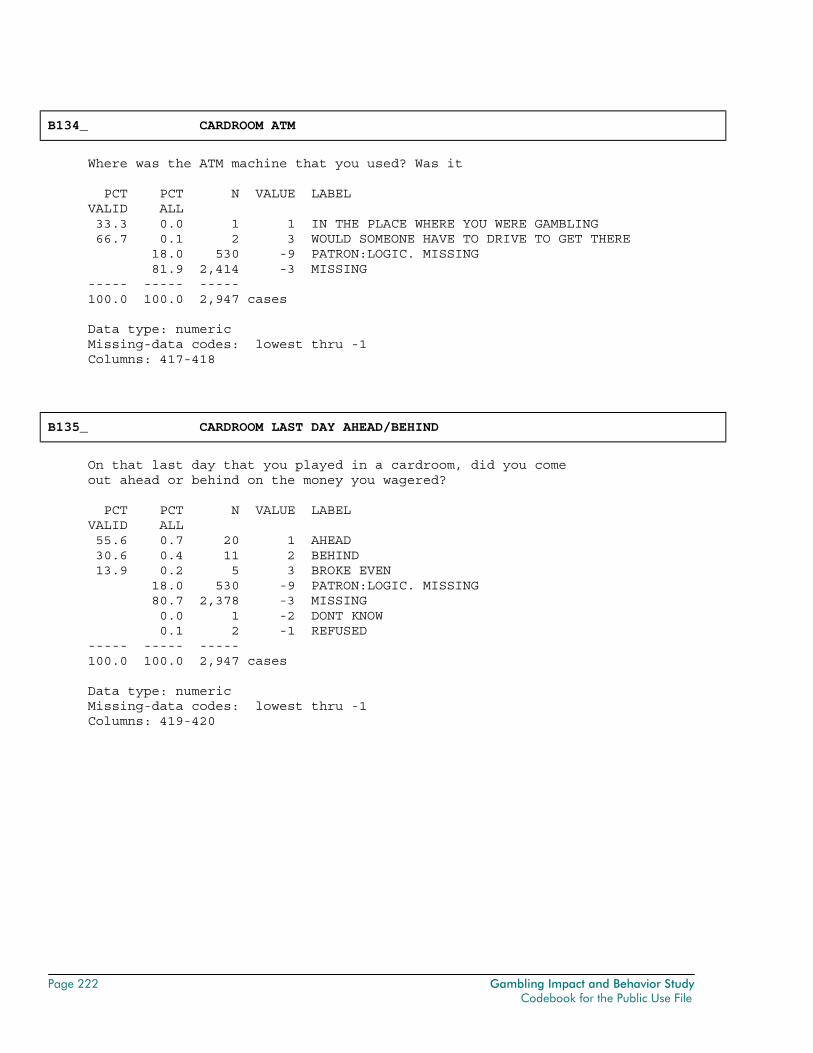
Page 222 Gambling Impact and Behavior Study Codebook for the Public Use File
B134_ CARDROOM ATM
Where was the ATM machine that you used? Was it PCT PCT N VALUE LABEL VALID ALL 33.3 0.0 1 1 IN THE PLACE WHERE YOU WERE GAMBLING 66.7 0.1 2 3 WOULD SOMEONE HAVE TO DRIVE TO GET THERE 18.0 530 -9 PATRON:LOGIC. MISSING 81.9 2,414 -3 MISSING ----- ----- ----- 100.0 100.0 2,947 cases Data type: numeric Missing-data codes: lowest thru -1 Columns: 417-418
B135_ CARDROOM LAST DAY AHEAD/BEHIND
On that last day that you played in a cardroom, did you come out ahead or behind on the money you wagered? PCT PCT N VALUE LABEL VALID ALL 55.6 0.7 20 1 AHEAD 30.6 0.4 11 2 BEHIND 13.9 0.2 5 3 BROKE EVEN 18.0 530 -9 PATRON:LOGIC. MISSING 80.7 2,378 -3 MISSING 0.0 1 -2 DONT KNOW 0.1 2 -1 REFUSED ----- ----- ----- 100.0 100.0 2,947 cases Data type: numeric Missing-data codes: lowest thru -1 Columns: 419-420
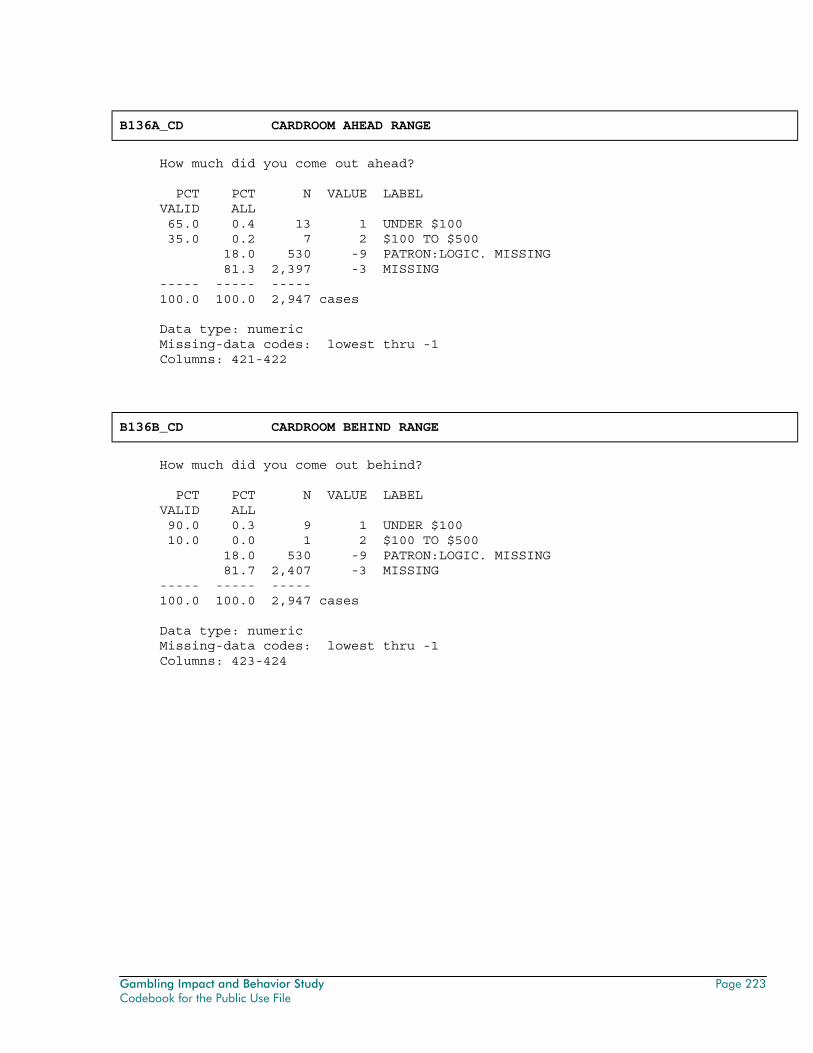
Gambling Impact and Behavior Study Page 223 Codebook for the Public Use File
B136A_CD CARDROOM AHEAD RANGE
How much did you come out ahead? PCT PCT N VALUE LABEL VALID ALL 65.0 0.4 13 1 UNDER $100 35.0 0.2 7 2 $100 TO $500 18.0 530 -9 PATRON:LOGIC. MISSING 81.3 2,397 -3 MISSING ----- ----- ----- 100.0 100.0 2,947 cases Data type: numeric Missing-data codes: lowest thru -1 Columns: 421-422
B136B_CD CARDROOM BEHIND RANGE
How much did you come out behind? PCT PCT N VALUE LABEL VALID ALL 90.0 0.3 9 1 UNDER $100 10.0 0.0 1 2 $100 TO $500 18.0 530 -9 PATRON:LOGIC. MISSING 81.7 2,407 -3 MISSING ----- ----- ----- 100.0 100.0 2,947 cases Data type: numeric Missing-data codes: lowest thru -1 Columns: 423-424
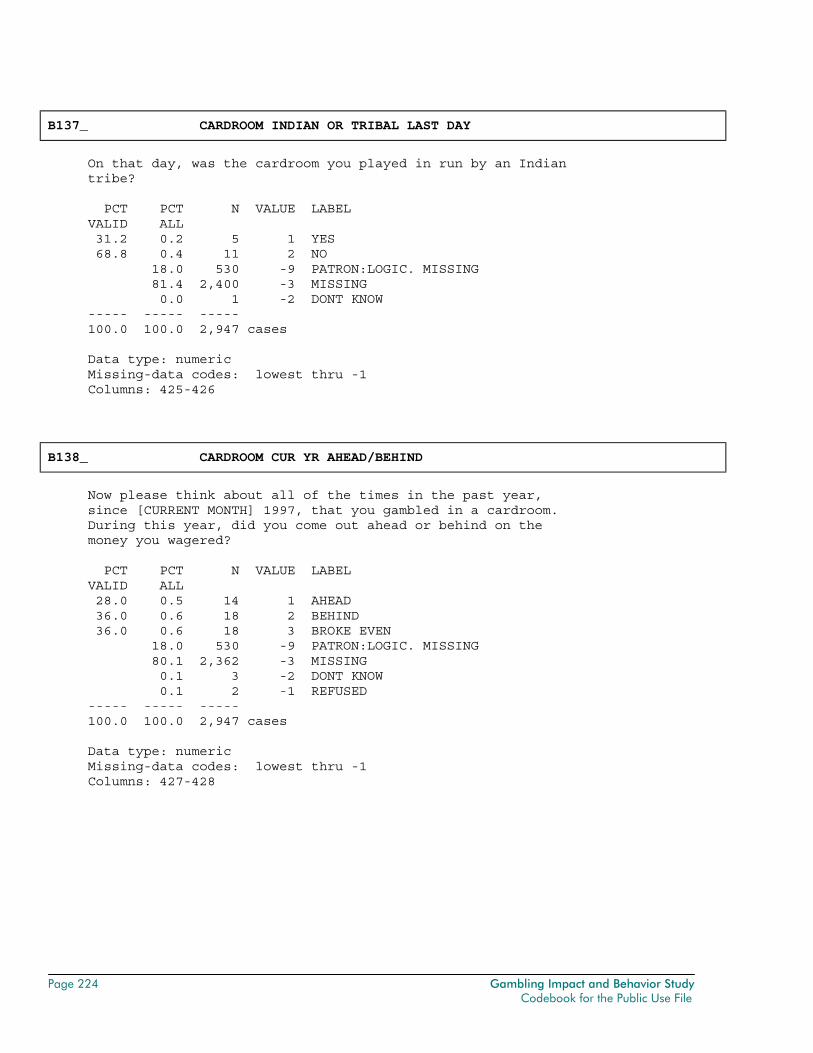
Page 224 Gambling Impact and Behavior Study Codebook for the Public Use File
B137_ CARDROOM INDIAN OR TRIBAL LAST DAY
On that day, was the cardroom you played in run by an Indian tribe? PCT PCT N VALUE LABEL VALID ALL 31.2 0.2 5 1 YES 68.8 0.4 11 2 NO 18.0 530 -9 PATRON:LOGIC. MISSING 81.4 2,400 -3 MISSING 0.0 1 -2 DONT KNOW ----- ----- ----- 100.0 100.0 2,947 cases Data type: numeric Missing-data codes: lowest thru -1 Columns: 425-426
B138_ CARDROOM CUR YR AHEAD/BEHIND
Now please think about all of the times in the past year, since [CURRENT MONTH] 1997, that you gambled in a cardroom. During this year, did you come out ahead or behind on the money you wagered? PCT PCT N VALUE LABEL VALID ALL 28.0 0.5 14 1 AHEAD 36.0 0.6 18 2 BEHIND 36.0 0.6 18 3 BROKE EVEN 18.0 530 -9 PATRON:LOGIC. MISSING 80.1 2,362 -3 MISSING 0.1 3 -2 DONT KNOW 0.1 2 -1 REFUSED ----- ----- ----- 100.0 100.0 2,947 cases Data type: numeric Missing-data codes: lowest thru -1 Columns: 427-428
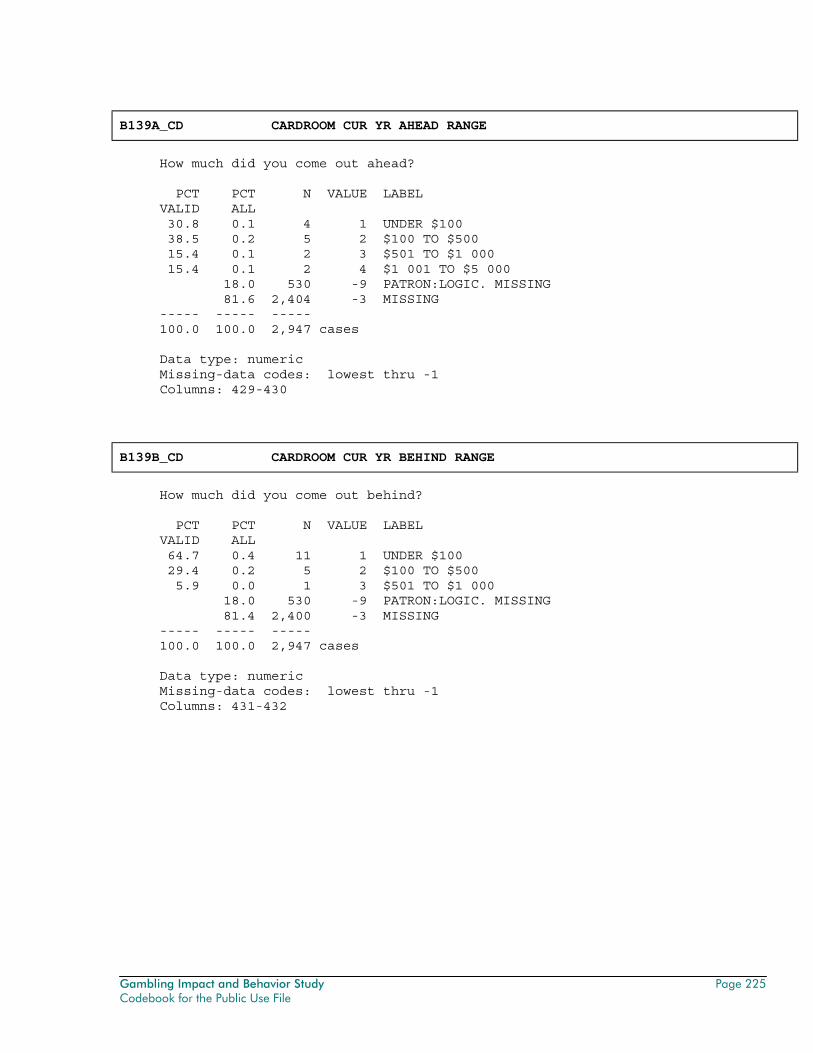
Gambling Impact and Behavior Study Page 225 Codebook for the Public Use File
B139A_CD CARDROOM CUR YR AHEAD RANGE
How much did you come out ahead? PCT PCT N VALUE LABEL VALID ALL 30.8 0.1 4 1 UNDER $100 38.5 0.2 5 2 $100 TO $500 15.4 0.1 2 3 $501 TO $1 000 15.4 0.1 2 4 $1 001 TO $5 000 18.0 530 -9 PATRON:LOGIC. MISSING 81.6 2,404 -3 MISSING ----- ----- ----- 100.0 100.0 2,947 cases Data type: numeric Missing-data codes: lowest thru -1 Columns: 429-430
B139B_CD CARDROOM CUR YR BEHIND RANGE
How much did you come out behind? PCT PCT N VALUE LABEL VALID ALL 64.7 0.4 11 1 UNDER $100 29.4 0.2 5 2 $100 TO $500 5.9 0.0 1 3 $501 TO $1 000 18.0 530 -9 PATRON:LOGIC. MISSING 81.4 2,400 -3 MISSING ----- ----- ----- 100.0 100.0 2,947 cases Data type: numeric Missing-data codes: lowest thru -1 Columns: 431-432
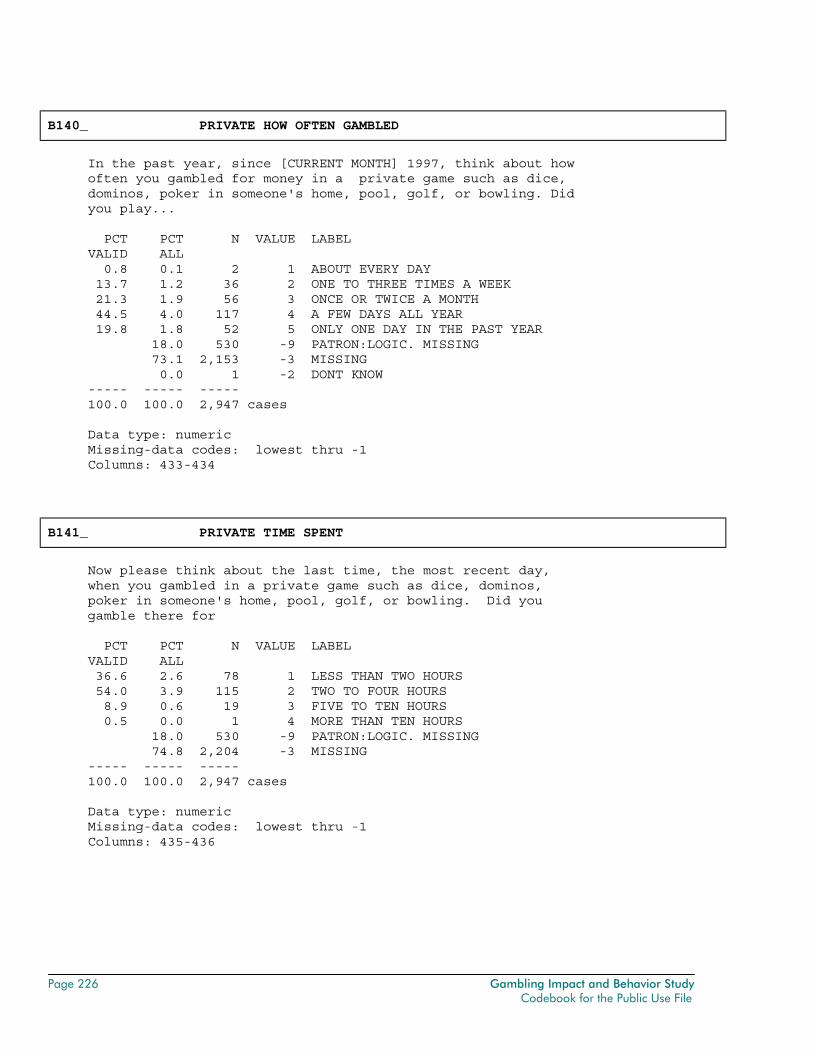
Page 226 Gambling Impact and Behavior Study Codebook for the Public Use File
B140_ PRIVATE HOW OFTEN GAMBLED
In the past year, since [CURRENT MONTH] 1997, think about how often you gambled for money in a private game such as dice, dominos, poker in someone's home, pool, golf, or bowling. Did you play... PCT PCT N VALUE LABEL VALID ALL 0.8 0.1 2 1 ABOUT EVERY DAY 13.7 1.2 36 2 ONE TO THREE TIMES A WEEK 21.3 1.9 56 3 ONCE OR TWICE A MONTH 44.5 4.0 117 4 A FEW DAYS ALL YEAR 19.8 1.8 52 5 ONLY ONE DAY IN THE PAST YEAR 18.0 530 -9 PATRON:LOGIC. MISSING 73.1 2,153 -3 MISSING 0.0 1 -2 DONT KNOW ----- ----- ----- 100.0 100.0 2,947 cases Data type: numeric Missing-data codes: lowest thru -1 Columns: 433-434
B141_ PRIVATE TIME SPENT
Now please think about the last time, the most recent day, when you gambled in a private game such as dice, dominos, poker in someone's home, pool, golf, or bowling. Did you gamble there for PCT PCT N VALUE LABEL VALID ALL 36.6 2.6 78 1 LESS THAN TWO HOURS 54.0 3.9 115 2 TWO TO FOUR HOURS 8.9 0.6 19 3 FIVE TO TEN HOURS 0.5 0.0 1 4 MORE THAN TEN HOURS 18.0 530 -9 PATRON:LOGIC. MISSING 74.8 2,204 -3 MISSING ----- ----- ----- 100.0 100.0 2,947 cases Data type: numeric Missing-data codes: lowest thru -1 Columns: 435-436
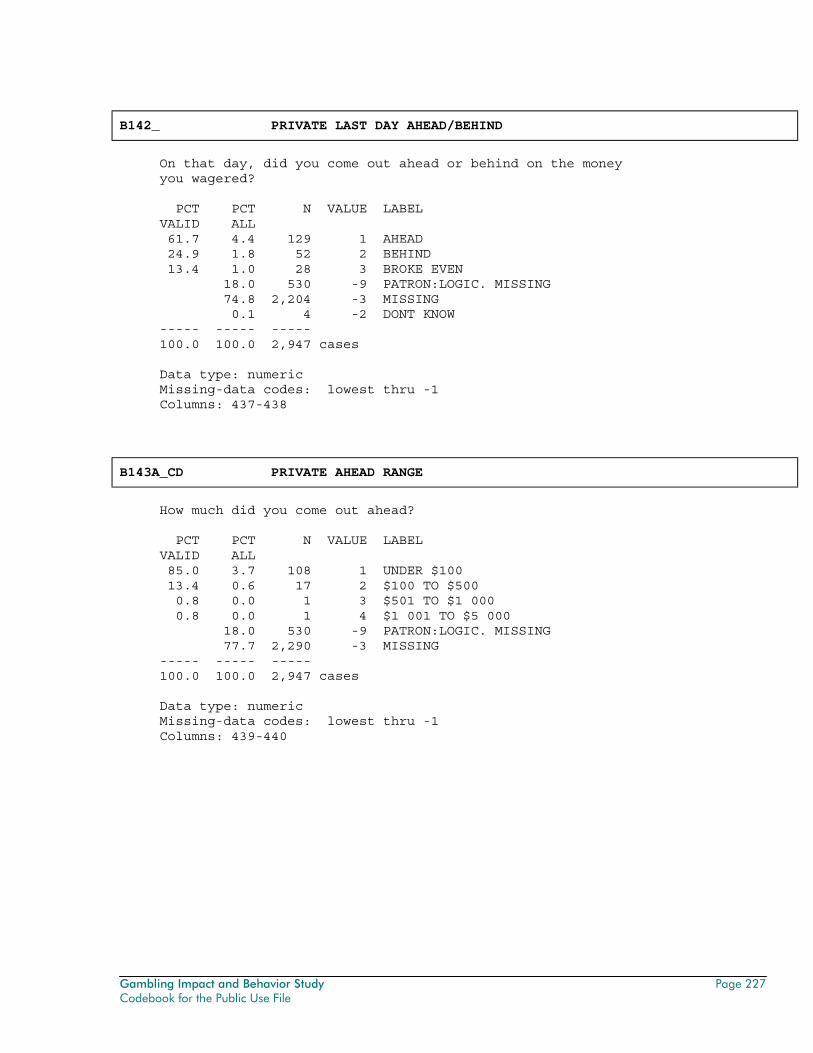
Gambling Impact and Behavior Study Page 227 Codebook for the Public Use File
B142_ PRIVATE LAST DAY AHEAD/BEHIND
On that day, did you come out ahead or behind on the money you wagered? PCT PCT N VALUE LABEL VALID ALL 61.7 4.4 129 1 AHEAD 24.9 1.8 52 2 BEHIND 13.4 1.0 28 3 BROKE EVEN 18.0 530 -9 PATRON:LOGIC. MISSING 74.8 2,204 -3 MISSING 0.1 4 -2 DONT KNOW ----- ----- ----- 100.0 100.0 2,947 cases Data type: numeric Missing-data codes: lowest thru -1 Columns: 437-438
B143A_CD PRIVATE AHEAD RANGE
How much did you come out ahead? PCT PCT N VALUE LABEL VALID ALL 85.0 3.7 108 1 UNDER $100 13.4 0.6 17 2 $100 TO $500 0.8 0.0 1 3 $501 TO $1 000 0.8 0.0 1 4 $1 001 TO $5 000 18.0 530 -9 PATRON:LOGIC. MISSING 77.7 2,290 -3 MISSING ----- ----- ----- 100.0 100.0 2,947 cases Data type: numeric Missing-data codes: lowest thru -1 Columns: 439-440
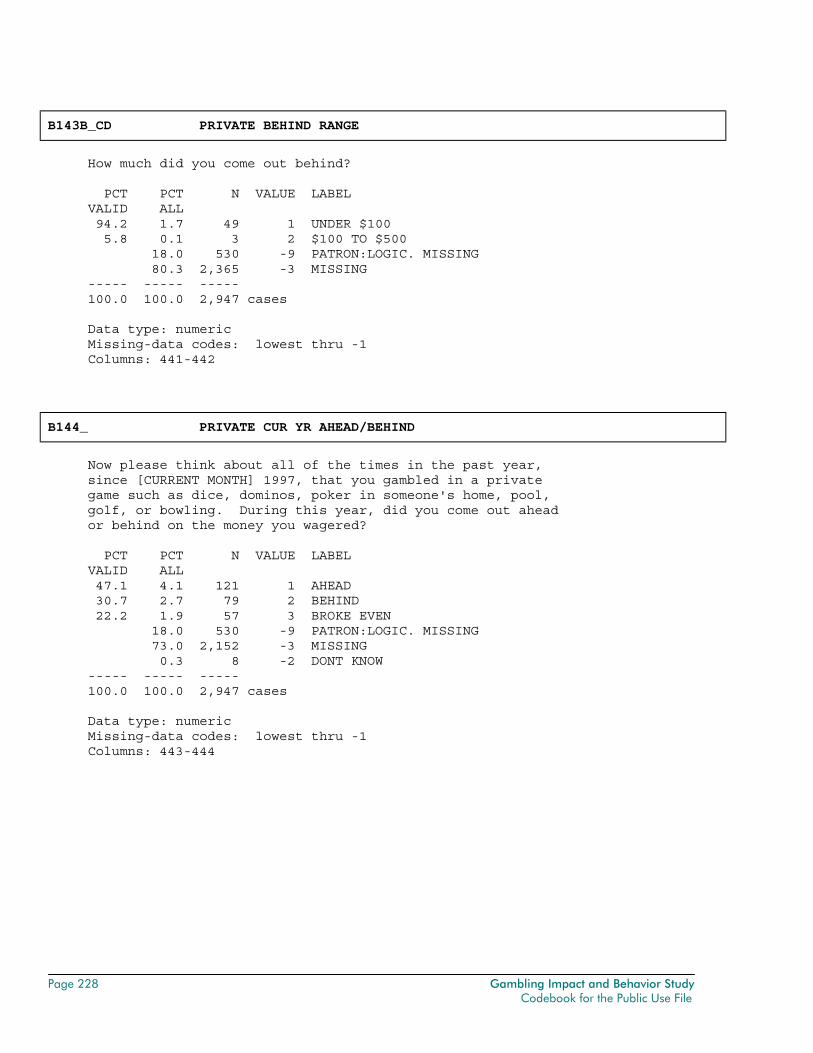
Page 228 Gambling Impact and Behavior Study Codebook for the Public Use File
B143B_CD PRIVATE BEHIND RANGE
How much did you come out behind? PCT PCT N VALUE LABEL VALID ALL 94.2 1.7 49 1 UNDER $100 5.8 0.1 3 2 $100 TO $500 18.0 530 -9 PATRON:LOGIC. MISSING 80.3 2,365 -3 MISSING ----- ----- ----- 100.0 100.0 2,947 cases Data type: numeric Missing-data codes: lowest thru -1 Columns: 441-442
B144_ PRIVATE CUR YR AHEAD/BEHIND
Now please think about all of the times in the past year, since [CURRENT MONTH] 1997, that you gambled in a private game such as dice, dominos, poker in someone's home, pool, golf, or bowling. During this year, did you come out ahead or behind on the money you wagered? PCT PCT N VALUE LABEL VALID ALL 47.1 4.1 121 1 AHEAD 30.7 2.7 79 2 BEHIND 22.2 1.9 57 3 BROKE EVEN 18.0 530 -9 PATRON:LOGIC. MISSING 73.0 2,152 -3 MISSING 0.3 8 -2 DONT KNOW ----- ----- ----- 100.0 100.0 2,947 cases Data type: numeric Missing-data codes: lowest thru -1 Columns: 443-444
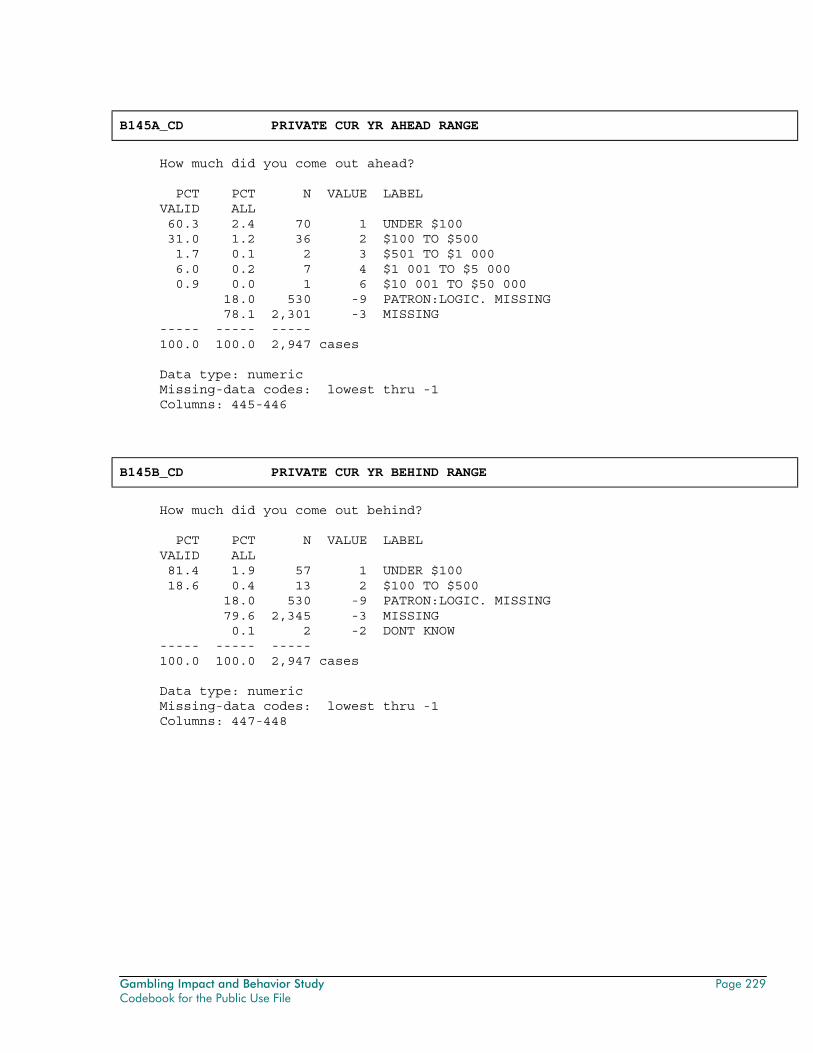
Gambling Impact and Behavior Study Page 229 Codebook for the Public Use File
B145A_CD PRIVATE CUR YR AHEAD RANGE
How much did you come out ahead? PCT PCT N VALUE LABEL VALID ALL 60.3 2.4 70 1 UNDER $100 31.0 1.2 36 2 $100 TO $500 1.7 0.1 2 3 $501 TO $1 000 6.0 0.2 7 4 $1 001 TO $5 000 0.9 0.0 1 6 $10 001 TO $50 000 18.0 530 -9 PATRON:LOGIC. MISSING 78.1 2,301 -3 MISSING ----- ----- ----- 100.0 100.0 2,947 cases Data type: numeric Missing-data codes: lowest thru -1 Columns: 445-446
B145B_CD PRIVATE CUR YR BEHIND RANGE
How much did you come out behind? PCT PCT N VALUE LABEL VALID ALL 81.4 1.9 57 1 UNDER $100 18.6 0.4 13 2 $100 TO $500 18.0 530 -9 PATRON:LOGIC. MISSING 79.6 2,345 -3 MISSING 0.1 2 -2 DONT KNOW ----- ----- ----- 100.0 100.0 2,947 cases Data type: numeric Missing-data codes: lowest thru -1 Columns: 447-448
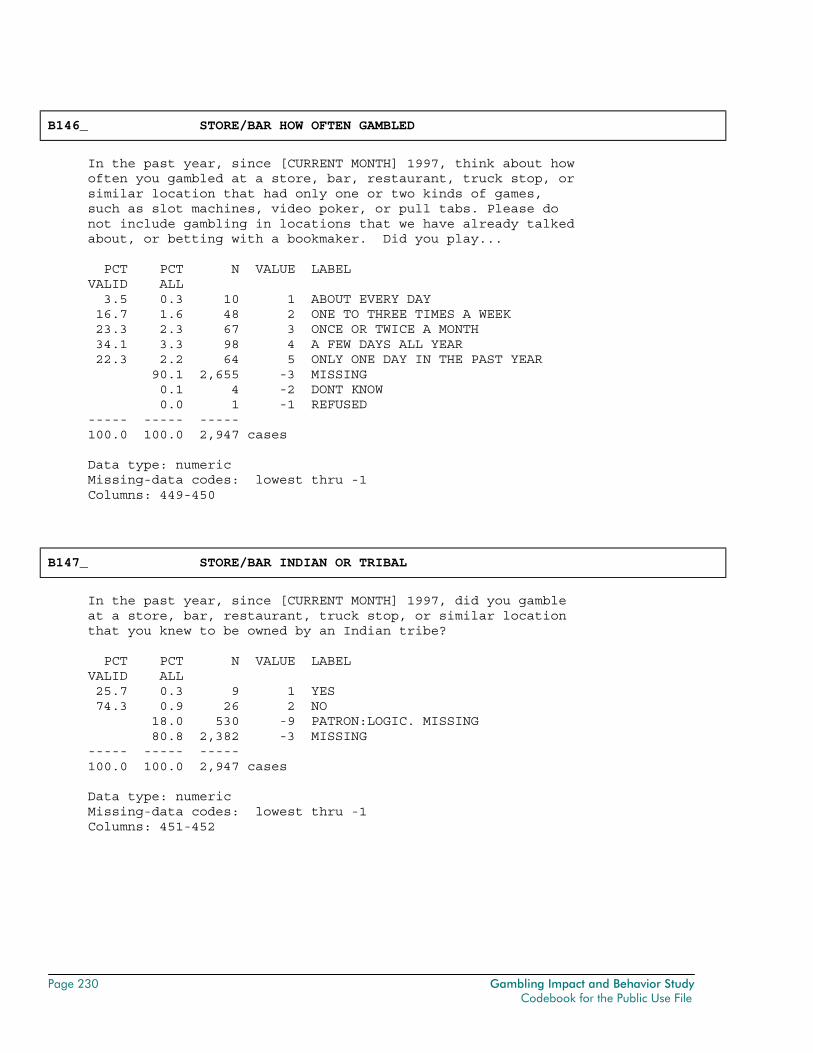
Page 230 Gambling Impact and Behavior Study Codebook for the Public Use File
B146_ STORE/BAR HOW OFTEN GAMBLED
In the past year, since [CURRENT MONTH] 1997, think about how often you gambled at a store, bar, restaurant, truck stop, or similar location that had only one or two kinds of games, such as slot machines, video poker, or pull tabs. Please do not include gambling in locations that we have already talked about, or betting with a bookmaker. Did you play... PCT PCT N VALUE LABEL VALID ALL 3.5 0.3 10 1 ABOUT EVERY DAY 16.7 1.6 48 2 ONE TO THREE TIMES A WEEK 23.3 2.3 67 3 ONCE OR TWICE A MONTH 34.1 3.3 98 4 A FEW DAYS ALL YEAR 22.3 2.2 64 5 ONLY ONE DAY IN THE PAST YEAR 90.1 2,655 -3 MISSING 0.1 4 -2 DONT KNOW 0.0 1 -1 REFUSED ----- ----- ----- 100.0 100.0 2,947 cases Data type: numeric Missing-data codes: lowest thru -1 Columns: 449-450
B147_ STORE/BAR INDIAN OR TRIBAL
In the past year, since [CURRENT MONTH] 1997, did you gamble at a store, bar, restaurant, truck stop, or similar location that you knew to be owned by an Indian tribe? PCT PCT N VALUE LABEL VALID ALL 25.7 0.3 9 1 YES 74.3 0.9 26 2 NO 18.0 530 -9 PATRON:LOGIC. MISSING 80.8 2,382 -3 MISSING ----- ----- ----- 100.0 100.0 2,947 cases Data type: numeric Missing-data codes: lowest thru -1 Columns: 451-452
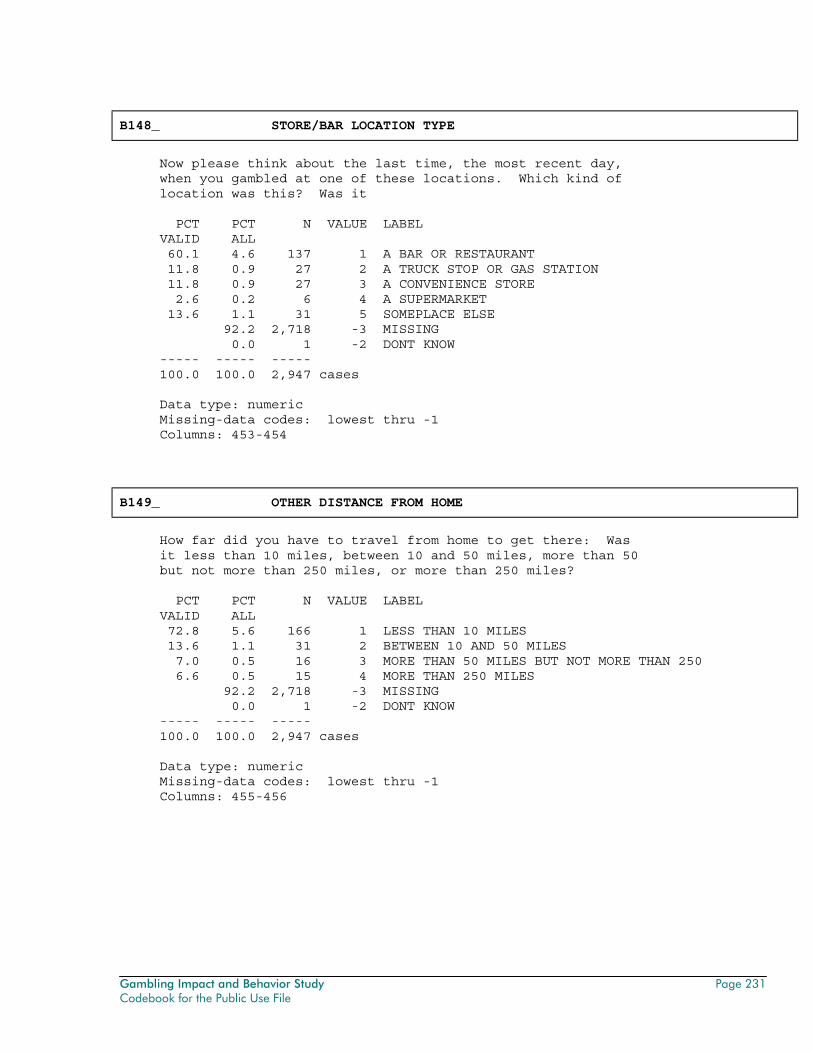
Gambling Impact and Behavior Study Page 231 Codebook for the Public Use File
B148_ STORE/BAR LOCATION TYPE
Now please think about the last time, the most recent day, when you gambled at one of these locations. Which kind of location was this? Was it PCT PCT N VALUE LABEL VALID ALL 60.1 4.6 137 1 A BAR OR RESTAURANT 11.8 0.9 27 2 A TRUCK STOP OR GAS STATION 11.8 0.9 27 3 A CONVENIENCE STORE 2.6 0.2 6 4 A SUPERMARKET 13.6 1.1 31 5 SOMEPLACE ELSE 92.2 2,718 -3 MISSING 0.0 1 -2 DONT KNOW ----- ----- ----- 100.0 100.0 2,947 cases Data type: numeric Missing-data codes: lowest thru -1 Columns: 453-454
B149_ OTHER DISTANCE FROM HOME
How far did you have to travel from home to get there: Was it less than 10 miles, between 10 and 50 miles, more than 50 but not more than 250 miles, or more than 250 miles? PCT PCT N VALUE LABEL VALID ALL 72.8 5.6 166 1 LESS THAN 10 MILES 13.6 1.1 31 2 BETWEEN 10 AND 50 MILES 7.0 0.5 16 3 MORE THAN 50 MILES BUT NOT MORE THAN 250 6.6 0.5 15 4 MORE THAN 250 MILES 92.2 2,718 -3 MISSING 0.0 1 -2 DONT KNOW ----- ----- ----- 100.0 100.0 2,947 cases Data type: numeric Missing-data codes: lowest thru -1 Columns: 455-456
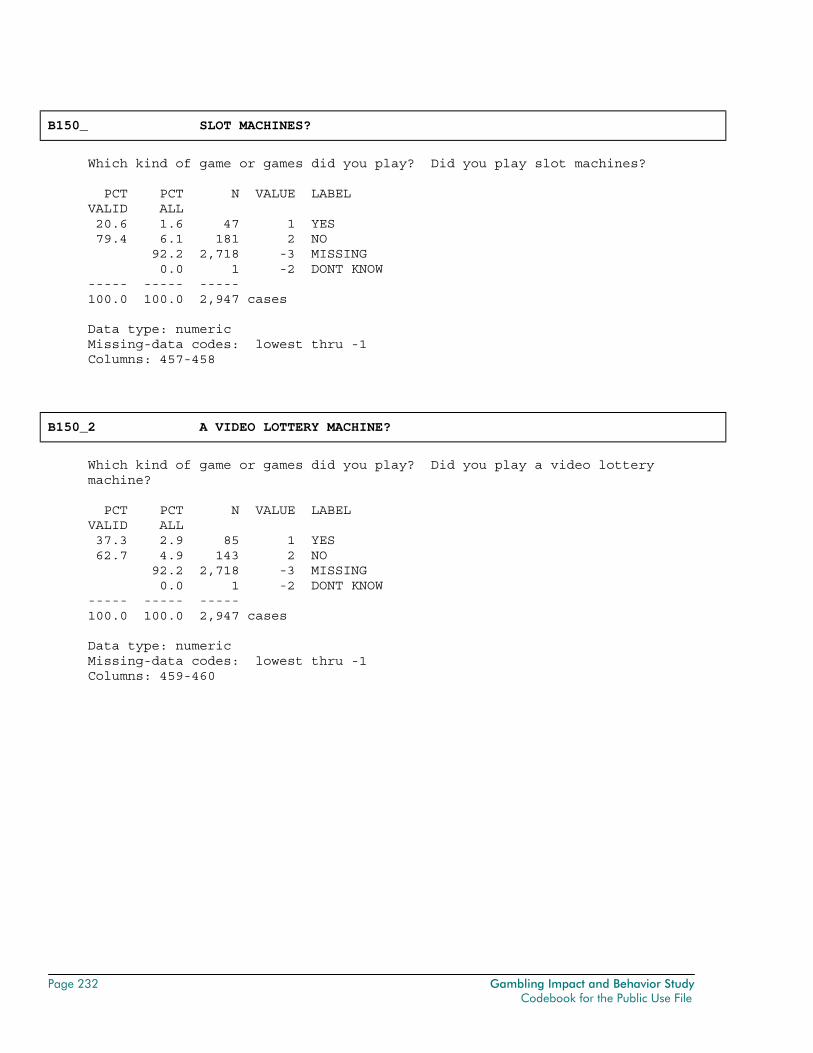
Page 232 Gambling Impact and Behavior Study Codebook for the Public Use File
B150_ SLOT MACHINES?
Which kind of game or games did you play? Did you play slot machines? PCT PCT N VALUE LABEL VALID ALL 20.6 1.6 47 1 YES 79.4 6.1 181 2 NO 92.2 2,718 -3 MISSING 0.0 1 -2 DONT KNOW ----- ----- ----- 100.0 100.0 2,947 cases Data type: numeric Missing-data codes: lowest thru -1 Columns: 457-458
B150_2 A VIDEO LOTTERY MACHINE?
Which kind of game or games did you play? Did you play a video lottery machine? PCT PCT N VALUE LABEL VALID ALL 37.3 2.9 85 1 YES 62.7 4.9 143 2 NO 92.2 2,718 -3 MISSING 0.0 1 -2 DONT KNOW ----- ----- ----- 100.0 100.0 2,947 cases Data type: numeric Missing-data codes: lowest thru -1 Columns: 459-460
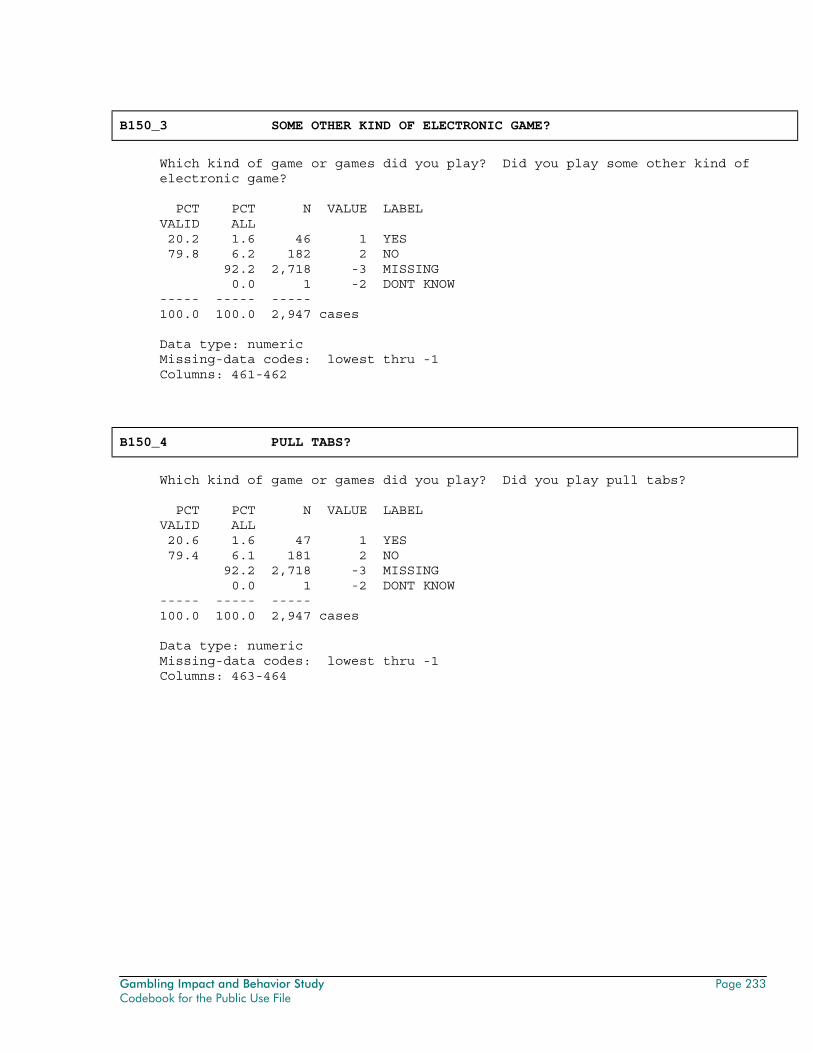
Gambling Impact and Behavior Study Page 233 Codebook for the Public Use File
B150_3 SOME OTHER KIND OF ELECTRONIC GAME?
Which kind of game or games did you play? Did you play some other kind of electronic game? PCT PCT N VALUE LABEL VALID ALL 20.2 1.6 46 1 YES 79.8 6.2 182 2 NO 92.2 2,718 -3 MISSING 0.0 1 -2 DONT KNOW ----- ----- ----- 100.0 100.0 2,947 cases Data type: numeric Missing-data codes: lowest thru -1 Columns: 461-462
B150_4 PULL TABS?
Which kind of game or games did you play? Did you play pull tabs? PCT PCT N VALUE LABEL VALID ALL 20.6 1.6 47 1 YES 79.4 6.1 181 2 NO 92.2 2,718 -3 MISSING 0.0 1 -2 DONT KNOW ----- ----- ----- 100.0 100.0 2,947 cases Data type: numeric Missing-data codes: lowest thru -1 Columns: 463-464
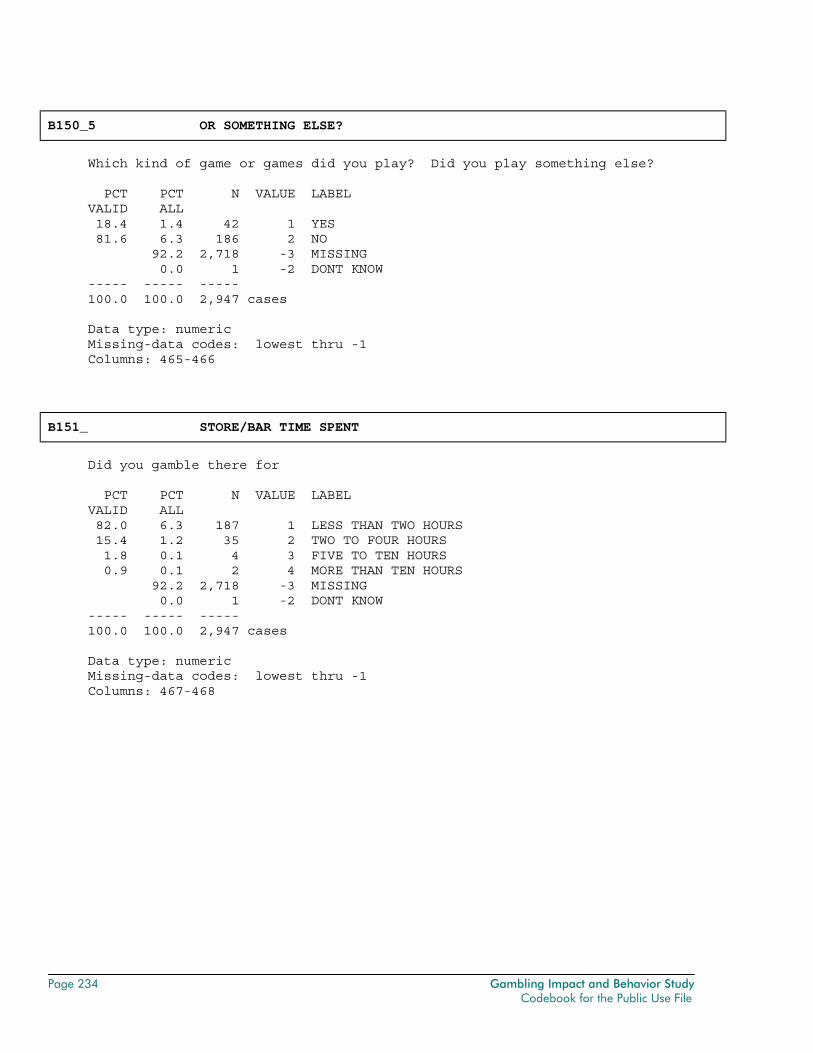
Page 234 Gambling Impact and Behavior Study Codebook for the Public Use File
B150_5 OR SOMETHING ELSE?
Which kind of game or games did you play? Did you play something else? PCT PCT N VALUE LABEL VALID ALL 18.4 1.4 42 1 YES 81.6 6.3 186 2 NO 92.2 2,718 -3 MISSING 0.0 1 -2 DONT KNOW ----- ----- ----- 100.0 100.0 2,947 cases Data type: numeric Missing-data codes: lowest thru -1 Columns: 465-466
B151_ STORE/BAR TIME SPENT
Did you gamble there for PCT PCT N VALUE LABEL VALID ALL 82.0 6.3 187 1 LESS THAN TWO HOURS 15.4 1.2 35 2 TWO TO FOUR HOURS 1.8 0.1 4 3 FIVE TO TEN HOURS 0.9 0.1 2 4 MORE THAN TEN HOURS 92.2 2,718 -3 MISSING 0.0 1 -2 DONT KNOW ----- ----- ----- 100.0 100.0 2,947 cases Data type: numeric Missing-data codes: lowest thru -1 Columns: 467-468
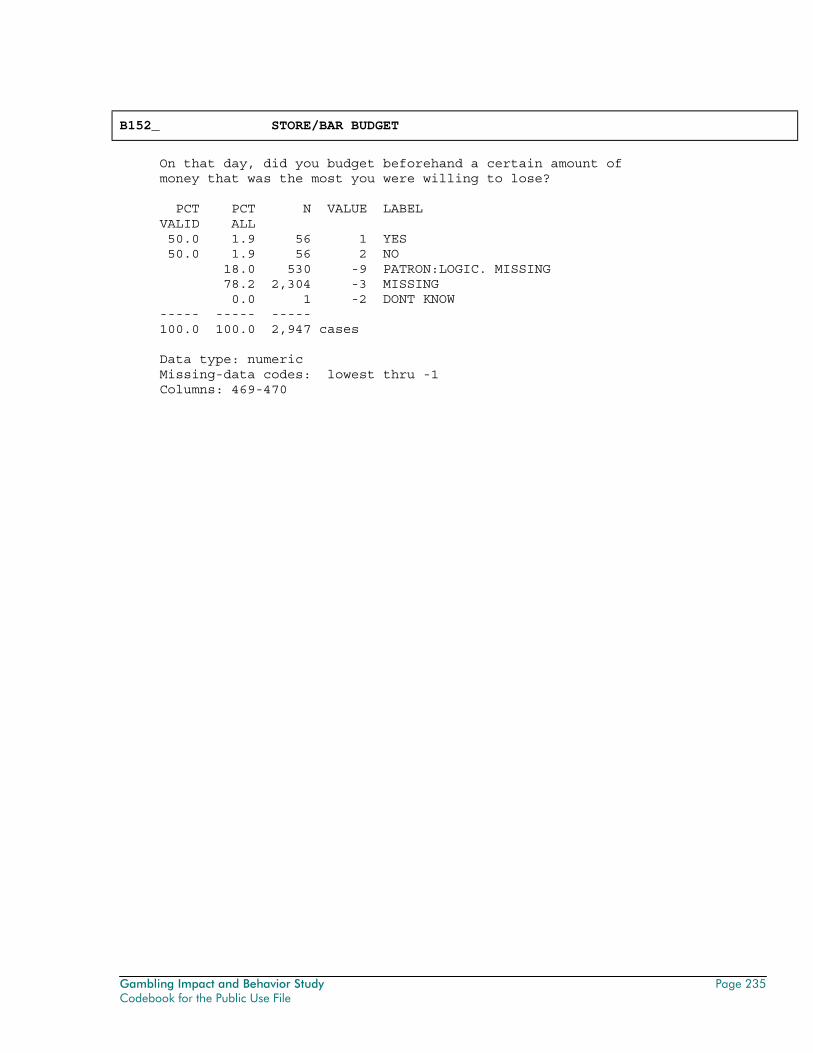
Gambling Impact and Behavior Study Page 235 Codebook for the Public Use File
B152_ STORE/BAR BUDGET
On that day, did you budget beforehand a certain amount of money that was the most you were willing to lose? PCT PCT N VALUE LABEL VALID ALL 50.0 1.9 56 1 YES 50.0 1.9 56 2 NO 18.0 530 -9 PATRON:LOGIC. MISSING 78.2 2,304 -3 MISSING 0.0 1 -2 DONT KNOW ----- ----- ----- 100.0 100.0 2,947 cases Data type: numeric Missing-data codes: lowest thru -1 Columns: 469-470
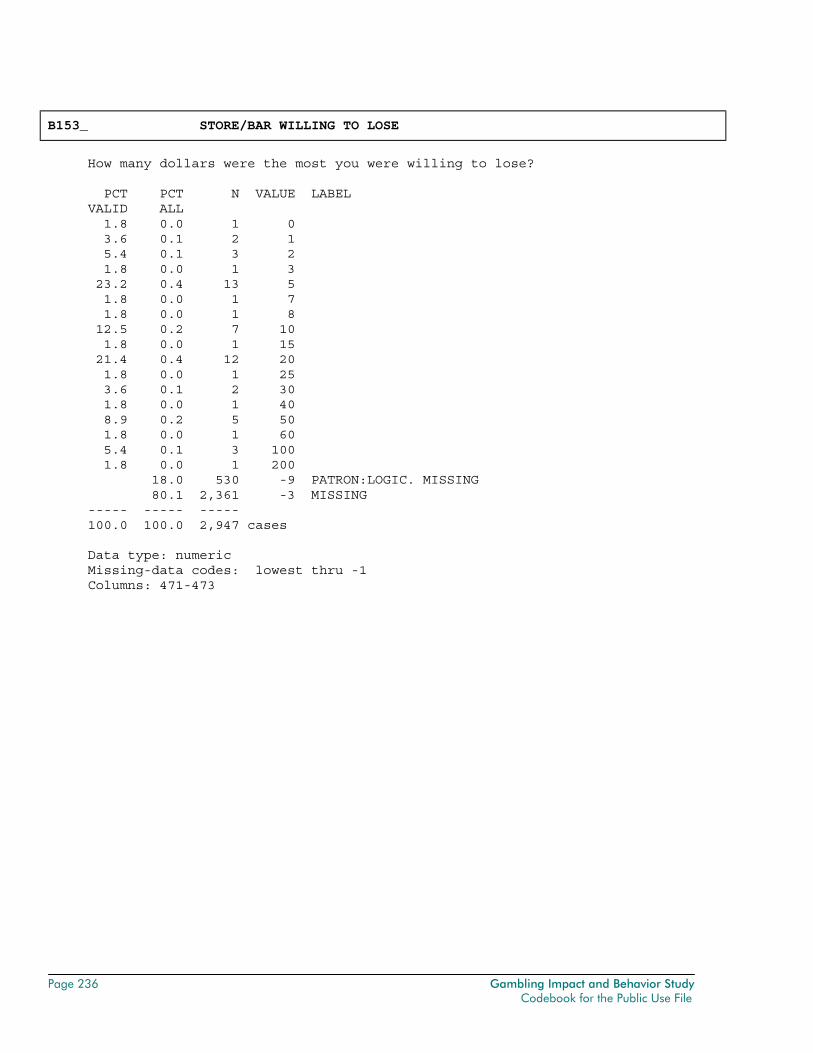
Page 236 Gambling Impact and Behavior Study Codebook for the Public Use File
B153_ STORE/BAR WILLING TO LOSE
How many dollars were the most you were willing to lose? PCT PCT N VALUE LABEL VALID ALL 1.8 0.0 1 0 3.6 0.1 2 1 5.4 0.1 3 2 1.8 0.0 1 3 23.2 0.4 13 5 1.8 0.0 1 7 1.8 0.0 1 8 12.5 0.2 7 10 1.8 0.0 1 15 21.4 0.4 12 20 1.8 0.0 1 25 3.6 0.1 2 30 1.8 0.0 1 40 8.9 0.2 5 50 1.8 0.0 1 60 5.4 0.1 3 100 1.8 0.0 1 200 18.0 530 -9 PATRON:LOGIC. MISSING 80.1 2,361 -3 MISSING ----- ----- ----- 100.0 100.0 2,947 cases Data type: numeric Missing-data codes: lowest thru -1 Columns: 471-473
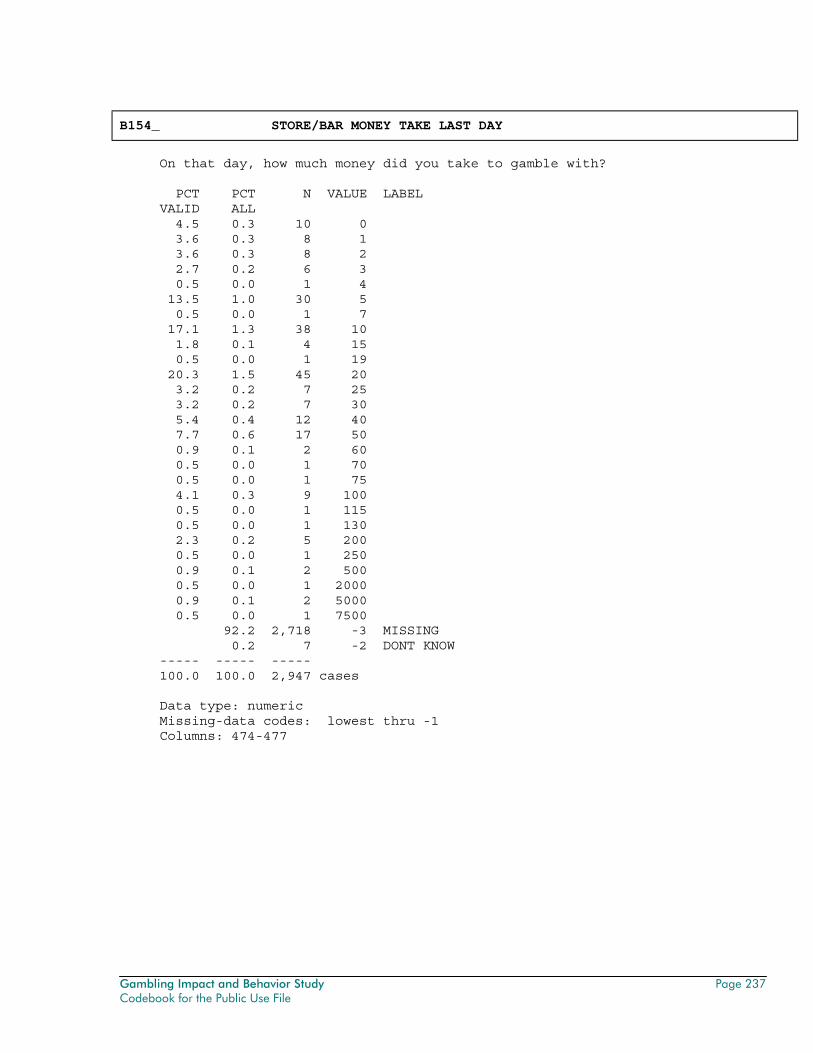
Gambling Impact and Behavior Study Page 237 Codebook for the Public Use File
B154_ STORE/BAR MONEY TAKE LAST DAY
On that day, how much money did you take to gamble with? PCT PCT N VALUE LABEL VALID ALL 4.5 0.3 10 0 3.6 0.3 8 1 3.6 0.3 8 2 2.7 0.2 6 3 0.5 0.0 1 4 13.5 1.0 30 5 0.5 0.0 1 7 17.1 1.3 38 10 1.8 0.1 4 15 0.5 0.0 1 19 20.3 1.5 45 20 3.2 0.2 7 25 3.2 0.2 7 30 5.4 0.4 12 40 7.7 0.6 17 50 0.9 0.1 2 60 0.5 0.0 1 70 0.5 0.0 1 75 4.1 0.3 9 100 0.5 0.0 1 115 0.5 0.0 1 130 2.3 0.2 5 200 0.5 0.0 1 250 0.9 0.1 2 500 0.5 0.0 1 2000 0.9 0.1 2 5000 0.5 0.0 1 7500 92.2 2,718 -3 MISSING 0.2 7 -2 DONT KNOW ----- ----- ----- 100.0 100.0 2,947 cases Data type: numeric Missing-data codes: lowest thru -1 Columns: 474-477

Page 238 Gambling Impact and Behavior Study Codebook for the Public Use File
B155_ STORE/BAR ACQUIRE MORE MONEY
And on that day, after you started gambling, did you acquire more money to gamble with, for example, by using an ATM, credit card, or cashing a check? PCT PCT N VALUE LABEL VALID ALL 1.8 0.1 2 1 YES 98.2 3.7 110 2 NO 18.0 530 -9 PATRON:LOGIC. MISSING 78.2 2,304 -3 MISSING 0.0 1 -2 DONT KNOW ----- ----- ----- 100.0 100.0 2,947 cases Data type: numeric Missing-data codes: lowest thru -1 Columns: 478-479
B156_ CASH A CHECK?
Please tell me which of the following ways you got more money to continue gambling. Did you cash a check? PCT PCT N VALUE LABEL VALID ALL 100.0 0.1 2 1 YES 18.0 530 -9 PATRON:LOGIC. MISSING 81.9 2,415 -3 MISSING ----- ----- ----- 100.0 100.0 2,947 cases Data type: numeric Missing-data codes: lowest thru -1 Columns: 480-481

Gambling Impact and Behavior Study Page 239 Codebook for the Public Use File
B156_2 TAKE MONEY FROM A BANK ACCOUNT USING AN
Please tell me which of the following ways you got more money to continue gambling. Did you take money from a bank account using an ATM? PCT PCT N VALUE LABEL VALID ALL 100.0 0.1 2 2 NO 18.0 530 -9 PATRON:LOGIC. MISSING 81.9 2,415 -3 MISSING ----- ----- ----- 100.0 100.0 2,947 cases Data type: numeric Missing-data codes: lowest thru -1 Columns: 482-483
B156_3 PAY WITH A CREDIT CARD?
Please tell me which of the following ways you got more money to continue gambling. Did you pay with a credit card? PCT PCT N VALUE LABEL VALID ALL 100.0 0.1 2 2 NO 18.0 530 -9 PATRON:LOGIC. MISSING 81.9 2,415 -3 MISSING ----- ----- ----- 100.0 100.0 2,947 cases Data type: numeric Missing-data codes: lowest thru -1 Columns: 484-485
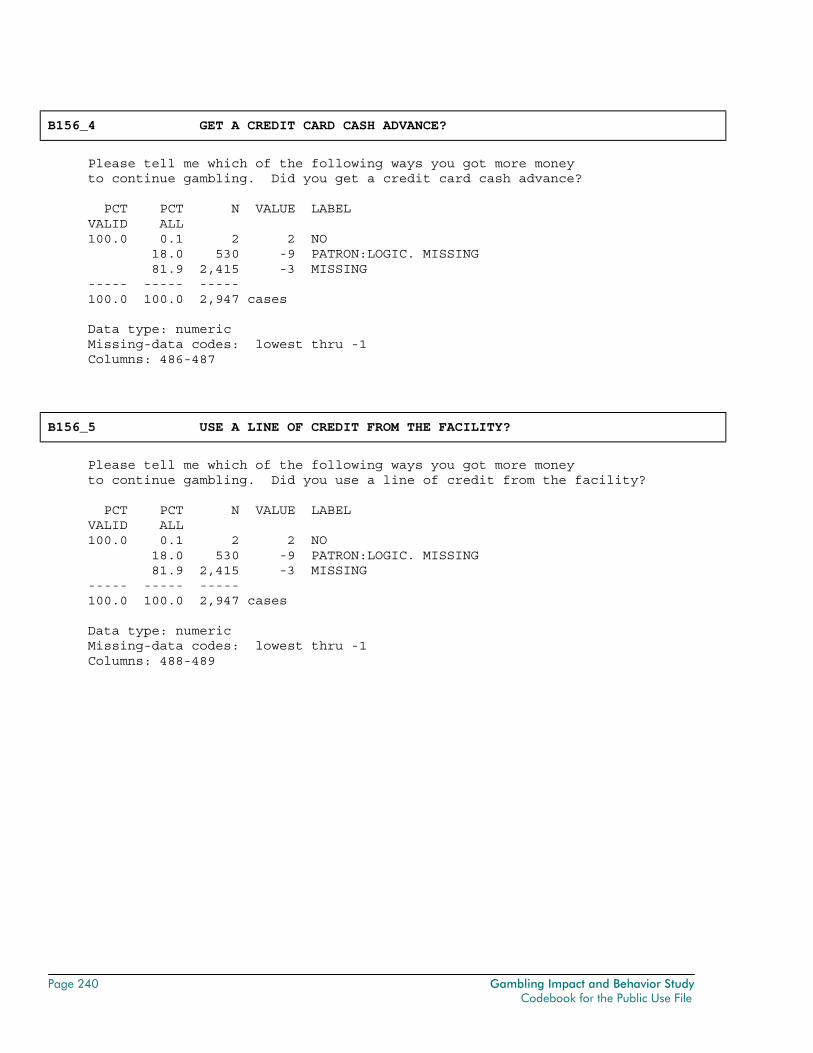
Page 240 Gambling Impact and Behavior Study Codebook for the Public Use File
B156_4 GET A CREDIT CARD CASH ADVANCE?
Please tell me which of the following ways you got more money to continue gambling. Did you get a credit card cash advance? PCT PCT N VALUE LABEL VALID ALL 100.0 0.1 2 2 NO 18.0 530 -9 PATRON:LOGIC. MISSING 81.9 2,415 -3 MISSING ----- ----- ----- 100.0 100.0 2,947 cases Data type: numeric Missing-data codes: lowest thru -1 Columns: 486-487
B156_5 USE A LINE OF CREDIT FROM THE FACILITY?
Please tell me which of the following ways you got more money to continue gambling. Did you use a line of credit from the facility? PCT PCT N VALUE LABEL VALID ALL 100.0 0.1 2 2 NO 18.0 530 -9 PATRON:LOGIC. MISSING 81.9 2,415 -3 MISSING ----- ----- ----- 100.0 100.0 2,947 cases Data type: numeric Missing-data codes: lowest thru -1 Columns: 488-489

Gambling Impact and Behavior Study Page 241 Codebook for the Public Use File
B156_6 BORROW MONEY FROM A FAMILY MEMBER OR FRI
Please tell me which of the following ways you got more money to continue gambling. Did you borrow money from a family member or friend? PCT PCT N VALUE LABEL VALID ALL 100.0 0.1 2 2 NO 18.0 530 -9 PATRON:LOGIC. MISSING 81.9 2,415 -3 MISSING ----- ----- ----- 100.0 100.0 2,947 cases Data type: numeric Missing-data codes: lowest thru -1 Columns: 490-491
B156_7 ANY OTHER WAY (SPECIFY)?
Please tell me which of the following ways you got more money to continue gambling. Did you get money any other way? PCT PCT N VALUE LABEL VALID ALL 100.0 0.1 2 2 NO 18.0 530 -9 PATRON:LOGIC. MISSING 81.9 2,415 -3 MISSING ----- ----- ----- 100.0 100.0 2,947 cases Data type: numeric Missing-data codes: lowest thru -1 Columns: 492-493
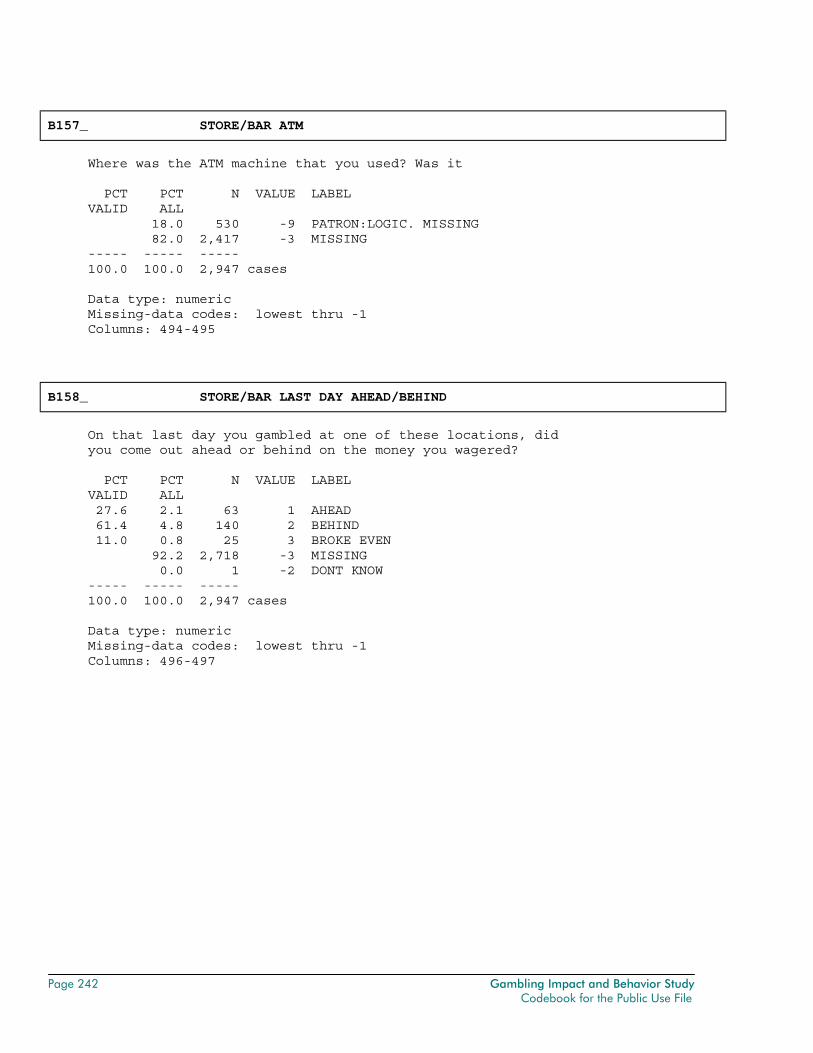
Page 242 Gambling Impact and Behavior Study Codebook for the Public Use File
B157_ STORE/BAR ATM
Where was the ATM machine that you used? Was it PCT PCT N VALUE LABEL VALID ALL 18.0 530 -9 PATRON:LOGIC. MISSING 82.0 2,417 -3 MISSING ----- ----- ----- 100.0 100.0 2,947 cases Data type: numeric Missing-data codes: lowest thru -1 Columns: 494-495
B158_ STORE/BAR LAST DAY AHEAD/BEHIND
On that last day you gambled at one of these locations, did you come out ahead or behind on the money you wagered? PCT PCT N VALUE LABEL VALID ALL 27.6 2.1 63 1 AHEAD 61.4 4.8 140 2 BEHIND 11.0 0.8 25 3 BROKE EVEN 92.2 2,718 -3 MISSING 0.0 1 -2 DONT KNOW ----- ----- ----- 100.0 100.0 2,947 cases Data type: numeric Missing-data codes: lowest thru -1 Columns: 496-497
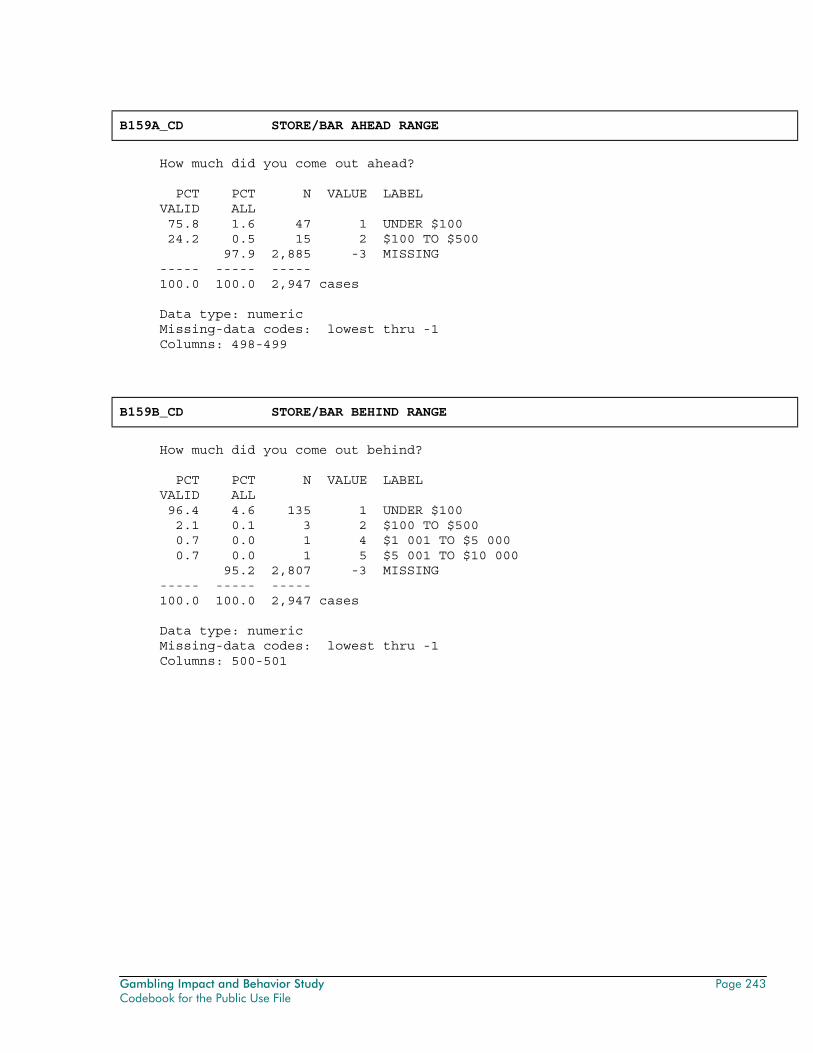
Gambling Impact and Behavior Study Page 243 Codebook for the Public Use File
B159A_CD STORE/BAR AHEAD RANGE
How much did you come out ahead? PCT PCT N VALUE LABEL VALID ALL 75.8 1.6 47 1 UNDER $100 24.2 0.5 15 2 $100 TO $500 97.9 2,885 -3 MISSING ----- ----- ----- 100.0 100.0 2,947 cases Data type: numeric Missing-data codes: lowest thru -1 Columns: 498-499
B159B_CD STORE/BAR BEHIND RANGE
How much did you come out behind? PCT PCT N VALUE LABEL VALID ALL 96.4 4.6 135 1 UNDER $100 2.1 0.1 3 2 $100 TO $500 0.7 0.0 1 4 $1 001 TO $5 000 0.7 0.0 1 5 $5 001 TO $10 000 95.2 2,807 -3 MISSING ----- ----- ----- 100.0 100.0 2,947 cases Data type: numeric Missing-data codes: lowest thru -1 Columns: 500-501
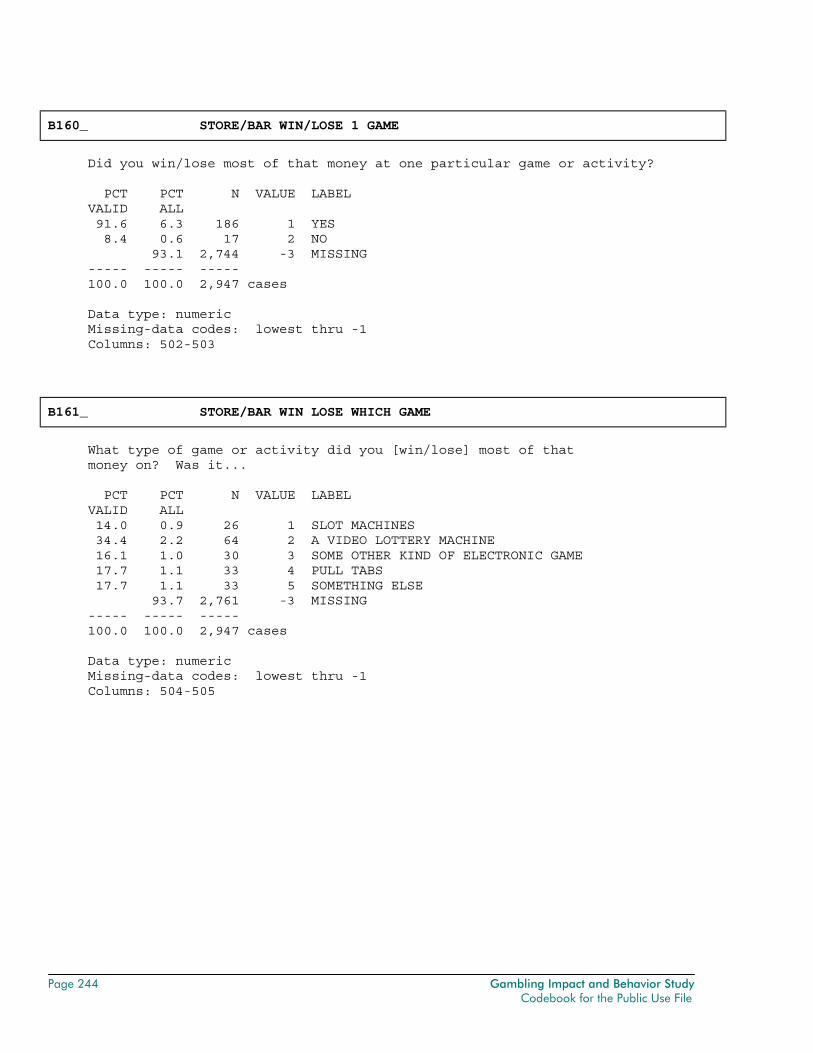
Page 244 Gambling Impact and Behavior Study Codebook for the Public Use File
B160_ STORE/BAR WIN/LOSE 1 GAME
Did you win/lose most of that money at one particular game or activity? PCT PCT N VALUE LABEL VALID ALL 91.6 6.3 186 1 YES 8.4 0.6 17 2 NO 93.1 2,744 -3 MISSING ----- ----- ----- 100.0 100.0 2,947 cases Data type: numeric Missing-data codes: lowest thru -1 Columns: 502-503
B161_ STORE/BAR WIN LOSE WHICH GAME
What type of game or activity did you [win/lose] most of that money on? Was it... PCT PCT N VALUE LABEL VALID ALL 14.0 0.9 26 1 SLOT MACHINES 34.4 2.2 64 2 A VIDEO LOTTERY MACHINE 16.1 1.0 30 3 SOME OTHER KIND OF ELECTRONIC GAME 17.7 1.1 33 4 PULL TABS 17.7 1.1 33 5 SOMETHING ELSE 93.7 2,761 -3 MISSING ----- ----- ----- 100.0 100.0 2,947 cases Data type: numeric Missing-data codes: lowest thru -1 Columns: 504-505
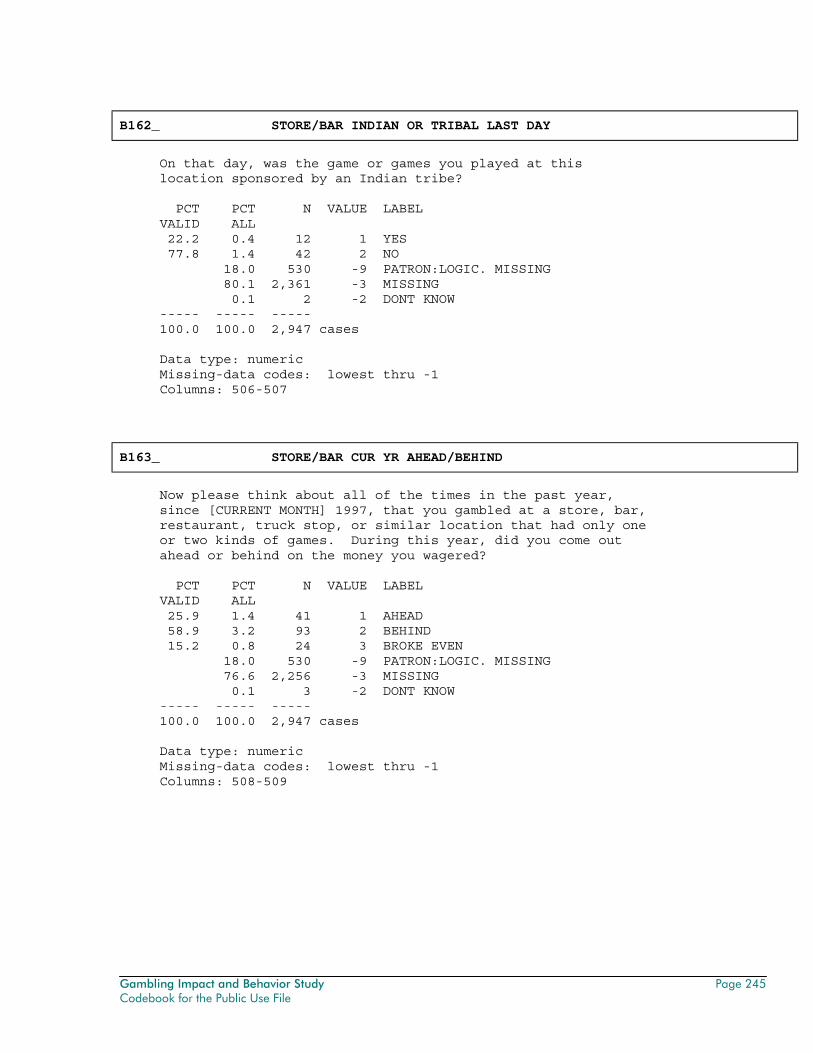
Gambling Impact and Behavior Study Page 245 Codebook for the Public Use File
B162_ STORE/BAR INDIAN OR TRIBAL LAST DAY
On that day, was the game or games you played at this location sponsored by an Indian tribe? PCT PCT N VALUE LABEL VALID ALL 22.2 0.4 12 1 YES 77.8 1.4 42 2 NO 18.0 530 -9 PATRON:LOGIC. MISSING 80.1 2,361 -3 MISSING 0.1 2 -2 DONT KNOW ----- ----- ----- 100.0 100.0 2,947 cases Data type: numeric Missing-data codes: lowest thru -1 Columns: 506-507
B163_ STORE/BAR CUR YR AHEAD/BEHIND
Now please think about all of the times in the past year, since [CURRENT MONTH] 1997, that you gambled at a store, bar, restaurant, truck stop, or similar location that had only one or two kinds of games. During this year, did you come out ahead or behind on the money you wagered? PCT PCT N VALUE LABEL VALID ALL 25.9 1.4 41 1 AHEAD 58.9 3.2 93 2 BEHIND 15.2 0.8 24 3 BROKE EVEN 18.0 530 -9 PATRON:LOGIC. MISSING 76.6 2,256 -3 MISSING 0.1 3 -2 DONT KNOW ----- ----- ----- 100.0 100.0 2,947 cases Data type: numeric Missing-data codes: lowest thru -1 Columns: 508-509
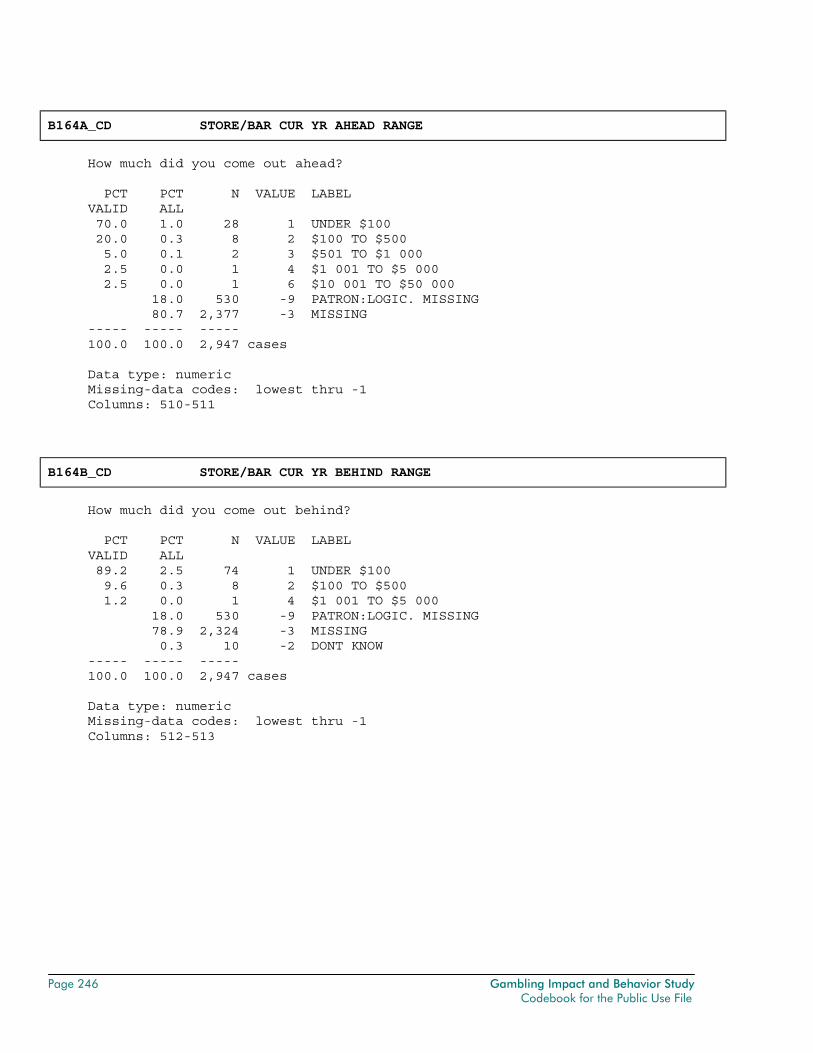
Page 246 Gambling Impact and Behavior Study Codebook for the Public Use File
B164A_CD STORE/BAR CUR YR AHEAD RANGE
How much did you come out ahead? PCT PCT N VALUE LABEL VALID ALL 70.0 1.0 28 1 UNDER $100 20.0 0.3 8 2 $100 TO $500 5.0 0.1 2 3 $501 TO $1 000 2.5 0.0 1 4 $1 001 TO $5 000 2.5 0.0 1 6 $10 001 TO $50 000 18.0 530 -9 PATRON:LOGIC. MISSING 80.7 2,377 -3 MISSING ----- ----- ----- 100.0 100.0 2,947 cases Data type: numeric Missing-data codes: lowest thru -1 Columns: 510-511
B164B_CD STORE/BAR CUR YR BEHIND RANGE
How much did you come out behind? PCT PCT N VALUE LABEL VALID ALL 89.2 2.5 74 1 UNDER $100 9.6 0.3 8 2 $100 TO $500 1.2 0.0 1 4 $1 001 TO $5 000 18.0 530 -9 PATRON:LOGIC. MISSING 78.9 2,324 -3 MISSING 0.3 10 -2 DONT KNOW ----- ----- ----- 100.0 100.0 2,947 cases Data type: numeric Missing-data codes: lowest thru -1 Columns: 512-513
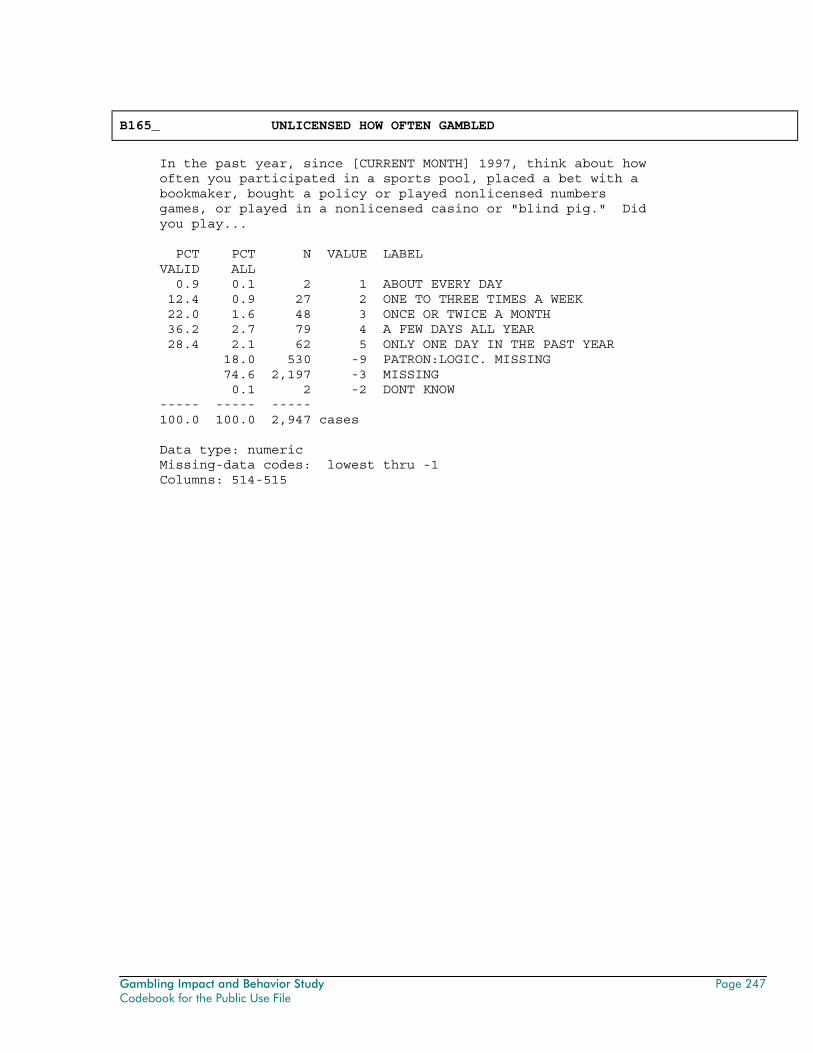
Gambling Impact and Behavior Study Page 247 Codebook for the Public Use File
B165_ UNLICENSED HOW OFTEN GAMBLED
In the past year, since [CURRENT MONTH] 1997, think about how often you participated in a sports pool, placed a bet with a bookmaker, bought a policy or played nonlicensed numbers games, or played in a nonlicensed casino or "blind pig." Did you play... PCT PCT N VALUE LABEL VALID ALL 0.9 0.1 2 1 ABOUT EVERY DAY 12.4 0.9 27 2 ONE TO THREE TIMES A WEEK 22.0 1.6 48 3 ONCE OR TWICE A MONTH 36.2 2.7 79 4 A FEW DAYS ALL YEAR 28.4 2.1 62 5 ONLY ONE DAY IN THE PAST YEAR 18.0 530 -9 PATRON:LOGIC. MISSING 74.6 2,197 -3 MISSING 0.1 2 -2 DONT KNOW ----- ----- ----- 100.0 100.0 2,947 cases Data type: numeric Missing-data codes: lowest thru -1 Columns: 514-515
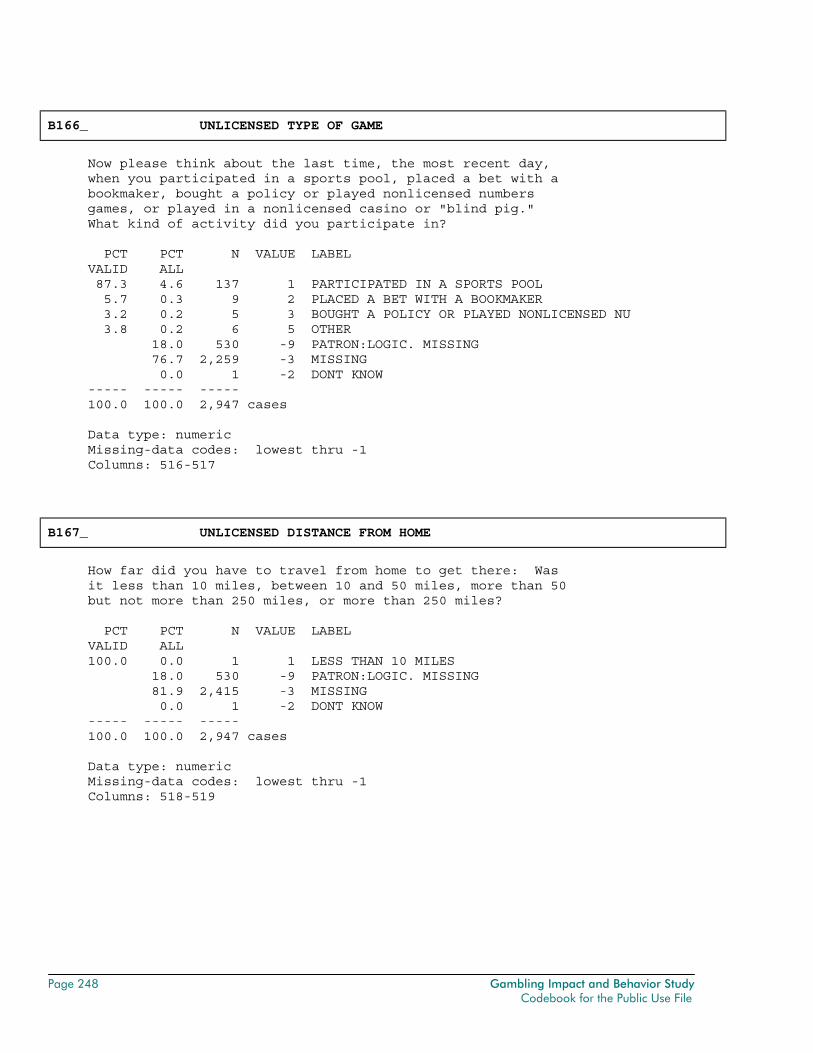
Page 248 Gambling Impact and Behavior Study Codebook for the Public Use File
B166_ UNLICENSED TYPE OF GAME
Now please think about the last time, the most recent day, when you participated in a sports pool, placed a bet with a bookmaker, bought a policy or played nonlicensed numbers games, or played in a nonlicensed casino or "blind pig." What kind of activity did you participate in? PCT PCT N VALUE LABEL VALID ALL 87.3 4.6 137 1 PARTICIPATED IN A SPORTS POOL 5.7 0.3 9 2 PLACED A BET WITH A BOOKMAKER 3.2 0.2 5 3 BOUGHT A POLICY OR PLAYED NONLICENSED NU 3.8 0.2 6 5 OTHER 18.0 530 -9 PATRON:LOGIC. MISSING 76.7 2,259 -3 MISSING 0.0 1 -2 DONT KNOW ----- ----- ----- 100.0 100.0 2,947 cases Data type: numeric Missing-data codes: lowest thru -1 Columns: 516-517
B167_ UNLICENSED DISTANCE FROM HOME
How far did you have to travel from home to get there: Was it less than 10 miles, between 10 and 50 miles, more than 50 but not more than 250 miles, or more than 250 miles? PCT PCT N VALUE LABEL VALID ALL 100.0 0.0 1 1 LESS THAN 10 MILES 18.0 530 -9 PATRON:LOGIC. MISSING 81.9 2,415 -3 MISSING 0.0 1 -2 DONT KNOW ----- ----- ----- 100.0 100.0 2,947 cases Data type: numeric Missing-data codes: lowest thru -1 Columns: 518-519
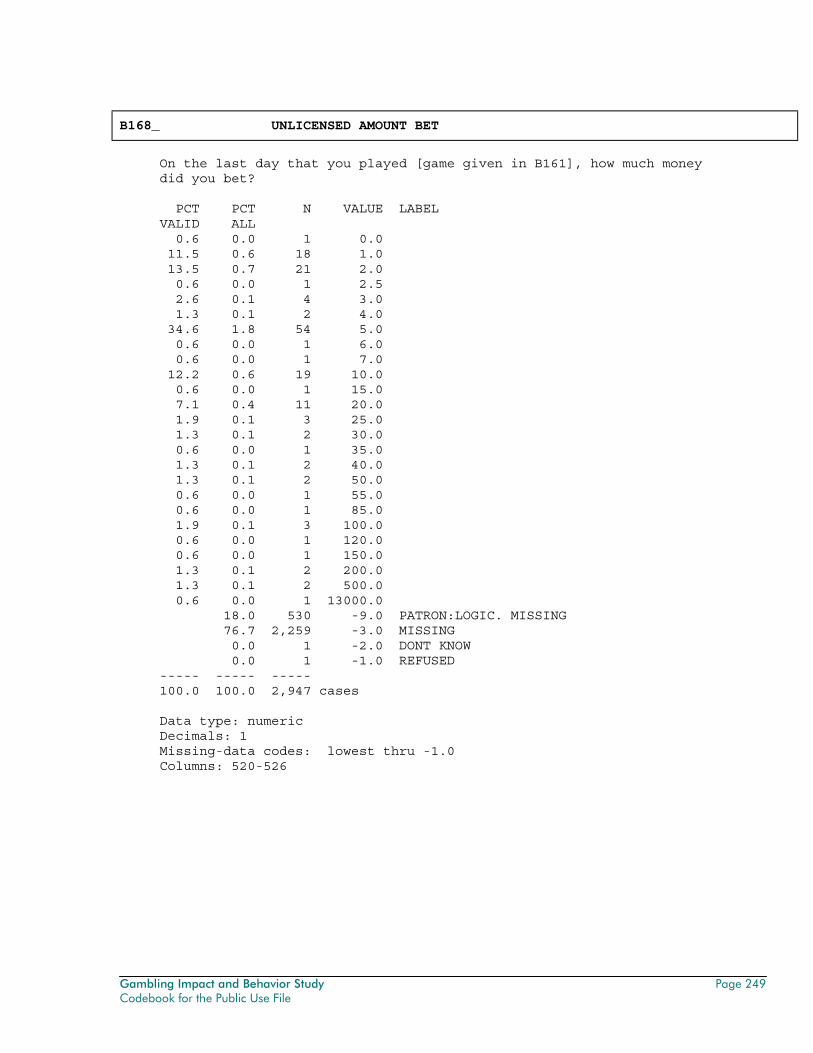
Gambling Impact and Behavior Study Page 249 Codebook for the Public Use File
B168_ UNLICENSED AMOUNT BET
On the last day that you played [game given in B161], how much money did you bet? PCT PCT N VALUE LABEL VALID ALL 0.6 0.0 1 0.0 11.5 0.6 18 1.0 13.5 0.7 21 2.0 0.6 0.0 1 2.5 2.6 0.1 4 3.0 1.3 0.1 2 4.0 34.6 1.8 54 5.0 0.6 0.0 1 6.0 0.6 0.0 1 7.0 12.2 0.6 19 10.0 0.6 0.0 1 15.0 7.1 0.4 11 20.0 1.9 0.1 3 25.0 1.3 0.1 2 30.0 0.6 0.0 1 35.0 1.3 0.1 2 40.0 1.3 0.1 2 50.0 0.6 0.0 1 55.0 0.6 0.0 1 85.0 1.9 0.1 3 100.0 0.6 0.0 1 120.0 0.6 0.0 1 150.0 1.3 0.1 2 200.0 1.3 0.1 2 500.0 0.6 0.0 1 13000.0 18.0 530 -9.0 PATRON:LOGIC. MISSING 76.7 2,259 -3.0 MISSING 0.0 1 -2.0 DONT KNOW 0.0 1 -1.0 REFUSED ----- ----- ----- 100.0 100.0 2,947 cases Data type: numeric Decimals: 1 Missing-data codes: lowest thru -1.0 Columns: 520-526
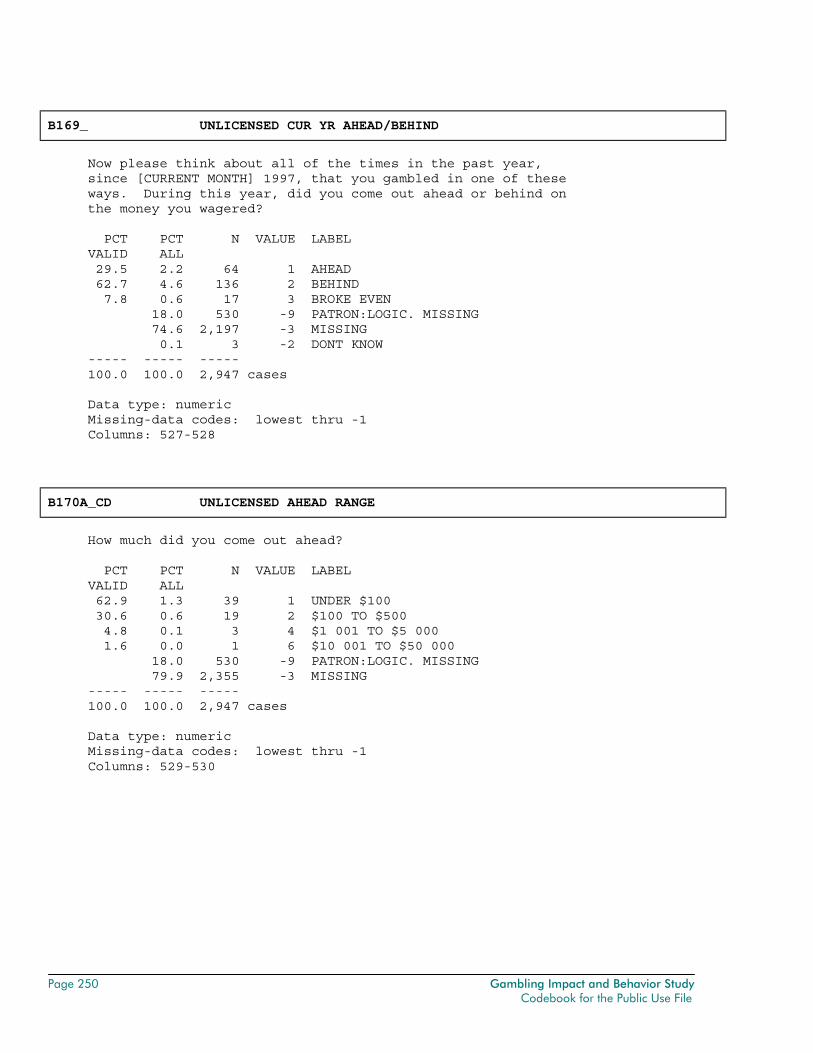
Page 250 Gambling Impact and Behavior Study Codebook for the Public Use File
B169_ UNLICENSED CUR YR AHEAD/BEHIND
Now please think about all of the times in the past year, since [CURRENT MONTH] 1997, that you gambled in one of these ways. During this year, did you come out ahead or behind on the money you wagered? PCT PCT N VALUE LABEL VALID ALL 29.5 2.2 64 1 AHEAD 62.7 4.6 136 2 BEHIND 7.8 0.6 17 3 BROKE EVEN 18.0 530 -9 PATRON:LOGIC. MISSING 74.6 2,197 -3 MISSING 0.1 3 -2 DONT KNOW ----- ----- ----- 100.0 100.0 2,947 cases Data type: numeric Missing-data codes: lowest thru -1 Columns: 527-528
B170A_CD UNLICENSED AHEAD RANGE
How much did you come out ahead? PCT PCT N VALUE LABEL VALID ALL 62.9 1.3 39 1 UNDER $100 30.6 0.6 19 2 $100 TO $500 4.8 0.1 3 4 $1 001 TO $5 000 1.6 0.0 1 6 $10 001 TO $50 000 18.0 530 -9 PATRON:LOGIC. MISSING 79.9 2,355 -3 MISSING ----- ----- ----- 100.0 100.0 2,947 cases Data type: numeric Missing-data codes: lowest thru -1 Columns: 529-530
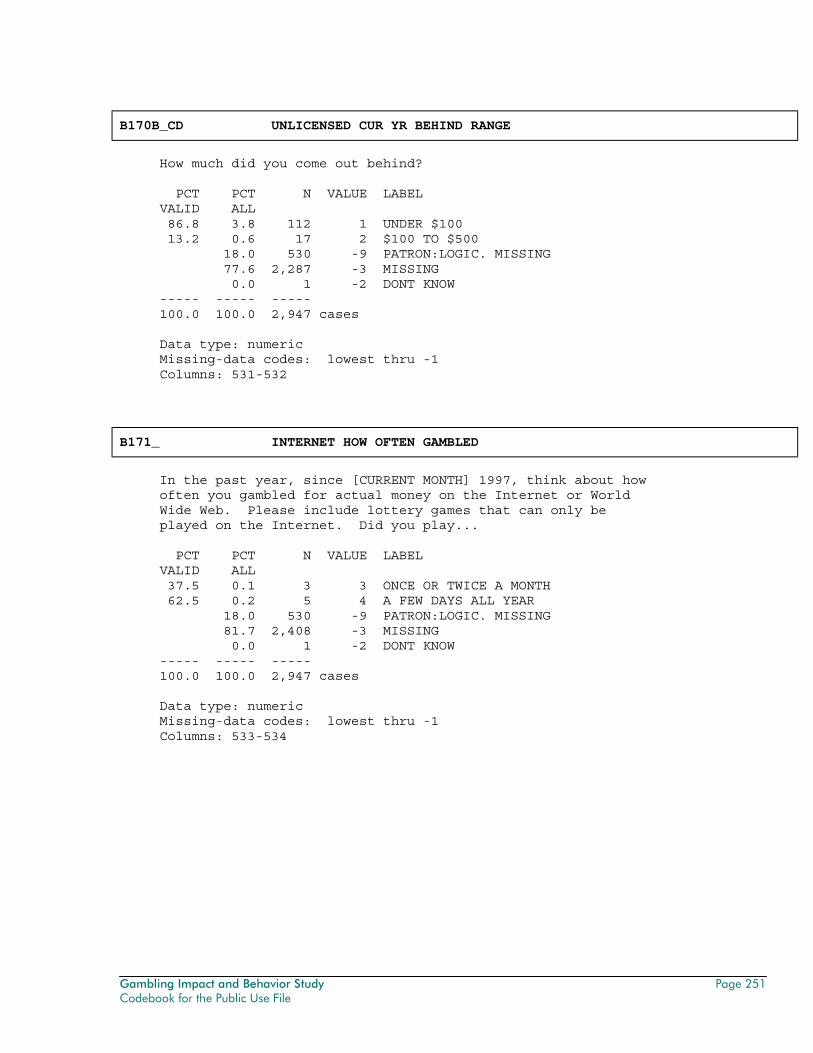
Gambling Impact and Behavior Study Page 251 Codebook for the Public Use File
B170B_CD UNLICENSED CUR YR BEHIND RANGE
How much did you come out behind? PCT PCT N VALUE LABEL VALID ALL 86.8 3.8 112 1 UNDER $100 13.2 0.6 17 2 $100 TO $500 18.0 530 -9 PATRON:LOGIC. MISSING 77.6 2,287 -3 MISSING 0.0 1 -2 DONT KNOW ----- ----- ----- 100.0 100.0 2,947 cases Data type: numeric Missing-data codes: lowest thru -1 Columns: 531-532
B171_ INTERNET HOW OFTEN GAMBLED
In the past year, since [CURRENT MONTH] 1997, think about how often you gambled for actual money on the Internet or World Wide Web. Please include lottery games that can only be played on the Internet. Did you play... PCT PCT N VALUE LABEL VALID ALL 37.5 0.1 3 3 ONCE OR TWICE A MONTH 62.5 0.2 5 4 A FEW DAYS ALL YEAR 18.0 530 -9 PATRON:LOGIC. MISSING 81.7 2,408 -3 MISSING 0.0 1 -2 DONT KNOW ----- ----- ----- 100.0 100.0 2,947 cases Data type: numeric Missing-data codes: lowest thru -1 Columns: 533-534
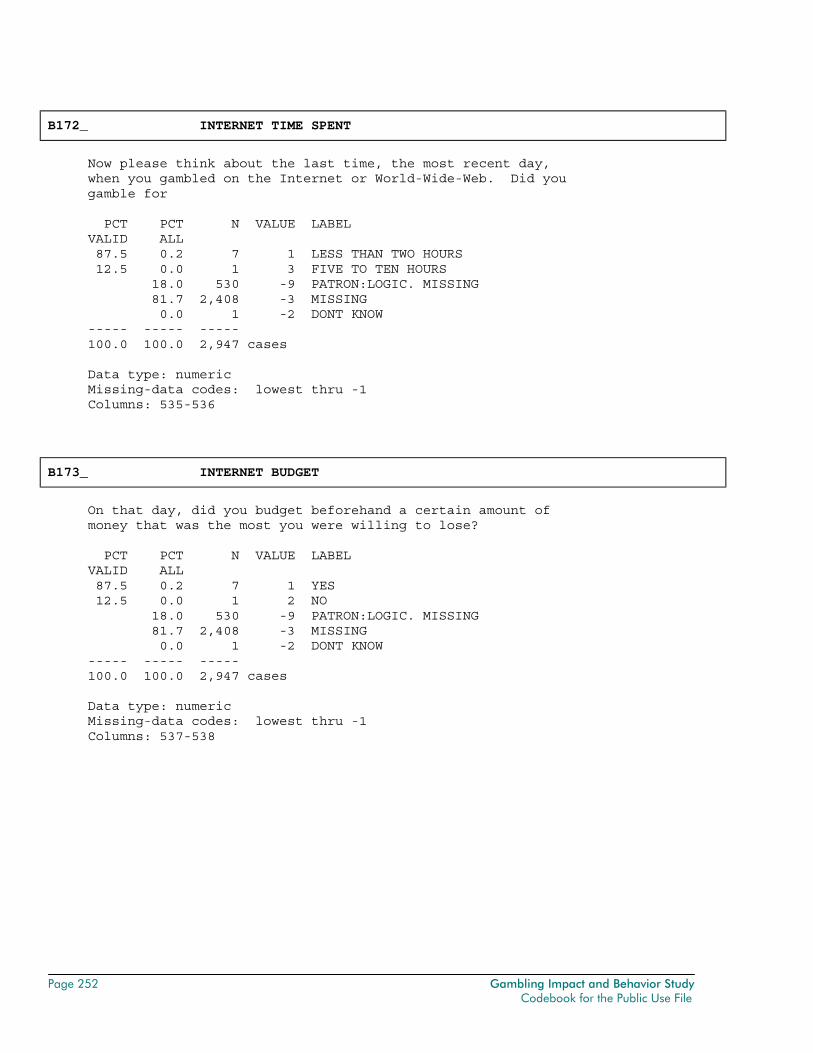
Page 252 Gambling Impact and Behavior Study Codebook for the Public Use File
B172_ INTERNET TIME SPENT
Now please think about the last time, the most recent day, when you gambled on the Internet or World-Wide-Web. Did you gamble for PCT PCT N VALUE LABEL VALID ALL 87.5 0.2 7 1 LESS THAN TWO HOURS 12.5 0.0 1 3 FIVE TO TEN HOURS 18.0 530 -9 PATRON:LOGIC. MISSING 81.7 2,408 -3 MISSING 0.0 1 -2 DONT KNOW ----- ----- ----- 100.0 100.0 2,947 cases Data type: numeric Missing-data codes: lowest thru -1 Columns: 535-536
B173_ INTERNET BUDGET
On that day, did you budget beforehand a certain amount of money that was the most you were willing to lose? PCT PCT N VALUE LABEL VALID ALL 87.5 0.2 7 1 YES 12.5 0.0 1 2 NO 18.0 530 -9 PATRON:LOGIC. MISSING 81.7 2,408 -3 MISSING 0.0 1 -2 DONT KNOW ----- ----- ----- 100.0 100.0 2,947 cases Data type: numeric Missing-data codes: lowest thru -1 Columns: 537-538
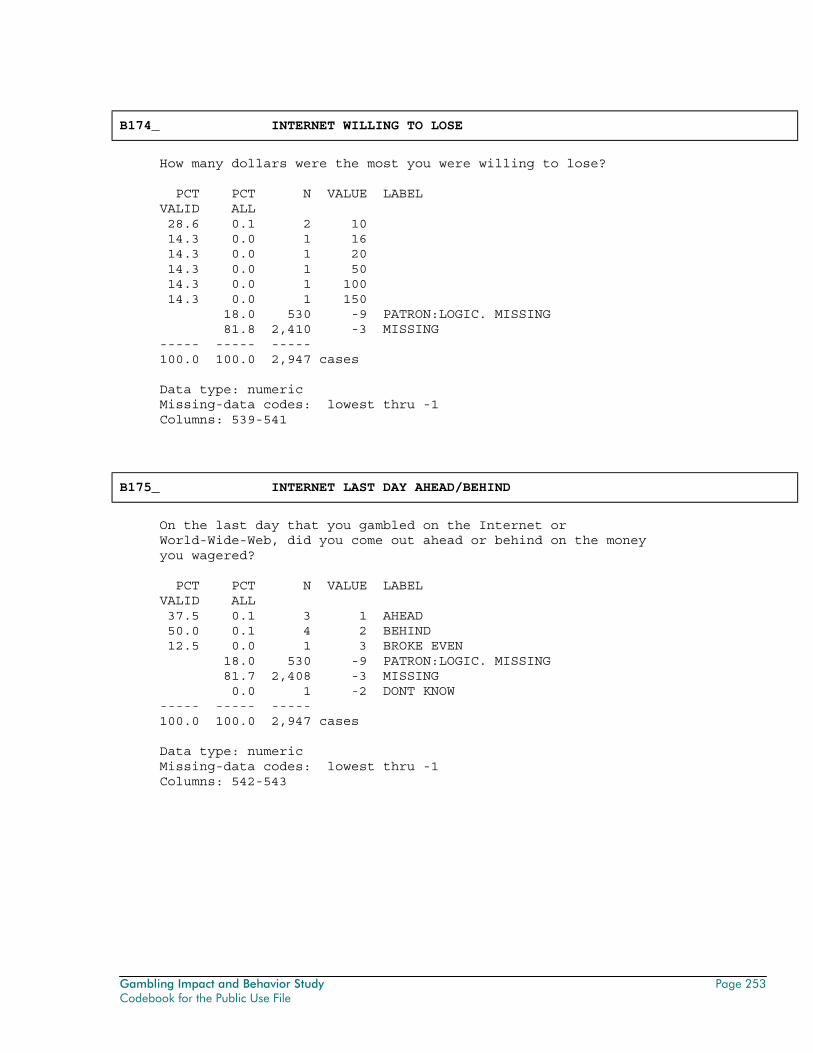
Gambling Impact and Behavior Study Page 253 Codebook for the Public Use File
B174_ INTERNET WILLING TO LOSE
How many dollars were the most you were willing to lose? PCT PCT N VALUE LABEL VALID ALL 28.6 0.1 2 10 14.3 0.0 1 16 14.3 0.0 1 20 14.3 0.0 1 50 14.3 0.0 1 100 14.3 0.0 1 150 18.0 530 -9 PATRON:LOGIC. MISSING 81.8 2,410 -3 MISSING ----- ----- ----- 100.0 100.0 2,947 cases Data type: numeric Missing-data codes: lowest thru -1 Columns: 539-541
B175_ INTERNET LAST DAY AHEAD/BEHIND
On the last day that you gambled on the Internet or World-Wide-Web, did you come out ahead or behind on the money you wagered? PCT PCT N VALUE LABEL VALID ALL 37.5 0.1 3 1 AHEAD 50.0 0.1 4 2 BEHIND 12.5 0.0 1 3 BROKE EVEN 18.0 530 -9 PATRON:LOGIC. MISSING 81.7 2,408 -3 MISSING 0.0 1 -2 DONT KNOW ----- ----- ----- 100.0 100.0 2,947 cases Data type: numeric Missing-data codes: lowest thru -1 Columns: 542-543
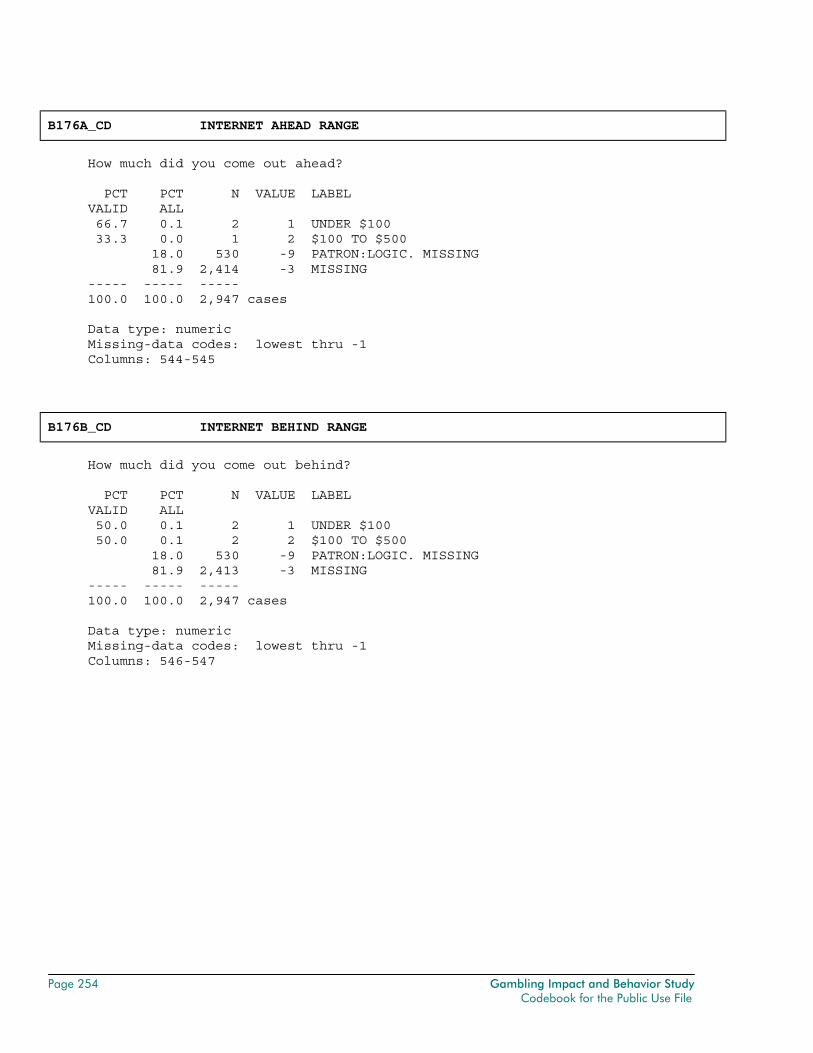
Page 254 Gambling Impact and Behavior Study Codebook for the Public Use File
B176A_CD INTERNET AHEAD RANGE
How much did you come out ahead? PCT PCT N VALUE LABEL VALID ALL 66.7 0.1 2 1 UNDER $100 33.3 0.0 1 2 $100 TO $500 18.0 530 -9 PATRON:LOGIC. MISSING 81.9 2,414 -3 MISSING ----- ----- ----- 100.0 100.0 2,947 cases Data type: numeric Missing-data codes: lowest thru -1 Columns: 544-545
B176B_CD INTERNET BEHIND RANGE
How much did you come out behind? PCT PCT N VALUE LABEL VALID ALL 50.0 0.1 2 1 UNDER $100 50.0 0.1 2 2 $100 TO $500 18.0 530 -9 PATRON:LOGIC. MISSING 81.9 2,413 -3 MISSING ----- ----- ----- 100.0 100.0 2,947 cases Data type: numeric Missing-data codes: lowest thru -1 Columns: 546-547
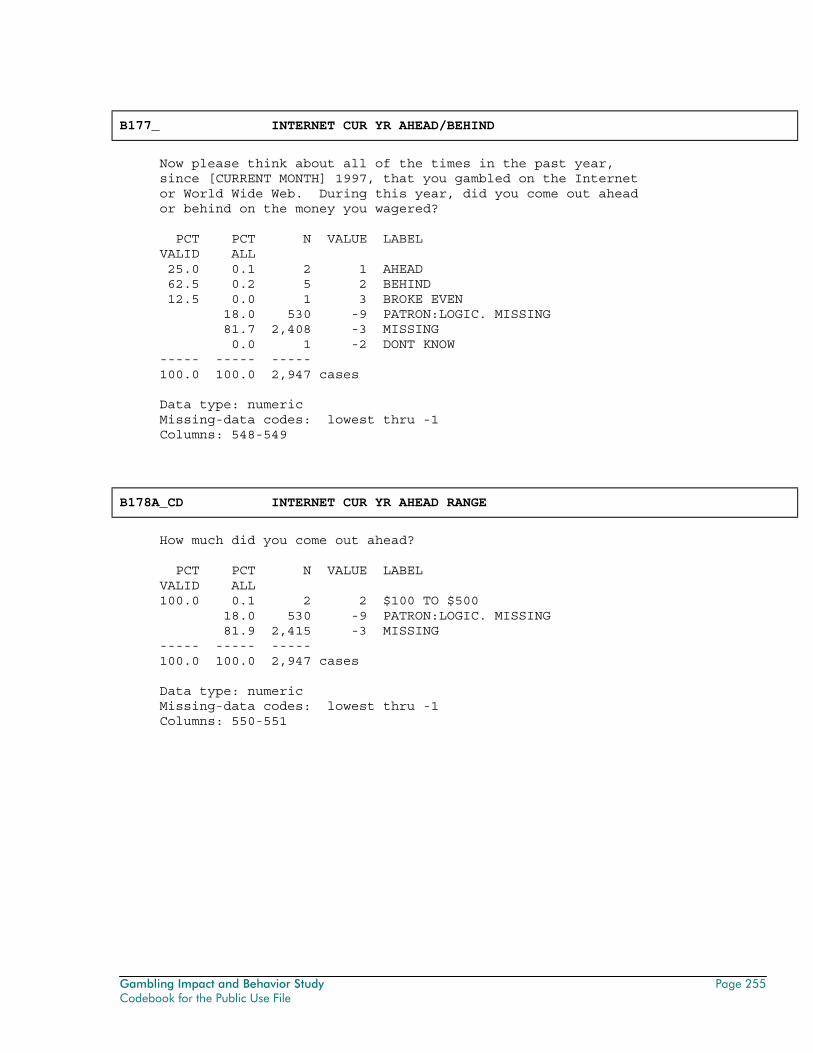
Gambling Impact and Behavior Study Page 255 Codebook for the Public Use File
B177_ INTERNET CUR YR AHEAD/BEHIND
Now please think about all of the times in the past year, since [CURRENT MONTH] 1997, that you gambled on the Internet or World Wide Web. During this year, did you come out ahead or behind on the money you wagered? PCT PCT N VALUE LABEL VALID ALL 25.0 0.1 2 1 AHEAD 62.5 0.2 5 2 BEHIND 12.5 0.0 1 3 BROKE EVEN 18.0 530 -9 PATRON:LOGIC. MISSING 81.7 2,408 -3 MISSING 0.0 1 -2 DONT KNOW ----- ----- ----- 100.0 100.0 2,947 cases Data type: numeric Missing-data codes: lowest thru -1 Columns: 548-549
B178A_CD INTERNET CUR YR AHEAD RANGE
How much did you come out ahead? PCT PCT N VALUE LABEL VALID ALL 100.0 0.1 2 2 $100 TO $500 18.0 530 -9 PATRON:LOGIC. MISSING 81.9 2,415 -3 MISSING ----- ----- ----- 100.0 100.0 2,947 cases Data type: numeric Missing-data codes: lowest thru -1 Columns: 550-551
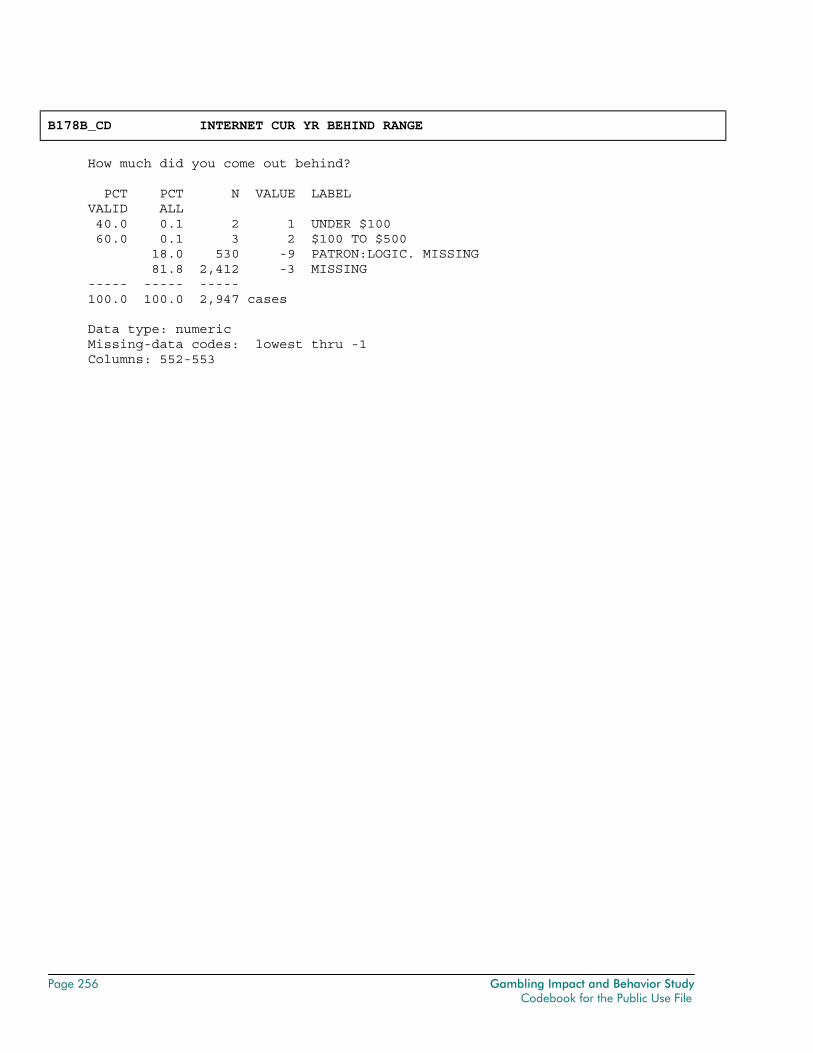
Page 256 Gambling Impact and Behavior Study Codebook for the Public Use File
B178B_CD INTERNET CUR YR BEHIND RANGE
How much did you come out behind? PCT PCT N VALUE LABEL VALID ALL 40.0 0.1 2 1 UNDER $100 60.0 0.1 3 2 $100 TO $500 18.0 530 -9 PATRON:LOGIC. MISSING 81.8 2,412 -3 MISSING ----- ----- ----- 100.0 100.0 2,947 cases Data type: numeric Missing-data codes: lowest thru -1 Columns: 552-553
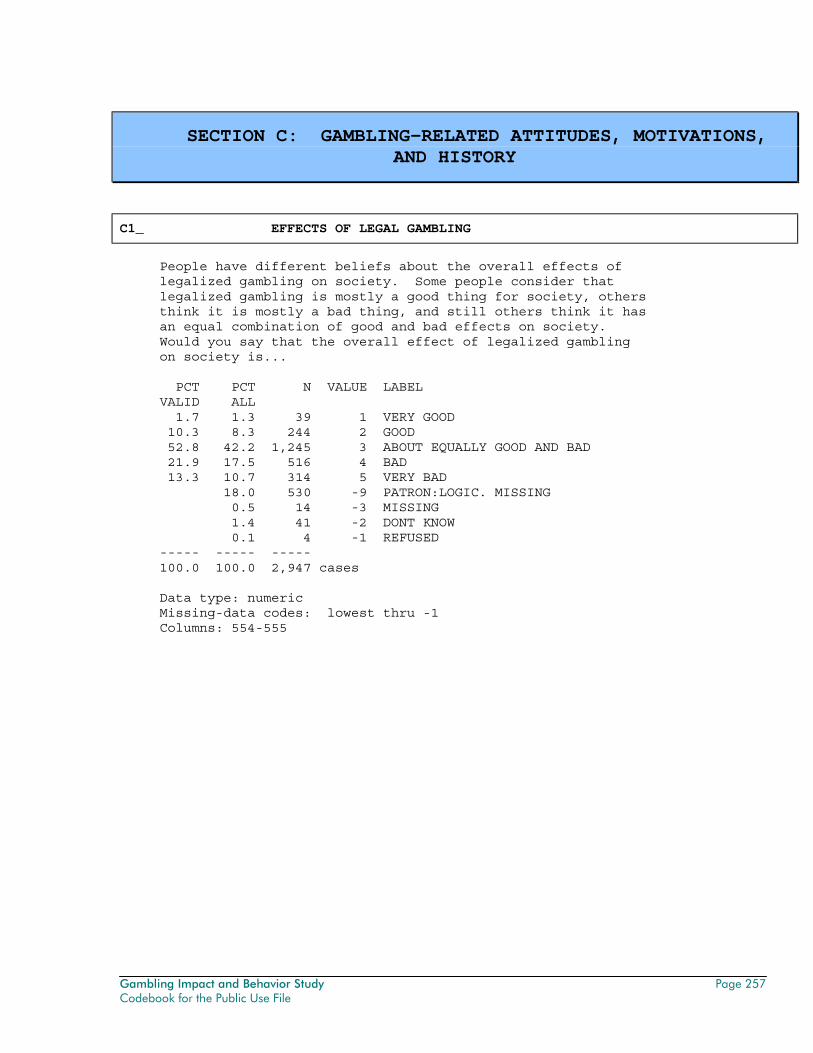
Gambling Impact and Behavior Study Page 257 Codebook for the Public Use File
SECTION C: GAMBLING-RELATED ATTITUDES, MOTIVATIONS, AND HISTORY
C1_ EFFECTS OF LEGAL GAMBLING
People have different beliefs about the overall effects of legalized gambling on society. Some people consider that legalized gambling is mostly a good thing for society, others think it is mostly a bad thing, and still others think it has an equal combination of good and bad effects on society. Would you say that the overall effect of legalized gambling on society is... PCT PCT N VALUE LABEL VALID ALL 1.7 1.3 39 1 VERY GOOD 10.3 8.3 244 2 GOOD 52.8 42.2 1,245 3 ABOUT EQUALLY GOOD AND BAD 21.9 17.5 516 4 BAD 13.3 10.7 314 5 VERY BAD 18.0 530 -9 PATRON:LOGIC. MISSING 0.5 14 -3 MISSING 1.4 41 -2 DONT KNOW 0.1 4 -1 REFUSED ----- ----- ----- 100.0 100.0 2,947 cases Data type: numeric Missing-data codes: lowest thru -1 Columns: 554-555
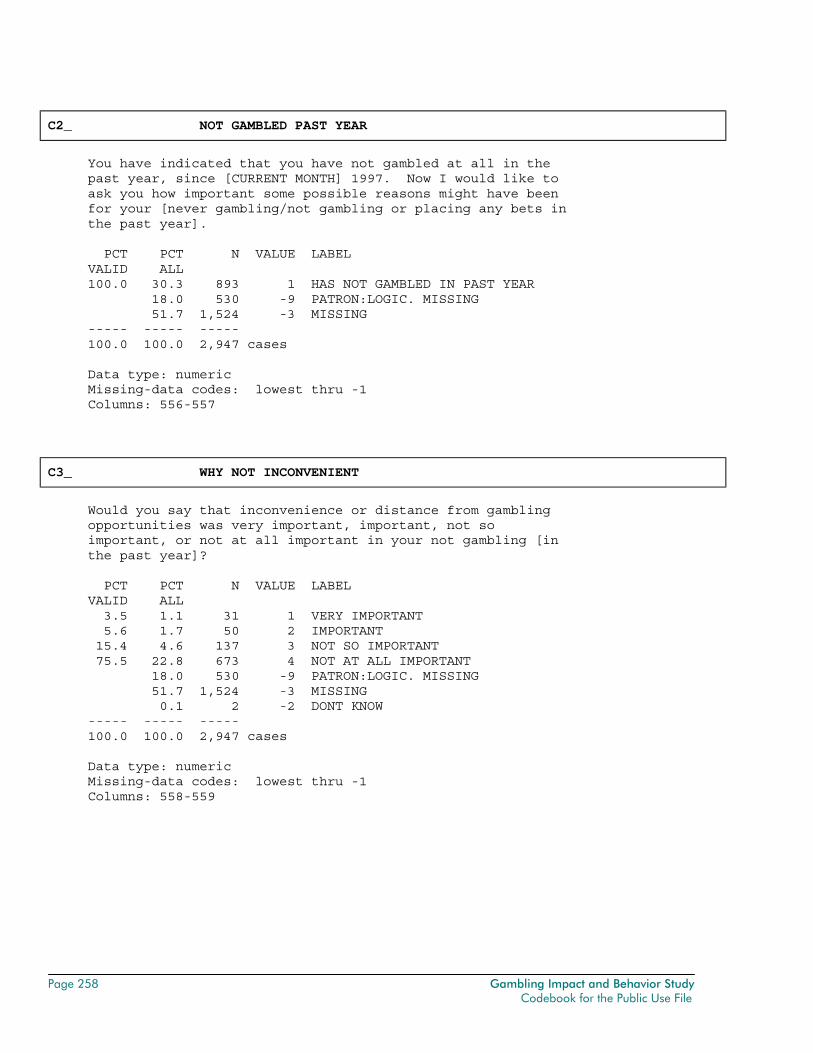
Page 258 Gambling Impact and Behavior Study Codebook for the Public Use File
C2_ NOT GAMBLED PAST YEAR
You have indicated that you have not gambled at all in the past year, since [CURRENT MONTH] 1997. Now I would like to ask you how important some possible reasons might have been for your [never gambling/not gambling or placing any bets in the past year]. PCT PCT N VALUE LABEL VALID ALL 100.0 30.3 893 1 HAS NOT GAMBLED IN PAST YEAR 18.0 530 -9 PATRON:LOGIC. MISSING 51.7 1,524 -3 MISSING ----- ----- ----- 100.0 100.0 2,947 cases Data type: numeric Missing-data codes: lowest thru -1 Columns: 556-557
C3_ WHY NOT INCONVENIENT
Would you say that inconvenience or distance from gambling opportunities was very important, important, not so important, or not at all important in your not gambling [in the past year]? PCT PCT N VALUE LABEL VALID ALL 3.5 1.1 31 1 VERY IMPORTANT 5.6 1.7 50 2 IMPORTANT 15.4 4.6 137 3 NOT SO IMPORTANT 75.5 22.8 673 4 NOT AT ALL IMPORTANT 18.0 530 -9 PATRON:LOGIC. MISSING 51.7 1,524 -3 MISSING 0.1 2 -2 DONT KNOW ----- ----- ----- 100.0 100.0 2,947 cases Data type: numeric Missing-data codes: lowest thru -1 Columns: 558-559
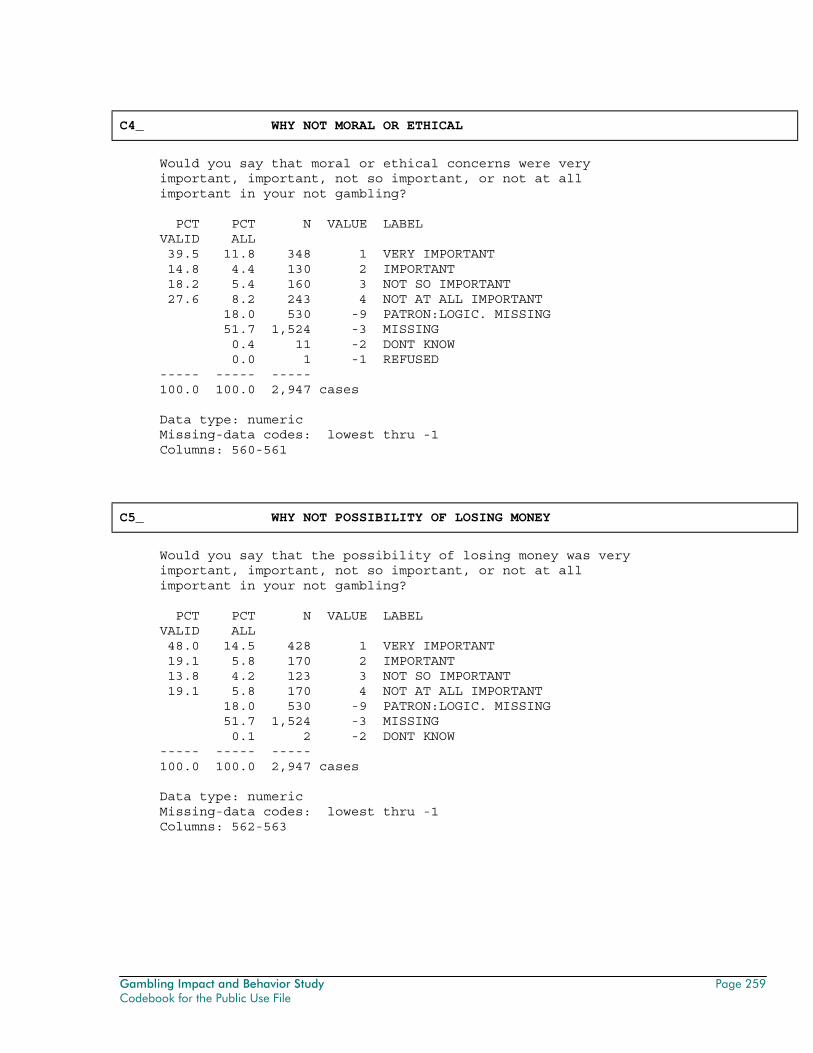
Gambling Impact and Behavior Study Page 259 Codebook for the Public Use File
C4_ WHY NOT MORAL OR ETHICAL
Would you say that moral or ethical concerns were very important, important, not so important, or not at all important in your not gambling? PCT PCT N VALUE LABEL VALID ALL 39.5 11.8 348 1 VERY IMPORTANT 14.8 4.4 130 2 IMPORTANT 18.2 5.4 160 3 NOT SO IMPORTANT 27.6 8.2 243 4 NOT AT ALL IMPORTANT 18.0 530 -9 PATRON:LOGIC. MISSING 51.7 1,524 -3 MISSING 0.4 11 -2 DONT KNOW 0.0 1 -1 REFUSED ----- ----- ----- 100.0 100.0 2,947 cases Data type: numeric Missing-data codes: lowest thru -1 Columns: 560-561
C5_ WHY NOT POSSIBILITY OF LOSING MONEY
Would you say that the possibility of losing money was very important, important, not so important, or not at all important in your not gambling? PCT PCT N VALUE LABEL VALID ALL 48.0 14.5 428 1 VERY IMPORTANT 19.1 5.8 170 2 IMPORTANT 13.8 4.2 123 3 NOT SO IMPORTANT 19.1 5.8 170 4 NOT AT ALL IMPORTANT 18.0 530 -9 PATRON:LOGIC. MISSING 51.7 1,524 -3 MISSING 0.1 2 -2 DONT KNOW ----- ----- ----- 100.0 100.0 2,947 cases Data type: numeric Missing-data codes: lowest thru -1 Columns: 562-563
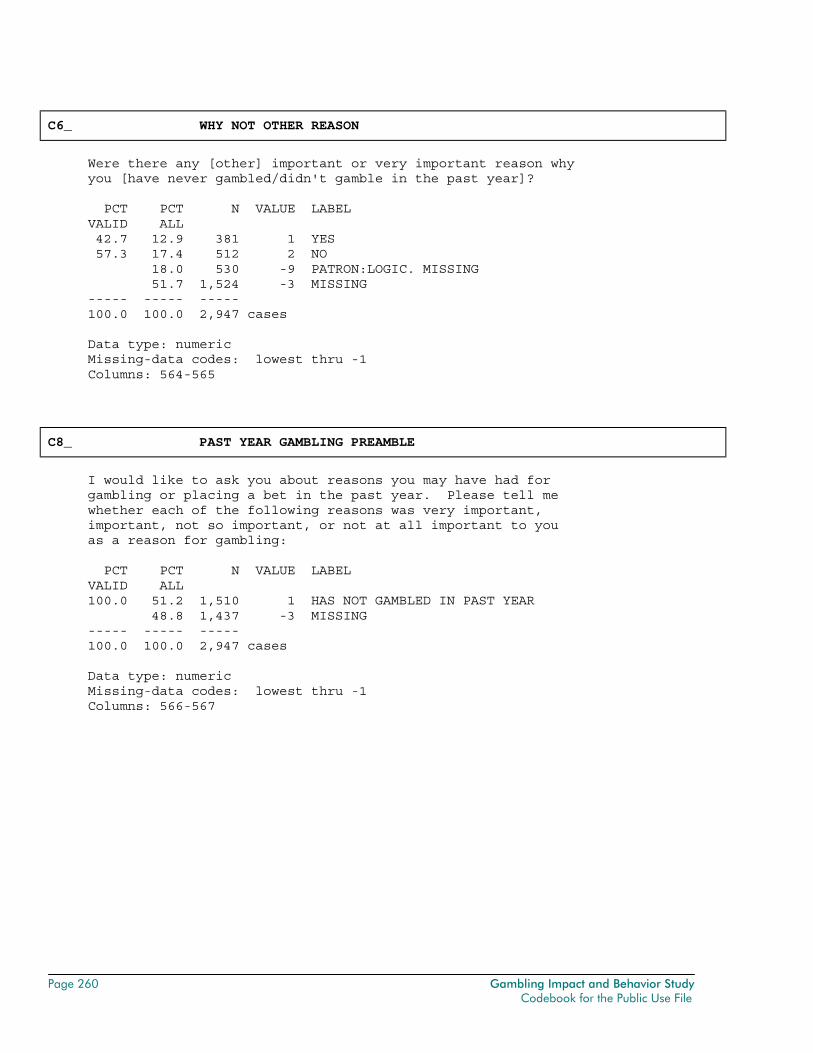
Page 260 Gambling Impact and Behavior Study Codebook for the Public Use File
C6_ WHY NOT OTHER REASON
Were there any [other] important or very important reason why you [have never gambled/didn't gamble in the past year]? PCT PCT N VALUE LABEL VALID ALL 42.7 12.9 381 1 YES 57.3 17.4 512 2 NO 18.0 530 -9 PATRON:LOGIC. MISSING 51.7 1,524 -3 MISSING ----- ----- ----- 100.0 100.0 2,947 cases Data type: numeric Missing-data codes: lowest thru -1 Columns: 564-565
C8_ PAST YEAR GAMBLING PREAMBLE
I would like to ask you about reasons you may have had for gambling or placing a bet in the past year. Please tell me whether each of the following reasons was very important, important, not so important, or not at all important to you as a reason for gambling: PCT PCT N VALUE LABEL VALID ALL 100.0 51.2 1,510 1 HAS NOT GAMBLED IN PAST YEAR 48.8 1,437 -3 MISSING ----- ----- ----- 100.0 100.0 2,947 cases Data type: numeric Missing-data codes: lowest thru -1 Columns: 566-567
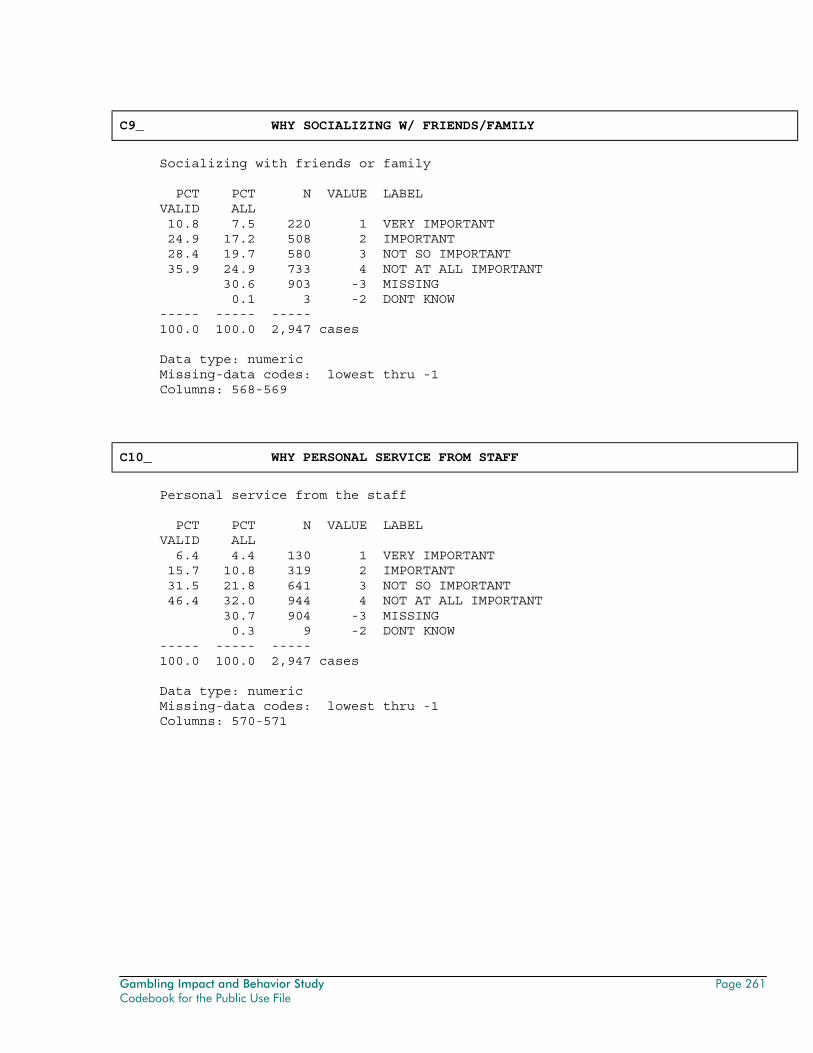
Gambling Impact and Behavior Study Page 261 Codebook for the Public Use File
C9_ WHY SOCIALIZING W/ FRIENDS/FAMILY
Socializing with friends or family PCT PCT N VALUE LABEL VALID ALL 10.8 7.5 220 1 VERY IMPORTANT 24.9 17.2 508 2 IMPORTANT 28.4 19.7 580 3 NOT SO IMPORTANT 35.9 24.9 733 4 NOT AT ALL IMPORTANT 30.6 903 -3 MISSING 0.1 3 -2 DONT KNOW ----- ----- ----- 100.0 100.0 2,947 cases Data type: numeric Missing-data codes: lowest thru -1 Columns: 568-569
C10_ WHY PERSONAL SERVICE FROM STAFF
Personal service from the staff PCT PCT N VALUE LABEL VALID ALL 6.4 4.4 130 1 VERY IMPORTANT 15.7 10.8 319 2 IMPORTANT 31.5 21.8 641 3 NOT SO IMPORTANT 46.4 32.0 944 4 NOT AT ALL IMPORTANT 30.7 904 -3 MISSING 0.3 9 -2 DONT KNOW ----- ----- ----- 100.0 100.0 2,947 cases Data type: numeric Missing-data codes: lowest thru -1 Columns: 570-571
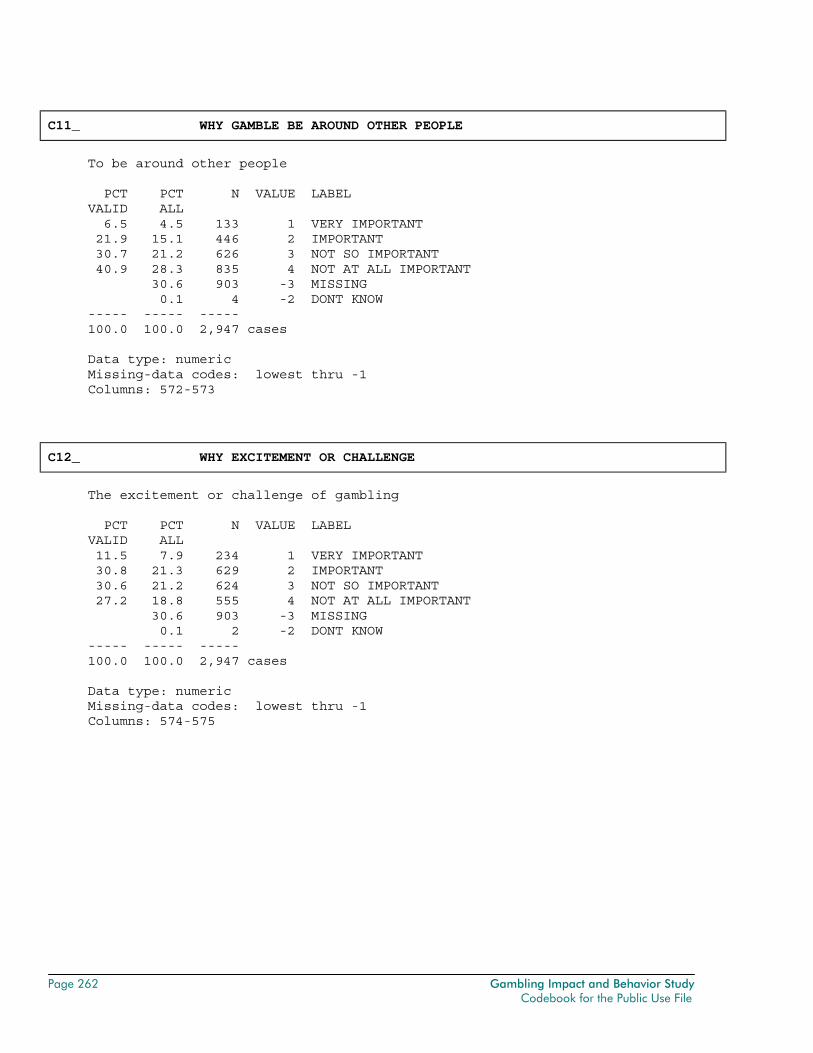
Page 262 Gambling Impact and Behavior Study Codebook for the Public Use File
C11_ WHY GAMBLE BE AROUND OTHER PEOPLE
To be around other people PCT PCT N VALUE LABEL VALID ALL 6.5 4.5 133 1 VERY IMPORTANT 21.9 15.1 446 2 IMPORTANT 30.7 21.2 626 3 NOT SO IMPORTANT 40.9 28.3 835 4 NOT AT ALL IMPORTANT 30.6 903 -3 MISSING 0.1 4 -2 DONT KNOW ----- ----- ----- 100.0 100.0 2,947 cases Data type: numeric Missing-data codes: lowest thru -1 Columns: 572-573
C12_ WHY EXCITEMENT OR CHALLENGE
The excitement or challenge of gambling PCT PCT N VALUE LABEL VALID ALL 11.5 7.9 234 1 VERY IMPORTANT 30.8 21.3 629 2 IMPORTANT 30.6 21.2 624 3 NOT SO IMPORTANT 27.2 18.8 555 4 NOT AT ALL IMPORTANT 30.6 903 -3 MISSING 0.1 2 -2 DONT KNOW ----- ----- ----- 100.0 100.0 2,947 cases Data type: numeric Missing-data codes: lowest thru -1 Columns: 574-575
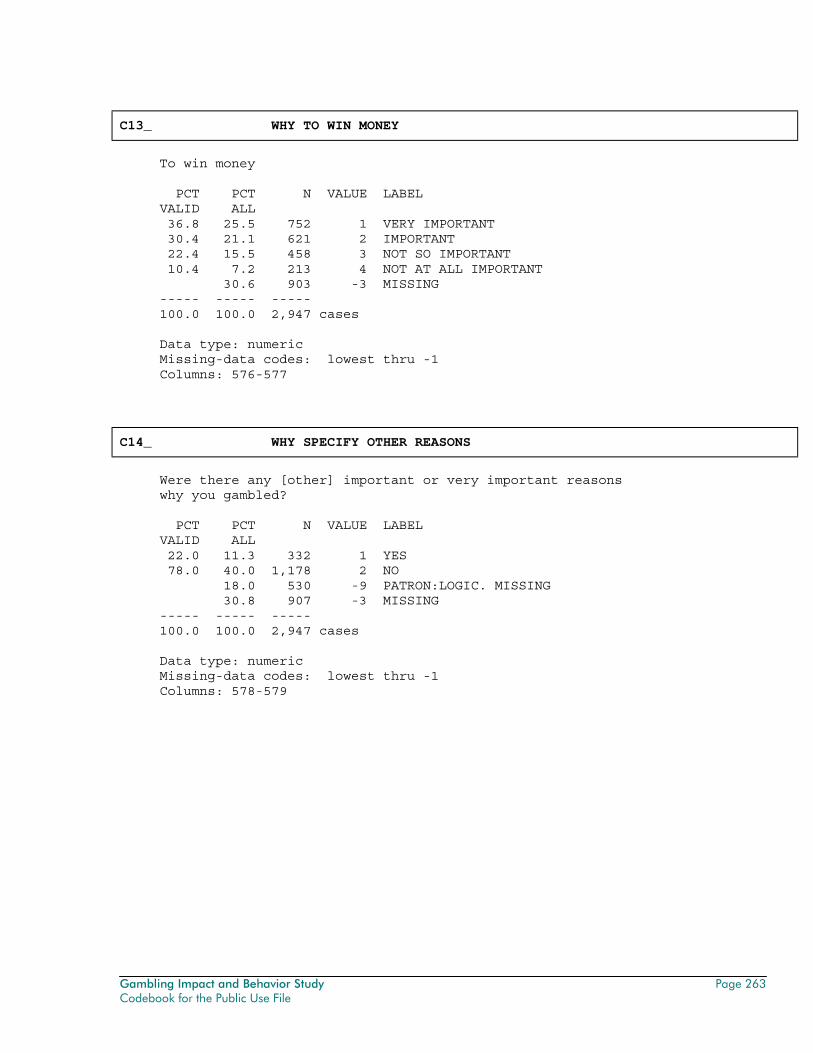
Gambling Impact and Behavior Study Page 263 Codebook for the Public Use File
C13_ WHY TO WIN MONEY
To win money PCT PCT N VALUE LABEL VALID ALL 36.8 25.5 752 1 VERY IMPORTANT 30.4 21.1 621 2 IMPORTANT 22.4 15.5 458 3 NOT SO IMPORTANT 10.4 7.2 213 4 NOT AT ALL IMPORTANT 30.6 903 -3 MISSING ----- ----- ----- 100.0 100.0 2,947 cases Data type: numeric Missing-data codes: lowest thru -1 Columns: 576-577
C14_ WHY SPECIFY OTHER REASONS
Were there any [other] important or very important reasons why you gambled? PCT PCT N VALUE LABEL VALID ALL 22.0 11.3 332 1 YES 78.0 40.0 1,178 2 NO 18.0 530 -9 PATRON:LOGIC. MISSING 30.8 907 -3 MISSING ----- ----- ----- 100.0 100.0 2,947 cases Data type: numeric Missing-data codes: lowest thru -1 Columns: 578-579
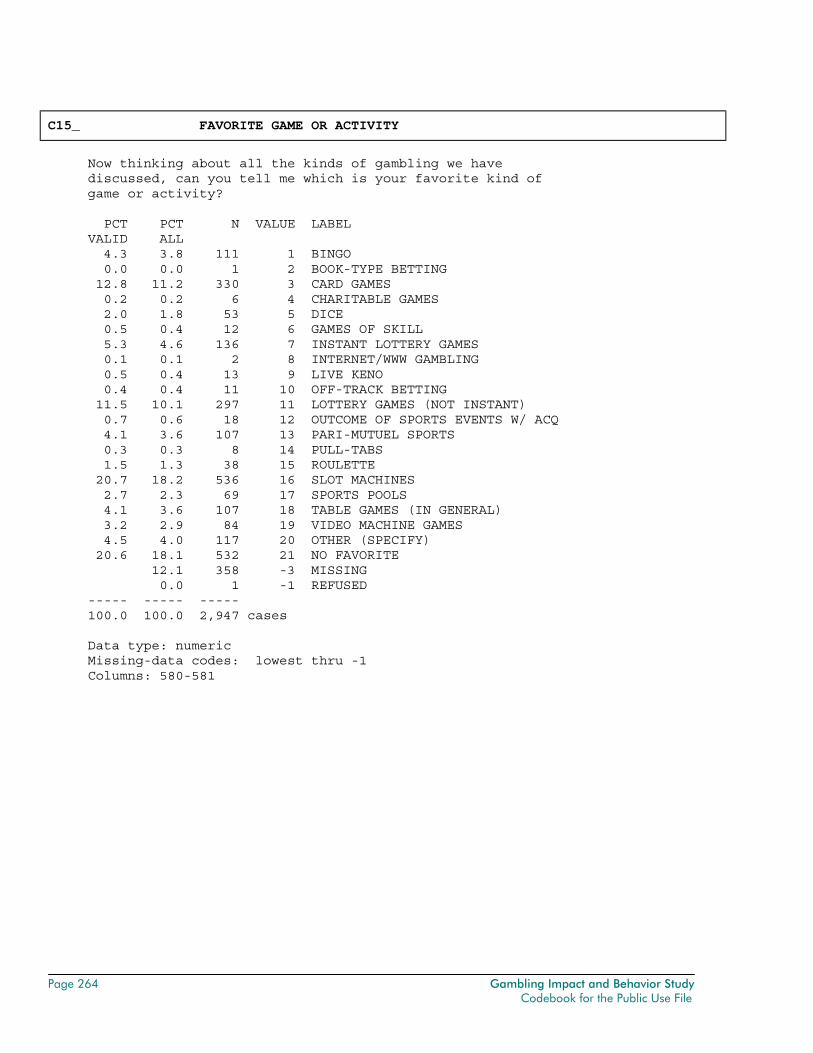
Page 264 Gambling Impact and Behavior Study Codebook for the Public Use File
C15_ FAVORITE GAME OR ACTIVITY
Now thinking about all the kinds of gambling we have discussed, can you tell me which is your favorite kind of game or activity? PCT PCT N VALUE LABEL VALID ALL 4.3 3.8 111 1 BINGO 0.0 0.0 1 2 BOOK-TYPE BETTING 12.8 11.2 330 3 CARD GAMES 0.2 0.2 6 4 CHARITABLE GAMES 2.0 1.8 53 5 DICE 0.5 0.4 12 6 GAMES OF SKILL 5.3 4.6 136 7 INSTANT LOTTERY GAMES 0.1 0.1 2 8 INTERNET/WWW GAMBLING 0.5 0.4 13 9 LIVE KENO 0.4 0.4 11 10 OFF-TRACK BETTING 11.5 10.1 297 11 LOTTERY GAMES (NOT INSTANT) 0.7 0.6 18 12 OUTCOME OF SPORTS EVENTS W/ ACQ 4.1 3.6 107 13 PARI-MUTUEL SPORTS 0.3 0.3 8 14 PULL-TABS 1.5 1.3 38 15 ROULETTE 20.7 18.2 536 16 SLOT MACHINES 2.7 2.3 69 17 SPORTS POOLS 4.1 3.6 107 18 TABLE GAMES (IN GENERAL) 3.2 2.9 84 19 VIDEO MACHINE GAMES 4.5 4.0 117 20 OTHER (SPECIFY) 20.6 18.1 532 21 NO FAVORITE 12.1 358 -3 MISSING 0.0 1 -1 REFUSED ----- ----- ----- 100.0 100.0 2,947 cases Data type: numeric Missing-data codes: lowest thru -1 Columns: 580-581
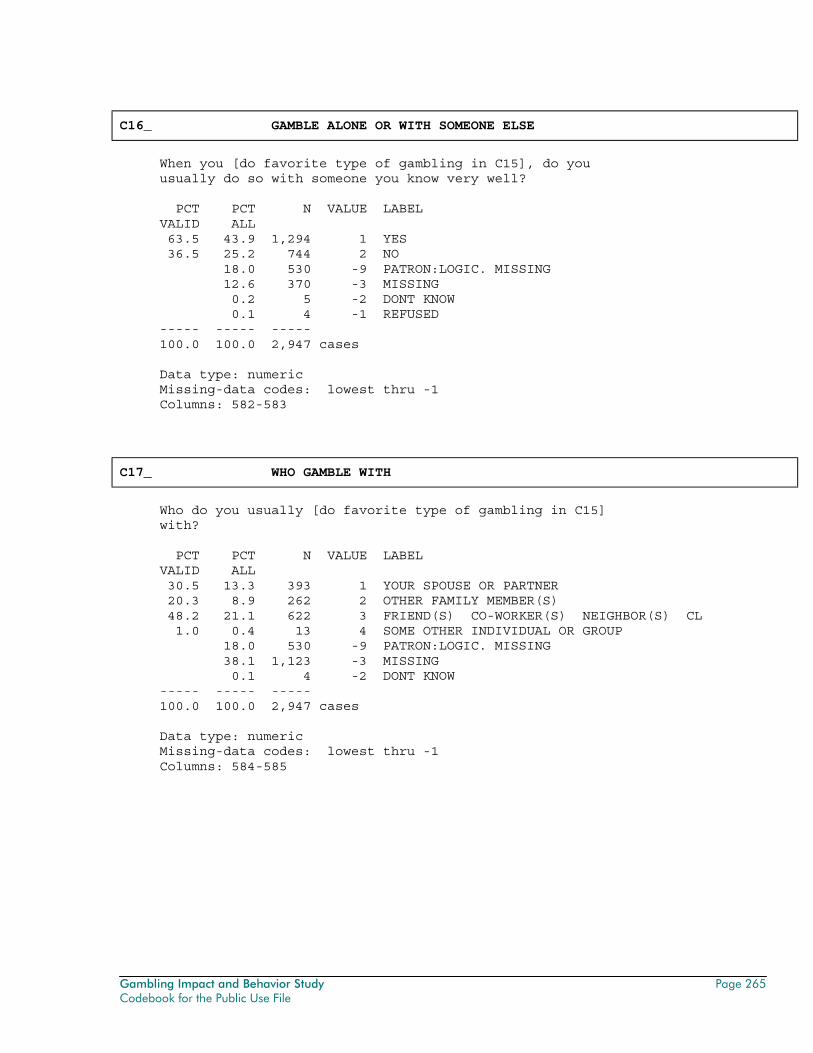
Gambling Impact and Behavior Study Page 265 Codebook for the Public Use File
C16_ GAMBLE ALONE OR WITH SOMEONE ELSE
When you [do favorite type of gambling in C15], do you usually do so with someone you know very well? PCT PCT N VALUE LABEL VALID ALL 63.5 43.9 1,294 1 YES 36.5 25.2 744 2 NO 18.0 530 -9 PATRON:LOGIC. MISSING 12.6 370 -3 MISSING 0.2 5 -2 DONT KNOW 0.1 4 -1 REFUSED ----- ----- ----- 100.0 100.0 2,947 cases Data type: numeric Missing-data codes: lowest thru -1 Columns: 582-583
C17_ WHO GAMBLE WITH
Who do you usually [do favorite type of gambling in C15] with? PCT PCT N VALUE LABEL VALID ALL 30.5 13.3 393 1 YOUR SPOUSE OR PARTNER 20.3 8.9 262 2 OTHER FAMILY MEMBER(S) 48.2 21.1 622 3 FRIEND(S) CO-WORKER(S) NEIGHBOR(S) CL 1.0 0.4 13 4 SOME OTHER INDIVIDUAL OR GROUP 18.0 530 -9 PATRON:LOGIC. MISSING 38.1 1,123 -3 MISSING 0.1 4 -2 DONT KNOW ----- ----- ----- 100.0 100.0 2,947 cases Data type: numeric Missing-data codes: lowest thru -1 Columns: 584-585
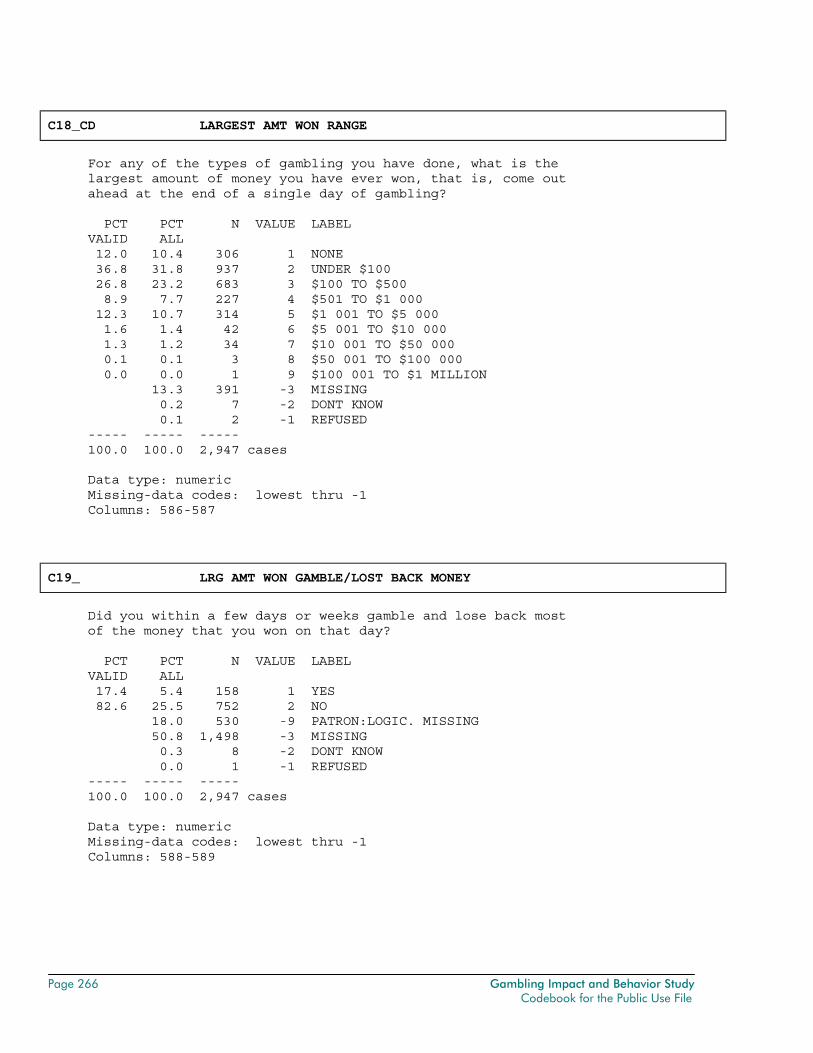
Page 266 Gambling Impact and Behavior Study Codebook for the Public Use File
C18_CD LARGEST AMT WON RANGE
For any of the types of gambling you have done, what is the largest amount of money you have ever won, that is, come out ahead at the end of a single day of gambling? PCT PCT N VALUE LABEL VALID ALL 12.0 10.4 306 1 NONE 36.8 31.8 937 2 UNDER $100 26.8 23.2 683 3 $100 TO $500 8.9 7.7 227 4 $501 TO $1 000 12.3 10.7 314 5 $1 001 TO $5 000 1.6 1.4 42 6 $5 001 TO $10 000 1.3 1.2 34 7 $10 001 TO $50 000 0.1 0.1 3 8 $50 001 TO $100 000 0.0 0.0 1 9 $100 001 TO $1 MILLION 13.3 391 -3 MISSING 0.2 7 -2 DONT KNOW 0.1 2 -1 REFUSED ----- ----- ----- 100.0 100.0 2,947 cases Data type: numeric Missing-data codes: lowest thru -1 Columns: 586-587
C19_ LRG AMT WON GAMBLE/LOST BACK MONEY
Did you within a few days or weeks gamble and lose back most of the money that you won on that day? PCT PCT N VALUE LABEL VALID ALL 17.4 5.4 158 1 YES 82.6 25.5 752 2 NO 18.0 530 -9 PATRON:LOGIC. MISSING 50.8 1,498 -3 MISSING 0.3 8 -2 DONT KNOW 0.0 1 -1 REFUSED ----- ----- ----- 100.0 100.0 2,947 cases Data type: numeric Missing-data codes: lowest thru -1 Columns: 588-589
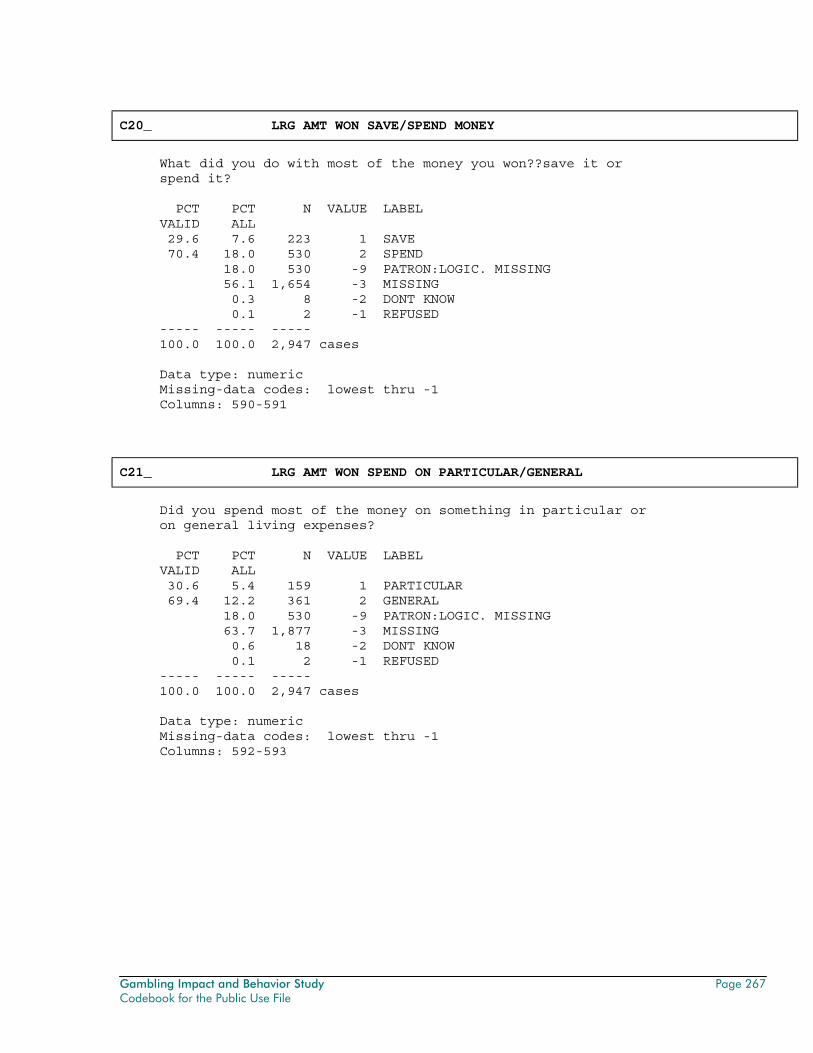
Gambling Impact and Behavior Study Page 267 Codebook for the Public Use File
C20_ LRG AMT WON SAVE/SPEND MONEY
What did you do with most of the money you won??save it or spend it? PCT PCT N VALUE LABEL VALID ALL 29.6 7.6 223 1 SAVE 70.4 18.0 530 2 SPEND 18.0 530 -9 PATRON:LOGIC. MISSING 56.1 1,654 -3 MISSING 0.3 8 -2 DONT KNOW 0.1 2 -1 REFUSED ----- ----- ----- 100.0 100.0 2,947 cases Data type: numeric Missing-data codes: lowest thru -1 Columns: 590-591
C21_ LRG AMT WON SPEND ON PARTICULAR/GENERAL
Did you spend most of the money on something in particular or on general living expenses? PCT PCT N VALUE LABEL VALID ALL 30.6 5.4 159 1 PARTICULAR 69.4 12.2 361 2 GENERAL 18.0 530 -9 PATRON:LOGIC. MISSING 63.7 1,877 -3 MISSING 0.6 18 -2 DONT KNOW 0.1 2 -1 REFUSED ----- ----- ----- 100.0 100.0 2,947 cases Data type: numeric Missing-data codes: lowest thru -1 Columns: 592-593
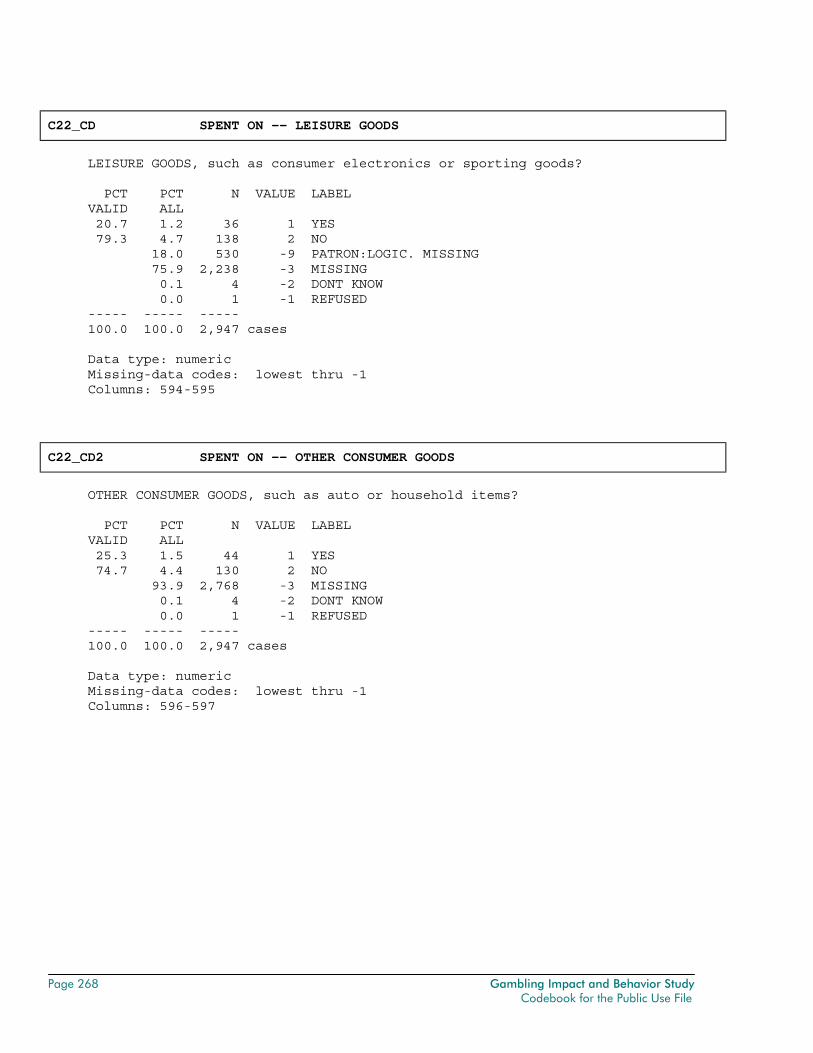
Page 268 Gambling Impact and Behavior Study Codebook for the Public Use File
C22_CD SPENT ON -- LEISURE GOODS
LEISURE GOODS, such as consumer electronics or sporting goods? PCT PCT N VALUE LABEL VALID ALL 20.7 1.2 36 1 YES 79.3 4.7 138 2 NO 18.0 530 -9 PATRON:LOGIC. MISSING 75.9 2,238 -3 MISSING 0.1 4 -2 DONT KNOW 0.0 1 -1 REFUSED ----- ----- ----- 100.0 100.0 2,947 cases Data type: numeric Missing-data codes: lowest thru -1 Columns: 594-595
C22_CD2 SPENT ON -- OTHER CONSUMER GOODS
OTHER CONSUMER GOODS, such as auto or household items? PCT PCT N VALUE LABEL VALID ALL 25.3 1.5 44 1 YES 74.7 4.4 130 2 NO 93.9 2,768 -3 MISSING 0.1 4 -2 DONT KNOW 0.0 1 -1 REFUSED ----- ----- ----- 100.0 100.0 2,947 cases Data type: numeric Missing-data codes: lowest thru -1 Columns: 596-597
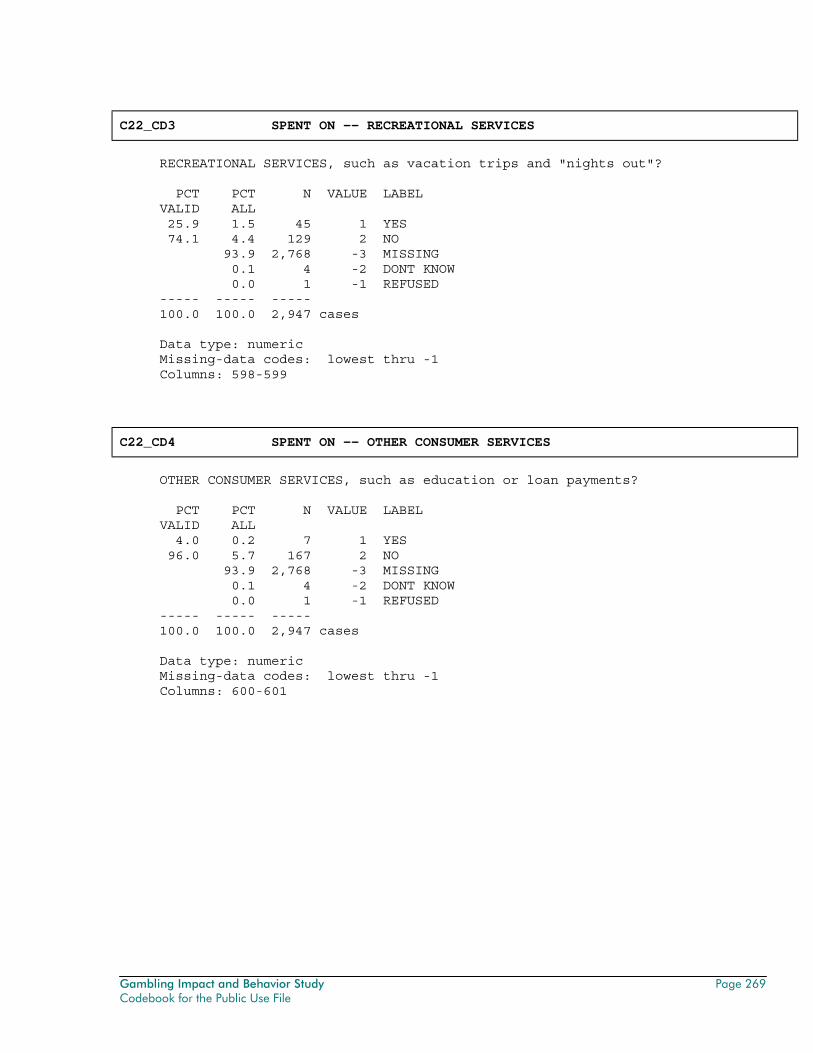
Gambling Impact and Behavior Study Page 269 Codebook for the Public Use File
C22_CD3 SPENT ON -- RECREATIONAL SERVICES
RECREATIONAL SERVICES, such as vacation trips and "nights out"? PCT PCT N VALUE LABEL VALID ALL 25.9 1.5 45 1 YES 74.1 4.4 129 2 NO 93.9 2,768 -3 MISSING 0.1 4 -2 DONT KNOW 0.0 1 -1 REFUSED ----- ----- ----- 100.0 100.0 2,947 cases Data type: numeric Missing-data codes: lowest thru -1 Columns: 598-599
C22_CD4 SPENT ON -- OTHER CONSUMER SERVICES
OTHER CONSUMER SERVICES, such as education or loan payments? PCT PCT N VALUE LABEL VALID ALL 4.0 0.2 7 1 YES 96.0 5.7 167 2 NO 93.9 2,768 -3 MISSING 0.1 4 -2 DONT KNOW 0.0 1 -1 REFUSED ----- ----- ----- 100.0 100.0 2,947 cases Data type: numeric Missing-data codes: lowest thru -1 Columns: 600-601
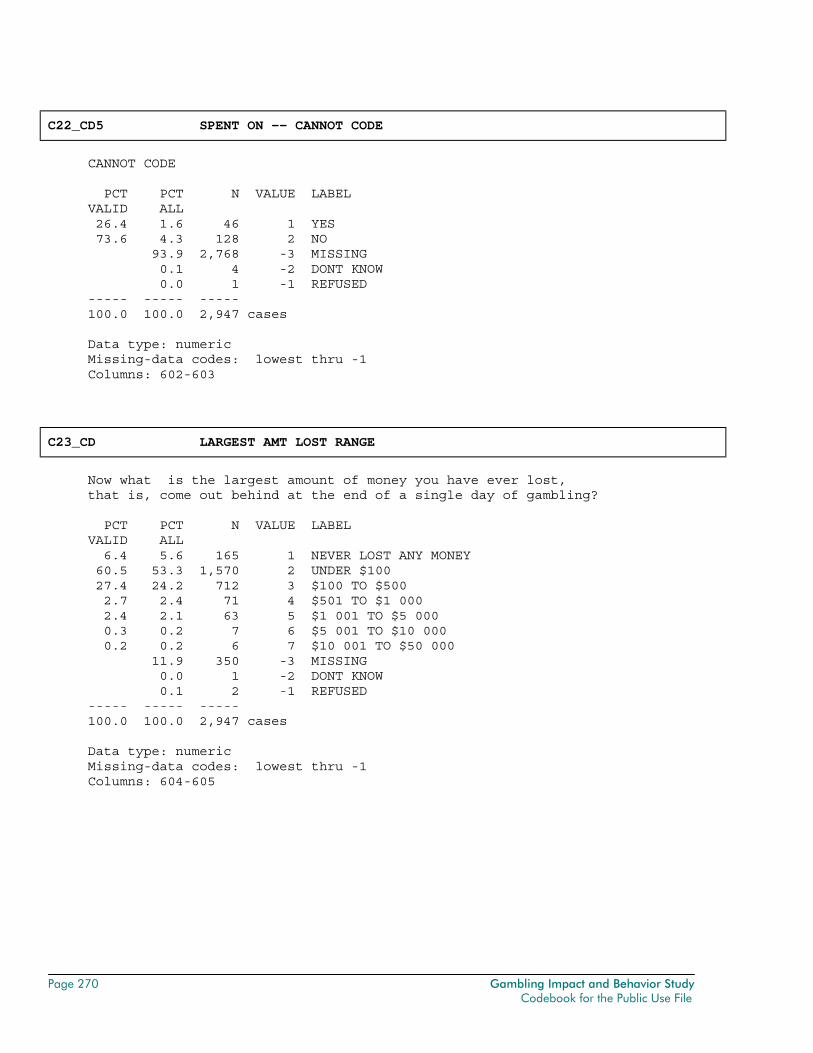
Page 270 Gambling Impact and Behavior Study Codebook for the Public Use File
C22_CD5 SPENT ON -- CANNOT CODE
CANNOT CODE PCT PCT N VALUE LABEL VALID ALL 26.4 1.6 46 1 YES 73.6 4.3 128 2 NO 93.9 2,768 -3 MISSING 0.1 4 -2 DONT KNOW 0.0 1 -1 REFUSED ----- ----- ----- 100.0 100.0 2,947 cases Data type: numeric Missing-data codes: lowest thru -1 Columns: 602-603
C23_CD LARGEST AMT LOST RANGE
Now what is the largest amount of money you have ever lost, that is, come out behind at the end of a single day of gambling? PCT PCT N VALUE LABEL VALID ALL 6.4 5.6 165 1 NEVER LOST ANY MONEY 60.5 53.3 1,570 2 UNDER $100 27.4 24.2 712 3 $100 TO $500 2.7 2.4 71 4 $501 TO $1 000 2.4 2.1 63 5 $1 001 TO $5 000 0.3 0.2 7 6 $5 001 TO $10 000 0.2 0.2 6 7 $10 001 TO $50 000 11.9 350 -3 MISSING 0.0 1 -2 DONT KNOW 0.1 2 -1 REFUSED ----- ----- ----- 100.0 100.0 2,947 cases Data type: numeric Missing-data codes: lowest thru -1 Columns: 604-605
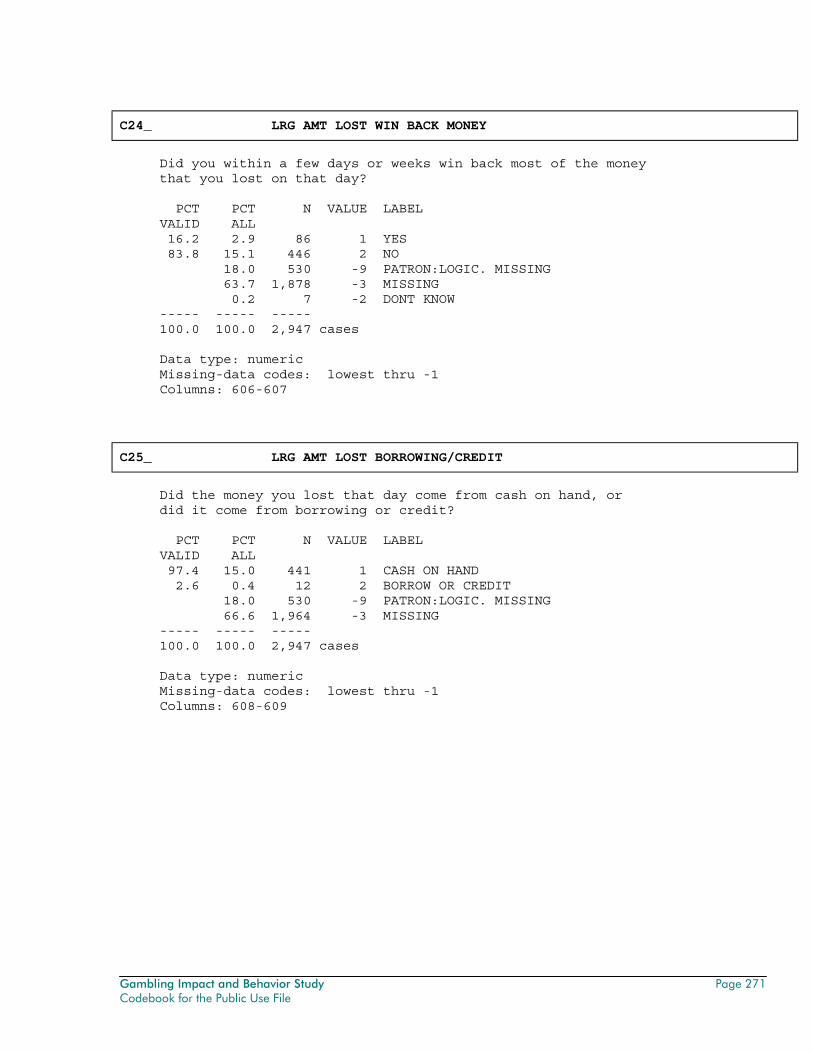
Gambling Impact and Behavior Study Page 271 Codebook for the Public Use File
C24_ LRG AMT LOST WIN BACK MONEY
Did you within a few days or weeks win back most of the money that you lost on that day? PCT PCT N VALUE LABEL VALID ALL 16.2 2.9 86 1 YES 83.8 15.1 446 2 NO 18.0 530 -9 PATRON:LOGIC. MISSING 63.7 1,878 -3 MISSING 0.2 7 -2 DONT KNOW ----- ----- ----- 100.0 100.0 2,947 cases Data type: numeric Missing-data codes: lowest thru -1 Columns: 606-607
C25_ LRG AMT LOST BORROWING/CREDIT
Did the money you lost that day come from cash on hand, or did it come from borrowing or credit? PCT PCT N VALUE LABEL VALID ALL 97.4 15.0 441 1 CASH ON HAND 2.6 0.4 12 2 BORROW OR CREDIT 18.0 530 -9 PATRON:LOGIC. MISSING 66.6 1,964 -3 MISSING ----- ----- ----- 100.0 100.0 2,947 cases Data type: numeric Missing-data codes: lowest thru -1 Columns: 608-609
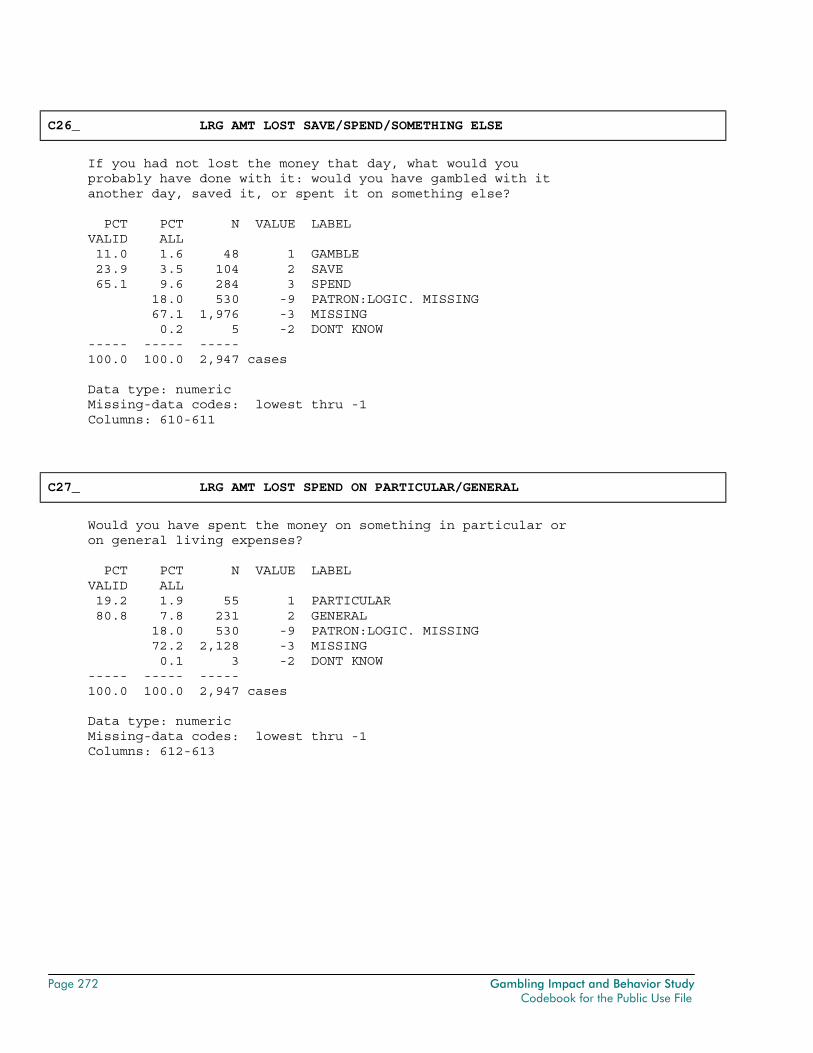
Page 272 Gambling Impact and Behavior Study Codebook for the Public Use File
C26_ LRG AMT LOST SAVE/SPEND/SOMETHING ELSE
If you had not lost the money that day, what would you probably have done with it: would you have gambled with it another day, saved it, or spent it on something else? PCT PCT N VALUE LABEL VALID ALL 11.0 1.6 48 1 GAMBLE 23.9 3.5 104 2 SAVE 65.1 9.6 284 3 SPEND 18.0 530 -9 PATRON:LOGIC. MISSING 67.1 1,976 -3 MISSING 0.2 5 -2 DONT KNOW ----- ----- ----- 100.0 100.0 2,947 cases Data type: numeric Missing-data codes: lowest thru -1 Columns: 610-611
C27_ LRG AMT LOST SPEND ON PARTICULAR/GENERAL
Would you have spent the money on something in particular or on general living expenses? PCT PCT N VALUE LABEL VALID ALL 19.2 1.9 55 1 PARTICULAR 80.8 7.8 231 2 GENERAL 18.0 530 -9 PATRON:LOGIC. MISSING 72.2 2,128 -3 MISSING 0.1 3 -2 DONT KNOW ----- ----- ----- 100.0 100.0 2,947 cases Data type: numeric Missing-data codes: lowest thru -1 Columns: 612-613
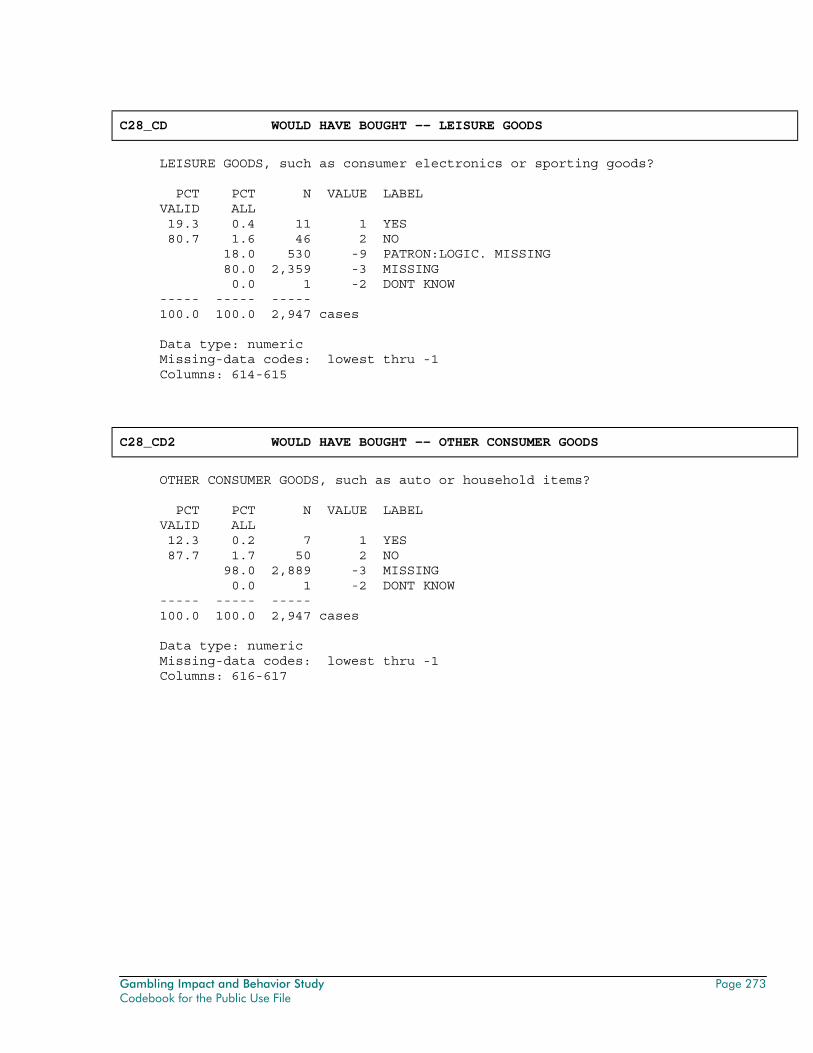
Gambling Impact and Behavior Study Page 273 Codebook for the Public Use File
C28_CD WOULD HAVE BOUGHT -- LEISURE GOODS
LEISURE GOODS, such as consumer electronics or sporting goods? PCT PCT N VALUE LABEL VALID ALL 19.3 0.4 11 1 YES 80.7 1.6 46 2 NO 18.0 530 -9 PATRON:LOGIC. MISSING 80.0 2,359 -3 MISSING 0.0 1 -2 DONT KNOW ----- ----- ----- 100.0 100.0 2,947 cases Data type: numeric Missing-data codes: lowest thru -1 Columns: 614-615
C28_CD2 WOULD HAVE BOUGHT -- OTHER CONSUMER GOODS
OTHER CONSUMER GOODS, such as auto or household items? PCT PCT N VALUE LABEL VALID ALL 12.3 0.2 7 1 YES 87.7 1.7 50 2 NO 98.0 2,889 -3 MISSING 0.0 1 -2 DONT KNOW ----- ----- ----- 100.0 100.0 2,947 cases Data type: numeric Missing-data codes: lowest thru -1 Columns: 616-617
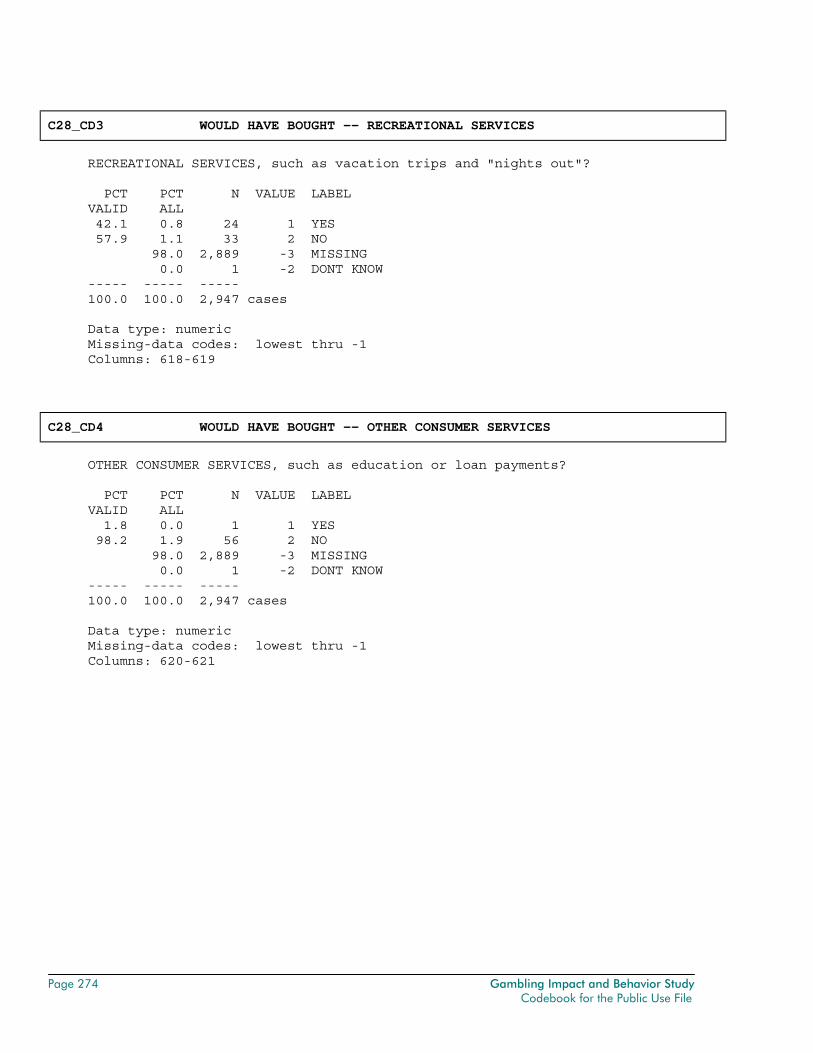
Page 274 Gambling Impact and Behavior Study Codebook for the Public Use File
C28_CD3 WOULD HAVE BOUGHT -- RECREATIONAL SERVICES
RECREATIONAL SERVICES, such as vacation trips and "nights out"? PCT PCT N VALUE LABEL VALID ALL 42.1 0.8 24 1 YES 57.9 1.1 33 2 NO 98.0 2,889 -3 MISSING 0.0 1 -2 DONT KNOW ----- ----- ----- 100.0 100.0 2,947 cases Data type: numeric Missing-data codes: lowest thru -1 Columns: 618-619
C28_CD4 WOULD HAVE BOUGHT -- OTHER CONSUMER SERVICES
OTHER CONSUMER SERVICES, such as education or loan payments? PCT PCT N VALUE LABEL VALID ALL 1.8 0.0 1 1 YES 98.2 1.9 56 2 NO 98.0 2,889 -3 MISSING 0.0 1 -2 DONT KNOW ----- ----- ----- 100.0 100.0 2,947 cases Data type: numeric Missing-data codes: lowest thru -1 Columns: 620-621
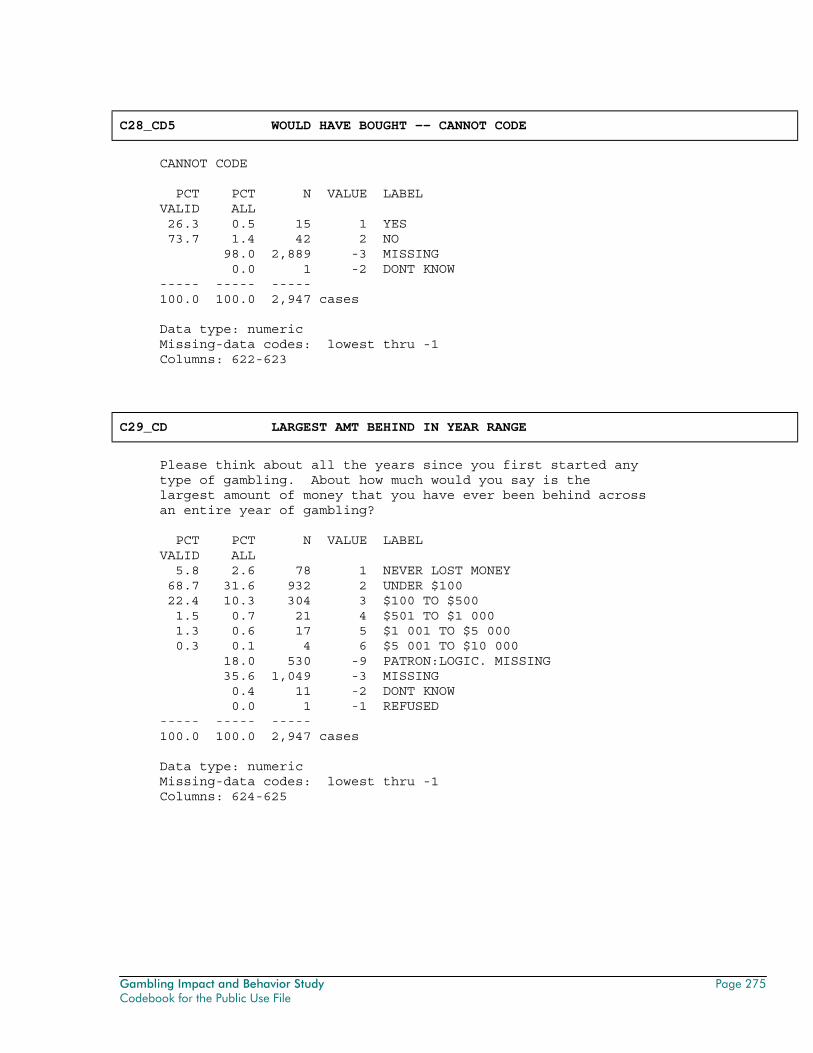
Gambling Impact and Behavior Study Page 275 Codebook for the Public Use File
C28_CD5 WOULD HAVE BOUGHT -- CANNOT CODE
CANNOT CODE PCT PCT N VALUE LABEL VALID ALL 26.3 0.5 15 1 YES 73.7 1.4 42 2 NO 98.0 2,889 -3 MISSING 0.0 1 -2 DONT KNOW ----- ----- ----- 100.0 100.0 2,947 cases Data type: numeric Missing-data codes: lowest thru -1 Columns: 622-623
C29_CD LARGEST AMT BEHIND IN YEAR RANGE
Please think about all the years since you first started any type of gambling. About how much would you say is the largest amount of money that you have ever been behind across an entire year of gambling? PCT PCT N VALUE LABEL VALID ALL 5.8 2.6 78 1 NEVER LOST MONEY 68.7 31.6 932 2 UNDER $100 22.4 10.3 304 3 $100 TO $500 1.5 0.7 21 4 $501 TO $1 000 1.3 0.6 17 5 $1 001 TO $5 000 0.3 0.1 4 6 $5 001 TO $10 000 18.0 530 -9 PATRON:LOGIC. MISSING 35.6 1,049 -3 MISSING 0.4 11 -2 DONT KNOW 0.0 1 -1 REFUSED ----- ----- ----- 100.0 100.0 2,947 cases Data type: numeric Missing-data codes: lowest thru -1 Columns: 624-625
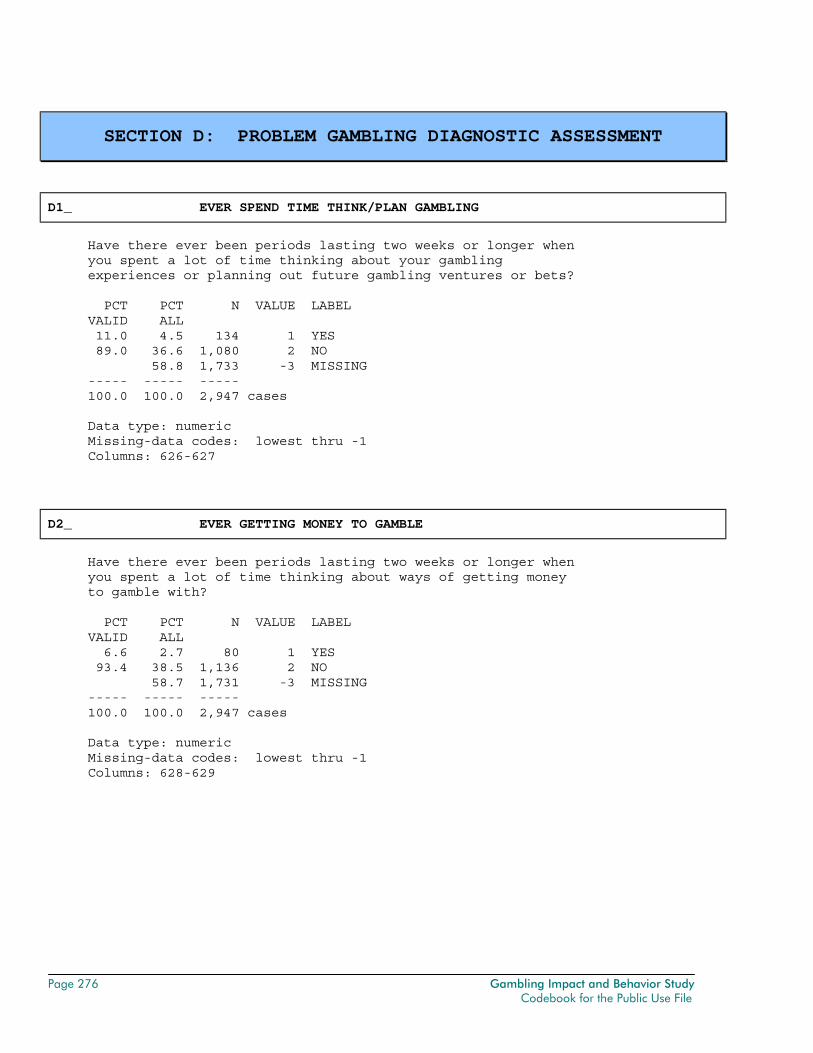
Page 276 Gambling Impact and Behavior Study Codebook for the Public Use File
SECTION D: PROBLEM GAMBLING DIAGNOSTIC ASSESSMENT
D1_ EVER SPEND TIME THINK/PLAN GAMBLING
Have there ever been periods lasting two weeks or longer when you spent a lot of time thinking about your gambling experiences or planning out future gambling ventures or bets? PCT PCT N VALUE LABEL VALID ALL 11.0 4.5 134 1 YES 89.0 36.6 1,080 2 NO 58.8 1,733 -3 MISSING ----- ----- ----- 100.0 100.0 2,947 cases Data type: numeric Missing-data codes: lowest thru -1 Columns: 626-627
D2_ EVER GETTING MONEY TO GAMBLE
Have there ever been periods lasting two weeks or longer when you spent a lot of time thinking about ways of getting money to gamble with? PCT PCT N VALUE LABEL VALID ALL 6.6 2.7 80 1 YES 93.4 38.5 1,136 2 NO 58.7 1,731 -3 MISSING ----- ----- ----- 100.0 100.0 2,947 cases Data type: numeric Missing-data codes: lowest thru -1 Columns: 628-629
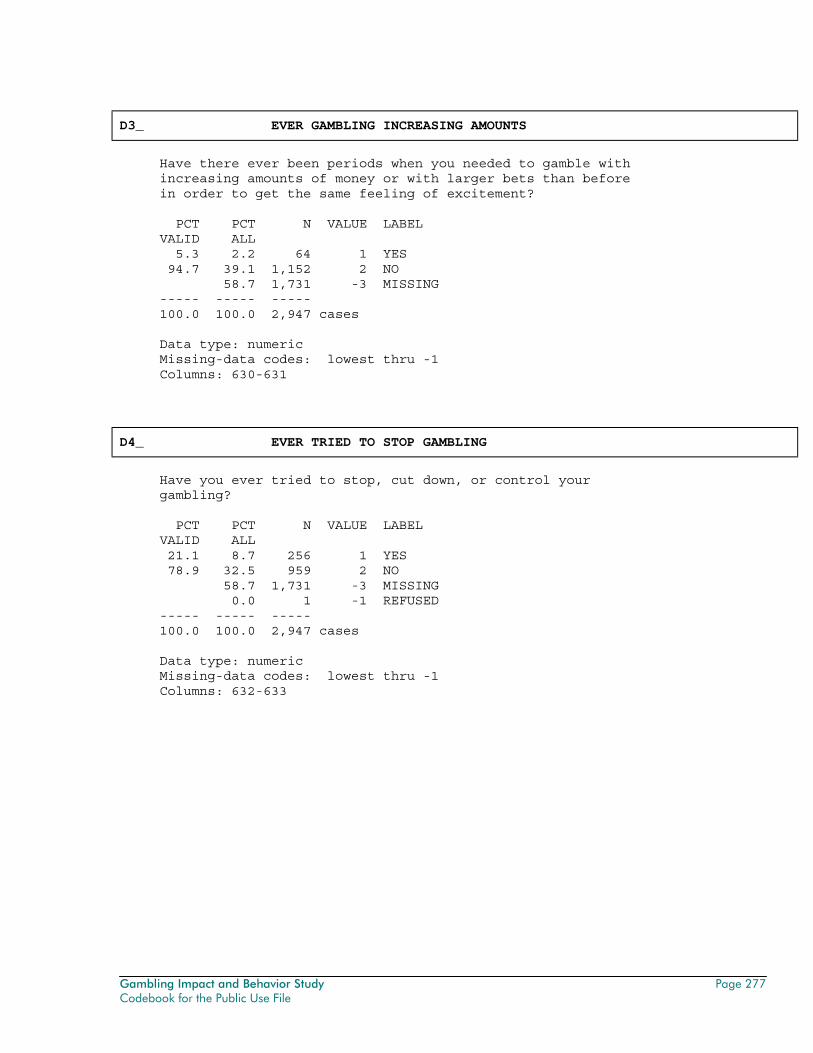
Gambling Impact and Behavior Study Page 277 Codebook for the Public Use File
D3_ EVER GAMBLING INCREASING AMOUNTS
Have there ever been periods when you needed to gamble with increasing amounts of money or with larger bets than before in order to get the same feeling of excitement? PCT PCT N VALUE LABEL VALID ALL 5.3 2.2 64 1 YES 94.7 39.1 1,152 2 NO 58.7 1,731 -3 MISSING ----- ----- ----- 100.0 100.0 2,947 cases Data type: numeric Missing-data codes: lowest thru -1 Columns: 630-631
D4_ EVER TRIED TO STOP GAMBLING
Have you ever tried to stop, cut down, or control your gambling? PCT PCT N VALUE LABEL VALID ALL 21.1 8.7 256 1 YES 78.9 32.5 959 2 NO 58.7 1,731 -3 MISSING 0.0 1 -1 REFUSED ----- ----- ----- 100.0 100.0 2,947 cases Data type: numeric Missing-data codes: lowest thru -1 Columns: 632-633
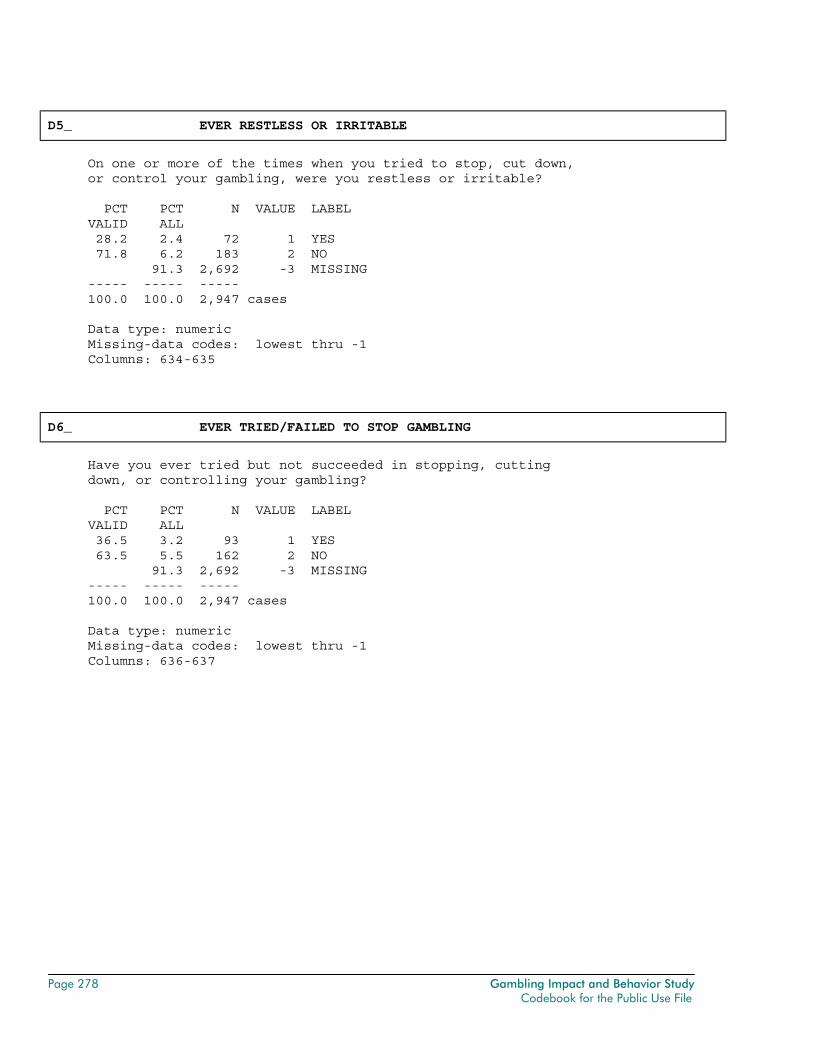
Page 278 Gambling Impact and Behavior Study Codebook for the Public Use File
D5_ EVER RESTLESS OR IRRITABLE
On one or more of the times when you tried to stop, cut down, or control your gambling, were you restless or irritable? PCT PCT N VALUE LABEL VALID ALL 28.2 2.4 72 1 YES 71.8 6.2 183 2 NO 91.3 2,692 -3 MISSING ----- ----- ----- 100.0 100.0 2,947 cases Data type: numeric Missing-data codes: lowest thru -1 Columns: 634-635
D6_ EVER TRIED/FAILED TO STOP GAMBLING
Have you ever tried but not succeeded in stopping, cutting down, or controlling your gambling? PCT PCT N VALUE LABEL VALID ALL 36.5 3.2 93 1 YES 63.5 5.5 162 2 NO 91.3 2,692 -3 MISSING ----- ----- ----- 100.0 100.0 2,947 cases Data type: numeric Missing-data codes: lowest thru -1 Columns: 636-637
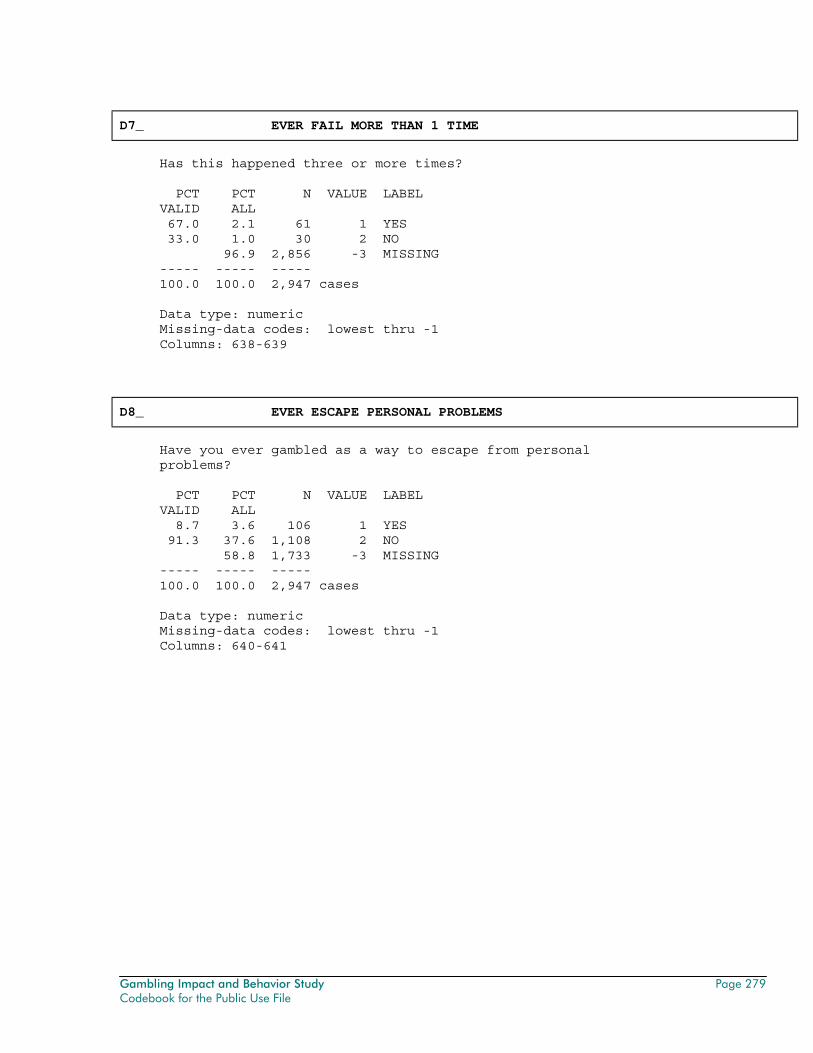
Gambling Impact and Behavior Study Page 279 Codebook for the Public Use File
D7_ EVER FAIL MORE THAN 1 TIME
Has this happened three or more times? PCT PCT N VALUE LABEL VALID ALL 67.0 2.1 61 1 YES 33.0 1.0 30 2 NO 96.9 2,856 -3 MISSING ----- ----- ----- 100.0 100.0 2,947 cases Data type: numeric Missing-data codes: lowest thru -1 Columns: 638-639
D8_ EVER ESCAPE PERSONAL PROBLEMS
Have you ever gambled as a way to escape from personal problems? PCT PCT N VALUE LABEL VALID ALL 8.7 3.6 106 1 YES 91.3 37.6 1,108 2 NO 58.8 1,733 -3 MISSING ----- ----- ----- 100.0 100.0 2,947 cases Data type: numeric Missing-data codes: lowest thru -1 Columns: 640-641
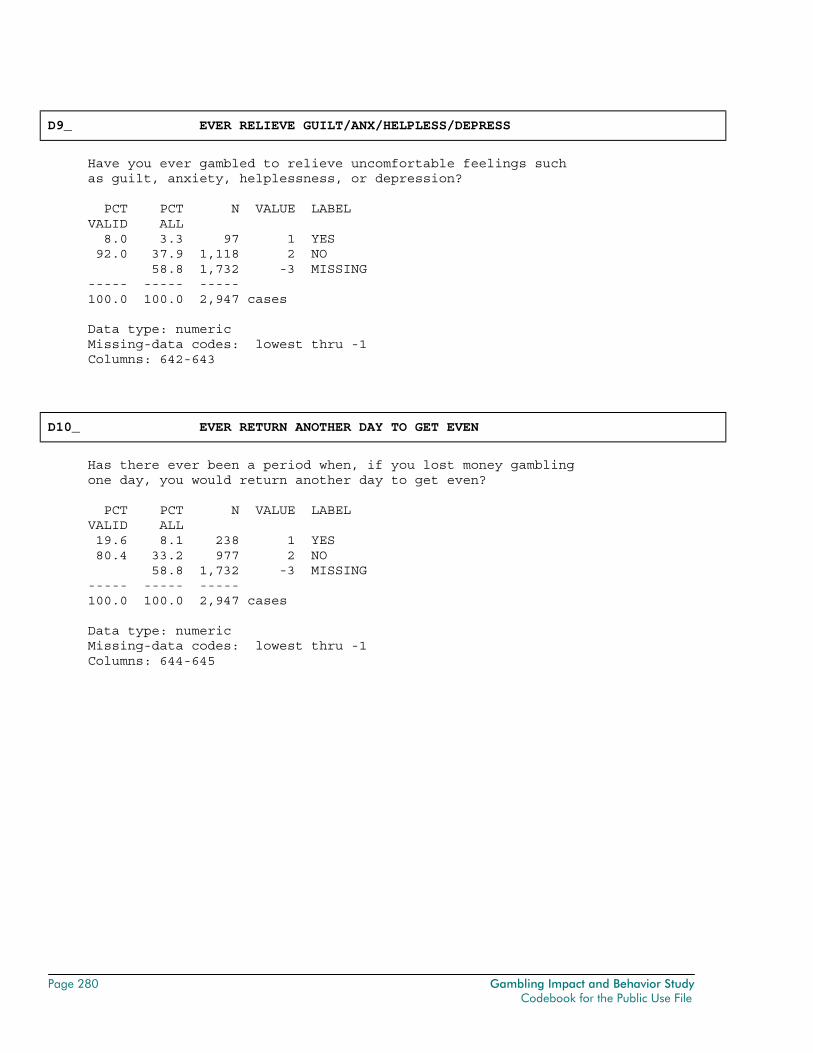
Page 280 Gambling Impact and Behavior Study Codebook for the Public Use File
D9_ EVER RELIEVE GUILT/ANX/HELPLESS/DEPRESS
Have you ever gambled to relieve uncomfortable feelings such as guilt, anxiety, helplessness, or depression? PCT PCT N VALUE LABEL VALID ALL 8.0 3.3 97 1 YES 92.0 37.9 1,118 2 NO 58.8 1,732 -3 MISSING ----- ----- ----- 100.0 100.0 2,947 cases Data type: numeric Missing-data codes: lowest thru -1 Columns: 642-643
D10_ EVER RETURN ANOTHER DAY TO GET EVEN
Has there ever been a period when, if you lost money gambling one day, you would return another day to get even? PCT PCT N VALUE LABEL VALID ALL 19.6 8.1 238 1 YES 80.4 33.2 977 2 NO 58.8 1,732 -3 MISSING ----- ----- ----- 100.0 100.0 2,947 cases Data type: numeric Missing-data codes: lowest thru -1 Columns: 644-645
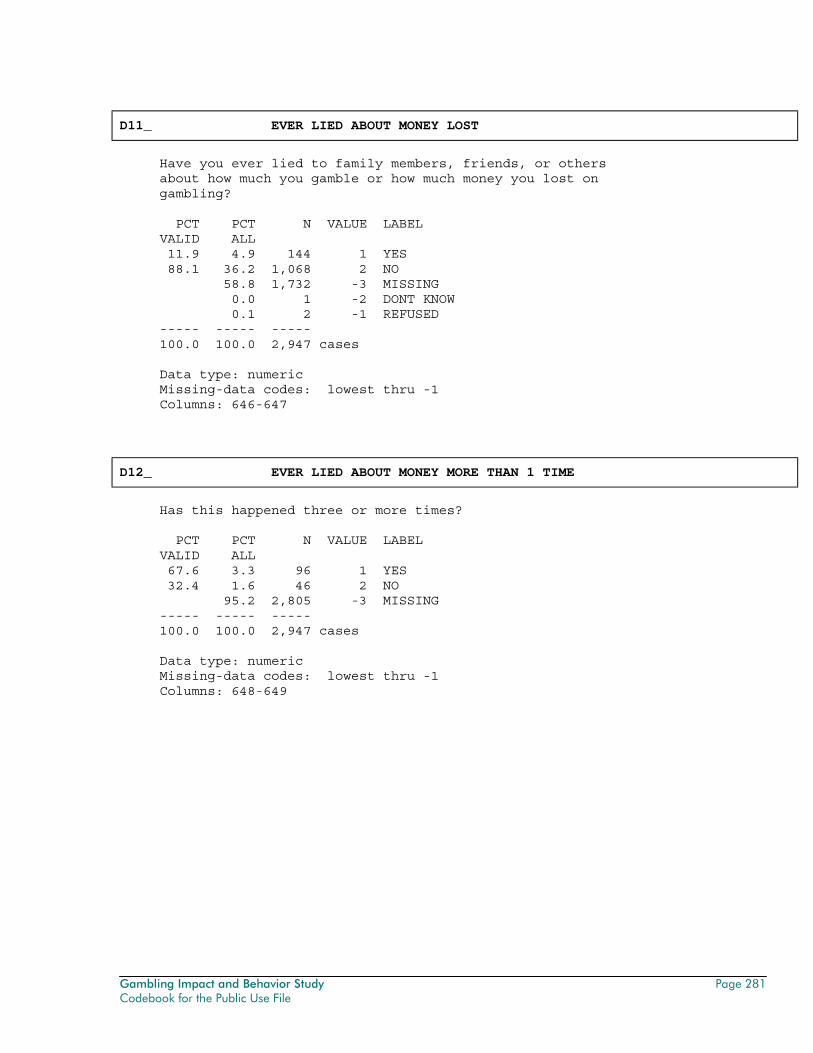
Gambling Impact and Behavior Study Page 281 Codebook for the Public Use File
D11_ EVER LIED ABOUT MONEY LOST
Have you ever lied to family members, friends, or others about how much you gamble or how much money you lost on gambling? PCT PCT N VALUE LABEL VALID ALL 11.9 4.9 144 1 YES 88.1 36.2 1,068 2 NO 58.8 1,732 -3 MISSING 0.0 1 -2 DONT KNOW 0.1 2 -1 REFUSED ----- ----- ----- 100.0 100.0 2,947 cases Data type: numeric Missing-data codes: lowest thru -1 Columns: 646-647
D12_ EVER LIED ABOUT MONEY MORE THAN 1 TIME
Has this happened three or more times? PCT PCT N VALUE LABEL VALID ALL 67.6 3.3 96 1 YES 32.4 1.6 46 2 NO 95.2 2,805 -3 MISSING ----- ----- ----- 100.0 100.0 2,947 cases Data type: numeric Missing-data codes: lowest thru -1 Columns: 648-649
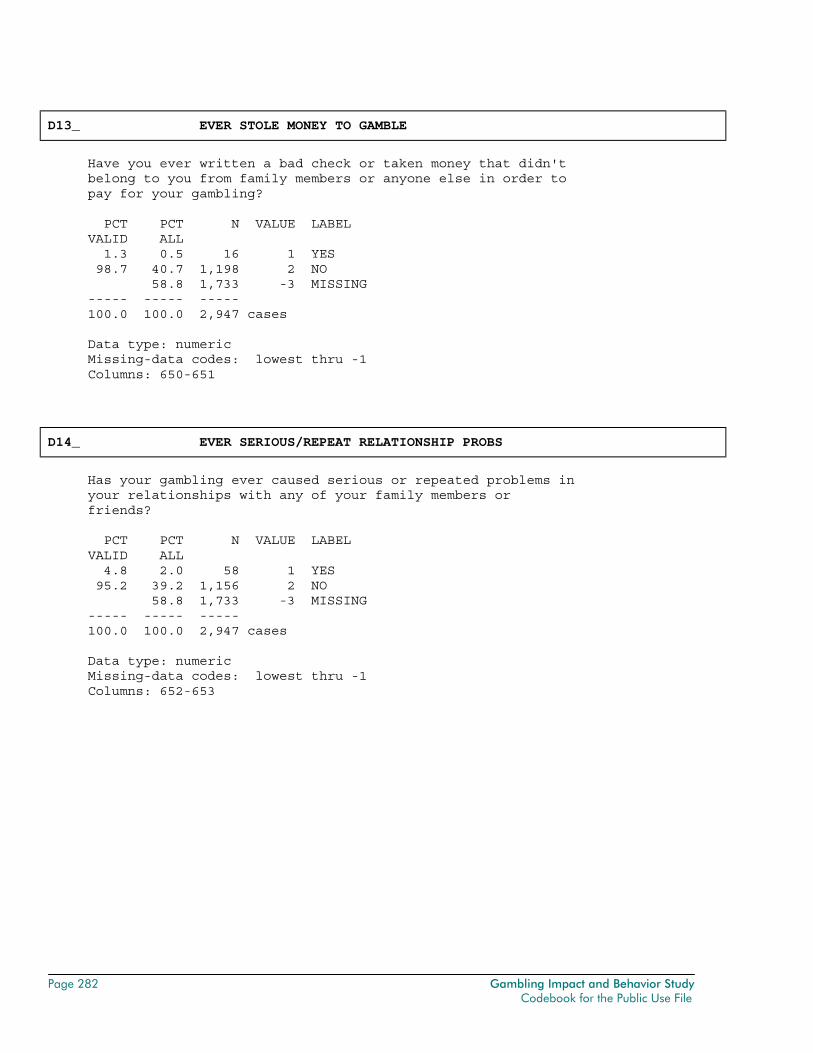
Page 282 Gambling Impact and Behavior Study Codebook for the Public Use File
D13_ EVER STOLE MONEY TO GAMBLE
Have you ever written a bad check or taken money that didn't belong to you from family members or anyone else in order to pay for your gambling? PCT PCT N VALUE LABEL VALID ALL 1.3 0.5 16 1 YES 98.7 40.7 1,198 2 NO 58.8 1,733 -3 MISSING ----- ----- ----- 100.0 100.0 2,947 cases Data type: numeric Missing-data codes: lowest thru -1 Columns: 650-651
D14_ EVER SERIOUS/REPEAT RELATIONSHIP PROBS
Has your gambling ever caused serious or repeated problems in your relationships with any of your family members or friends? PCT PCT N VALUE LABEL VALID ALL 4.8 2.0 58 1 YES 95.2 39.2 1,156 2 NO 58.8 1,733 -3 MISSING ----- ----- ----- 100.0 100.0 2,947 cases Data type: numeric Missing-data codes: lowest thru -1 Columns: 652-653

Gambling Impact and Behavior Study Page 283 Codebook for the Public Use File
D15_ EVER CAUSED PROBLEMS IN SCHOOL
Has your gambling caused you any problems in school, such as missing classes or days of school, or your grades dropping? PCT PCT N VALUE LABEL VALID ALL 100.0 2.7 81 2 NO 97.3 2,866 -3 MISSING ----- ----- ----- 100.0 100.0 2,947 cases Data type: numeric Missing-data codes: lowest thru -1 Columns: 654-655
D16_ EVER CAUSED PROBLEMS AT WORK
Has your gambling ever caused you to lose a job, have trouble with your job, or miss out on an important job or career opportunity? PCT PCT N VALUE LABEL VALID ALL 1.0 0.4 12 1 YES 99.0 40.8 1,202 2 NO 58.8 1,733 -3 MISSING ----- ----- ----- 100.0 100.0 2,947 cases Data type: numeric Missing-data codes: lowest thru -1 Columns: 656-657
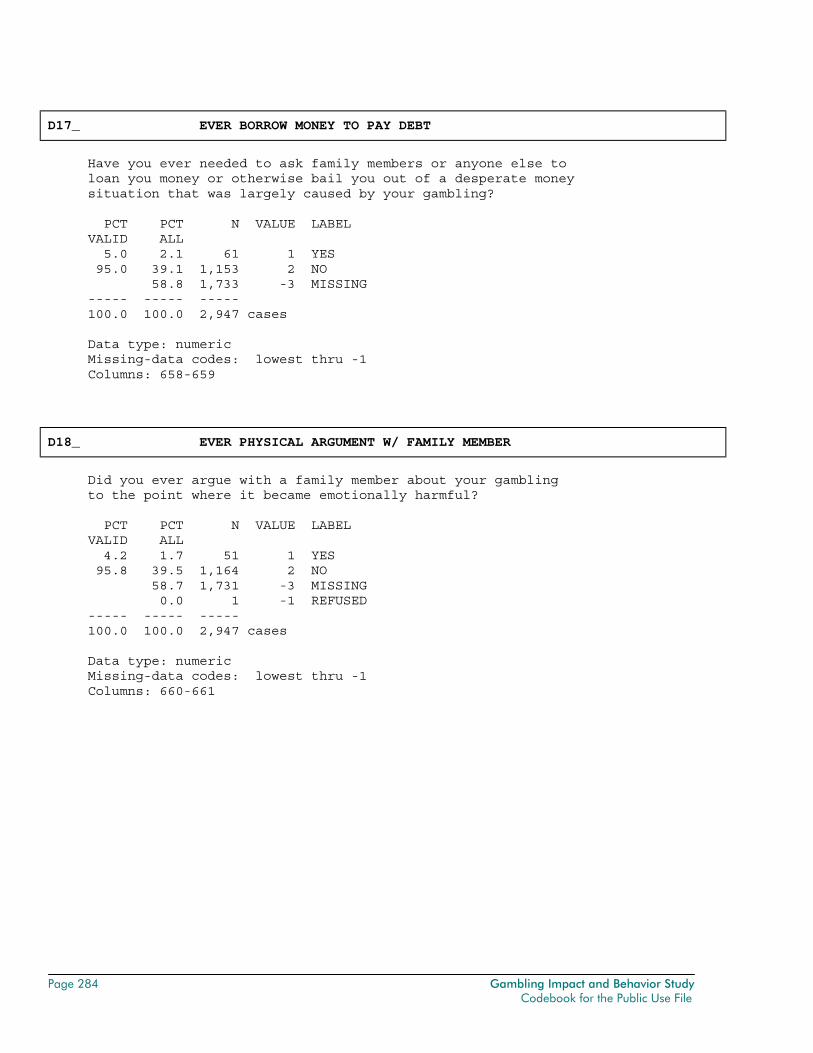
Page 284 Gambling Impact and Behavior Study Codebook for the Public Use File
D17_ EVER BORROW MONEY TO PAY DEBT
Have you ever needed to ask family members or anyone else to loan you money or otherwise bail you out of a desperate money situation that was largely caused by your gambling? PCT PCT N VALUE LABEL VALID ALL 5.0 2.1 61 1 YES 95.0 39.1 1,153 2 NO 58.8 1,733 -3 MISSING ----- ----- ----- 100.0 100.0 2,947 cases Data type: numeric Missing-data codes: lowest thru -1 Columns: 658-659
D18_ EVER PHYSICAL ARGUMENT W/ FAMILY MEMBER
Did you ever argue with a family member about your gambling to the point where it became emotionally harmful? PCT PCT N VALUE LABEL VALID ALL 4.2 1.7 51 1 YES 95.8 39.5 1,164 2 NO 58.7 1,731 -3 MISSING 0.0 1 -1 REFUSED ----- ----- ----- 100.0 100.0 2,947 cases Data type: numeric Missing-data codes: lowest thru -1 Columns: 660-661
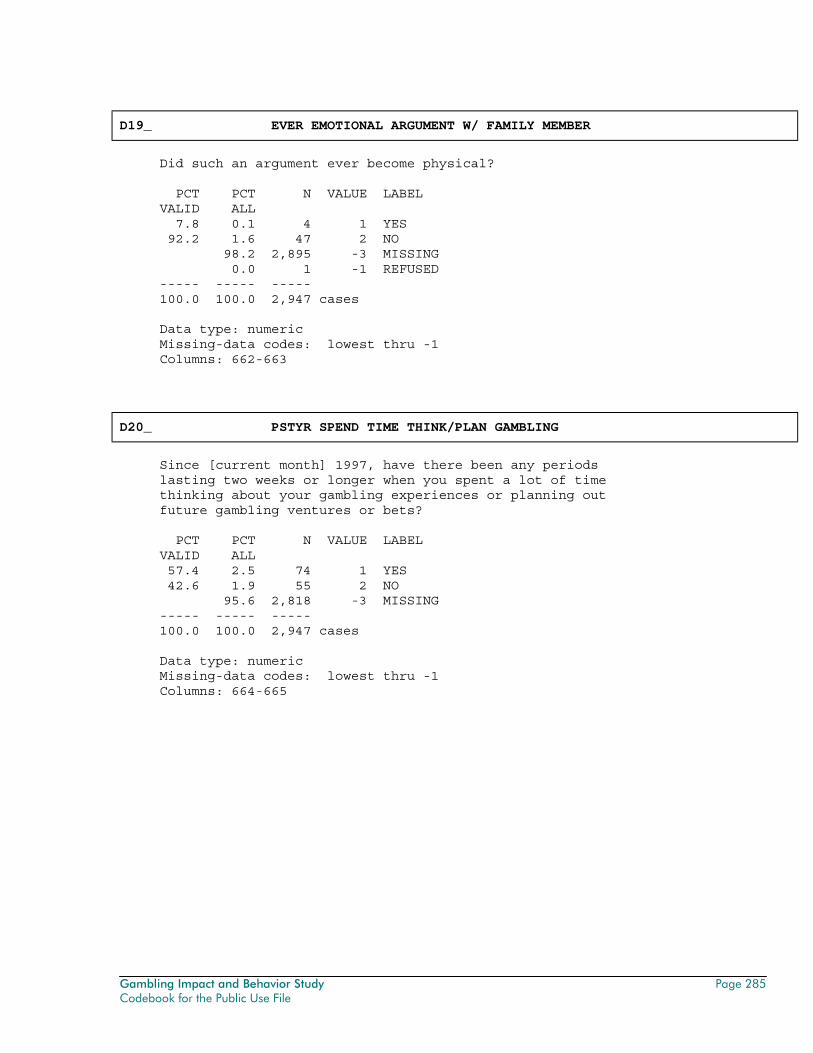
Gambling Impact and Behavior Study Page 285 Codebook for the Public Use File
D19_ EVER EMOTIONAL ARGUMENT W/ FAMILY MEMBER
Did such an argument ever become physical? PCT PCT N VALUE LABEL VALID ALL 7.8 0.1 4 1 YES 92.2 1.6 47 2 NO 98.2 2,895 -3 MISSING 0.0 1 -1 REFUSED ----- ----- ----- 100.0 100.0 2,947 cases Data type: numeric Missing-data codes: lowest thru -1 Columns: 662-663
D20_ PSTYR SPEND TIME THINK/PLAN GAMBLING
Since [current month] 1997, have there been any periods lasting two weeks or longer when you spent a lot of time thinking about your gambling experiences or planning out future gambling ventures or bets? PCT PCT N VALUE LABEL VALID ALL 57.4 2.5 74 1 YES 42.6 1.9 55 2 NO 95.6 2,818 -3 MISSING ----- ----- ----- 100.0 100.0 2,947 cases Data type: numeric Missing-data codes: lowest thru -1 Columns: 664-665
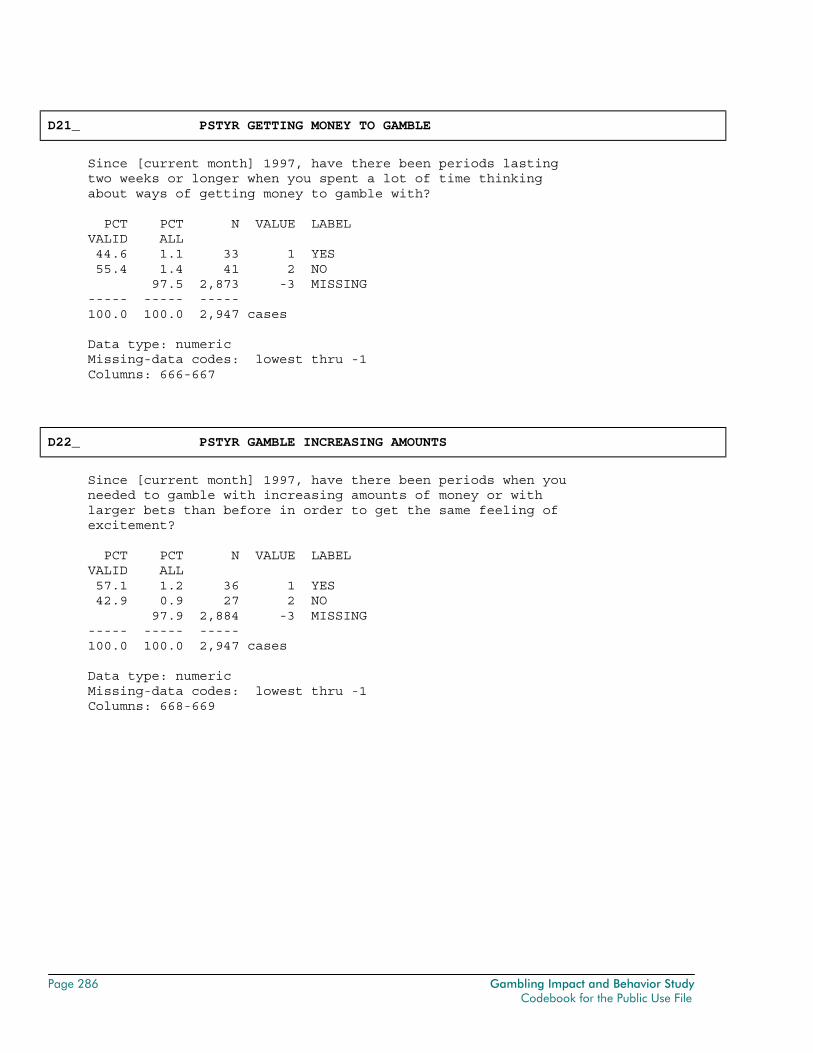
Page 286 Gambling Impact and Behavior Study Codebook for the Public Use File
D21_ PSTYR GETTING MONEY TO GAMBLE
Since [current month] 1997, have there been periods lasting two weeks or longer when you spent a lot of time thinking about ways of getting money to gamble with? PCT PCT N VALUE LABEL VALID ALL 44.6 1.1 33 1 YES 55.4 1.4 41 2 NO 97.5 2,873 -3 MISSING ----- ----- ----- 100.0 100.0 2,947 cases Data type: numeric Missing-data codes: lowest thru -1 Columns: 666-667
D22_ PSTYR GAMBLE INCREASING AMOUNTS
Since [current month] 1997, have there been periods when you needed to gamble with increasing amounts of money or with larger bets than before in order to get the same feeling of excitement? PCT PCT N VALUE LABEL VALID ALL 57.1 1.2 36 1 YES 42.9 0.9 27 2 NO 97.9 2,884 -3 MISSING ----- ----- ----- 100.0 100.0 2,947 cases Data type: numeric Missing-data codes: lowest thru -1 Columns: 668-669
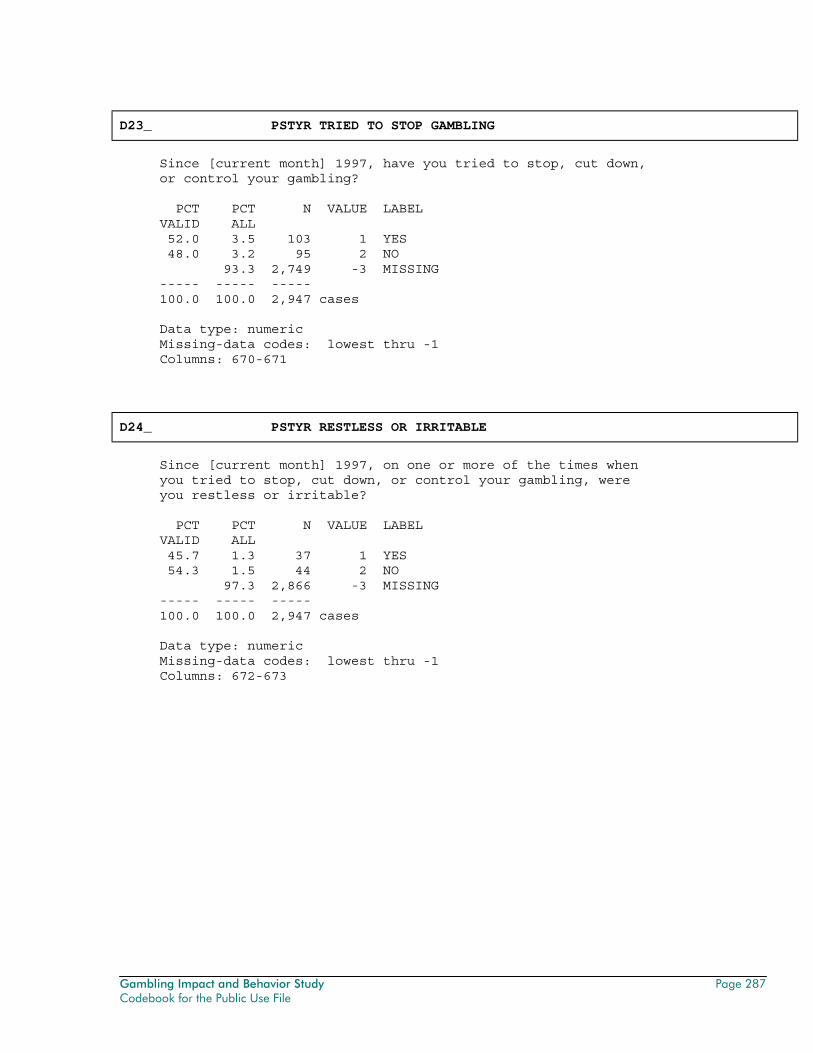
Gambling Impact and Behavior Study Page 287 Codebook for the Public Use File
D23_ PSTYR TRIED TO STOP GAMBLING
Since [current month] 1997, have you tried to stop, cut down, or control your gambling? PCT PCT N VALUE LABEL VALID ALL 52.0 3.5 103 1 YES 48.0 3.2 95 2 NO 93.3 2,749 -3 MISSING ----- ----- ----- 100.0 100.0 2,947 cases Data type: numeric Missing-data codes: lowest thru -1 Columns: 670-671
D24_ PSTYR RESTLESS OR IRRITABLE
Since [current month] 1997, on one or more of the times when you tried to stop, cut down, or control your gambling, were you restless or irritable? PCT PCT N VALUE LABEL VALID ALL 45.7 1.3 37 1 YES 54.3 1.5 44 2 NO 97.3 2,866 -3 MISSING ----- ----- ----- 100.0 100.0 2,947 cases Data type: numeric Missing-data codes: lowest thru -1 Columns: 672-673
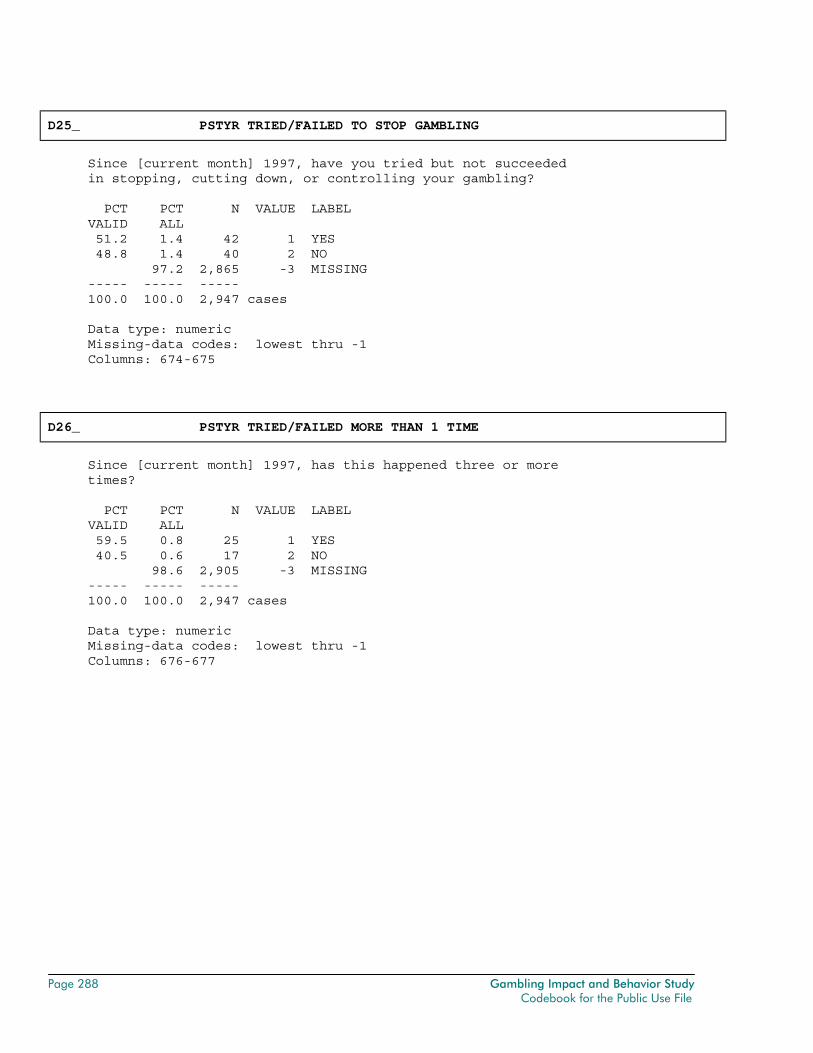
Page 288 Gambling Impact and Behavior Study Codebook for the Public Use File
D25_ PSTYR TRIED/FAILED TO STOP GAMBLING
Since [current month] 1997, have you tried but not succeeded in stopping, cutting down, or controlling your gambling? PCT PCT N VALUE LABEL VALID ALL 51.2 1.4 42 1 YES 48.8 1.4 40 2 NO 97.2 2,865 -3 MISSING ----- ----- ----- 100.0 100.0 2,947 cases Data type: numeric Missing-data codes: lowest thru -1 Columns: 674-675
D26_ PSTYR TRIED/FAILED MORE THAN 1 TIME
Since [current month] 1997, has this happened three or more times? PCT PCT N VALUE LABEL VALID ALL 59.5 0.8 25 1 YES 40.5 0.6 17 2 NO 98.6 2,905 -3 MISSING ----- ----- ----- 100.0 100.0 2,947 cases Data type: numeric Missing-data codes: lowest thru -1 Columns: 676-677
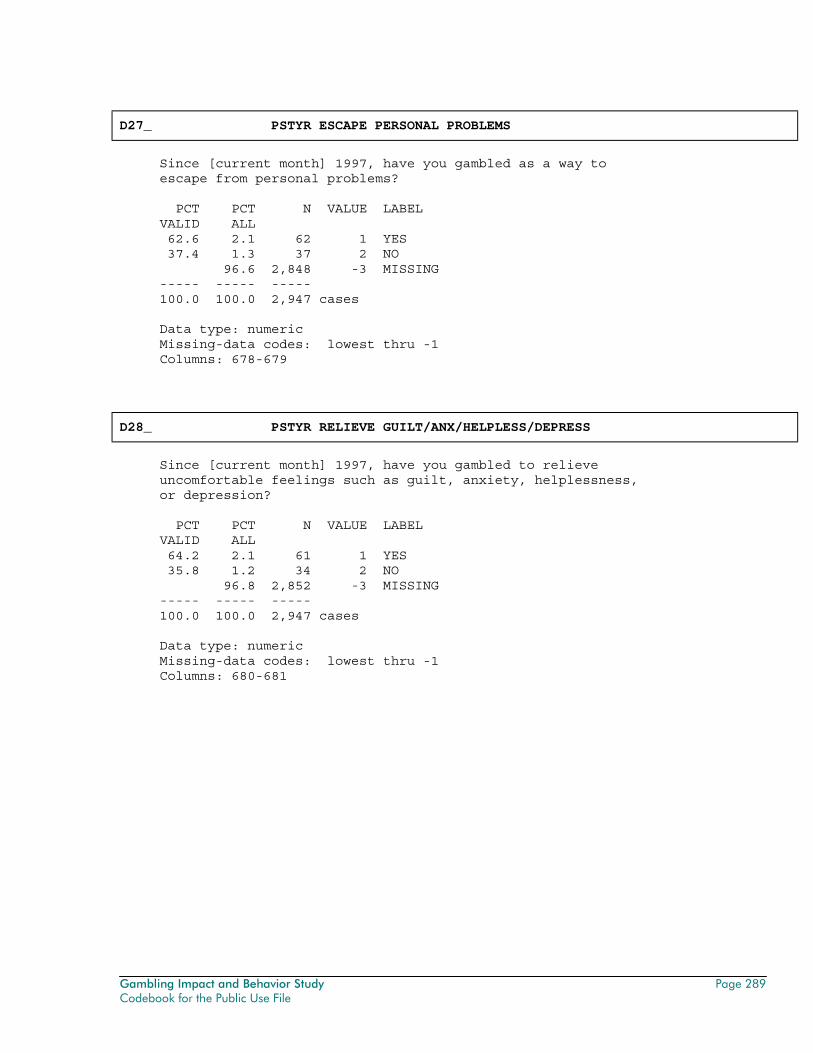
Gambling Impact and Behavior Study Page 289 Codebook for the Public Use File
D27_ PSTYR ESCAPE PERSONAL PROBLEMS
Since [current month] 1997, have you gambled as a way to escape from personal problems? PCT PCT N VALUE LABEL VALID ALL 62.6 2.1 62 1 YES 37.4 1.3 37 2 NO 96.6 2,848 -3 MISSING ----- ----- ----- 100.0 100.0 2,947 cases Data type: numeric Missing-data codes: lowest thru -1 Columns: 678-679
D28_ PSTYR RELIEVE GUILT/ANX/HELPLESS/DEPRESS
Since [current month] 1997, have you gambled to relieve uncomfortable feelings such as guilt, anxiety, helplessness, or depression? PCT PCT N VALUE LABEL VALID ALL 64.2 2.1 61 1 YES 35.8 1.2 34 2 NO 96.8 2,852 -3 MISSING ----- ----- ----- 100.0 100.0 2,947 cases Data type: numeric Missing-data codes: lowest thru -1 Columns: 680-681
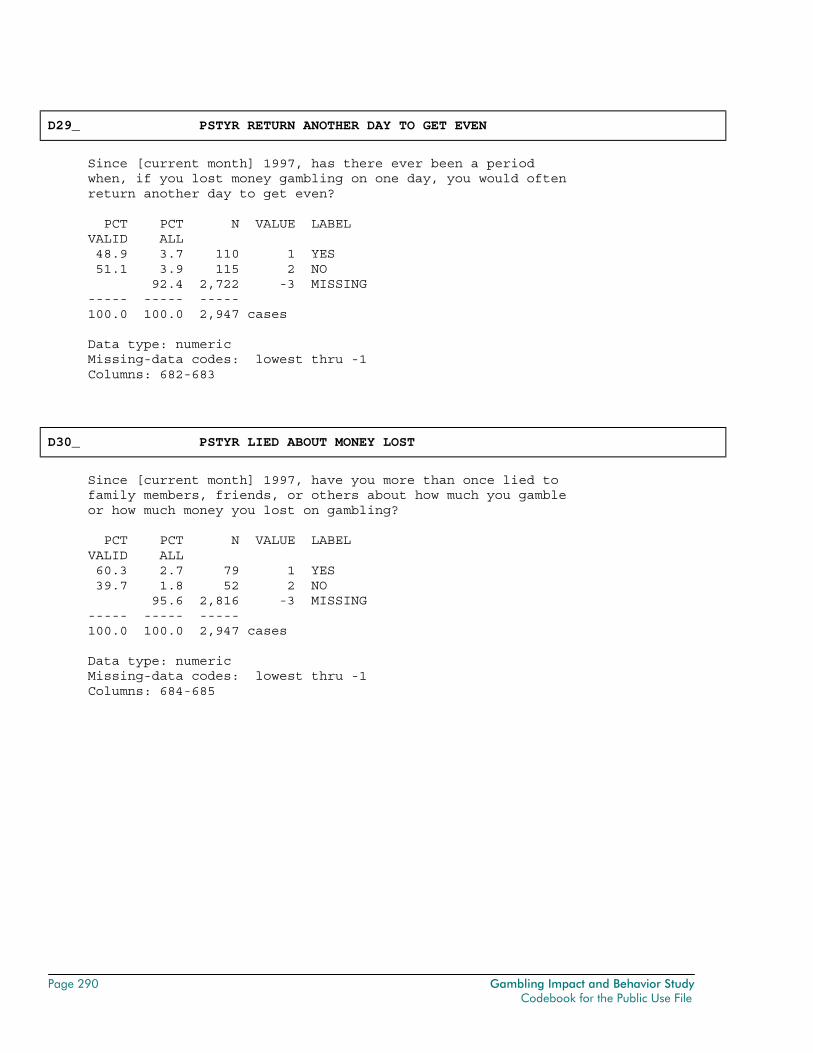
Page 290 Gambling Impact and Behavior Study Codebook for the Public Use File
D29_ PSTYR RETURN ANOTHER DAY TO GET EVEN
Since [current month] 1997, has there ever been a period when, if you lost money gambling on one day, you would often return another day to get even? PCT PCT N VALUE LABEL VALID ALL 48.9 3.7 110 1 YES 51.1 3.9 115 2 NO 92.4 2,722 -3 MISSING ----- ----- ----- 100.0 100.0 2,947 cases Data type: numeric Missing-data codes: lowest thru -1 Columns: 682-683
D30_ PSTYR LIED ABOUT MONEY LOST
Since [current month] 1997, have you more than once lied to family members, friends, or others about how much you gamble or how much money you lost on gambling? PCT PCT N VALUE LABEL VALID ALL 60.3 2.7 79 1 YES 39.7 1.8 52 2 NO 95.6 2,816 -3 MISSING ----- ----- ----- 100.0 100.0 2,947 cases Data type: numeric Missing-data codes: lowest thru -1 Columns: 684-685
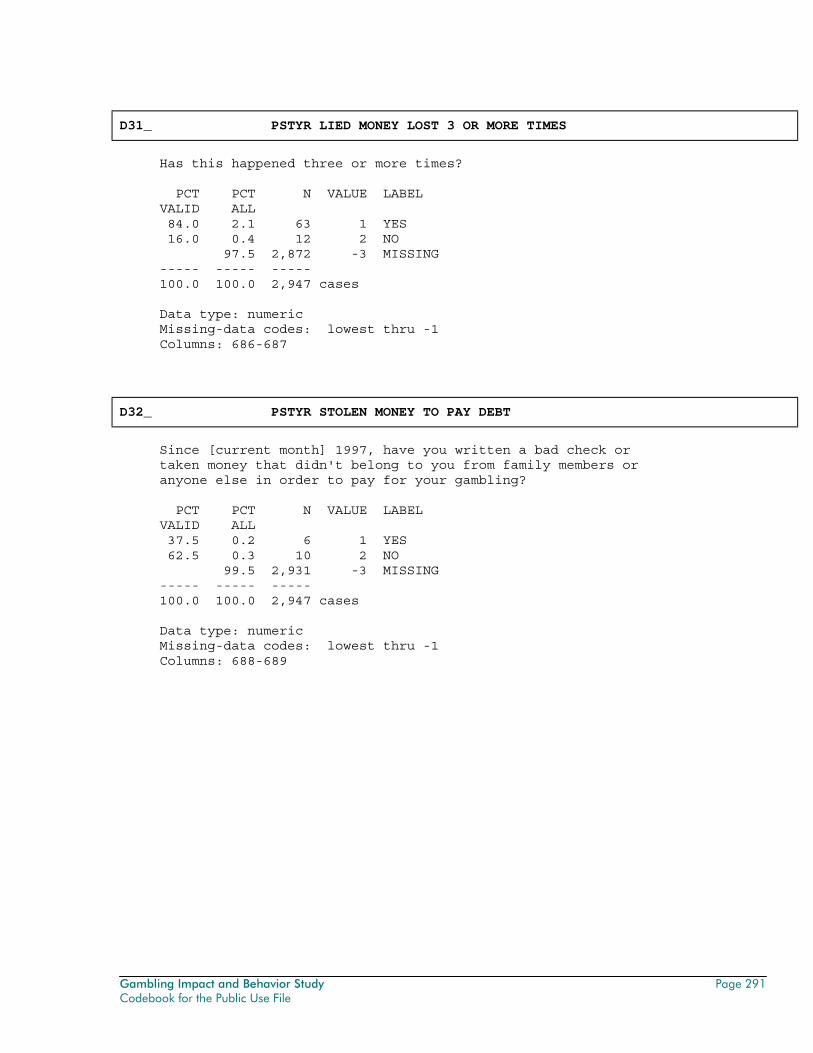
Gambling Impact and Behavior Study Page 291 Codebook for the Public Use File
D31_ PSTYR LIED MONEY LOST 3 OR MORE TIMES
Has this happened three or more times? PCT PCT N VALUE LABEL VALID ALL 84.0 2.1 63 1 YES 16.0 0.4 12 2 NO 97.5 2,872 -3 MISSING ----- ----- ----- 100.0 100.0 2,947 cases Data type: numeric Missing-data codes: lowest thru -1 Columns: 686-687
D32_ PSTYR STOLEN MONEY TO PAY DEBT
Since [current month] 1997, have you written a bad check or taken money that didn't belong to you from family members or anyone else in order to pay for your gambling? PCT PCT N VALUE LABEL VALID ALL 37.5 0.2 6 1 YES 62.5 0.3 10 2 NO 99.5 2,931 -3 MISSING ----- ----- ----- 100.0 100.0 2,947 cases Data type: numeric Missing-data codes: lowest thru -1 Columns: 688-689
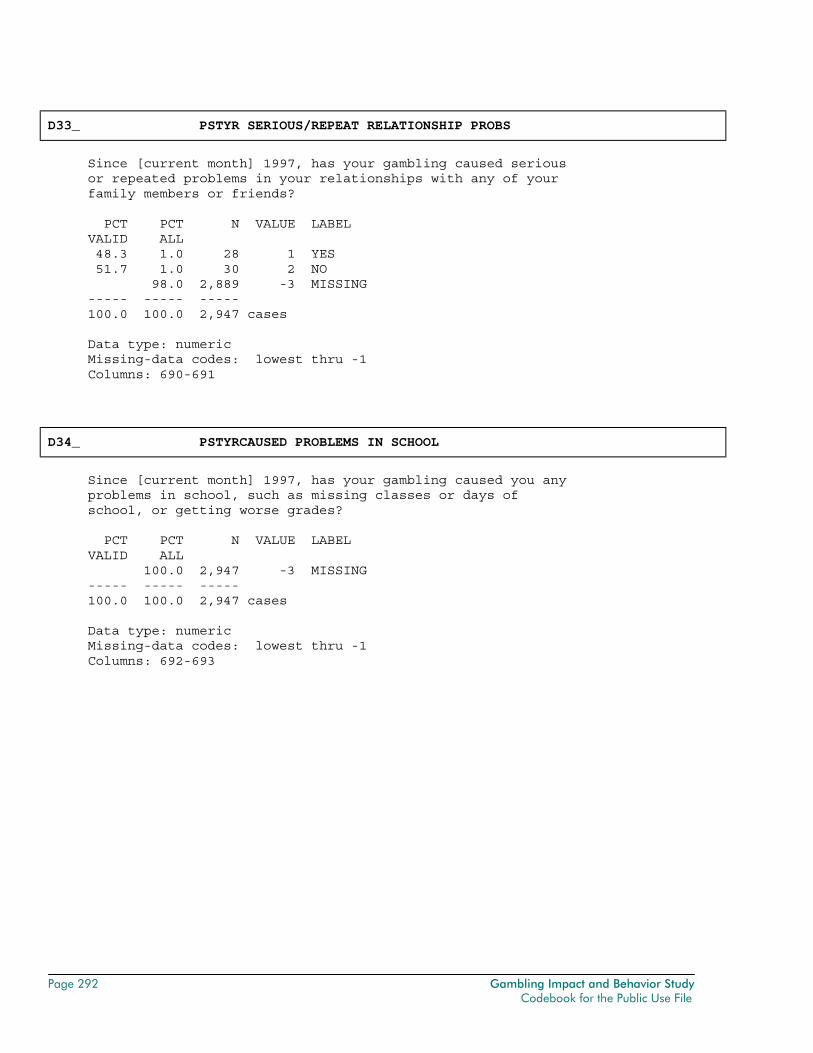
Page 292 Gambling Impact and Behavior Study Codebook for the Public Use File
D33_ PSTYR SERIOUS/REPEAT RELATIONSHIP PROBS
Since [current month] 1997, has your gambling caused serious or repeated problems in your relationships with any of your family members or friends? PCT PCT N VALUE LABEL VALID ALL 48.3 1.0 28 1 YES 51.7 1.0 30 2 NO 98.0 2,889 -3 MISSING ----- ----- ----- 100.0 100.0 2,947 cases Data type: numeric Missing-data codes: lowest thru -1 Columns: 690-691
D34_ PSTYRCAUSED PROBLEMS IN SCHOOL
Since [current month] 1997, has your gambling caused you any problems in school, such as missing classes or days of school, or getting worse grades? PCT PCT N VALUE LABEL VALID ALL 100.0 2,947 -3 MISSING ----- ----- ----- 100.0 100.0 2,947 cases Data type: numeric Missing-data codes: lowest thru -1 Columns: 692-693
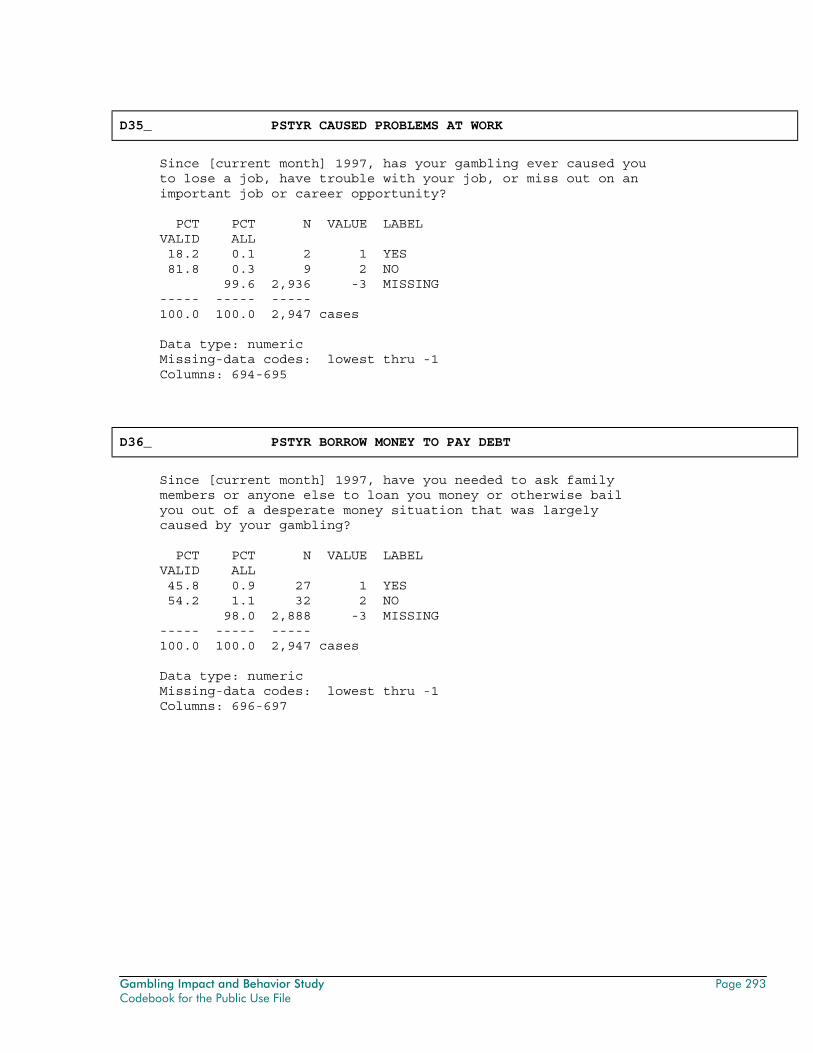
Gambling Impact and Behavior Study Page 293 Codebook for the Public Use File
D35_ PSTYR CAUSED PROBLEMS AT WORK
Since [current month] 1997, has your gambling ever caused you to lose a job, have trouble with your job, or miss out on an important job or career opportunity? PCT PCT N VALUE LABEL VALID ALL 18.2 0.1 2 1 YES 81.8 0.3 9 2 NO 99.6 2,936 -3 MISSING ----- ----- ----- 100.0 100.0 2,947 cases Data type: numeric Missing-data codes: lowest thru -1 Columns: 694-695
D36_ PSTYR BORROW MONEY TO PAY DEBT
Since [current month] 1997, have you needed to ask family members or anyone else to loan you money or otherwise bail you out of a desperate money situation that was largely caused by your gambling? PCT PCT N VALUE LABEL VALID ALL 45.8 0.9 27 1 YES 54.2 1.1 32 2 NO 98.0 2,888 -3 MISSING ----- ----- ----- 100.0 100.0 2,947 cases Data type: numeric Missing-data codes: lowest thru -1 Columns: 696-697
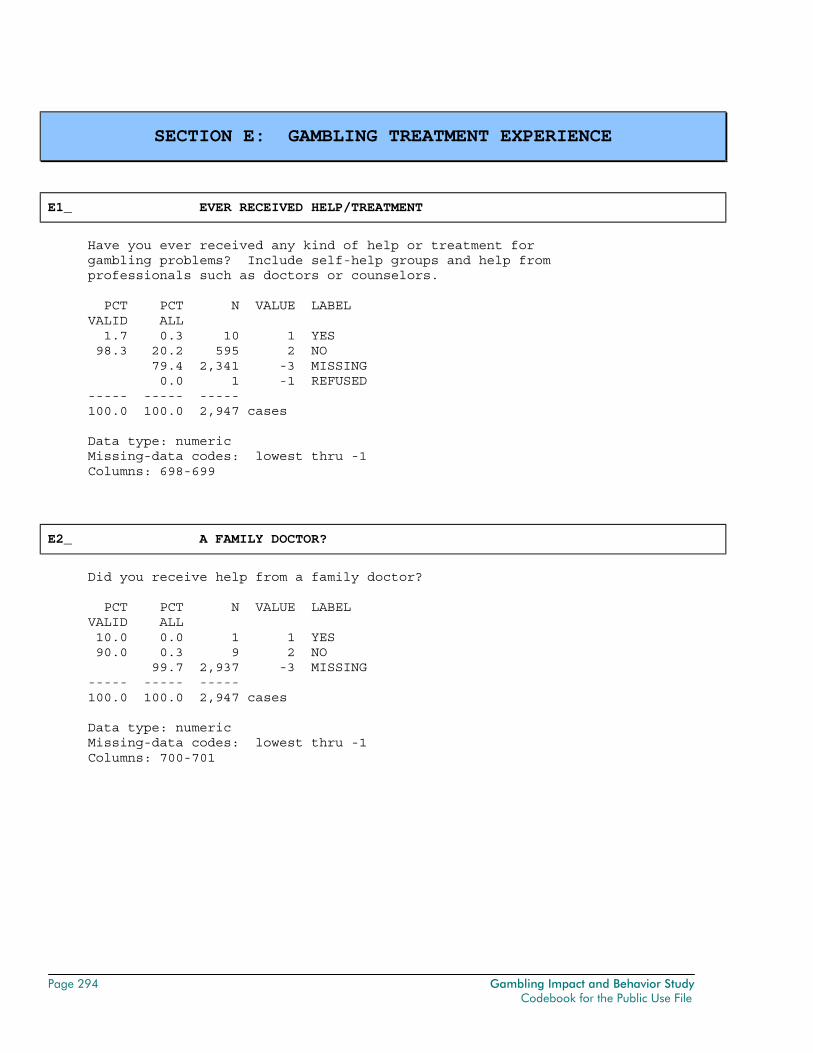
Page 294 Gambling Impact and Behavior Study Codebook for the Public Use File
SECTION E: GAMBLING TREATMENT EXPERIENCE
E1_ EVER RECEIVED HELP/TREATMENT
Have you ever received any kind of help or treatment for gambling problems? Include self-help groups and help from professionals such as doctors or counselors. PCT PCT N VALUE LABEL VALID ALL 1.7 0.3 10 1 YES 98.3 20.2 595 2 NO 79.4 2,341 -3 MISSING 0.0 1 -1 REFUSED ----- ----- ----- 100.0 100.0 2,947 cases Data type: numeric Missing-data codes: lowest thru -1 Columns: 698-699
E2_ A FAMILY DOCTOR?
Did you receive help from a family doctor? PCT PCT N VALUE LABEL VALID ALL 10.0 0.0 1 1 YES 90.0 0.3 9 2 NO 99.7 2,937 -3 MISSING ----- ----- ----- 100.0 100.0 2,947 cases Data type: numeric Missing-data codes: lowest thru -1 Columns: 700-701
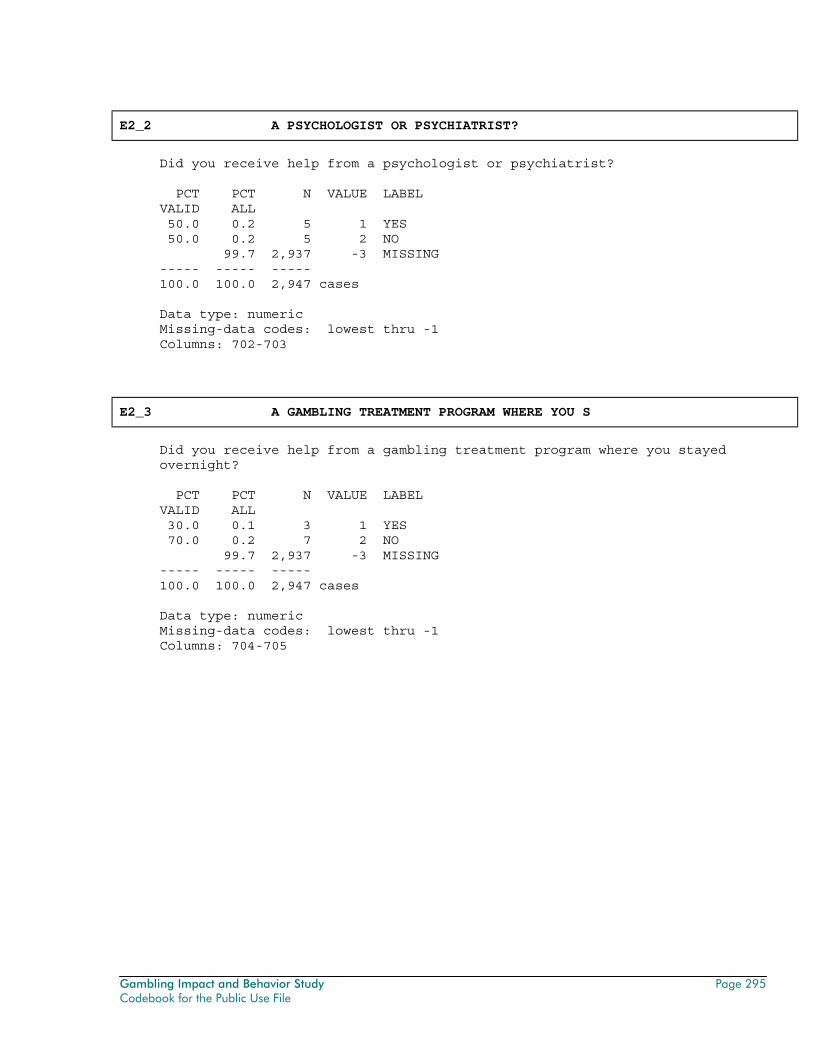
Gambling Impact and Behavior Study Page 295 Codebook for the Public Use File
E2_2 A PSYCHOLOGIST OR PSYCHIATRIST?
Did you receive help from a psychologist or psychiatrist? PCT PCT N VALUE LABEL VALID ALL 50.0 0.2 5 1 YES 50.0 0.2 5 2 NO 99.7 2,937 -3 MISSING ----- ----- ----- 100.0 100.0 2,947 cases Data type: numeric Missing-data codes: lowest thru -1 Columns: 702-703
E2_3 A GAMBLING TREATMENT PROGRAM WHERE YOU S
Did you receive help from a gambling treatment program where you stayed overnight? PCT PCT N VALUE LABEL VALID ALL 30.0 0.1 3 1 YES 70.0 0.2 7 2 NO 99.7 2,937 -3 MISSING ----- ----- ----- 100.0 100.0 2,947 cases Data type: numeric Missing-data codes: lowest thru -1 Columns: 704-705
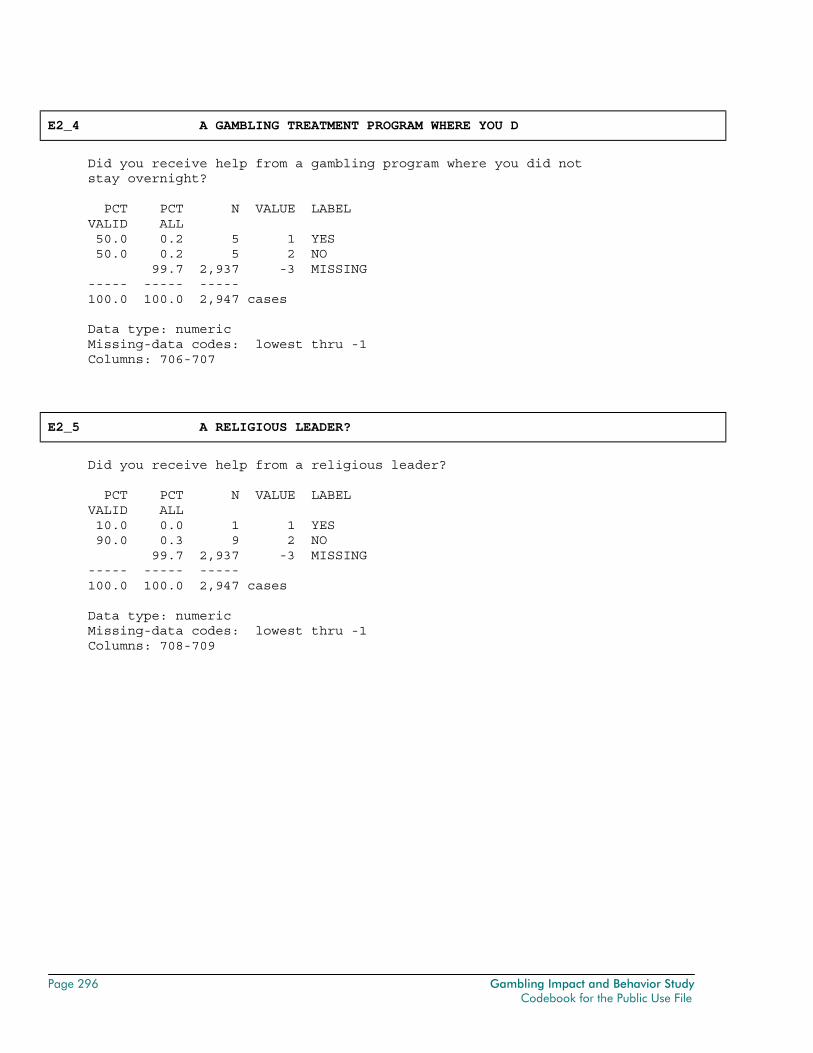
Page 296 Gambling Impact and Behavior Study Codebook for the Public Use File
E2_4 A GAMBLING TREATMENT PROGRAM WHERE YOU D
Did you receive help from a gambling program where you did not stay overnight? PCT PCT N VALUE LABEL VALID ALL 50.0 0.2 5 1 YES 50.0 0.2 5 2 NO 99.7 2,937 -3 MISSING ----- ----- ----- 100.0 100.0 2,947 cases Data type: numeric Missing-data codes: lowest thru -1 Columns: 706-707
E2_5 A RELIGIOUS LEADER?
Did you receive help from a religious leader? PCT PCT N VALUE LABEL VALID ALL 10.0 0.0 1 1 YES 90.0 0.3 9 2 NO 99.7 2,937 -3 MISSING ----- ----- ----- 100.0 100.0 2,947 cases Data type: numeric Missing-data codes: lowest thru -1 Columns: 708-709
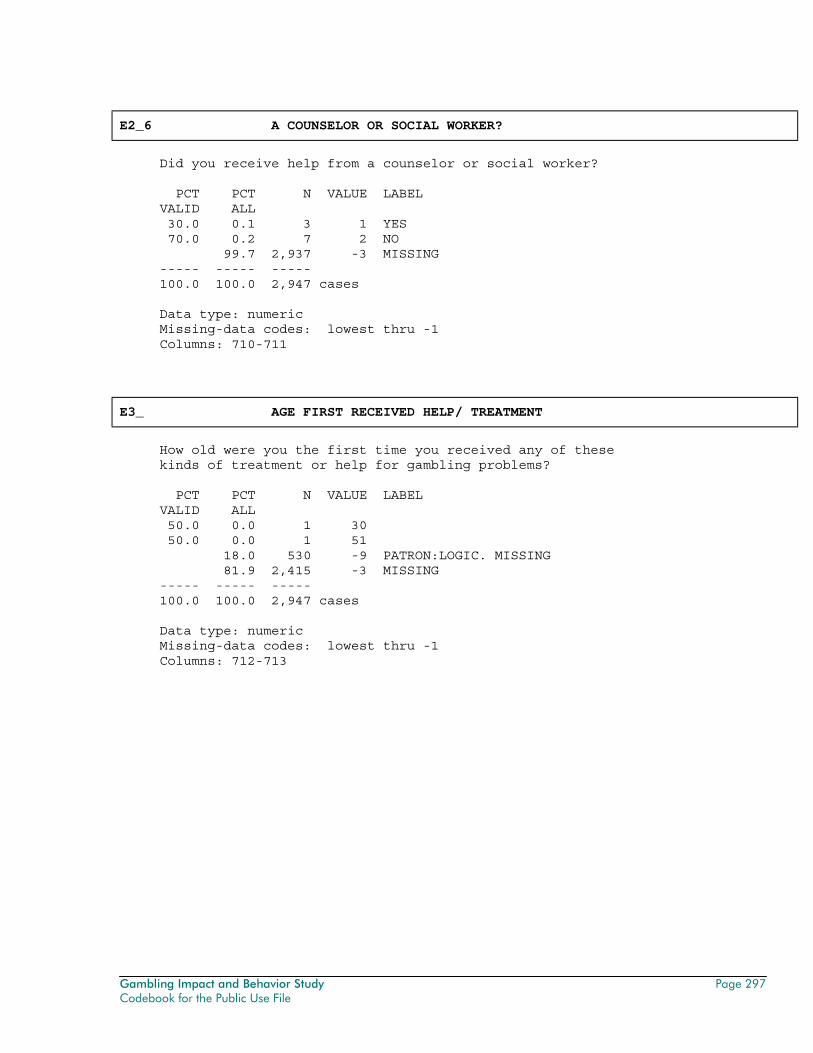
Gambling Impact and Behavior Study Page 297 Codebook for the Public Use File
E2_6 A COUNSELOR OR SOCIAL WORKER?
Did you receive help from a counselor or social worker? PCT PCT N VALUE LABEL VALID ALL 30.0 0.1 3 1 YES 70.0 0.2 7 2 NO 99.7 2,937 -3 MISSING ----- ----- ----- 100.0 100.0 2,947 cases Data type: numeric Missing-data codes: lowest thru -1 Columns: 710-711
E3_ AGE FIRST RECEIVED HELP/ TREATMENT
How old were you the first time you received any of these kinds of treatment or help for gambling problems? PCT PCT N VALUE LABEL VALID ALL 50.0 0.0 1 30 50.0 0.0 1 51 18.0 530 -9 PATRON:LOGIC. MISSING 81.9 2,415 -3 MISSING ----- ----- ----- 100.0 100.0 2,947 cases Data type: numeric Missing-data codes: lowest thru -1 Columns: 712-713
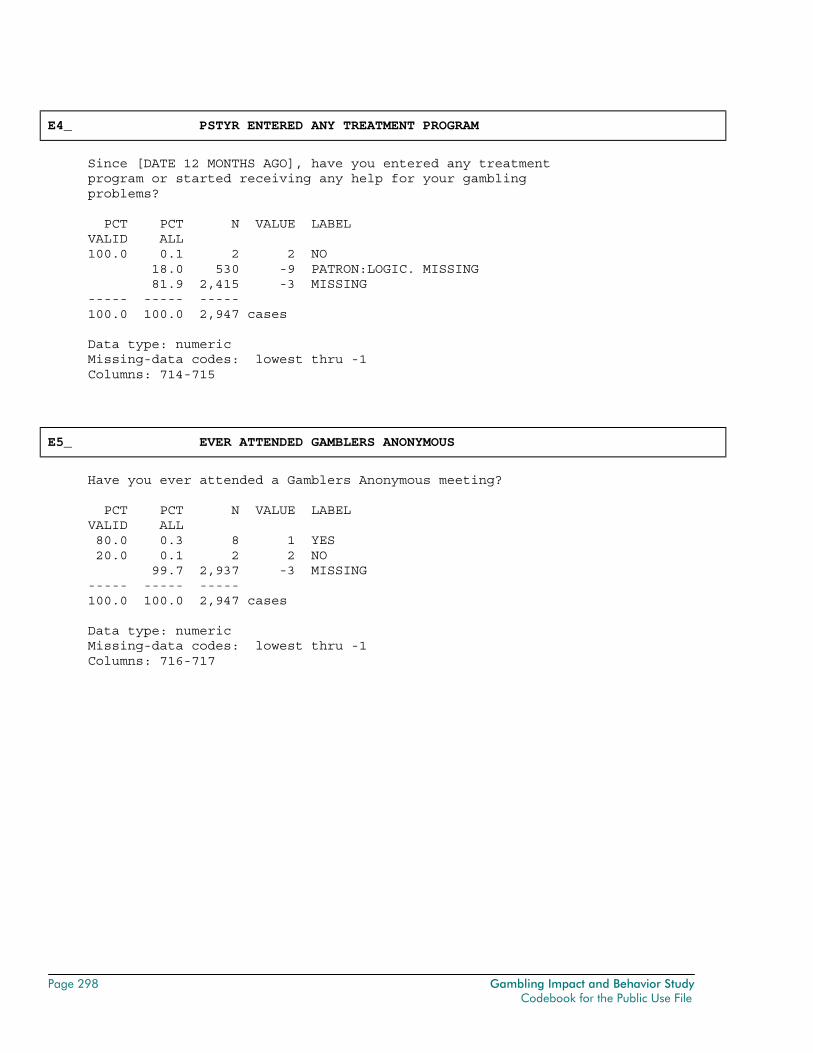
Page 298 Gambling Impact and Behavior Study Codebook for the Public Use File
E4_ PSTYR ENTERED ANY TREATMENT PROGRAM
Since [DATE 12 MONTHS AGO], have you entered any treatment program or started receiving any help for your gambling problems? PCT PCT N VALUE LABEL VALID ALL 100.0 0.1 2 2 NO 18.0 530 -9 PATRON:LOGIC. MISSING 81.9 2,415 -3 MISSING ----- ----- ----- 100.0 100.0 2,947 cases Data type: numeric Missing-data codes: lowest thru -1 Columns: 714-715
E5_ EVER ATTENDED GAMBLERS ANONYMOUS
Have you ever attended a Gamblers Anonymous meeting? PCT PCT N VALUE LABEL VALID ALL 80.0 0.3 8 1 YES 20.0 0.1 2 2 NO 99.7 2,937 -3 MISSING ----- ----- ----- 100.0 100.0 2,947 cases Data type: numeric Missing-data codes: lowest thru -1 Columns: 716-717
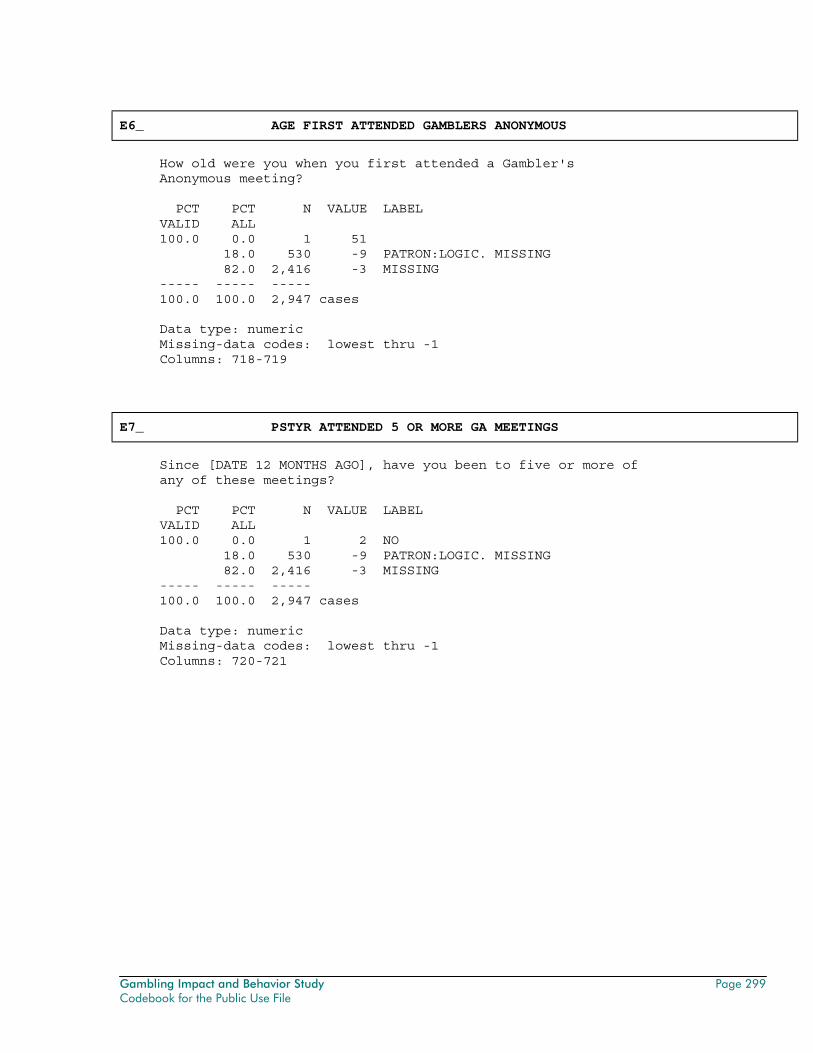
Gambling Impact and Behavior Study Page 299 Codebook for the Public Use File
E6_ AGE FIRST ATTENDED GAMBLERS ANONYMOUS
How old were you when you first attended a Gambler's Anonymous meeting? PCT PCT N VALUE LABEL VALID ALL 100.0 0.0 1 51 18.0 530 -9 PATRON:LOGIC. MISSING 82.0 2,416 -3 MISSING ----- ----- ----- 100.0 100.0 2,947 cases Data type: numeric Missing-data codes: lowest thru -1 Columns: 718-719
E7_ PSTYR ATTENDED 5 OR MORE GA MEETINGS
Since [DATE 12 MONTHS AGO], have you been to five or more of any of these meetings? PCT PCT N VALUE LABEL VALID ALL 100.0 0.0 1 2 NO 18.0 530 -9 PATRON:LOGIC. MISSING 82.0 2,416 -3 MISSING ----- ----- ----- 100.0 100.0 2,947 cases Data type: numeric Missing-data codes: lowest thru -1 Columns: 720-721
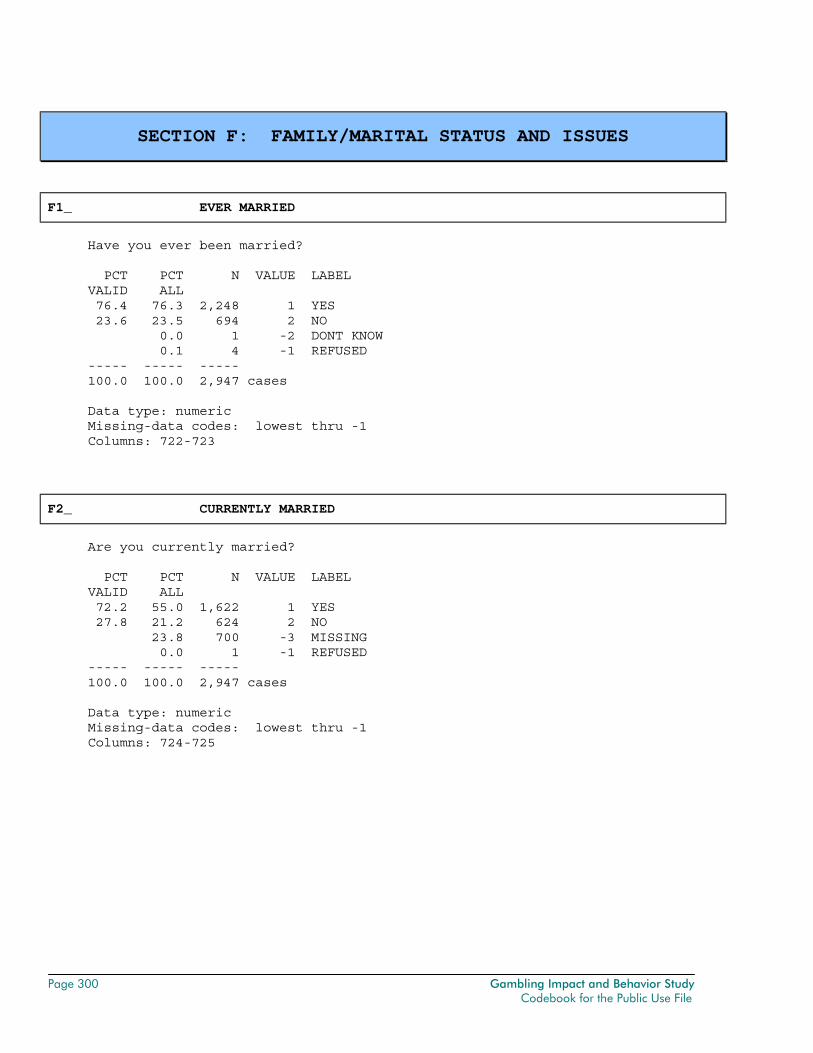
Page 300 Gambling Impact and Behavior Study Codebook for the Public Use File
SECTION F: FAMILY/MARITAL STATUS AND ISSUES
F1_ EVER MARRIED
Have you ever been married? PCT PCT N VALUE LABEL VALID ALL 76.4 76.3 2,248 1 YES 23.6 23.5 694 2 NO 0.0 1 -2 DONT KNOW 0.1 4 -1 REFUSED ----- ----- ----- 100.0 100.0 2,947 cases Data type: numeric Missing-data codes: lowest thru -1 Columns: 722-723
F2_ CURRENTLY MARRIED
Are you currently married? PCT PCT N VALUE LABEL VALID ALL 72.2 55.0 1,622 1 YES 27.8 21.2 624 2 NO 23.8 700 -3 MISSING 0.0 1 -1 REFUSED ----- ----- ----- 100.0 100.0 2,947 cases Data type: numeric Missing-data codes: lowest thru -1 Columns: 724-725
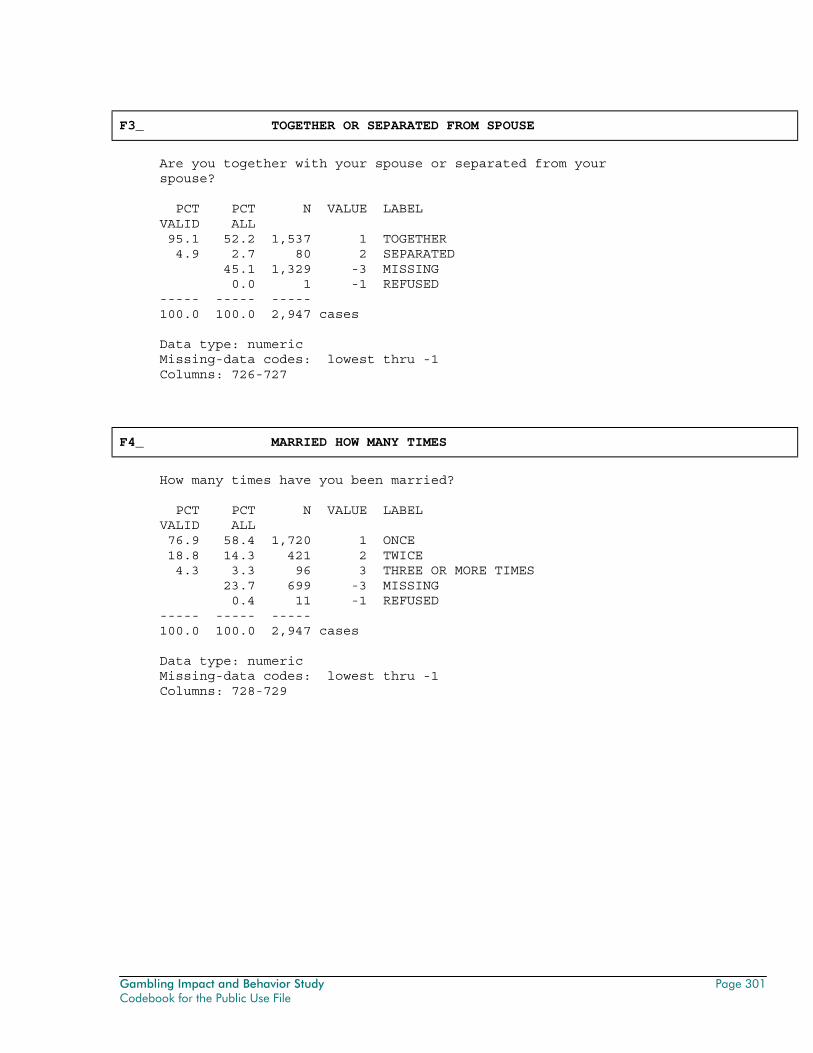
Gambling Impact and Behavior Study Page 301 Codebook for the Public Use File
F3_ TOGETHER OR SEPARATED FROM SPOUSE
Are you together with your spouse or separated from your spouse? PCT PCT N VALUE LABEL VALID ALL 95.1 52.2 1,537 1 TOGETHER 4.9 2.7 80 2 SEPARATED 45.1 1,329 -3 MISSING 0.0 1 -1 REFUSED ----- ----- ----- 100.0 100.0 2,947 cases Data type: numeric Missing-data codes: lowest thru -1 Columns: 726-727
F4_ MARRIED HOW MANY TIMES
How many times have you been married? PCT PCT N VALUE LABEL VALID ALL 76.9 58.4 1,720 1 ONCE 18.8 14.3 421 2 TWICE 4.3 3.3 96 3 THREE OR MORE TIMES 23.7 699 -3 MISSING 0.4 11 -1 REFUSED ----- ----- ----- 100.0 100.0 2,947 cases Data type: numeric Missing-data codes: lowest thru -1 Columns: 728-729
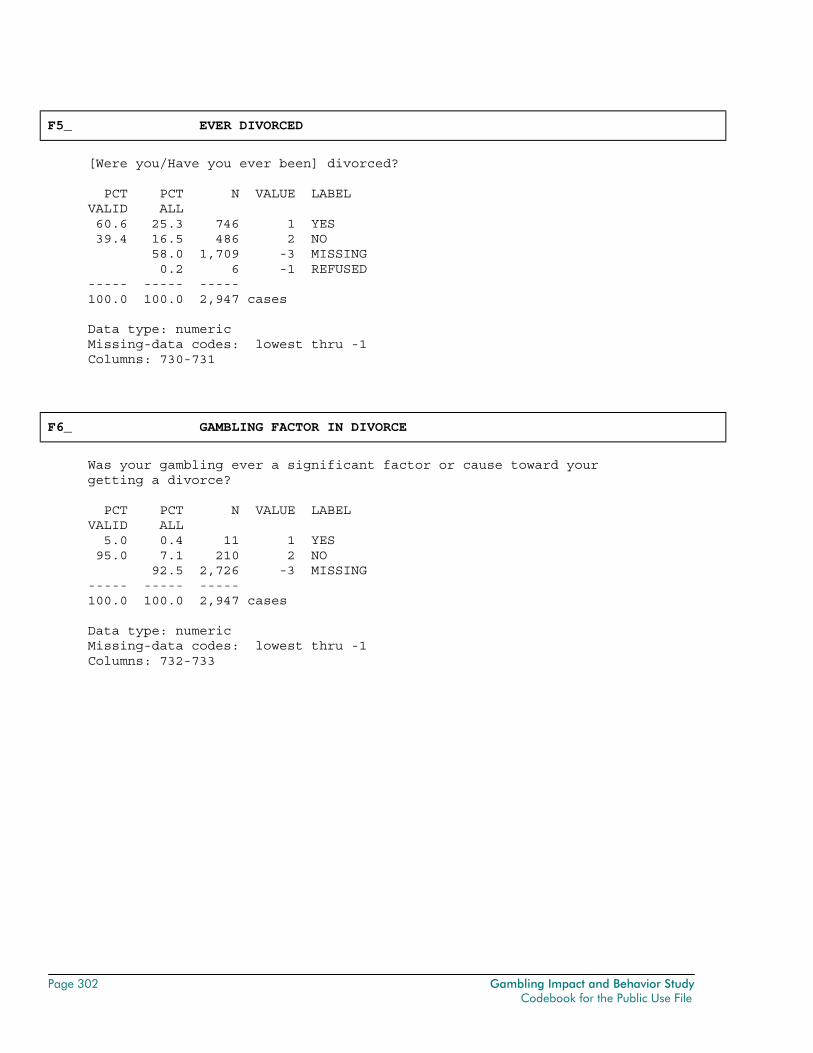
Page 302 Gambling Impact and Behavior Study Codebook for the Public Use File
F5_ EVER DIVORCED
[Were you/Have you ever been] divorced? PCT PCT N VALUE LABEL VALID ALL 60.6 25.3 746 1 YES 39.4 16.5 486 2 NO 58.0 1,709 -3 MISSING 0.2 6 -1 REFUSED ----- ----- ----- 100.0 100.0 2,947 cases Data type: numeric Missing-data codes: lowest thru -1 Columns: 730-731
F6_ GAMBLING FACTOR IN DIVORCE
Was your gambling ever a significant factor or cause toward your getting a divorce? PCT PCT N VALUE LABEL VALID ALL 5.0 0.4 11 1 YES 95.0 7.1 210 2 NO 92.5 2,726 -3 MISSING ----- ----- ----- 100.0 100.0 2,947 cases Data type: numeric Missing-data codes: lowest thru -1 Columns: 732-733
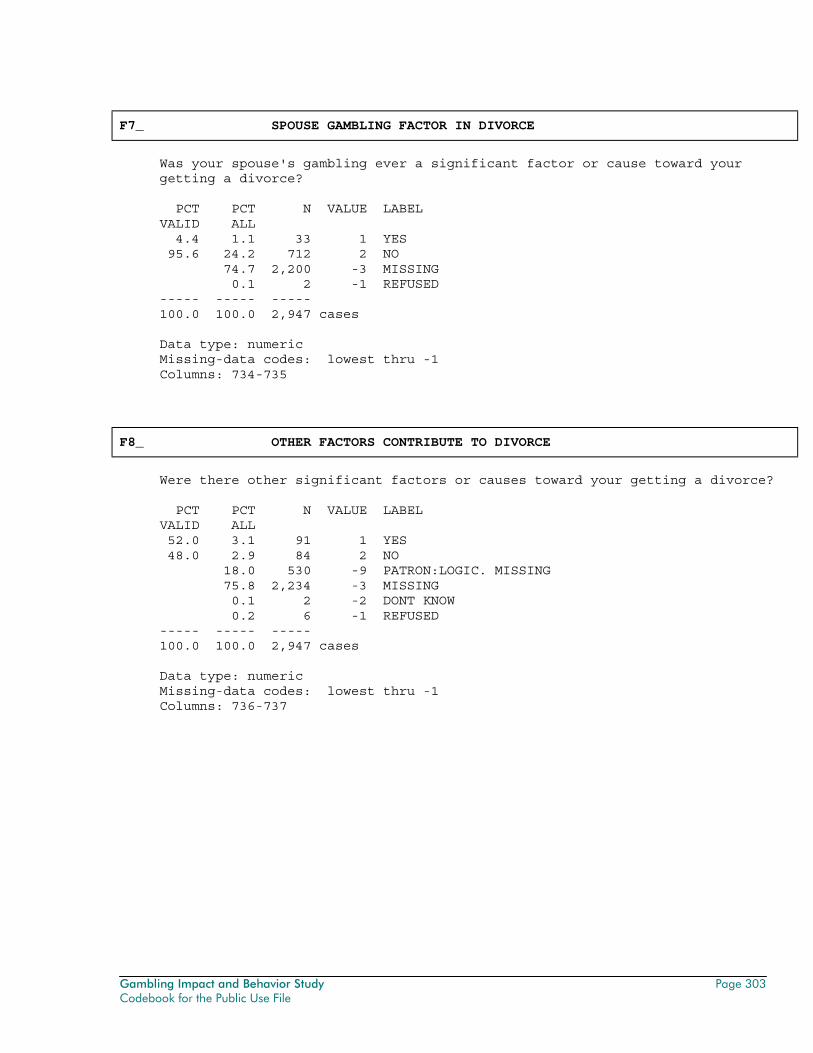
Gambling Impact and Behavior Study Page 303 Codebook for the Public Use File
F7_ SPOUSE GAMBLING FACTOR IN DIVORCE
Was your spouse's gambling ever a significant factor or cause toward your getting a divorce? PCT PCT N VALUE LABEL VALID ALL 4.4 1.1 33 1 YES 95.6 24.2 712 2 NO 74.7 2,200 -3 MISSING 0.1 2 -1 REFUSED ----- ----- ----- 100.0 100.0 2,947 cases Data type: numeric Missing-data codes: lowest thru -1 Columns: 734-735
F8_ OTHER FACTORS CONTRIBUTE TO DIVORCE
Were there other significant factors or causes toward your getting a divorce? PCT PCT N VALUE LABEL VALID ALL 52.0 3.1 91 1 YES 48.0 2.9 84 2 NO 18.0 530 -9 PATRON:LOGIC. MISSING 75.8 2,234 -3 MISSING 0.1 2 -2 DONT KNOW 0.2 6 -1 REFUSED ----- ----- ----- 100.0 100.0 2,947 cases Data type: numeric Missing-data codes: lowest thru -1 Columns: 736-737
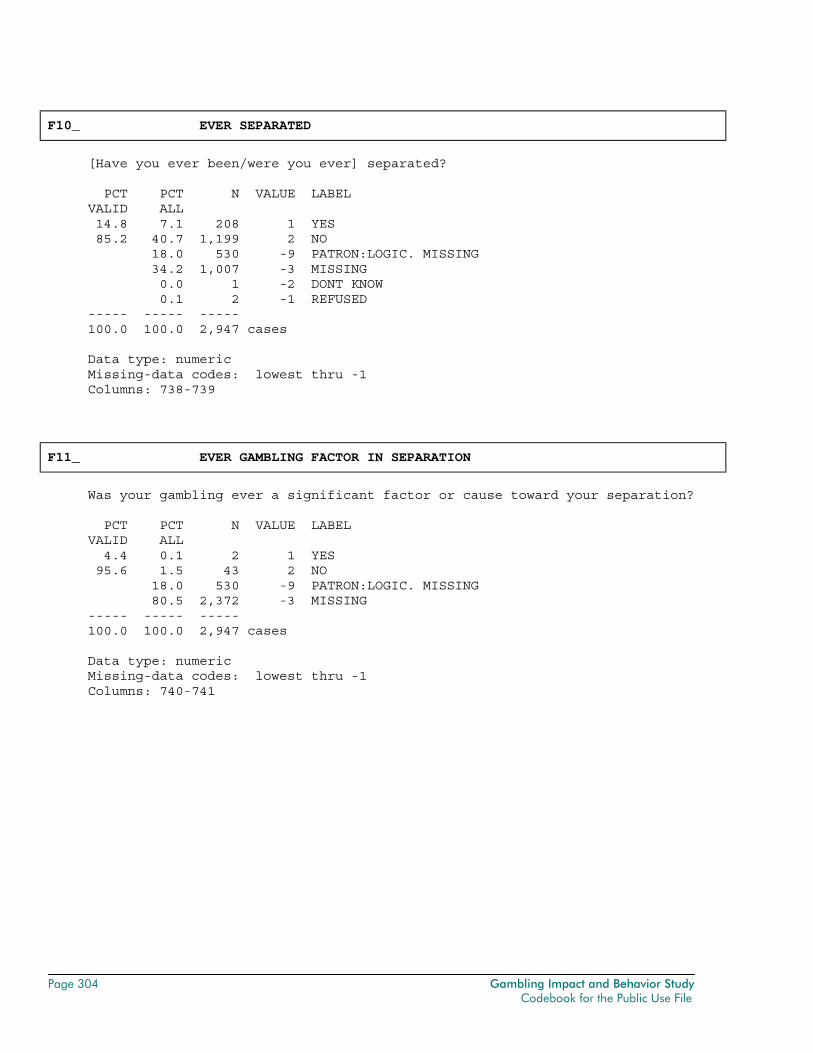
Page 304 Gambling Impact and Behavior Study Codebook for the Public Use File
F10_ EVER SEPARATED
[Have you ever been/were you ever] separated? PCT PCT N VALUE LABEL VALID ALL 14.8 7.1 208 1 YES 85.2 40.7 1,199 2 NO 18.0 530 -9 PATRON:LOGIC. MISSING 34.2 1,007 -3 MISSING 0.0 1 -2 DONT KNOW 0.1 2 -1 REFUSED ----- ----- ----- 100.0 100.0 2,947 cases Data type: numeric Missing-data codes: lowest thru -1 Columns: 738-739
F11_ EVER GAMBLING FACTOR IN SEPARATION
Was your gambling ever a significant factor or cause toward your separation? PCT PCT N VALUE LABEL VALID ALL 4.4 0.1 2 1 YES 95.6 1.5 43 2 NO 18.0 530 -9 PATRON:LOGIC. MISSING 80.5 2,372 -3 MISSING ----- ----- ----- 100.0 100.0 2,947 cases Data type: numeric Missing-data codes: lowest thru -1 Columns: 740-741
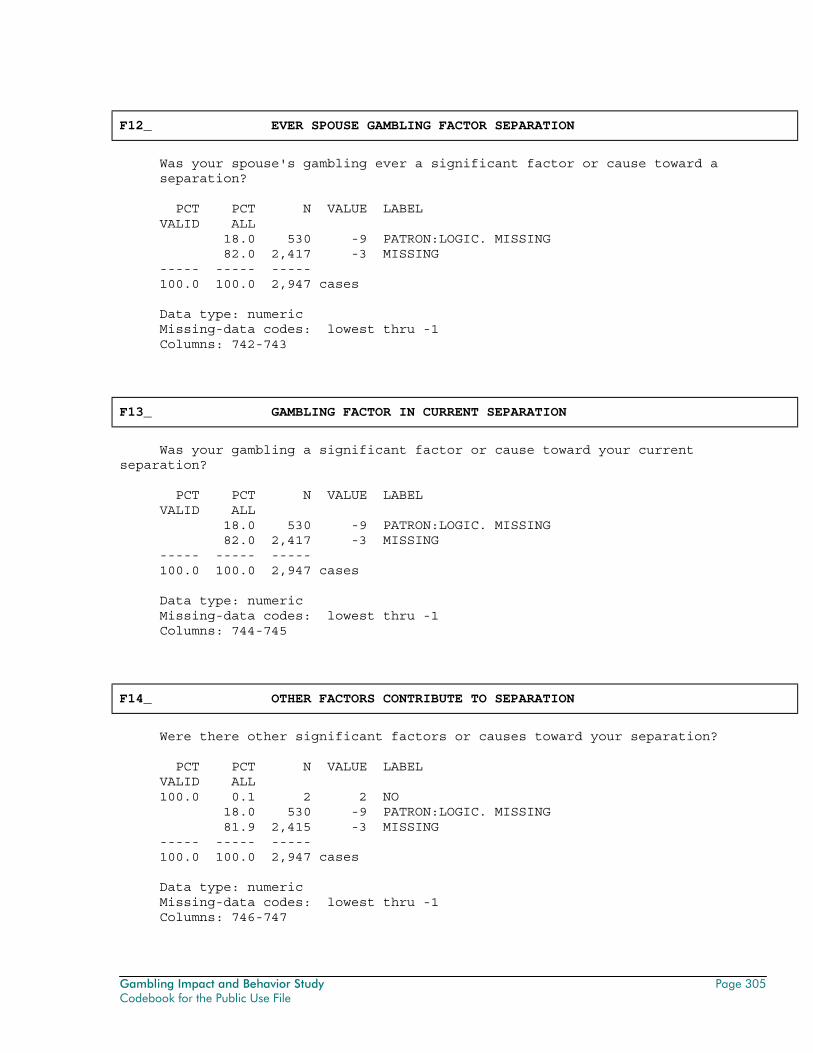
Gambling Impact and Behavior Study Page 305 Codebook for the Public Use File
F12_ EVER SPOUSE GAMBLING FACTOR SEPARATION
Was your spouse's gambling ever a significant factor or cause toward a separation? PCT PCT N VALUE LABEL VALID ALL 18.0 530 -9 PATRON:LOGIC. MISSING 82.0 2,417 -3 MISSING ----- ----- ----- 100.0 100.0 2,947 cases Data type: numeric Missing-data codes: lowest thru -1 Columns: 742-743
F13_ GAMBLING FACTOR IN CURRENT SEPARATION
Was your gambling a significant factor or cause toward your current separation? PCT PCT N VALUE LABEL VALID ALL 18.0 530 -9 PATRON:LOGIC. MISSING 82.0 2,417 -3 MISSING ----- ----- ----- 100.0 100.0 2,947 cases Data type: numeric Missing-data codes: lowest thru -1 Columns: 744-745
F14_ OTHER FACTORS CONTRIBUTE TO SEPARATION
Were there other significant factors or causes toward your separation? PCT PCT N VALUE LABEL VALID ALL 100.0 0.1 2 2 NO 18.0 530 -9 PATRON:LOGIC. MISSING 81.9 2,415 -3 MISSING ----- ----- ----- 100.0 100.0 2,947 cases Data type: numeric Missing-data codes: lowest thru -1 Columns: 746-747
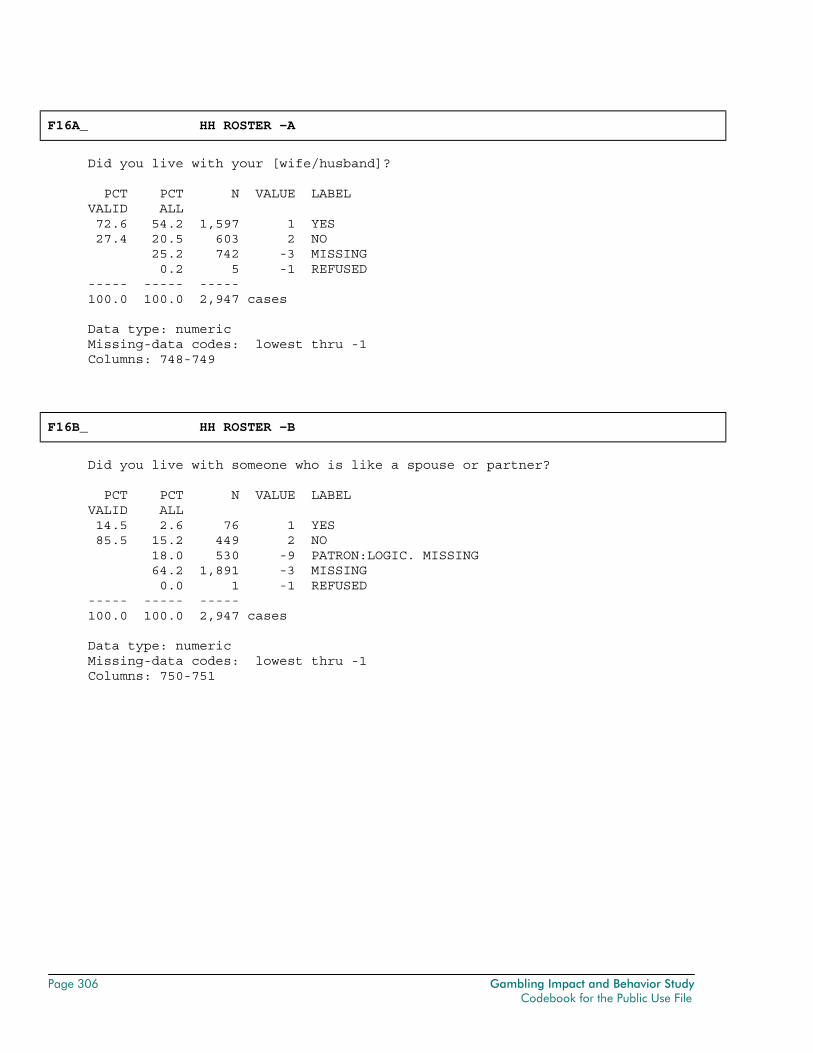
Page 306 Gambling Impact and Behavior Study Codebook for the Public Use File
F16A_ HH ROSTER -A
Did you live with your [wife/husband]? PCT PCT N VALUE LABEL VALID ALL 72.6 54.2 1,597 1 YES 27.4 20.5 603 2 NO 25.2 742 -3 MISSING 0.2 5 -1 REFUSED ----- ----- ----- 100.0 100.0 2,947 cases Data type: numeric Missing-data codes: lowest thru -1 Columns: 748-749
F16B_ HH ROSTER -B
Did you live with someone who is like a spouse or partner? PCT PCT N VALUE LABEL VALID ALL 14.5 2.6 76 1 YES 85.5 15.2 449 2 NO 18.0 530 -9 PATRON:LOGIC. MISSING 64.2 1,891 -3 MISSING 0.0 1 -1 REFUSED ----- ----- ----- 100.0 100.0 2,947 cases Data type: numeric Missing-data codes: lowest thru -1 Columns: 750-751
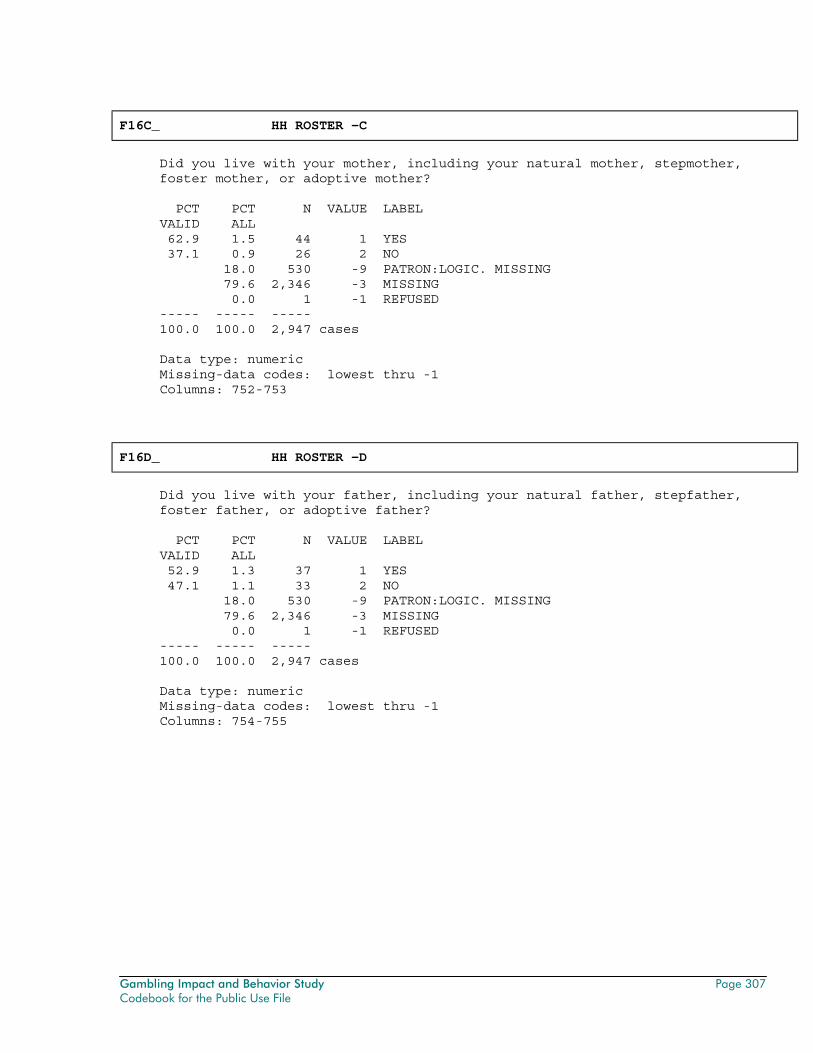
Gambling Impact and Behavior Study Page 307 Codebook for the Public Use File
F16C_ HH ROSTER -C
Did you live with your mother, including your natural mother, stepmother, foster mother, or adoptive mother? PCT PCT N VALUE LABEL VALID ALL 62.9 1.5 44 1 YES 37.1 0.9 26 2 NO 18.0 530 -9 PATRON:LOGIC. MISSING 79.6 2,346 -3 MISSING 0.0 1 -1 REFUSED ----- ----- ----- 100.0 100.0 2,947 cases Data type: numeric Missing-data codes: lowest thru -1 Columns: 752-753
F16D_ HH ROSTER -D
Did you live with your father, including your natural father, stepfather, foster father, or adoptive father? PCT PCT N VALUE LABEL VALID ALL 52.9 1.3 37 1 YES 47.1 1.1 33 2 NO 18.0 530 -9 PATRON:LOGIC. MISSING 79.6 2,346 -3 MISSING 0.0 1 -1 REFUSED ----- ----- ----- 100.0 100.0 2,947 cases Data type: numeric Missing-data codes: lowest thru -1 Columns: 754-755
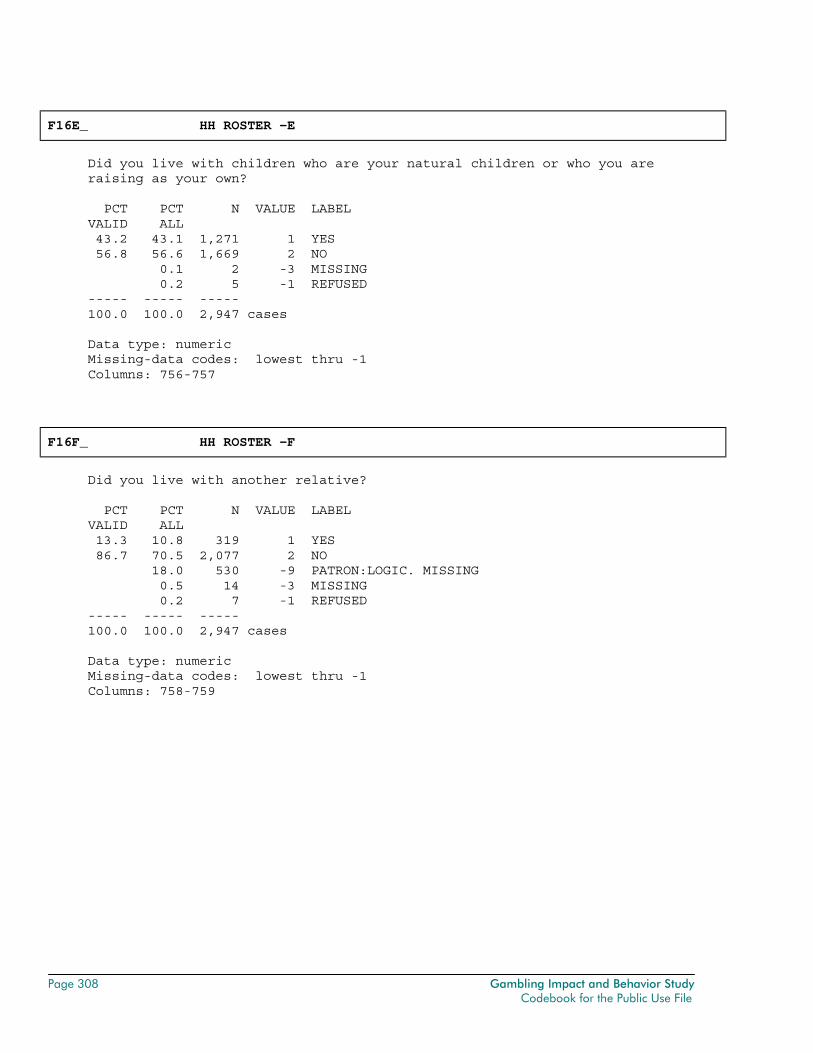
Page 308 Gambling Impact and Behavior Study Codebook for the Public Use File
F16E_ HH ROSTER -E
Did you live with children who are your natural children or who you are raising as your own? PCT PCT N VALUE LABEL VALID ALL 43.2 43.1 1,271 1 YES 56.8 56.6 1,669 2 NO 0.1 2 -3 MISSING 0.2 5 -1 REFUSED ----- ----- ----- 100.0 100.0 2,947 cases Data type: numeric Missing-data codes: lowest thru -1 Columns: 756-757
F16F_ HH ROSTER -F
Did you live with another relative? PCT PCT N VALUE LABEL VALID ALL 13.3 10.8 319 1 YES 86.7 70.5 2,077 2 NO 18.0 530 -9 PATRON:LOGIC. MISSING 0.5 14 -3 MISSING 0.2 7 -1 REFUSED ----- ----- ----- 100.0 100.0 2,947 cases Data type: numeric Missing-data codes: lowest thru -1 Columns: 758-759
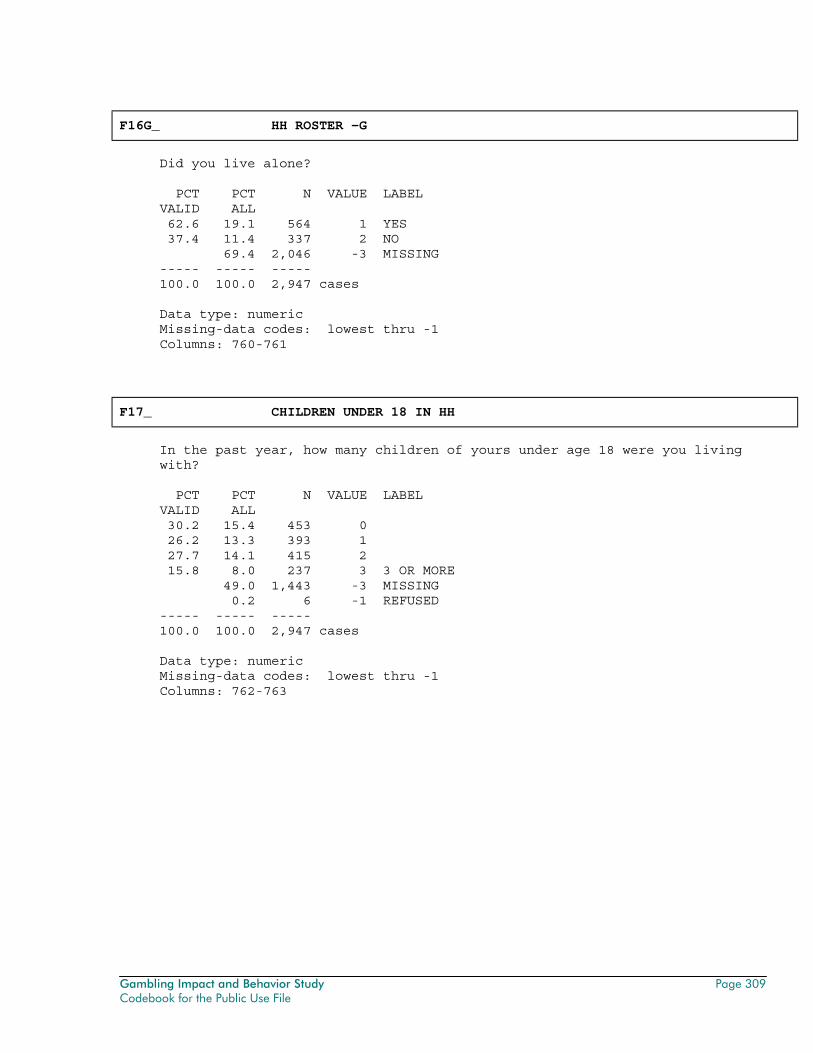
Gambling Impact and Behavior Study Page 309 Codebook for the Public Use File
F16G_ HH ROSTER -G
Did you live alone? PCT PCT N VALUE LABEL VALID ALL 62.6 19.1 564 1 YES 37.4 11.4 337 2 NO 69.4 2,046 -3 MISSING ----- ----- ----- 100.0 100.0 2,947 cases Data type: numeric Missing-data codes: lowest thru -1 Columns: 760-761
F17_ CHILDREN UNDER 18 IN HH
In the past year, how many children of yours under age 18 were you living with? PCT PCT N VALUE LABEL VALID ALL 30.2 15.4 453 0 26.2 13.3 393 1 27.7 14.1 415 2 15.8 8.0 237 3 3 OR MORE 49.0 1,443 -3 MISSING 0.2 6 -1 REFUSED ----- ----- ----- 100.0 100.0 2,947 cases Data type: numeric Missing-data codes: lowest thru -1 Columns: 762-763
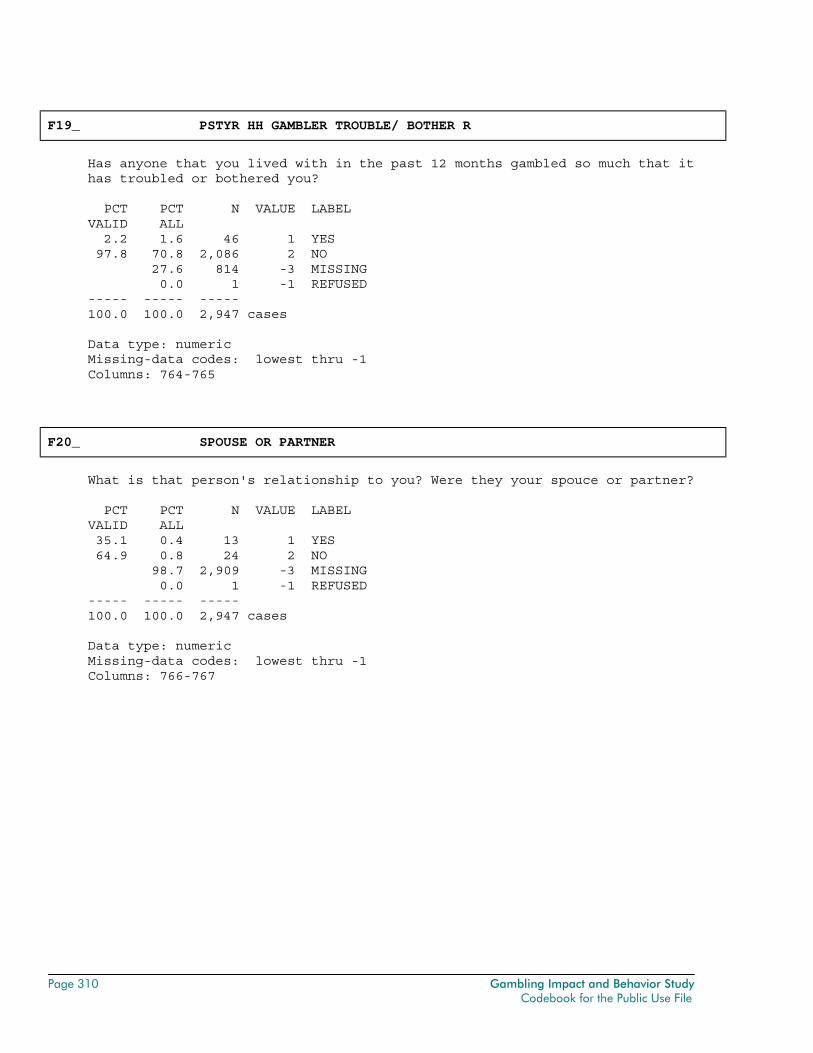
Page 310 Gambling Impact and Behavior Study Codebook for the Public Use File
F19_ PSTYR HH GAMBLER TROUBLE/ BOTHER R
Has anyone that you lived with in the past 12 months gambled so much that it has troubled or bothered you? PCT PCT N VALUE LABEL VALID ALL 2.2 1.6 46 1 YES 97.8 70.8 2,086 2 NO 27.6 814 -3 MISSING 0.0 1 -1 REFUSED ----- ----- ----- 100.0 100.0 2,947 cases Data type: numeric Missing-data codes: lowest thru -1 Columns: 764-765
F20_ SPOUSE OR PARTNER
What is that person's relationship to you? Were they your spouce or partner? PCT PCT N VALUE LABEL VALID ALL 35.1 0.4 13 1 YES 64.9 0.8 24 2 NO 98.7 2,909 -3 MISSING 0.0 1 -1 REFUSED ----- ----- ----- 100.0 100.0 2,947 cases Data type: numeric Missing-data codes: lowest thru -1 Columns: 766-767
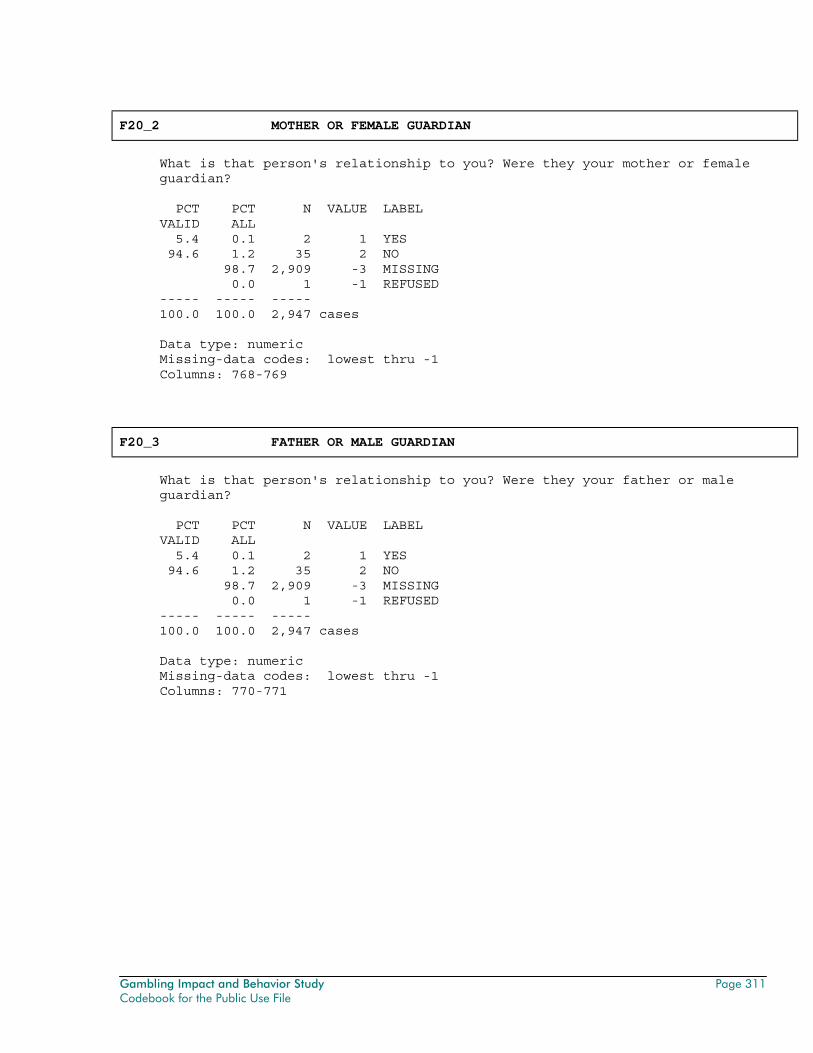
Gambling Impact and Behavior Study Page 311 Codebook for the Public Use File
F20_2 MOTHER OR FEMALE GUARDIAN
What is that person's relationship to you? Were they your mother or female guardian? PCT PCT N VALUE LABEL VALID ALL 5.4 0.1 2 1 YES 94.6 1.2 35 2 NO 98.7 2,909 -3 MISSING 0.0 1 -1 REFUSED ----- ----- ----- 100.0 100.0 2,947 cases Data type: numeric Missing-data codes: lowest thru -1 Columns: 768-769
F20_3 FATHER OR MALE GUARDIAN
What is that person's relationship to you? Were they your father or male guardian? PCT PCT N VALUE LABEL VALID ALL 5.4 0.1 2 1 YES 94.6 1.2 35 2 NO 98.7 2,909 -3 MISSING 0.0 1 -1 REFUSED ----- ----- ----- 100.0 100.0 2,947 cases Data type: numeric Missing-data codes: lowest thru -1 Columns: 770-771
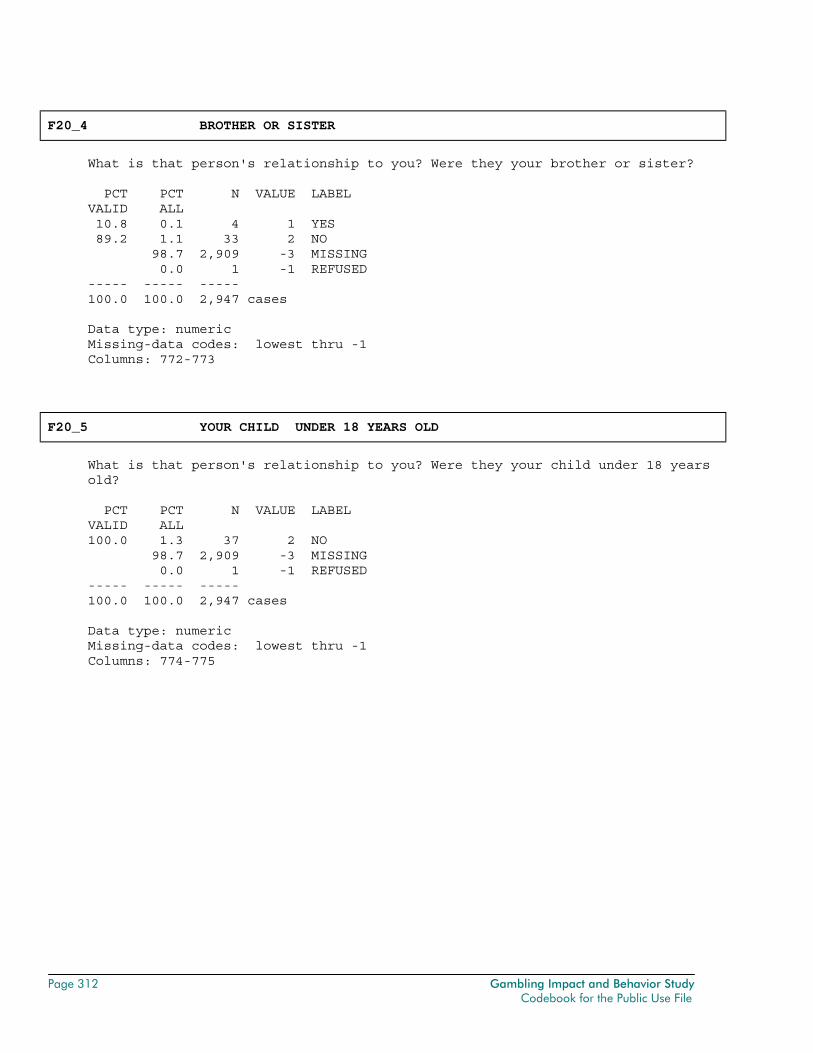
Page 312 Gambling Impact and Behavior Study Codebook for the Public Use File
F20_4 BROTHER OR SISTER
What is that person's relationship to you? Were they your brother or sister? PCT PCT N VALUE LABEL VALID ALL 10.8 0.1 4 1 YES 89.2 1.1 33 2 NO 98.7 2,909 -3 MISSING 0.0 1 -1 REFUSED ----- ----- ----- 100.0 100.0 2,947 cases Data type: numeric Missing-data codes: lowest thru -1 Columns: 772-773
F20_5 YOUR CHILD UNDER 18 YEARS OLD
What is that person's relationship to you? Were they your child under 18 years old? PCT PCT N VALUE LABEL VALID ALL 100.0 1.3 37 2 NO 98.7 2,909 -3 MISSING 0.0 1 -1 REFUSED ----- ----- ----- 100.0 100.0 2,947 cases Data type: numeric Missing-data codes: lowest thru -1 Columns: 774-775
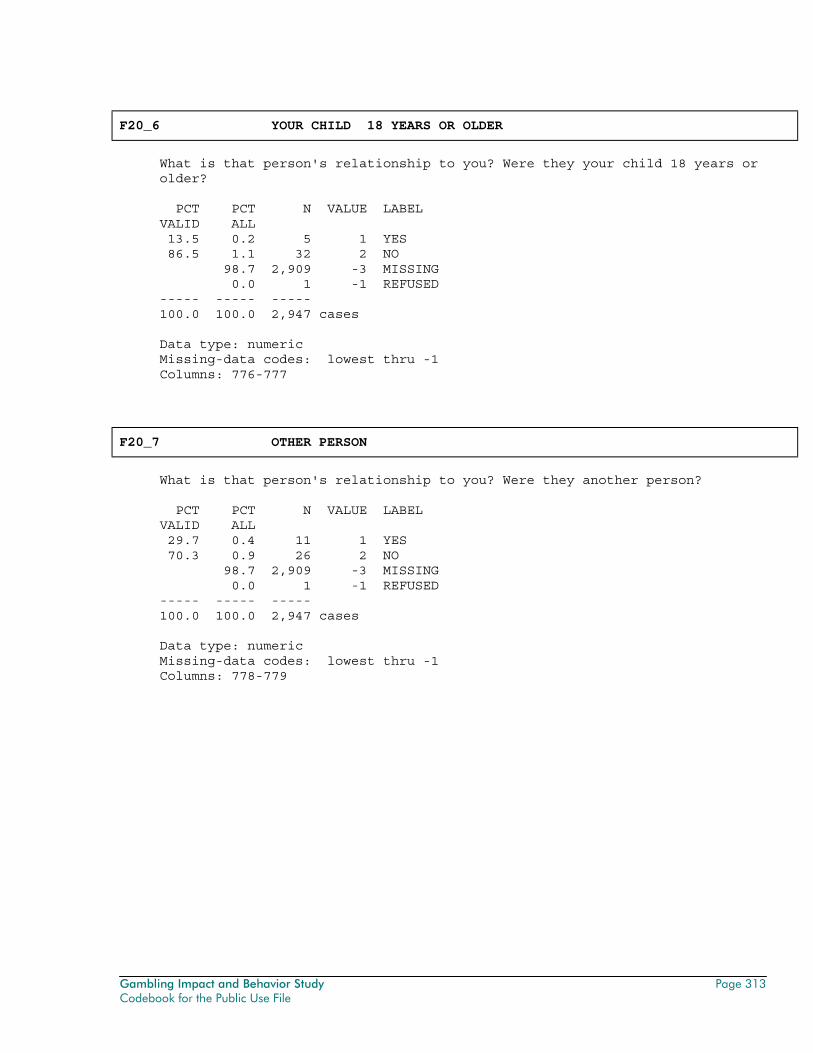
Gambling Impact and Behavior Study Page 313 Codebook for the Public Use File
F20_6 YOUR CHILD 18 YEARS OR OLDER
What is that person's relationship to you? Were they your child 18 years or older? PCT PCT N VALUE LABEL VALID ALL 13.5 0.2 5 1 YES 86.5 1.1 32 2 NO 98.7 2,909 -3 MISSING 0.0 1 -1 REFUSED ----- ----- ----- 100.0 100.0 2,947 cases Data type: numeric Missing-data codes: lowest thru -1 Columns: 776-777
F20_7 OTHER PERSON
What is that person's relationship to you? Were they another person? PCT PCT N VALUE LABEL VALID ALL 29.7 0.4 11 1 YES 70.3 0.9 26 2 NO 98.7 2,909 -3 MISSING 0.0 1 -1 REFUSED ----- ----- ----- 100.0 100.0 2,947 cases Data type: numeric Missing-data codes: lowest thru -1 Columns: 778-779
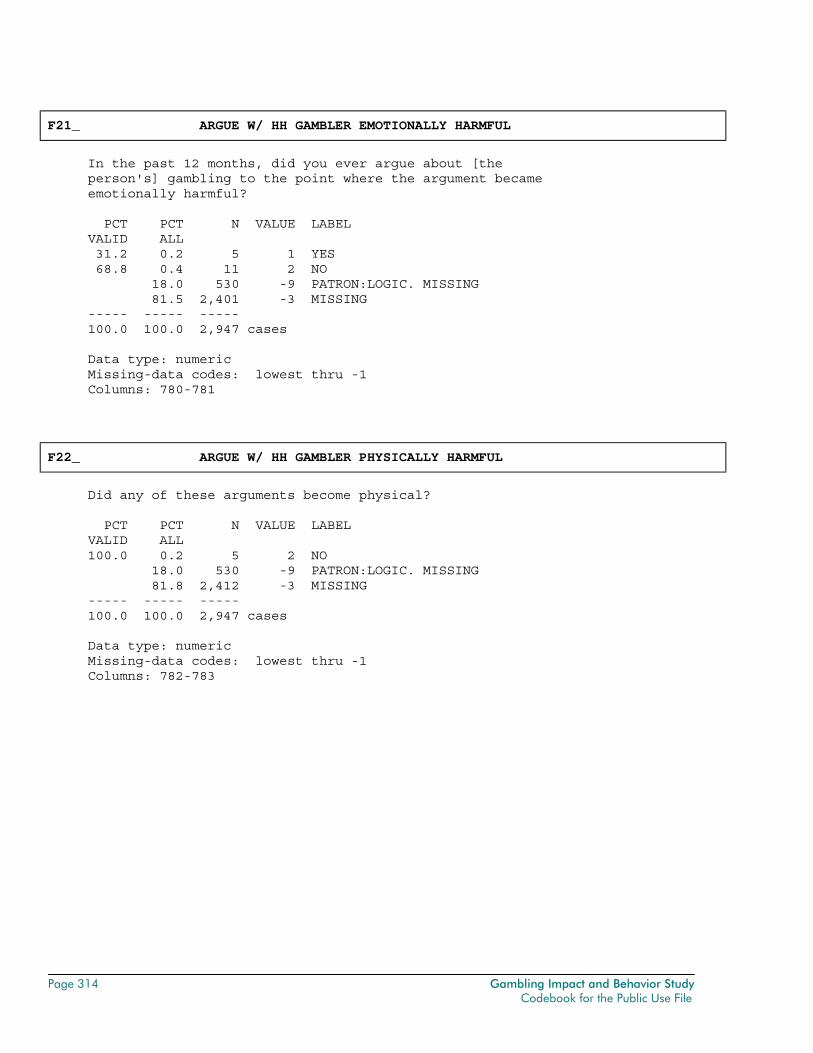
Page 314 Gambling Impact and Behavior Study Codebook for the Public Use File
F21_ ARGUE W/ HH GAMBLER EMOTIONALLY HARMFUL
In the past 12 months, did you ever argue about [the person's] gambling to the point where the argument became emotionally harmful? PCT PCT N VALUE LABEL VALID ALL 31.2 0.2 5 1 YES 68.8 0.4 11 2 NO 18.0 530 -9 PATRON:LOGIC. MISSING 81.5 2,401 -3 MISSING ----- ----- ----- 100.0 100.0 2,947 cases Data type: numeric Missing-data codes: lowest thru -1 Columns: 780-781
F22_ ARGUE W/ HH GAMBLER PHYSICALLY HARMFUL
Did any of these arguments become physical? PCT PCT N VALUE LABEL VALID ALL 100.0 0.2 5 2 NO 18.0 530 -9 PATRON:LOGIC. MISSING 81.8 2,412 -3 MISSING ----- ----- ----- 100.0 100.0 2,947 cases Data type: numeric Missing-data codes: lowest thru -1 Columns: 782-783
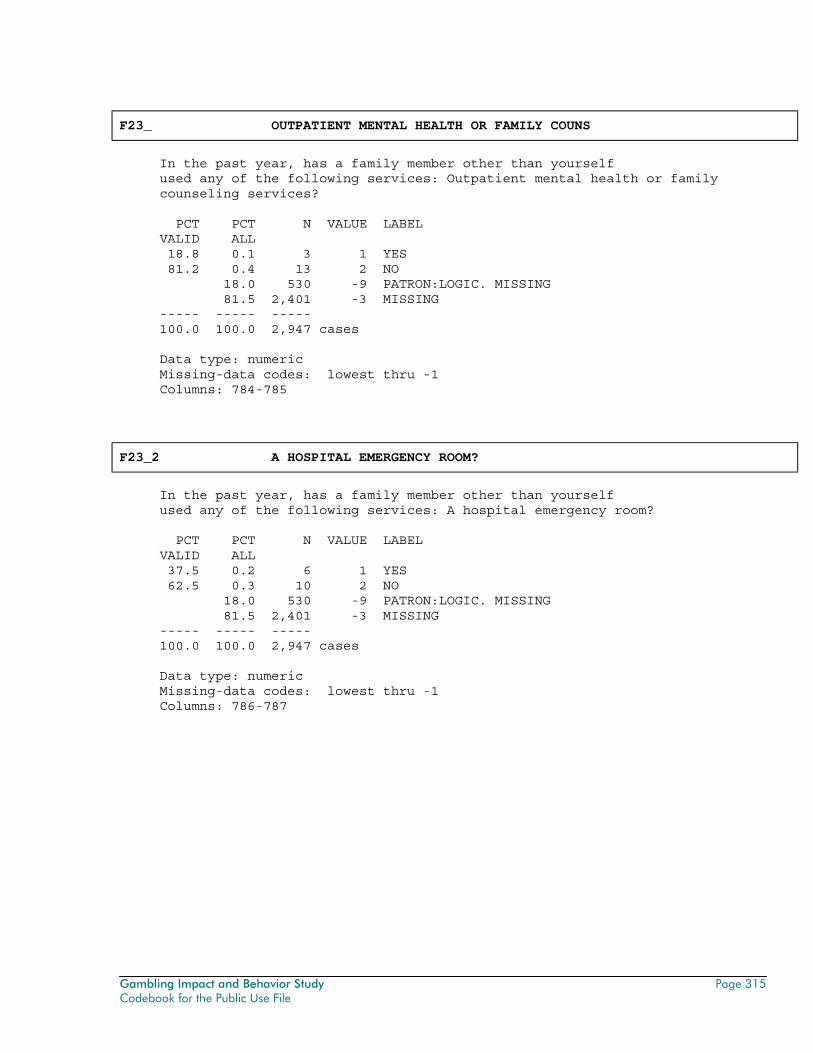
Gambling Impact and Behavior Study Page 315 Codebook for the Public Use File
F23_ OUTPATIENT MENTAL HEALTH OR FAMILY COUNS
In the past year, has a family member other than yourself used any of the following services: Outpatient mental health or family counseling services? PCT PCT N VALUE LABEL VALID ALL 18.8 0.1 3 1 YES 81.2 0.4 13 2 NO 18.0 530 -9 PATRON:LOGIC. MISSING 81.5 2,401 -3 MISSING ----- ----- ----- 100.0 100.0 2,947 cases Data type: numeric Missing-data codes: lowest thru -1 Columns: 784-785
F23_2 A HOSPITAL EMERGENCY ROOM?
In the past year, has a family member other than yourself used any of the following services: A hospital emergency room? PCT PCT N VALUE LABEL VALID ALL 37.5 0.2 6 1 YES 62.5 0.3 10 2 NO 18.0 530 -9 PATRON:LOGIC. MISSING 81.5 2,401 -3 MISSING ----- ----- ----- 100.0 100.0 2,947 cases Data type: numeric Missing-data codes: lowest thru -1 Columns: 786-787
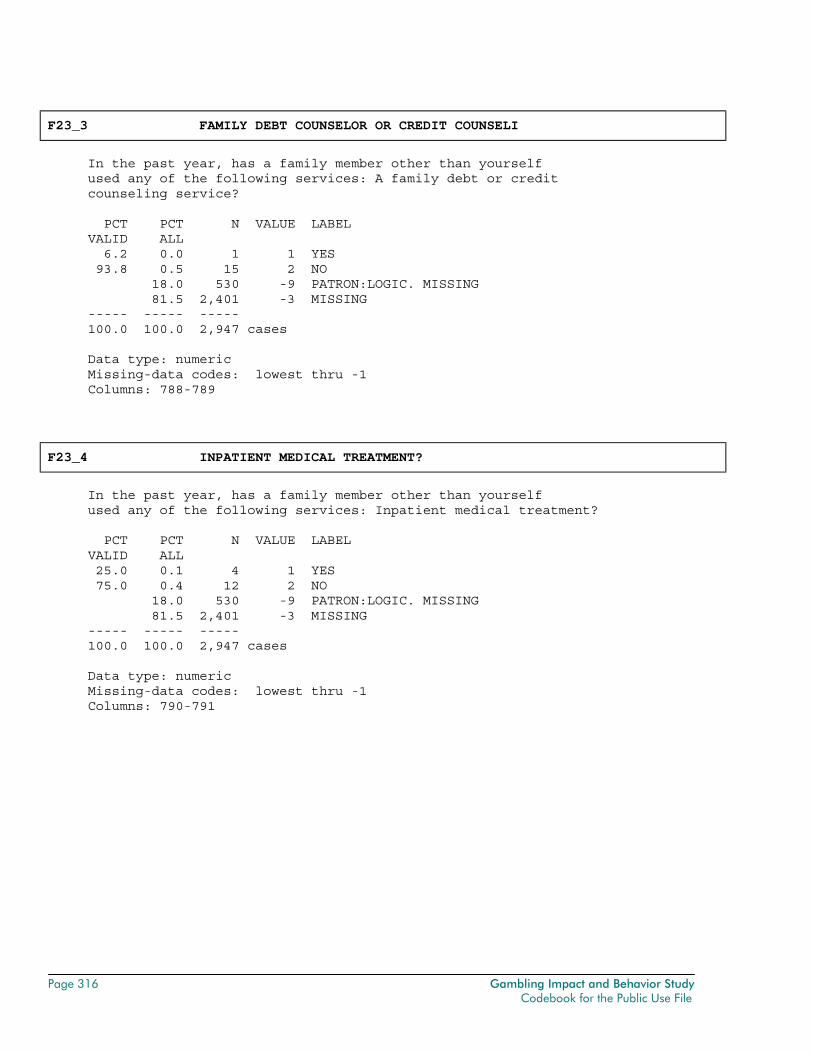
Page 316 Gambling Impact and Behavior Study Codebook for the Public Use File
F23_3 FAMILY DEBT COUNSELOR OR CREDIT COUNSELI
In the past year, has a family member other than yourself used any of the following services: A family debt or credit counseling service? PCT PCT N VALUE LABEL VALID ALL 6.2 0.0 1 1 YES 93.8 0.5 15 2 NO 18.0 530 -9 PATRON:LOGIC. MISSING 81.5 2,401 -3 MISSING ----- ----- ----- 100.0 100.0 2,947 cases Data type: numeric Missing-data codes: lowest thru -1 Columns: 788-789
F23_4 INPATIENT MEDICAL TREATMENT?
In the past year, has a family member other than yourself used any of the following services: Inpatient medical treatment? PCT PCT N VALUE LABEL VALID ALL 25.0 0.1 4 1 YES 75.0 0.4 12 2 NO 18.0 530 -9 PATRON:LOGIC. MISSING 81.5 2,401 -3 MISSING ----- ----- ----- 100.0 100.0 2,947 cases Data type: numeric Missing-data codes: lowest thru -1 Columns: 790-791
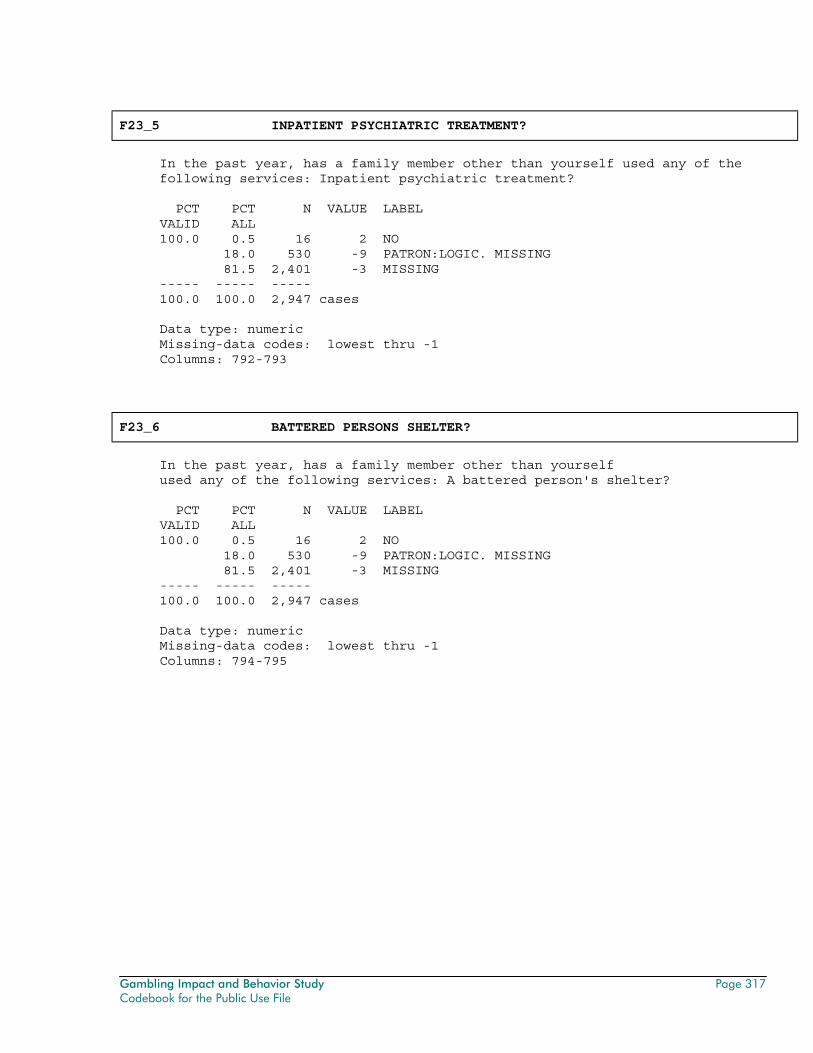
Gambling Impact and Behavior Study Page 317 Codebook for the Public Use File
F23_5 INPATIENT PSYCHIATRIC TREATMENT?
In the past year, has a family member other than yourself used any of the following services: Inpatient psychiatric treatment? PCT PCT N VALUE LABEL VALID ALL 100.0 0.5 16 2 NO 18.0 530 -9 PATRON:LOGIC. MISSING 81.5 2,401 -3 MISSING ----- ----- ----- 100.0 100.0 2,947 cases Data type: numeric Missing-data codes: lowest thru -1 Columns: 792-793
F23_6 BATTERED PERSONS SHELTER?
In the past year, has a family member other than yourself used any of the following services: A battered person's shelter? PCT PCT N VALUE LABEL VALID ALL 100.0 0.5 16 2 NO 18.0 530 -9 PATRON:LOGIC. MISSING 81.5 2,401 -3 MISSING ----- ----- ----- 100.0 100.0 2,947 cases Data type: numeric Missing-data codes: lowest thru -1 Columns: 794-795
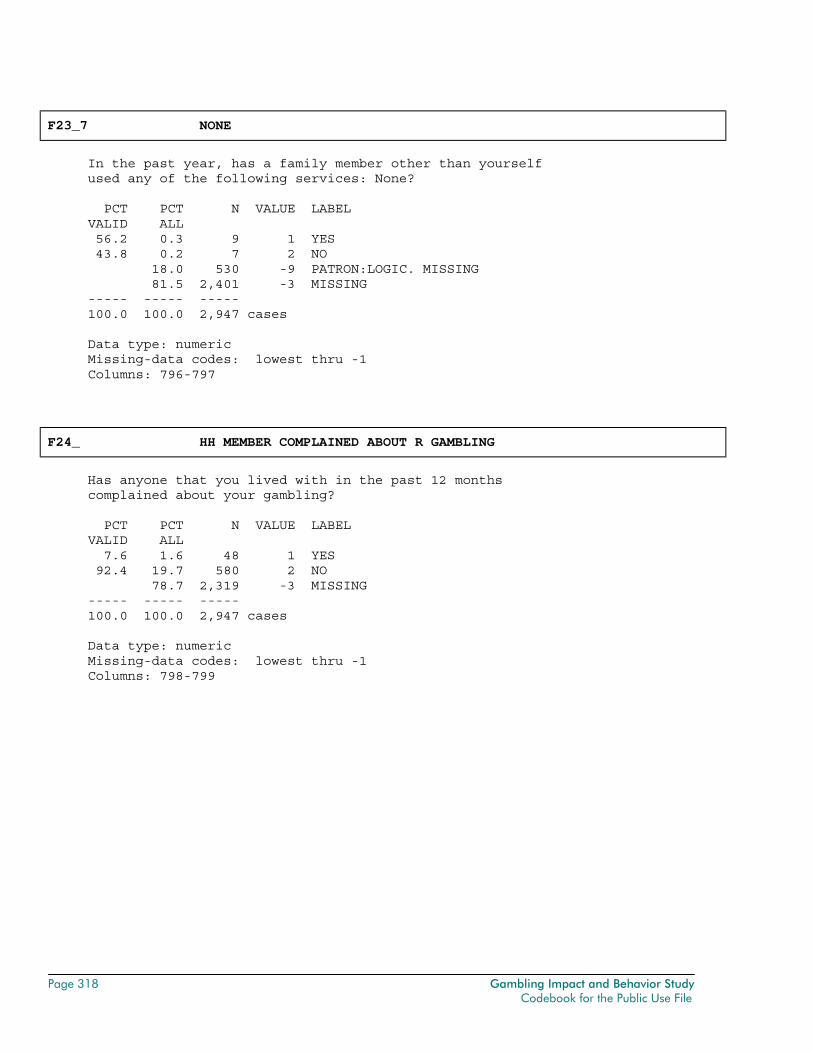
Page 318 Gambling Impact and Behavior Study Codebook for the Public Use File
F23_7 NONE
In the past year, has a family member other than yourself used any of the following services: None? PCT PCT N VALUE LABEL VALID ALL 56.2 0.3 9 1 YES 43.8 0.2 7 2 NO 18.0 530 -9 PATRON:LOGIC. MISSING 81.5 2,401 -3 MISSING ----- ----- ----- 100.0 100.0 2,947 cases Data type: numeric Missing-data codes: lowest thru -1 Columns: 796-797
F24_ HH MEMBER COMPLAINED ABOUT R GAMBLING
Has anyone that you lived with in the past 12 months complained about your gambling? PCT PCT N VALUE LABEL VALID ALL 7.6 1.6 48 1 YES 92.4 19.7 580 2 NO 78.7 2,319 -3 MISSING ----- ----- ----- 100.0 100.0 2,947 cases Data type: numeric Missing-data codes: lowest thru -1 Columns: 798-799
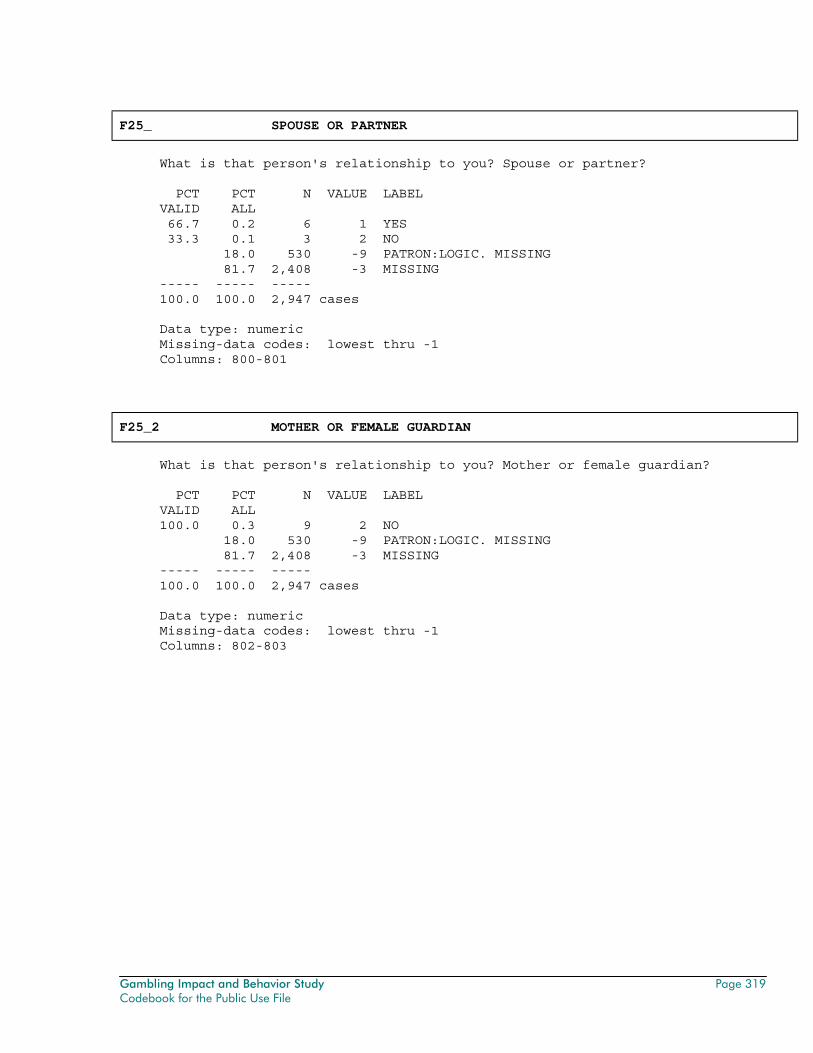
Gambling Impact and Behavior Study Page 319 Codebook for the Public Use File
F25_ SPOUSE OR PARTNER
What is that person's relationship to you? Spouse or partner? PCT PCT N VALUE LABEL VALID ALL 66.7 0.2 6 1 YES 33.3 0.1 3 2 NO 18.0 530 -9 PATRON:LOGIC. MISSING 81.7 2,408 -3 MISSING ----- ----- ----- 100.0 100.0 2,947 cases Data type: numeric Missing-data codes: lowest thru -1 Columns: 800-801
F25_2 MOTHER OR FEMALE GUARDIAN
What is that person's relationship to you? Mother or female guardian? PCT PCT N VALUE LABEL VALID ALL 100.0 0.3 9 2 NO 18.0 530 -9 PATRON:LOGIC. MISSING 81.7 2,408 -3 MISSING ----- ----- ----- 100.0 100.0 2,947 cases Data type: numeric Missing-data codes: lowest thru -1 Columns: 802-803
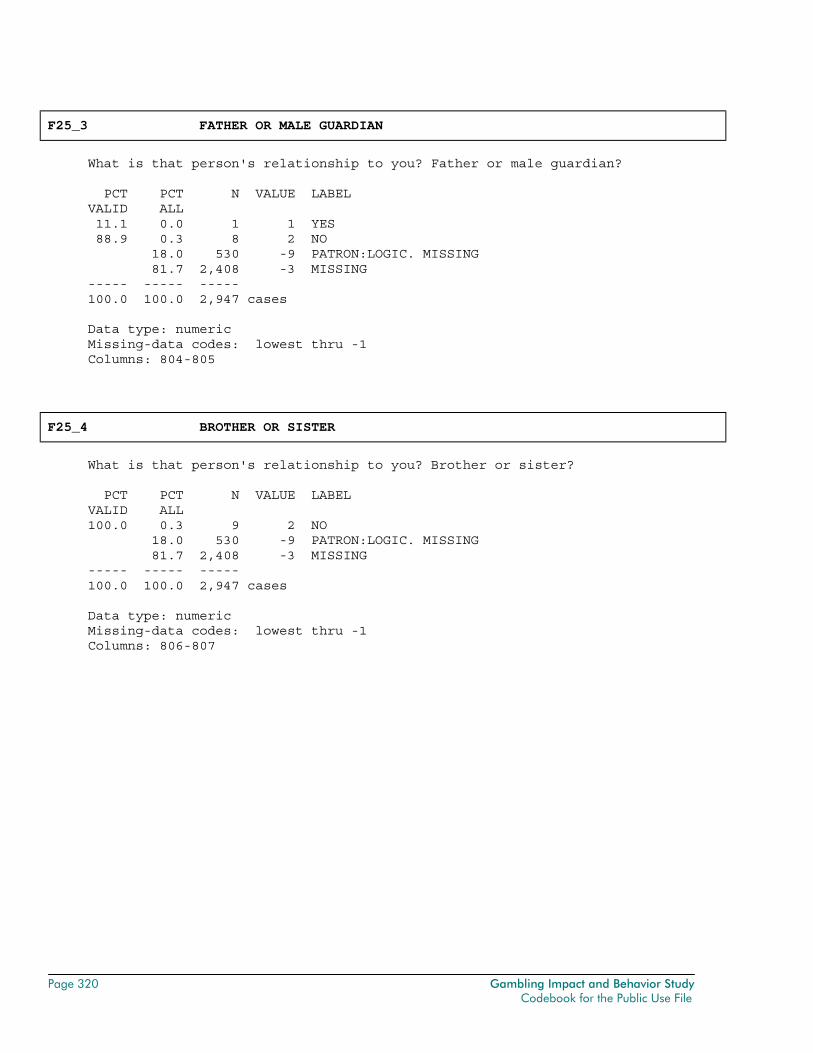
Page 320 Gambling Impact and Behavior Study Codebook for the Public Use File
F25_3 FATHER OR MALE GUARDIAN
What is that person's relationship to you? Father or male guardian? PCT PCT N VALUE LABEL VALID ALL 11.1 0.0 1 1 YES 88.9 0.3 8 2 NO 18.0 530 -9 PATRON:LOGIC. MISSING 81.7 2,408 -3 MISSING ----- ----- ----- 100.0 100.0 2,947 cases Data type: numeric Missing-data codes: lowest thru -1 Columns: 804-805
F25_4 BROTHER OR SISTER
What is that person's relationship to you? Brother or sister? PCT PCT N VALUE LABEL VALID ALL 100.0 0.3 9 2 NO 18.0 530 -9 PATRON:LOGIC. MISSING 81.7 2,408 -3 MISSING ----- ----- ----- 100.0 100.0 2,947 cases Data type: numeric Missing-data codes: lowest thru -1 Columns: 806-807
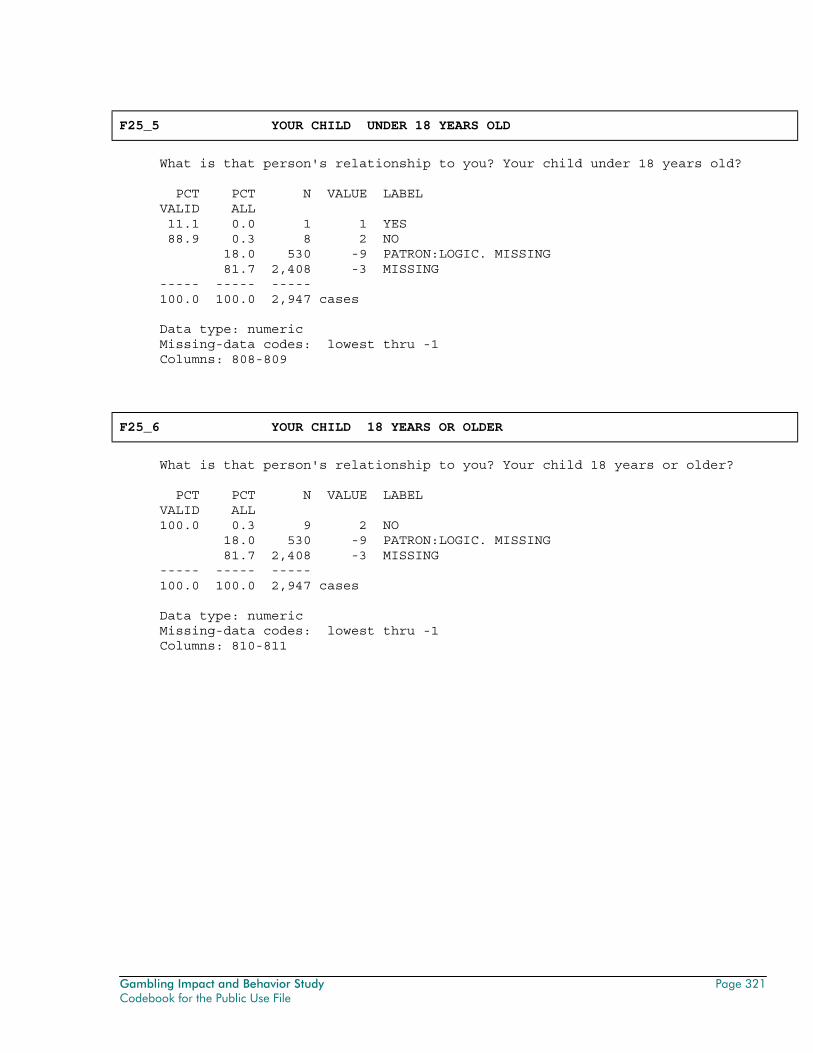
Gambling Impact and Behavior Study Page 321 Codebook for the Public Use File
F25_5 YOUR CHILD UNDER 18 YEARS OLD
What is that person's relationship to you? Your child under 18 years old? PCT PCT N VALUE LABEL VALID ALL 11.1 0.0 1 1 YES 88.9 0.3 8 2 NO 18.0 530 -9 PATRON:LOGIC. MISSING 81.7 2,408 -3 MISSING ----- ----- ----- 100.0 100.0 2,947 cases Data type: numeric Missing-data codes: lowest thru -1 Columns: 808-809
F25_6 YOUR CHILD 18 YEARS OR OLDER
What is that person's relationship to you? Your child 18 years or older? PCT PCT N VALUE LABEL VALID ALL 100.0 0.3 9 2 NO 18.0 530 -9 PATRON:LOGIC. MISSING 81.7 2,408 -3 MISSING ----- ----- ----- 100.0 100.0 2,947 cases Data type: numeric Missing-data codes: lowest thru -1 Columns: 810-811
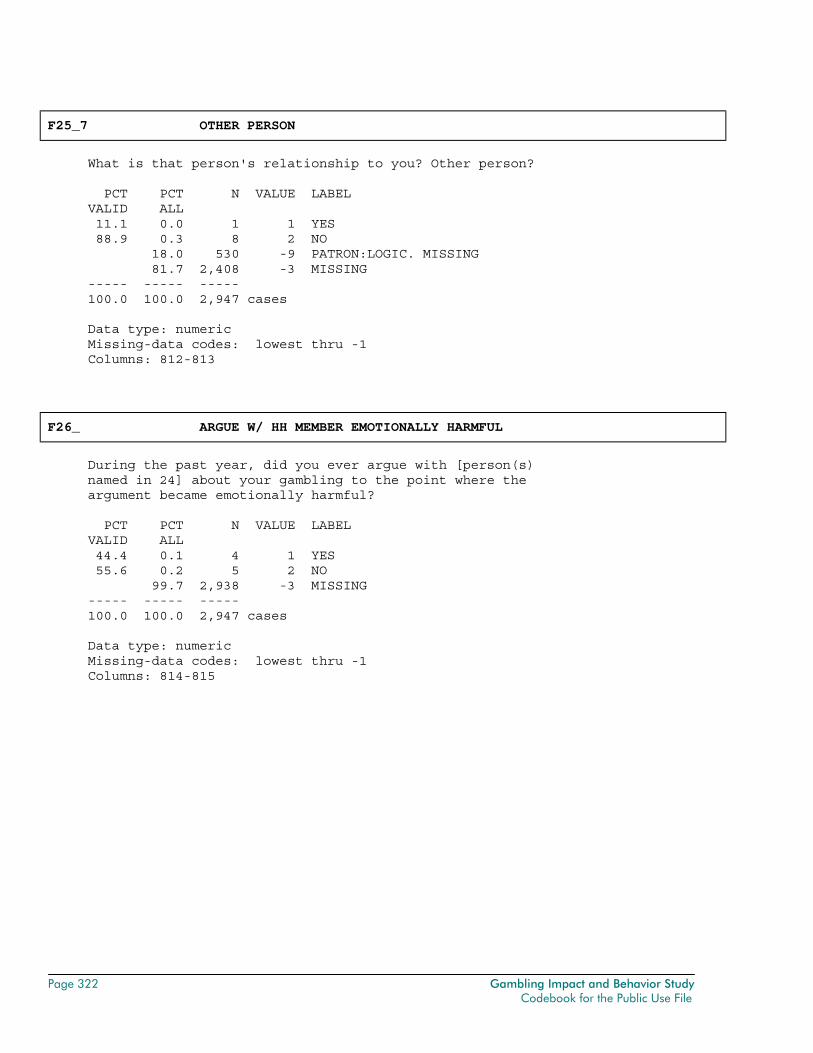
Page 322 Gambling Impact and Behavior Study Codebook for the Public Use File
F25_7 OTHER PERSON
What is that person's relationship to you? Other person? PCT PCT N VALUE LABEL VALID ALL 11.1 0.0 1 1 YES 88.9 0.3 8 2 NO 18.0 530 -9 PATRON:LOGIC. MISSING 81.7 2,408 -3 MISSING ----- ----- ----- 100.0 100.0 2,947 cases Data type: numeric Missing-data codes: lowest thru -1 Columns: 812-813
F26_ ARGUE W/ HH MEMBER EMOTIONALLY HARMFUL
During the past year, did you ever argue with [person(s) named in 24] about your gambling to the point where the argument became emotionally harmful? PCT PCT N VALUE LABEL VALID ALL 44.4 0.1 4 1 YES 55.6 0.2 5 2 NO 99.7 2,938 -3 MISSING ----- ----- ----- 100.0 100.0 2,947 cases Data type: numeric Missing-data codes: lowest thru -1 Columns: 814-815
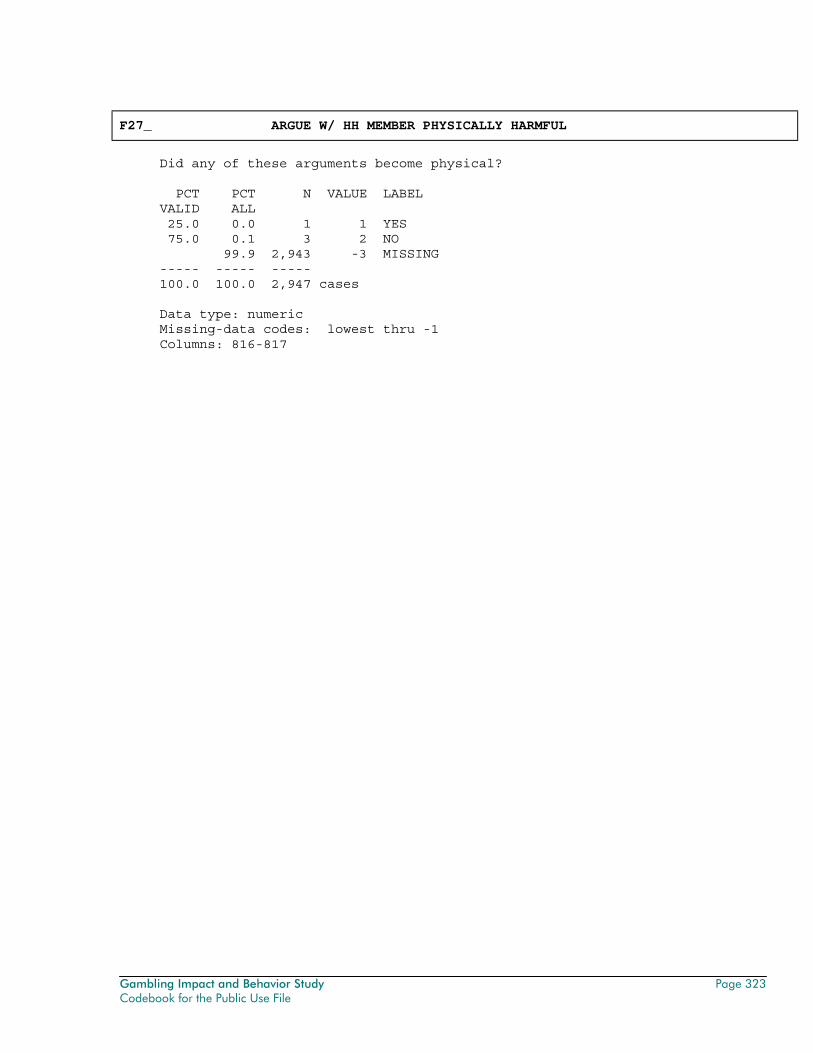
Gambling Impact and Behavior Study Page 323 Codebook for the Public Use File
F27_ ARGUE W/ HH MEMBER PHYSICALLY HARMFUL
Did any of these arguments become physical? PCT PCT N VALUE LABEL VALID ALL 25.0 0.0 1 1 YES 75.0 0.1 3 2 NO 99.9 2,943 -3 MISSING ----- ----- ----- 100.0 100.0 2,947 cases Data type: numeric Missing-data codes: lowest thru -1 Columns: 816-817

Page 324 Gambling Impact and Behavior Study Codebook for the Public Use File
SECTION G: INCOME AND FINANCIAL INFORMATION
G1_ CURRENT EMPLOYMENT STATUS
Right now, what is your employment status? Are you... PCT PCT N VALUE LABEL VALID ALL 53.4 53.1 1,564 1 WORKING FULL-TIME WITH ONLY ONE JOB 4.3 4.3 126 2 WORKING A FULL-TIME JOB PLUS ANOTHER JO 8.7 8.6 254 3 WORKING PART-TIME WITH ONLY ONE JOB 1.5 1.5 44 4 WORKING MORE THAN ONE PART-TIME JOB 32.1 31.9 939 5 ARE YOU UNEMPLOYED OR NOT IN THE LABOR 0.2 7 -3 MISSING 0.0 1 -2 DONT KNOW 0.4 12 -1 REFUSED ----- ----- ----- 100.0 100.0 2,947 cases Data type: numeric Missing-data codes: lowest thru -1 Columns: 818-819
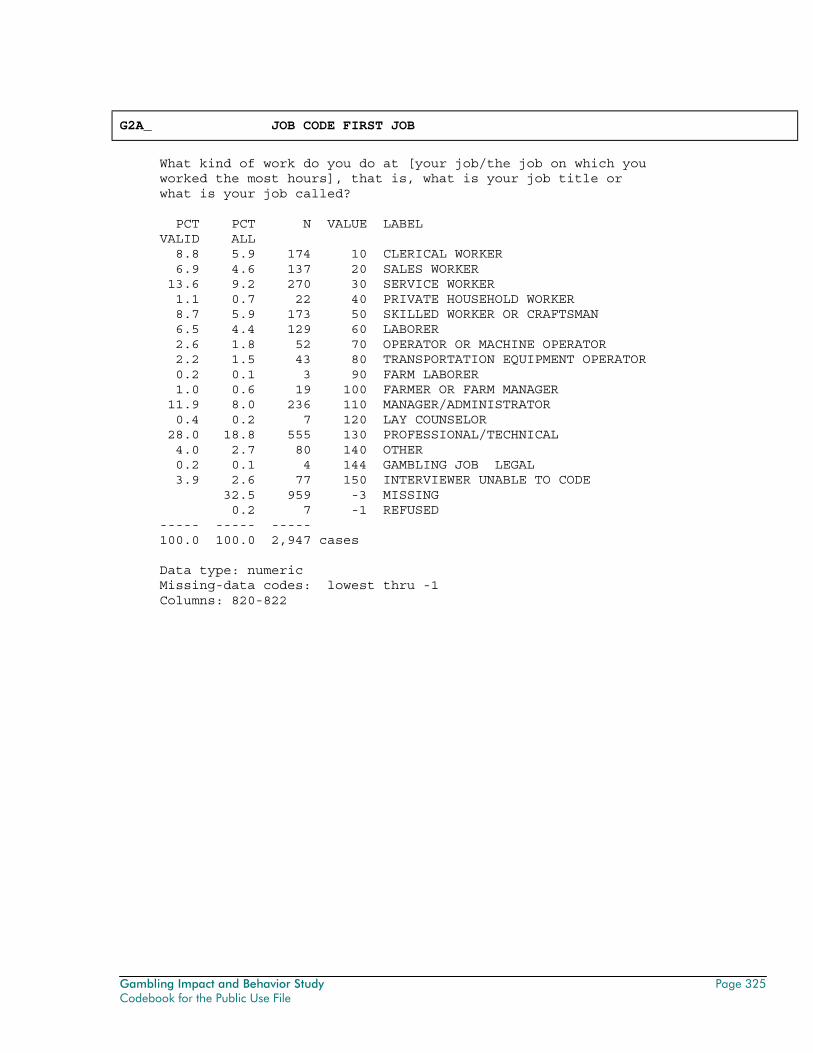
Gambling Impact and Behavior Study Page 325 Codebook for the Public Use File
G2A_ JOB CODE FIRST JOB
What kind of work do you do at [your job/the job on which you worked the most hours], that is, what is your job title or what is your job called? PCT PCT N VALUE LABEL VALID ALL 8.8 5.9 174 10 CLERICAL WORKER 6.9 4.6 137 20 SALES WORKER 13.6 9.2 270 30 SERVICE WORKER 1.1 0.7 22 40 PRIVATE HOUSEHOLD WORKER 8.7 5.9 173 50 SKILLED WORKER OR CRAFTSMAN 6.5 4.4 129 60 LABORER 2.6 1.8 52 70 OPERATOR OR MACHINE OPERATOR 2.2 1.5 43 80 TRANSPORTATION EQUIPMENT OPERATOR 0.2 0.1 3 90 FARM LABORER 1.0 0.6 19 100 FARMER OR FARM MANAGER 11.9 8.0 236 110 MANAGER/ADMINISTRATOR 0.4 0.2 7 120 LAY COUNSELOR 28.0 18.8 555 130 PROFESSIONAL/TECHNICAL 4.0 2.7 80 140 OTHER 0.2 0.1 4 144 GAMBLING JOB LEGAL 3.9 2.6 77 150 INTERVIEWER UNABLE TO CODE 32.5 959 -3 MISSING 0.2 7 -1 REFUSED ----- ----- ----- 100.0 100.0 2,947 cases Data type: numeric Missing-data codes: lowest thru -1 Columns: 820-822
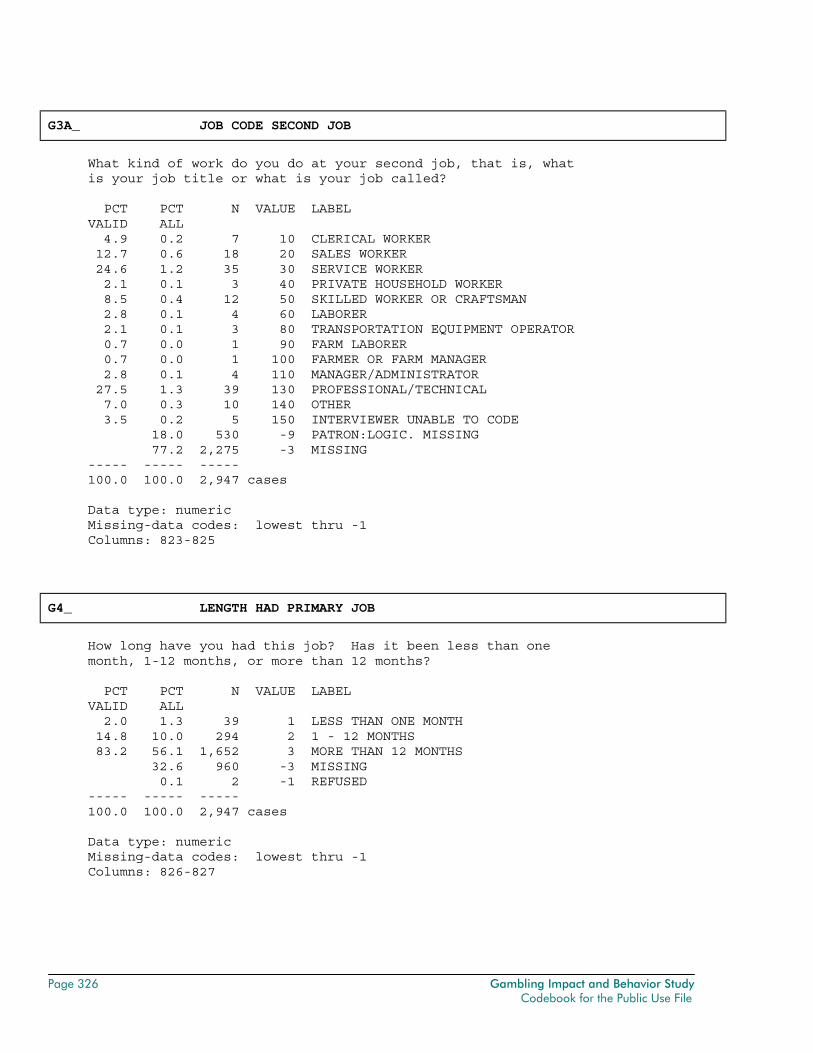
Page 326 Gambling Impact and Behavior Study Codebook for the Public Use File
G3A_ JOB CODE SECOND JOB
What kind of work do you do at your second job, that is, what is your job title or what is your job called? PCT PCT N VALUE LABEL VALID ALL 4.9 0.2 7 10 CLERICAL WORKER 12.7 0.6 18 20 SALES WORKER 24.6 1.2 35 30 SERVICE WORKER 2.1 0.1 3 40 PRIVATE HOUSEHOLD WORKER 8.5 0.4 12 50 SKILLED WORKER OR CRAFTSMAN 2.8 0.1 4 60 LABORER 2.1 0.1 3 80 TRANSPORTATION EQUIPMENT OPERATOR 0.7 0.0 1 90 FARM LABORER 0.7 0.0 1 100 FARMER OR FARM MANAGER 2.8 0.1 4 110 MANAGER/ADMINISTRATOR 27.5 1.3 39 130 PROFESSIONAL/TECHNICAL 7.0 0.3 10 140 OTHER 3.5 0.2 5 150 INTERVIEWER UNABLE TO CODE 18.0 530 -9 PATRON:LOGIC. MISSING 77.2 2,275 -3 MISSING ----- ----- ----- 100.0 100.0 2,947 cases Data type: numeric Missing-data codes: lowest thru -1 Columns: 823-825
G4_ LENGTH HAD PRIMARY JOB
How long have you had this job? Has it been less than one month, 1-12 months, or more than 12 months? PCT PCT N VALUE LABEL VALID ALL 2.0 1.3 39 1 LESS THAN ONE MONTH 14.8 10.0 294 2 1 - 12 MONTHS 83.2 56.1 1,652 3 MORE THAN 12 MONTHS 32.6 960 -3 MISSING 0.1 2 -1 REFUSED ----- ----- ----- 100.0 100.0 2,947 cases Data type: numeric Missing-data codes: lowest thru -1 Columns: 826-827
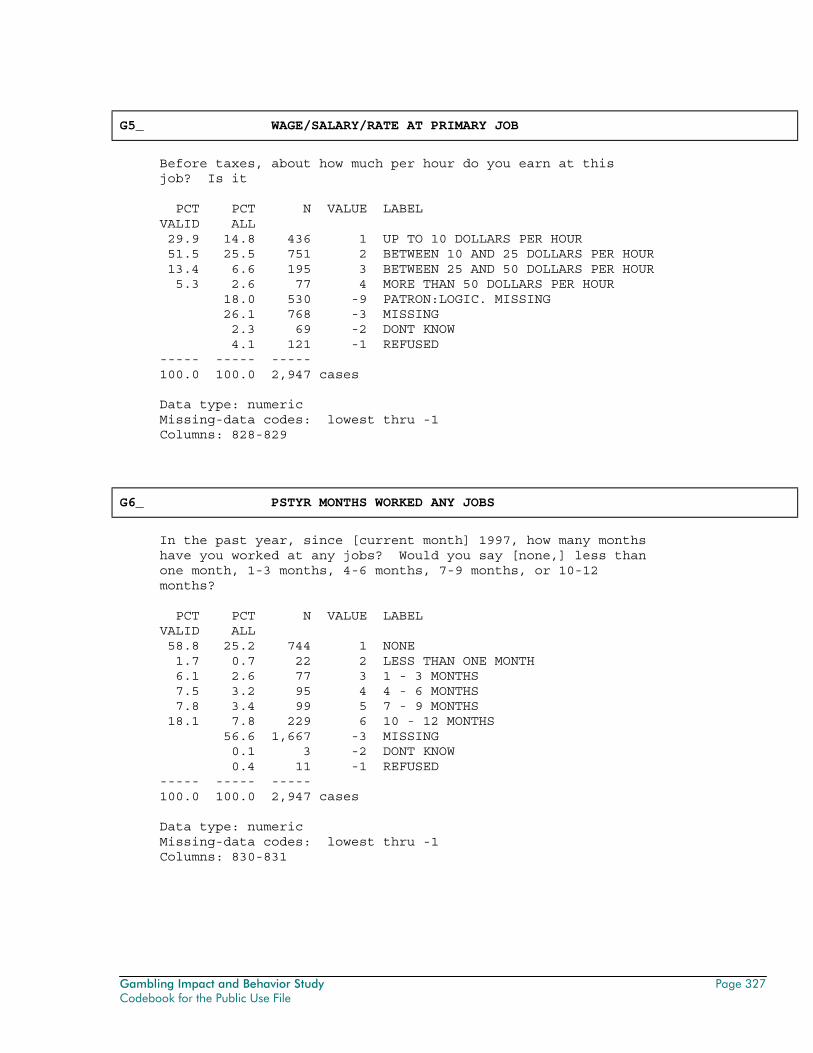
Gambling Impact and Behavior Study Page 327 Codebook for the Public Use File
G5_ WAGE/SALARY/RATE AT PRIMARY JOB
Before taxes, about how much per hour do you earn at this job? Is it PCT PCT N VALUE LABEL VALID ALL 29.9 14.8 436 1 UP TO 10 DOLLARS PER HOUR 51.5 25.5 751 2 BETWEEN 10 AND 25 DOLLARS PER HOUR 13.4 6.6 195 3 BETWEEN 25 AND 50 DOLLARS PER HOUR 5.3 2.6 77 4 MORE THAN 50 DOLLARS PER HOUR 18.0 530 -9 PATRON:LOGIC. MISSING 26.1 768 -3 MISSING 2.3 69 -2 DONT KNOW 4.1 121 -1 REFUSED ----- ----- ----- 100.0 100.0 2,947 cases Data type: numeric Missing-data codes: lowest thru -1 Columns: 828-829
G6_ PSTYR MONTHS WORKED ANY JOBS
In the past year, since [current month] 1997, how many months have you worked at any jobs? Would you say [none,] less than one month, 1-3 months, 4-6 months, 7-9 months, or 10-12 months? PCT PCT N VALUE LABEL VALID ALL 58.8 25.2 744 1 NONE 1.7 0.7 22 2 LESS THAN ONE MONTH 6.1 2.6 77 3 1 - 3 MONTHS 7.5 3.2 95 4 4 - 6 MONTHS 7.8 3.4 99 5 7 - 9 MONTHS 18.1 7.8 229 6 10 - 12 MONTHS 56.6 1,667 -3 MISSING 0.1 3 -2 DONT KNOW 0.4 11 -1 REFUSED ----- ----- ----- 100.0 100.0 2,947 cases Data type: numeric Missing-data codes: lowest thru -1 Columns: 830-831
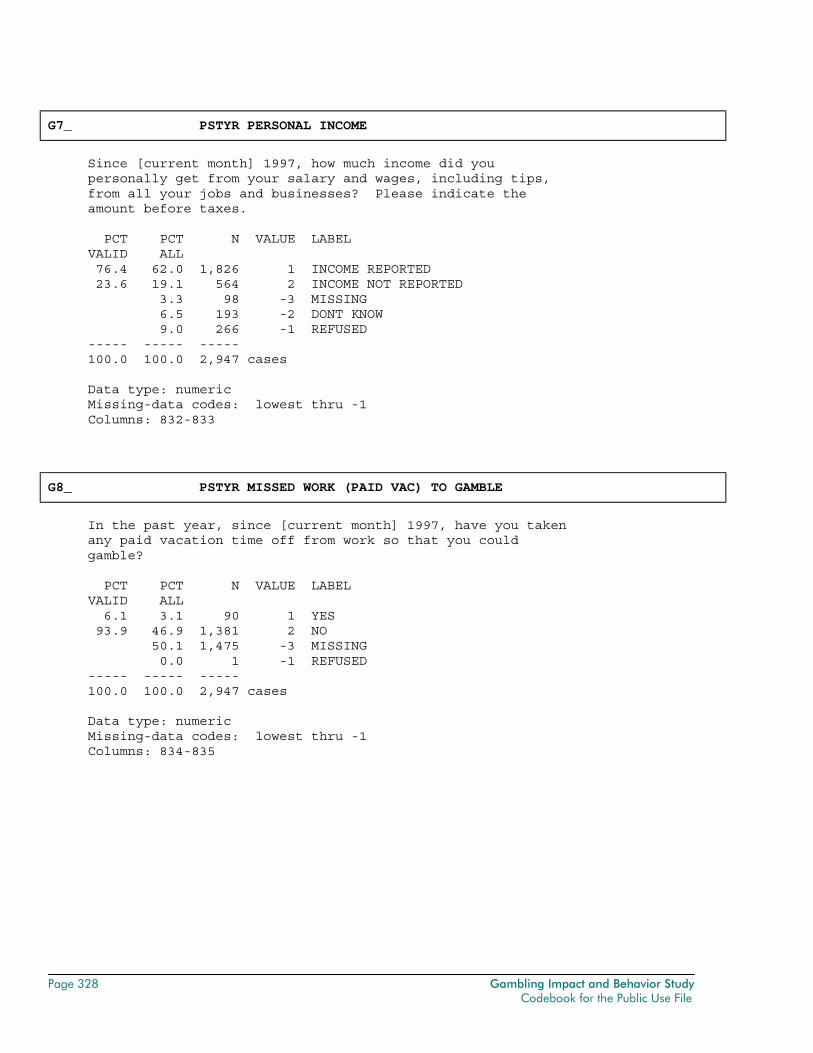
Page 328 Gambling Impact and Behavior Study Codebook for the Public Use File
G7_ PSTYR PERSONAL INCOME
Since [current month] 1997, how much income did you personally get from your salary and wages, including tips, from all your jobs and businesses? Please indicate the amount before taxes. PCT PCT N VALUE LABEL VALID ALL 76.4 62.0 1,826 1 INCOME REPORTED 23.6 19.1 564 2 INCOME NOT REPORTED 3.3 98 -3 MISSING 6.5 193 -2 DONT KNOW 9.0 266 -1 REFUSED ----- ----- ----- 100.0 100.0 2,947 cases Data type: numeric Missing-data codes: lowest thru -1 Columns: 832-833
G8_ PSTYR MISSED WORK (PAID VAC) TO GAMBLE
In the past year, since [current month] 1997, have you taken any paid vacation time off from work so that you could gamble? PCT PCT N VALUE LABEL VALID ALL 6.1 3.1 90 1 YES 93.9 46.9 1,381 2 NO 50.1 1,475 -3 MISSING 0.0 1 -1 REFUSED ----- ----- ----- 100.0 100.0 2,947 cases Data type: numeric Missing-data codes: lowest thru -1 Columns: 834-835
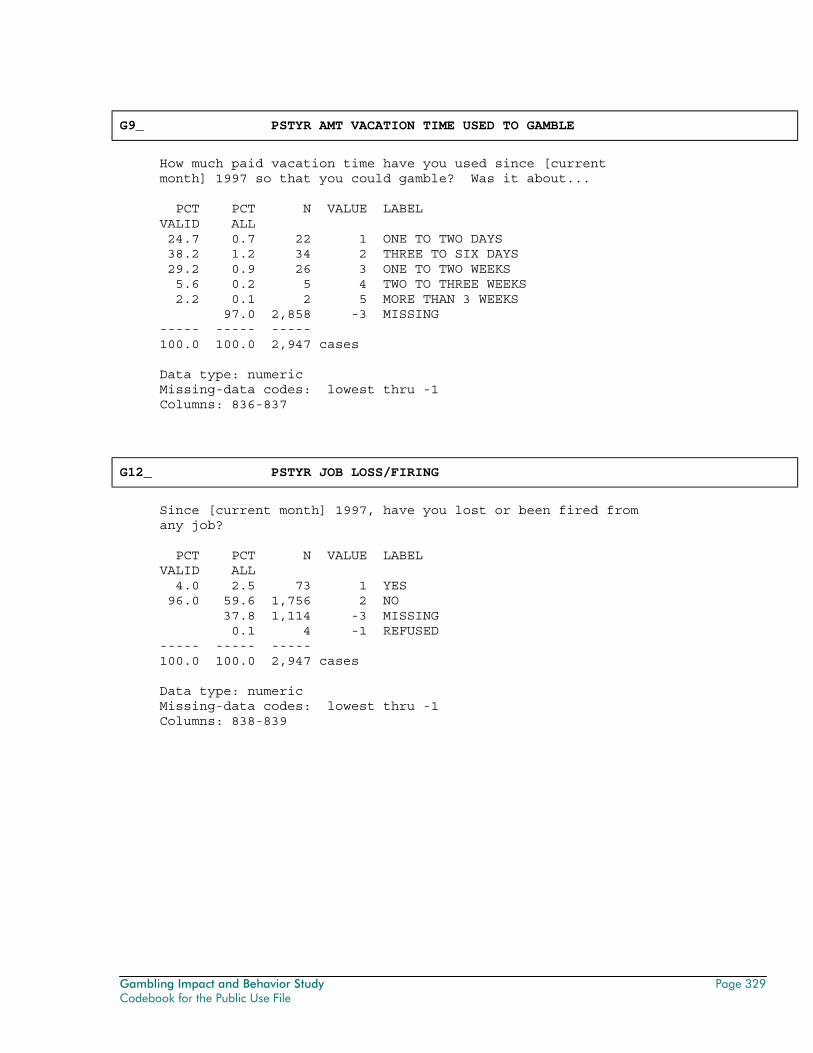
Gambling Impact and Behavior Study Page 329 Codebook for the Public Use File
G9_ PSTYR AMT VACATION TIME USED TO GAMBLE
How much paid vacation time have you used since [current month] 1997 so that you could gamble? Was it about... PCT PCT N VALUE LABEL VALID ALL 24.7 0.7 22 1 ONE TO TWO DAYS 38.2 1.2 34 2 THREE TO SIX DAYS 29.2 0.9 26 3 ONE TO TWO WEEKS 5.6 0.2 5 4 TWO TO THREE WEEKS 2.2 0.1 2 5 MORE THAN 3 WEEKS 97.0 2,858 -3 MISSING ----- ----- ----- 100.0 100.0 2,947 cases Data type: numeric Missing-data codes: lowest thru -1 Columns: 836-837
G12_ PSTYR JOB LOSS/FIRING
Since [current month] 1997, have you lost or been fired from any job? PCT PCT N VALUE LABEL VALID ALL 4.0 2.5 73 1 YES 96.0 59.6 1,756 2 NO 37.8 1,114 -3 MISSING 0.1 4 -1 REFUSED ----- ----- ----- 100.0 100.0 2,947 cases Data type: numeric Missing-data codes: lowest thru -1 Columns: 838-839
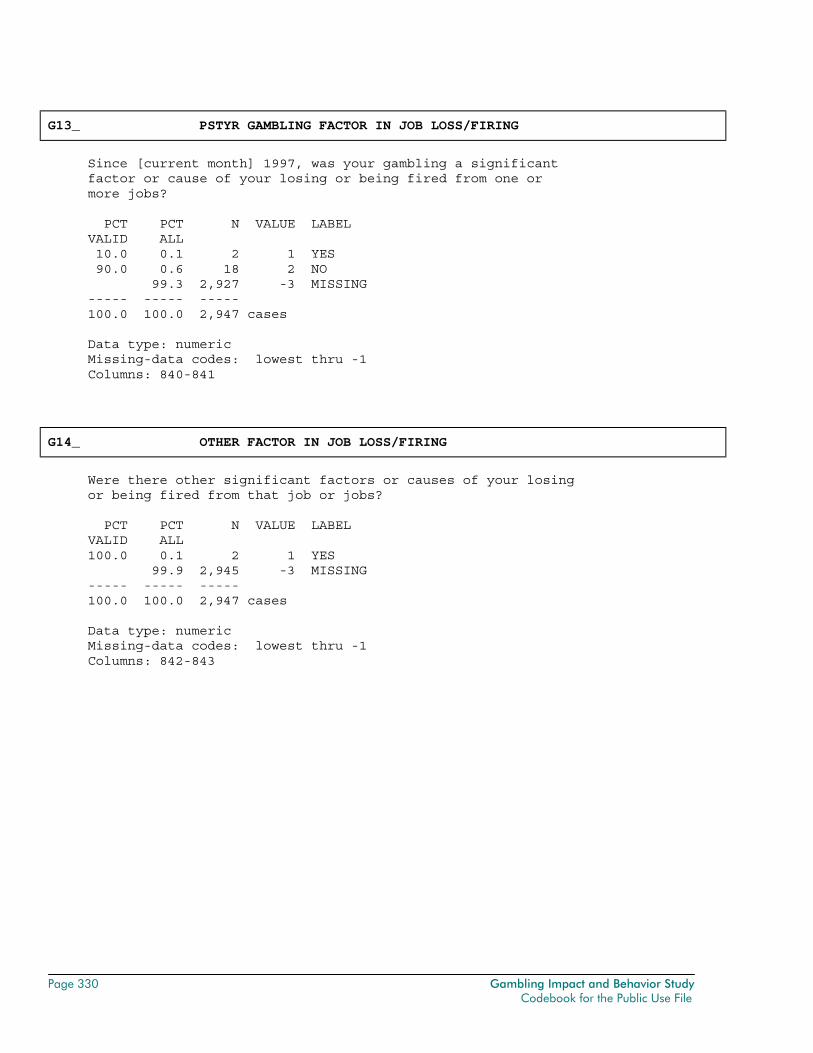
Page 330 Gambling Impact and Behavior Study Codebook for the Public Use File
G13_ PSTYR GAMBLING FACTOR IN JOB LOSS/FIRING
Since [current month] 1997, was your gambling a significant factor or cause of your losing or being fired from one or more jobs? PCT PCT N VALUE LABEL VALID ALL 10.0 0.1 2 1 YES 90.0 0.6 18 2 NO 99.3 2,927 -3 MISSING ----- ----- ----- 100.0 100.0 2,947 cases Data type: numeric Missing-data codes: lowest thru -1 Columns: 840-841
G14_ OTHER FACTOR IN JOB LOSS/FIRING
Were there other significant factors or causes of your losing or being fired from that job or jobs? PCT PCT N VALUE LABEL VALID ALL 100.0 0.1 2 1 YES 99.9 2,945 -3 MISSING ----- ----- ----- 100.0 100.0 2,947 cases Data type: numeric Missing-data codes: lowest thru -1 Columns: 842-843
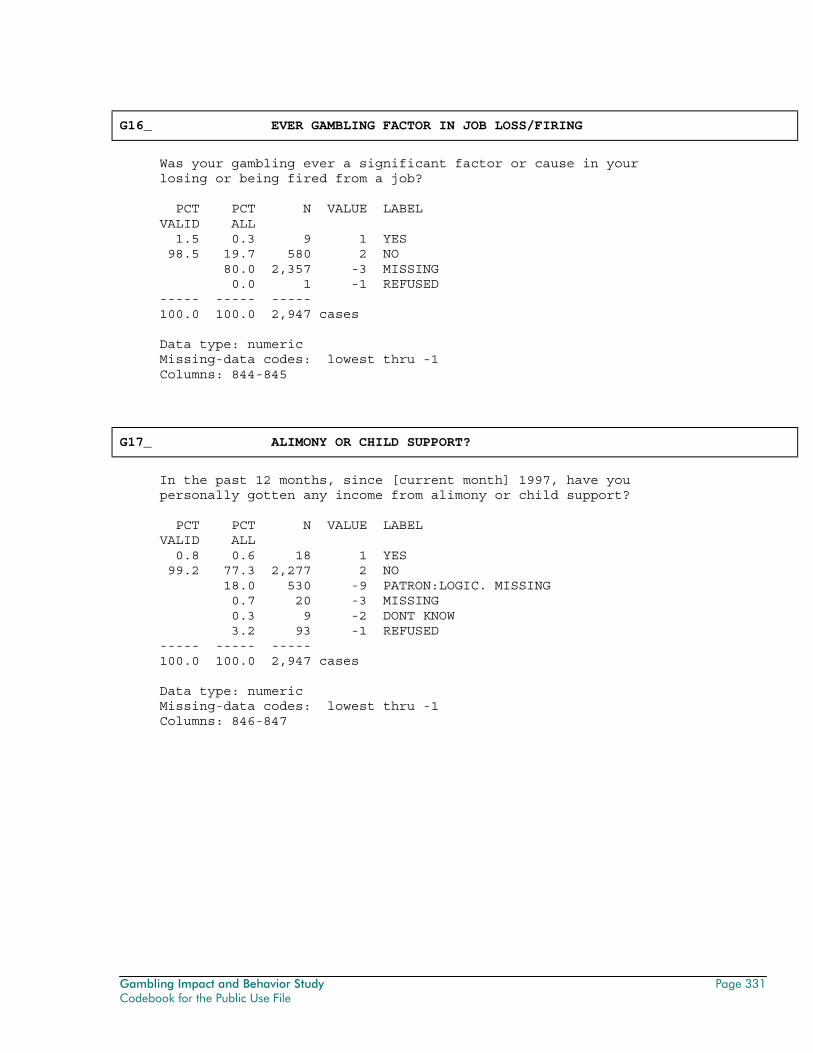
Gambling Impact and Behavior Study Page 331 Codebook for the Public Use File
G16_ EVER GAMBLING FACTOR IN JOB LOSS/FIRING
Was your gambling ever a significant factor or cause in your losing or being fired from a job? PCT PCT N VALUE LABEL VALID ALL 1.5 0.3 9 1 YES 98.5 19.7 580 2 NO 80.0 2,357 -3 MISSING 0.0 1 -1 REFUSED ----- ----- ----- 100.0 100.0 2,947 cases Data type: numeric Missing-data codes: lowest thru -1 Columns: 844-845
G17_ ALIMONY OR CHILD SUPPORT?
In the past 12 months, since [current month] 1997, have you personally gotten any income from alimony or child support? PCT PCT N VALUE LABEL VALID ALL 0.8 0.6 18 1 YES 99.2 77.3 2,277 2 NO 18.0 530 -9 PATRON:LOGIC. MISSING 0.7 20 -3 MISSING 0.3 9 -2 DONT KNOW 3.2 93 -1 REFUSED ----- ----- ----- 100.0 100.0 2,947 cases Data type: numeric Missing-data codes: lowest thru -1 Columns: 846-847
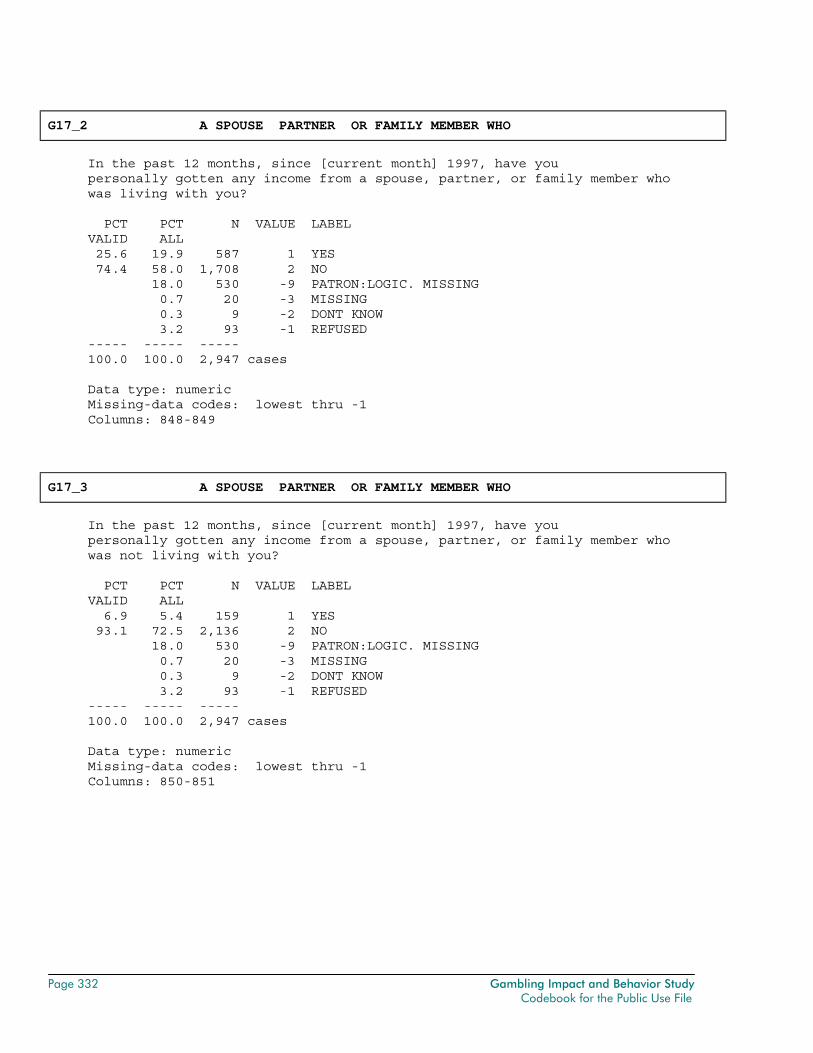
Page 332 Gambling Impact and Behavior Study Codebook for the Public Use File
G17_2 A SPOUSE PARTNER OR FAMILY MEMBER WHO
In the past 12 months, since [current month] 1997, have you personally gotten any income from a spouse, partner, or family member who was living with you? PCT PCT N VALUE LABEL VALID ALL 25.6 19.9 587 1 YES 74.4 58.0 1,708 2 NO 18.0 530 -9 PATRON:LOGIC. MISSING 0.7 20 -3 MISSING 0.3 9 -2 DONT KNOW 3.2 93 -1 REFUSED ----- ----- ----- 100.0 100.0 2,947 cases Data type: numeric Missing-data codes: lowest thru -1 Columns: 848-849
G17_3 A SPOUSE PARTNER OR FAMILY MEMBER WHO
In the past 12 months, since [current month] 1997, have you personally gotten any income from a spouse, partner, or family member who was not living with you? PCT PCT N VALUE LABEL VALID ALL 6.9 5.4 159 1 YES 93.1 72.5 2,136 2 NO 18.0 530 -9 PATRON:LOGIC. MISSING 0.7 20 -3 MISSING 0.3 9 -2 DONT KNOW 3.2 93 -1 REFUSED ----- ----- ----- 100.0 100.0 2,947 cases Data type: numeric Missing-data codes: lowest thru -1 Columns: 850-851
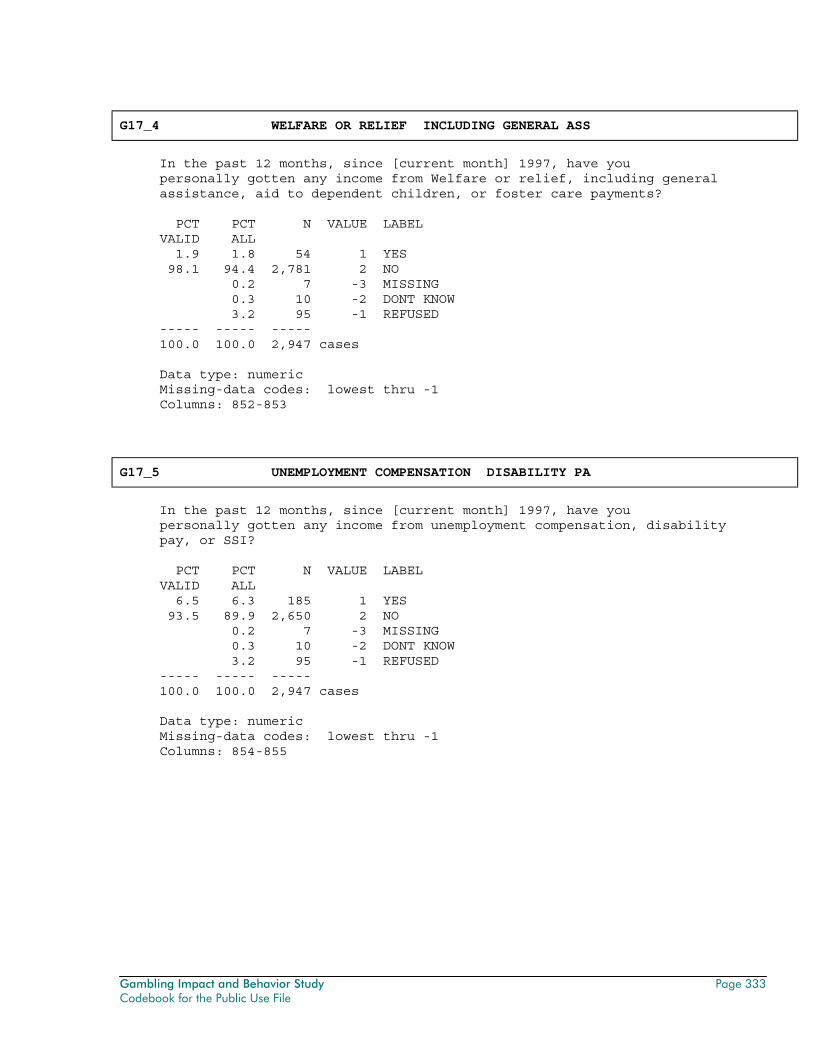
Gambling Impact and Behavior Study Page 333 Codebook for the Public Use File
G17_4 WELFARE OR RELIEF INCLUDING GENERAL ASS
In the past 12 months, since [current month] 1997, have you personally gotten any income from Welfare or relief, including general assistance, aid to dependent children, or foster care payments? PCT PCT N VALUE LABEL VALID ALL 1.9 1.8 54 1 YES 98.1 94.4 2,781 2 NO 0.2 7 -3 MISSING 0.3 10 -2 DONT KNOW 3.2 95 -1 REFUSED ----- ----- ----- 100.0 100.0 2,947 cases Data type: numeric Missing-data codes: lowest thru -1 Columns: 852-853
G17_5 UNEMPLOYMENT COMPENSATION DISABILITY PA
In the past 12 months, since [current month] 1997, have you personally gotten any income from unemployment compensation, disability pay, or SSI? PCT PCT N VALUE LABEL VALID ALL 6.5 6.3 185 1 YES 93.5 89.9 2,650 2 NO 0.2 7 -3 MISSING 0.3 10 -2 DONT KNOW 3.2 95 -1 REFUSED ----- ----- ----- 100.0 100.0 2,947 cases Data type: numeric Missing-data codes: lowest thru -1 Columns: 854-855
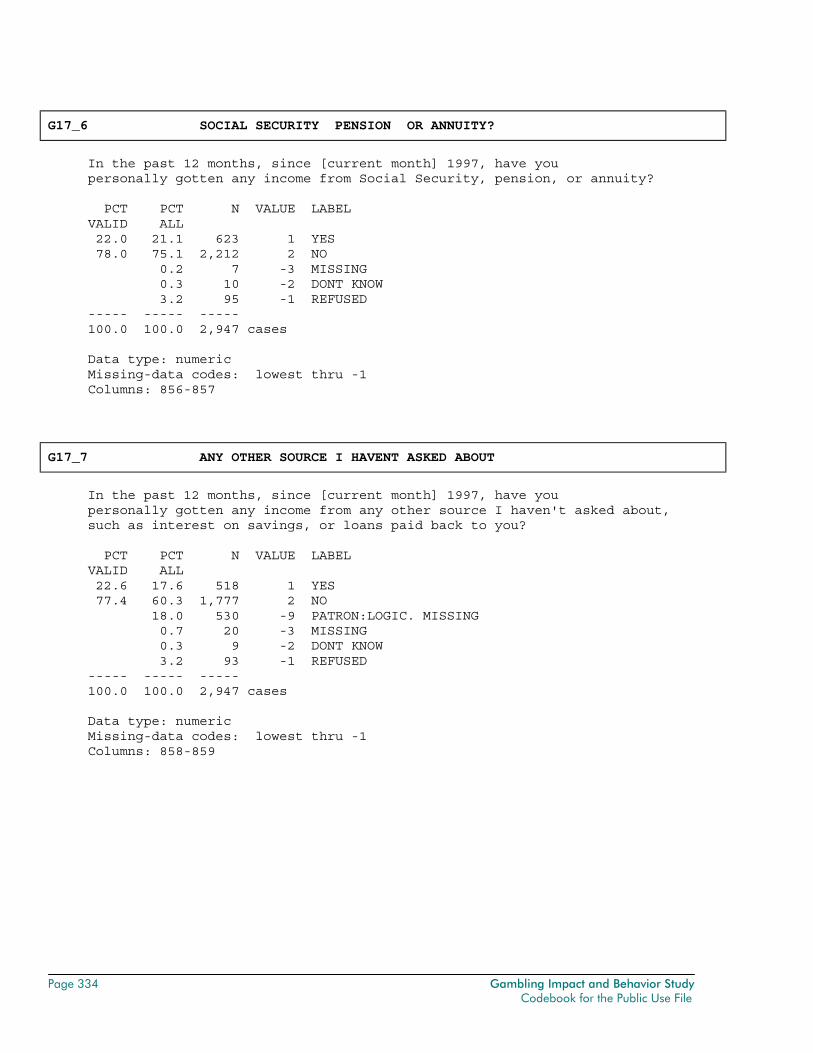
Page 334 Gambling Impact and Behavior Study Codebook for the Public Use File
G17_6 SOCIAL SECURITY PENSION OR ANNUITY?
In the past 12 months, since [current month] 1997, have you personally gotten any income from Social Security, pension, or annuity? PCT PCT N VALUE LABEL VALID ALL 22.0 21.1 623 1 YES 78.0 75.1 2,212 2 NO 0.2 7 -3 MISSING 0.3 10 -2 DONT KNOW 3.2 95 -1 REFUSED ----- ----- ----- 100.0 100.0 2,947 cases Data type: numeric Missing-data codes: lowest thru -1 Columns: 856-857
G17_7 ANY OTHER SOURCE I HAVENT ASKED ABOUT
In the past 12 months, since [current month] 1997, have you personally gotten any income from any other source I haven't asked about, such as interest on savings, or loans paid back to you? PCT PCT N VALUE LABEL VALID ALL 22.6 17.6 518 1 YES 77.4 60.3 1,777 2 NO 18.0 530 -9 PATRON:LOGIC. MISSING 0.7 20 -3 MISSING 0.3 9 -2 DONT KNOW 3.2 93 -1 REFUSED ----- ----- ----- 100.0 100.0 2,947 cases Data type: numeric Missing-data codes: lowest thru -1 Columns: 858-859
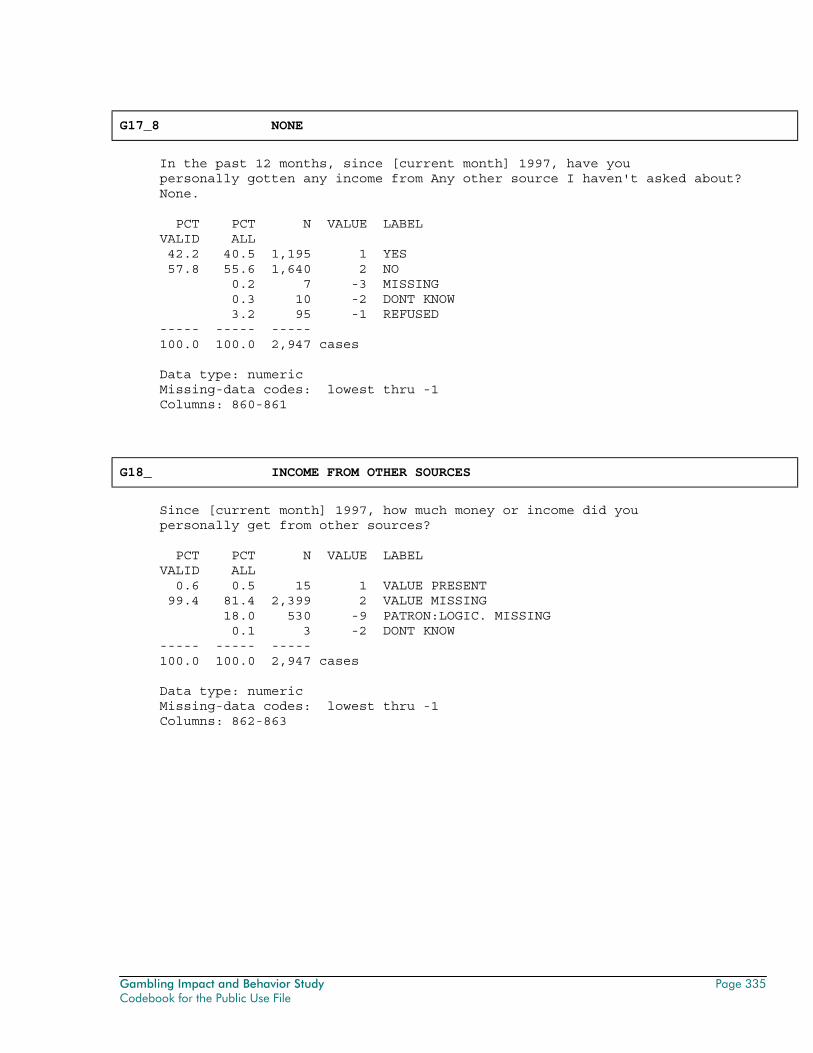
Gambling Impact and Behavior Study Page 335 Codebook for the Public Use File
G17_8 NONE
In the past 12 months, since [current month] 1997, have you personally gotten any income from Any other source I haven't asked about? None. PCT PCT N VALUE LABEL VALID ALL 42.2 40.5 1,195 1 YES 57.8 55.6 1,640 2 NO 0.2 7 -3 MISSING 0.3 10 -2 DONT KNOW 3.2 95 -1 REFUSED ----- ----- ----- 100.0 100.0 2,947 cases Data type: numeric Missing-data codes: lowest thru -1 Columns: 860-861
G18_ INCOME FROM OTHER SOURCES
Since [current month] 1997, how much money or income did you personally get from other sources? PCT PCT N VALUE LABEL VALID ALL 0.6 0.5 15 1 VALUE PRESENT 99.4 81.4 2,399 2 VALUE MISSING 18.0 530 -9 PATRON:LOGIC. MISSING 0.1 3 -2 DONT KNOW ----- ----- ----- 100.0 100.0 2,947 cases Data type: numeric Missing-data codes: lowest thru -1 Columns: 862-863
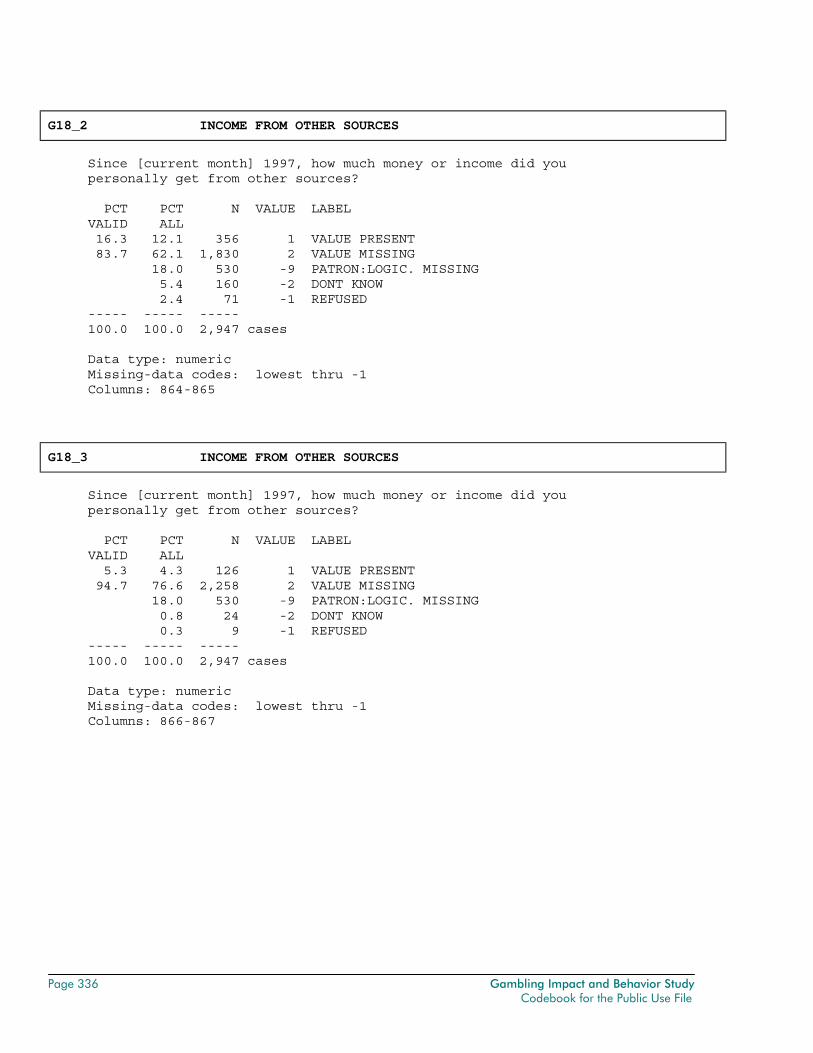
Page 336 Gambling Impact and Behavior Study Codebook for the Public Use File
G18_2 INCOME FROM OTHER SOURCES
Since [current month] 1997, how much money or income did you personally get from other sources? PCT PCT N VALUE LABEL VALID ALL 16.3 12.1 356 1 VALUE PRESENT 83.7 62.1 1,830 2 VALUE MISSING 18.0 530 -9 PATRON:LOGIC. MISSING 5.4 160 -2 DONT KNOW 2.4 71 -1 REFUSED ----- ----- ----- 100.0 100.0 2,947 cases Data type: numeric Missing-data codes: lowest thru -1 Columns: 864-865
G18_3 INCOME FROM OTHER SOURCES
Since [current month] 1997, how much money or income did you personally get from other sources? PCT PCT N VALUE LABEL VALID ALL 5.3 4.3 126 1 VALUE PRESENT 94.7 76.6 2,258 2 VALUE MISSING 18.0 530 -9 PATRON:LOGIC. MISSING 0.8 24 -2 DONT KNOW 0.3 9 -1 REFUSED ----- ----- ----- 100.0 100.0 2,947 cases Data type: numeric Missing-data codes: lowest thru -1 Columns: 866-867
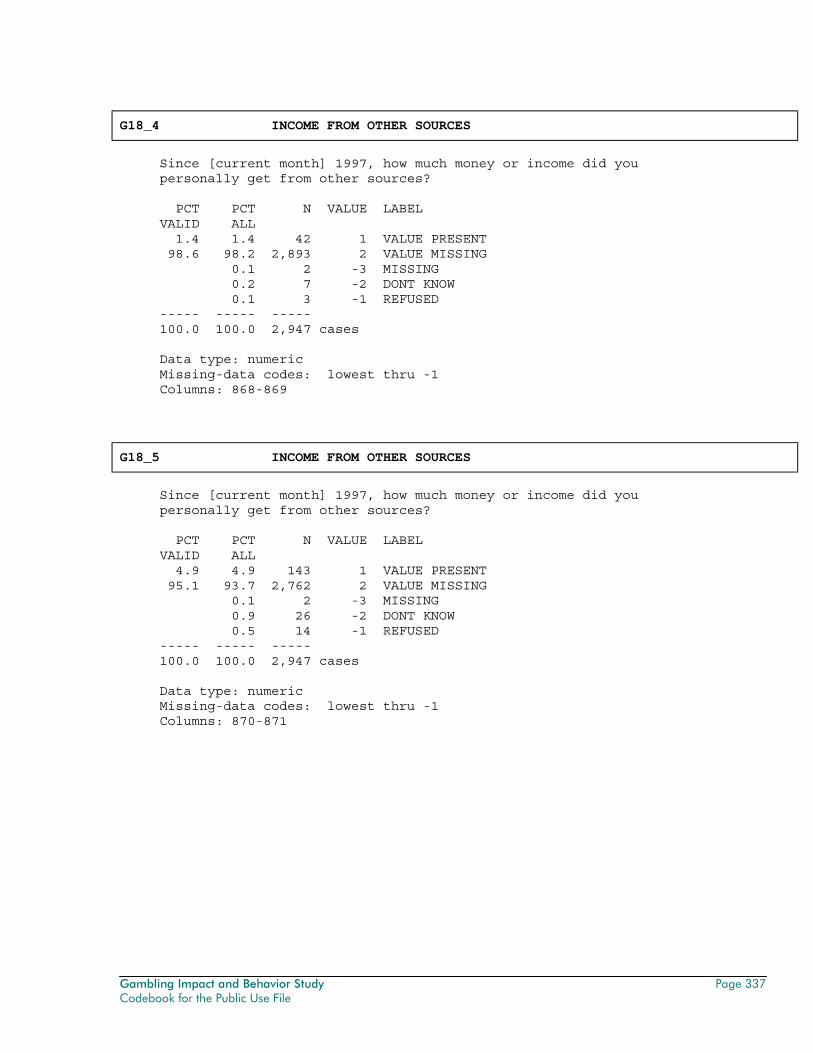
Gambling Impact and Behavior Study Page 337 Codebook for the Public Use File
G18_4 INCOME FROM OTHER SOURCES
Since [current month] 1997, how much money or income did you personally get from other sources? PCT PCT N VALUE LABEL VALID ALL 1.4 1.4 42 1 VALUE PRESENT 98.6 98.2 2,893 2 VALUE MISSING 0.1 2 -3 MISSING 0.2 7 -2 DONT KNOW 0.1 3 -1 REFUSED ----- ----- ----- 100.0 100.0 2,947 cases Data type: numeric Missing-data codes: lowest thru -1 Columns: 868-869
G18_5 INCOME FROM OTHER SOURCES
Since [current month] 1997, how much money or income did you personally get from other sources? PCT PCT N VALUE LABEL VALID ALL 4.9 4.9 143 1 VALUE PRESENT 95.1 93.7 2,762 2 VALUE MISSING 0.1 2 -3 MISSING 0.9 26 -2 DONT KNOW 0.5 14 -1 REFUSED ----- ----- ----- 100.0 100.0 2,947 cases Data type: numeric Missing-data codes: lowest thru -1 Columns: 870-871
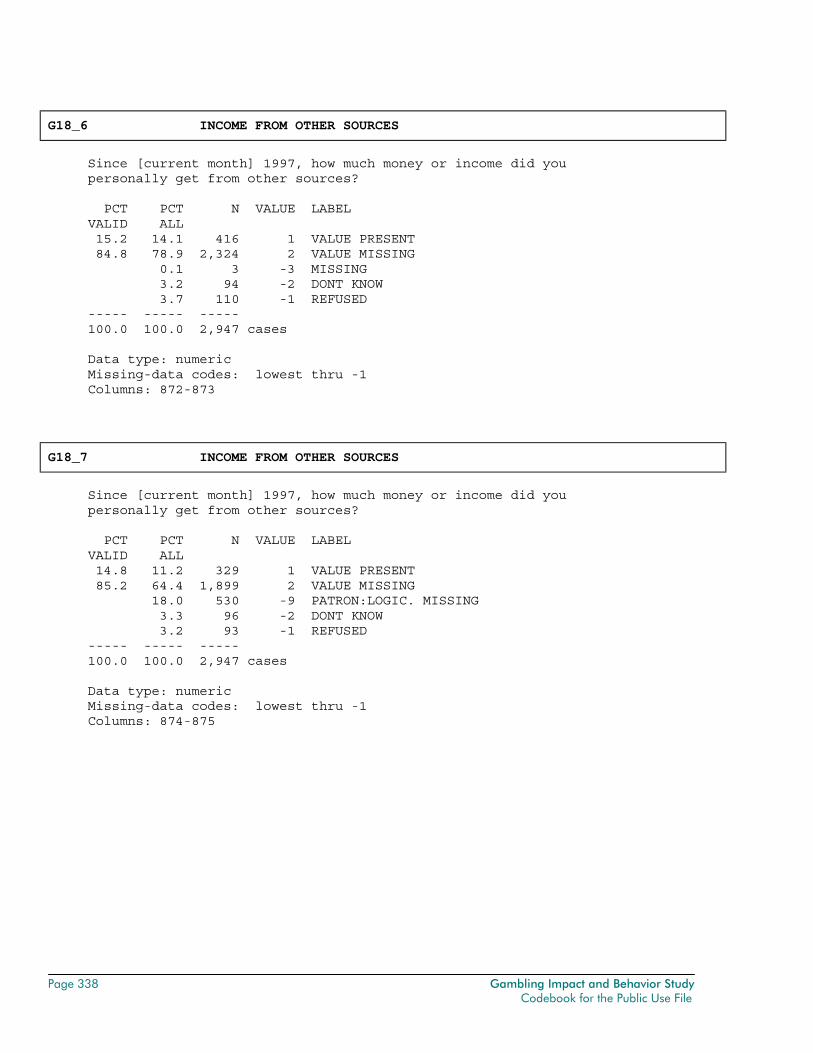
Page 338 Gambling Impact and Behavior Study Codebook for the Public Use File
G18_6 INCOME FROM OTHER SOURCES
Since [current month] 1997, how much money or income did you personally get from other sources? PCT PCT N VALUE LABEL VALID ALL 15.2 14.1 416 1 VALUE PRESENT 84.8 78.9 2,324 2 VALUE MISSING 0.1 3 -3 MISSING 3.2 94 -2 DONT KNOW 3.7 110 -1 REFUSED ----- ----- ----- 100.0 100.0 2,947 cases Data type: numeric Missing-data codes: lowest thru -1 Columns: 872-873
G18_7 INCOME FROM OTHER SOURCES
Since [current month] 1997, how much money or income did you personally get from other sources? PCT PCT N VALUE LABEL VALID ALL 14.8 11.2 329 1 VALUE PRESENT 85.2 64.4 1,899 2 VALUE MISSING 18.0 530 -9 PATRON:LOGIC. MISSING 3.3 96 -2 DONT KNOW 3.2 93 -1 REFUSED ----- ----- ----- 100.0 100.0 2,947 cases Data type: numeric Missing-data codes: lowest thru -1 Columns: 874-875
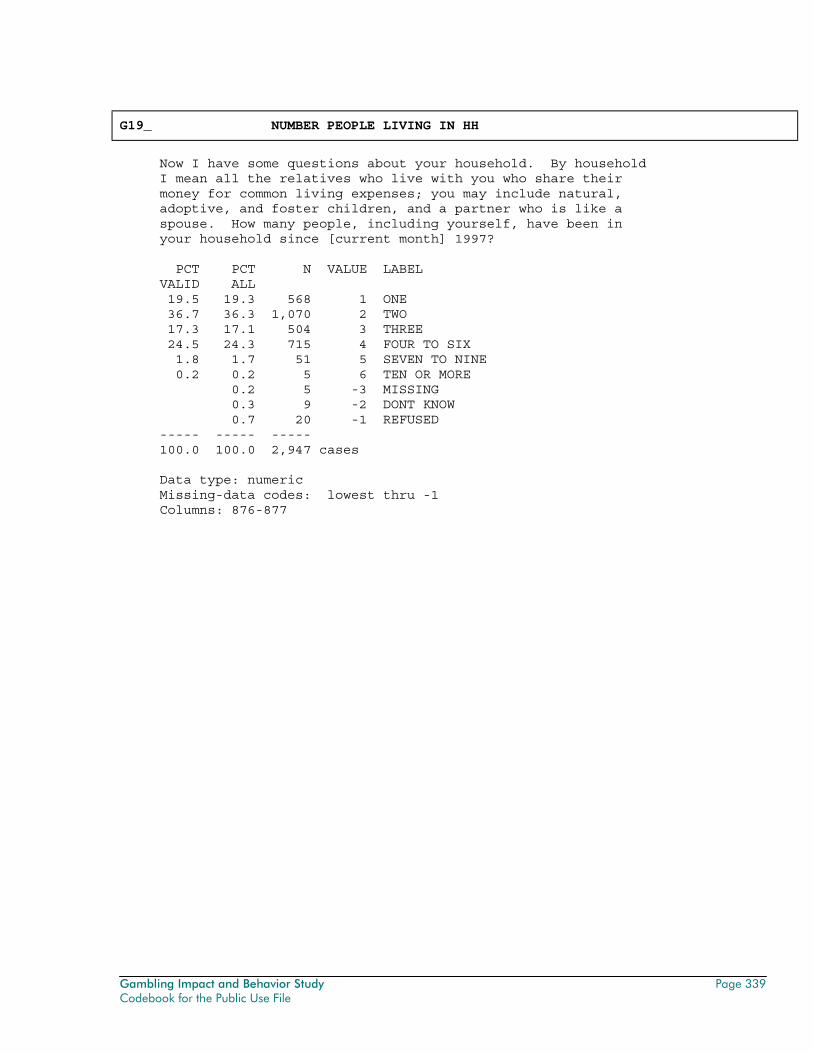
Gambling Impact and Behavior Study Page 339 Codebook for the Public Use File
G19_ NUMBER PEOPLE LIVING IN HH
Now I have some questions about your household. By household I mean all the relatives who live with you who share their money for common living expenses; you may include natural, adoptive, and foster children, and a partner who is like a spouse. How many people, including yourself, have been in your household since [current month] 1997? PCT PCT N VALUE LABEL VALID ALL 19.5 19.3 568 1 ONE 36.7 36.3 1,070 2 TWO 17.3 17.1 504 3 THREE 24.5 24.3 715 4 FOUR TO SIX 1.8 1.7 51 5 SEVEN TO NINE 0.2 0.2 5 6 TEN OR MORE 0.2 5 -3 MISSING 0.3 9 -2 DONT KNOW 0.7 20 -1 REFUSED ----- ----- ----- 100.0 100.0 2,947 cases Data type: numeric Missing-data codes: lowest thru -1 Columns: 876-877
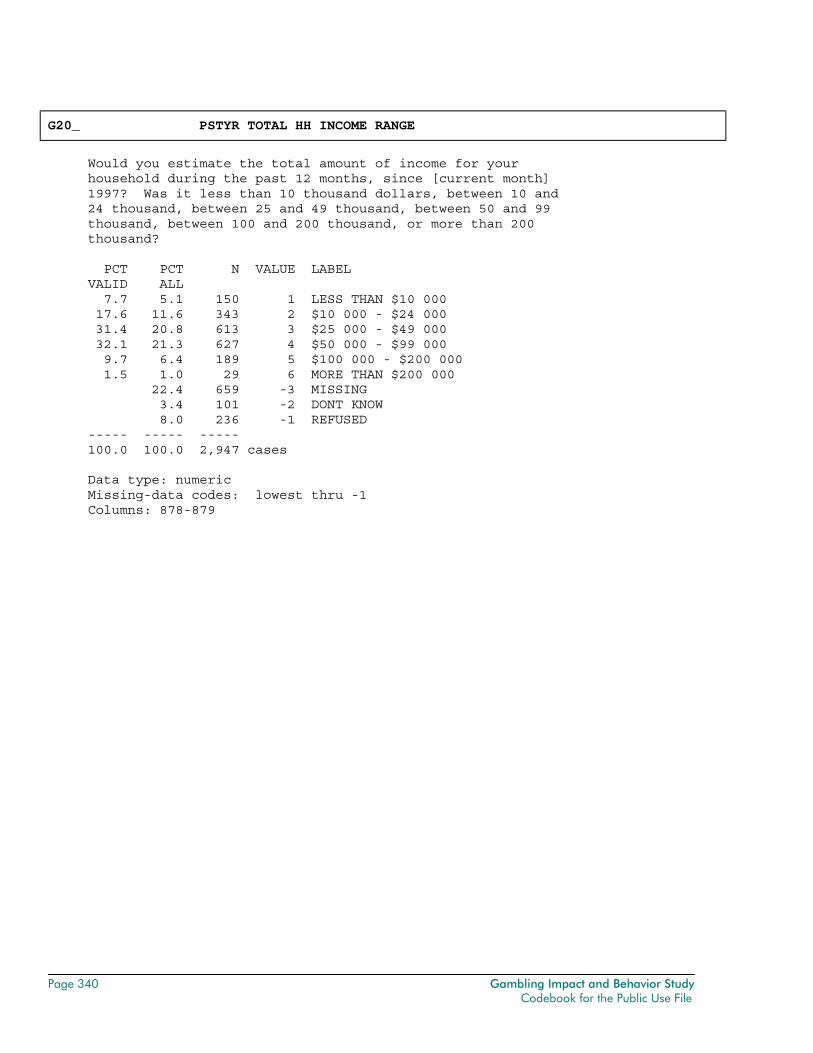
Page 340 Gambling Impact and Behavior Study Codebook for the Public Use File
G20_ PSTYR TOTAL HH INCOME RANGE
Would you estimate the total amount of income for your household during the past 12 months, since [current month] 1997? Was it less than 10 thousand dollars, between 10 and 24 thousand, between 25 and 49 thousand, between 50 and 99 thousand, between 100 and 200 thousand, or more than 200 thousand? PCT PCT N VALUE LABEL VALID ALL 7.7 5.1 150 1 LESS THAN $10 000 17.6 11.6 343 2 $10 000 - $24 000 31.4 20.8 613 3 $25 000 - $49 000 32.1 21.3 627 4 $50 000 - $99 000 9.7 6.4 189 5 $100 000 - $200 000 1.5 1.0 29 6 MORE THAN $200 000 22.4 659 -3 MISSING 3.4 101 -2 DONT KNOW 8.0 236 -1 REFUSED ----- ----- ----- 100.0 100.0 2,947 cases Data type: numeric Missing-data codes: lowest thru -1 Columns: 878-879
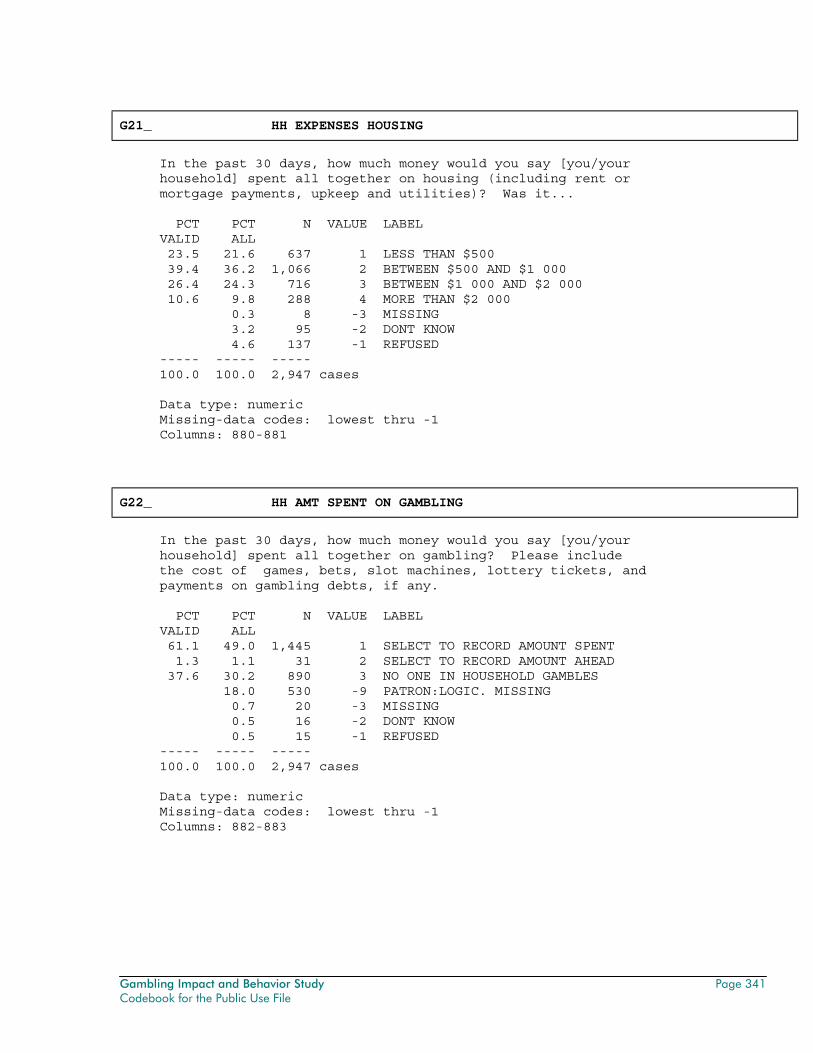
Gambling Impact and Behavior Study Page 341 Codebook for the Public Use File
G21_ HH EXPENSES HOUSING
In the past 30 days, how much money would you say [you/your household] spent all together on housing (including rent or mortgage payments, upkeep and utilities)? Was it... PCT PCT N VALUE LABEL VALID ALL 23.5 21.6 637 1 LESS THAN $500 39.4 36.2 1,066 2 BETWEEN $500 AND $1 000 26.4 24.3 716 3 BETWEEN $1 000 AND $2 000 10.6 9.8 288 4 MORE THAN $2 000 0.3 8 -3 MISSING 3.2 95 -2 DONT KNOW 4.6 137 -1 REFUSED ----- ----- ----- 100.0 100.0 2,947 cases Data type: numeric Missing-data codes: lowest thru -1 Columns: 880-881
G22_ HH AMT SPENT ON GAMBLING
In the past 30 days, how much money would you say [you/your household] spent all together on gambling? Please include the cost of games, bets, slot machines, lottery tickets, and payments on gambling debts, if any. PCT PCT N VALUE LABEL VALID ALL 61.1 49.0 1,445 1 SELECT TO RECORD AMOUNT SPENT 1.3 1.1 31 2 SELECT TO RECORD AMOUNT AHEAD 37.6 30.2 890 3 NO ONE IN HOUSEHOLD GAMBLES 18.0 530 -9 PATRON:LOGIC. MISSING 0.7 20 -3 MISSING 0.5 16 -2 DONT KNOW 0.5 15 -1 REFUSED ----- ----- ----- 100.0 100.0 2,947 cases Data type: numeric Missing-data codes: lowest thru -1 Columns: 882-883
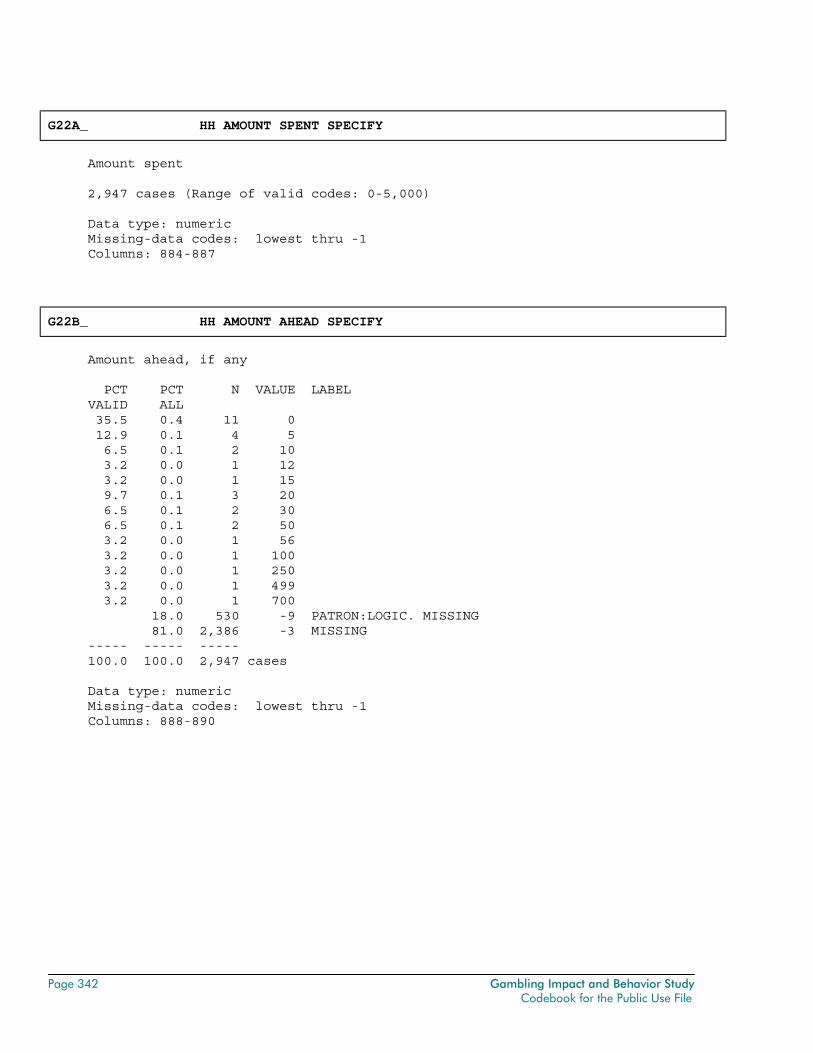
Page 342 Gambling Impact and Behavior Study Codebook for the Public Use File
G22A_ HH AMOUNT SPENT SPECIFY
Amount spent 2,947 cases (Range of valid codes: 0-5,000) Data type: numeric Missing-data codes: lowest thru -1 Columns: 884-887
G22B_ HH AMOUNT AHEAD SPECIFY
Amount ahead, if any PCT PCT N VALUE LABEL VALID ALL 35.5 0.4 11 0 12.9 0.1 4 5 6.5 0.1 2 10 3.2 0.0 1 12 3.2 0.0 1 15 9.7 0.1 3 20 6.5 0.1 2 30 6.5 0.1 2 50 3.2 0.0 1 56 3.2 0.0 1 100 3.2 0.0 1 250 3.2 0.0 1 499 3.2 0.0 1 700 18.0 530 -9 PATRON:LOGIC. MISSING 81.0 2,386 -3 MISSING ----- ----- ----- 100.0 100.0 2,947 cases Data type: numeric Missing-data codes: lowest thru -1 Columns: 888-890
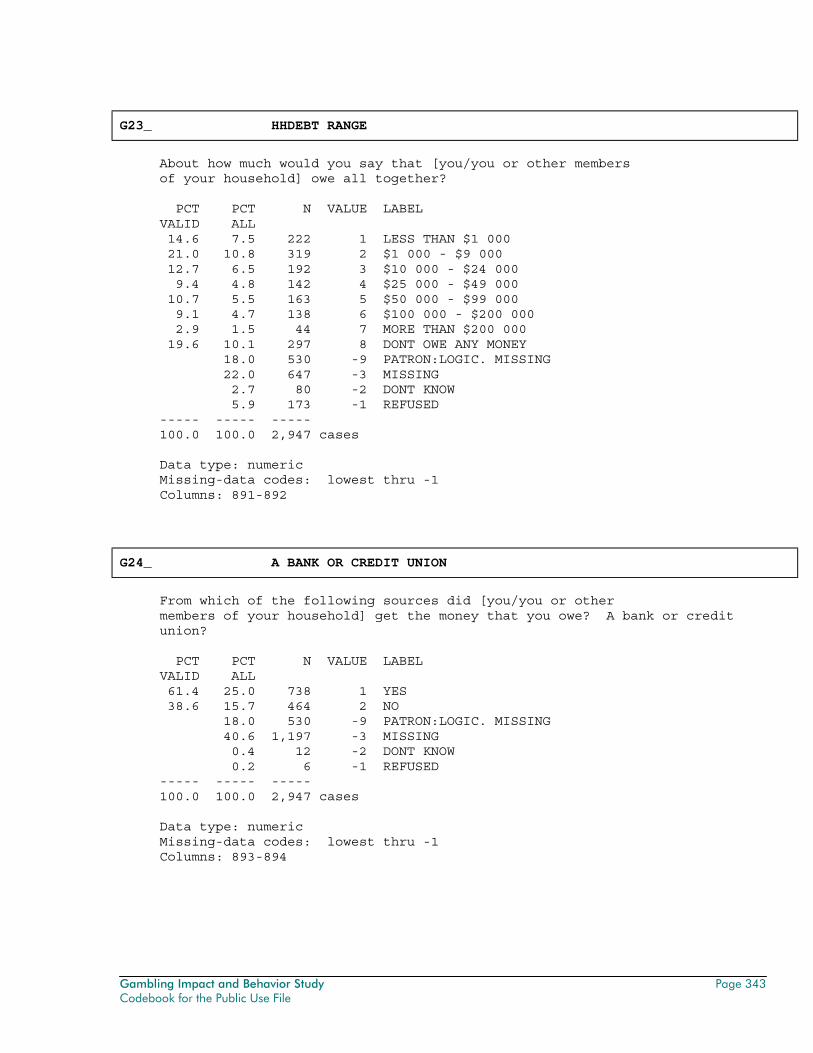
Gambling Impact and Behavior Study Page 343 Codebook for the Public Use File
G23_ HHDEBT RANGE
About how much would you say that [you/you or other members of your household] owe all together? PCT PCT N VALUE LABEL VALID ALL 14.6 7.5 222 1 LESS THAN $1 000 21.0 10.8 319 2 $1 000 - $9 000 12.7 6.5 192 3 $10 000 - $24 000 9.4 4.8 142 4 $25 000 - $49 000 10.7 5.5 163 5 $50 000 - $99 000 9.1 4.7 138 6 $100 000 - $200 000 2.9 1.5 44 7 MORE THAN $200 000 19.6 10.1 297 8 DONT OWE ANY MONEY 18.0 530 -9 PATRON:LOGIC. MISSING 22.0 647 -3 MISSING 2.7 80 -2 DONT KNOW 5.9 173 -1 REFUSED ----- ----- ----- 100.0 100.0 2,947 cases Data type: numeric Missing-data codes: lowest thru -1 Columns: 891-892
G24_ A BANK OR CREDIT UNION
From which of the following sources did [you/you or other members of your household] get the money that you owe? A bank or credit union? PCT PCT N VALUE LABEL VALID ALL 61.4 25.0 738 1 YES 38.6 15.7 464 2 NO 18.0 530 -9 PATRON:LOGIC. MISSING 40.6 1,197 -3 MISSING 0.4 12 -2 DONT KNOW 0.2 6 -1 REFUSED ----- ----- ----- 100.0 100.0 2,947 cases Data type: numeric Missing-data codes: lowest thru -1 Columns: 893-894
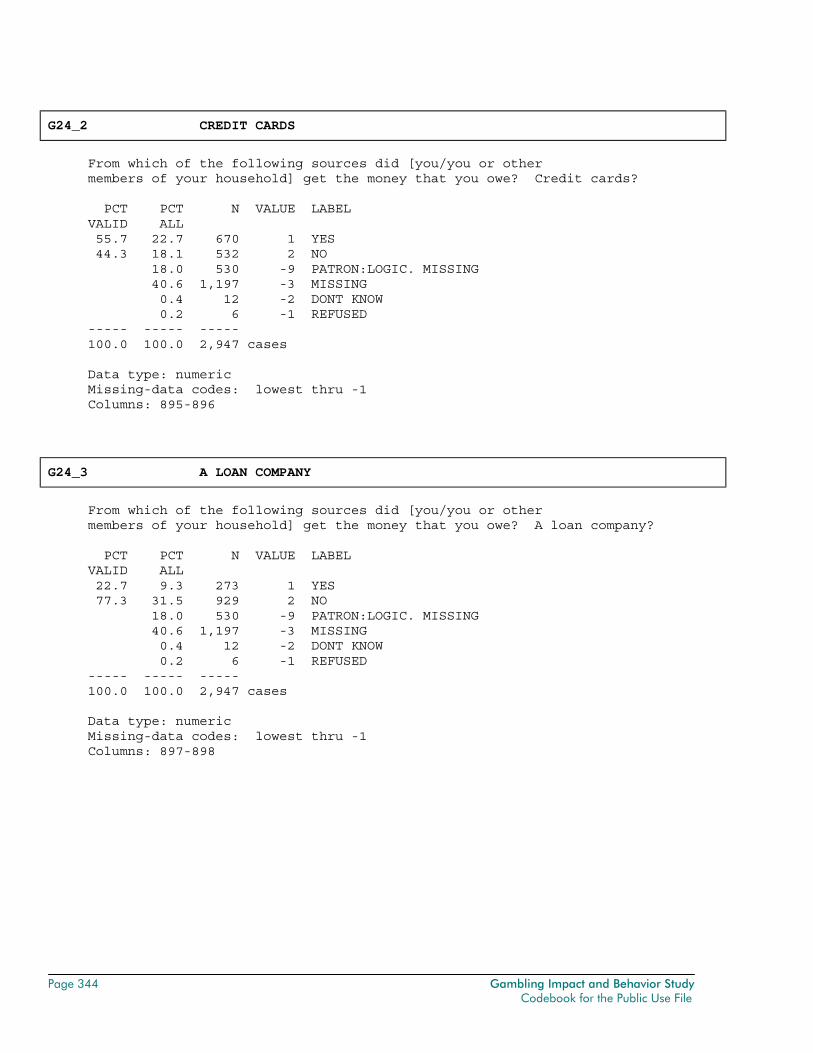
Page 344 Gambling Impact and Behavior Study Codebook for the Public Use File
G24_2 CREDIT CARDS
From which of the following sources did [you/you or other members of your household] get the money that you owe? Credit cards? PCT PCT N VALUE LABEL VALID ALL 55.7 22.7 670 1 YES 44.3 18.1 532 2 NO 18.0 530 -9 PATRON:LOGIC. MISSING 40.6 1,197 -3 MISSING 0.4 12 -2 DONT KNOW 0.2 6 -1 REFUSED ----- ----- ----- 100.0 100.0 2,947 cases Data type: numeric Missing-data codes: lowest thru -1 Columns: 895-896
G24_3 A LOAN COMPANY
From which of the following sources did [you/you or other members of your household] get the money that you owe? A loan company? PCT PCT N VALUE LABEL VALID ALL 22.7 9.3 273 1 YES 77.3 31.5 929 2 NO 18.0 530 -9 PATRON:LOGIC. MISSING 40.6 1,197 -3 MISSING 0.4 12 -2 DONT KNOW 0.2 6 -1 REFUSED ----- ----- ----- 100.0 100.0 2,947 cases Data type: numeric Missing-data codes: lowest thru -1 Columns: 897-898
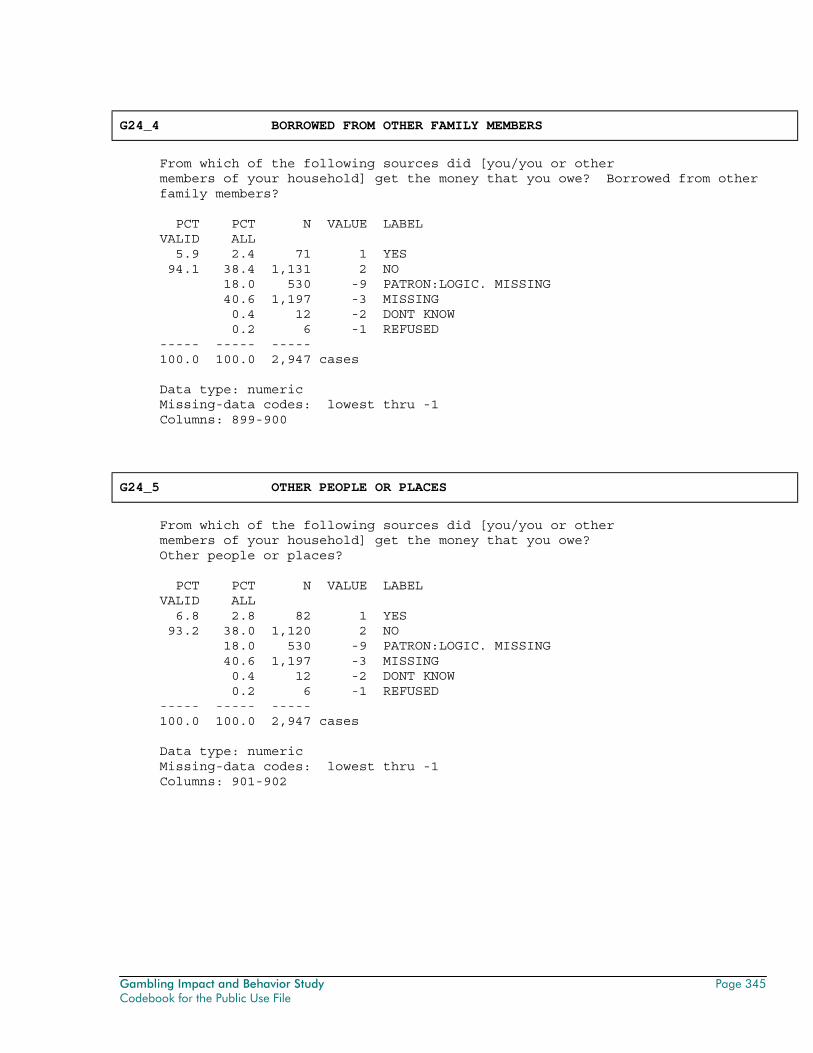
Gambling Impact and Behavior Study Page 345 Codebook for the Public Use File
G24_4 BORROWED FROM OTHER FAMILY MEMBERS
From which of the following sources did [you/you or other members of your household] get the money that you owe? Borrowed from other family members? PCT PCT N VALUE LABEL VALID ALL 5.9 2.4 71 1 YES 94.1 38.4 1,131 2 NO 18.0 530 -9 PATRON:LOGIC. MISSING 40.6 1,197 -3 MISSING 0.4 12 -2 DONT KNOW 0.2 6 -1 REFUSED ----- ----- ----- 100.0 100.0 2,947 cases Data type: numeric Missing-data codes: lowest thru -1 Columns: 899-900
G24_5 OTHER PEOPLE OR PLACES
From which of the following sources did [you/you or other members of your household] get the money that you owe? Other people or places? PCT PCT N VALUE LABEL VALID ALL 6.8 2.8 82 1 YES 93.2 38.0 1,120 2 NO 18.0 530 -9 PATRON:LOGIC. MISSING 40.6 1,197 -3 MISSING 0.4 12 -2 DONT KNOW 0.2 6 -1 REFUSED ----- ----- ----- 100.0 100.0 2,947 cases Data type: numeric Missing-data codes: lowest thru -1 Columns: 901-902
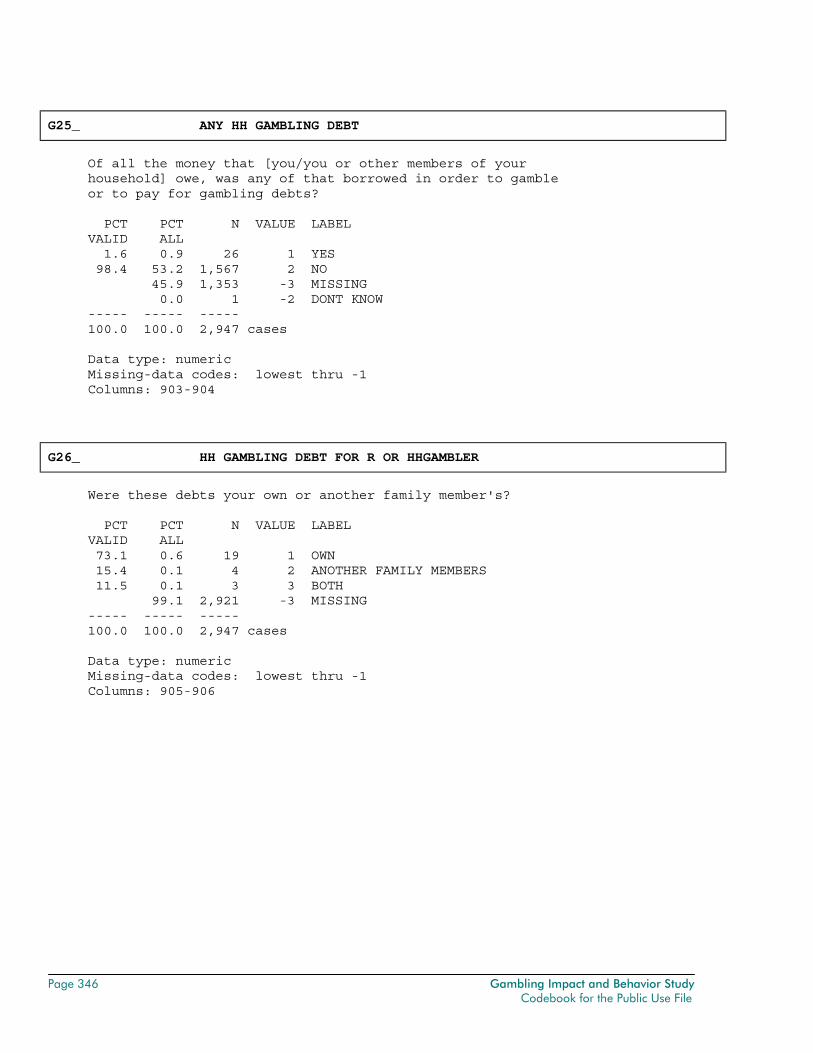
Page 346 Gambling Impact and Behavior Study Codebook for the Public Use File
G25_ ANY HH GAMBLING DEBT
Of all the money that [you/you or other members of your household] owe, was any of that borrowed in order to gamble or to pay for gambling debts? PCT PCT N VALUE LABEL VALID ALL 1.6 0.9 26 1 YES 98.4 53.2 1,567 2 NO 45.9 1,353 -3 MISSING 0.0 1 -2 DONT KNOW ----- ----- ----- 100.0 100.0 2,947 cases Data type: numeric Missing-data codes: lowest thru -1 Columns: 903-904
G26_ HH GAMBLING DEBT FOR R OR HHGAMBLER
Were these debts your own or another family member's? PCT PCT N VALUE LABEL VALID ALL 73.1 0.6 19 1 OWN 15.4 0.1 4 2 ANOTHER FAMILY MEMBERS 11.5 0.1 3 3 BOTH 99.1 2,921 -3 MISSING ----- ----- ----- 100.0 100.0 2,947 cases Data type: numeric Missing-data codes: lowest thru -1 Columns: 905-906
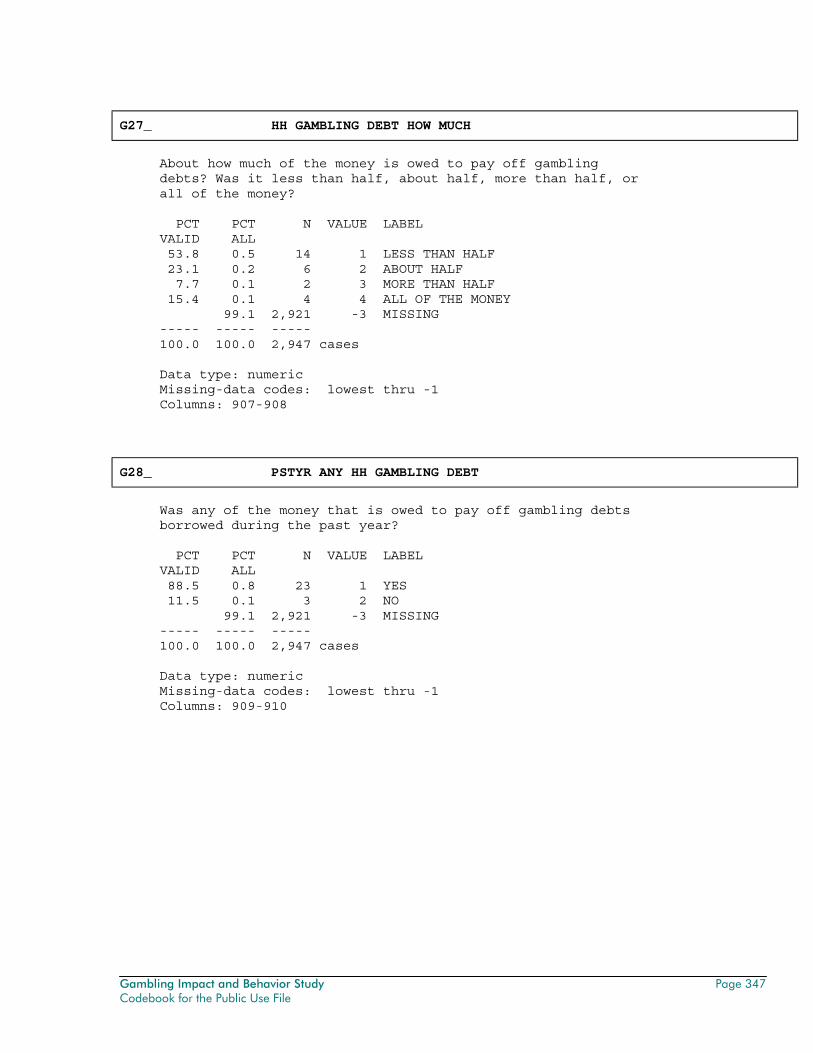
Gambling Impact and Behavior Study Page 347 Codebook for the Public Use File
G27_ HH GAMBLING DEBT HOW MUCH
About how much of the money is owed to pay off gambling debts? Was it less than half, about half, more than half, or all of the money? PCT PCT N VALUE LABEL VALID ALL 53.8 0.5 14 1 LESS THAN HALF 23.1 0.2 6 2 ABOUT HALF 7.7 0.1 2 3 MORE THAN HALF 15.4 0.1 4 4 ALL OF THE MONEY 99.1 2,921 -3 MISSING ----- ----- ----- 100.0 100.0 2,947 cases Data type: numeric Missing-data codes: lowest thru -1 Columns: 907-908
G28_ PSTYR ANY HH GAMBLING DEBT
Was any of the money that is owed to pay off gambling debts borrowed during the past year? PCT PCT N VALUE LABEL VALID ALL 88.5 0.8 23 1 YES 11.5 0.1 3 2 NO 99.1 2,921 -3 MISSING ----- ----- ----- 100.0 100.0 2,947 cases Data type: numeric Missing-data codes: lowest thru -1 Columns: 909-910
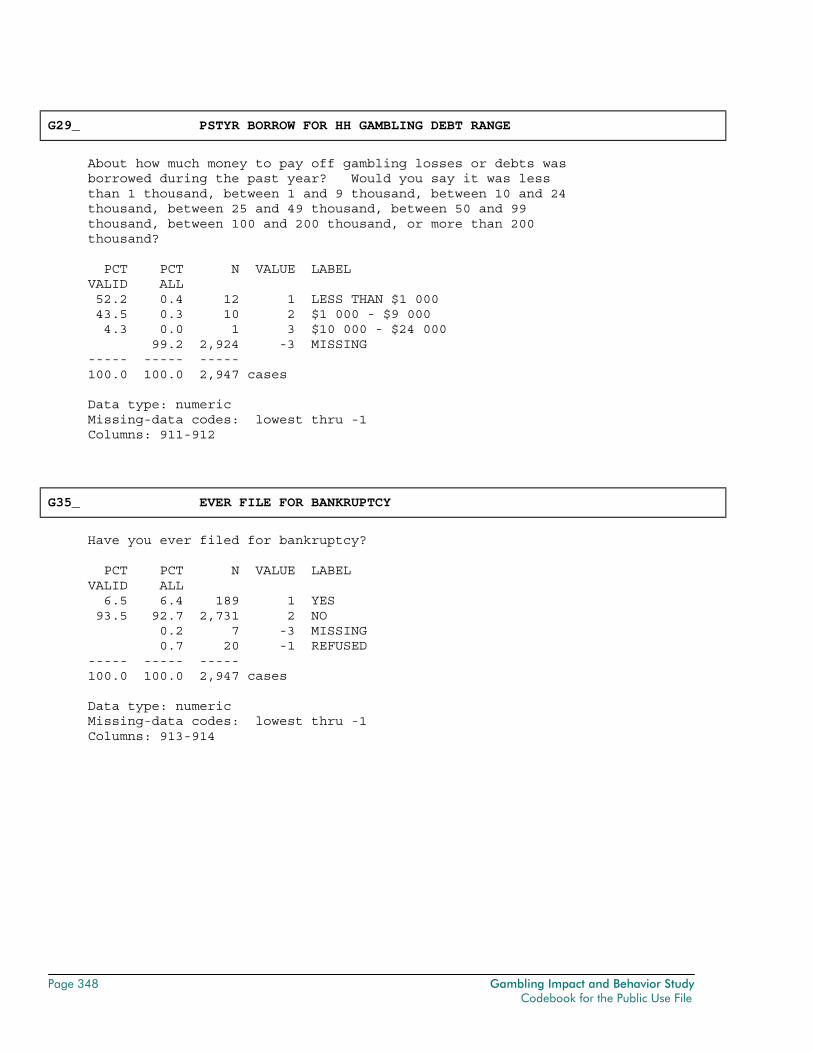
Page 348 Gambling Impact and Behavior Study Codebook for the Public Use File
G29_ PSTYR BORROW FOR HH GAMBLING DEBT RANGE
About how much money to pay off gambling losses or debts was borrowed during the past year? Would you say it was less than 1 thousand, between 1 and 9 thousand, between 10 and 24 thousand, between 25 and 49 thousand, between 50 and 99 thousand, between 100 and 200 thousand, or more than 200 thousand? PCT PCT N VALUE LABEL VALID ALL 52.2 0.4 12 1 LESS THAN $1 000 43.5 0.3 10 2 $1 000 - $9 000 4.3 0.0 1 3 $10 000 - $24 000 99.2 2,924 -3 MISSING ----- ----- ----- 100.0 100.0 2,947 cases Data type: numeric Missing-data codes: lowest thru -1 Columns: 911-912
G35_ EVER FILE FOR BANKRUPTCY
Have you ever filed for bankruptcy? PCT PCT N VALUE LABEL VALID ALL 6.5 6.4 189 1 YES 93.5 92.7 2,731 2 NO 0.2 7 -3 MISSING 0.7 20 -1 REFUSED ----- ----- ----- 100.0 100.0 2,947 cases Data type: numeric Missing-data codes: lowest thru -1 Columns: 913-914
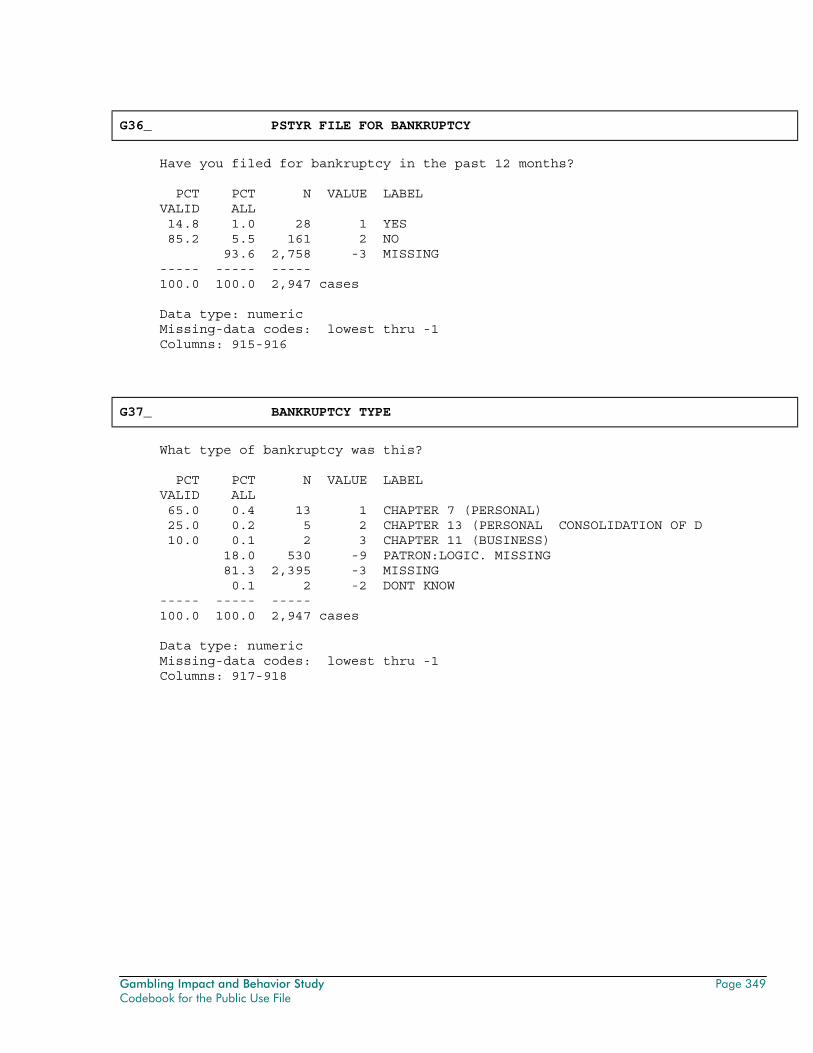
Gambling Impact and Behavior Study Page 349 Codebook for the Public Use File
G36_ PSTYR FILE FOR BANKRUPTCY
Have you filed for bankruptcy in the past 12 months? PCT PCT N VALUE LABEL VALID ALL 14.8 1.0 28 1 YES 85.2 5.5 161 2 NO 93.6 2,758 -3 MISSING ----- ----- ----- 100.0 100.0 2,947 cases Data type: numeric Missing-data codes: lowest thru -1 Columns: 915-916
G37_ BANKRUPTCY TYPE
What type of bankruptcy was this? PCT PCT N VALUE LABEL VALID ALL 65.0 0.4 13 1 CHAPTER 7 (PERSONAL) 25.0 0.2 5 2 CHAPTER 13 (PERSONAL CONSOLIDATION OF D 10.0 0.1 2 3 CHAPTER 11 (BUSINESS) 18.0 530 -9 PATRON:LOGIC. MISSING 81.3 2,395 -3 MISSING 0.1 2 -2 DONT KNOW ----- ----- ----- 100.0 100.0 2,947 cases Data type: numeric Missing-data codes: lowest thru -1 Columns: 917-918
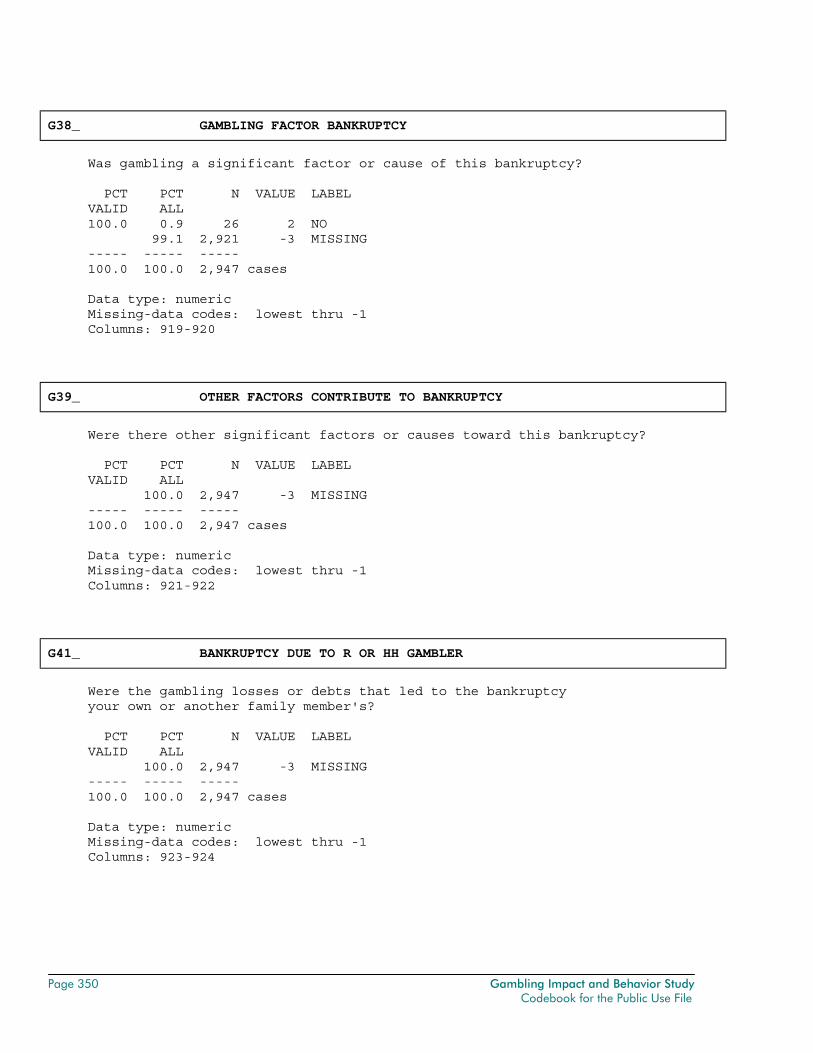
Page 350 Gambling Impact and Behavior Study Codebook for the Public Use File
G38_ GAMBLING FACTOR BANKRUPTCY
Was gambling a significant factor or cause of this bankruptcy? PCT PCT N VALUE LABEL VALID ALL 100.0 0.9 26 2 NO 99.1 2,921 -3 MISSING ----- ----- ----- 100.0 100.0 2,947 cases Data type: numeric Missing-data codes: lowest thru -1 Columns: 919-920
G39_ OTHER FACTORS CONTRIBUTE TO BANKRUPTCY
Were there other significant factors or causes toward this bankruptcy? PCT PCT N VALUE LABEL VALID ALL 100.0 2,947 -3 MISSING ----- ----- ----- 100.0 100.0 2,947 cases Data type: numeric Missing-data codes: lowest thru -1 Columns: 921-922
G41_ BANKRUPTCY DUE TO R OR HH GAMBLER
Were the gambling losses or debts that led to the bankruptcy your own or another family member's? PCT PCT N VALUE LABEL VALID ALL 100.0 2,947 -3 MISSING ----- ----- ----- 100.0 100.0 2,947 cases Data type: numeric Missing-data codes: lowest thru -1 Columns: 923-924
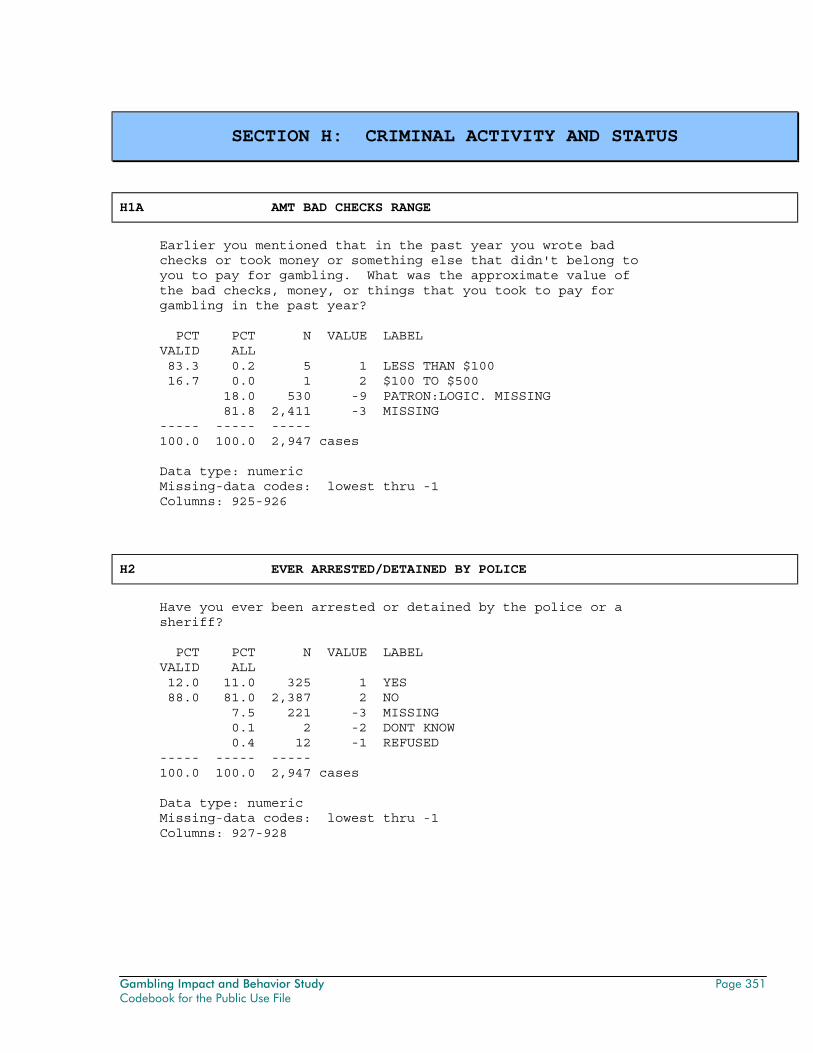
Gambling Impact and Behavior Study Page 351 Codebook for the Public Use File
SECTION H: CRIMINAL ACTIVITY AND STATUS
H1A AMT BAD CHECKS RANGE
Earlier you mentioned that in the past year you wrote bad checks or took money or something else that didn't belong to you to pay for gambling. What was the approximate value of the bad checks, money, or things that you took to pay for gambling in the past year? PCT PCT N VALUE LABEL VALID ALL 83.3 0.2 5 1 LESS THAN $100 16.7 0.0 1 2 $100 TO $500 18.0 530 -9 PATRON:LOGIC. MISSING 81.8 2,411 -3 MISSING ----- ----- ----- 100.0 100.0 2,947 cases Data type: numeric Missing-data codes: lowest thru -1 Columns: 925-926
H2 EVER ARRESTED/DETAINED BY POLICE
Have you ever been arrested or detained by the police or a sheriff? PCT PCT N VALUE LABEL VALID ALL 12.0 11.0 325 1 YES 88.0 81.0 2,387 2 NO 7.5 221 -3 MISSING 0.1 2 -2 DONT KNOW 0.4 12 -1 REFUSED ----- ----- ----- 100.0 100.0 2,947 cases Data type: numeric Missing-data codes: lowest thru -1 Columns: 927-928
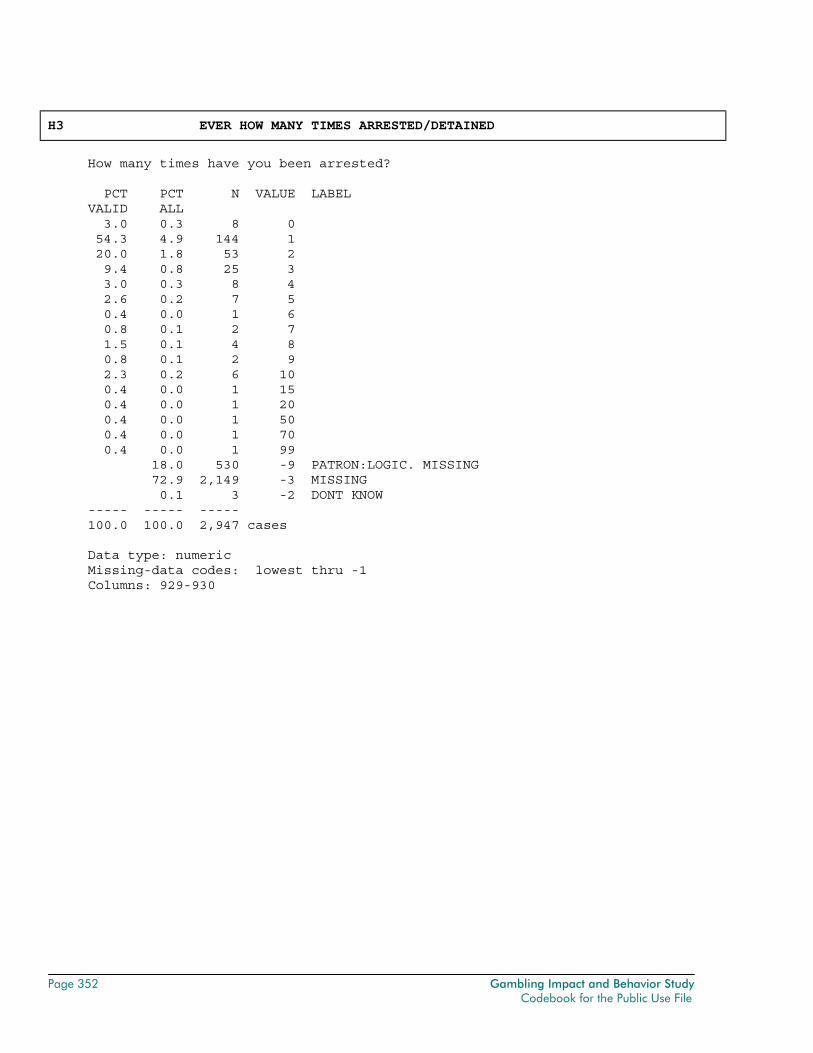
Page 352 Gambling Impact and Behavior Study Codebook for the Public Use File
H3 EVER HOW MANY TIMES ARRESTED/DETAINED
How many times have you been arrested? PCT PCT N VALUE LABEL VALID ALL 3.0 0.3 8 0 54.3 4.9 144 1 20.0 1.8 53 2 9.4 0.8 25 3 3.0 0.3 8 4 2.6 0.2 7 5 0.4 0.0 1 6 0.8 0.1 2 7 1.5 0.1 4 8 0.8 0.1 2 9 2.3 0.2 6 10 0.4 0.0 1 15 0.4 0.0 1 20 0.4 0.0 1 50 0.4 0.0 1 70 0.4 0.0 1 99 18.0 530 -9 PATRON:LOGIC. MISSING 72.9 2,149 -3 MISSING 0.1 3 -2 DONT KNOW ----- ----- ----- 100.0 100.0 2,947 cases Data type: numeric Missing-data codes: lowest thru -1 Columns: 929-930
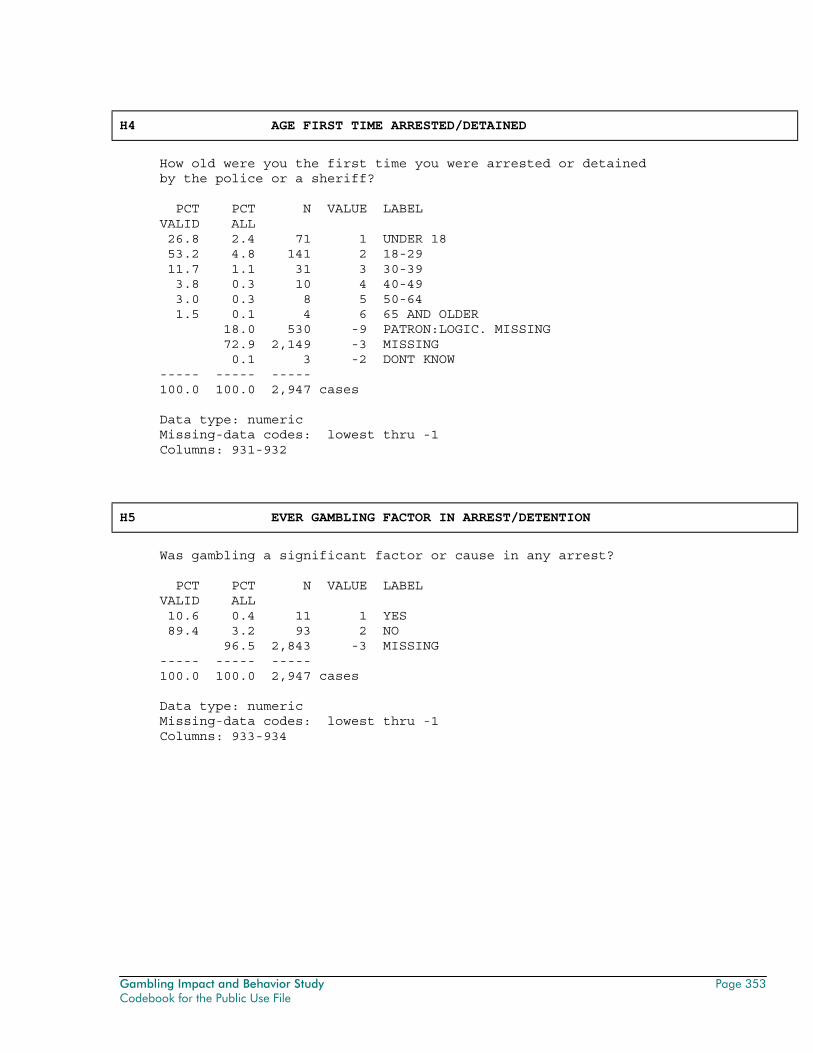
Gambling Impact and Behavior Study Page 353 Codebook for the Public Use File
H4 AGE FIRST TIME ARRESTED/DETAINED
How old were you the first time you were arrested or detained by the police or a sheriff? PCT PCT N VALUE LABEL VALID ALL 26.8 2.4 71 1 UNDER 18 53.2 4.8 141 2 18-29 11.7 1.1 31 3 30-39 3.8 0.3 10 4 40-49 3.0 0.3 8 5 50-64 1.5 0.1 4 6 65 AND OLDER 18.0 530 -9 PATRON:LOGIC. MISSING 72.9 2,149 -3 MISSING 0.1 3 -2 DONT KNOW ----- ----- ----- 100.0 100.0 2,947 cases Data type: numeric Missing-data codes: lowest thru -1 Columns: 931-932
H5 EVER GAMBLING FACTOR IN ARREST/DETENTION
Was gambling a significant factor or cause in any arrest? PCT PCT N VALUE LABEL VALID ALL 10.6 0.4 11 1 YES 89.4 3.2 93 2 NO 96.5 2,843 -3 MISSING ----- ----- ----- 100.0 100.0 2,947 cases Data type: numeric Missing-data codes: lowest thru -1 Columns: 933-934
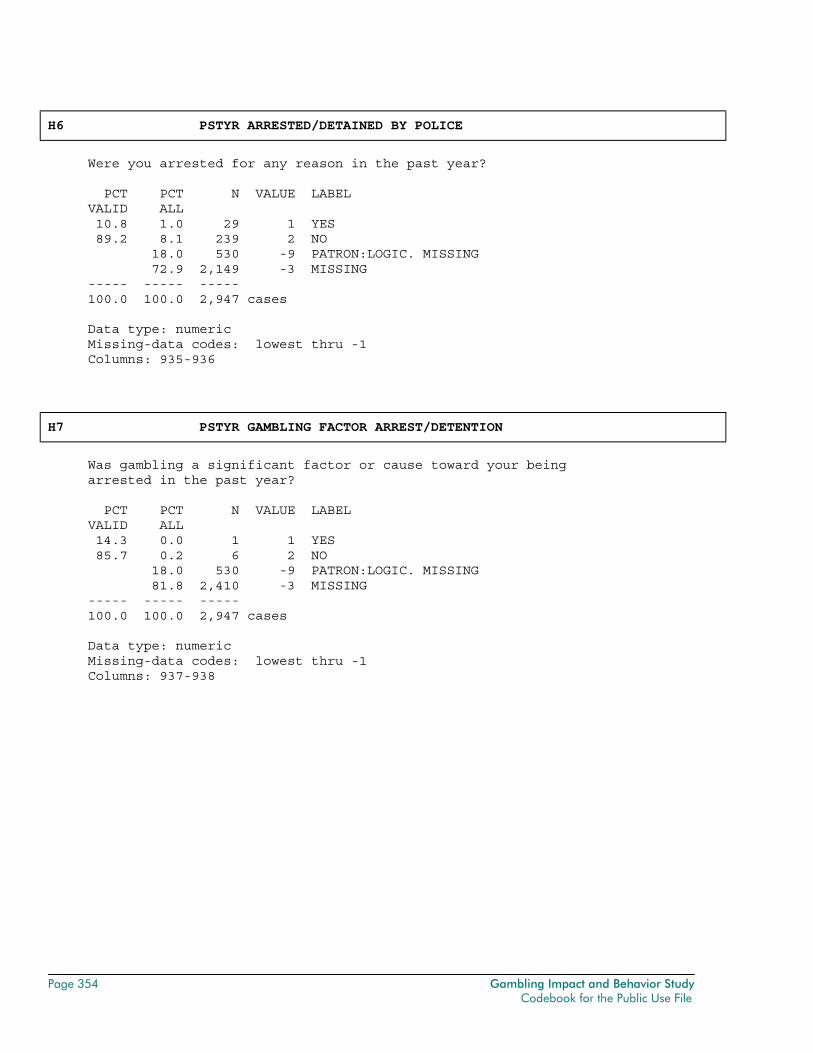
Page 354 Gambling Impact and Behavior Study Codebook for the Public Use File
H6 PSTYR ARRESTED/DETAINED BY POLICE
Were you arrested for any reason in the past year? PCT PCT N VALUE LABEL VALID ALL 10.8 1.0 29 1 YES 89.2 8.1 239 2 NO 18.0 530 -9 PATRON:LOGIC. MISSING 72.9 2,149 -3 MISSING ----- ----- ----- 100.0 100.0 2,947 cases Data type: numeric Missing-data codes: lowest thru -1 Columns: 935-936
H7 PSTYR GAMBLING FACTOR ARREST/DETENTION
Was gambling a significant factor or cause toward your being arrested in the past year? PCT PCT N VALUE LABEL VALID ALL 14.3 0.0 1 1 YES 85.7 0.2 6 2 NO 18.0 530 -9 PATRON:LOGIC. MISSING 81.8 2,410 -3 MISSING ----- ----- ----- 100.0 100.0 2,947 cases Data type: numeric Missing-data codes: lowest thru -1 Columns: 937-938
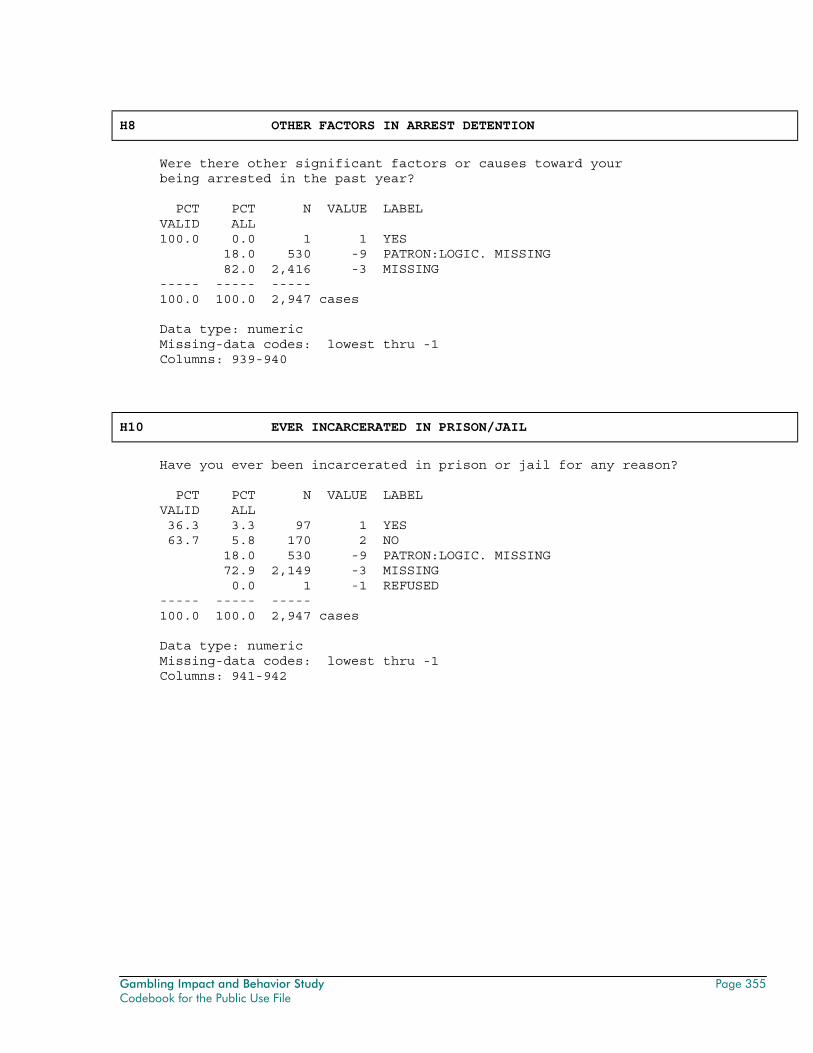
Gambling Impact and Behavior Study Page 355 Codebook for the Public Use File
H8 OTHER FACTORS IN ARREST DETENTION
Were there other significant factors or causes toward your being arrested in the past year? PCT PCT N VALUE LABEL VALID ALL 100.0 0.0 1 1 YES 18.0 530 -9 PATRON:LOGIC. MISSING 82.0 2,416 -3 MISSING ----- ----- ----- 100.0 100.0 2,947 cases Data type: numeric Missing-data codes: lowest thru -1 Columns: 939-940
H10 EVER INCARCERATED IN PRISON/JAIL
Have you ever been incarcerated in prison or jail for any reason? PCT PCT N VALUE LABEL VALID ALL 36.3 3.3 97 1 YES 63.7 5.8 170 2 NO 18.0 530 -9 PATRON:LOGIC. MISSING 72.9 2,149 -3 MISSING 0.0 1 -1 REFUSED ----- ----- ----- 100.0 100.0 2,947 cases Data type: numeric Missing-data codes: lowest thru -1 Columns: 941-942
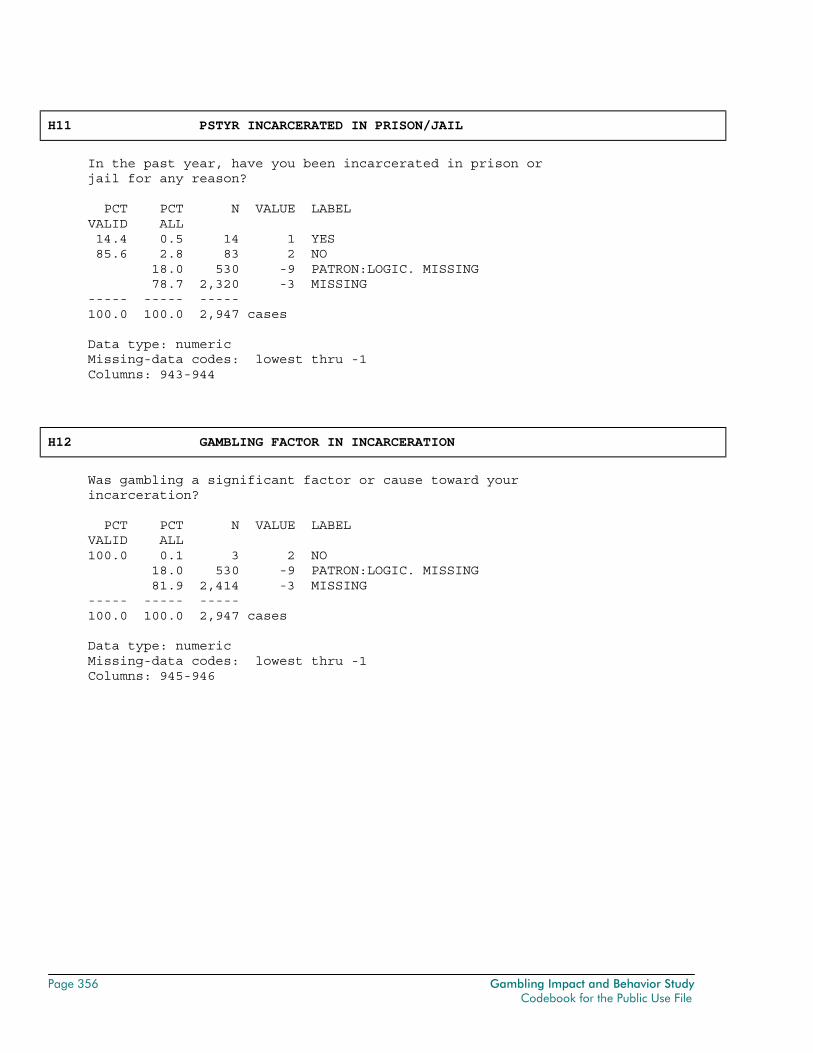
Page 356 Gambling Impact and Behavior Study Codebook for the Public Use File
H11 PSTYR INCARCERATED IN PRISON/JAIL
In the past year, have you been incarcerated in prison or jail for any reason? PCT PCT N VALUE LABEL VALID ALL 14.4 0.5 14 1 YES 85.6 2.8 83 2 NO 18.0 530 -9 PATRON:LOGIC. MISSING 78.7 2,320 -3 MISSING ----- ----- ----- 100.0 100.0 2,947 cases Data type: numeric Missing-data codes: lowest thru -1 Columns: 943-944
H12 GAMBLING FACTOR IN INCARCERATION
Was gambling a significant factor or cause toward your incarceration? PCT PCT N VALUE LABEL VALID ALL 100.0 0.1 3 2 NO 18.0 530 -9 PATRON:LOGIC. MISSING 81.9 2,414 -3 MISSING ----- ----- ----- 100.0 100.0 2,947 cases Data type: numeric Missing-data codes: lowest thru -1 Columns: 945-946
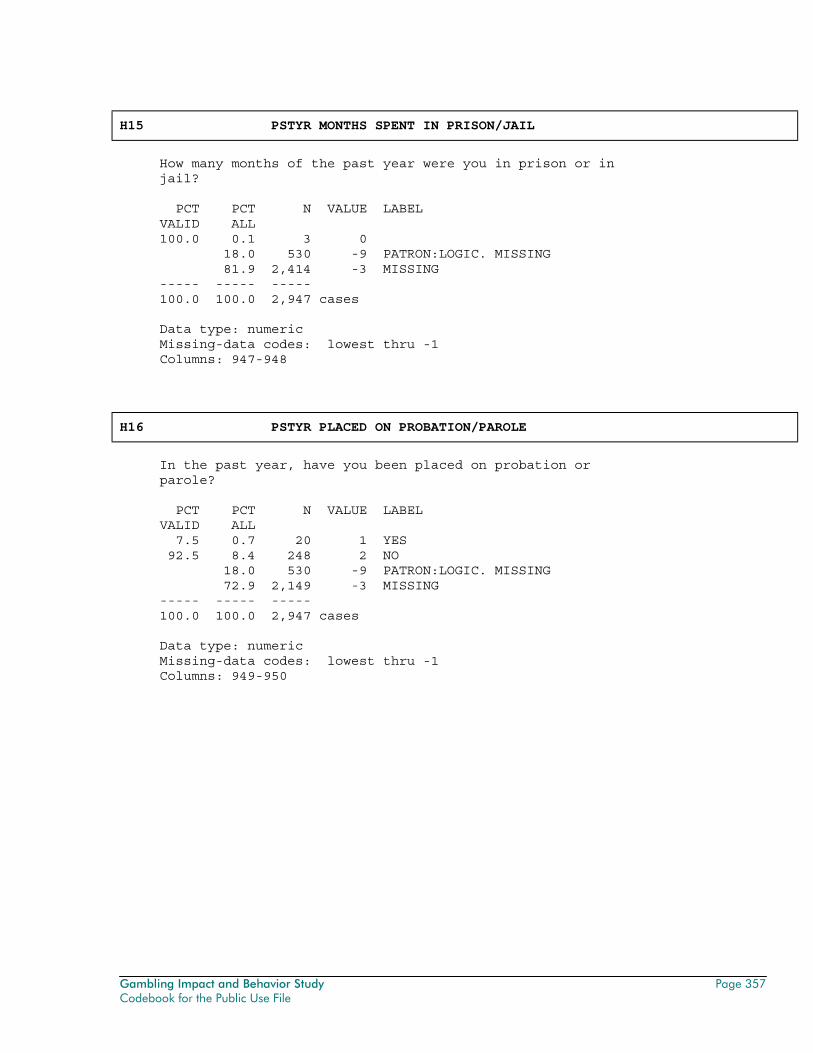
Gambling Impact and Behavior Study Page 357 Codebook for the Public Use File
H15 PSTYR MONTHS SPENT IN PRISON/JAIL
How many months of the past year were you in prison or in jail? PCT PCT N VALUE LABEL VALID ALL 100.0 0.1 3 0 18.0 530 -9 PATRON:LOGIC. MISSING 81.9 2,414 -3 MISSING ----- ----- ----- 100.0 100.0 2,947 cases Data type: numeric Missing-data codes: lowest thru -1 Columns: 947-948
H16 PSTYR PLACED ON PROBATION/PAROLE
In the past year, have you been placed on probation or parole? PCT PCT N VALUE LABEL VALID ALL 7.5 0.7 20 1 YES 92.5 8.4 248 2 NO 18.0 530 -9 PATRON:LOGIC. MISSING 72.9 2,149 -3 MISSING ----- ----- ----- 100.0 100.0 2,947 cases Data type: numeric Missing-data codes: lowest thru -1 Columns: 949-950
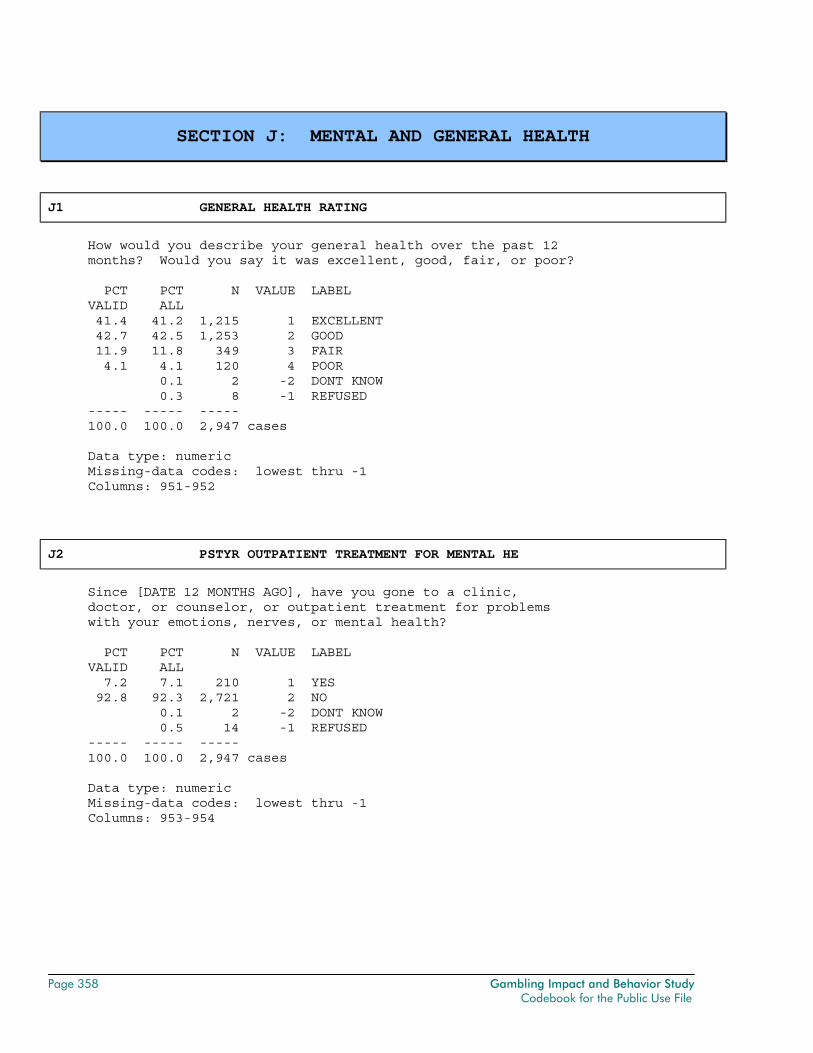
Page 358 Gambling Impact and Behavior Study Codebook for the Public Use File
SECTION J: MENTAL AND GENERAL HEALTH
J1 GENERAL HEALTH RATING
How would you describe your general health over the past 12 months? Would you say it was excellent, good, fair, or poor? PCT PCT N VALUE LABEL VALID ALL 41.4 41.2 1,215 1 EXCELLENT 42.7 42.5 1,253 2 GOOD 11.9 11.8 349 3 FAIR 4.1 4.1 120 4 POOR 0.1 2 -2 DONT KNOW 0.3 8 -1 REFUSED ----- ----- ----- 100.0 100.0 2,947 cases Data type: numeric Missing-data codes: lowest thru -1 Columns: 951-952
J2 PSTYR OUTPATIENT TREATMENT FOR MENTAL HE
Since [DATE 12 MONTHS AGO], have you gone to a clinic, doctor, or counselor, or outpatient treatment for problems with your emotions, nerves, or mental health? PCT PCT N VALUE LABEL VALID ALL 7.2 7.1 210 1 YES 92.8 92.3 2,721 2 NO 0.1 2 -2 DONT KNOW 0.5 14 -1 REFUSED ----- ----- ----- 100.0 100.0 2,947 cases Data type: numeric Missing-data codes: lowest thru -1 Columns: 953-954
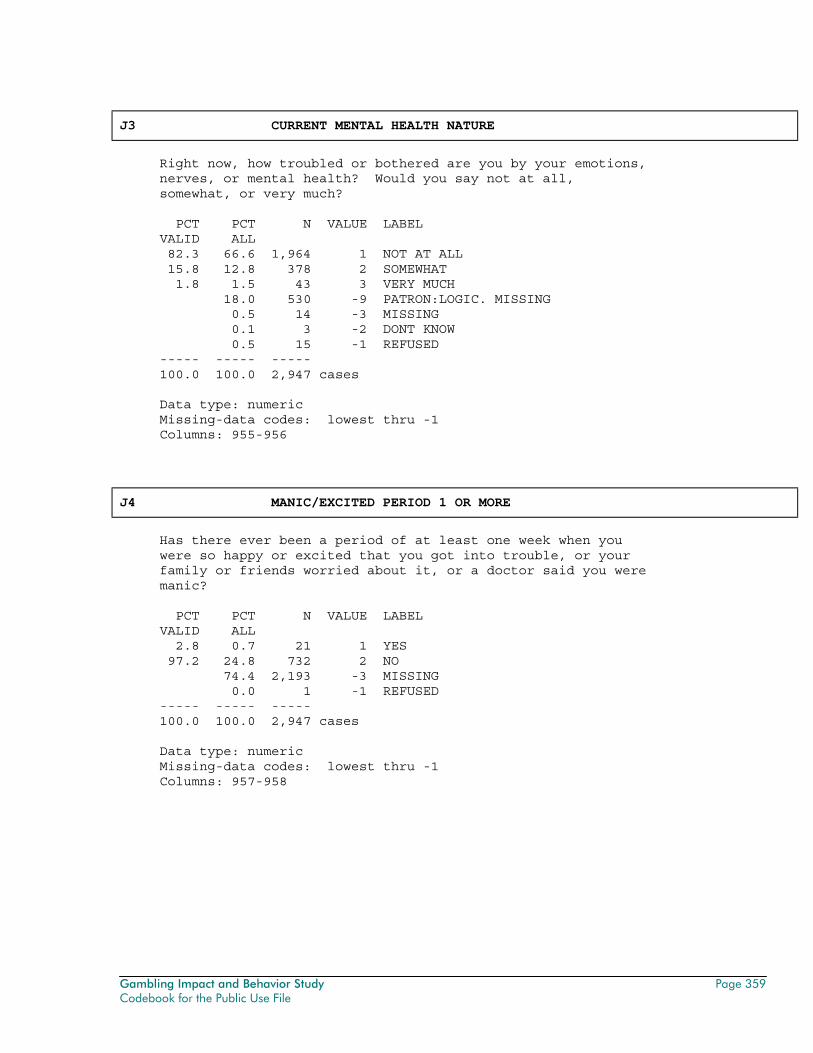
Gambling Impact and Behavior Study Page 359 Codebook for the Public Use File
J3 CURRENT MENTAL HEALTH NATURE
Right now, how troubled or bothered are you by your emotions, nerves, or mental health? Would you say not at all, somewhat, or very much? PCT PCT N VALUE LABEL VALID ALL 82.3 66.6 1,964 1 NOT AT ALL 15.8 12.8 378 2 SOMEWHAT 1.8 1.5 43 3 VERY MUCH 18.0 530 -9 PATRON:LOGIC. MISSING 0.5 14 -3 MISSING 0.1 3 -2 DONT KNOW 0.5 15 -1 REFUSED ----- ----- ----- 100.0 100.0 2,947 cases Data type: numeric Missing-data codes: lowest thru -1 Columns: 955-956
J4 MANIC/EXCITED PERIOD 1 OR MORE
Has there ever been a period of at least one week when you were so happy or excited that you got into trouble, or your family or friends worried about it, or a doctor said you were manic? PCT PCT N VALUE LABEL VALID ALL 2.8 0.7 21 1 YES 97.2 24.8 732 2 NO 74.4 2,193 -3 MISSING 0.0 1 -1 REFUSED ----- ----- ----- 100.0 100.0 2,947 cases Data type: numeric Missing-data codes: lowest thru -1 Columns: 957-958
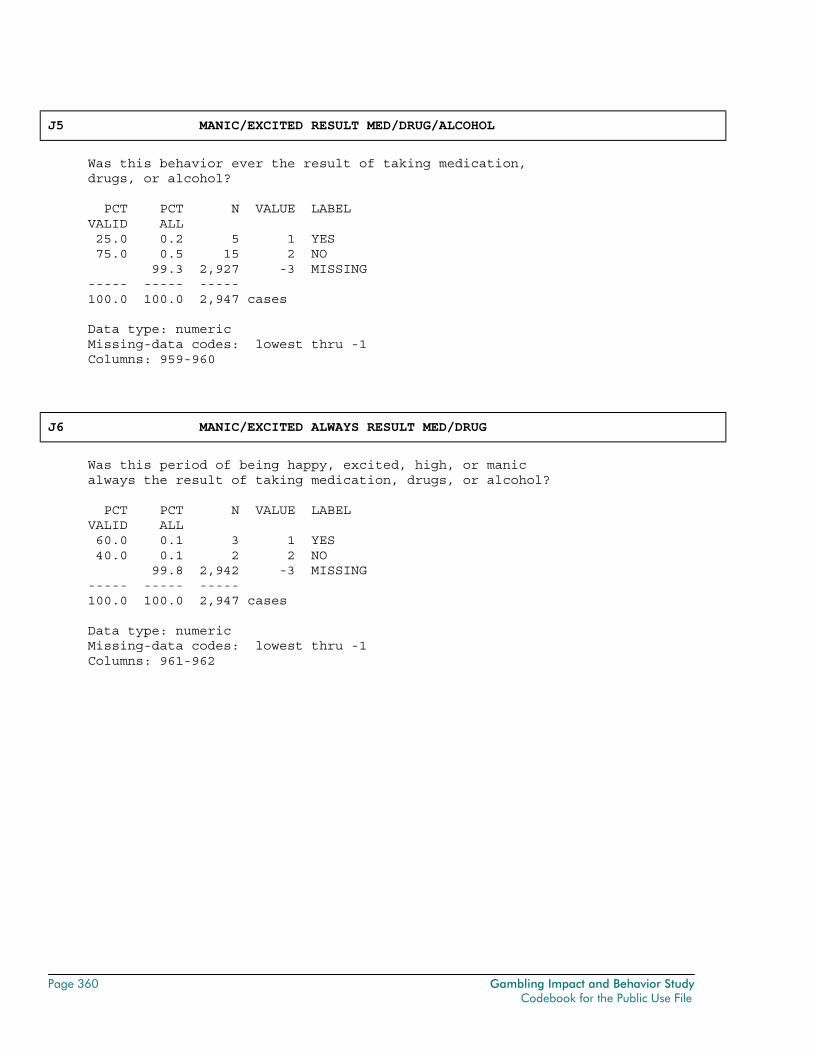
Page 360 Gambling Impact and Behavior Study Codebook for the Public Use File
J5 MANIC/EXCITED RESULT MED/DRUG/ALCOHOL
Was this behavior ever the result of taking medication, drugs, or alcohol? PCT PCT N VALUE LABEL VALID ALL 25.0 0.2 5 1 YES 75.0 0.5 15 2 NO 99.3 2,927 -3 MISSING ----- ----- ----- 100.0 100.0 2,947 cases Data type: numeric Missing-data codes: lowest thru -1 Columns: 959-960
J6 MANIC/EXCITED ALWAYS RESULT MED/DRUG
Was this period of being happy, excited, high, or manic always the result of taking medication, drugs, or alcohol? PCT PCT N VALUE LABEL VALID ALL 60.0 0.1 3 1 YES 40.0 0.1 2 2 NO 99.8 2,942 -3 MISSING ----- ----- ----- 100.0 100.0 2,947 cases Data type: numeric Missing-data codes: lowest thru -1 Columns: 961-962
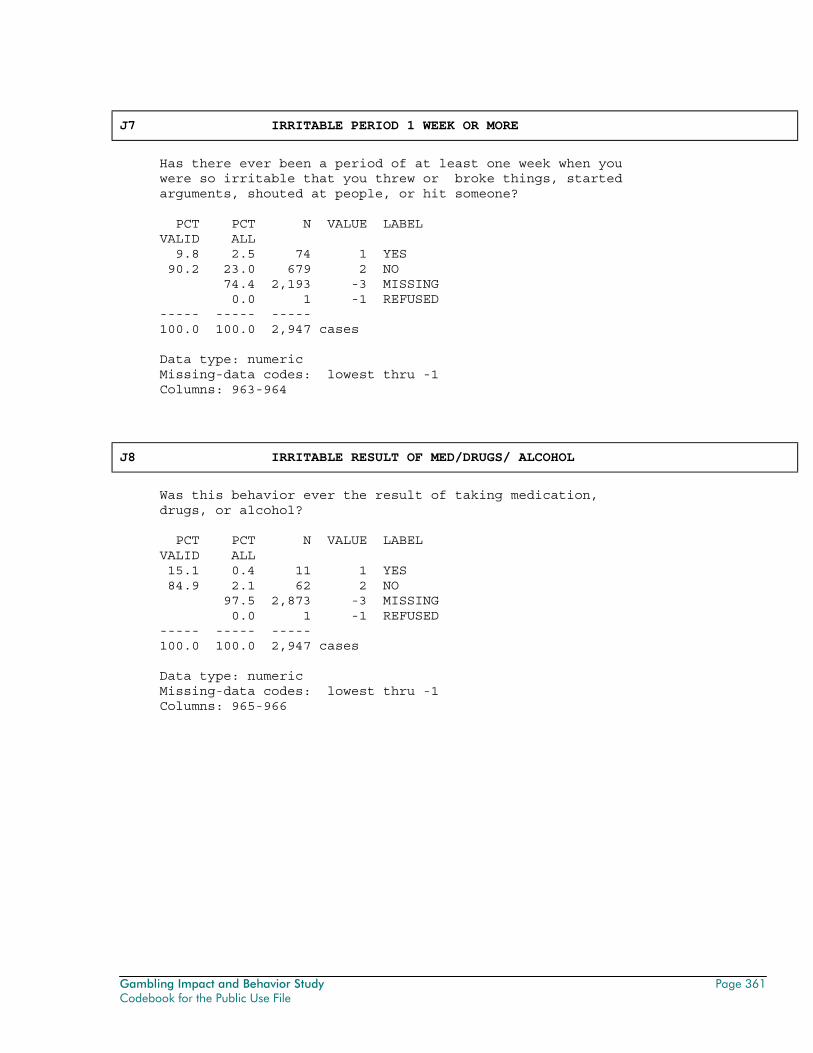
Gambling Impact and Behavior Study Page 361 Codebook for the Public Use File
J7 IRRITABLE PERIOD 1 WEEK OR MORE
Has there ever been a period of at least one week when you were so irritable that you threw or broke things, started arguments, shouted at people, or hit someone? PCT PCT N VALUE LABEL VALID ALL 9.8 2.5 74 1 YES 90.2 23.0 679 2 NO 74.4 2,193 -3 MISSING 0.0 1 -1 REFUSED ----- ----- ----- 100.0 100.0 2,947 cases Data type: numeric Missing-data codes: lowest thru -1 Columns: 963-964
J8 IRRITABLE RESULT OF MED/DRUGS/ ALCOHOL
Was this behavior ever the result of taking medication, drugs, or alcohol? PCT PCT N VALUE LABEL VALID ALL 15.1 0.4 11 1 YES 84.9 2.1 62 2 NO 97.5 2,873 -3 MISSING 0.0 1 -1 REFUSED ----- ----- ----- 100.0 100.0 2,947 cases Data type: numeric Missing-data codes: lowest thru -1 Columns: 965-966
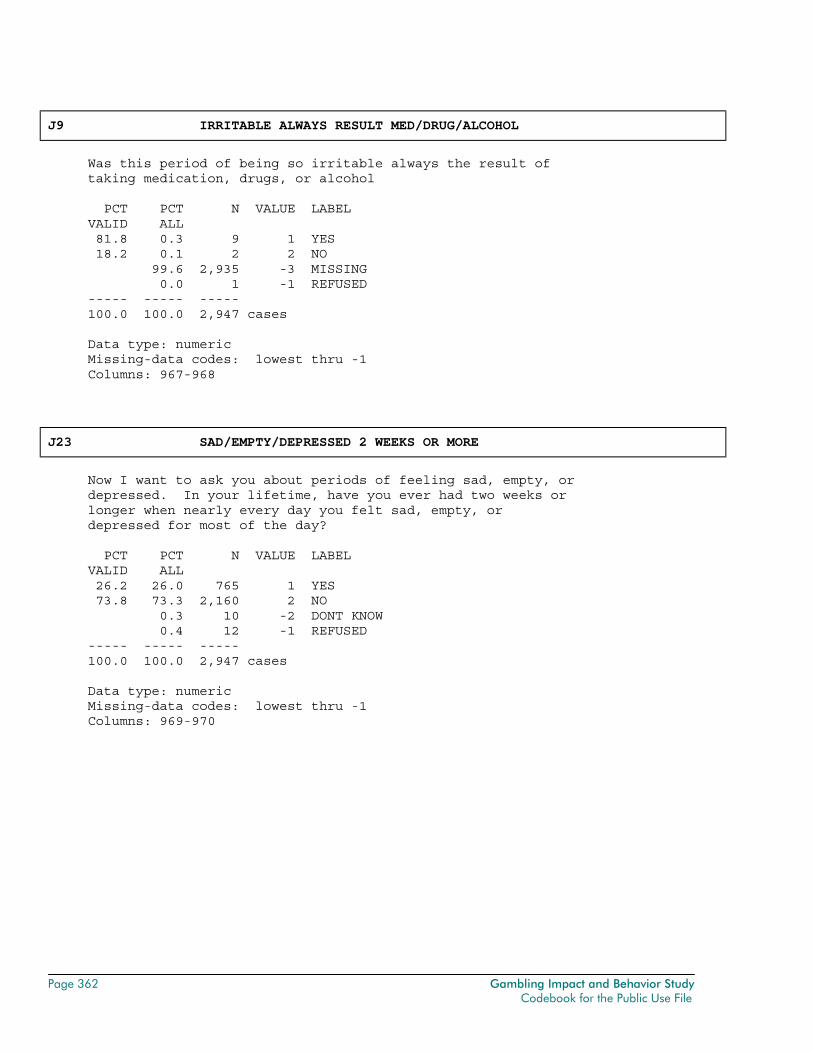
Page 362 Gambling Impact and Behavior Study Codebook for the Public Use File
J9 IRRITABLE ALWAYS RESULT MED/DRUG/ALCOHOL
Was this period of being so irritable always the result of taking medication, drugs, or alcohol PCT PCT N VALUE LABEL VALID ALL 81.8 0.3 9 1 YES 18.2 0.1 2 2 NO 99.6 2,935 -3 MISSING 0.0 1 -1 REFUSED ----- ----- ----- 100.0 100.0 2,947 cases Data type: numeric Missing-data codes: lowest thru -1 Columns: 967-968
J23 SAD/EMPTY/DEPRESSED 2 WEEKS OR MORE
Now I want to ask you about periods of feeling sad, empty, or depressed. In your lifetime, have you ever had two weeks or longer when nearly every day you felt sad, empty, or depressed for most of the day? PCT PCT N VALUE LABEL VALID ALL 26.2 26.0 765 1 YES 73.8 73.3 2,160 2 NO 0.3 10 -2 DONT KNOW 0.4 12 -1 REFUSED ----- ----- ----- 100.0 100.0 2,947 cases Data type: numeric Missing-data codes: lowest thru -1 Columns: 969-970
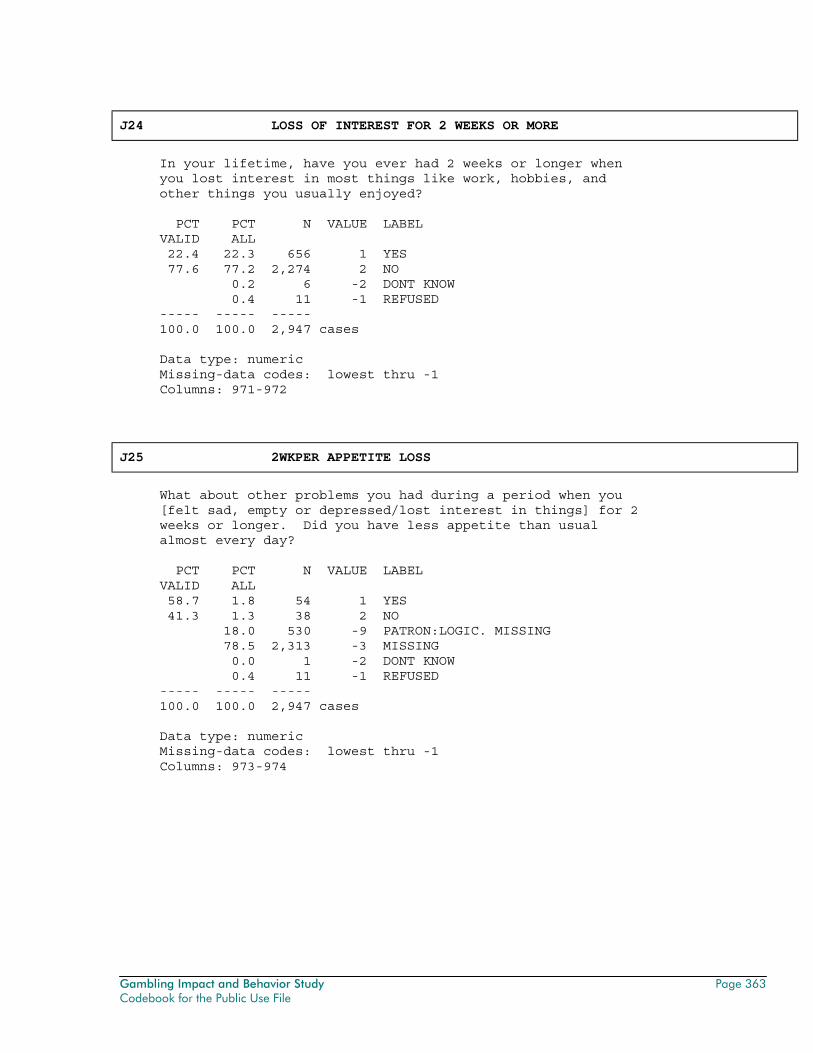
Gambling Impact and Behavior Study Page 363 Codebook for the Public Use File
J24 LOSS OF INTEREST FOR 2 WEEKS OR MORE
In your lifetime, have you ever had 2 weeks or longer when you lost interest in most things like work, hobbies, and other things you usually enjoyed? PCT PCT N VALUE LABEL VALID ALL 22.4 22.3 656 1 YES 77.6 77.2 2,274 2 NO 0.2 6 -2 DONT KNOW 0.4 11 -1 REFUSED ----- ----- ----- 100.0 100.0 2,947 cases Data type: numeric Missing-data codes: lowest thru -1 Columns: 971-972
J25 2WKPER APPETITE LOSS
What about other problems you had during a period when you [felt sad, empty or depressed/lost interest in things] for 2 weeks or longer. Did you have less appetite than usual almost every day? PCT PCT N VALUE LABEL VALID ALL 58.7 1.8 54 1 YES 41.3 1.3 38 2 NO 18.0 530 -9 PATRON:LOGIC. MISSING 78.5 2,313 -3 MISSING 0.0 1 -2 DONT KNOW 0.4 11 -1 REFUSED ----- ----- ----- 100.0 100.0 2,947 cases Data type: numeric Missing-data codes: lowest thru -1 Columns: 973-974
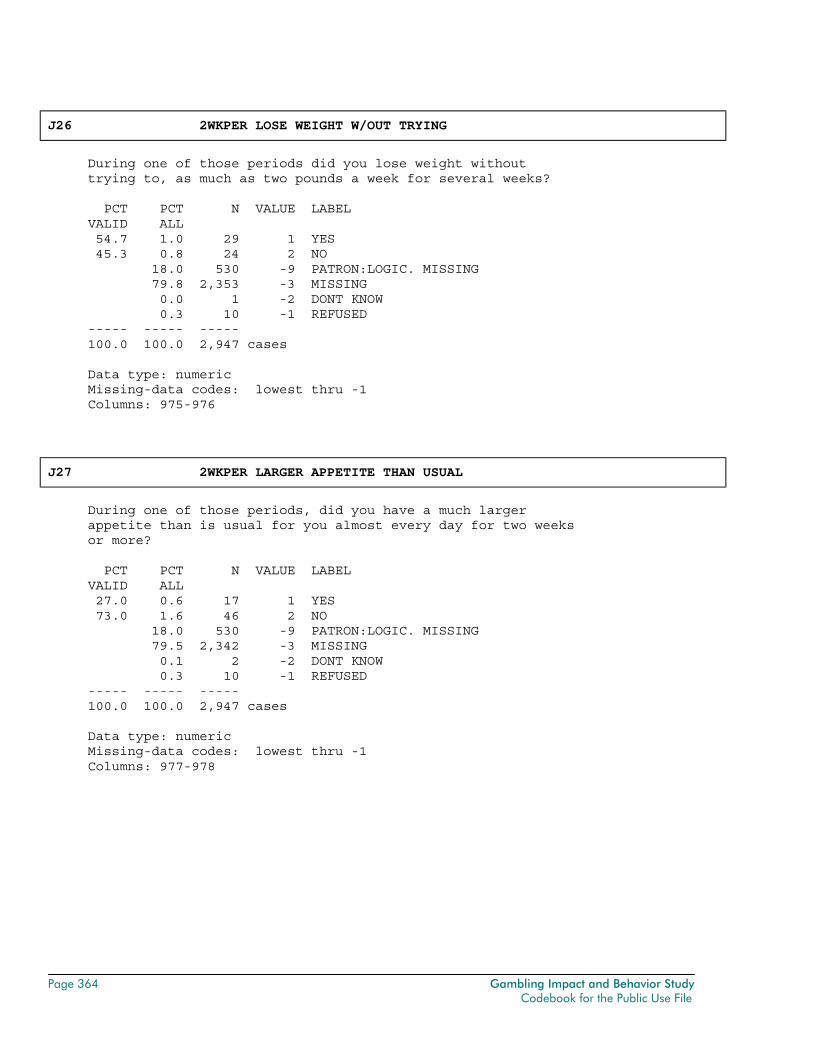
Page 364 Gambling Impact and Behavior Study Codebook for the Public Use File
J26 2WKPER LOSE WEIGHT W/OUT TRYING
During one of those periods did you lose weight without trying to, as much as two pounds a week for several weeks? PCT PCT N VALUE LABEL VALID ALL 54.7 1.0 29 1 YES 45.3 0.8 24 2 NO 18.0 530 -9 PATRON:LOGIC. MISSING 79.8 2,353 -3 MISSING 0.0 1 -2 DONT KNOW 0.3 10 -1 REFUSED ----- ----- ----- 100.0 100.0 2,947 cases Data type: numeric Missing-data codes: lowest thru -1 Columns: 975-976
J27 2WKPER LARGER APPETITE THAN USUAL
During one of those periods, did you have a much larger appetite than is usual for you almost every day for two weeks or more? PCT PCT N VALUE LABEL VALID ALL 27.0 0.6 17 1 YES 73.0 1.6 46 2 NO 18.0 530 -9 PATRON:LOGIC. MISSING 79.5 2,342 -3 MISSING 0.1 2 -2 DONT KNOW 0.3 10 -1 REFUSED ----- ----- ----- 100.0 100.0 2,947 cases Data type: numeric Missing-data codes: lowest thru -1 Columns: 977-978
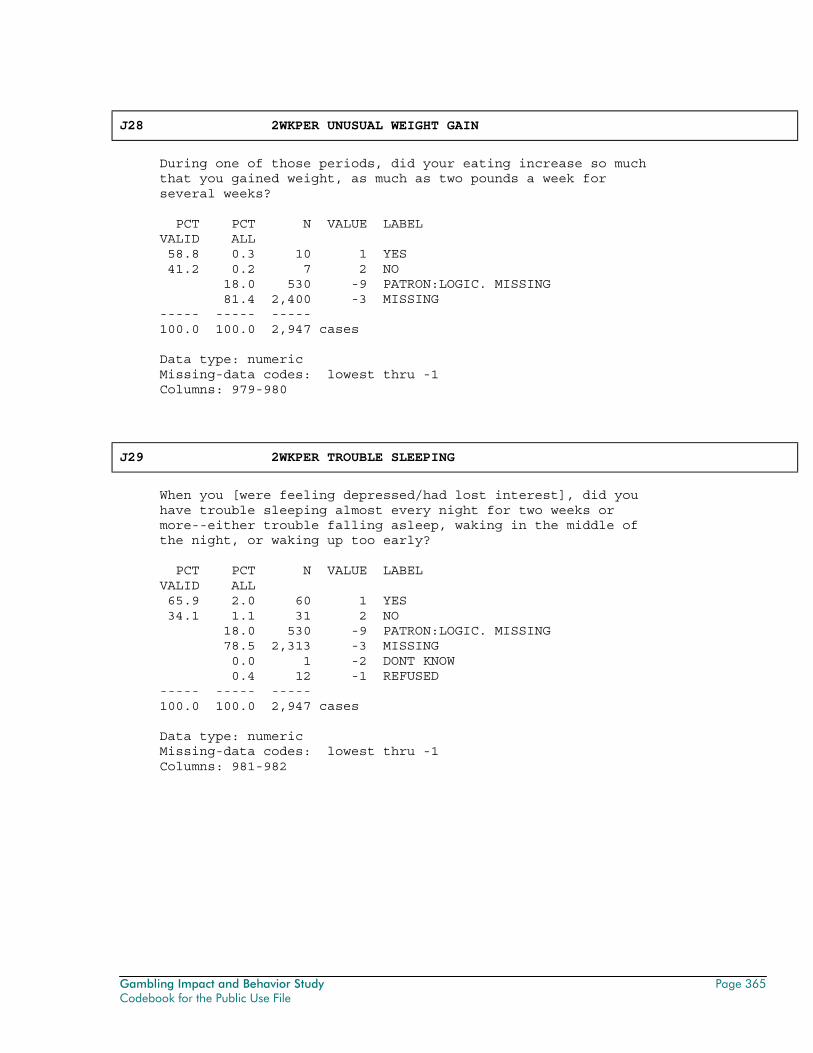
Gambling Impact and Behavior Study Page 365 Codebook for the Public Use File
J28 2WKPER UNUSUAL WEIGHT GAIN
During one of those periods, did your eating increase so much that you gained weight, as much as two pounds a week for several weeks? PCT PCT N VALUE LABEL VALID ALL 58.8 0.3 10 1 YES 41.2 0.2 7 2 NO 18.0 530 -9 PATRON:LOGIC. MISSING 81.4 2,400 -3 MISSING ----- ----- ----- 100.0 100.0 2,947 cases Data type: numeric Missing-data codes: lowest thru -1 Columns: 979-980
J29 2WKPER TROUBLE SLEEPING
When you [were feeling depressed/had lost interest], did you have trouble sleeping almost every night for two weeks or more--either trouble falling asleep, waking in the middle of the night, or waking up too early? PCT PCT N VALUE LABEL VALID ALL 65.9 2.0 60 1 YES 34.1 1.1 31 2 NO 18.0 530 -9 PATRON:LOGIC. MISSING 78.5 2,313 -3 MISSING 0.0 1 -2 DONT KNOW 0.4 12 -1 REFUSED ----- ----- ----- 100.0 100.0 2,947 cases Data type: numeric Missing-data codes: lowest thru -1 Columns: 981-982
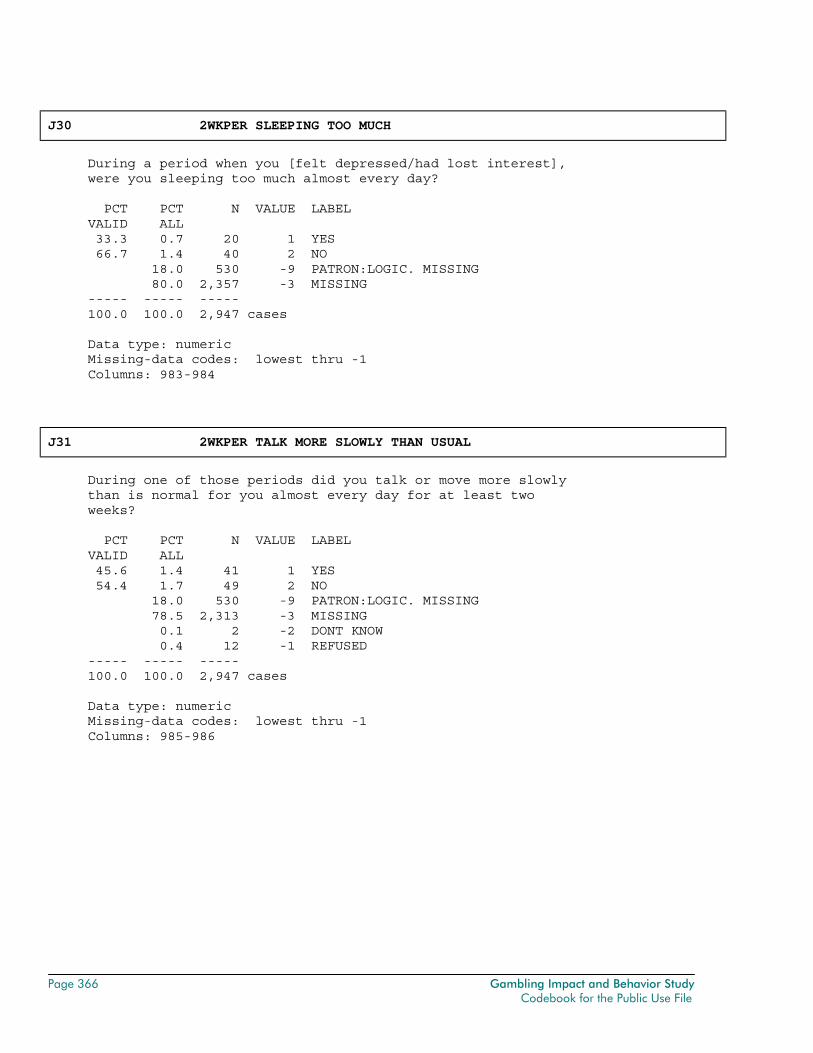
Page 366 Gambling Impact and Behavior Study Codebook for the Public Use File
J30 2WKPER SLEEPING TOO MUCH
During a period when you [felt depressed/had lost interest], were you sleeping too much almost every day? PCT PCT N VALUE LABEL VALID ALL 33.3 0.7 20 1 YES 66.7 1.4 40 2 NO 18.0 530 -9 PATRON:LOGIC. MISSING 80.0 2,357 -3 MISSING ----- ----- ----- 100.0 100.0 2,947 cases Data type: numeric Missing-data codes: lowest thru -1 Columns: 983-984
J31 2WKPER TALK MORE SLOWLY THAN USUAL
During one of those periods did you talk or move more slowly than is normal for you almost every day for at least two weeks? PCT PCT N VALUE LABEL VALID ALL 45.6 1.4 41 1 YES 54.4 1.7 49 2 NO 18.0 530 -9 PATRON:LOGIC. MISSING 78.5 2,313 -3 MISSING 0.1 2 -2 DONT KNOW 0.4 12 -1 REFUSED ----- ----- ----- 100.0 100.0 2,947 cases Data type: numeric Missing-data codes: lowest thru -1 Columns: 985-986
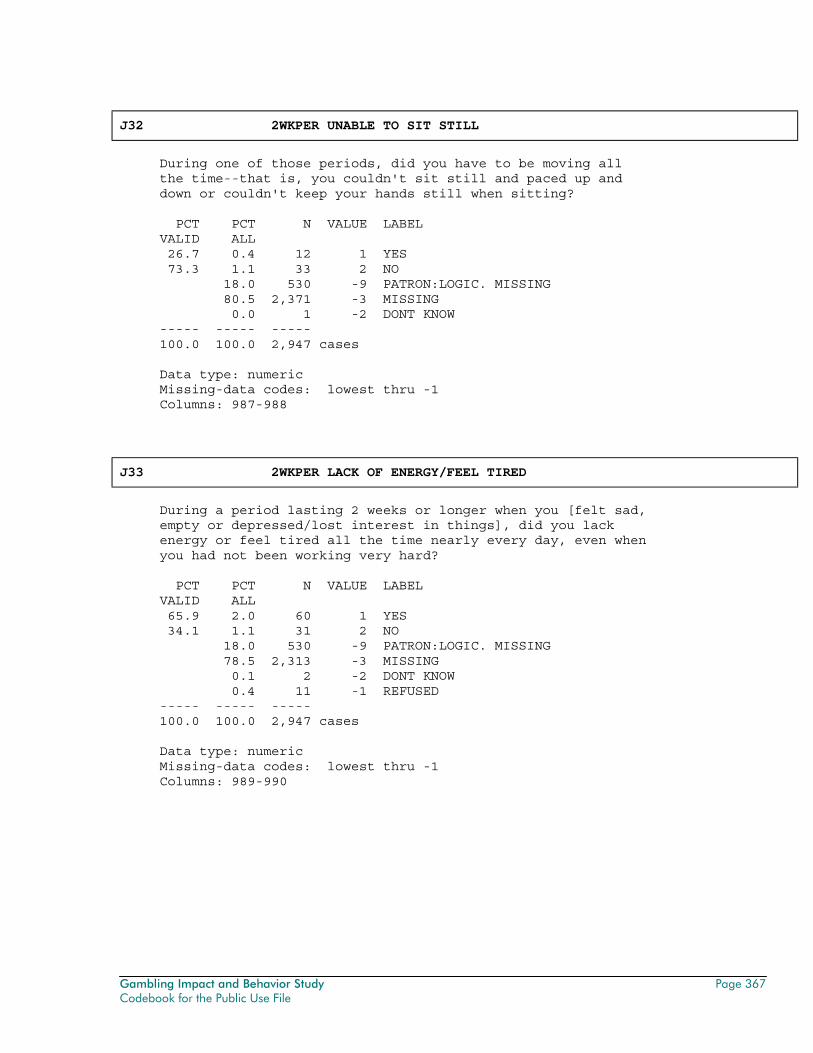
Gambling Impact and Behavior Study Page 367 Codebook for the Public Use File
J32 2WKPER UNABLE TO SIT STILL
During one of those periods, did you have to be moving all the time--that is, you couldn't sit still and paced up and down or couldn't keep your hands still when sitting? PCT PCT N VALUE LABEL VALID ALL 26.7 0.4 12 1 YES 73.3 1.1 33 2 NO 18.0 530 -9 PATRON:LOGIC. MISSING 80.5 2,371 -3 MISSING 0.0 1 -2 DONT KNOW ----- ----- ----- 100.0 100.0 2,947 cases Data type: numeric Missing-data codes: lowest thru -1 Columns: 987-988
J33 2WKPER LACK OF ENERGY/FEEL TIRED
During a period lasting 2 weeks or longer when you [felt sad, empty or depressed/lost interest in things], did you lack energy or feel tired all the time nearly every day, even when you had not been working very hard? PCT PCT N VALUE LABEL VALID ALL 65.9 2.0 60 1 YES 34.1 1.1 31 2 NO 18.0 530 -9 PATRON:LOGIC. MISSING 78.5 2,313 -3 MISSING 0.1 2 -2 DONT KNOW 0.4 11 -1 REFUSED ----- ----- ----- 100.0 100.0 2,947 cases Data type: numeric Missing-data codes: lowest thru -1 Columns: 989-990
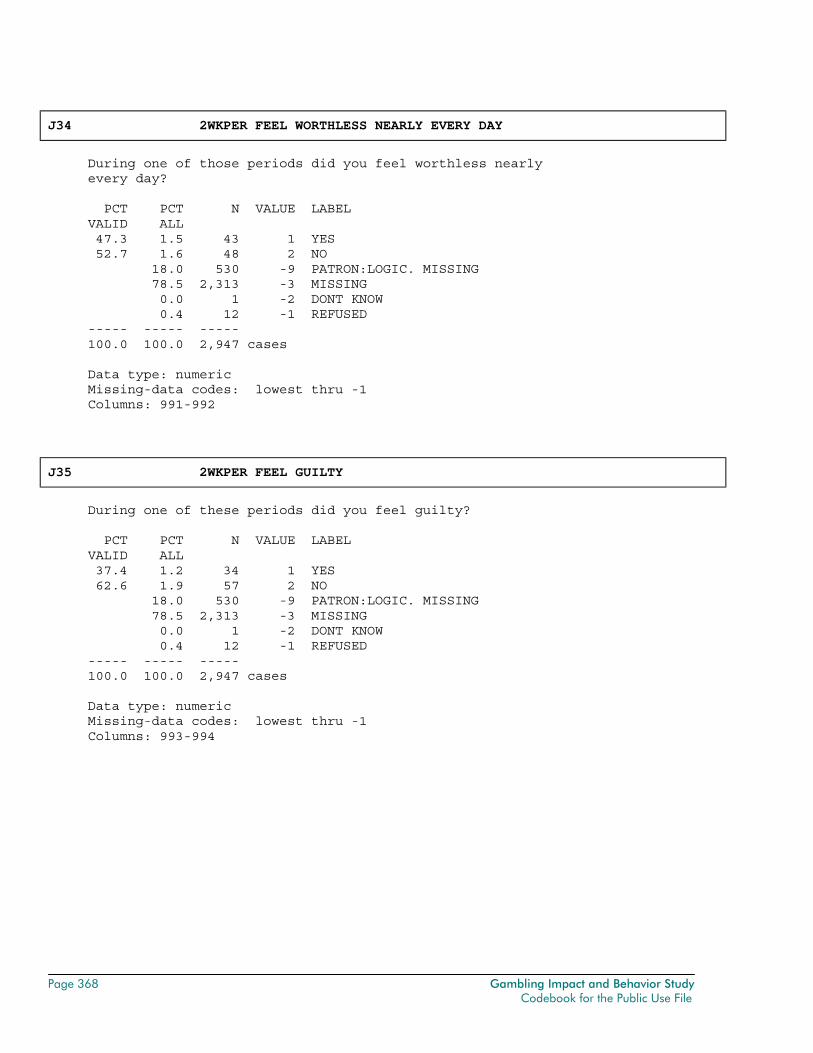
Page 368 Gambling Impact and Behavior Study Codebook for the Public Use File
J34 2WKPER FEEL WORTHLESS NEARLY EVERY DAY
During one of those periods did you feel worthless nearly every day? PCT PCT N VALUE LABEL VALID ALL 47.3 1.5 43 1 YES 52.7 1.6 48 2 NO 18.0 530 -9 PATRON:LOGIC. MISSING 78.5 2,313 -3 MISSING 0.0 1 -2 DONT KNOW 0.4 12 -1 REFUSED ----- ----- ----- 100.0 100.0 2,947 cases Data type: numeric Missing-data codes: lowest thru -1 Columns: 991-992
J35 2WKPER FEEL GUILTY
During one of these periods did you feel guilty? PCT PCT N VALUE LABEL VALID ALL 37.4 1.2 34 1 YES 62.6 1.9 57 2 NO 18.0 530 -9 PATRON:LOGIC. MISSING 78.5 2,313 -3 MISSING 0.0 1 -2 DONT KNOW 0.4 12 -1 REFUSED ----- ----- ----- 100.0 100.0 2,947 cases Data type: numeric Missing-data codes: lowest thru -1 Columns: 993-994
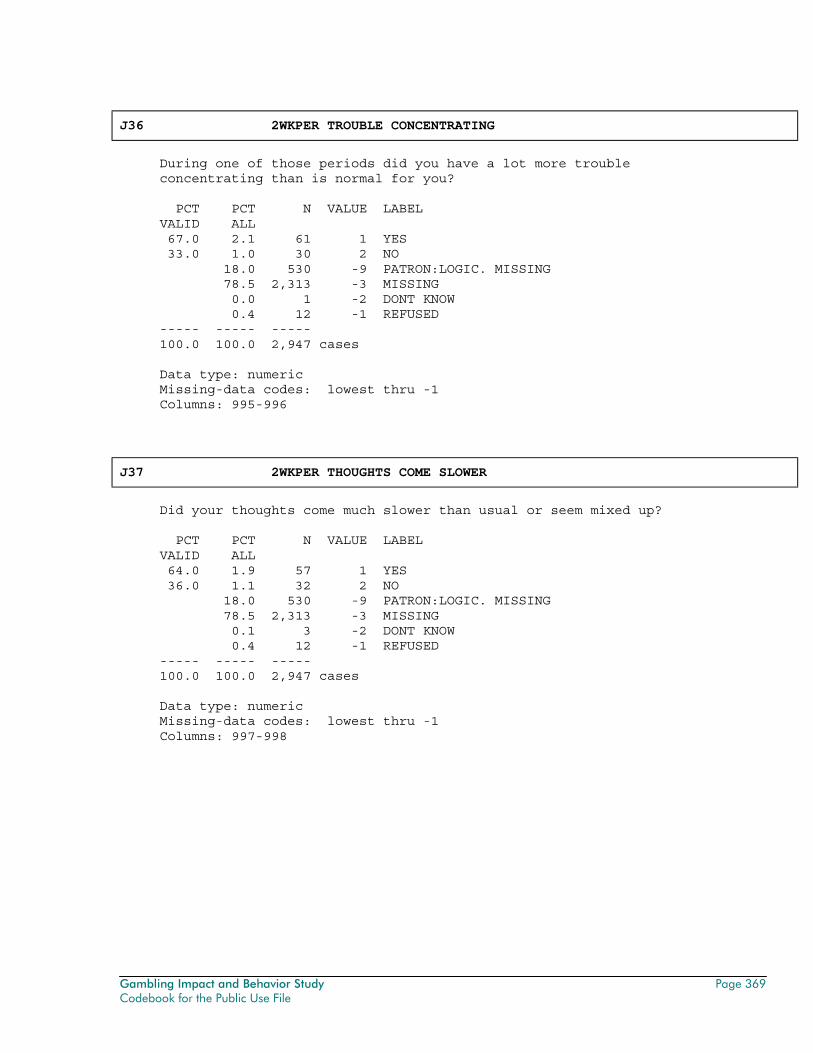
Gambling Impact and Behavior Study Page 369 Codebook for the Public Use File
J36 2WKPER TROUBLE CONCENTRATING
During one of those periods did you have a lot more trouble concentrating than is normal for you? PCT PCT N VALUE LABEL VALID ALL 67.0 2.1 61 1 YES 33.0 1.0 30 2 NO 18.0 530 -9 PATRON:LOGIC. MISSING 78.5 2,313 -3 MISSING 0.0 1 -2 DONT KNOW 0.4 12 -1 REFUSED ----- ----- ----- 100.0 100.0 2,947 cases Data type: numeric Missing-data codes: lowest thru -1 Columns: 995-996
J37 2WKPER THOUGHTS COME SLOWER
Did your thoughts come much slower than usual or seem mixed up? PCT PCT N VALUE LABEL VALID ALL 64.0 1.9 57 1 YES 36.0 1.1 32 2 NO 18.0 530 -9 PATRON:LOGIC. MISSING 78.5 2,313 -3 MISSING 0.1 3 -2 DONT KNOW 0.4 12 -1 REFUSED ----- ----- ----- 100.0 100.0 2,947 cases Data type: numeric Missing-data codes: lowest thru -1 Columns: 997-998
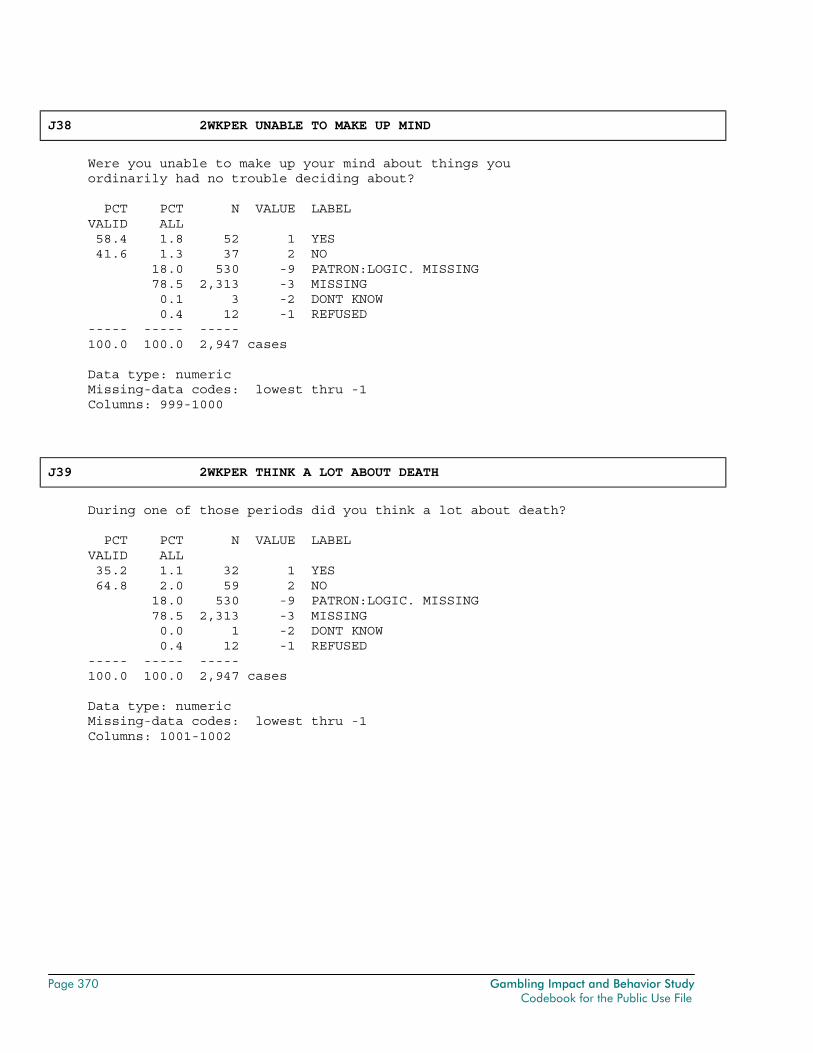
Page 370 Gambling Impact and Behavior Study Codebook for the Public Use File
J38 2WKPER UNABLE TO MAKE UP MIND
Were you unable to make up your mind about things you ordinarily had no trouble deciding about? PCT PCT N VALUE LABEL VALID ALL 58.4 1.8 52 1 YES 41.6 1.3 37 2 NO 18.0 530 -9 PATRON:LOGIC. MISSING 78.5 2,313 -3 MISSING 0.1 3 -2 DONT KNOW 0.4 12 -1 REFUSED ----- ----- ----- 100.0 100.0 2,947 cases Data type: numeric Missing-data codes: lowest thru -1 Columns: 999-1000
J39 2WKPER THINK A LOT ABOUT DEATH
During one of those periods did you think a lot about death? PCT PCT N VALUE LABEL VALID ALL 35.2 1.1 32 1 YES 64.8 2.0 59 2 NO 18.0 530 -9 PATRON:LOGIC. MISSING 78.5 2,313 -3 MISSING 0.0 1 -2 DONT KNOW 0.4 12 -1 REFUSED ----- ----- ----- 100.0 100.0 2,947 cases Data type: numeric Missing-data codes: lowest thru -1 Columns: 1001-1002
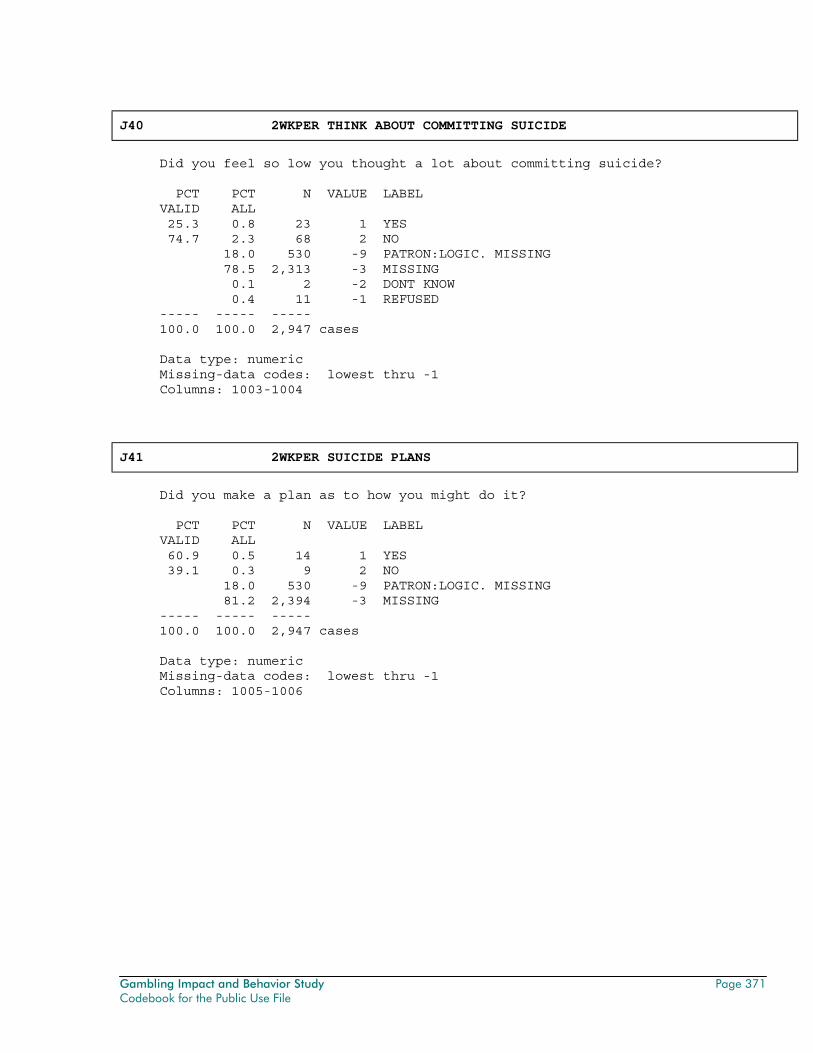
Gambling Impact and Behavior Study Page 371 Codebook for the Public Use File
J40 2WKPER THINK ABOUT COMMITTING SUICIDE
Did you feel so low you thought a lot about committing suicide? PCT PCT N VALUE LABEL VALID ALL 25.3 0.8 23 1 YES 74.7 2.3 68 2 NO 18.0 530 -9 PATRON:LOGIC. MISSING 78.5 2,313 -3 MISSING 0.1 2 -2 DONT KNOW 0.4 11 -1 REFUSED ----- ----- ----- 100.0 100.0 2,947 cases Data type: numeric Missing-data codes: lowest thru -1 Columns: 1003-1004
J41 2WKPER SUICIDE PLANS
Did you make a plan as to how you might do it? PCT PCT N VALUE LABEL VALID ALL 60.9 0.5 14 1 YES 39.1 0.3 9 2 NO 18.0 530 -9 PATRON:LOGIC. MISSING 81.2 2,394 -3 MISSING ----- ----- ----- 100.0 100.0 2,947 cases Data type: numeric Missing-data codes: lowest thru -1 Columns: 1005-1006
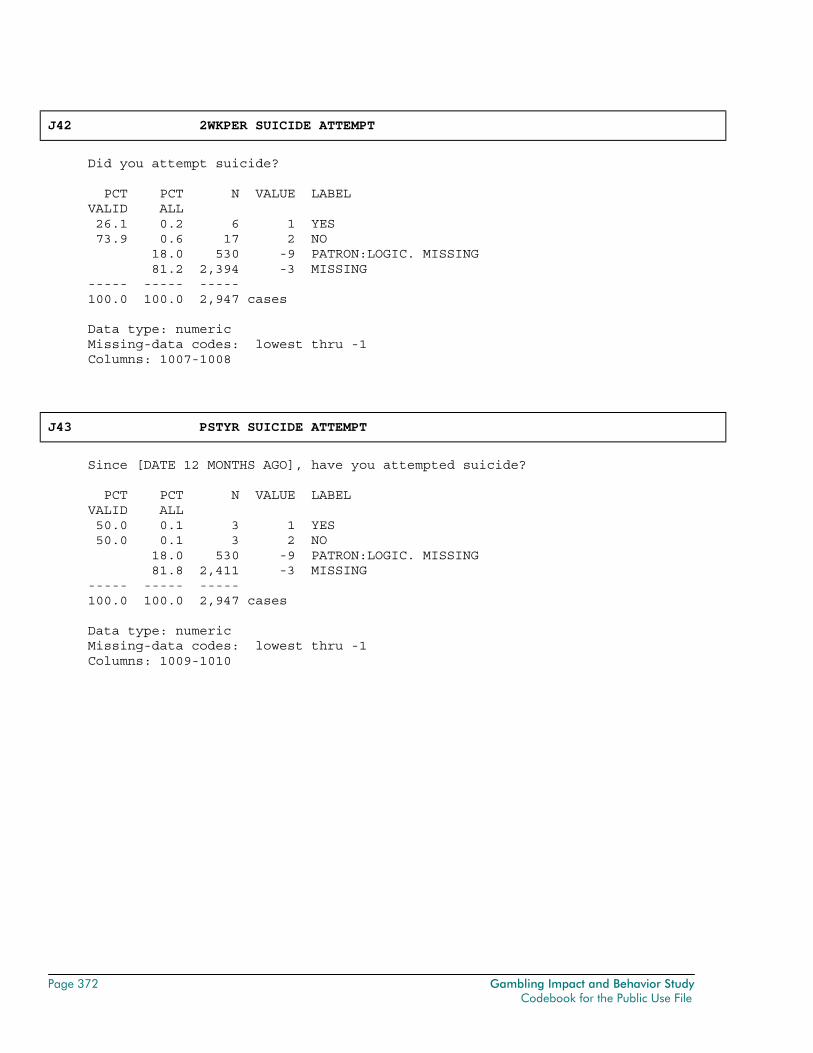
Page 372 Gambling Impact and Behavior Study Codebook for the Public Use File
J42 2WKPER SUICIDE ATTEMPT
Did you attempt suicide? PCT PCT N VALUE LABEL VALID ALL 26.1 0.2 6 1 YES 73.9 0.6 17 2 NO 18.0 530 -9 PATRON:LOGIC. MISSING 81.2 2,394 -3 MISSING ----- ----- ----- 100.0 100.0 2,947 cases Data type: numeric Missing-data codes: lowest thru -1 Columns: 1007-1008
J43 PSTYR SUICIDE ATTEMPT
Since [DATE 12 MONTHS AGO], have you attempted suicide? PCT PCT N VALUE LABEL VALID ALL 50.0 0.1 3 1 YES 50.0 0.1 3 2 NO 18.0 530 -9 PATRON:LOGIC. MISSING 81.8 2,411 -3 MISSING ----- ----- ----- 100.0 100.0 2,947 cases Data type: numeric Missing-data codes: lowest thru -1 Columns: 1009-1010
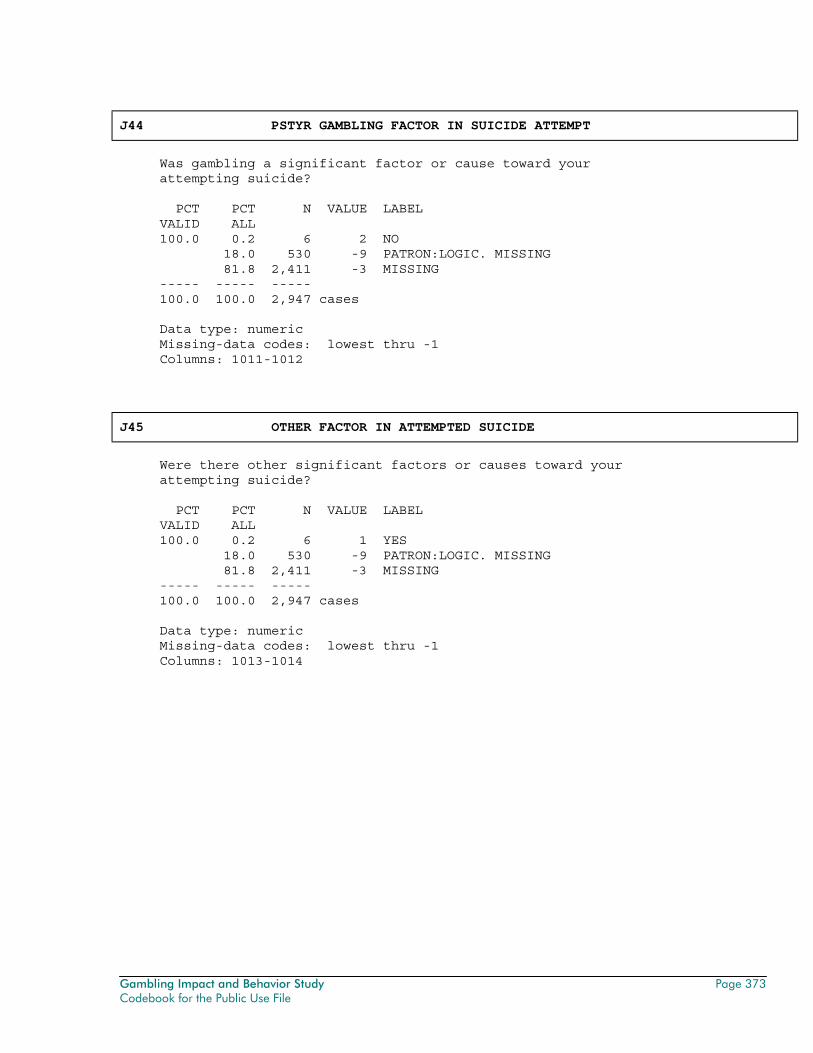
Gambling Impact and Behavior Study Page 373 Codebook for the Public Use File
J44 PSTYR GAMBLING FACTOR IN SUICIDE ATTEMPT
Was gambling a significant factor or cause toward your attempting suicide? PCT PCT N VALUE LABEL VALID ALL 100.0 0.2 6 2 NO 18.0 530 -9 PATRON:LOGIC. MISSING 81.8 2,411 -3 MISSING ----- ----- ----- 100.0 100.0 2,947 cases Data type: numeric Missing-data codes: lowest thru -1 Columns: 1011-1012
J45 OTHER FACTOR IN ATTEMPTED SUICIDE
Were there other significant factors or causes toward your attempting suicide? PCT PCT N VALUE LABEL VALID ALL 100.0 0.2 6 1 YES 18.0 530 -9 PATRON:LOGIC. MISSING 81.8 2,411 -3 MISSING ----- ----- ----- 100.0 100.0 2,947 cases Data type: numeric Missing-data codes: lowest thru -1 Columns: 1013-1014
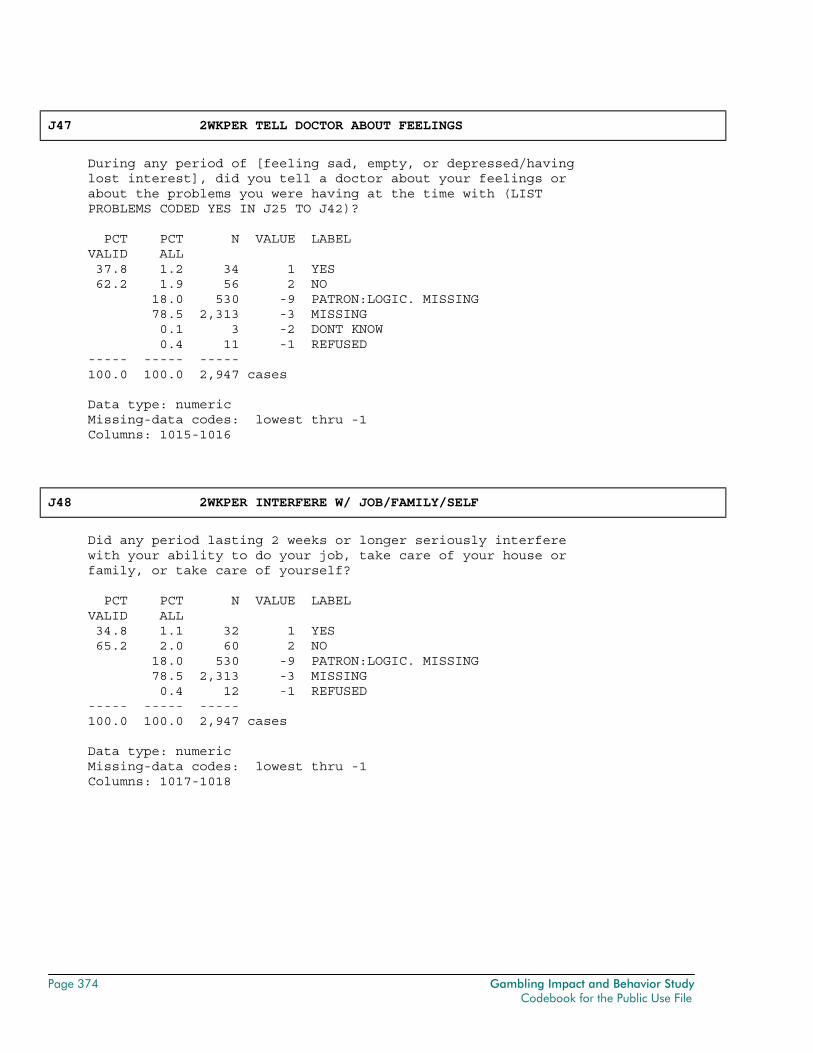
Page 374 Gambling Impact and Behavior Study Codebook for the Public Use File
J47 2WKPER TELL DOCTOR ABOUT FEELINGS
During any period of [feeling sad, empty, or depressed/having lost interest], did you tell a doctor about your feelings or about the problems you were having at the time with (LIST PROBLEMS CODED YES IN J25 TO J42)? PCT PCT N VALUE LABEL VALID ALL 37.8 1.2 34 1 YES 62.2 1.9 56 2 NO 18.0 530 -9 PATRON:LOGIC. MISSING 78.5 2,313 -3 MISSING 0.1 3 -2 DONT KNOW 0.4 11 -1 REFUSED ----- ----- ----- 100.0 100.0 2,947 cases Data type: numeric Missing-data codes: lowest thru -1 Columns: 1015-1016
J48 2WKPER INTERFERE W/ JOB/FAMILY/SELF
Did any period lasting 2 weeks or longer seriously interfere with your ability to do your job, take care of your house or family, or take care of yourself? PCT PCT N VALUE LABEL VALID ALL 34.8 1.1 32 1 YES 65.2 2.0 60 2 NO 18.0 530 -9 PATRON:LOGIC. MISSING 78.5 2,313 -3 MISSING 0.4 12 -1 REFUSED ----- ----- ----- 100.0 100.0 2,947 cases Data type: numeric Missing-data codes: lowest thru -1 Columns: 1017-1018
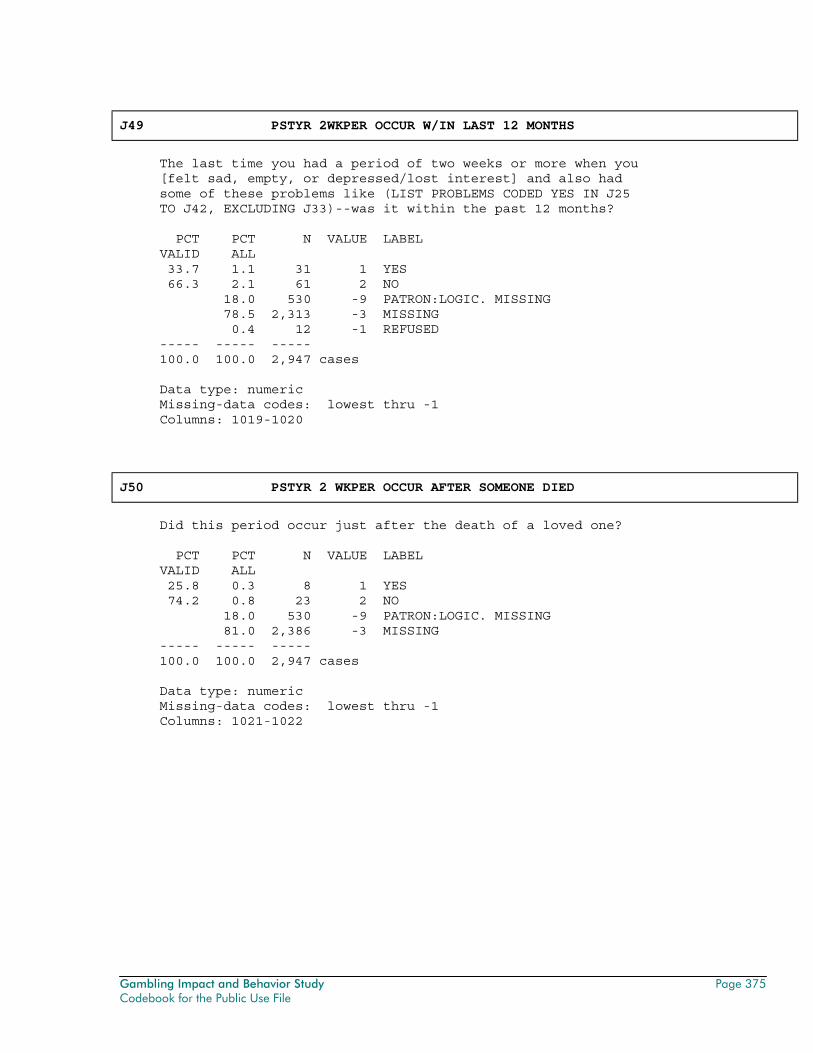
Gambling Impact and Behavior Study Page 375 Codebook for the Public Use File
J49 PSTYR 2WKPER OCCUR W/IN LAST 12 MONTHS
The last time you had a period of two weeks or more when you [felt sad, empty, or depressed/lost interest] and also had some of these problems like (LIST PROBLEMS CODED YES IN J25 TO J42, EXCLUDING J33)--was it within the past 12 months? PCT PCT N VALUE LABEL VALID ALL 33.7 1.1 31 1 YES 66.3 2.1 61 2 NO 18.0 530 -9 PATRON:LOGIC. MISSING 78.5 2,313 -3 MISSING 0.4 12 -1 REFUSED ----- ----- ----- 100.0 100.0 2,947 cases Data type: numeric Missing-data codes: lowest thru -1 Columns: 1019-1020
J50 PSTYR 2 WKPER OCCUR AFTER SOMEONE DIED
Did this period occur just after the death of a loved one? PCT PCT N VALUE LABEL VALID ALL 25.8 0.3 8 1 YES 74.2 0.8 23 2 NO 18.0 530 -9 PATRON:LOGIC. MISSING 81.0 2,386 -3 MISSING ----- ----- ----- 100.0 100.0 2,947 cases Data type: numeric Missing-data codes: lowest thru -1 Columns: 1021-1022
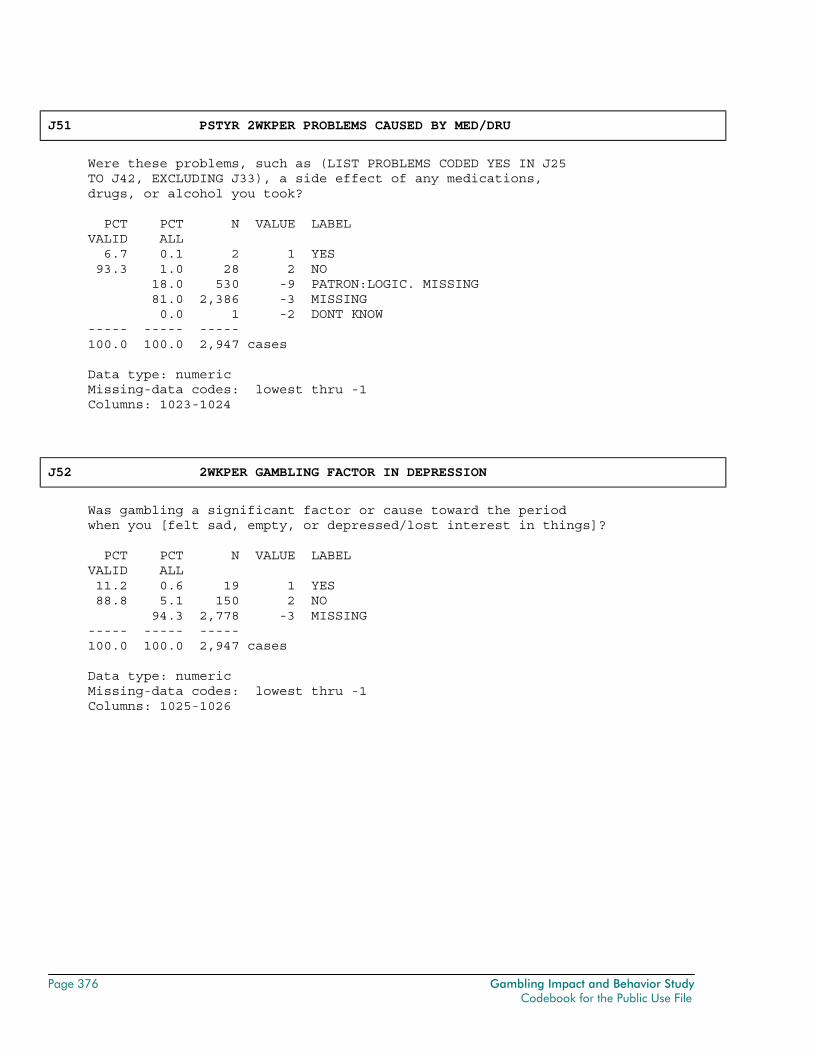
Page 376 Gambling Impact and Behavior Study Codebook for the Public Use File
J51 PSTYR 2WKPER PROBLEMS CAUSED BY MED/DRU
Were these problems, such as (LIST PROBLEMS CODED YES IN J25 TO J42, EXCLUDING J33), a side effect of any medications, drugs, or alcohol you took? PCT PCT N VALUE LABEL VALID ALL 6.7 0.1 2 1 YES 93.3 1.0 28 2 NO 18.0 530 -9 PATRON:LOGIC. MISSING 81.0 2,386 -3 MISSING 0.0 1 -2 DONT KNOW ----- ----- ----- 100.0 100.0 2,947 cases Data type: numeric Missing-data codes: lowest thru -1 Columns: 1023-1024
J52 2WKPER GAMBLING FACTOR IN DEPRESSION
Was gambling a significant factor or cause toward the period when you [felt sad, empty, or depressed/lost interest in things]? PCT PCT N VALUE LABEL VALID ALL 11.2 0.6 19 1 YES 88.8 5.1 150 2 NO 94.3 2,778 -3 MISSING ----- ----- ----- 100.0 100.0 2,947 cases Data type: numeric Missing-data codes: lowest thru -1 Columns: 1025-1026
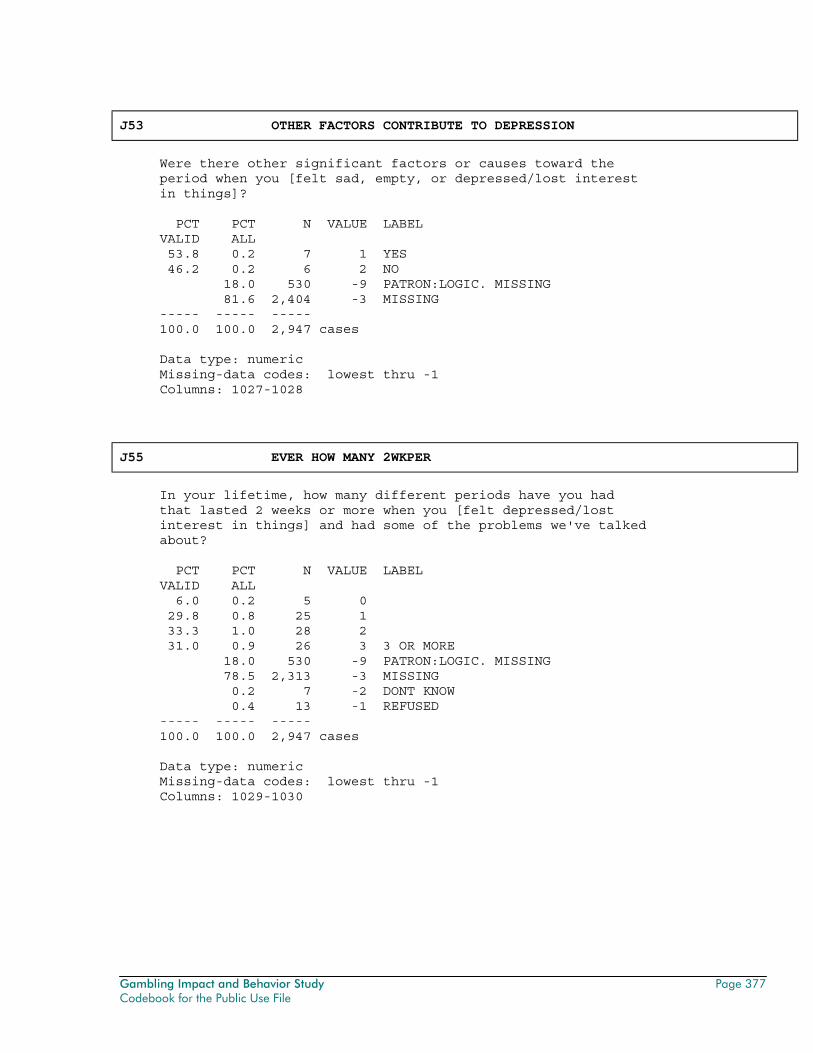
Gambling Impact and Behavior Study Page 377 Codebook for the Public Use File
J53 OTHER FACTORS CONTRIBUTE TO DEPRESSION
Were there other significant factors or causes toward the period when you [felt sad, empty, or depressed/lost interest in things]? PCT PCT N VALUE LABEL VALID ALL 53.8 0.2 7 1 YES 46.2 0.2 6 2 NO 18.0 530 -9 PATRON:LOGIC. MISSING 81.6 2,404 -3 MISSING ----- ----- ----- 100.0 100.0 2,947 cases Data type: numeric Missing-data codes: lowest thru -1 Columns: 1027-1028
J55 EVER HOW MANY 2WKPER
In your lifetime, how many different periods have you had that lasted 2 weeks or more when you [felt depressed/lost interest in things] and had some of the problems we've talked about? PCT PCT N VALUE LABEL VALID ALL 6.0 0.2 5 0 29.8 0.8 25 1 33.3 1.0 28 2 31.0 0.9 26 3 3 OR MORE 18.0 530 -9 PATRON:LOGIC. MISSING 78.5 2,313 -3 MISSING 0.2 7 -2 DONT KNOW 0.4 13 -1 REFUSED ----- ----- ----- 100.0 100.0 2,947 cases Data type: numeric Missing-data codes: lowest thru -1 Columns: 1029-1030
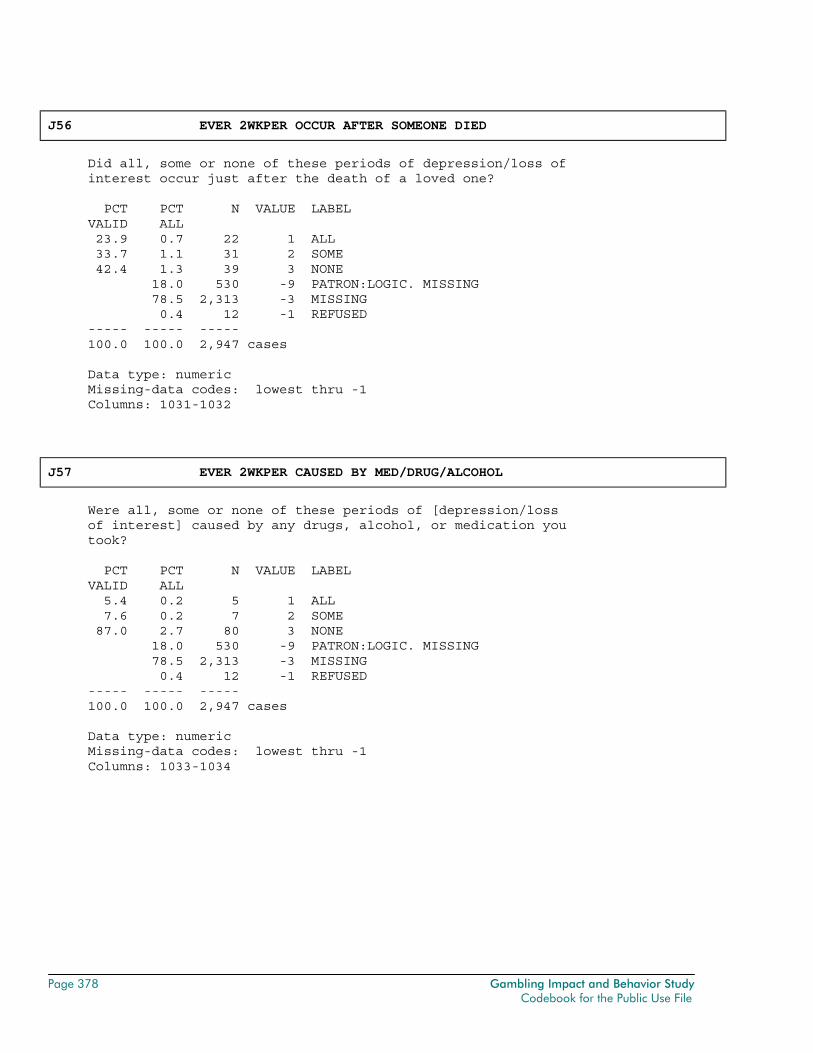
Page 378 Gambling Impact and Behavior Study Codebook for the Public Use File
J56 EVER 2WKPER OCCUR AFTER SOMEONE DIED
Did all, some or none of these periods of depression/loss of interest occur just after the death of a loved one? PCT PCT N VALUE LABEL VALID ALL 23.9 0.7 22 1 ALL 33.7 1.1 31 2 SOME 42.4 1.3 39 3 NONE 18.0 530 -9 PATRON:LOGIC. MISSING 78.5 2,313 -3 MISSING 0.4 12 -1 REFUSED ----- ----- ----- 100.0 100.0 2,947 cases Data type: numeric Missing-data codes: lowest thru -1 Columns: 1031-1032
J57 EVER 2WKPER CAUSED BY MED/DRUG/ALCOHOL
Were all, some or none of these periods of [depression/loss of interest] caused by any drugs, alcohol, or medication you took? PCT PCT N VALUE LABEL VALID ALL 5.4 0.2 5 1 ALL 7.6 0.2 7 2 SOME 87.0 2.7 80 3 NONE 18.0 530 -9 PATRON:LOGIC. MISSING 78.5 2,313 -3 MISSING 0.4 12 -1 REFUSED ----- ----- ----- 100.0 100.0 2,947 cases Data type: numeric Missing-data codes: lowest thru -1 Columns: 1033-1034
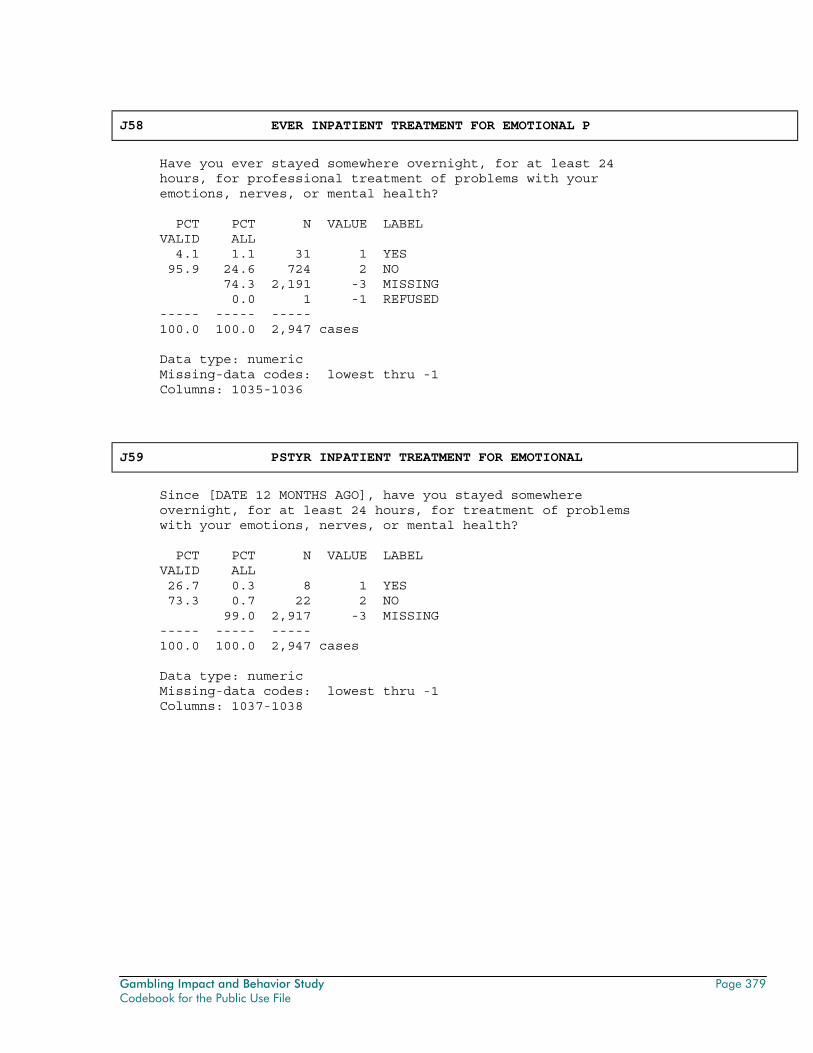
Gambling Impact and Behavior Study Page 379 Codebook for the Public Use File
J58 EVER INPATIENT TREATMENT FOR EMOTIONAL P
Have you ever stayed somewhere overnight, for at least 24 hours, for professional treatment of problems with your emotions, nerves, or mental health? PCT PCT N VALUE LABEL VALID ALL 4.1 1.1 31 1 YES 95.9 24.6 724 2 NO 74.3 2,191 -3 MISSING 0.0 1 -1 REFUSED ----- ----- ----- 100.0 100.0 2,947 cases Data type: numeric Missing-data codes: lowest thru -1 Columns: 1035-1036
J59 PSTYR INPATIENT TREATMENT FOR EMOTIONAL
Since [DATE 12 MONTHS AGO], have you stayed somewhere overnight, for at least 24 hours, for treatment of problems with your emotions, nerves, or mental health? PCT PCT N VALUE LABEL VALID ALL 26.7 0.3 8 1 YES 73.3 0.7 22 2 NO 99.0 2,917 -3 MISSING ----- ----- ----- 100.0 100.0 2,947 cases Data type: numeric Missing-data codes: lowest thru -1 Columns: 1037-1038
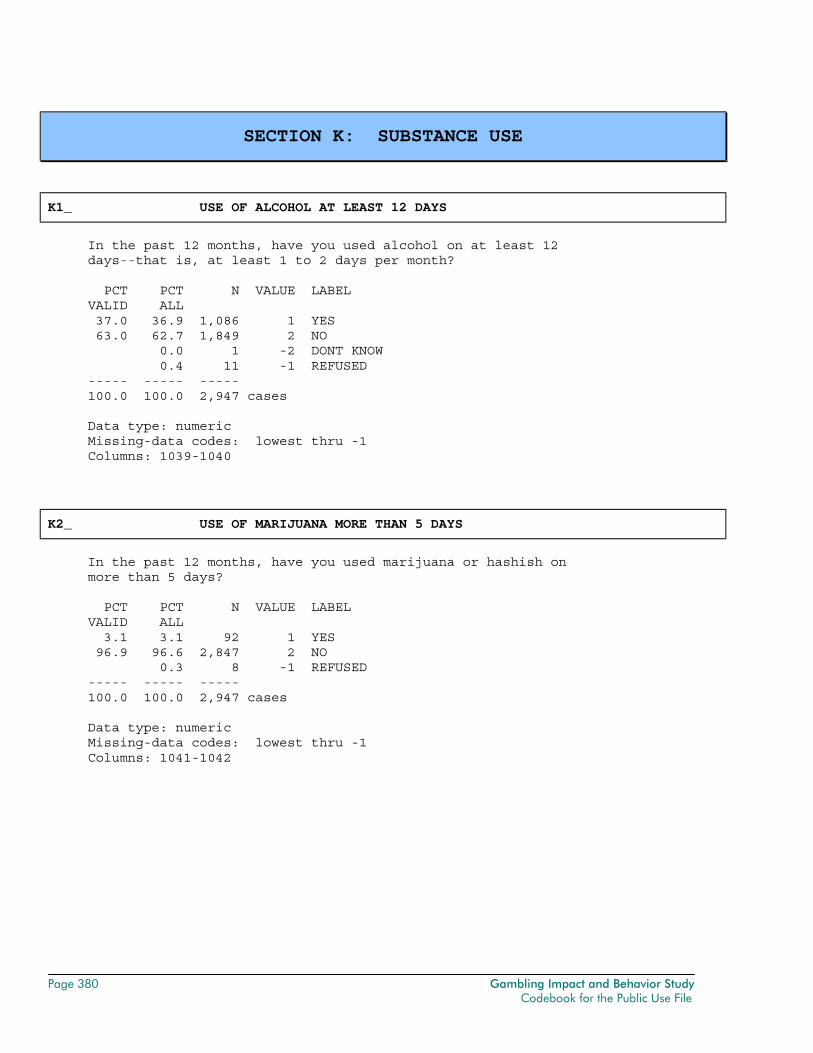
Page 380 Gambling Impact and Behavior Study Codebook for the Public Use File
SECTION K: SUBSTANCE USE
K1_ USE OF ALCOHOL AT LEAST 12 DAYS
In the past 12 months, have you used alcohol on at least 12 days--that is, at least 1 to 2 days per month? PCT PCT N VALUE LABEL VALID ALL 37.0 36.9 1,086 1 YES 63.0 62.7 1,849 2 NO 0.0 1 -2 DONT KNOW 0.4 11 -1 REFUSED ----- ----- ----- 100.0 100.0 2,947 cases Data type: numeric Missing-data codes: lowest thru -1 Columns: 1039-1040
K2_ USE OF MARIJUANA MORE THAN 5 DAYS
In the past 12 months, have you used marijuana or hashish on more than 5 days? PCT PCT N VALUE LABEL VALID ALL 3.1 3.1 92 1 YES 96.9 96.6 2,847 2 NO 0.3 8 -1 REFUSED ----- ----- ----- 100.0 100.0 2,947 cases Data type: numeric Missing-data codes: lowest thru -1 Columns: 1041-1042
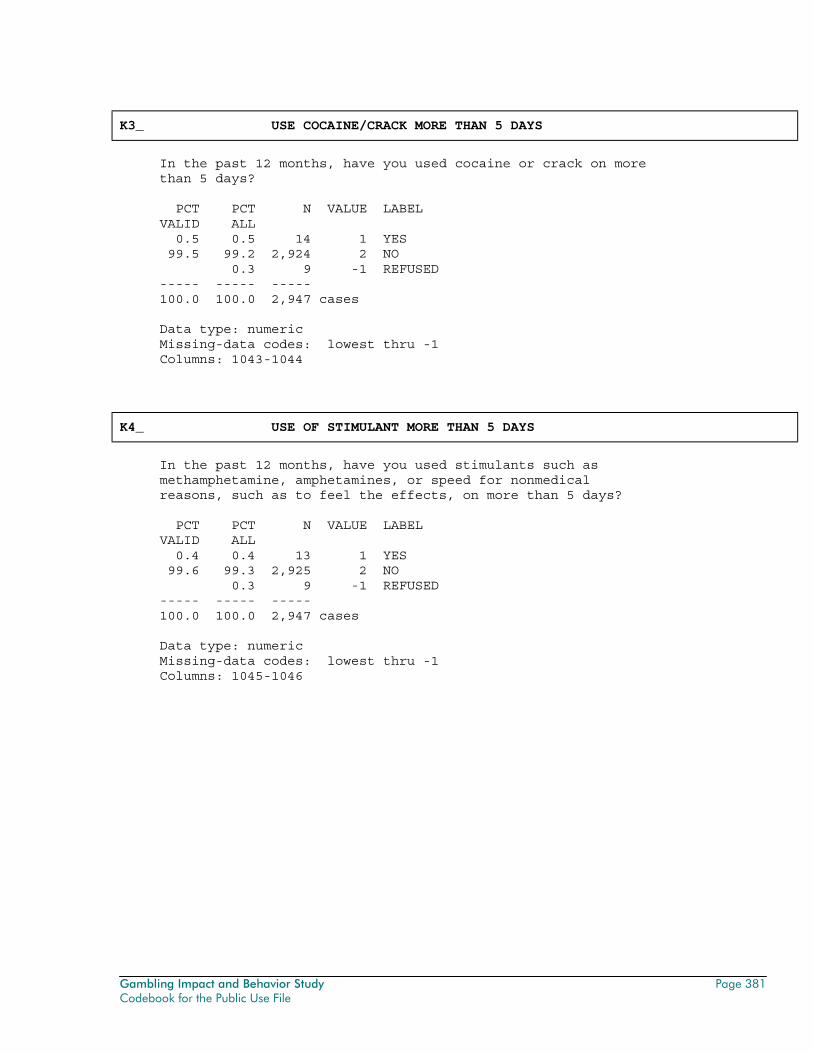
Gambling Impact and Behavior Study Page 381 Codebook for the Public Use File
K3_ USE COCAINE/CRACK MORE THAN 5 DAYS
In the past 12 months, have you used cocaine or crack on more than 5 days? PCT PCT N VALUE LABEL VALID ALL 0.5 0.5 14 1 YES 99.5 99.2 2,924 2 NO 0.3 9 -1 REFUSED ----- ----- ----- 100.0 100.0 2,947 cases Data type: numeric Missing-data codes: lowest thru -1 Columns: 1043-1044
K4_ USE OF STIMULANT MORE THAN 5 DAYS
In the past 12 months, have you used stimulants such as methamphetamine, amphetamines, or speed for nonmedical reasons, such as to feel the effects, on more than 5 days? PCT PCT N VALUE LABEL VALID ALL 0.4 0.4 13 1 YES 99.6 99.3 2,925 2 NO 0.3 9 -1 REFUSED ----- ----- ----- 100.0 100.0 2,947 cases Data type: numeric Missing-data codes: lowest thru -1 Columns: 1045-1046
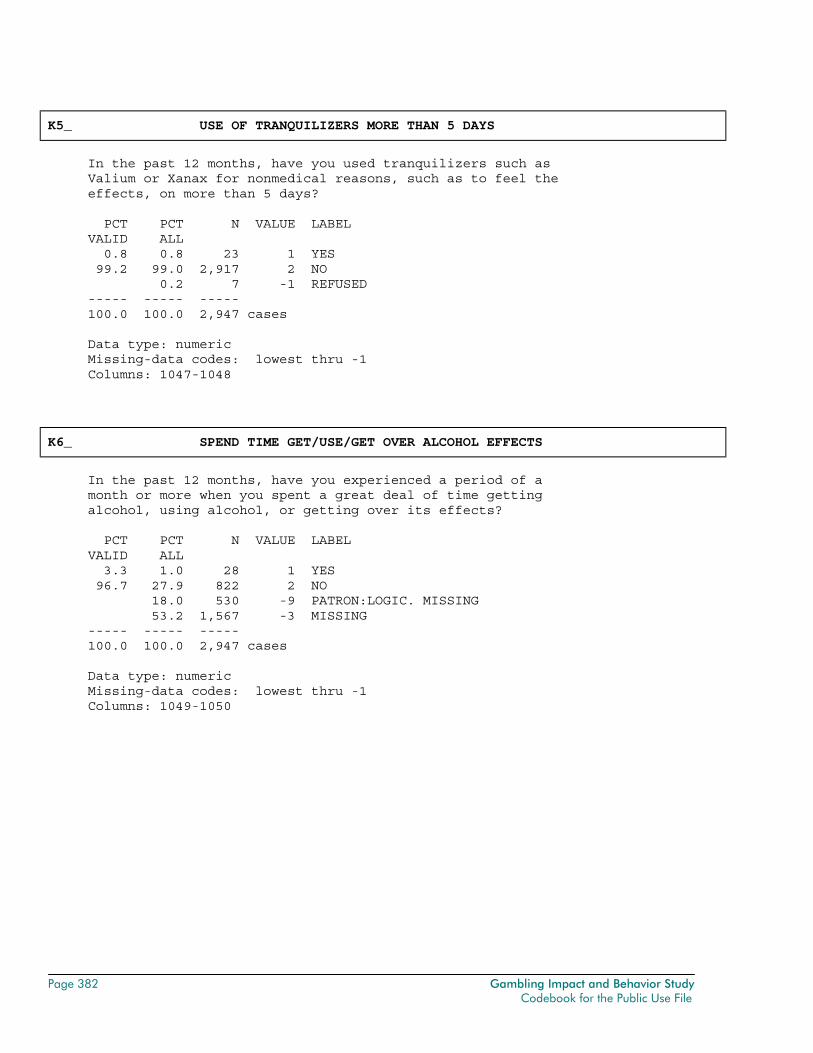
Page 382 Gambling Impact and Behavior Study Codebook for the Public Use File
K5_ USE OF TRANQUILIZERS MORE THAN 5 DAYS
In the past 12 months, have you used tranquilizers such as Valium or Xanax for nonmedical reasons, such as to feel the effects, on more than 5 days? PCT PCT N VALUE LABEL VALID ALL 0.8 0.8 23 1 YES 99.2 99.0 2,917 2 NO 0.2 7 -1 REFUSED ----- ----- ----- 100.0 100.0 2,947 cases Data type: numeric Missing-data codes: lowest thru -1 Columns: 1047-1048
K6_ SPEND TIME GET/USE/GET OVER ALCOHOL EFFECTS
In the past 12 months, have you experienced a period of a month or more when you spent a great deal of time getting alcohol, using alcohol, or getting over its effects? PCT PCT N VALUE LABEL VALID ALL 3.3 1.0 28 1 YES 96.7 27.9 822 2 NO 18.0 530 -9 PATRON:LOGIC. MISSING 53.2 1,567 -3 MISSING ----- ----- ----- 100.0 100.0 2,947 cases Data type: numeric Missing-data codes: lowest thru -1 Columns: 1049-1050
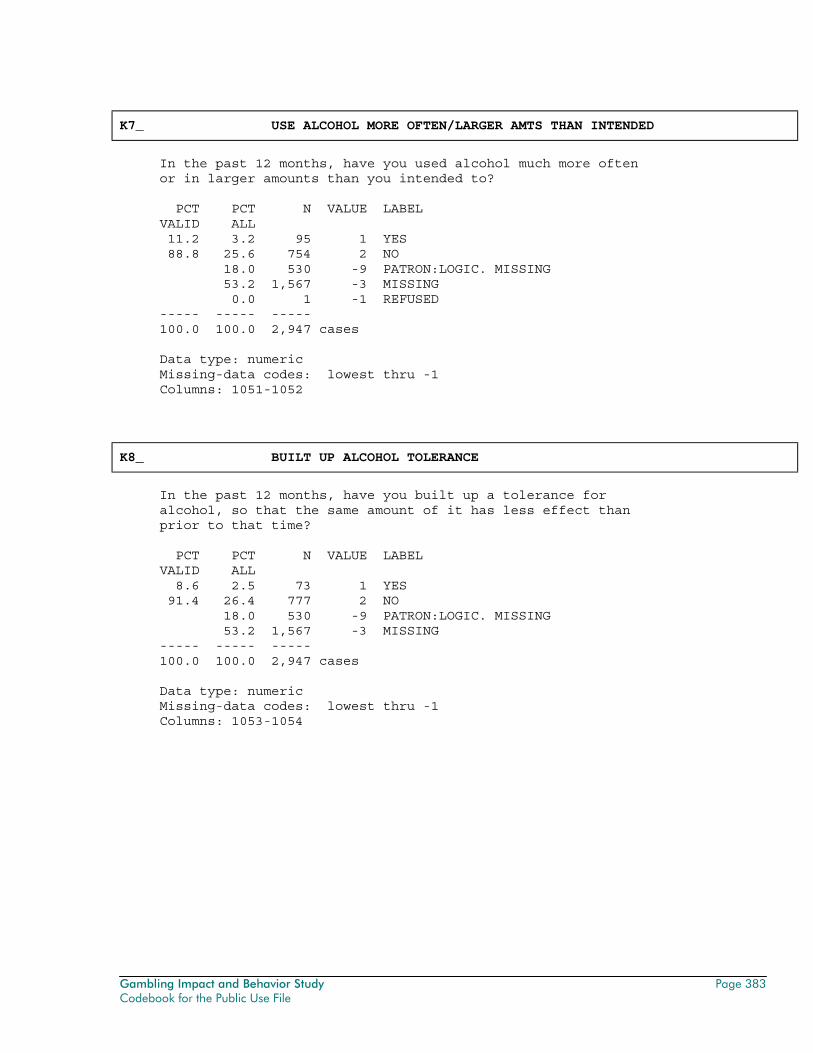
Gambling Impact and Behavior Study Page 383 Codebook for the Public Use File
K7_ USE ALCOHOL MORE OFTEN/LARGER AMTS THAN INTENDED
In the past 12 months, have you used alcohol much more often or in larger amounts than you intended to? PCT PCT N VALUE LABEL VALID ALL 11.2 3.2 95 1 YES 88.8 25.6 754 2 NO 18.0 530 -9 PATRON:LOGIC. MISSING 53.2 1,567 -3 MISSING 0.0 1 -1 REFUSED ----- ----- ----- 100.0 100.0 2,947 cases Data type: numeric Missing-data codes: lowest thru -1 Columns: 1051-1052
K8_ BUILT UP ALCOHOL TOLERANCE
In the past 12 months, have you built up a tolerance for alcohol, so that the same amount of it has less effect than prior to that time? PCT PCT N VALUE LABEL VALID ALL 8.6 2.5 73 1 YES 91.4 26.4 777 2 NO 18.0 530 -9 PATRON:LOGIC. MISSING 53.2 1,567 -3 MISSING ----- ----- ----- 100.0 100.0 2,947 cases Data type: numeric Missing-data codes: lowest thru -1 Columns: 1053-1054
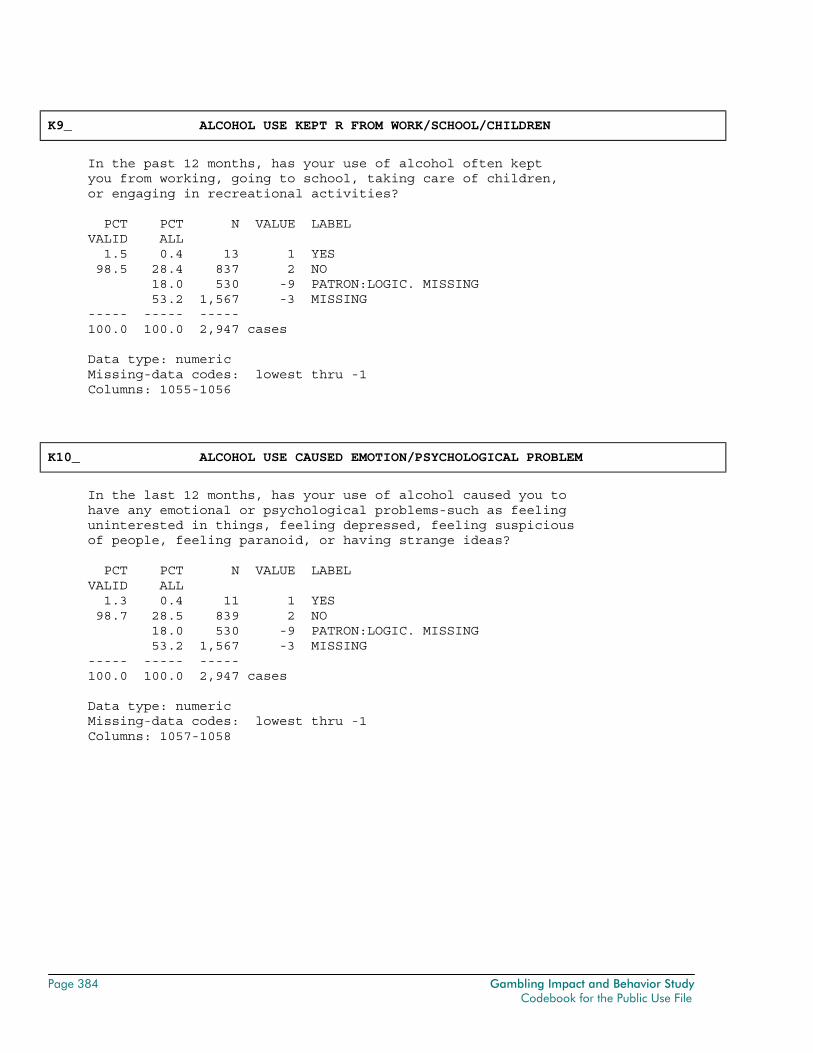
Page 384 Gambling Impact and Behavior Study Codebook for the Public Use File
K9_ ALCOHOL USE KEPT R FROM WORK/SCHOOL/CHILDREN
In the past 12 months, has your use of alcohol often kept you from working, going to school, taking care of children, or engaging in recreational activities? PCT PCT N VALUE LABEL VALID ALL 1.5 0.4 13 1 YES 98.5 28.4 837 2 NO 18.0 530 -9 PATRON:LOGIC. MISSING 53.2 1,567 -3 MISSING ----- ----- ----- 100.0 100.0 2,947 cases Data type: numeric Missing-data codes: lowest thru -1 Columns: 1055-1056
K10_ ALCOHOL USE CAUSED EMOTION/PSYCHOLOGICAL PROBLEM
In the last 12 months, has your use of alcohol caused you to have any emotional or psychological problems-such as feeling uninterested in things, feeling depressed, feeling suspicious of people, feeling paranoid, or having strange ideas? PCT PCT N VALUE LABEL VALID ALL 1.3 0.4 11 1 YES 98.7 28.5 839 2 NO 18.0 530 -9 PATRON:LOGIC. MISSING 53.2 1,567 -3 MISSING ----- ----- ----- 100.0 100.0 2,947 cases Data type: numeric Missing-data codes: lowest thru -1 Columns: 1057-1058
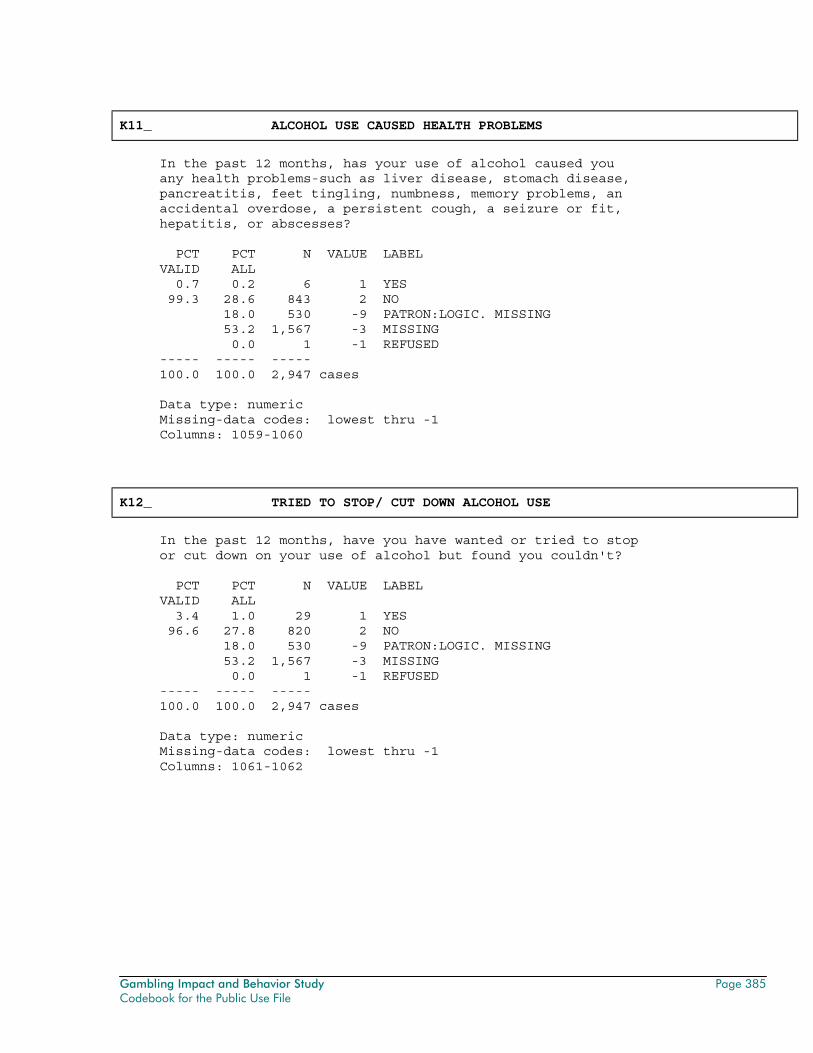
Gambling Impact and Behavior Study Page 385 Codebook for the Public Use File
K11_ ALCOHOL USE CAUSED HEALTH PROBLEMS
In the past 12 months, has your use of alcohol caused you any health problems-such as liver disease, stomach disease, pancreatitis, feet tingling, numbness, memory problems, an accidental overdose, a persistent cough, a seizure or fit, hepatitis, or abscesses? PCT PCT N VALUE LABEL VALID ALL 0.7 0.2 6 1 YES 99.3 28.6 843 2 NO 18.0 530 -9 PATRON:LOGIC. MISSING 53.2 1,567 -3 MISSING 0.0 1 -1 REFUSED ----- ----- ----- 100.0 100.0 2,947 cases Data type: numeric Missing-data codes: lowest thru -1 Columns: 1059-1060
K12_ TRIED TO STOP/ CUT DOWN ALCOHOL USE
In the past 12 months, have you have wanted or tried to stop or cut down on your use of alcohol but found you couldn't? PCT PCT N VALUE LABEL VALID ALL 3.4 1.0 29 1 YES 96.6 27.8 820 2 NO 18.0 530 -9 PATRON:LOGIC. MISSING 53.2 1,567 -3 MISSING 0.0 1 -1 REFUSED ----- ----- ----- 100.0 100.0 2,947 cases Data type: numeric Missing-data codes: lowest thru -1 Columns: 1061-1062
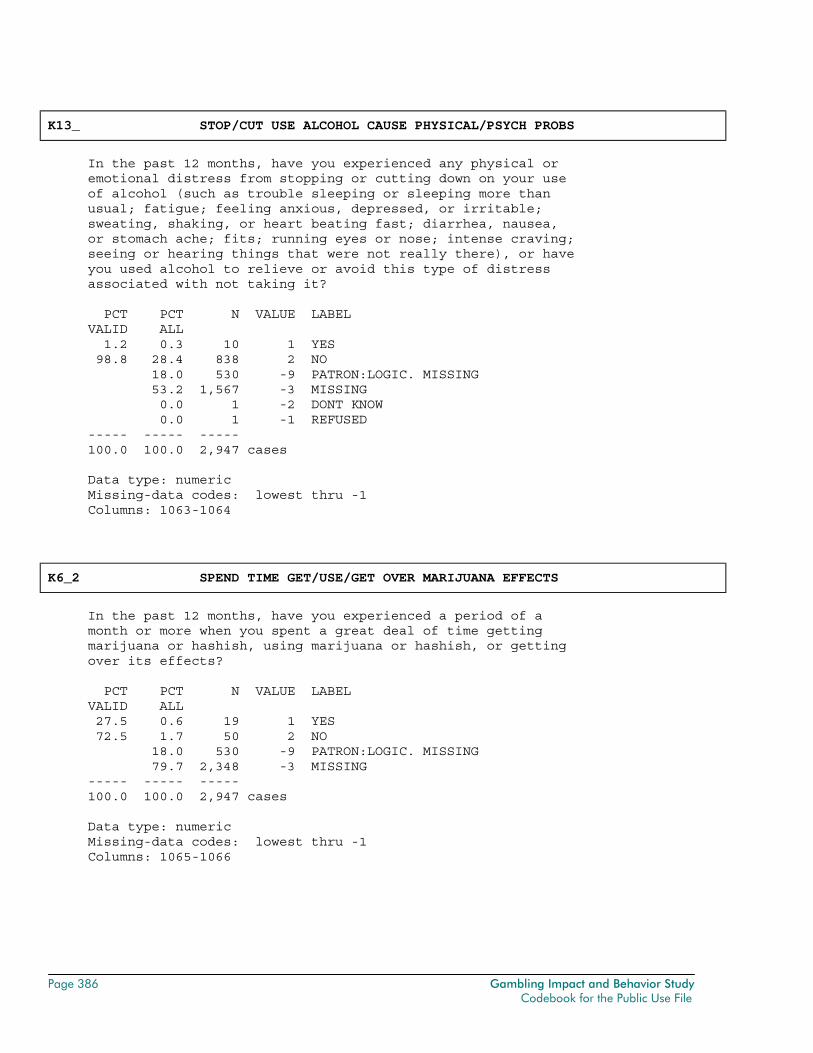
Page 386 Gambling Impact and Behavior Study Codebook for the Public Use File
K13_ STOP/CUT USE ALCOHOL CAUSE PHYSICAL/PSYCH PROBS
In the past 12 months, have you experienced any physical or emotional distress from stopping or cutting down on your use of alcohol (such as trouble sleeping or sleeping more than usual; fatigue; feeling anxious, depressed, or irritable; sweating, shaking, or heart beating fast; diarrhea, nausea, or stomach ache; fits; running eyes or nose; intense craving; seeing or hearing things that were not really there), or have you used alcohol to relieve or avoid this type of distress associated with not taking it? PCT PCT N VALUE LABEL VALID ALL 1.2 0.3 10 1 YES 98.8 28.4 838 2 NO 18.0 530 -9 PATRON:LOGIC. MISSING 53.2 1,567 -3 MISSING 0.0 1 -2 DONT KNOW 0.0 1 -1 REFUSED ----- ----- ----- 100.0 100.0 2,947 cases Data type: numeric Missing-data codes: lowest thru -1 Columns: 1063-1064
K6_2 SPEND TIME GET/USE/GET OVER MARIJUANA EFFECTS
In the past 12 months, have you experienced a period of a month or more when you spent a great deal of time getting marijuana or hashish, using marijuana or hashish, or getting over its effects? PCT PCT N VALUE LABEL VALID ALL 27.5 0.6 19 1 YES 72.5 1.7 50 2 NO 18.0 530 -9 PATRON:LOGIC. MISSING 79.7 2,348 -3 MISSING ----- ----- ----- 100.0 100.0 2,947 cases Data type: numeric Missing-data codes: lowest thru -1 Columns: 1065-1066
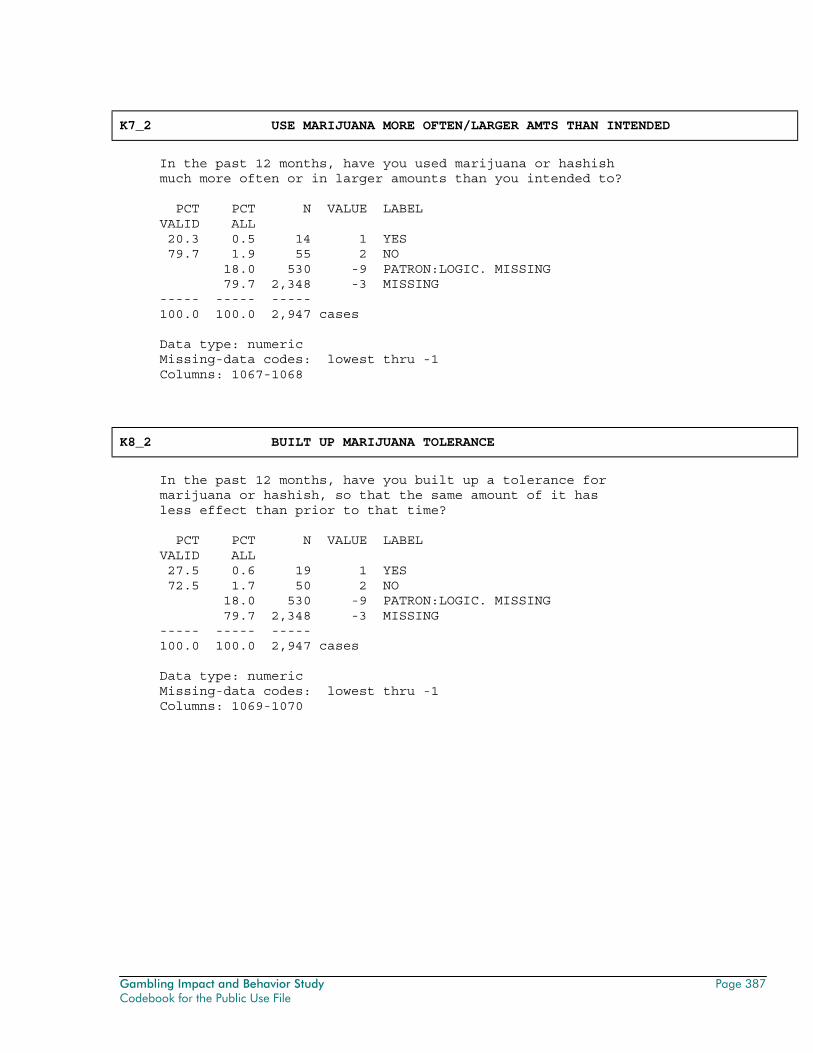
Gambling Impact and Behavior Study Page 387 Codebook for the Public Use File
K7_2 USE MARIJUANA MORE OFTEN/LARGER AMTS THAN INTENDED
In the past 12 months, have you used marijuana or hashish much more often or in larger amounts than you intended to? PCT PCT N VALUE LABEL VALID ALL 20.3 0.5 14 1 YES 79.7 1.9 55 2 NO 18.0 530 -9 PATRON:LOGIC. MISSING 79.7 2,348 -3 MISSING ----- ----- ----- 100.0 100.0 2,947 cases Data type: numeric Missing-data codes: lowest thru -1 Columns: 1067-1068
K8_2 BUILT UP MARIJUANA TOLERANCE
In the past 12 months, have you built up a tolerance for marijuana or hashish, so that the same amount of it has less effect than prior to that time? PCT PCT N VALUE LABEL VALID ALL 27.5 0.6 19 1 YES 72.5 1.7 50 2 NO 18.0 530 -9 PATRON:LOGIC. MISSING 79.7 2,348 -3 MISSING ----- ----- ----- 100.0 100.0 2,947 cases Data type: numeric Missing-data codes: lowest thru -1 Columns: 1069-1070
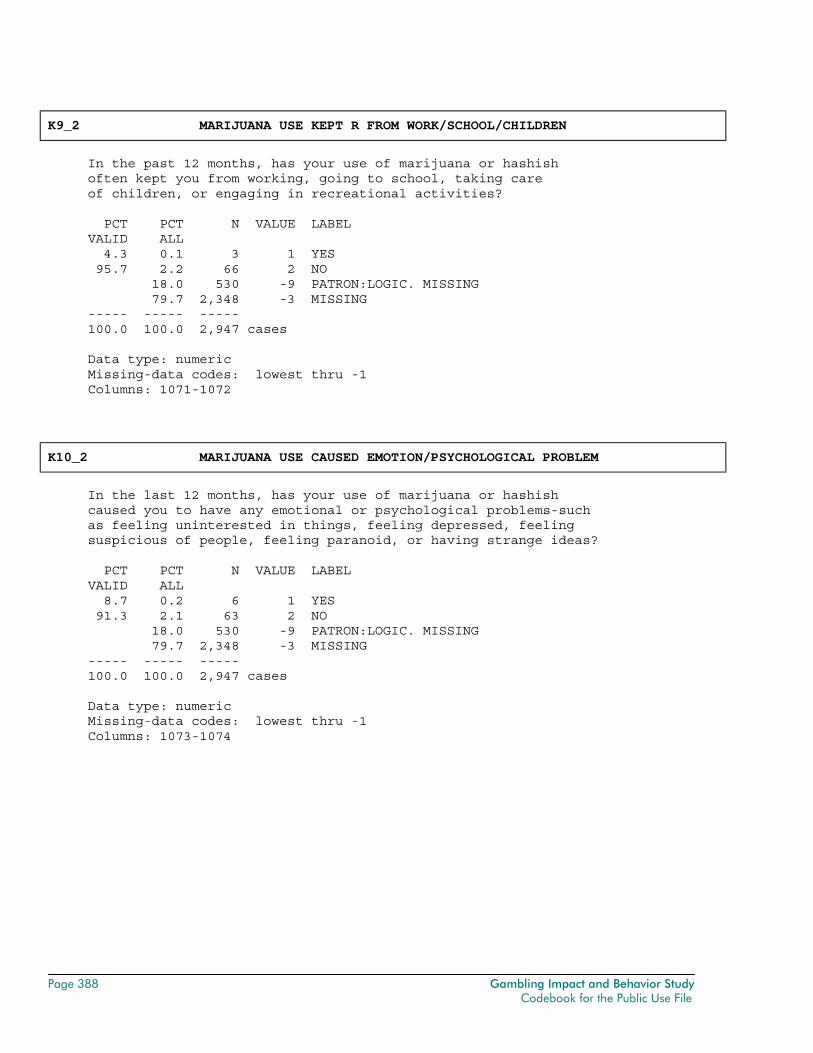
Page 388 Gambling Impact and Behavior Study Codebook for the Public Use File
K9_2 MARIJUANA USE KEPT R FROM WORK/SCHOOL/CHILDREN
In the past 12 months, has your use of marijuana or hashish often kept you from working, going to school, taking care of children, or engaging in recreational activities? PCT PCT N VALUE LABEL VALID ALL 4.3 0.1 3 1 YES 95.7 2.2 66 2 NO 18.0 530 -9 PATRON:LOGIC. MISSING 79.7 2,348 -3 MISSING ----- ----- ----- 100.0 100.0 2,947 cases Data type: numeric Missing-data codes: lowest thru -1 Columns: 1071-1072
K10_2 MARIJUANA USE CAUSED EMOTION/PSYCHOLOGICAL PROBLEM
In the last 12 months, has your use of marijuana or hashish caused you to have any emotional or psychological problems-such as feeling uninterested in things, feeling depressed, feeling suspicious of people, feeling paranoid, or having strange ideas? PCT PCT N VALUE LABEL VALID ALL 8.7 0.2 6 1 YES 91.3 2.1 63 2 NO 18.0 530 -9 PATRON:LOGIC. MISSING 79.7 2,348 -3 MISSING ----- ----- ----- 100.0 100.0 2,947 cases Data type: numeric Missing-data codes: lowest thru -1 Columns: 1073-1074

Gambling Impact and Behavior Study Page 389 Codebook for the Public Use File
K11_2 MARIJUANA USE CAUSED HEALTH PROBLEMS
In the past 12 months, has your use of marijuana or hashish caused you any health problems-such as liver disease, stomach disease, pancreatitis, feet tingling, numbness, memory problems, an accidental overdose, a persistent cough, a seizure or fit, hepatitis, or abscesses? PCT PCT N VALUE LABEL VALID ALL 4.3 0.1 3 1 YES 95.7 2.2 66 2 NO 18.0 530 -9 PATRON:LOGIC. MISSING 79.7 2,348 -3 MISSING ----- ----- ----- 100.0 100.0 2,947 cases Data type: numeric Missing-data codes: lowest thru -1 Columns: 1075-1076
K12_2 TRIED TO STOP/ CUT DOWN MARIJUANA USE
In the past 12 months, have you have wanted or tried to stop or cut down on your use of marijuana or hashish but found you couldn't? PCT PCT N VALUE LABEL VALID ALL 8.7 0.2 6 1 YES 91.3 2.1 63 2 NO 18.0 530 -9 PATRON:LOGIC. MISSING 79.7 2,348 -3 MISSING ----- ----- ----- 100.0 100.0 2,947 cases Data type: numeric Missing-data codes: lowest thru -1 Columns: 1077-1078
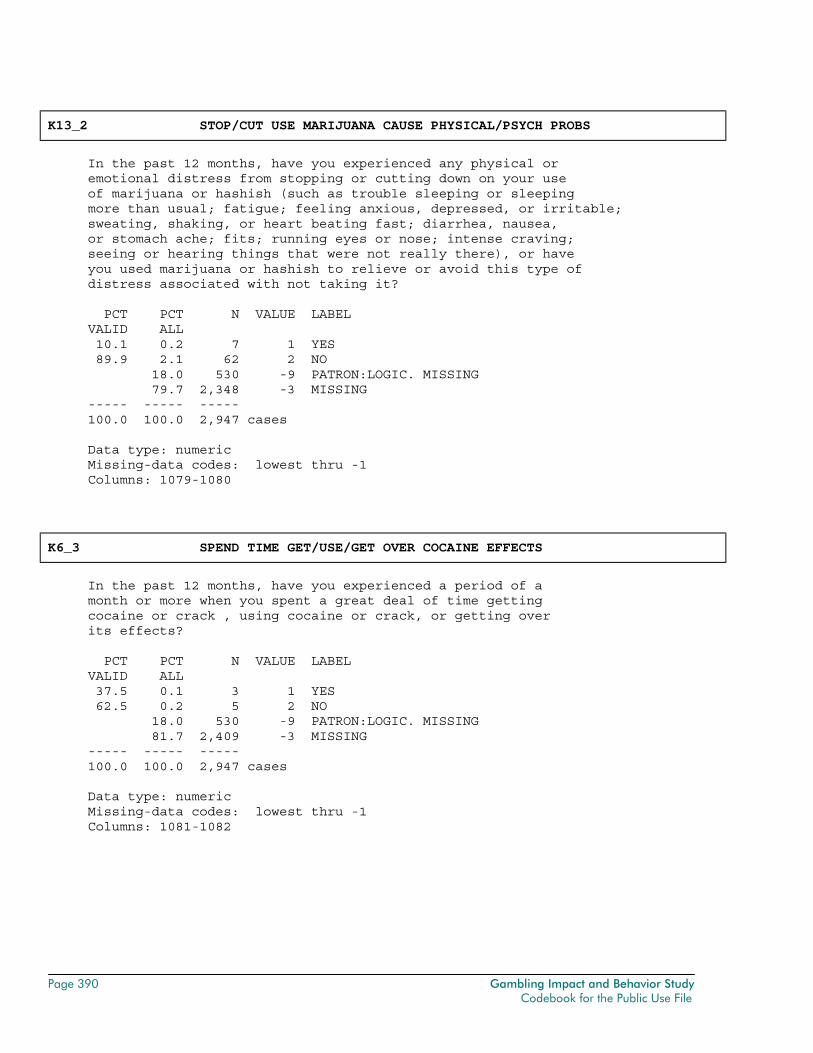
Page 390 Gambling Impact and Behavior Study Codebook for the Public Use File
K13_2 STOP/CUT USE MARIJUANA CAUSE PHYSICAL/PSYCH PROBS
In the past 12 months, have you experienced any physical or emotional distress from stopping or cutting down on your use of marijuana or hashish (such as trouble sleeping or sleeping more than usual; fatigue; feeling anxious, depressed, or irritable; sweating, shaking, or heart beating fast; diarrhea, nausea, or stomach ache; fits; running eyes or nose; intense craving; seeing or hearing things that were not really there), or have you used marijuana or hashish to relieve or avoid this type of distress associated with not taking it? PCT PCT N VALUE LABEL VALID ALL 10.1 0.2 7 1 YES 89.9 2.1 62 2 NO 18.0 530 -9 PATRON:LOGIC. MISSING 79.7 2,348 -3 MISSING ----- ----- ----- 100.0 100.0 2,947 cases Data type: numeric Missing-data codes: lowest thru -1 Columns: 1079-1080
K6_3 SPEND TIME GET/USE/GET OVER COCAINE EFFECTS
In the past 12 months, have you experienced a period of a month or more when you spent a great deal of time getting cocaine or crack , using cocaine or crack, or getting over its effects? PCT PCT N VALUE LABEL VALID ALL 37.5 0.1 3 1 YES 62.5 0.2 5 2 NO 18.0 530 -9 PATRON:LOGIC. MISSING 81.7 2,409 -3 MISSING ----- ----- ----- 100.0 100.0 2,947 cases Data type: numeric Missing-data codes: lowest thru -1 Columns: 1081-1082
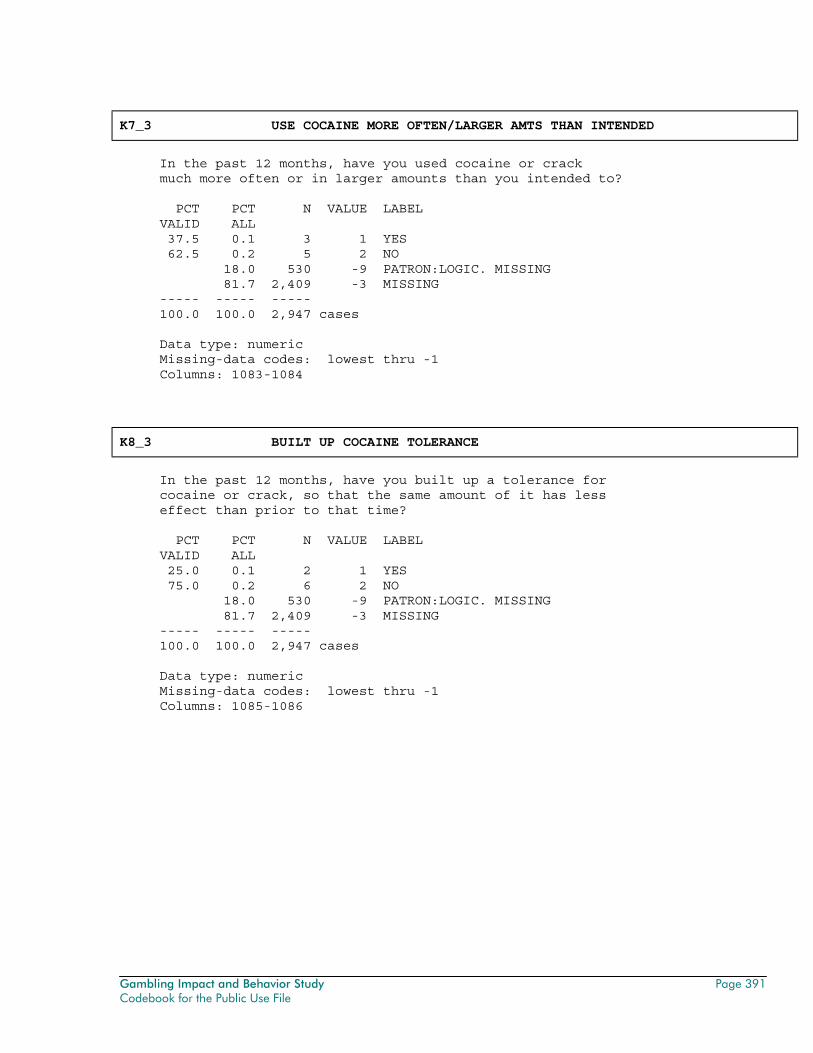
Gambling Impact and Behavior Study Page 391 Codebook for the Public Use File
K7_3 USE COCAINE MORE OFTEN/LARGER AMTS THAN INTENDED
In the past 12 months, have you used cocaine or crack much more often or in larger amounts than you intended to? PCT PCT N VALUE LABEL VALID ALL 37.5 0.1 3 1 YES 62.5 0.2 5 2 NO 18.0 530 -9 PATRON:LOGIC. MISSING 81.7 2,409 -3 MISSING ----- ----- ----- 100.0 100.0 2,947 cases Data type: numeric Missing-data codes: lowest thru -1 Columns: 1083-1084
K8_3 BUILT UP COCAINE TOLERANCE
In the past 12 months, have you built up a tolerance for cocaine or crack, so that the same amount of it has less effect than prior to that time? PCT PCT N VALUE LABEL VALID ALL 25.0 0.1 2 1 YES 75.0 0.2 6 2 NO 18.0 530 -9 PATRON:LOGIC. MISSING 81.7 2,409 -3 MISSING ----- ----- ----- 100.0 100.0 2,947 cases Data type: numeric Missing-data codes: lowest thru -1 Columns: 1085-1086
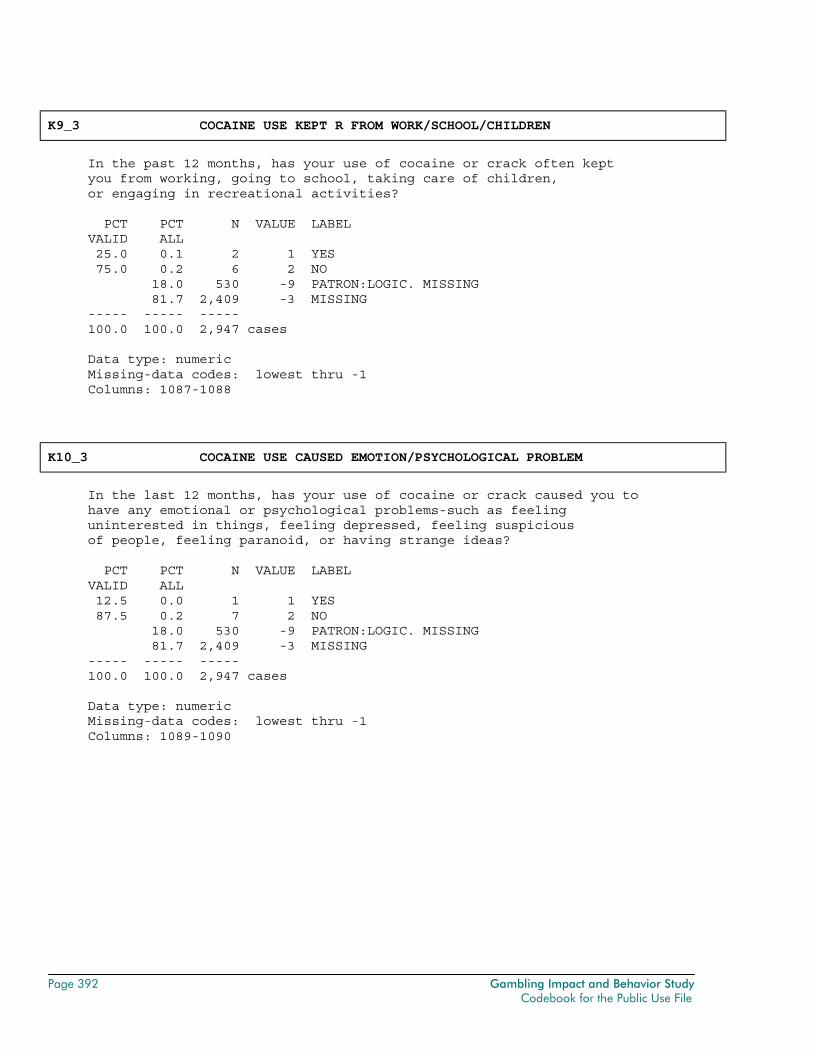
Page 392 Gambling Impact and Behavior Study Codebook for the Public Use File
K9_3 COCAINE USE KEPT R FROM WORK/SCHOOL/CHILDREN
In the past 12 months, has your use of cocaine or crack often kept you from working, going to school, taking care of children, or engaging in recreational activities? PCT PCT N VALUE LABEL VALID ALL 25.0 0.1 2 1 YES 75.0 0.2 6 2 NO 18.0 530 -9 PATRON:LOGIC. MISSING 81.7 2,409 -3 MISSING ----- ----- ----- 100.0 100.0 2,947 cases Data type: numeric Missing-data codes: lowest thru -1 Columns: 1087-1088
K10_3 COCAINE USE CAUSED EMOTION/PSYCHOLOGICAL PROBLEM
In the last 12 months, has your use of cocaine or crack caused you to have any emotional or psychological problems-such as feeling uninterested in things, feeling depressed, feeling suspicious of people, feeling paranoid, or having strange ideas? PCT PCT N VALUE LABEL VALID ALL 12.5 0.0 1 1 YES 87.5 0.2 7 2 NO 18.0 530 -9 PATRON:LOGIC. MISSING 81.7 2,409 -3 MISSING ----- ----- ----- 100.0 100.0 2,947 cases Data type: numeric Missing-data codes: lowest thru -1 Columns: 1089-1090
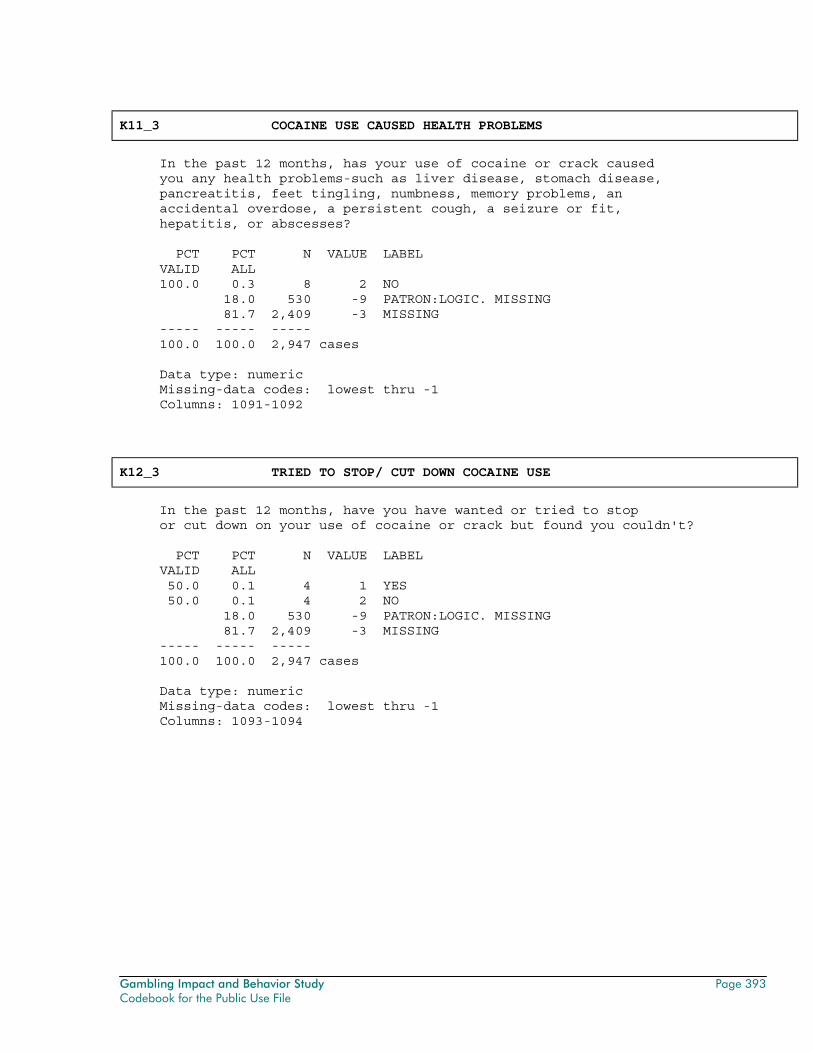
Gambling Impact and Behavior Study Page 393 Codebook for the Public Use File
K11_3 COCAINE USE CAUSED HEALTH PROBLEMS
In the past 12 months, has your use of cocaine or crack caused you any health problems-such as liver disease, stomach disease, pancreatitis, feet tingling, numbness, memory problems, an accidental overdose, a persistent cough, a seizure or fit, hepatitis, or abscesses? PCT PCT N VALUE LABEL VALID ALL 100.0 0.3 8 2 NO 18.0 530 -9 PATRON:LOGIC. MISSING 81.7 2,409 -3 MISSING ----- ----- ----- 100.0 100.0 2,947 cases Data type: numeric Missing-data codes: lowest thru -1 Columns: 1091-1092
K12_3 TRIED TO STOP/ CUT DOWN COCAINE USE
In the past 12 months, have you have wanted or tried to stop or cut down on your use of cocaine or crack but found you couldn't? PCT PCT N VALUE LABEL VALID ALL 50.0 0.1 4 1 YES 50.0 0.1 4 2 NO 18.0 530 -9 PATRON:LOGIC. MISSING 81.7 2,409 -3 MISSING ----- ----- ----- 100.0 100.0 2,947 cases Data type: numeric Missing-data codes: lowest thru -1 Columns: 1093-1094
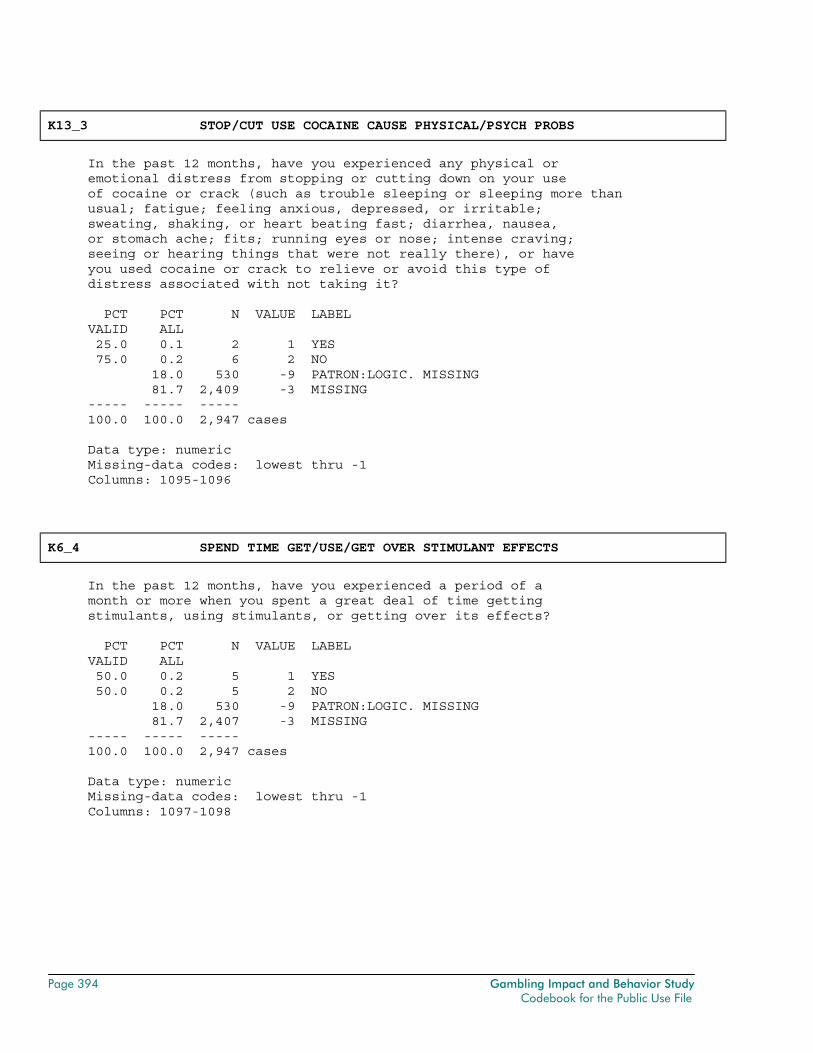
Page 394 Gambling Impact and Behavior Study Codebook for the Public Use File
K13_3 STOP/CUT USE COCAINE CAUSE PHYSICAL/PSYCH PROBS
In the past 12 months, have you experienced any physical or emotional distress from stopping or cutting down on your use of cocaine or crack (such as trouble sleeping or sleeping more than usual; fatigue; feeling anxious, depressed, or irritable; sweating, shaking, or heart beating fast; diarrhea, nausea, or stomach ache; fits; running eyes or nose; intense craving; seeing or hearing things that were not really there), or have you used cocaine or crack to relieve or avoid this type of distress associated with not taking it? PCT PCT N VALUE LABEL VALID ALL 25.0 0.1 2 1 YES 75.0 0.2 6 2 NO 18.0 530 -9 PATRON:LOGIC. MISSING 81.7 2,409 -3 MISSING ----- ----- ----- 100.0 100.0 2,947 cases Data type: numeric Missing-data codes: lowest thru -1 Columns: 1095-1096
K6_4 SPEND TIME GET/USE/GET OVER STIMULANT EFFECTS
In the past 12 months, have you experienced a period of a month or more when you spent a great deal of time getting stimulants, using stimulants, or getting over its effects? PCT PCT N VALUE LABEL VALID ALL 50.0 0.2 5 1 YES 50.0 0.2 5 2 NO 18.0 530 -9 PATRON:LOGIC. MISSING 81.7 2,407 -3 MISSING ----- ----- ----- 100.0 100.0 2,947 cases Data type: numeric Missing-data codes: lowest thru -1 Columns: 1097-1098
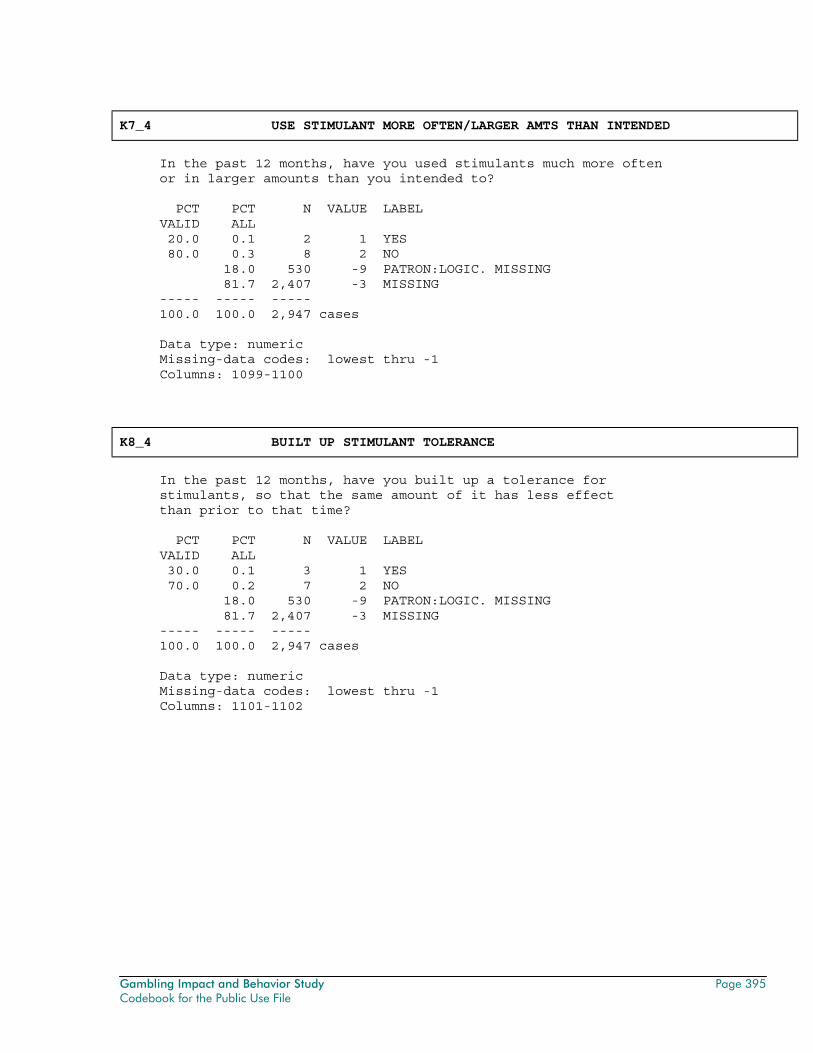
Gambling Impact and Behavior Study Page 395 Codebook for the Public Use File
K7_4 USE STIMULANT MORE OFTEN/LARGER AMTS THAN INTENDED
In the past 12 months, have you used stimulants much more often or in larger amounts than you intended to? PCT PCT N VALUE LABEL VALID ALL 20.0 0.1 2 1 YES 80.0 0.3 8 2 NO 18.0 530 -9 PATRON:LOGIC. MISSING 81.7 2,407 -3 MISSING ----- ----- ----- 100.0 100.0 2,947 cases Data type: numeric Missing-data codes: lowest thru -1 Columns: 1099-1100
K8_4 BUILT UP STIMULANT TOLERANCE
In the past 12 months, have you built up a tolerance for stimulants, so that the same amount of it has less effect than prior to that time? PCT PCT N VALUE LABEL VALID ALL 30.0 0.1 3 1 YES 70.0 0.2 7 2 NO 18.0 530 -9 PATRON:LOGIC. MISSING 81.7 2,407 -3 MISSING ----- ----- ----- 100.0 100.0 2,947 cases Data type: numeric Missing-data codes: lowest thru -1 Columns: 1101-1102
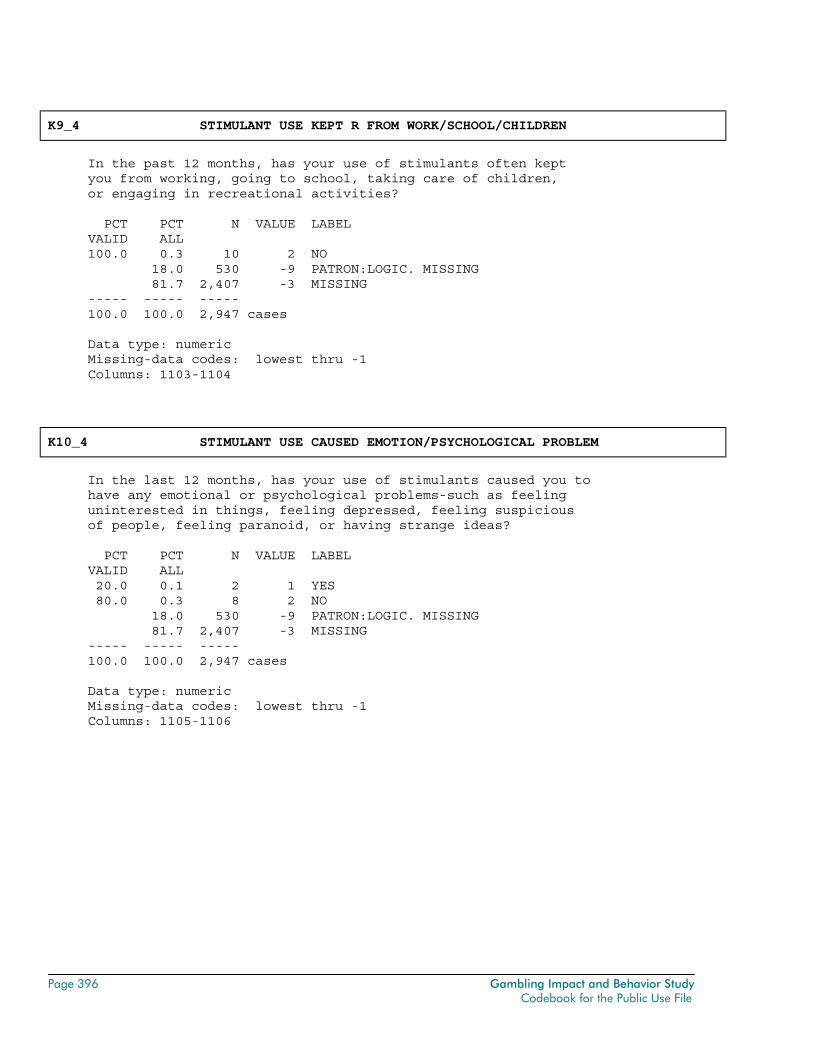
Page 396 Gambling Impact and Behavior Study Codebook for the Public Use File
K9_4 STIMULANT USE KEPT R FROM WORK/SCHOOL/CHILDREN
In the past 12 months, has your use of stimulants often kept you from working, going to school, taking care of children, or engaging in recreational activities? PCT PCT N VALUE LABEL VALID ALL 100.0 0.3 10 2 NO 18.0 530 -9 PATRON:LOGIC. MISSING 81.7 2,407 -3 MISSING ----- ----- ----- 100.0 100.0 2,947 cases Data type: numeric Missing-data codes: lowest thru -1 Columns: 1103-1104
K10_4 STIMULANT USE CAUSED EMOTION/PSYCHOLOGICAL PROBLEM
In the last 12 months, has your use of stimulants caused you to have any emotional or psychological problems-such as feeling uninterested in things, feeling depressed, feeling suspicious of people, feeling paranoid, or having strange ideas? PCT PCT N VALUE LABEL VALID ALL 20.0 0.1 2 1 YES 80.0 0.3 8 2 NO 18.0 530 -9 PATRON:LOGIC. MISSING 81.7 2,407 -3 MISSING ----- ----- ----- 100.0 100.0 2,947 cases Data type: numeric Missing-data codes: lowest thru -1 Columns: 1105-1106
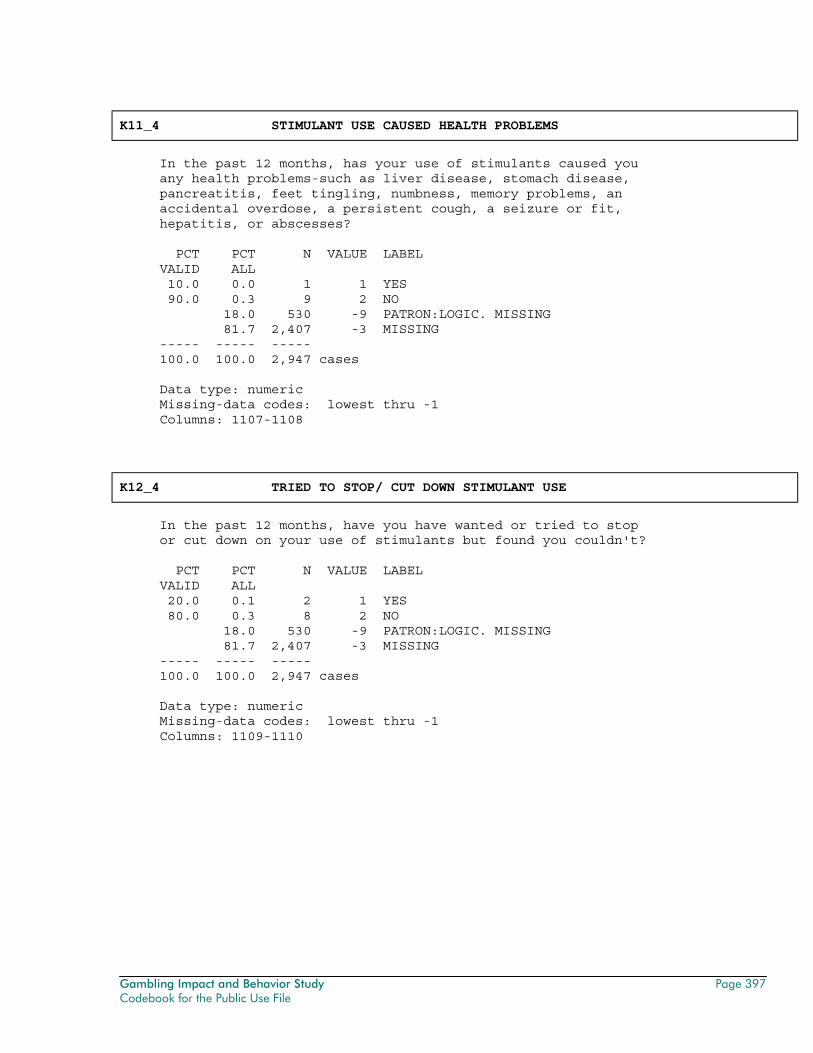
Gambling Impact and Behavior Study Page 397 Codebook for the Public Use File
K11_4 STIMULANT USE CAUSED HEALTH PROBLEMS
In the past 12 months, has your use of stimulants caused you any health problems-such as liver disease, stomach disease, pancreatitis, feet tingling, numbness, memory problems, an accidental overdose, a persistent cough, a seizure or fit, hepatitis, or abscesses? PCT PCT N VALUE LABEL VALID ALL 10.0 0.0 1 1 YES 90.0 0.3 9 2 NO 18.0 530 -9 PATRON:LOGIC. MISSING 81.7 2,407 -3 MISSING ----- ----- ----- 100.0 100.0 2,947 cases Data type: numeric Missing-data codes: lowest thru -1 Columns: 1107-1108
K12_4 TRIED TO STOP/ CUT DOWN STIMULANT USE
In the past 12 months, have you have wanted or tried to stop or cut down on your use of stimulants but found you couldn't? PCT PCT N VALUE LABEL VALID ALL 20.0 0.1 2 1 YES 80.0 0.3 8 2 NO 18.0 530 -9 PATRON:LOGIC. MISSING 81.7 2,407 -3 MISSING ----- ----- ----- 100.0 100.0 2,947 cases Data type: numeric Missing-data codes: lowest thru -1 Columns: 1109-1110
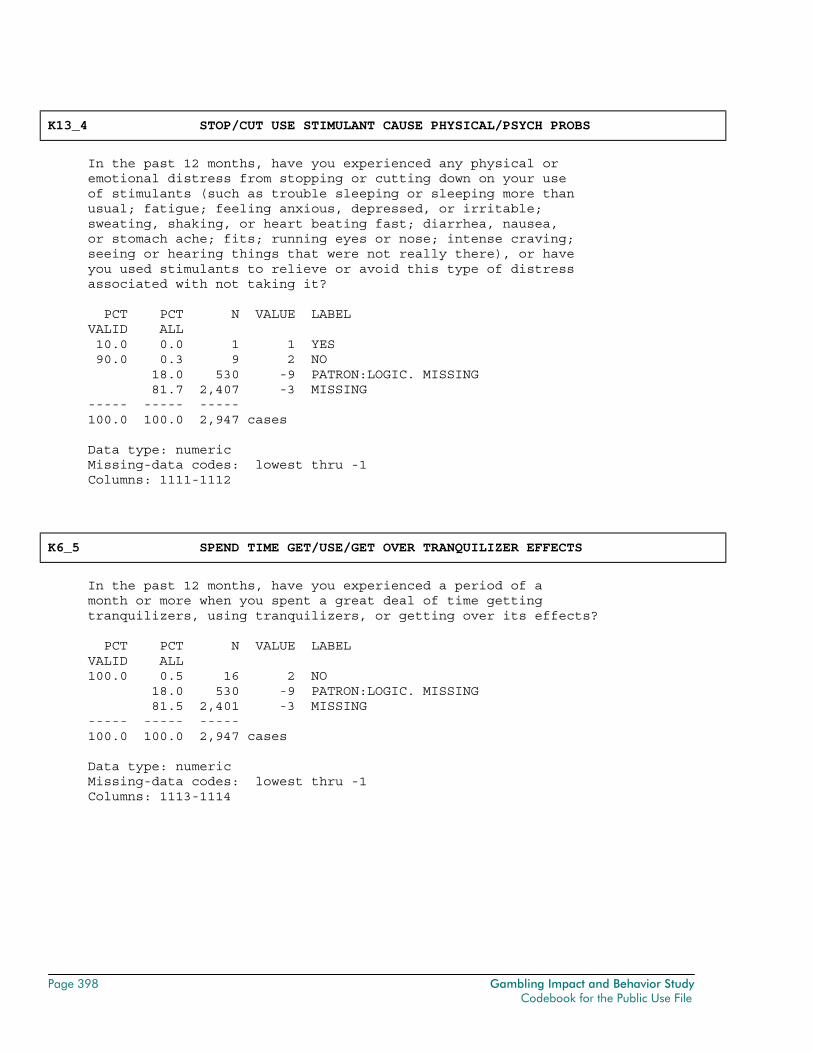
Page 398 Gambling Impact and Behavior Study Codebook for the Public Use File
K13_4 STOP/CUT USE STIMULANT CAUSE PHYSICAL/PSYCH PROBS
In the past 12 months, have you experienced any physical or emotional distress from stopping or cutting down on your use of stimulants (such as trouble sleeping or sleeping more than usual; fatigue; feeling anxious, depressed, or irritable; sweating, shaking, or heart beating fast; diarrhea, nausea, or stomach ache; fits; running eyes or nose; intense craving; seeing or hearing things that were not really there), or have you used stimulants to relieve or avoid this type of distress associated with not taking it? PCT PCT N VALUE LABEL VALID ALL 10.0 0.0 1 1 YES 90.0 0.3 9 2 NO 18.0 530 -9 PATRON:LOGIC. MISSING 81.7 2,407 -3 MISSING ----- ----- ----- 100.0 100.0 2,947 cases Data type: numeric Missing-data codes: lowest thru -1 Columns: 1111-1112
K6_5 SPEND TIME GET/USE/GET OVER TRANQUILIZER EFFECTS
In the past 12 months, have you experienced a period of a month or more when you spent a great deal of time getting tranquilizers, using tranquilizers, or getting over its effects? PCT PCT N VALUE LABEL VALID ALL 100.0 0.5 16 2 NO 18.0 530 -9 PATRON:LOGIC. MISSING 81.5 2,401 -3 MISSING ----- ----- ----- 100.0 100.0 2,947 cases Data type: numeric Missing-data codes: lowest thru -1 Columns: 1113-1114
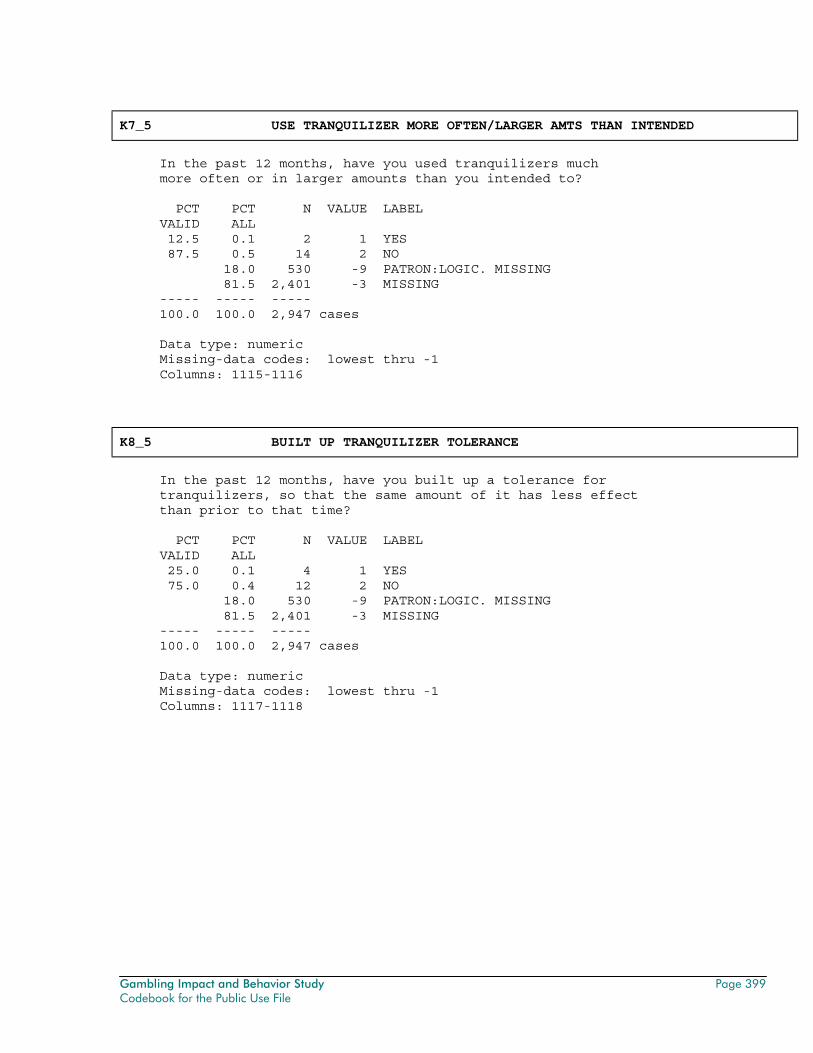
Gambling Impact and Behavior Study Page 399 Codebook for the Public Use File
K7_5 USE TRANQUILIZER MORE OFTEN/LARGER AMTS THAN INTENDED
In the past 12 months, have you used tranquilizers much more often or in larger amounts than you intended to? PCT PCT N VALUE LABEL VALID ALL 12.5 0.1 2 1 YES 87.5 0.5 14 2 NO 18.0 530 -9 PATRON:LOGIC. MISSING 81.5 2,401 -3 MISSING ----- ----- ----- 100.0 100.0 2,947 cases Data type: numeric Missing-data codes: lowest thru -1 Columns: 1115-1116
K8_5 BUILT UP TRANQUILIZER TOLERANCE
In the past 12 months, have you built up a tolerance for tranquilizers, so that the same amount of it has less effect than prior to that time? PCT PCT N VALUE LABEL VALID ALL 25.0 0.1 4 1 YES 75.0 0.4 12 2 NO 18.0 530 -9 PATRON:LOGIC. MISSING 81.5 2,401 -3 MISSING ----- ----- ----- 100.0 100.0 2,947 cases Data type: numeric Missing-data codes: lowest thru -1 Columns: 1117-1118
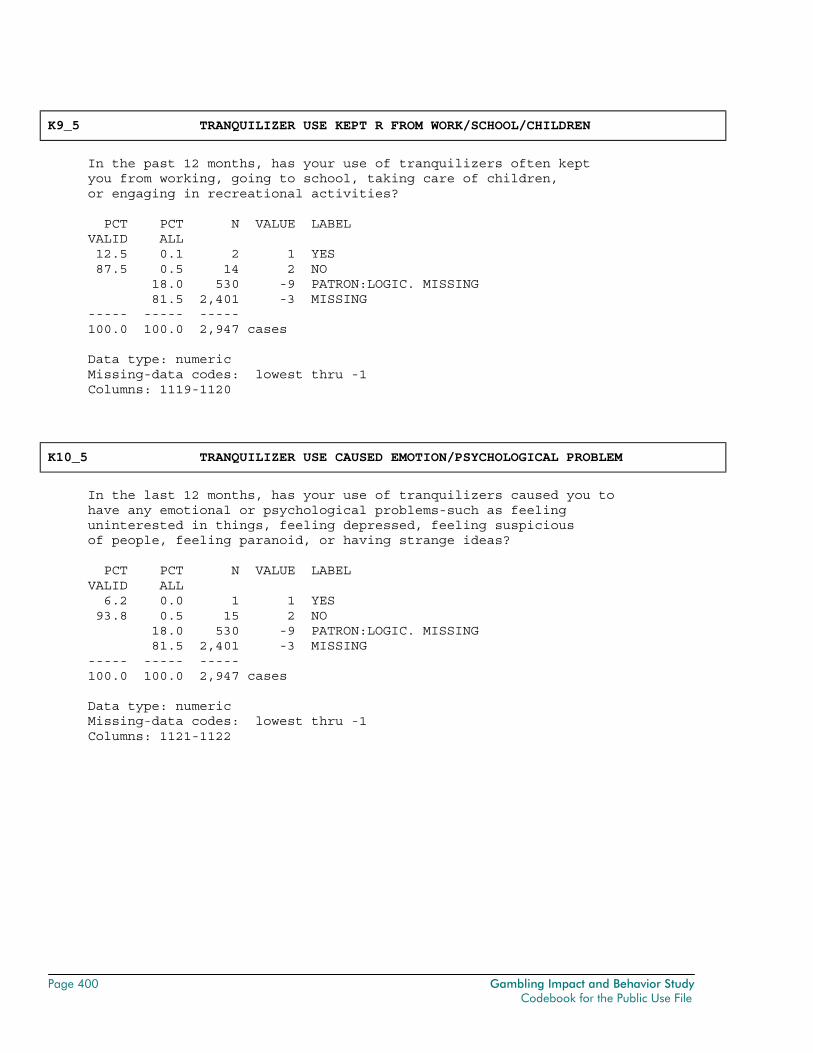
Page 400 Gambling Impact and Behavior Study Codebook for the Public Use File
K9_5 TRANQUILIZER USE KEPT R FROM WORK/SCHOOL/CHILDREN
In the past 12 months, has your use of tranquilizers often kept you from working, going to school, taking care of children, or engaging in recreational activities? PCT PCT N VALUE LABEL VALID ALL 12.5 0.1 2 1 YES 87.5 0.5 14 2 NO 18.0 530 -9 PATRON:LOGIC. MISSING 81.5 2,401 -3 MISSING ----- ----- ----- 100.0 100.0 2,947 cases Data type: numeric Missing-data codes: lowest thru -1 Columns: 1119-1120
K10_5 TRANQUILIZER USE CAUSED EMOTION/PSYCHOLOGICAL PROBLEM
In the last 12 months, has your use of tranquilizers caused you to have any emotional or psychological problems-such as feeling uninterested in things, feeling depressed, feeling suspicious of people, feeling paranoid, or having strange ideas? PCT PCT N VALUE LABEL VALID ALL 6.2 0.0 1 1 YES 93.8 0.5 15 2 NO 18.0 530 -9 PATRON:LOGIC. MISSING 81.5 2,401 -3 MISSING ----- ----- ----- 100.0 100.0 2,947 cases Data type: numeric Missing-data codes: lowest thru -1 Columns: 1121-1122
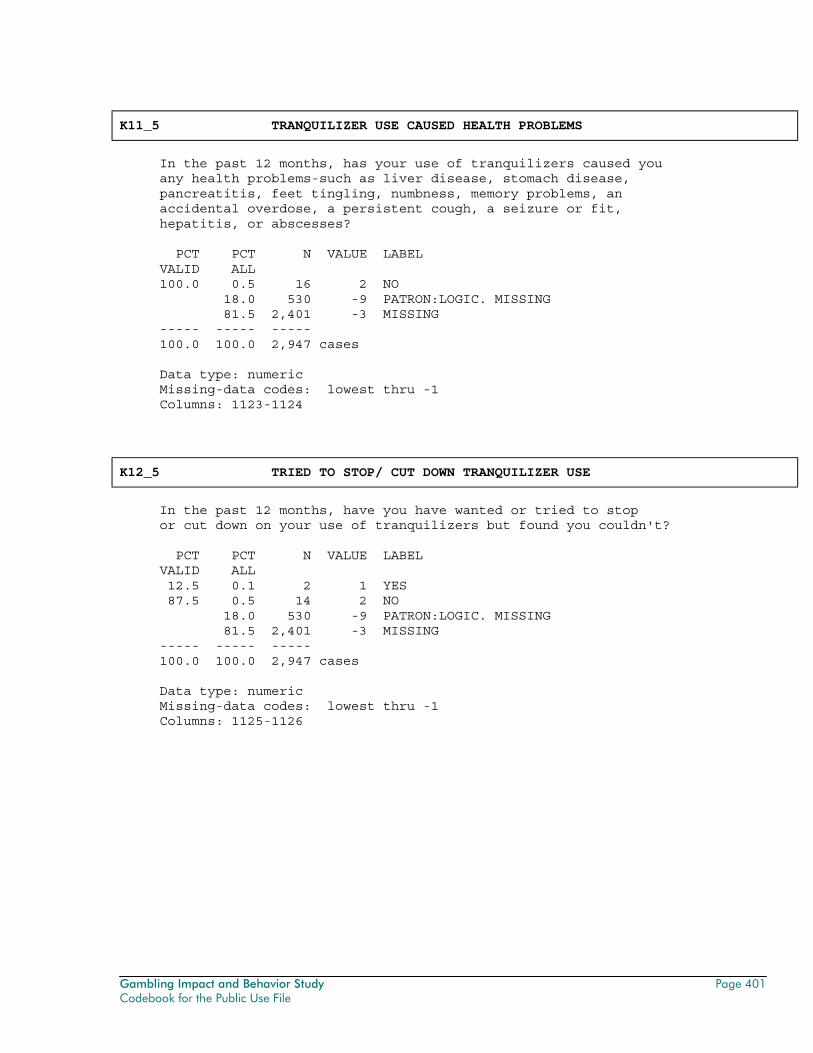
Gambling Impact and Behavior Study Page 401 Codebook for the Public Use File
K11_5 TRANQUILIZER USE CAUSED HEALTH PROBLEMS
In the past 12 months, has your use of tranquilizers caused you any health problems-such as liver disease, stomach disease, pancreatitis, feet tingling, numbness, memory problems, an accidental overdose, a persistent cough, a seizure or fit, hepatitis, or abscesses? PCT PCT N VALUE LABEL VALID ALL 100.0 0.5 16 2 NO 18.0 530 -9 PATRON:LOGIC. MISSING 81.5 2,401 -3 MISSING ----- ----- ----- 100.0 100.0 2,947 cases Data type: numeric Missing-data codes: lowest thru -1 Columns: 1123-1124
K12_5 TRIED TO STOP/ CUT DOWN TRANQUILIZER USE
In the past 12 months, have you have wanted or tried to stop or cut down on your use of tranquilizers but found you couldn't? PCT PCT N VALUE LABEL VALID ALL 12.5 0.1 2 1 YES 87.5 0.5 14 2 NO 18.0 530 -9 PATRON:LOGIC. MISSING 81.5 2,401 -3 MISSING ----- ----- ----- 100.0 100.0 2,947 cases Data type: numeric Missing-data codes: lowest thru -1 Columns: 1125-1126
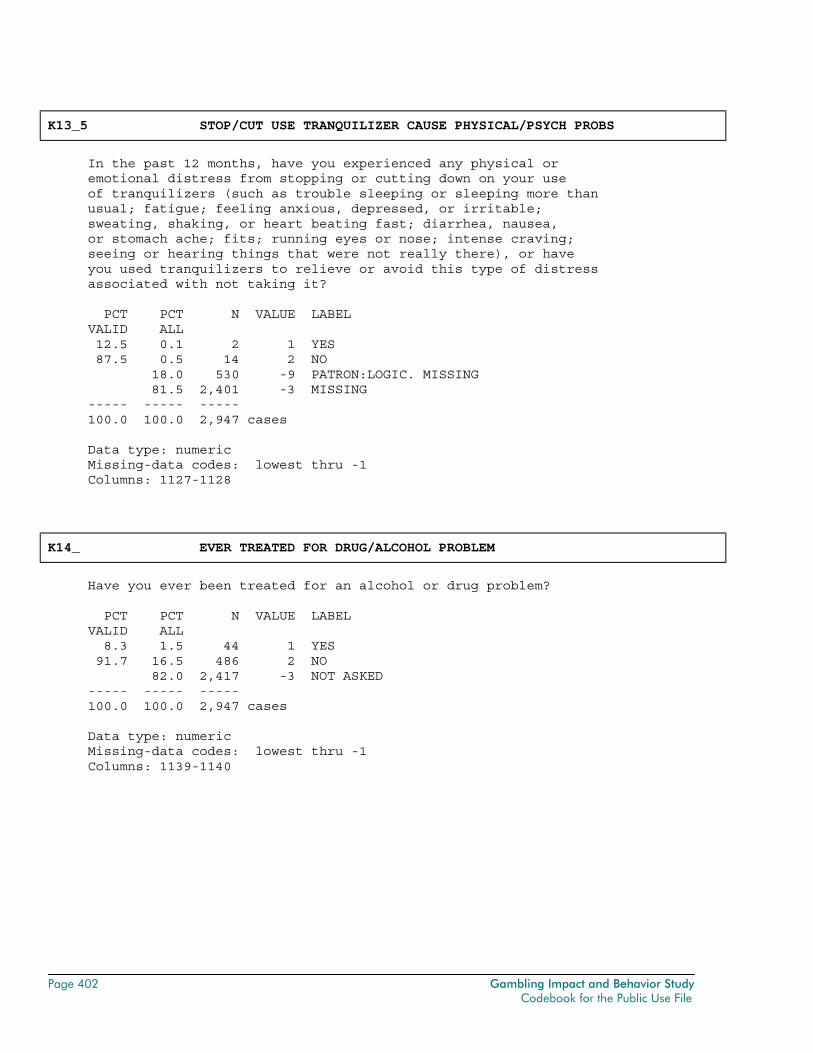
Page 402 Gambling Impact and Behavior Study Codebook for the Public Use File
K13_5 STOP/CUT USE TRANQUILIZER CAUSE PHYSICAL/PSYCH PROBS
In the past 12 months, have you experienced any physical or emotional distress from stopping or cutting down on your use of tranquilizers (such as trouble sleeping or sleeping more than usual; fatigue; feeling anxious, depressed, or irritable; sweating, shaking, or heart beating fast; diarrhea, nausea, or stomach ache; fits; running eyes or nose; intense craving; seeing or hearing things that were not really there), or have you used tranquilizers to relieve or avoid this type of distress associated with not taking it? PCT PCT N VALUE LABEL VALID ALL 12.5 0.1 2 1 YES 87.5 0.5 14 2 NO 18.0 530 -9 PATRON:LOGIC. MISSING 81.5 2,401 -3 MISSING ----- ----- ----- 100.0 100.0 2,947 cases Data type: numeric Missing-data codes: lowest thru -1 Columns: 1127-1128
K14_ EVER TREATED FOR DRUG/ALCOHOL PROBLEM
Have you ever been treated for an alcohol or drug problem? PCT PCT N VALUE LABEL VALID ALL 8.3 1.5 44 1 YES 91.7 16.5 486 2 NO 82.0 2,417 -3 NOT ASKED ----- ----- ----- 100.0 100.0 2,947 cases Data type: numeric Missing-data codes: lowest thru -1 Columns: 1139-1140
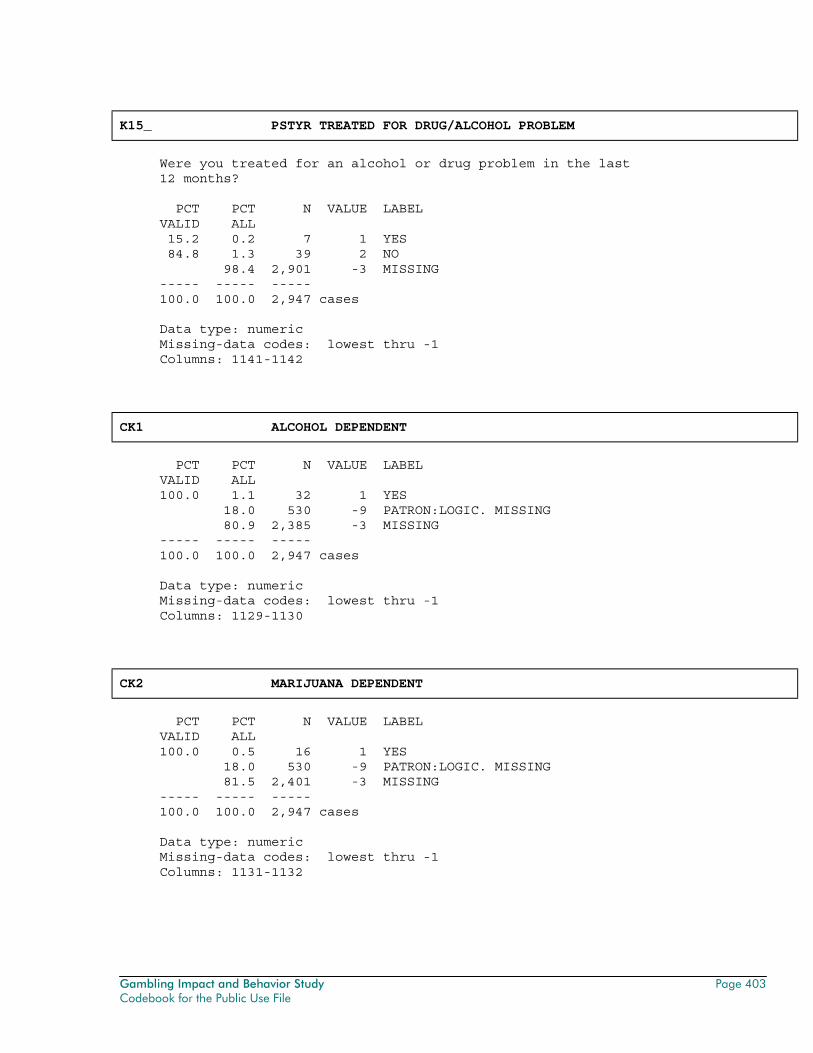
Gambling Impact and Behavior Study Page 403 Codebook for the Public Use File
K15_ PSTYR TREATED FOR DRUG/ALCOHOL PROBLEM
Were you treated for an alcohol or drug problem in the last 12 months? PCT PCT N VALUE LABEL VALID ALL 15.2 0.2 7 1 YES 84.8 1.3 39 2 NO 98.4 2,901 -3 MISSING ----- ----- ----- 100.0 100.0 2,947 cases Data type: numeric Missing-data codes: lowest thru -1 Columns: 1141-1142
CK1 ALCOHOL DEPENDENT
PCT PCT N VALUE LABEL VALID ALL 100.0 1.1 32 1 YES 18.0 530 -9 PATRON:LOGIC. MISSING 80.9 2,385 -3 MISSING ----- ----- ----- 100.0 100.0 2,947 cases Data type: numeric Missing-data codes: lowest thru -1 Columns: 1129-1130
CK2 MARIJUANA DEPENDENT
PCT PCT N VALUE LABEL VALID ALL 100.0 0.5 16 1 YES 18.0 530 -9 PATRON:LOGIC. MISSING 81.5 2,401 -3 MISSING ----- ----- ----- 100.0 100.0 2,947 cases Data type: numeric Missing-data codes: lowest thru -1 Columns: 1131-1132
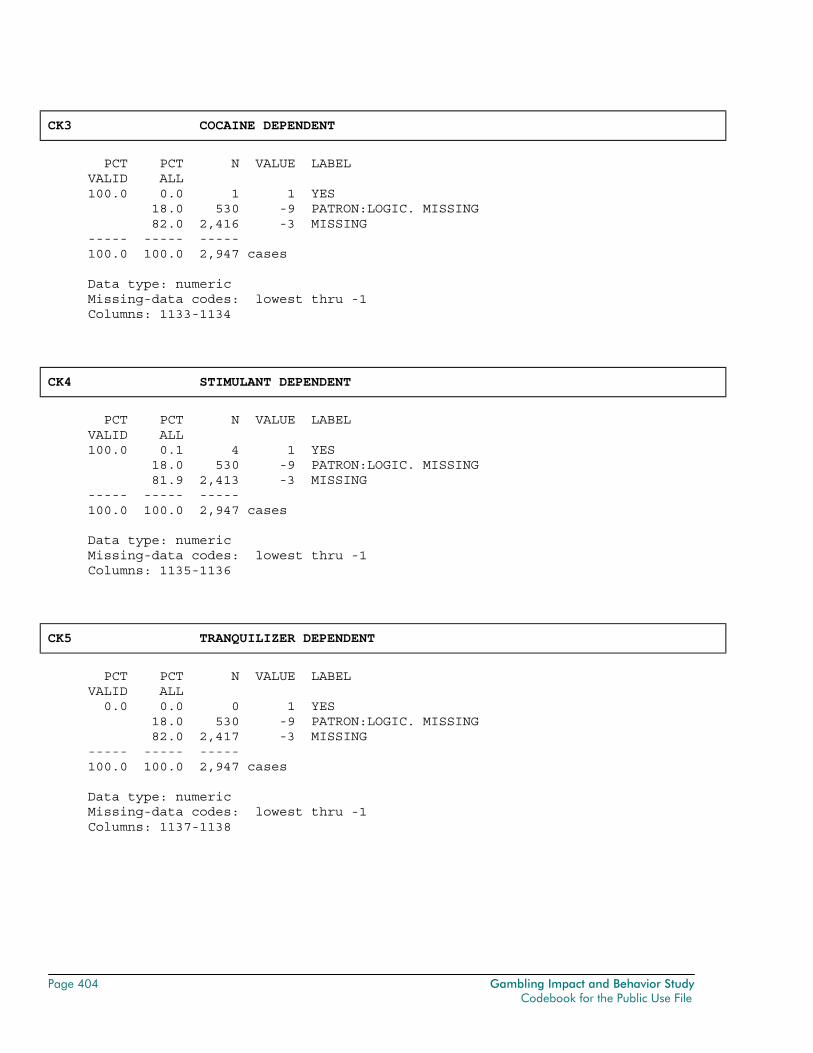
Page 404 Gambling Impact and Behavior Study Codebook for the Public Use File
CK3 COCAINE DEPENDENT
PCT PCT N VALUE LABEL VALID ALL 100.0 0.0 1 1 YES 18.0 530 -9 PATRON:LOGIC. MISSING 82.0 2,416 -3 MISSING ----- ----- ----- 100.0 100.0 2,947 cases Data type: numeric Missing-data codes: lowest thru -1 Columns: 1133-1134
CK4 STIMULANT DEPENDENT
PCT PCT N VALUE LABEL VALID ALL 100.0 0.1 4 1 YES 18.0 530 -9 PATRON:LOGIC. MISSING 81.9 2,413 -3 MISSING ----- ----- ----- 100.0 100.0 2,947 cases Data type: numeric Missing-data codes: lowest thru -1 Columns: 1135-1136
CK5 TRANQUILIZER DEPENDENT
PCT PCT N VALUE LABEL VALID ALL 0.0 0.0 0 1 YES 18.0 530 -9 PATRON:LOGIC. MISSING 82.0 2,417 -3 MISSING ----- ----- ----- 100.0 100.0 2,947 cases Data type: numeric Missing-data codes: lowest thru -1 Columns: 1137-1138
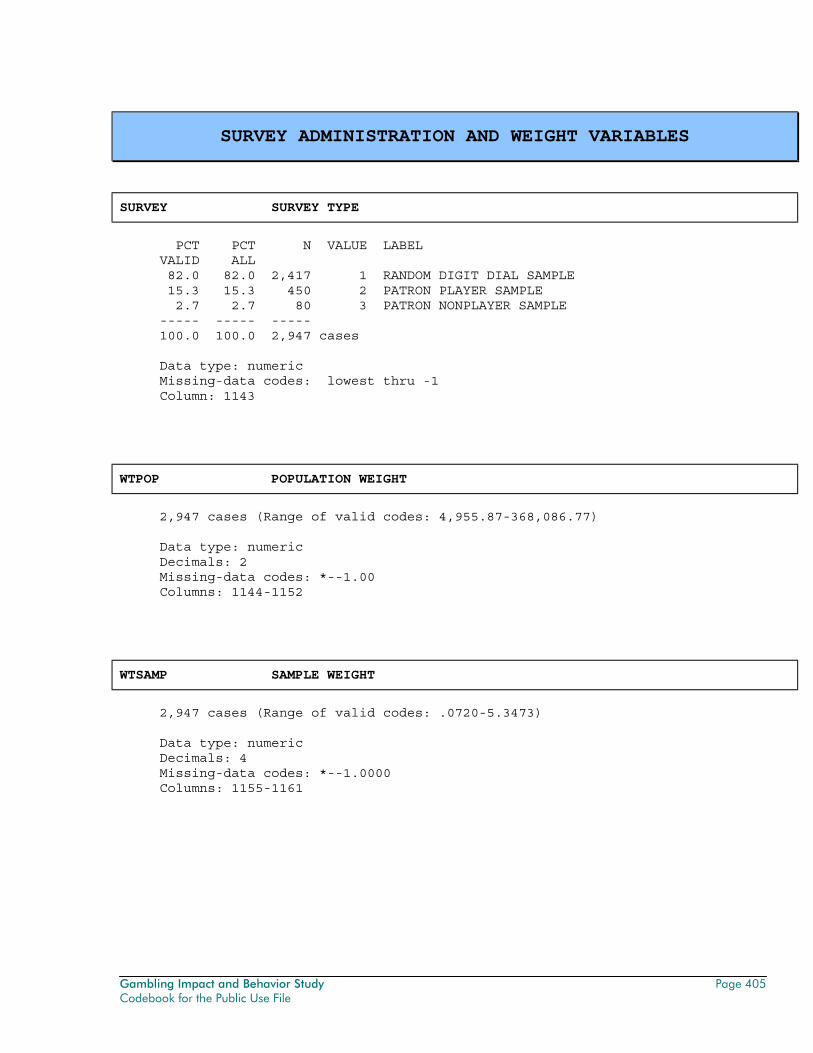
Gambling Impact and Behavior Study Page 405 Codebook for the Public Use File
SURVEY ADMINISTRATION AND WEIGHT VARIABLES
SURVEY SURVEY TYPE
PCT PCT N VALUE LABEL VALID ALL 82.0 82.0 2,417 1 RANDOM DIGIT DIAL SAMPLE 15.3 15.3 450 2 PATRON PLAYER SAMPLE 2.7 2.7 80 3 PATRON NONPLAYER SAMPLE ----- ----- ----- 100.0 100.0 2,947 cases Data type: numeric Missing-data codes: lowest thru -1 Column: 1143
WTPOP POPULATION WEIGHT
2,947 cases (Range of valid codes: 4,955.87-368,086.77) Data type: numeric Decimals: 2 Missing-data codes: *--1.00 Columns: 1144-1152
WTSAMP SAMPLE WEIGHT
2,947 cases (Range of valid codes: .0720-5.3473) Data type: numeric Decimals: 4 Missing-data codes: *--1.0000 Columns: 1155-1161
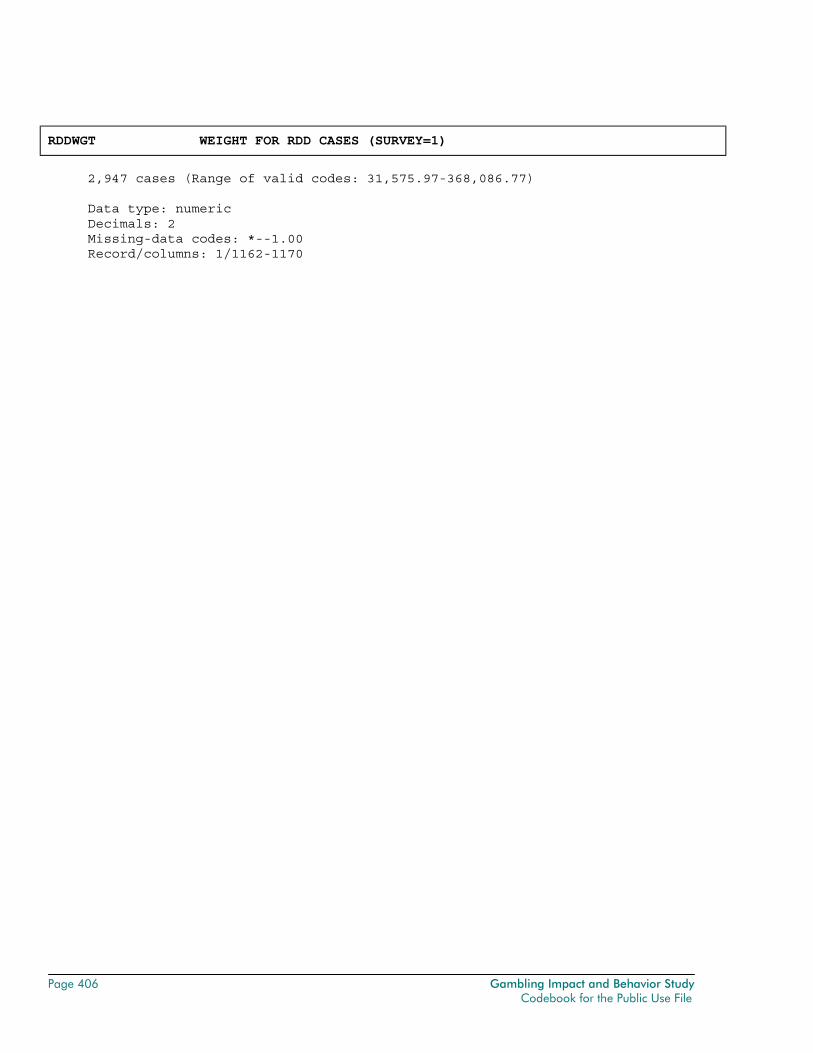
Page 406 Gambling Impact and Behavior Study Codebook for the Public Use File
RDDWGT WEIGHT FOR RDD CASES (SURVEY=1)
2,947 cases (Range of valid codes: 31,575.97-368,086.77) Data type: numeric Decimals: 2 Missing-data codes: *--1.00 Record/columns: 1/1162-1170
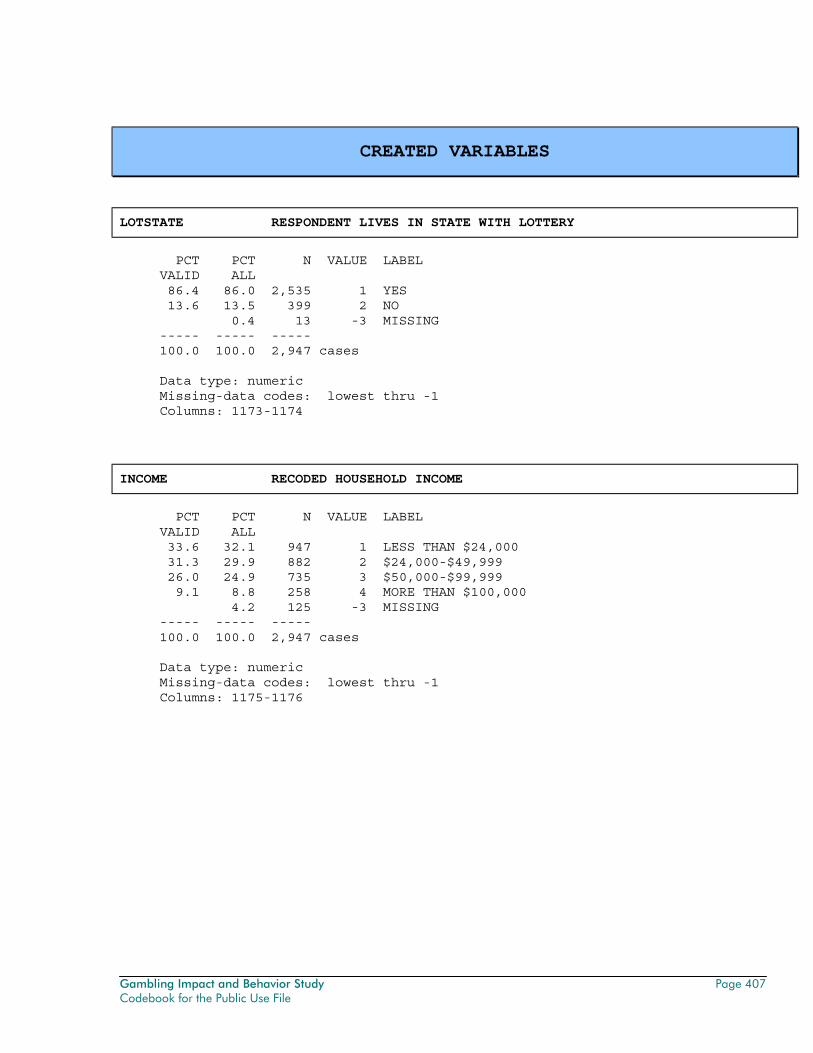
Gambling Impact and Behavior Study Page 407 Codebook for the Public Use File
CREATED VARIABLES
LOTSTATE RESPONDENT LIVES IN STATE WITH LOTTERY
PCT PCT N VALUE LABEL VALID ALL 86.4 86.0 2,535 1 YES 13.6 13.5 399 2 NO 0.4 13 -3 MISSING ----- ----- ----- 100.0 100.0 2,947 cases Data type: numeric Missing-data codes: lowest thru -1 Columns: 1173-1174
INCOME RECODED HOUSEHOLD INCOME
PCT PCT N VALUE LABEL VALID ALL 33.6 32.1 947 1 LESS THAN $24,000 31.3 29.9 882 2 $24,000-$49,999 26.0 24.9 735 3 $50,000-$99,999 9.1 8.8 258 4 MORE THAN $100,000 4.2 125 -3 MISSING ----- ----- ----- 100.0 100.0 2,947 cases Data type: numeric Missing-data codes: lowest thru -1 Columns: 1175-1176
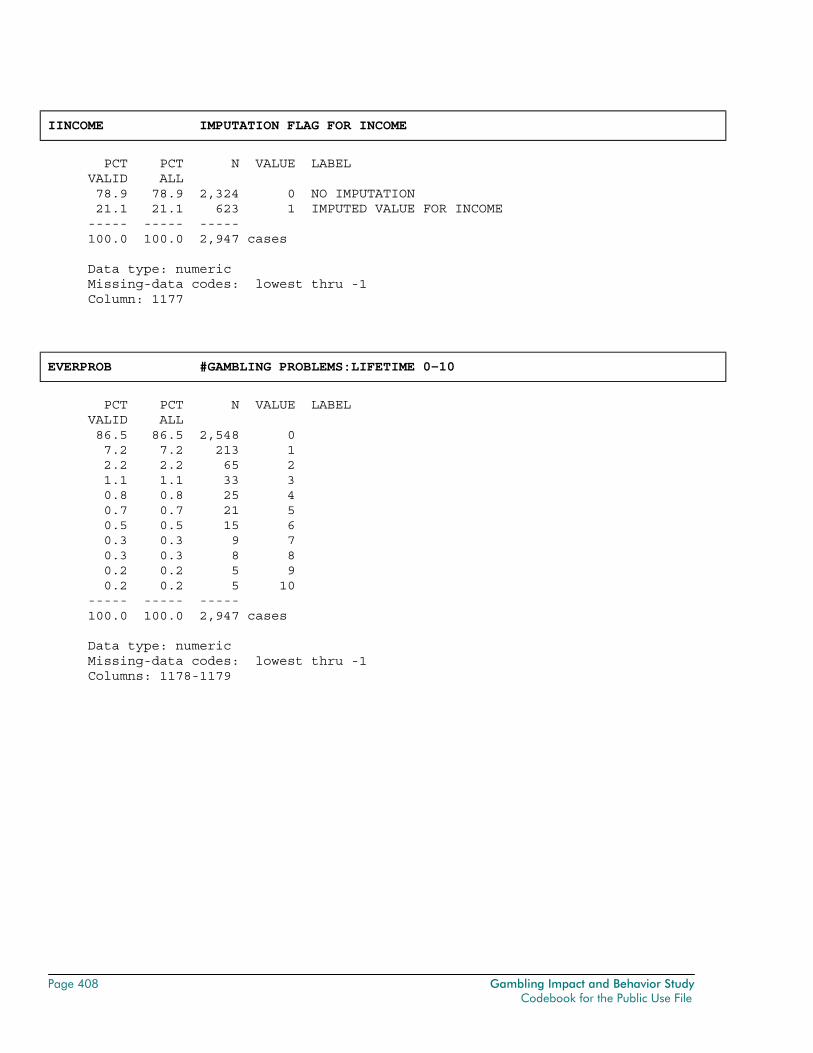
Page 408 Gambling Impact and Behavior Study Codebook for the Public Use File
IINCOME IMPUTATION FLAG FOR INCOME
PCT PCT N VALUE LABEL VALID ALL 78.9 78.9 2,324 0 NO IMPUTATION 21.1 21.1 623 1 IMPUTED VALUE FOR INCOME ----- ----- ----- 100.0 100.0 2,947 cases Data type: numeric Missing-data codes: lowest thru -1 Column: 1177
EVERPROB #GAMBLING PROBLEMS:LIFETIME 0-10
PCT PCT N VALUE LABEL VALID ALL 86.5 86.5 2,548 0 7.2 7.2 213 1 2.2 2.2 65 2 1.1 1.1 33 3 0.8 0.8 25 4 0.7 0.7 21 5 0.5 0.5 15 6 0.3 0.3 9 7 0.3 0.3 8 8 0.2 0.2 5 9 0.2 0.2 5 10 ----- ----- ----- 100.0 100.0 2,947 cases Data type: numeric Missing-data codes: lowest thru -1 Columns: 1178-1179
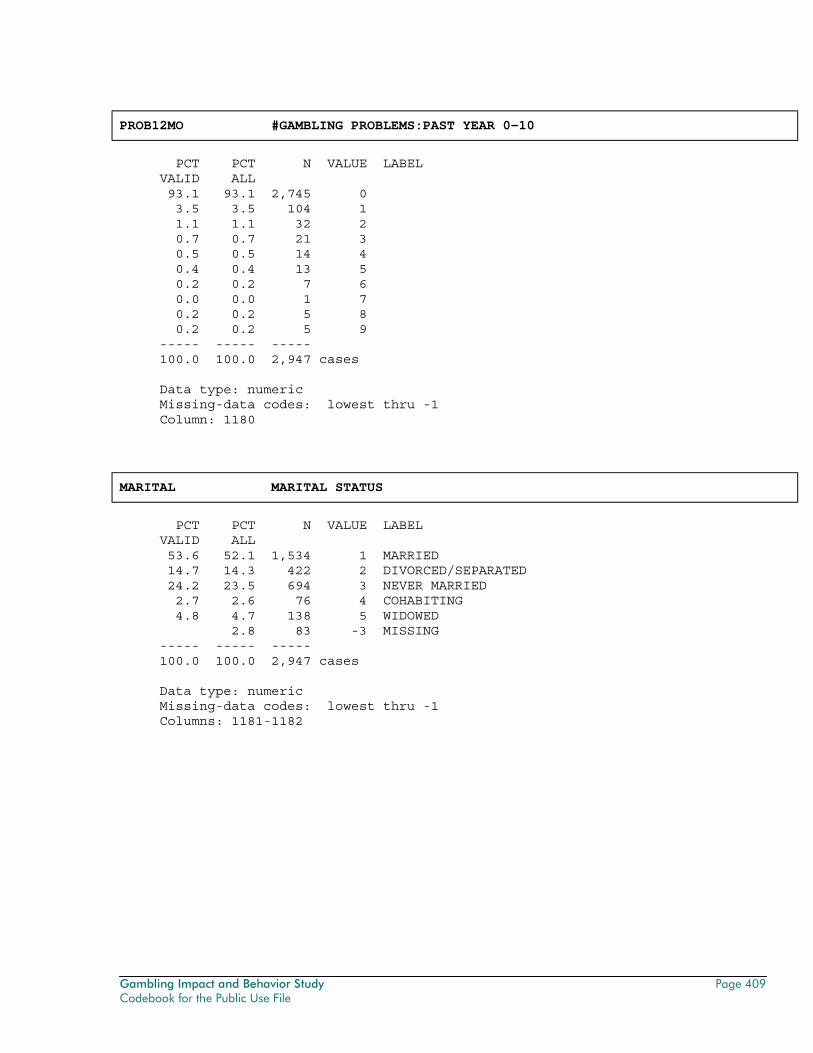
Gambling Impact and Behavior Study Page 409 Codebook for the Public Use File
PROB12MO #GAMBLING PROBLEMS:PAST YEAR 0-10
PCT PCT N VALUE LABEL VALID ALL 93.1 93.1 2,745 0 3.5 3.5 104 1 1.1 1.1 32 2 0.7 0.7 21 3 0.5 0.5 14 4 0.4 0.4 13 5 0.2 0.2 7 6 0.0 0.0 1 7 0.2 0.2 5 8 0.2 0.2 5 9 ----- ----- ----- 100.0 100.0 2,947 cases Data type: numeric Missing-data codes: lowest thru -1 Column: 1180
MARITAL MARITAL STATUS
PCT PCT N VALUE LABEL VALID ALL 53.6 52.1 1,534 1 MARRIED 14.7 14.3 422 2 DIVORCED/SEPARATED 24.2 23.5 694 3 NEVER MARRIED 2.7 2.6 76 4 COHABITING 4.8 4.7 138 5 WIDOWED 2.8 83 -3 MISSING ----- ----- ----- 100.0 100.0 2,947 cases Data type: numeric Missing-data codes: lowest thru -1 Columns: 1181-1182
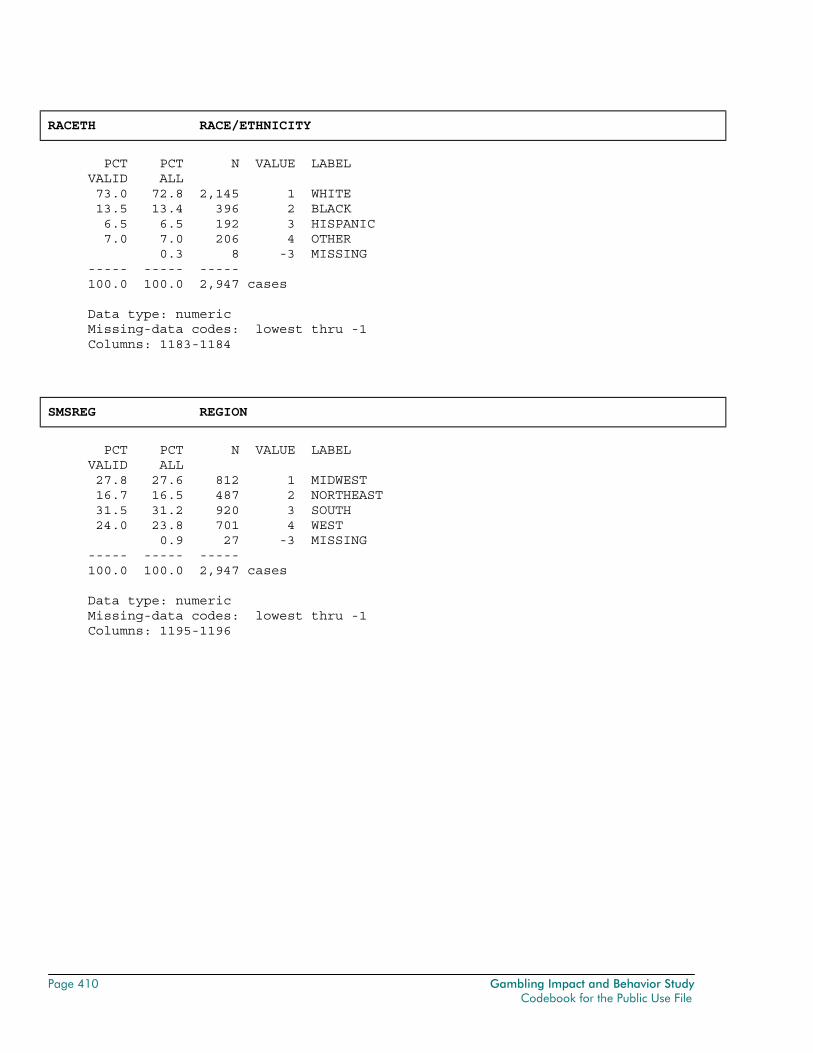
Page 410 Gambling Impact and Behavior Study Codebook for the Public Use File
RACETH RACE/ETHNICITY
PCT PCT N VALUE LABEL VALID ALL 73.0 72.8 2,145 1 WHITE 13.5 13.4 396 2 BLACK 6.5 6.5 192 3 HISPANIC 7.0 7.0 206 4 OTHER 0.3 8 -3 MISSING ----- ----- ----- 100.0 100.0 2,947 cases Data type: numeric Missing-data codes: lowest thru -1 Columns: 1183-1184
SMSREG REGION
PCT PCT N VALUE LABEL VALID ALL 27.8 27.6 812 1 MIDWEST 16.7 16.5 487 2 NORTHEAST 31.5 31.2 920 3 SOUTH 24.0 23.8 701 4 WEST 0.9 27 -3 MISSING ----- ----- ----- 100.0 100.0 2,947 cases Data type: numeric Missing-data codes: lowest thru -1 Columns: 1195-1196
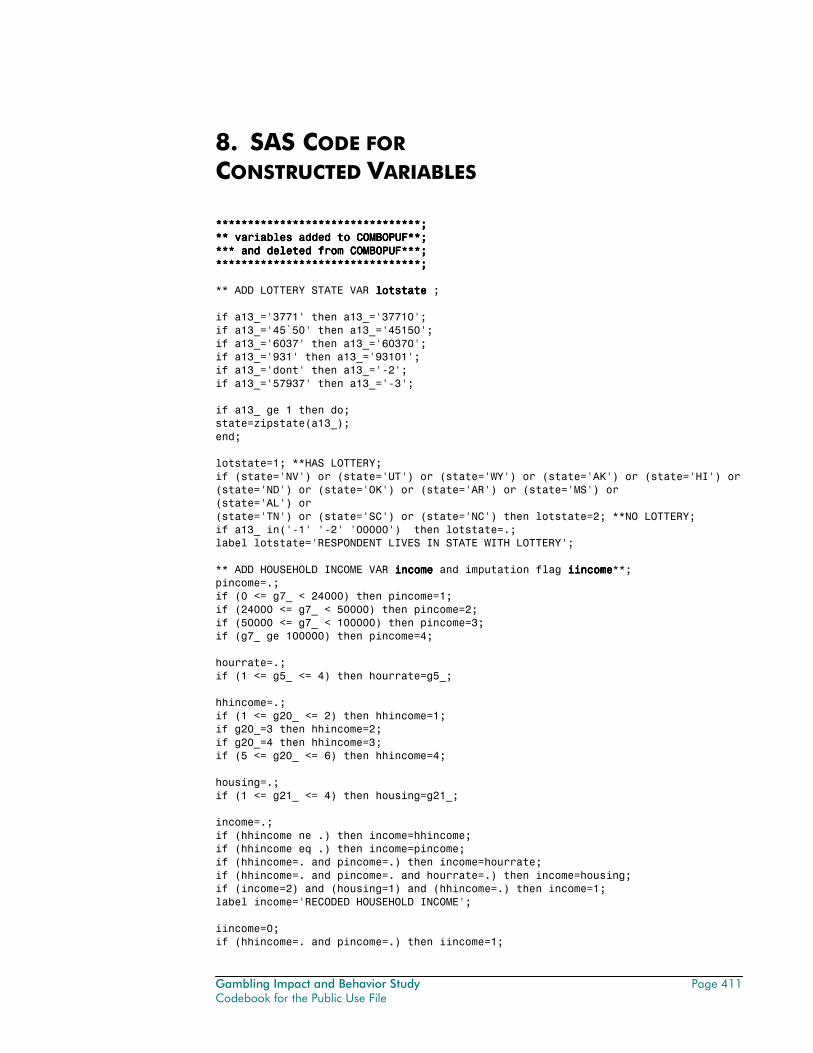
Gambling Impact and Behavior Study Page 411 Codebook for the Public Use File
8. SAS CODE FOR CONSTRUCTED VARIABLES
********************************;********************************;********************************;********************************;
** variables added to COMBOPUF**;** variables added to COMBOPUF**;** variables added to COMBOPUF**;** variables added to COMBOPUF**;
*** and deleted from COMBOPUF***;*** and deleted from COMBOPUF***;*** and deleted from COMBOPUF***;*** and deleted from COMBOPUF***;
********************************;********************************;********************************;********************************;
** ADD LOTTERY STATE VAR
lotstatelotstatelotstatelotstate
;
if a13_='3771' then a13_='37710';
if a13_='45
`50' then a13_='45150';
if a13_='6037' then a13_='60370';
if a13_='931' then a13_='93101';
if a13_='dont' then a13_='
-
2';
if a13_='57937' then a13_='
-
3';
if a13_ ge 1 then do;
state=zipstate(a13_);
end;
lotstate=1; **HAS LOTTERY;
if (state='NV') or (stat
e='UT') or (state='WY') or (state='AK') or (state='HI') or
(state='ND') or (state='OK') or (state='AR') or (state='MS') or
(state='AL') or
(state='TN') or (state='SC') or (state='NC') then lotstate=2; **NO LOTTERY;
if a13_ in('
-
1' '
-
2' '00000') then lotst
ate=.;
label lotstate='RESPONDENT LIVES IN STATE WITH LOTTERY';
** ADD HOUSEHOLD INCOME VAR
incomeincomeincomeincome
and imputation flag
iincomeiincomeiincomeiincome
**;
pincome=.;
if (0 <= g7_ < 24000) then pincome=1;
if (24000 <= g7_ < 50000) then pincome=2;
if (50000 <= g7_ < 100000) then pi
ncome=3;
if (g7_ ge 100000) then pincome=4;
hourrate=.;
if (1 <= g5_ <= 4) then hourrate=g5_;
hhincome=.;
if (1 <= g20_ <= 2) then hhincome=1;
if g20_=3 then hhincome=2;
if g20_=4 then hhincome=3;
if (5 <= g20_ <= 6) then hhincome=4;
housing=.;
if (1 <=
g21_ <= 4) then housing=g21_;
income=.;
if (hhincome ne .) then income=hhincome;
if (hhincome eq .) then income=pincome;
if (hhincome=. and pincome=.) then income=hourrate;
if (hhincome=. and pincome=. and hourrate=.) then income=housing;
if (income=2) a
nd (housing=1) and (hhincome=.) then income=1;
label income='RECODED HOUSEHOLD INCOME';
iincome=0;
if (hhincome=. and pincome=.) then iincome=1;
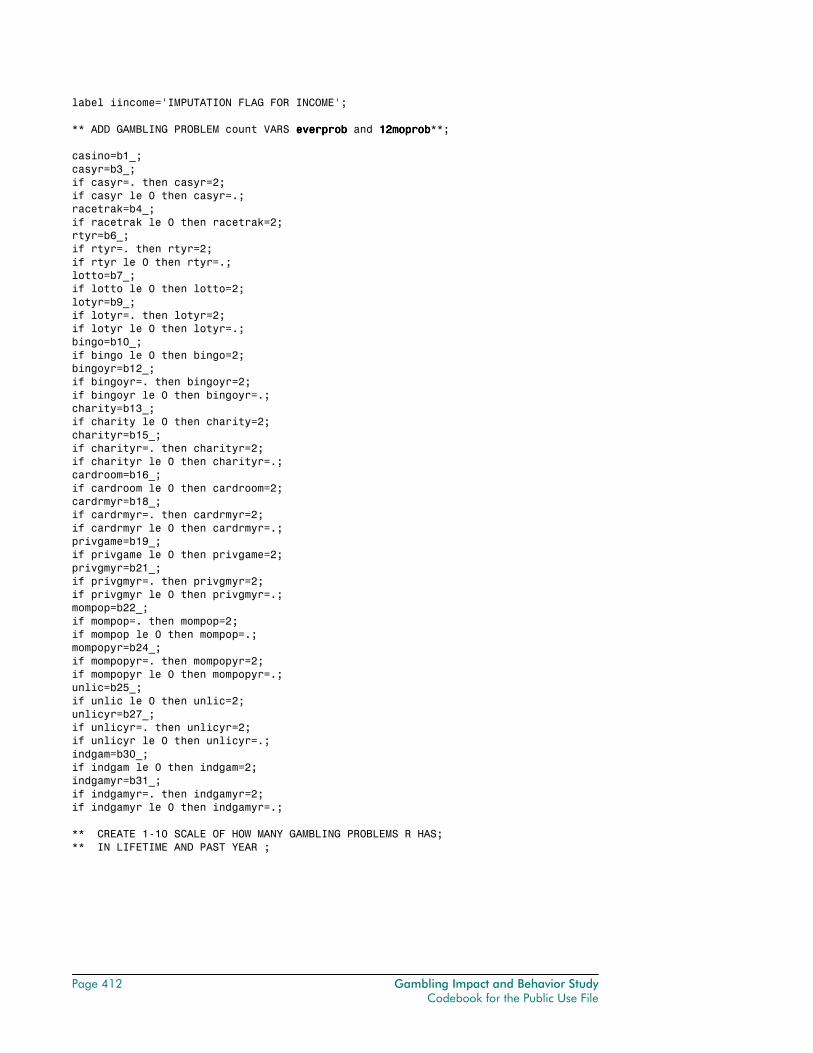
Page 412 Gambling Impact and Behavior Study Codebook for the Public Use File
label iincome='IMPUTATION FLAG FOR INCOME';
** ADD GAMBLING PROBLEM count VARS
everprobeverprobeverprobeverprob
and
12moprob12moprob12moprob12moprob
**;
casi
no=b1_;
casyr=b3_;
if casyr=. then casyr=2;
if casyr le 0 then casyr=.;
racetrak=b4_;
if racetrak le 0 then racetrak=2;
rtyr=b6_;
if rtyr=. then rtyr=2;
if rtyr le 0 then rtyr=.;
lotto=b7_;
if lotto le 0 then lotto=2;
lotyr=b9_;
if lotyr=. then lotyr=2;
if
lotyr le 0 then lotyr=.;
bingo=b10_;
if bingo le 0 then bingo=2;
bingoyr=b12_;
if bingoyr=. then bingoyr=2;
if bingoyr le 0 then bingoyr=.;
charity=b13_;
if charity le 0 then charity=2;
charityr=b15_;
if charityr=. then charityr=2;
if charityr le 0 then c
harityr=.;
cardroom=b16_;
if cardroom le 0 then cardroom=2;
cardrmyr=b18_;
if cardrmyr=. then cardrmyr=2;
if cardrmyr le 0 then cardrmyr=.;
privgame=b19_;
if privgame le 0 then privgame=2;
privgmyr=b21_;
if privgmyr=. then privgmyr=2;
if privgmyr le 0 then
privgmyr=.;
mompop=b22_;
if mompop=. then mompop=2;
if mompop le 0 then mompop=.;
mompopyr=b24_;
if mompopyr=. then mompopyr=2;
if mompopyr le 0 then mompopyr=.;
unlic=b25_;
if unlic le 0 then unlic=2;
unlicyr=b27_;
if unlicyr=. then unlicyr=2;
if unlicyr
le 0 then unlicyr=.;
indgam=b30_;
if indgam le 0 then indgam=2;
indgamyr=b31_;
if indgamyr=. then indgamyr=2;
if indgamyr le 0 then indgamyr=.;
** CREATE 1
-
10 SCALE OF HOW MANY GAMBLING PROBLEMS R HAS;
** IN LIFETIME AND PAST YEAR ;
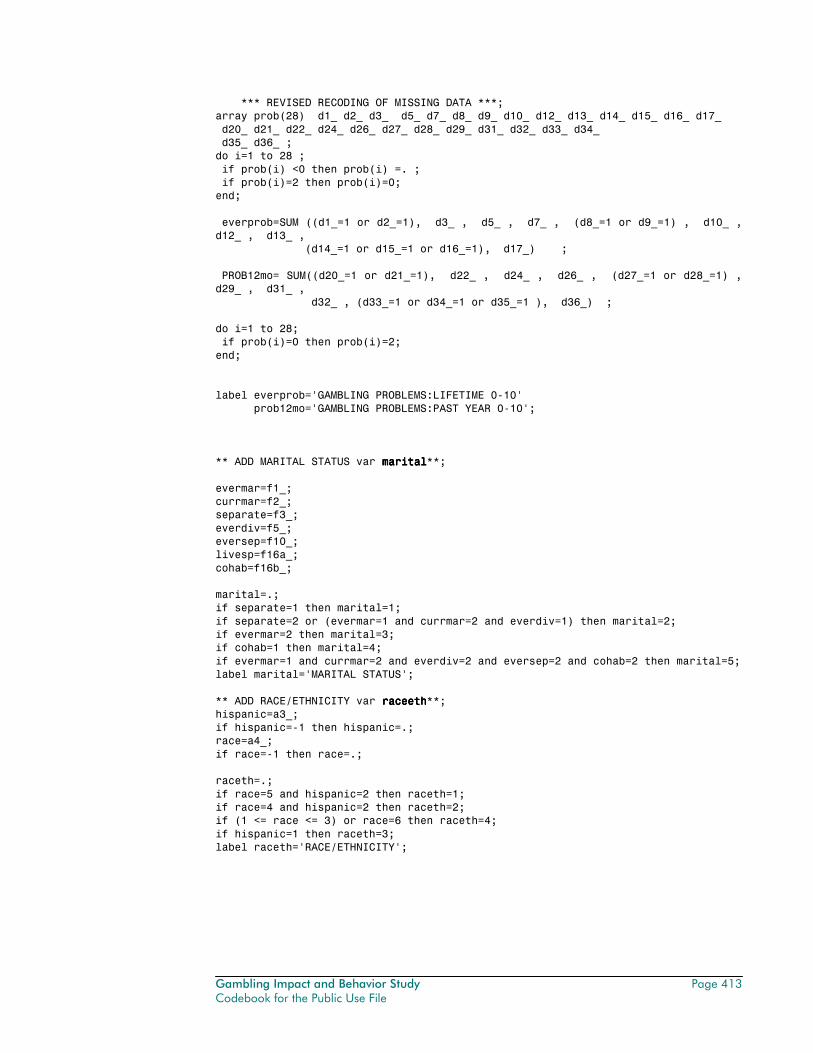
Gambling Impact and Behavior Study Page 413 Codebook for the Public Use File
*** REVISED R
ECODING OF MISSING DATA ***;
array prob(28) d1_ d2_ d3_ d5_ d7_ d8_ d9_ d10_ d12_ d13_ d14_ d15_ d16_ d17_
d20_ d21_ d22_ d24_ d26_ d27_ d28_ d29_ d31_ d32_ d33_ d34_
d35_ d36_ ;
do i=1 to 28 ;
if prob(i) <0 then prob(i) =. ;
if prob(i)=2 then prob(i
)=0;
end;
everprob=SUM ((d1_=1 or d2_=1), d3_ , d5_ , d7_ , (d8_=1 or d9_=1) , d10_ ,
d12_ , d13_ ,
(d14_=1 or d15_=1 or d16_=1), d17_) ;
PROB12mo= SUM((d20_=1 or d21_=1), d22_ , d24_ , d26_ , (d27_=1 or d28_=1) ,
d29_ ,
d31_ ,
d32_ , (d33_=1 or d34_=1 or d35_=1 ), d36_) ;
do i=1 to 28;
if prob(i)=0 then prob(i)=2;
end;
label everprob='GAMBLING PROBLEMS:LIFETIME 0
-
10'
prob12mo='GAMBLING PROBLEMS:PAST YEAR 0
-
10';
** ADD MARITAL STATUS var
maritmaritmaritmarit
alalalal
**;
evermar=f1_;
currmar=f2_;
separate=f3_;
everdiv=f5_;
eversep=f10_;
livesp=f16a_;
cohab=f16b_;
marital=.;
if separate=1 then marital=1;
if separate=2 or (evermar=1 and currmar=2 and everdiv=1) then marital=2;
if evermar=2 then marital=3;
if cohab=1
then marital=4;
if evermar=1 and currmar=2 and everdiv=2 and eversep=2 and cohab=2 then marital=5;
label marital='MARITAL STATUS';
** ADD RACE/ETHNICITY var
raceethraceethraceethraceeth
**;
hispanic=a3_;
if hispanic=
-
1 then hispanic=.;
race=a4_;
if race=
-
1 then race=.;
raceth
=.;
if race=5 and hispanic=2 then raceth=1;
if race=4 and hispanic=2 then raceth=2;
if (1 <= race <= 3) or race=6 then raceth=4;
if hispanic=1 then raceth=3;
label raceth='RACE/ETHNICITY';
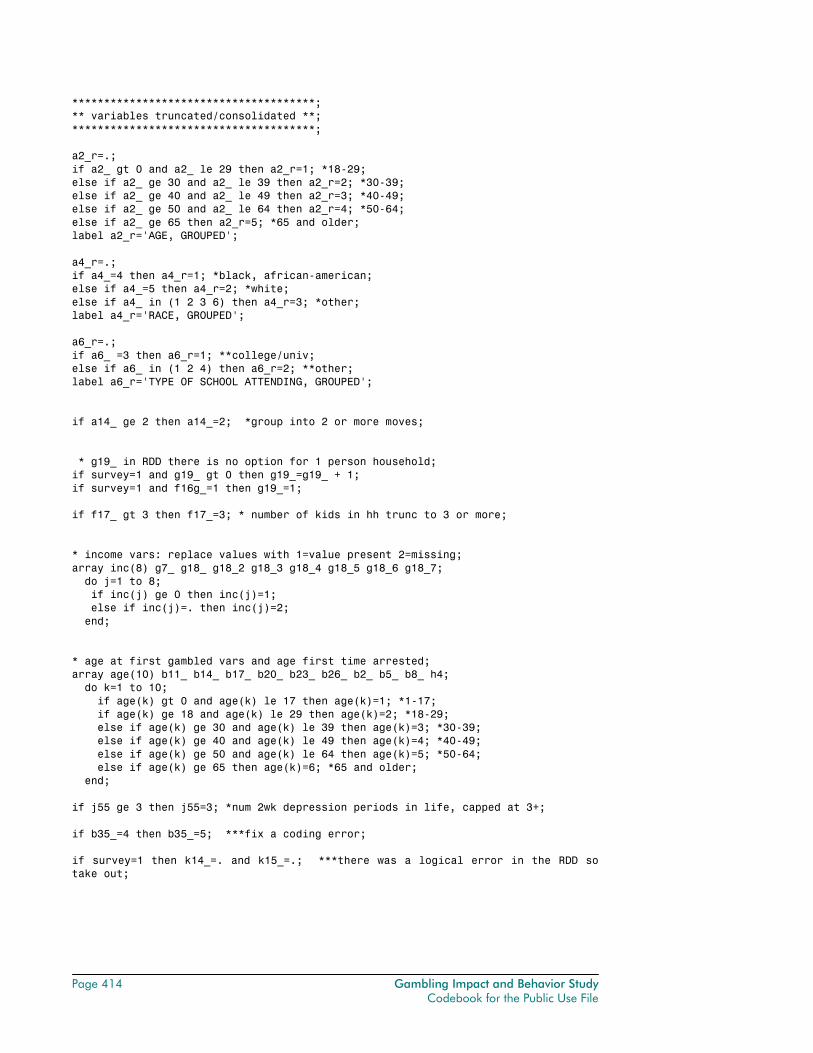
Page 414 Gambling Impact and Behavior Study Codebook for the Public Use File
**************************************;
** variables truncated/c
onsolidated **;
**************************************;
a2_r=.;
if a2_ gt 0 and a2_ le 29 then a2_r=1; *18
-
29;
else if a2_ ge 30 and a2_ le 39 then a2_r=2; *30
-
39;
else if a2_ ge 40 and a2_ le 49 then a2_r=3; *40
-
49;
else if a2_ ge 50 and a2_ le 64 then a
2_r=4; *50
-
64;
else if a2_ ge 65 then a2_r=5; *65 and older;
label a2_r='AGE, GROUPED';
a4_r=.;
if a4_=4 then a4_r=1; *black, african
-
american;
else if a4_=5 then a4_r=2; *white;
else if a4_ in (1 2 3 6) then a4_r=3; *other;
label a4_r='RACE, GROUPED';
a
6_r=.;
if a6_ =3 then a6_r=1; **college/univ;
else if a6_ in (1 2 4) then a6_r=2; **other;
label a6_r='TYPE OF SCHOOL ATTENDING, GROUPED';
if a14_ ge 2 then a14_=2; *group into 2 or more moves;
* g19_ in RDD there is no option for 1 person household;
if survey=1 and g19_ gt 0 then g19_=g19_ + 1;
if survey=1 and f16g_=1 then g19_=1;
if f17_ gt 3 then f17_=3; * number of kids in hh trunc to 3 or more;
* income vars: replace values with 1=value present 2=missing;
array inc(8) g7_ g18_ g18_2 g18_3 g18_
4 g18_5 g18_6 g18_7;
do j=1 to 8;
if inc(j) ge 0 then inc(j)=1;
else if inc(j)=. then inc(j)=2;
end;
* age at first gambled vars and age first time arrested;
array age(10) b11_ b14_ b17_ b20_ b23_ b26_ b2_ b5_ b8_ h4;
do k=1 to 10;
if age
(k) gt 0 and age(k) le 17 then age(k)=1; *1
-
17;
if age(k) ge 18 and age(k) le 29 then age(k)=2; *18
-
29;
else if age(k) ge 30 and age(k) le 39 then age(k)=3; *30
-
39;
else if age(k) ge 40 and age(k) le 49 then age(k)=4; *40
-
49;
else if age(k)
ge 50 and age(k) le 64 then age(k)=5; *50
-
64;
else if age(k) ge 65 then age(k)=6; *65 and older;
end;
if j55 ge 3 then j55=3; *num 2wk depression periods in life, capped at 3+;
if b35_=4 then b35_=5; ***fix a coding error;
if survey=1 then k14_=
. and k15_=.; ***there was a logical error in the RDD so
take out;
Gambling Impact and Behavior Study Page 415 Codebook for the Public Use File
*****************************;
** variables to be deleted **;
*****************************;
drop
i j k
state pincome hourrate hhincome housing casino casyr
racetrak rtyr lotto lotyr
bingo bingoyr charity charityr
cardroom cardrmyr privgame privgmyr mompop mompopyr
unlic unlicyr indgam indgamyr evermar currmar separate
everdiv eversep livesp cohab hispanic race
a2_
a4_
a6_
a13_
b79_1 b80_1 b81_1 b61OP b64 g19p g20p
f18_
g2_
g3_
j10
--
j22
b83_
--
b83_53 b83_54
--
b83_106
b83_107
--
b83_159 b83_160
--
b83_212
a4O_ a6O_ b35O_ b39O_ b44O_ b49O_ b59O_ b65O_ b102o_ b118O_ b133O_ b148O_ b150O_
b156O_
b161O_ b166O_ c7_ c14O_ c15O_ c22_ c28_ f9_ f15_ g15_ g40_ g
17O_
h9 h14 j46 j54 b90_
b47a_ b47b_ b52a_ b52b_ b68a_ b68b_ b72a_ b72b_ b93a_ b93b_
b105a_ b105b_ b108a_ b108b_ b121a_ b121b_ b124a_ b124b_
b136a_ b136b_ b139a_ b139b_ b143a_ b143b_ b145a_ b145b_
b159a_ b159b_ b164a_ b164b_ b170a_ b170b_ b176a_
b176b_
b178a_ b178b_ c18_ c22_ c23_ c28_ c29_ h1
b118_7
g10_ g11_ g30_ g31_ g32_ g33_ g34_
h13
ck6
-
ck57
rcomment
sc1 sc2 sc3 sc4 sc5
sdate
cadedate
version
saq
patron
state
sitetype
sitetyp2
distance
_obstat_
iwday iwmo iwyear
secb1 s
ecb2 secb3 secb4 secb5 secb6 secb7 secb8 secb9 secb10
secb11 secb12
adults
Page 416 Gambling Impact and Behavior Study Codebook for the Public Use File
cell
b69_ b70_ b81_ b81_2 b81_3 b81_4
;
run;