Embed Size (px)
Citation preview

Contents lists available at ScienceDirect
Applied Catalysis A, General
journal homepage: www.elsevier.com/locate/apcata
Gallium and tin exchanged Y zeolites for glucose isomerisation and 5-hydroxymethyl furfural productionRyan Oozeerallya, John Pilliera, Emre Kilica, Paul B.J. Thompsonb,c, Marc Walkerd,Benjamin E. Griffithd, John V. Hannad, Volkan Degirmencia,*a School of Engineering, University of Warwick, CV4 7AL, Coventry, UKbDepartment of Physics, Liverpool, L69 3BX, UKc XMaS UK CRG Beam Line, European Synchrotron Radiation Facility, 38000 Grenoble, FrancedDepartment of Physics, University of Warwick, CV4 7AL, Coventry, UK
A R T I C L E I N F O
Keywords:HMFGlucoseIsomerisationBiomassZeolite
A B S T R A C T
This study demonstrates the use of gallium and tin modified Y zeolites as catalysts for the conversion of glucoseinto fructose, mannose and 5-Hydroxymethyl furfural. These catalysts can be synthesised via a simple andscalable procedure that uses commercially available Y zeolite. The catalysts were characterised by varioustechniques including elemental analysis, electron microscopy, nitrogen physisorption, X-ray diffraction, X-rayphotoelectron spectroscopy, ultraviolet-visible spectroscopy, solid state nuclear magnetic resonance spectro-scopy and X-ray absorption near edge spectroscopy. It is found that tin containing Y zeolite generate a glucoseconversion of 36 % and total product yield of 17 % in water. Meanwhile, gallium containing Y zeolite shows anHMF yield of 33 % when reactions were conducted in DMSO. The recyclability of tin and gallium containing Yzeolites were studied in DMSO and the activities of both materials were shown to remain stable. Furthermore,the spent catalysts can be regenerated via calcination in air.
1. Introduction
Biomass derived platform molecules, such as 5-hydroxylmethylfurfural (HMF), could play a key role in reducing the global dependenceon fossil fuel resources. [1,2] HMF has the potential to enable theproduction of bulk chemicals for polymer, fine chemical and pharma-ceutical industries and therefore could pave the wave for a future bio-refinery [3,4]. In literature it has been shown that HMF can be easilyproduced via the dehydration of fructose. [5,6] However, the conver-sion of glucose, the main constituent of cellulosic biomass, remainschallenging. A scalable and industrially applicable heterogeneous cat-alytic system is highly sought [7,8]. A process utilising the glucose willenable the use of vast cellulosic biomass resources and thus it couldaccelerate the transition from petroleum to biomass‐based chemicalindustry in a cost effective way [9].
Tin containing beta zeolite (Sn-beta) has attracted great attentionover the last decade due to its high selectivity for glucose isomerisationinto fructose. [10] Despite its high selectivity, Sn-beta has somedrawbacks. First, the traditional synthesis of Sn-beta requires longsynthesis times and highly toxic hydrofluoric acid which makes its in-dustrial application challenging. Secondly, Sn-beta suffers from the
rapid deactivation under hydrothermal reaction conditions [11] and ithas been shown that the use of Sn-beta in a fixed bed reactor leads tothe irreversible destruction of the catalyst [12]. Isomerisation of glu-cose into fructose over Sn-beta needs to be coupled with the consecutivedehydration of fructose into HMF. Preferably, a single step conversionfrom glucose to HMF could be more cost efficient. The co-use of mineralacids in a one pot reaction have been reported [13], however thisfurther reduces catalyst stability in strongly acidic conditions.
Sn-beta [14–16] and Sn-MFI [17–19] zeolites as well as Sn con-taining mesoporous silicas [20–22] and acidic resins [23] were ex-tensively studied and reported in literature [24–26]. However, thepotential of other zeolite topologies has not been fully explored to date.Considering the vast range of known zeolite types, this remains to be arelatively less studied area. In this respect, zeolite Y is a promisingcatalyst because it is one of the most widely used catalysts in petro-chemical industry [27]. With regards to glucose diffusivity, zeolite Yhas an advantage of possessing large pore network, where glucosemolecules were shown to diffuse into. [28] Moreover, zeolite Y hasbeen reported to be a promising support for the base catalysed con-version of glucose when its sodium form is doped with magnesiumoxide [29–31]. Meanwhile, leaching of the metal species was observed
https://doi.org/10.1016/j.apcata.2020.117798Received 15 June 2020; Received in revised form 31 July 2020; Accepted 19 August 2020
⁎ Corresponding author.E-mail address: [email protected] (V. Degirmenci).
Applied Catalysis A, General 605 (2020) 117798
Available online 22 August 20200926-860X/ © 2020 The Author(s). Published by Elsevier B.V. This is an open access article under the CC BY license (http://creativecommons.org/licenses/by/4.0/).
similar to other reports on cation-exchanged A, X, and, Y zeolites [32].Among various Mg-promoted zeolite structures, only zeolite Y wasobserved to recover its initial activity after reactivation in air [31].
Glucose conversion over solid-acid zeolites including zeolite Y,mordenite, ZSM-5 and beta were reported in ionic liquid media withpromising conversions and selectivity. [33] However, the use of ionicliquid limits its application because of its high cost, toxicity and po-tential difficulties in product separation. To design a scalable greenprocess, water is the preferred solvent. Iron doped zeolite Y [34,35],MFI [36], and montmorillonites [37] were reported to be active inglucose conversion. However, regardless of the topology, these solid-acid zeolites were poorly selective towards HMF, yielding levulinic andformic acids as the main products especially under low pH and longreaction times.
In this work, we explored the effect of Sn and Ga addition in zeoliteY on the performance for glucose conversion at relatively low tem-perature (140 °C) in water, 0.1M HCl, and DMSO. More recently, it hasbeen shown that the incorporation of Sn [38,39] and Ga [40,41] inZeolite Y results in stable catalysts in organic solvents for the produc-tion of various biomass based green chemicals, such as C1–C4 alkyllactates. Unlike beta zeolite, the structure of zeolite Y contains sodalitecavities and super cage structures. [27,42] Conventional zeolite Y hasweak acidity and it is typically hydrothermally unstable with its highaluminium (Al) content (Si/Al< 3.0). [43]. For industrial application,the conventional zeolite Y is replaced by high silica ultra-stable Yzeolite (USY) by removing Al from its framework. [44] The aluminiummay reside outside the zeolite Y crystals and the presence of extraframework aluminium leads to improved hydrothermal stability, in-creased Lewis acidity, and enhanced catalytic activity for reactions thatrequire strong Brønsted acid sites, which are desirable criteria for glu-cose conversion into HMF. While utilising a simple and scalable catalystsynthesis method, we demonstrate the application of Sn and Ga con-taining zeolite Y in the isomerization of glucose and production of HMFin water, 0.1M HCl and DMSO. The recyclability of Sn and Ga materialsare also explored in these solvents. Finally, in-situ XANES analysis isemployed to better understand the behaviour of Sn and Ga active sitesduring reactions.
2. Experimental
2.1. Synthesis of catalysts
Zeolite Y catalyst was obtained from Alfa Aesar (#45870, SiO2/Al2O3 mole ratio 30:1, proton form, HY, CAS: 1318−02-1).Dealumination of zeolite Y was performed based on methods adoptedfrom literature [39]. First 5 g of HY was placed in a round bottom flaskand 50mL of 8M nitric acid solution was added. Second, the mixturewas stirred in at 80 °C for 20 h under reflux. After cooling to roomtemperature, the catalyst was recovered via filtration and washed withdeionized water. Finally, the resulting solid was dried at 80 °C anddenoted as deAl-HY. For the preparation of Tin (Sn) and Gallium (Ga)containing zeolite Y an adapted incipient wetness technique was ap-plied. Typically, a metal containing precursor solution was made bydissolving 0.118 g of Tin (IV) Chloride Pentahydrate (99.9 % VWR) or0.147 g of Gallium (III) Nitrate Hydrate (99.9 % Fisher Scientific) in0.739mL of demi water. Then, the metal precursor solution was addeddropwise on 1 g of deAl-HY. The resulting mixtures were stirred beforedrying at 80 °C for 24 h. Finally, the samples were calcined at 550 °C (ata heating rate of 1 °Cmin−1) for 5 h. The Sn and Ga modified zeoliteswere denoted as Sn-deAl-HY and Ga-deAl-HY respectively.
2.2. Characterization of catalysts
Powder X-ray Diffraction (XRD) patterns were recorded on aPanalytical X’Pert Pro spectrometer equipped with a monochromatic CuKα1 radiation and a PIXcel solid-state detector, in the 2θ range of 5–40 °
with a scanning speed of 0.05° min−1.Nitrogen sorption isotherms were measured at −196 °C on a
Micromeritics ASAP2020 instrument in static measurement mode. Thesamples were outgassed at 450 °C for 8 h prior to the sorption mea-surements. The Brunauer-Emmett-Teller (BET) equation was used tocalculate the specific surface area (SBET) from the adsorption branchobtained between p/p0 0.05 and 0.25. The total pore volume (Vtot) iscalculated at p/p0= 0.97. The mesopore volume (Vmeso) and mesoporesize distribution were calculated using the Barrett-Joyner-Halenda(BJH) method on the adsorption branch of the isotherm. The microporevolume (Vmicro) was calculated from the t-plot curve at thickness rangebetween 3.5 and 5.4 Å. The micropore size distribution was calculatedusing the Horvath-Kawazoe (HK) method applying Saito-Foley (SF)correction.
The x-ray photoelectron spectroscopy (XPS) data were collected atthe Warwick Photoemission Facility, University of Warwick. The sam-ples investigated in this study were attached to electrically-conductivecarbon tape, mounted on to a sample bar and loaded in to a Kratos AxisUltra DLD spectrometer which possesses a base pressure below2×10−10 mbar. XPS measurements were performed in the mainanalysis chamber, with the sample being illuminated using a monochromated Al Kα x-ray source (hν =1486.7 eV). The measurementswere conducted at room temperature and at a take-off angle of 90° withrespect to the surface parallel. The core level spectra were recordedusing a pass energy of 20 eV (resolution approx. 0.4 eV), from an ana-lysis area of 300 μm x 700 μm. The work function and binding energyscale of the spectrometer were calibrated using the Fermi edge and 3d5/2 peak recorded from a polycrystalline Ag sample prior to the com-mencement of the experiments. To prevent surface charging, the sur-face was flooded with a beam of low energy electrons throughout theexperiment and this necessitated recalibration of the binding energyscale. To achieve this, the main C-C/C-H component of the C 1s spec-trum was referenced to 284.8 eV. The data were analysed in the CasaXPS package, using Shirley backgrounds and mixed Gaussian-Lorentzian (Voigt) line shapes. For compositional analysis, the analysertransmission function has been determined using clean metallic foils todetermine the detection efficiency across the full binding energy range.
Aluminium, Tin and Ga contents of catalysts were determined byinductively coupled plasma optical emission spectroscopy (ICP-OES).Prior to the measurement the samples were dissolved in an acid mixtureof HF/HNO3/H2O (1 : 1 : 1).
Scanning Electron Microscopy (SEM) was performed using a ZEISSscanning electron microscope SUPRA 55-VP. The catalysts were coatedwith gold prior to measurements.
UV–vis diffuse reflectance spectra (DRS) were recorded on aShimadzu UV-2401 PC spectrometer in diffuse reflectance mode with a60mm integrating sphere. BaSO4 was used as the reference. The spectrawere transformed into Kubela-Munk function and deconvoluted intosubbands by Fityk [45] peak fitting software.
The 29Si solid state magic-angle-spinning, nuclear magnetic re-sonance (MAS NMR) data were acquired at 7.05 T using a VarianInfinityPlus-300 spectrometer for operating at 29Si and 1H Larmorfrequencies (νo) of 59.59 and 300.13MHz, respectively, and a Bruker7mm HX probe which enabled MAS frequencies of 5 kHz throughout.The 29Si pulse calibration was undertaken on solid kaolinite from whicha π/2 pulse length of 4.5 μs was measured. All 29Si MAS NMR data wasmeasured using single pulse experiments employing π/3 pulse lengthsof 3 μs, a recycle delay of 240 s, and high power 1H decoupling of∼80 kHz through the data (FID) acquisition period. The reported 29Sichemical shifts were referenced to TMS (δiso =0.0 ppm, IUPAC primaryreference) via a secondary solid kaolinite reference (δiso = -92 ppm).[46] The corresponding 27Al MAS NMR data were measured at 9.4 Tusing a Bruker Avance HD spectrometer operating at 27Al and 1HLarmor frequencies of 104.23 and 400.13MHz, respectively, and aBruker 3.2mm HX probe which facilitated MAS frequencies of 20 kHzthroughout. For quantitative 27Al single pulse measurements within the
R. Oozeerally, et al. Applied Catalysis A, General 605 (2020) 117798
2
central transition to be obtained, a ‘non-selective’ (solution) π/2 pulselength of 30 μs was calibrated corresponding to a ‘selective’ (solids) π/12 pulse of 1.67 μs was used in conjunction with a recycle delay of 5 s.The reported 27Al chemical shifts were referenced directly to a 1.1M Al(NO3)3 solution (δiso =0.0 ppm, IUPAC primary reference). [46]
The ammonia temperature programmed desorption (TPD) wereperformed by using an excess flow of 2 vol. % ammonia in helium. In atypical experiment, 50mg of fresh catalyst was loaded in a quartz tube.Prior to measurements catalyst was activated in air flow in-situ at550 °C for 1 h. Then the catalyst bed was cooled down to at 100 °C andexposed to ammonia for 0.5 h. The ammonia was then desorbed fromthe catalysts by heating the bed at a rate of 2 °Cmin−1 under heliumflow. The amount of ammonia desorbed was measured by using a massspectrometer (Pfeiffer OmniStar) where m/z=17, 15 were monitored.Known amount of ammonia was injected by a sample loop for quanti-fication.
In-situ X-ray absorption near edge spectroscopy (XANES) experi-ments were performed in fluorescence yield, using a silicon drift diodeas the detector. The sample was mounted within a helium filledchamber to minimise air absorption, which was especially important formeasurements at the Sn edge. [47] A transmission cells designed andbuilt in house are used [48]. The cell can be heated up to 200 °C and itallows uniform mixing of the liquid during the measurements. The li-quid was placed between Kapton windows. XANES spectra were col-lected in transmission mode at the Sn L(III) edge and at Ga K edge at theXMaS beam line of the European Synchrotron Radiation Facility (ESRF)in Grenoble, France. A Si (111) monochromator was used for theseexperiments. In a typical experiment, 20mg of catalyst was mixed with0.2 mL 10 wt. % aqueous glucose solution. Afterwards, this mixture wastransferred into the XANES cell and the cell was sealed. The cell wasthen transferred to the beamline and XANES spectra were recorded atroom temperature, after heating to 140 °C, after subsequent heating at140 °C for 3 h, and after cooling to room temperature. An experimentwas carried out without adding sugar by following the same proceduredescribed above. The XANES spectra of references in powder form wererecorded at room temperature as self-supporting pellets (13mm dia-meter) of the physical mixture of powder materials and the powdercrystalline micro cellulose.
2.3. Catalytic activity measurements
Catalytic activity measurements were performed in 4mL glass re-action vials. The reactors were heated in an oil bath placed on top of amagnetic stirrer. In a typical experiment, a stock solution of D-(+)-Glucose (> 99.5 %, Sigma Aldrich) or of D-(-)-Fructose (> 99 %,Sigma Aldrich) was prepared using the desired solvent at a sugar con-centration of 100mgmL−1 and 3mL was distributed over the reactors.Water, dimethylsulfoxide (DMSO, Fisher Scientific) and 0.1M hydro-chloric acid solution were used as the reaction medium. After in-troducing the catalyst (40mg), the reactor was closed and placed in thepreheated oil bath at 140 °C for 3 h. Afterwards, the reaction wasstopped by quenching the reaction vial at 0 °C. The product mixture wasanalysed by Shimadzu High Performance Liquid Chromatography(HPLC) equipped with Photo Diode Array (PDA) Detector andEvaporative Light Scattering Detector (ELSD) over a Bio-rad AminexHPX-87 P column. Glucose, fructose, and mannose were detected byELSD while HMF was detected by PDA detector. The mobile phase(0.6 mLmin−1) was water and the column temperature were 50 °C.Sugars and HMF concentration were calculated with respect to externalstandards. The conversion was calculated as the number of moles ofglucose reacted per mole of glucose in stock solution. The product yieldis defined as the number of moles of product formed per mole of glucosein stock solution.
Recycle tests were performed using a 25mL stainless steel reactorequipped with a PTFE inner lining (Berghof, BR-25). In a typical ex-periment, a stock solution of D-(+)-Glucose was prepared at a sugar
concentration of 100mgmL−1 and 15mL was added to the reactoralong with 200mg of catalyst. The reactor was then sealed and pres-surized to 10 bars using an inert gas (Helium, He) before being im-mersed into a preheated aluminium heating block on a magnetic stir-ring plate. After 3 h, the reaction was stopped by quenching the reactorat 0 °C. The catalyst was filtered, washed with deionised water, anddried overnight at 80 °C. The recovered catalyst was used for the sub-sequent reaction cycle and all the liquids were analysed by HPLC.
3. Results and discussion
3.1. Structure and morphology
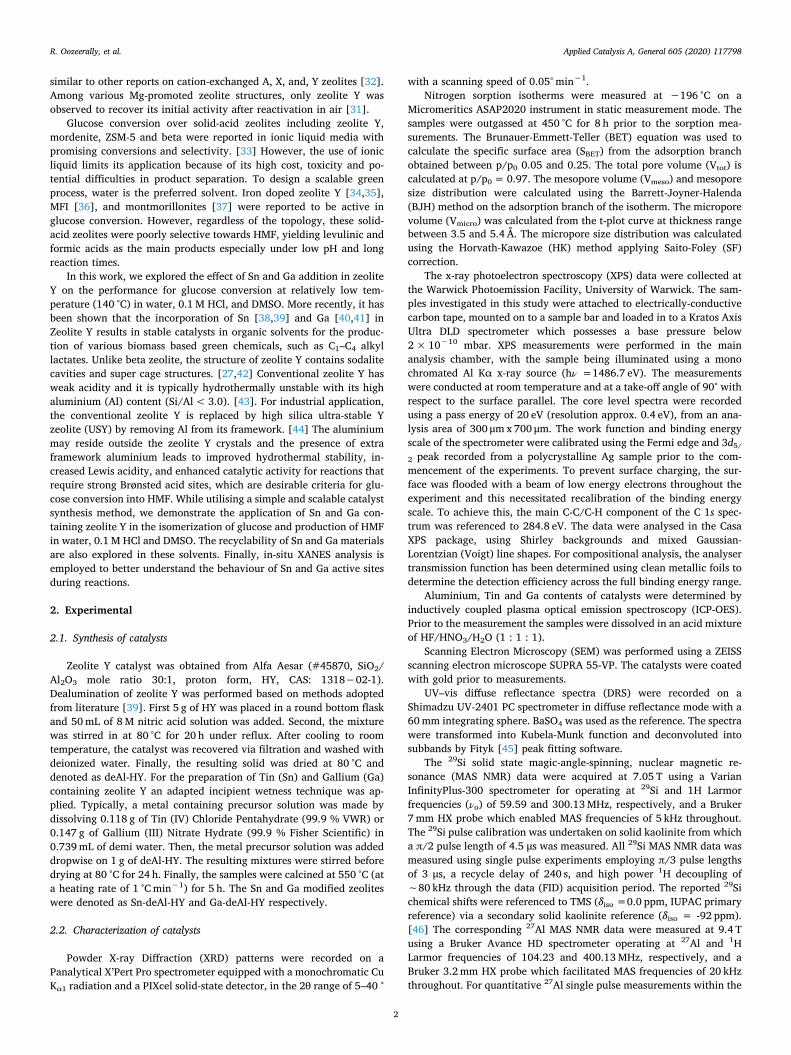
The powder XRD patterns of the catalysts are presented in Fig. 1.The parent material, zeolite Y in hydrogen form, exhibits the typicalpattern [49] of a USY zeolite (Fig. 1 a). The dealumination of the parentzeolite Y were conducted in nitric acid prior to the addition of metalprecursors. The dealuminated zeolite Y (deAl-HY) exhibits the sameintense X-Ray diffraction peaks (Fig. 1 b) indicating that the originalstructure of HY is retained, and it does not suffer any structural damagefrom the acid treatment. Fig. 1 c and d show the powder XRD patternsof Sn and Ga incorporated in deAl-HY respectively. Similarly, thepowder XRD spectra of these materials exhibit sharp peaks, showingthat the zeolite crystal structures are preserved. No features belongingto larger metal oxide phases are observed suggesting the high disper-sion of Sn and Ga. This could indicate that Sn and Ga are either em-bedded into the framework, or the T atoms (Si or Al) of the zeoliteframework are partially replaced by the newly introduced metals. It isalso possible that they are present in the catalyst as extra frameworkspecies in small size (i.e. < 2 nm) outside the detection limits ofpowder XRD.
Fig. 2 shows the N2 adsorption-desorption isotherms and the pore
Fig. 1. Powder XRD patterns of catalysts a) HY, b) deAl-HY c) Sn-deAl-HY d)Ga-deAl-HY.
R. Oozeerally, et al. Applied Catalysis A, General 605 (2020) 117798
3
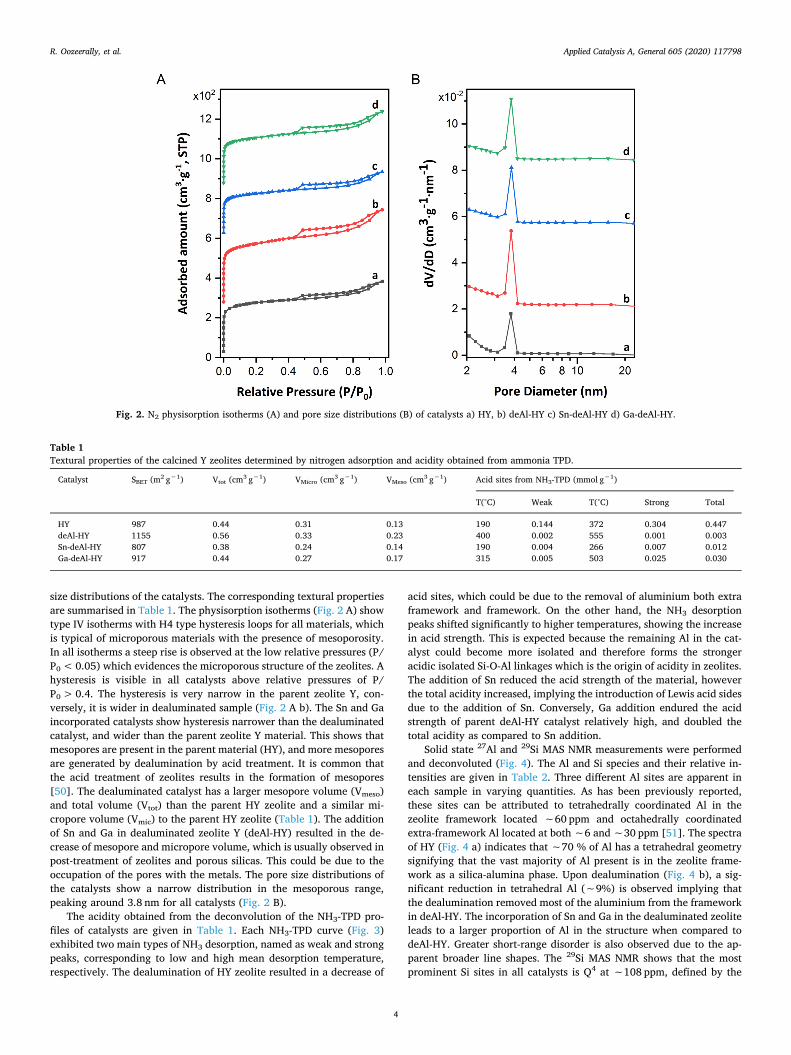
size distributions of the catalysts. The corresponding textural propertiesare summarised in Table 1. The physisorption isotherms (Fig. 2 A) showtype IV isotherms with H4 type hysteresis loops for all materials, whichis typical of microporous materials with the presence of mesoporosity.In all isotherms a steep rise is observed at the low relative pressures (P/P0<0.05) which evidences the microporous structure of the zeolites. Ahysteresis is visible in all catalysts above relative pressures of P/P0>0.4. The hysteresis is very narrow in the parent zeolite Y, con-versely, it is wider in dealuminated sample (Fig. 2 A b). The Sn and Gaincorporated catalysts show hysteresis narrower than the dealuminatedcatalyst, and wider than the parent zeolite Y material. This shows thatmesopores are present in the parent material (HY), and more mesoporesare generated by dealumination by acid treatment. It is common thatthe acid treatment of zeolites results in the formation of mesopores[50]. The dealuminated catalyst has a larger mesopore volume (Vmeso)and total volume (Vtot) than the parent HY zeolite and a similar mi-cropore volume (Vmic) to the parent HY zeolite (Table 1). The additionof Sn and Ga in dealuminated zeolite Y (deAl-HY) resulted in the de-crease of mesopore and micropore volume, which is usually observed inpost-treatment of zeolites and porous silicas. This could be due to theoccupation of the pores with the metals. The pore size distributions ofthe catalysts show a narrow distribution in the mesoporous range,peaking around 3.8 nm for all catalysts (Fig. 2 B).
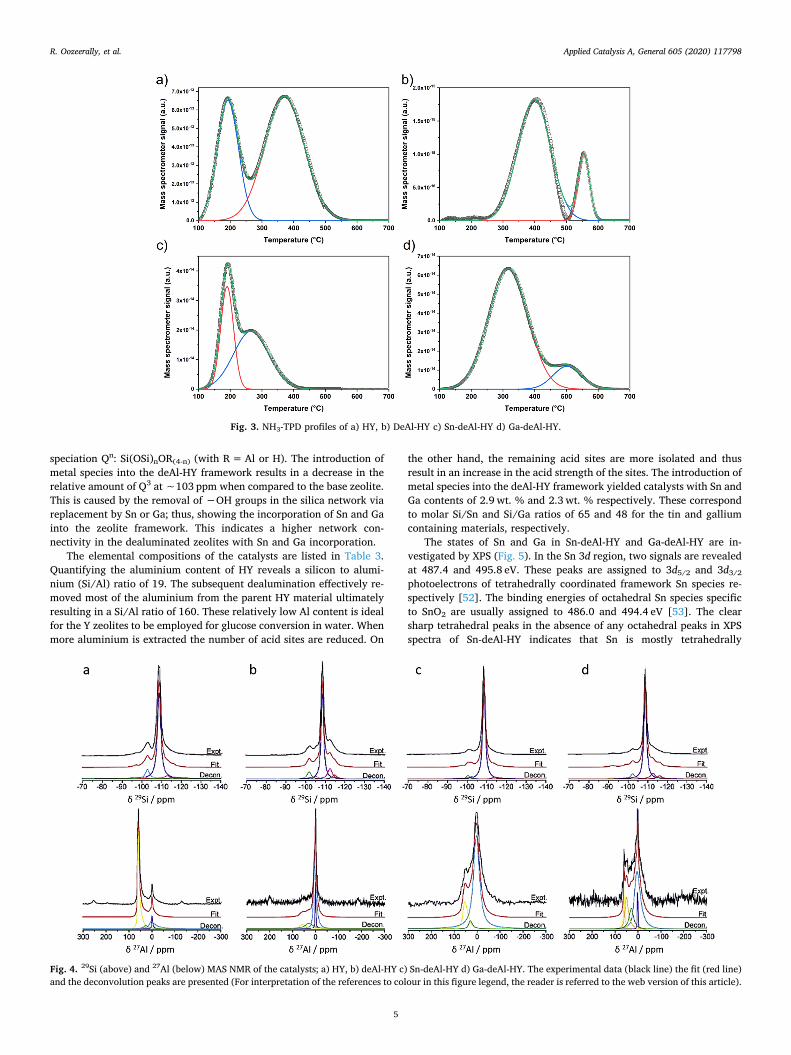
The acidity obtained from the deconvolution of the NH3-TPD pro-files of catalysts are given in Table 1. Each NH3-TPD curve (Fig. 3)exhibited two main types of NH3 desorption, named as weak and strongpeaks, corresponding to low and high mean desorption temperature,respectively. The dealumination of HY zeolite resulted in a decrease of
acid sites, which could be due to the removal of aluminium both extraframework and framework. On the other hand, the NH3 desorptionpeaks shifted significantly to higher temperatures, showing the increasein acid strength. This is expected because the remaining Al in the cat-alyst could become more isolated and therefore forms the strongeracidic isolated Si-O-Al linkages which is the origin of acidity in zeolites.The addition of Sn reduced the acid strength of the material, howeverthe total acidity increased, implying the introduction of Lewis acid sidesdue to the addition of Sn. Conversely, Ga addition endured the acidstrength of parent deAl-HY catalyst relatively high, and doubled thetotal acidity as compared to Sn addition.
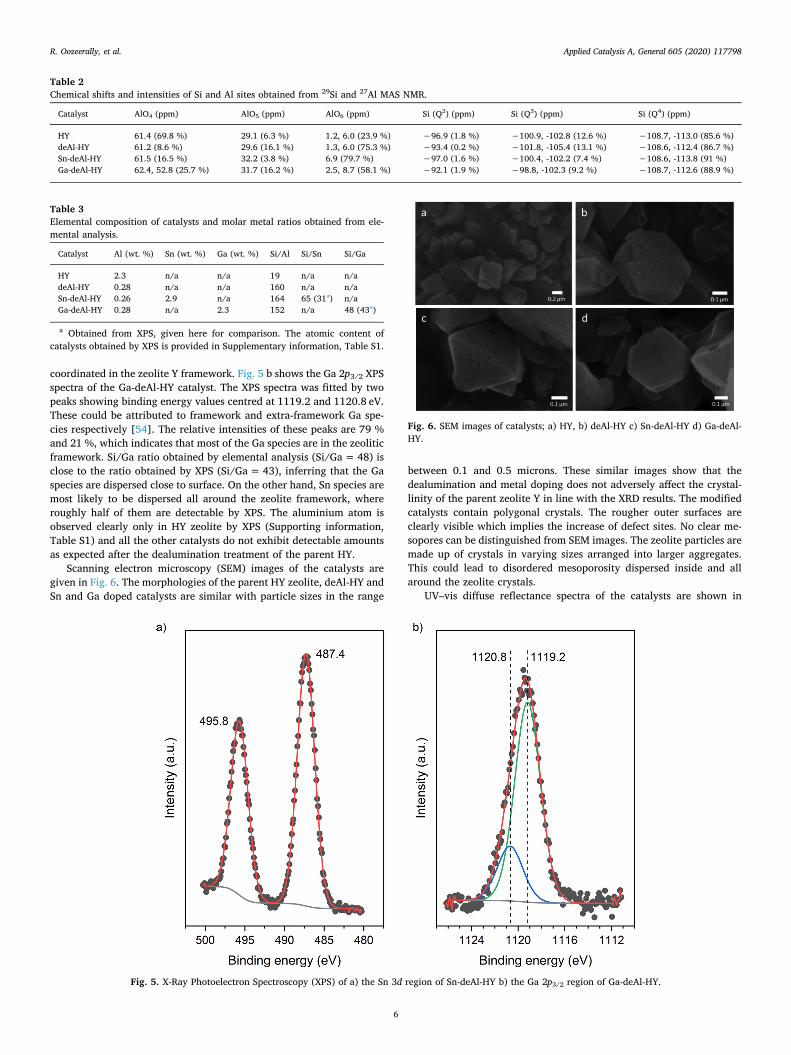
Solid state 27Al and 29Si MAS NMR measurements were performedand deconvoluted (Fig. 4). The Al and Si species and their relative in-tensities are given in Table 2. Three different Al sites are apparent ineach sample in varying quantities. As has been previously reported,these sites can be attributed to tetrahedrally coordinated Al in thezeolite framework located ∼60 ppm and octahedrally coordinatedextra-framework Al located at both ∼6 and ∼30 ppm [51]. The spectraof HY (Fig. 4 a) indicates that ∼70 % of Al has a tetrahedral geometrysignifying that the vast majority of Al present is in the zeolite frame-work as a silica-alumina phase. Upon dealumination (Fig. 4 b), a sig-nificant reduction in tetrahedral Al (∼9%) is observed implying thatthe dealumination removed most of the aluminium from the frameworkin deAl-HY. The incorporation of Sn and Ga in the dealuminated zeoliteleads to a larger proportion of Al in the structure when compared todeAl-HY. Greater short-range disorder is also observed due to the ap-parent broader line shapes. The 29Si MAS NMR shows that the mostprominent Si sites in all catalysts is Q4 at ∼108 ppm, defined by the
Fig. 2. N2 physisorption isotherms (A) and pore size distributions (B) of catalysts a) HY, b) deAl-HY c) Sn-deAl-HY d) Ga-deAl-HY.
Table 1Textural properties of the calcined Y zeolites determined by nitrogen adsorption and acidity obtained from ammonia TPD.
Catalyst SBET (m2 g−1) Vtot (cm3 g−1) VMicro (cm3 g−1) VMeso (cm3 g−1) Acid sites from NH3-TPD (mmol g−1)
T(°C) Weak T(°C) Strong Total
HY 987 0.44 0.31 0.13 190 0.144 372 0.304 0.447deAl-HY 1155 0.56 0.33 0.23 400 0.002 555 0.001 0.003Sn-deAl-HY 807 0.38 0.24 0.14 190 0.004 266 0.007 0.012Ga-deAl-HY 917 0.44 0.27 0.17 315 0.005 503 0.025 0.030
R. Oozeerally, et al. Applied Catalysis A, General 605 (2020) 117798
4
speciation Qn: Si(OSi)nOR(4-n) (with R=Al or H). The introduction ofmetal species into the deAl-HY framework results in a decrease in therelative amount of Q3 at ∼103 ppm when compared to the base zeolite.This is caused by the removal of −OH groups in the silica network viareplacement by Sn or Ga; thus, showing the incorporation of Sn and Gainto the zeolite framework. This indicates a higher network con-nectivity in the dealuminated zeolites with Sn and Ga incorporation.
The elemental compositions of the catalysts are listed in Table 3.Quantifying the aluminium content of HY reveals a silicon to alumi-nium (Si/Al) ratio of 19. The subsequent dealumination effectively re-moved most of the aluminium from the parent HY material ultimatelyresulting in a Si/Al ratio of 160. These relatively low Al content is idealfor the Y zeolites to be employed for glucose conversion in water. Whenmore aluminium is extracted the number of acid sites are reduced. On
the other hand, the remaining acid sites are more isolated and thusresult in an increase in the acid strength of the sites. The introduction ofmetal species into the deAl-HY framework yielded catalysts with Sn andGa contents of 2.9 wt. % and 2.3 wt. % respectively. These correspondto molar Si/Sn and Si/Ga ratios of 65 and 48 for the tin and galliumcontaining materials, respectively.
The states of Sn and Ga in Sn-deAl-HY and Ga-deAl-HY are in-vestigated by XPS (Fig. 5). In the Sn 3d region, two signals are revealedat 487.4 and 495.8 eV. These peaks are assigned to 3d5/2 and 3d3/2photoelectrons of tetrahedrally coordinated framework Sn species re-spectively [52]. The binding energies of octahedral Sn species specificto SnO2 are usually assigned to 486.0 and 494.4 eV [53]. The clearsharp tetrahedral peaks in the absence of any octahedral peaks in XPSspectra of Sn-deAl-HY indicates that Sn is mostly tetrahedrally
Fig. 3. NH3-TPD profiles of a) HY, b) DeAl-HY c) Sn-deAl-HY d) Ga-deAl-HY.
Fig. 4. 29Si (above) and 27Al (below) MAS NMR of the catalysts; a) HY, b) deAl-HY c) Sn-deAl-HY d) Ga-deAl-HY. The experimental data (black line) the fit (red line)and the deconvolution peaks are presented (For interpretation of the references to colour in this figure legend, the reader is referred to the web version of this article).
R. Oozeerally, et al. Applied Catalysis A, General 605 (2020) 117798
5
coordinated in the zeolite Y framework. Fig. 5 b shows the Ga 2p3/2 XPSspectra of the Ga-deAl-HY catalyst. The XPS spectra was fitted by twopeaks showing binding energy values centred at 1119.2 and 1120.8 eV.These could be attributed to framework and extra-framework Ga spe-cies respectively [54]. The relative intensities of these peaks are 79 %and 21 %, which indicates that most of the Ga species are in the zeoliticframework. Si/Ga ratio obtained by elemental analysis (Si/Ga=48) isclose to the ratio obtained by XPS (Si/Ga= 43), inferring that the Gaspecies are dispersed close to surface. On the other hand, Sn species aremost likely to be dispersed all around the zeolite framework, whereroughly half of them are detectable by XPS. The aluminium atom isobserved clearly only in HY zeolite by XPS (Supporting information,Table S1) and all the other catalysts do not exhibit detectable amountsas expected after the dealumination treatment of the parent HY.
Scanning electron microscopy (SEM) images of the catalysts aregiven in Fig. 6. The morphologies of the parent HY zeolite, deAl-HY andSn and Ga doped catalysts are similar with particle sizes in the range
between 0.1 and 0.5 microns. These similar images show that thedealumination and metal doping does not adversely affect the crystal-linity of the parent zeolite Y in line with the XRD results. The modifiedcatalysts contain polygonal crystals. The rougher outer surfaces areclearly visible which implies the increase of defect sites. No clear me-sopores can be distinguished from SEM images. The zeolite particles aremade up of crystals in varying sizes arranged into larger aggregates.This could lead to disordered mesoporosity dispersed inside and allaround the zeolite crystals.
UV–vis diffuse reflectance spectra of the catalysts are shown in
Table 2Chemical shifts and intensities of Si and Al sites obtained from 29Si and 27Al MAS NMR.
Catalyst AlO4 (ppm) AlO5 (ppm) AlO6 (ppm) Si (Q2) (ppm) Si (Q3) (ppm) Si (Q4) (ppm)
HY 61.4 (69.8 %) 29.1 (6.3 %) 1.2, 6.0 (23.9 %) −96.9 (1.8 %) −100.9, -102.8 (12.6 %) −108.7, -113.0 (85.6 %)deAl-HY 61.2 (8.6 %) 29.6 (16.1 %) 1.3, 6.0 (75.3 %) −93.4 (0.2 %) −101.8, -105.4 (13.1 %) −108.6, -112.4 (86.7 %)Sn-deAl-HY 61.5 (16.5 %) 32.2 (3.8 %) 6.9 (79.7 %) −97.0 (1.6 %) −100.4, -102.2 (7.4 %) −108.6, -113.8 (91 %)Ga-deAl-HY 62.4, 52.8 (25.7 %) 31.7 (16.2 %) 2.5, 8.7 (58.1 %) −92.1 (1.9 %) −98.8, -102.3 (9.2 %) −108.7, -112.6 (88.9 %)
Table 3Elemental composition of catalysts and molar metal ratios obtained from ele-mental analysis.
Catalyst Al (wt. %) Sn (wt. %) Ga (wt. %) Si/Al Si/Sn Si/Ga
HY 2.3 n/a n/a 19 n/a n/adeAl-HY 0.28 n/a n/a 160 n/a n/aSn-deAl-HY 0.26 2.9 n/a 164 65 (31a) n/aGa-deAl-HY 0.28 n/a 2.3 152 n/a 48 (43a)
a Obtained from XPS, given here for comparison. The atomic content ofcatalysts obtained by XPS is provided in Supplementary information, Table S1.
Fig. 5. X-Ray Photoelectron Spectroscopy (XPS) of a) the Sn 3d region of Sn-deAl-HY b) the Ga 2p3/2 region of Ga-deAl-HY.
Fig. 6. SEM images of catalysts; a) HY, b) deAl-HY c) Sn-deAl-HY d) Ga-deAl-HY.
R. Oozeerally, et al. Applied Catalysis A, General 605 (2020) 117798
6
Fig. 7 and their deconvoluted counterparts are presented in supportinginformation (Supporting information, Figure S1). The spectrum of HY(Fig. 7 a) is dominated by two intense bands at 223 nm with a shoulderat 201 nm and 271 nm, which are typical of zeolite framework [55,56].Dealumination of the parent zeolite Y resulted in a change in the re-lative intensities of the features; the band at 201 nm became the shar-pest peak (Fig. 7 b). The lower wavelengths are usually ascribed to thecharge transfer between the oxygens and the tetrahedrally coordinatedframework metal atoms. This implies that the dealumination processmight have washed out the extra framework alumina and caused ahigher absorption in lower wavelengths. The introduction of Sn to deAl-HY results in a broader spectrum with bands between 200 nm and300 nm (Fig. 7 c). This UV–vis spectra of Sn-deAl-HY is typical ofconventional Sn containing zeolites, and the broad absorption at amaximum around 270 nm with a shoulder expanding to 300 nm ispreviously ascribed to extra framework or polymeric Sn-O-Sn type sites,while the peak at 220 nm is often assumed to be the catalytically activeisolated SnIV in tetrahedral coordination in the framework. [57] Theabsence of strong absorption above 300 nm indicates that there is nobulk SnO2 present because SnO2 usually shows an absorption band at340 nm that could be attributed to the octahedral coordination of Sn inthe SnO2 framework. [58] Conversely, Ga-deAl-HY shows a narrowerspectrum, maximising at 205 nm with a shoulder until 270 nm. Thismay indicate that the Ga is occupying mostly the framework positionsas isolated species and therefore its spectrum is dominated with thepeak at 205 nm, whereas Sn has a broader distribution between theframework and extra framework sites.
3.2. Glucose dehydration to HMF
Fig. 8 a–c shows the conversion of glucose and the product yields of
HMF, fructose and mannose in water, in acid solution (HCl, pH=1.0)and in a polar aprotic solvent (DMSO) respectively. The blank reactionwithout any catalyst results in a glucose conversion like that of HY inwater (Fig. 8 a). It is evident that HY does not have any significanteffect on the reaction. This is likely due to the lack of Lewis acid sites inHY. The deAl-HY shows similar results to HY and blank reactions, inother words, the deAl-HY zeolite does not catalyse the reaction anyfurther than HY. When the Sn is incorporated into the zeolite Y fra-mework, more drastic changes are observed in conversion and in pro-duct yields. The catalyst Sn-deAl-HY zeolite resulted in a glucose con-version of 35 %. More interestingly, the fructose yield of 13 % wasobserved. This shows that Sn included zeolite Y is an active catalyst forthe isomerization of glucose into fructose. The isolated framework SnIV
species are considered the active sites for the isomerization reactionover Sn-beta in literature [24], thus this result indicates that Sn is in-corporated as isolated species into the framework of deAl-HY. Similarly,the Ga-deAl-HY shows activity for isomerization of glucose into fruc-tose. The glucose conversion (17 %) and fructose yield (5 %) werelower than the Sn included catalyst. Nevertheless, this activity provesthat the Ga species form isolated active sites in Ga-deAl-HY and theyprovide the Lewis acidity necessary to catalyse the isomerization re-action.
It has been shown in literature that the fructose could be easilyconverted into HMF in mineral acids at pH=1.0 (0.1M HCl) catalysedby the Brønsted acidity. [59] To drive the reaction towards HMF, weexamined the glucose conversion over the catalysts in 0.1M HCl (Fig. 8b). The glucose conversion increased in the blank reaction and over allcatalysts at pH=1.0 in the Brønsted acidic medium. The HY showsslightly higher glucose conversion and HMF yields than the blank re-action, whereas deAl-HY and Sn-deAl-HY show similar results to blankreaction. The conversion over Sn-deAl-HY in 0.1M HCl is not sig-nificantly different as compared to when water is the reaction mediumover the same catalyst. As the mechanism of glucose conversion couldbe quite complex [60], in the presence of HCl the reaction may proceedthrough the routes catalysed by the mineral acid only in a competitivefashion and the Sn-deAl-HY may not be able to play a role. On the otherhand, Ga-deAl-HY shows higher glucose conversion than all the othercases. Although the reason is not clear, it could be due to the active Gaspecies catalysing the glucose and any other reaction intermediateseffectively not only to form HMF but to form unidentified side productsthrough alternative reaction pathways. No fructose formation is ob-served over Sn-deAl-HY and trace amount were seen over Ga-deAl-HY(< 2 %). This implies that the reaction is mainly catalysed by theBrønsted acidic protons of the mineral acid where all the fructoseformed is readily converted into HMF (or into any other side product).It is important to note that HMF does not necessarily need to be formedthrough the isomerisation of glucose to fructose catalysed by the zeo-lites under these conditions. In other words, it is possible that HMFcould also be formed through Brønsted acidic proton catalysing alter-native reaction mechanisms. The alternative reaction pathways couldbe prevalent under these conditions, and we speculate that it could bethe reason for HY showing higher glucose conversion than deAl-HYwhere the former has higher alumina content, and thus possesses moreacid sites.
The widely accepted mechanism of glucose isomerisation to fructosethrough hydride shift is given in Scheme 1. The other products includemannose through glucose epimerisation, soluble polymers and in-soluble poorly characterised oligomeric species named as humins. Theaprotic polar solvents, i.e. DMSO, was shown to supress the formationof humins (carbon based dark-coloured tarry solids [61]) and enhanceHMF yields [62]. Not only are humins an undesired side product, butalso their accumulation may block the catalytically actives sites. DMSOhas also been shown to catalyse the fructose dehydration to HMF [63].Therefore, the effect of DMSO on reactions is twofold. As shown inFig. 8 c, the use of DMSO as the solvent significantly increased glucoseconversion in the blank reaction and in the presence of all catalysts. The
Fig. 7. UV–vis diffuse reflectance spectra of catalysts a) HY, b) deAl-HY c) Sn-deAl-HY d) Ga-deAl-HY.
R. Oozeerally, et al. Applied Catalysis A, General 605 (2020) 117798
7
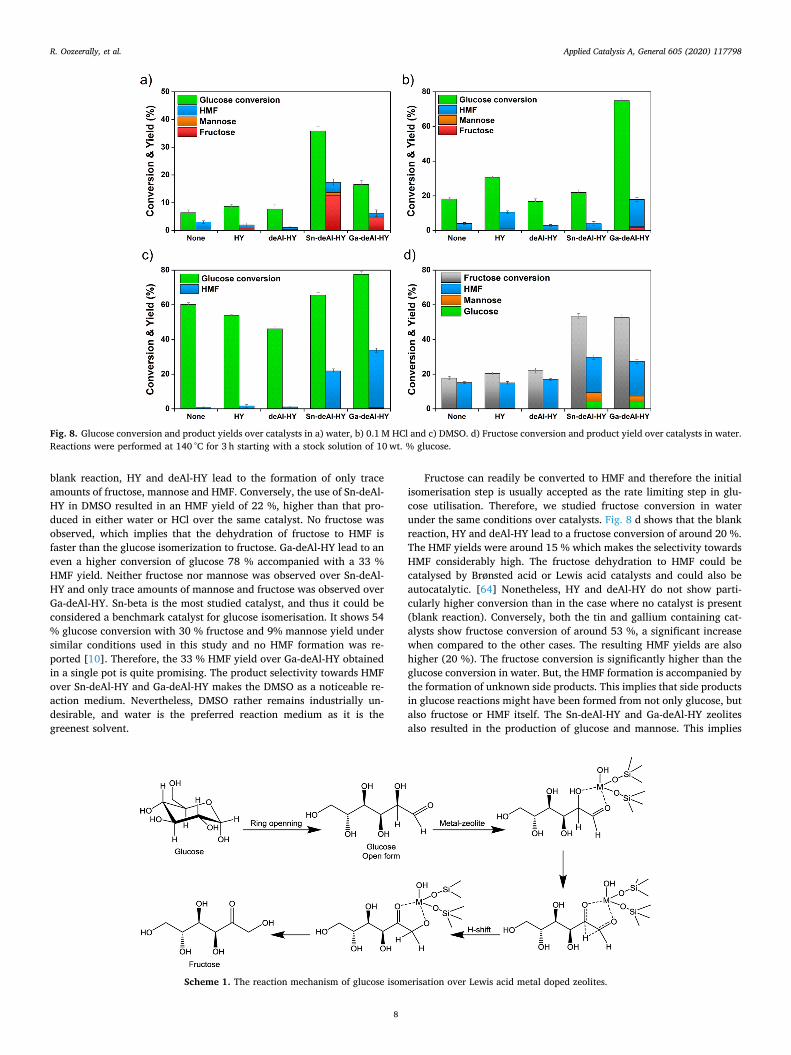
blank reaction, HY and deAl-HY lead to the formation of only traceamounts of fructose, mannose and HMF. Conversely, the use of Sn-deAl-HY in DMSO resulted in an HMF yield of 22 %, higher than that pro-duced in either water or HCl over the same catalyst. No fructose wasobserved, which implies that the dehydration of fructose to HMF isfaster than the glucose isomerization to fructose. Ga-deAl-HY lead to aneven a higher conversion of glucose 78 % accompanied with a 33 %HMF yield. Neither fructose nor mannose was observed over Sn-deAl-HY and only trace amounts of mannose and fructose was observed overGa-deAl-HY. Sn-beta is the most studied catalyst, and thus it could beconsidered a benchmark catalyst for glucose isomerisation. It shows 54% glucose conversion with 30 % fructose and 9% mannose yield undersimilar conditions used in this study and no HMF formation was re-ported [10]. Therefore, the 33 % HMF yield over Ga-deAl-HY obtainedin a single pot is quite promising. The product selectivity towards HMFover Sn-deAl-HY and Ga-deAl-HY makes the DMSO as a noticeable re-action medium. Nevertheless, DMSO rather remains industrially un-desirable, and water is the preferred reaction medium as it is thegreenest solvent.
Fructose can readily be converted to HMF and therefore the initialisomerisation step is usually accepted as the rate limiting step in glu-cose utilisation. Therefore, we studied fructose conversion in waterunder the same conditions over catalysts. Fig. 8 d shows that the blankreaction, HY and deAl-HY lead to a fructose conversion of around 20 %.The HMF yields were around 15 % which makes the selectivity towardsHMF considerably high. The fructose dehydration to HMF could becatalysed by Brønsted acid or Lewis acid catalysts and could also beautocatalytic. [64] Nonetheless, HY and deAl-HY do not show parti-cularly higher conversion than in the case where no catalyst is present(blank reaction). Conversely, both the tin and gallium containing cat-alysts show fructose conversion of around 53 %, a significant increasewhen compared to the other cases. The resulting HMF yields are alsohigher (20 %). The fructose conversion is significantly higher than theglucose conversion in water. But, the HMF formation is accompanied bythe formation of unknown side products. This implies that side productsin glucose reactions might have been formed from not only glucose, butalso fructose or HMF itself. The Sn-deAl-HY and Ga-deAl-HY zeolitesalso resulted in the production of glucose and mannose. This implies
Fig. 8. Glucose conversion and product yields over catalysts in a) water, b) 0.1M HCl and c) DMSO. d) Fructose conversion and product yield over catalysts in water.Reactions were performed at 140 °C for 3 h starting with a stock solution of 10wt. % glucose.
Scheme 1. The reaction mechanism of glucose isomerisation over Lewis acid metal doped zeolites.
R. Oozeerally, et al. Applied Catalysis A, General 605 (2020) 117798
8

that the initial isomerisation and epimerisation steps are equilibriumreactions. Therefore, biphasic systems may work best for increasingglucose conversion and for increasing HMF yields by continual removalHMF.
We performed XANES analysis in-situ at the Sn LIII-edge and Ga K-edge to reveal the changes in the chemical environment of the activemetal sites during the reaction in water (Fig. 9). First, the spectra werecollected when the catalysts were in water in the absence of glucose atroom temperature. Later catalysts were added in 10wt. % glucose stocksolution in water and scans were collected similarly at room tempera-ture when there is no reaction was taking place. The XANES spectra ofSn-deAl-HY revealed bands at 3930 eV, 3941 eV and 3960 eV. These aretypical features of tin oxide and the XANES spectra of Sn-deAl-HYwhich mostly resemble Sn oxide. The only difference is that the band at3941 eV is relatively less sharp. This could be due to the presence ofisolated SnIV species in the zeolite framework. The presence of glucosein water at room temperature has not affected the position of thesefeatures. A post edge band was also observed at 4002 eV in the case ofSn-deAl-HY in water and it disappears with the presence of glucose insolution. Afterwards, the reactor was heated to the reaction tempera-ture of 140 °C and the spectra were collected in situ at 140 °C after10min and after 3 h. The band at 3941 eV became sharper relative toother bands as soon as the reaction started when compared to the noreaction case (Fig. 9A d–e). It remained the same and similar spectrawere obtained after 3 h of reaction. Meanwhile, there were no changesin other features. The pre-edge features in XANES are very sensitive tothe oxidation state and chemical environment of the metal under study.In this case, the change in the sharpness of the band at 3941 eV could bedue to the isolated Sn sites being coordinated with the oxygens of thereactants and intermediates, i.e. glucose, fructose, and HMF. Similartrends are observed in the case of Ga-deAl-HY (Fig. 9B). The two mainfeatures of the XANES spectra of Ga are at 10,379 eV and 10,395 eV.The spectra of Ga-deAl-HY resembles that of Ga oxide. Upon addition ofglucose in water, the spectra do not have any difference to that of Ga-deAl-HY in water. However, the reaction affects the relative intensity ofthese bands, and the latter band becomes relatively more intense.Likewise, it could be due to the strong interaction of the isolated Gaspecies with the reacting hydrocarbon molecules in the solutionmedium.
3.3. Catalyst stability and recycling
The deactivation of the catalysts usually occurs through theleaching of the active metal species during the reaction. Therefore, westudied the stability of the catalysts by analysing the amount of activemetals (Sn or Ga) in the reaction medium after the reaction, the resultsof which are shown in Table 4. Sn-deAl-HY shows higher stability ascompared to Ga-deAl-HY in all solvents. The amount of tin leached fromSn-deAl-HY is less than 0.6 % of Sn present in the catalyst in the be-ginning of the reaction in all solvents. In contrast, Ga leached in greateramounts particularly at pH=1.0. The amount of Ga leached in 0.1MHCl is as high as 55 %.
To assess the reusability of the materials, recycle reactions wereperformed. The Sn-deAl-HY was recycled a total of four times in waterand in DMSO. After each recycle reaction the catalyst was recovered viaa centrifuge before being added back to a fresh stock solution. As shownin Fig. 10, the activity of Sn-deAl-HY significantly reduced from first tosecond cycle of reaction and remained constant thereafter in the fol-lowing reaction cycles. Given the trace amount Sn metal in reactionsolvent, we concluded that leaching is not the main reason for the de-activation of Sn-deAl-HY. Instead the deactivation could be due to anaccumulation of humins on the catalyst surface and thus blocking theaccess to the active sites over time. To remove humin deposits, recycledSn-deAl-HY was reactivated by calcination at elevated temperature(550 °C) after the fourth cycle. XRD analysis revealed that the zeolite Ystructure is maintained after reactivation by calcination (Supportinginformation, Figure S2). Nevertheless, the performance of the catalystwas not recovered. In another attempt, the Sn-deAl-HY was regeneratedafter the 1st reaction cycle. Similarly, this did not help to recover its
Fig. 9. XANES of Sn-deAl-HY (A) and Ga-deAl-HY (B). The spectra of metal foil (a) and metaloxide (b) are given as reference. The spectrawere taken at c) catalyst in water at roomtemperature, d) catalyst in 10wt. % glucosestock solution at room temperature, e) after 3 hof reaction at 140 °C, and f) post reaction aftercooling down the reactor to room temperature.Sn-deAl-HY is shortened as Sn-Y and Ga-deAl-HY is shortened as Ga-Y on the figures. RT re-presents room temperature. Glu/water re-presents the solution of 10wt. % glucose inwater.
Table 4Tin and Gallium content of the post reaction solution after 3 h at 140 °C.
Catalyst Medium Sn (ppm) Ga (ppm)
Sn-deAl-H-Y Water 2.1 n/aSn-deAl-H-Y HCl (pH=1.0) 0.4 n/aSn-deAl-H-Y DMSO 0.5 n/aGa-deAl-H-Y Water n/a 32.1Ga-deAl-H-Y HCl (pH=1.0) n/a 167.2Ga-deAl-H-Y DMSO n/a 40.7
R. Oozeerally, et al. Applied Catalysis A, General 605 (2020) 117798
9

activity either.Fig. 11 shows the recycling of Sn-deAl-HY and Ga-deAl-HY in
DMSO. Glucose conversion and HMF yields remain stable over the re-cycles, within±10 %. A slight decrease is observed after 3rd cycle andthis decline is far less severe than that observed in the water. The re-activation of the Sn-deAl-HY was found to effectively recover the ac-tivity of the catalyst after this cycle. The conversion of glucose and HMFyields over Ga-deAl-HY showed a similar trend and the calcination ofthe spent Ga-deAl-HY in air recovered catalytic activity effectively(Fig. 11 b). XRD analysis of both Sn-deAl-HY and Ga-deAl-HY afterreactivation (Supporting information, Figure S3) show that the struc-tures of the zeolites have been preserved.
4. Conclusions
Tin and gallium containing zeolite Y materials effectively catalysethe isomerization of glucose to fructose and HMF production in water,0.1 M HCl and DMSO. The catalysts can be produced using a simple andscalable method that utilises commercially available zeolite Y. Of thematerials considered, Sn-deAl-HY was found to be the most active
material for glucose isomerization in water. Meanwhile, Ga-deAl-HYwas shown to generate the highest activity and HMF yield when reac-tions were conducted in DMSO. Both catalysts showed higher selectivitytowards HMF in DMSO. We concluded that the deactivation of Sn-deAl-HY in water was likely a result of humin accumulation on the catalystrather than leaching. Whereas, Ga leaches out significantly in water.Both Sn-deAl-HY and Ga-deAl-HY showed stable catalytic performancein cycles of reactions conducted in DMSO. Both catalysts are selectiveand can be regenerated when reactions are conducted in DMSO. Thismakes them promising catalysts for glucose utilisation. Overall, weshowed that post synthesis modification of zeolite Y, and the use of Gaas active metal in zeolite Y, may offer an attractive route towards theproduction of HMF in bio renewables industry.
CRediT authorship contribution statement
Ryan Oozeerally: Investigation, Writing - original draft, Formalanalysis, Methodology, Writing - review & editing. John Pillier:Resources, Methodology, Investigation. Emre Kilic: Investigation,Software. Paul B.J. Thompson: Resources, Methodology,Investigation, Software, Data curation, Writing - review & editing.MarcWalker: Data curation, Writing - review & editing, Resources.Benjamin E. Griffith: Data curation, Investigation, Writing - review &editing. John V. Hanna: Resources, Supervision, Funding acquisition,Writing - review & editing. Volkan Degirmenci: Conceptualization,Methodology, Writing - original draft, Visualization, Supervision,Funding acquisition, Writing - review & editing.
Declaration of Competing Interest
The authors report no declarations of interest.
Acknowledgements
The XANES experiments were performed on beamline BM28 XMaSat the European Synchrotron Radiation Facility (ESRF), Grenoble,France. XMaS is a UK national research facility supported by EPSRC. Weare grateful to all the beamline team staff for their support. V.D and E.K.are grateful for the support provided by Royal Academy of Engineeringunder the grant number NRCP1617/6/204. J.V.H. acknowledges
Fig. 10. Recycling of Sn-deAl-HY in water. Glucose conversion and productyields of 4 reaction cycles and after the reactivation of the catalyst following4th and 1st cycle. Reactions were performed at 140 °C for 3 h starting with astock solution of 10 wt. % glucose.
Fig. 11. Recycling of a) Sn-deAl-HY and b) Ga-deAl-HY in DMSO. Glucose conversion and product yields of 3 reaction cycles and after the reactivation of the catalystsfollowing the 3rd cycle. Reactions were performed at 140 °C for 3 h starting with a stock solution of 10wt. % glucose.
R. Oozeerally, et al. Applied Catalysis A, General 605 (2020) 117798
10
financial support for the solid state NMR instrumentation at Warwickused in this research which was funded by EPSRC (grants EP/M028186/1 and EP/K024418/1), the University of Warwick, and theBirmingham Science City AM1 and AM2 projects which were supportedby Advantage West Midlands (AWM) and the European RegionalDevelopment Fund (ERDF). Authors thank to Nikolay Cherkasov for hissupport on TPD experiments.
Appendix A. Supplementary data
Supplementary material related to this article can be found, in theonline version, at doi:https://doi.org/10.1016/j.apcata.2020.117798.
References
[1] A. Mukherjee, M.Je. Dumont, V. Raghavan, Biomass Bioenerg. 72 (2015) 143–183.[2] F.A. Kucherov, L.V. Romashov, K.I. Galkin, V.P. Ananikov, ACS Sustain. Chem. Eng.
6 (2018) 8064–8092.[3] I.K.M. Yu, D.C.W. Tsang, Bioresour. Technol. 238 (2017) 716–732.[4] R.J. Van Putten, J.C. Van Der Waal, E. De Jong, C.B. Rasrendra, H.J. Heeres, J.G. De
Vries, Chem. Rev. 113 (2013) 1499–1597.[5] J.N. Chheda, Y. Roman-Leshkov, J.A. Dumesic, Green Chem. 9 (2007) 342–350.[6] Y. Roman-Leshkov, J.N. Chheda, J.A. Dumesic, Science 312 (2006) 1933–1937.[7] V. Degirmenci, E.J.M. Hensen, Environ. Prog. Sustain. Energy 33 (2014) 657–662.[8] V. Degirmenci, E.A. Pidko, P.C.M.M. Magusin, E.J.M. Hensen, ChemCatChem 3
(2011) 969–972.[9] S.G. Wettstein, D.M. Alonso, E.I. Gürbüz, J.A. Dumesic, Curr. Opin. Chem. Eng. 1
(2012) 218–224.[10] M. Moliner, Y. Román-Leshkov, M.E. Davis, Proc. Natl. Acad. Sci. U.S.A. 107 (2010)
6164.[11] G.M. Lari, P.Y. Dapsens, D. Scholz, S. Mitchell, C. Mondelli, J. Pérez-Ramírez, Green
Chem. 18 (2016) 1249–1260.[12] D. Padovan, C. Parsons, M. Simplicio Grasina, C. Hammond, Green Chem. 18 (2016)
5041–5049.[13] E. Nikolla, Y. Román-Leshkov, M. Moliner, M.E. Davis, ACS Catal. 1 (2011)
408–410.[14] R. Bermejo-Deval, R.S. Assary, E. Nikolla, M. Moliner, Y. Román-Leshkov, S.-
J. Hwang, A. Palsdottir, D. Silverman, R.F. Lobo, L.A. Curtiss, M.E. Davis, Proc.Natl. Acad. Sci. U. S. A. 109 (2012) 9727.
[15] J.S. Kruger, V. Choudhary, V. Nikolakis, D.G. Vlachos, ACS Catal. 3 (2013)1279–1291.
[16] J. Zhang, L. Wang, G. Wang, F. Chen, J. Zhu, C. Wang, C. Bian, S. Pan, F.-S. Xiao,ACS Sustain. Chem. Eng. 5 (2017) 3123–3131.
[17] L. Ren, Q. Guo, P. Kumar, M. Orazov, D. Xu, S.M. Alhassan, K.A. Mkhoyan,M.E. Davis, M. Tsapatsis, Angew. Chem. Int. Ed. 54 (2015) 10848–10851.
[18] P.Y. Dapsens, C. Mondelli, J. Jagielski, R. Hauert, J. Pérez-Ramírez, Catal. Sci.Technol. 4 (2014) 2302–2311.
[19] C.M. Lew, N. Rajabbeigi, M. Tsapatsis, Microporous Mesoporous Mater. 153 (2012)55–58.
[20] J.P. Lorenti, E. Scolari, E.M. Albuquerque, M.A. Fraga, J.M.R. Gallo, Appl. Catal. AGen. 581 (2019) 37–42.
[21] B. Murillo, A. Sánchez, V. Sebastián, C. Casado-Coterillo, O. de la Iglesia,M.P. López-Ram- de-Viu, C. Téllez, J. Coronas, J. Chem. Technol. Biotechnol. 89(2014) 1344–1350.
[22] L. Li, C. Stroobants, K. Lin, P.A. Jacobs, B.F. Sels, P.P. Pescarmona, Green Chem. 13(2011) 1175–1181.
[23] C. Tempelman, U. Jacobs, T. Hut, E. Pereira de Pina, M. van Munster, N. Cherkasov,V. Degirmenci, Appl. Catal. A Gen. 588 (2019) 117267.
[24] I. Delidovich, R. Palkovits, ChemSusChem 9 (2016) 547–561.
[25] P.Y. Dapsens, C. Mondelli, J. Pérez-Ramírez, Chem. Soc. Rev. 44 (2015) 7025–7043.[26] C.M. Osmundsen, M.S. Holm, S. Dahl, E. Taarning, P. Roy, Soc. A Math. Phy. 468
(2012) 2000–2016.[27] E.T.C. Vogt, B.M. Weckhuysen, Chem. Soc. Rev. 44 (2015) 7342–7370.[28] R. Netrabukkana, K. Lourvanij, G.L. Rorrer, Ind. Eng. Chem. Res. 35 (1996)
458–464.[29] I. Graça, D. Iruretagoyena, D. Chadwick, Appl. Catal. B 206 (2017) 434–443.[30] I. Graça, M.C. Bacariza, A. Fernandes, D. Chadwick, Appl. Catal. B 224 (2018)
660–670.[31] I. Graça, M.C. Bacariza, D. Chadwick, Microporous Mesoporous Mater. 255 (2018)
130–139.[32] C. Moreau, R. Durand, A. Roux, D. Tichit, Appl. Catal. A Gen. 193 (2000) 257–264.[33] L. Hu, Z. Wu, J. Xu, Y. Sun, L. Lin, S. Liu, Chem. Eng. J. 244 (2014) 137–144.[34] N.A.S. Ramli, N.A.S. Amin, Chem. Eng. J. 283 (2016) 150–159.[35] N.A.S. Ramli, N.A.S. Amin, Appl. Catal. B 163 (2015) 487–498.[36] Z. Wei, C. Dang-guo, Z. Huanhuan, C. Fengqiu, Z. Xiaoli, React. Kinet. Mech. Catal.
100 (2010) 377–384.[37] K. Lourvanij, G.L. Rorrer, Appl. Catal. A Gen. 109 (1994) 147–165.[38] P.Y. Dapsens, C. Mondelli, B.T. Kusema, R. Verel, J. Pérez-Ramírez, Green Chem. 16
(2014) 1176–1186.[39] X. Yang, L. Wu, Z. Wang, J. Bian, T. Lu, L. Zhou, C. Chen, J. Xu, Catal. Sci. Technol.
6 (2016) 1757–1763.[40] P.Y. Dapsens, B.T. Kusema, C. Mondelli, J. Pérez-Ramírez, J. Mol. Catal. A Chem.
388-389 (2014) 141–147.[41] P.Y. Dapsens, M.J. Menart, C. Mondelli, J. Pérez-Ramírez, Green Chem. 16 (2014)
589–593.[42] C.W. Kim, H.-C. Kang, N.H. Heo, K. Seff, J. Phys. Chem. C 118 (2014)
11014–11025.[43] G.T. Kerr, J. Phys. Chem. 71 (1967) 4155–4156.[44] R.M. Ravenelle, F. Schüβler, A. D’Amico, N. Danilina, J.A. van Bokhoven,
J.A. Lercher, C.W. Jones, C. Sievers, J. Phys. Chem. C 114 (2010) 19582–19595.[45] M. Wojdyr, J. Appl. Crystallogr. 43 (2010) 1126–1128.[46] R.K. Harris, E.D. Becker, S.M. Cabral de Menezes, R. Goodfellow, P. Granger, Solid
State Nucl. Magn. Reson. 22 (2002) 458–483.[47] P.B.J. Thompson, B.N. Nguyen, R. Nicholls, R.A. Bourne, J.B. Brazier,
K.R.J. Lovelock, S.D. Brown, D. Wermeille, O. Bikondoa, C.A. Lucas, T.P.A. Hase,M.A. Newton, J. Synchrotron Radiat. 22 (2015) 1426–1439.
[48] E.A. Pidko, V. Degirmenci, R.A. Van Santen, E.J.M. Hensen, Angew. Chem. Int. Ed.49 (2010) 2530–2534.
[49] C. Huang, A. Li, Z.-S. Chao, RSC Adv. 7 (2017) 48275–48285.[50] L. Hillen, V. Degirmenci, Rev. Adv. Sci. Eng. 4 (2015) 147–162.[51] J. Sanz, V. Fornés, A. Corma, J. Chem. Soc. Farad. Trans. 1 84 (1988) 3113–3119.[52] B. Tang, W. Dai, G. Wu, N. Guan, L. Li, M. Hunger, ACS Catal. 4 (2014) 2801–2810.[53] M.P. Pachamuthu, K. Shanthi, R. Luque, A. Ramanathan, Green Chem. 15 (2013)
2158–2166.[54] M. Xin, E. Xing, X. Gao, Y. Wang, Y. Ouyang, G. Xu, Y. Luo, X. Shu, Ind. Eng. Chem.
Res. 58 (2019) 6970–6981.[55] Y. Yu, G. Xiong, C. Li, F.-S. Xiao, J. Catal. 194 (2000) 487–490.[56] Y. Xin, P. Qi, X. Duan, H. Lin, Y. Yuan, Catal. Lett. 143 (2013) 798–806.[57] J. Dijkmans, D. Gabriëls, M. Dusselier, F. de Clippel, P. Vanelderen, K. Houthoofd,
A. Malfliet, Y. Pontikes, B.F. Sels, Green Chem. 15 (2013) 2777–2785.[58] S. Samanta, N.K. Mal, A. Manna, A. Bhaumik, Appl. Catal. A Gen. 273 (2004)
157–161.[59] J.N. Chheda, Y. Román-Leshkov, J.A. Dumesic, Green Chem. 9 (2007) 342–350.[60] L. Yang, G. Tsilomelekis, S. Caratzoulas, D.G. Vlachos, ChemSusChem 8 (2015)
1334–1341.[61] S.K.R. Patil, J. Heltzel, C.R.F. Lund, Energ. Fuel. 26 (2012) 5281–5293.[62] Y. Román-Leshkov, J.N. Chheda, J.A. Dumesic, Science 312 (2006) 1933.[63] A.S. Amarasekara, L.D. Williams, C.C. Ebede, Carbohydr. Res. 343 (2008)
3021–3024.[64] A. Ranoux, K. Djanashvili, I.W.C.E. Arends, U. Hanefeld, ACS Catal. 3 (2013)
760–763.
R. Oozeerally, et al. Applied Catalysis A, General 605 (2020) 117798
11


![Characterization of gallium-containing zeolites for ... · of the difference in charge between the [SiO4] ... framework negative charge must be balanced by cations, typically protons,](https://img.pdfslide.us/doc/110x75/606c70e1e14b8724a20316f9/characterization-of-gallium-containing-zeolites-for-of-the-difference-in-charge.jpg)