Embed Size (px)
Citation preview
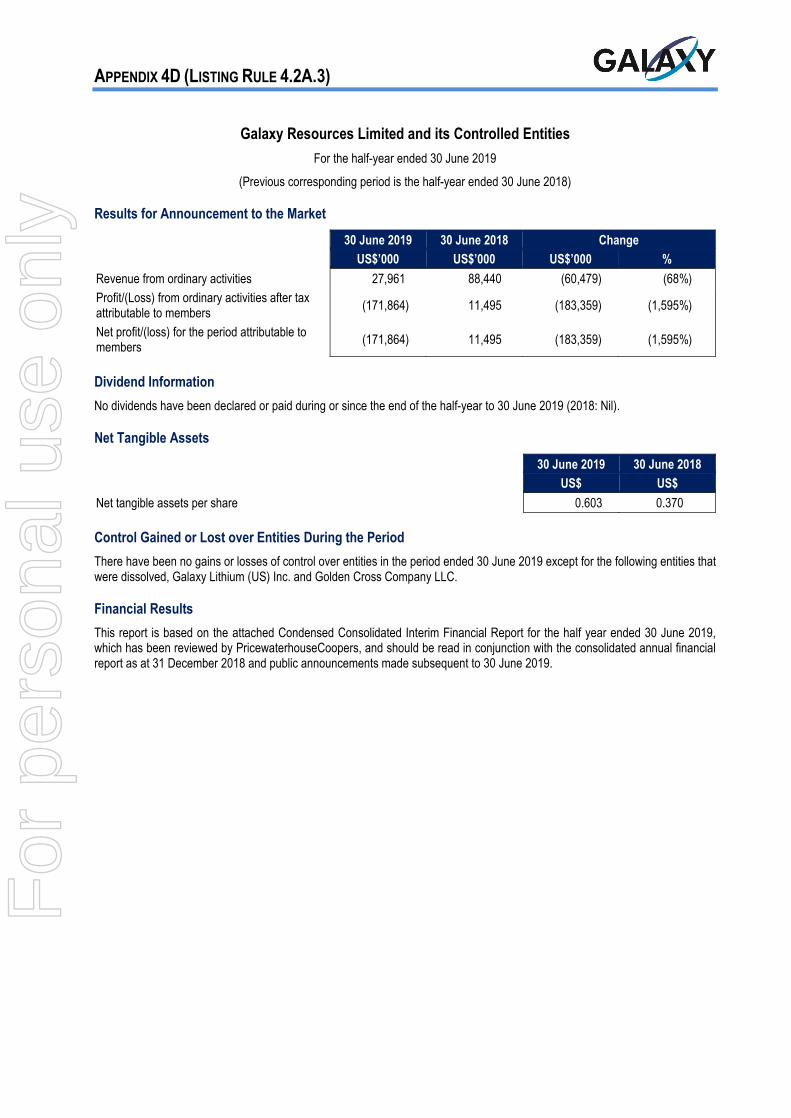
APPENDIX 4D (LISTING RULE 4.2A.3)
Galaxy Resources Limited and its Controlled Entities For the half-year ended 30 June 2019
(Previous corresponding period is the half-year ended 30 June 2018)
Results for Announcement to the Market
30 June 2019 30 June 2018 Change US$’000 US$’000 US$’000 % Revenue from ordinary activities 27,961 88,440 (60,479) (68%) Profit/(Loss) from ordinary activities after tax attributable to members (171,864) 11,495 (183,359) (1,595%)
Net profit/(loss) for the period attributable to members (171,864) 11,495 (183,359) (1,595%)
Dividend Information No dividends have been declared or paid during or since the end of the half-year to 30 June 2019 (2018: Nil).
Net Tangible Assets
30 June 2019 30 June 2018 US$ US$ Net tangible assets per share 0.603 0.370
Control Gained or Lost over Entities During the Period There have been no gains or losses of control over entities in the period ended 30 June 2019 except for the following entities that were dissolved, Galaxy Lithium (US) Inc. and Golden Cross Company LLC.
Financial Results This report is based on the attached Condensed Consolidated Interim Financial Report for the half year ended 30 June 2019, which has been reviewed by PricewaterhouseCoopers, and should be read in conjunction with the consolidated annual financial report as at 31 December 2018 and public announcements made subsequent to 30 June 2019.
For
per
sona
l use
onl
y
GALAXY RESOURCES LIMITED ABN 11 071 976 442
CONDENSED CONSOLIDATED FINANCIAL REPORT
FOR THE HALF-YEAR ENDED 30 JUNE 2019
www.gxy.com
For
per
sona
l use
onl
y
HALF-YEAR FINANCIAL REPORT 30 JUNE 2019 1
CORPORATE DIRECTORY
BOARD OF DIRECTORS Mr Martin Rowley - Independent Non-Executive Chairman Mr Anthony Tse - Executive Director from 1 July 2019 was previously Managing Director and Chief Executive Officer Mr Peter Bacchus - Independent Non-Executive Director Mr John Turner - Independent Non-Executive Director Ms Florencia Heredia - Independent Non-Executive Director Mr Alan Fitzpatrick - Independent Non-Executive Director – appointed 16 January 2019
CHIEF EXECUTIVE OFFICER Mr Simon Hay – appointed 1 July 2019
CHIEF FINANCIAL OFFICER Mr Alan Rule
COMPANY SECRETARY Mr John Sanders
REGISTERED OFFICE AND PRINCIPAL PLACE OF BUSINESS Level 4, 21 Kintail Road Applecross WA 6153 Australia Phone: + 61 8 9215 1700 Fax: + 61 8 9215 1799 Emails: [email protected] (General Enquiries) [email protected] (Investor Relations and Media Enquiries) Website: www.gxy.com
SHARE REGISTRIES Computershare Investor Services Pty Ltd Computershare Investor Services Inc. Level 11, 172 St Georges Terrace 100 University Avenue, 8th Floor Perth Western Australia 6000 Toronto Ontario M5J 2Y1 Australia Canada Phone: 1300 557 010 (within Australia) Phone: 1 800 564 6253 (within Canada and the United States) Phone: + 61 3 9415 5000 (outside Australia) Phone: +1 514 982 7555 (international direct dial) Fax: + 61 8 9323 2033 Fax: +1 866 249 7775 Website: www.computershare.com Website: www.computershare.com
LEGAL ADVISERS Steinepreis Paganin (Australia) Fasken Martineau DuMoulin LLP (Canada) Level 4, The Read Buildings The Stock Exchange Tower 16 Milligan Street Suite 3700, 800 Square Victoria Perth Western Australia 6000 Montréal Quebec H4Z 1E9 Australia Canada
AUDITORS PricewaterhouseCoopers Level 15, 125 St Georges Terrace Perth Western Australia 6000 Australia
AUSTRALIAN BUSINESS NUMBER 11 071 976 442 Stock Exchange Listing ASX Code: GXY
For
per
sona
l use
onl
y
HALF-YEAR FINANCIAL REPORT 30 JUNE 2019 2
TABLE OF CONTENTS Directors’ Report ............................................................................................................................................................................... 3 Auditor’s Independence Declaration ................................................................................................................................................. 8 Condensed Consolidated Income Statement and Statement of Other Comprehensive Income ...................................................... 9 Condensed Consolidated Statement of Financial Position ............................................................................................................. 10 Condensed Consolidated Statement of Changes in Equity ............................................................................................................ 11 Condensed Consolidated Statement of Cash Flows ....................................................................................................................... 12 Notes to the Condensed Consolidated Financial Statements ......................................................................................................... 13 Directors’ Declaration ...................................................................................................................................................................... 25 Independent Auditor’s Review Report ............................................................................................................................................. 26
For
per
sona
l use
onl
y
HALF-YEAR FINANCIAL REPORT 30 JUNE 2019 3
DIRECTORS’ REPORT Your directors present their report on the consolidated financial statements of Galaxy Resources Limited (“Company”) and the entities it controlled (“Group”) during the 6 months ended 30 June 2019 (“Half-Year”).
DIRECTORS The following persons were directors of the Company during the Half-Year and up to the date of this report except where indicated:
Mr Martin Rowley Mr Anthony Tse (was Managing Director and Chief Executive Officer until 1 July 2019) Mr Peter Bacchus Mr John Turner Ms Florencia Heredia Mr Alan Fitzpatrick (appointed 16 January 2019) Mr Jian-Nan (George) Zhang (retired 16 January 2019)
PRINCIPAL ACTIVITIES The principal activities of the entities within the Group are:
• Production of lithium concentrate; • Exploration for minerals in Australia, Canada and Argentina; and • Completion of studies and development of projects in Canada and Argentina.
OPERATING RESULTS FOR THE PERIOD The Group’s loss after tax for the Half-Year was US$171,864,000 (30 June 2018: profit US$11,495,000).
The result for the period includes the following key items:
• Write down of Inventory at Mt Cattlin of US$13.6 million (refer to note 9) • Impairment of Property, Plant & Equipment at Mt Cattlin of US$123.5 million (refer to note 10) • Derecognition of Deferred tax assets US$39.7 million (refer to note 11)
DIVIDENDS FOR THE PERIOD No dividends have been paid by the Company during the Half-Year, nor have the Directors recommended that any dividends be paid (2018: none).
SUSTAINABILITY Safety Performance The Total Recordable Injury Frequency rate (“TRIFR”) for Galaxy at 30 June 2019 was 14.31. Operations at Mt Cattlin have continued without any Lost Time Injuries (“LTI”) whereas two LTI’s were recorded at the Sal de Vida project in Argentina in the 12 months ended 30 June 2019.
Galaxy continues to focus on implementing health and safety systems and processes that are focused on hazard identification, risk management and incident prevention. Galaxy’s Health, Safety & Environmental Management System (“HSEMS”) defines the framework in which Galaxy and its subsidiaries manage operations to meet required legal obligations and comply with industry standards. Site specific safety management systems continue to be upgraded to mirror the corporate framework.
For
per
sona
l use
onl
y
DIRECTORS’ REPORT (CONTINUED)
HALF-YEAR FINANCIAL REPORT 30 JUNE 2019 4
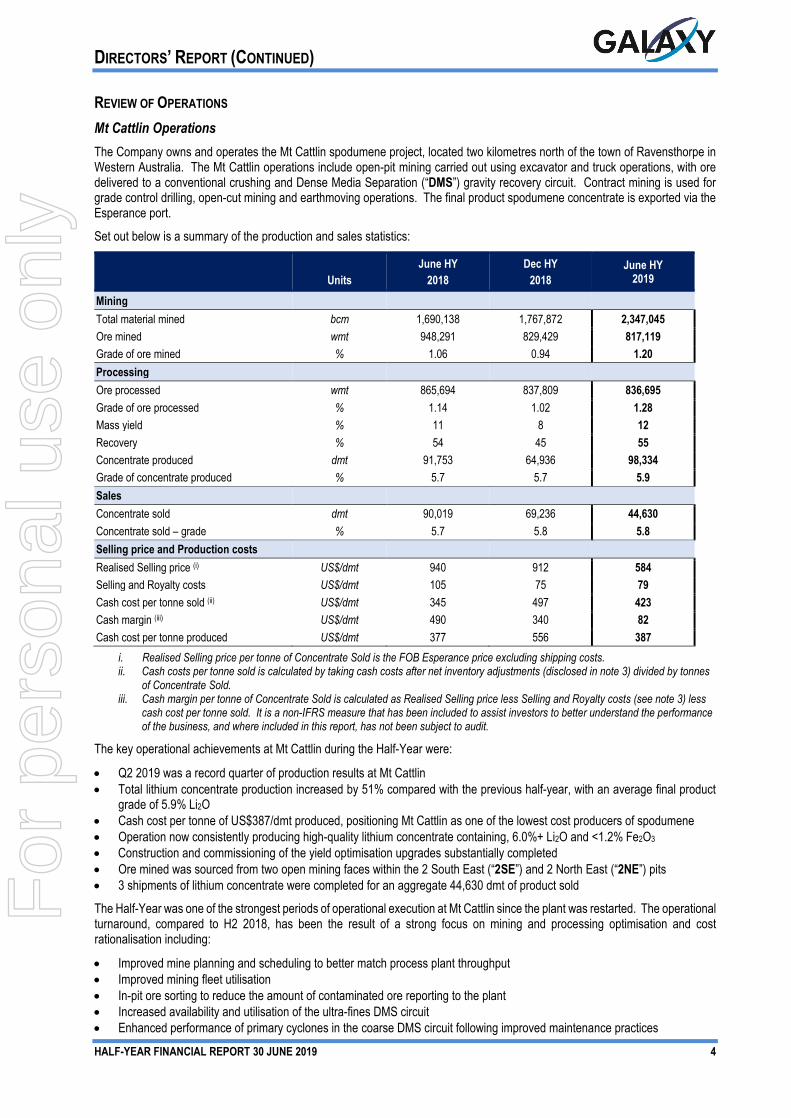
REVIEW OF OPERATIONS Mt Cattlin Operations The Company owns and operates the Mt Cattlin spodumene project, located two kilometres north of the town of Ravensthorpe in Western Australia. The Mt Cattlin operations include open-pit mining carried out using excavator and truck operations, with ore delivered to a conventional crushing and Dense Media Separation (“DMS”) gravity recovery circuit. Contract mining is used for grade control drilling, open-cut mining and earthmoving operations. The final product spodumene concentrate is exported via the Esperance port. Set out below is a summary of the production and sales statistics:
Units June HY
2018 Dec HY
2018 June HY
2019
Mining Total material mined bcm 1,690,138 1,767,872 2,347,045 Ore mined wmt 948,291 829,429 817,119 Grade of ore mined % 1.06 0.94 1.20 Processing Ore processed wmt 865,694 837,809 836,695 Grade of ore processed % 1.14 1.02 1.28 Mass yield % 11 8 12 Recovery % 54 45 55 Concentrate produced dmt 91,753 64,936 98,334 Grade of concentrate produced % 5.7 5.7 5.9 Sales Concentrate sold dmt 90,019 69,236 44,630 Concentrate sold – grade % 5.7 5.8 5.8 Selling price and Production costs Realised Selling price (i) US$/dmt 940 912 584 Selling and Royalty costs US$/dmt 105 75 79 Cash cost per tonne sold (ii) US$/dmt 345 497 423 Cash margin (iii) US$/dmt 490 340 82 Cash cost per tonne produced US$/dmt 377 556 387
i. Realised Selling price per tonne of Concentrate Sold is the FOB Esperance price excluding shipping costs. ii. Cash costs per tonne sold is calculated by taking cash costs after net inventory adjustments (disclosed in note 3) divided by tonnes
of Concentrate Sold. iii. Cash margin per tonne of Concentrate Sold is calculated as Realised Selling price less Selling and Royalty costs (see note 3) less
cash cost per tonne sold. It is a non-IFRS measure that has been included to assist investors to better understand the performance of the business, and where included in this report, has not been subject to audit.
The key operational achievements at Mt Cattlin during the Half-Year were:
• Q2 2019 was a record quarter of production results at Mt Cattlin • Total lithium concentrate production increased by 51% compared with the previous half-year, with an average final product
grade of 5.9% Li2O • Cash cost per tonne of US$387/dmt produced, positioning Mt Cattlin as one of the lowest cost producers of spodumene • Operation now consistently producing high-quality lithium concentrate containing, 6.0%+ Li2O and <1.2% Fe2O3 • Construction and commissioning of the yield optimisation upgrades substantially completed • Ore mined was sourced from two open mining faces within the 2 South East (“2SE”) and 2 North East (“2NE”) pits • 3 shipments of lithium concentrate were completed for an aggregate 44,630 dmt of product sold
The Half-Year was one of the strongest periods of operational execution at Mt Cattlin since the plant was restarted. The operational turnaround, compared to H2 2018, has been the result of a strong focus on mining and processing optimisation and cost rationalisation including:
• Improved mine planning and scheduling to better match process plant throughput • Improved mining fleet utilisation • In-pit ore sorting to reduce the amount of contaminated ore reporting to the plant • Increased availability and utilisation of the ultra-fines DMS circuit • Enhanced performance of primary cyclones in the coarse DMS circuit following improved maintenance practices
For
per
sona
l use
onl
y
DIRECTORS’ REPORT (CONTINUED)
HALF-YEAR FINANCIAL REPORT 30 JUNE 2019 5
PROJECT DEVELOPMENT Sal De Vida The Sal de Vida lithium project (“Sal de Vida” or “Project”) is located on the Salar del Hombre Muerto in northwest Argentina, in a region known as the ‘Lithium Triangle’. Sal de Vida is one of the world’s largest and highest quality undeveloped lithium brine deposits. The JORC-compliant ore reserve estimate of 1.1 million tonnes of retrievable lithium carbonate equivalent (“LCE”) and 4.2 million tonnes of potassium chloride equivalent (“potash” or “KCI”) supports an estimated mine life of 40 years.
Sal de Vida development works continued throughout the Half-Year, primarily focused on process optimisation works and seeking to identify potential opportunities to de-risk project development and rationalise the execution timeline.
The key achievements at Sal de Vida during the Half-Year were:
• Earthworks for the construction of the first 15Ha of evaporation ponds were completed and pond lining materials ordered, with installation scheduled to commence in the September quarter
• Optimisation test work underway on the existing base case flow sheet • Two solvent extraction and two ion exchange process technology providers were engaged to conduct initial test work and
potential piloting on alternative flowsheet configurations • Preliminary lithium extraction results from hydrometallurgical test work completed to date has been encouraging, coming in
higher than the existing base case flowsheet • The new office located in Catamarca, which will serve as the Sal de Vida Project headquarters, was formally opened in May
2019, officiated by the Mining Secretary of Catamarca, Mr. Rodolfo Micone and the full Board of the Company • A number of key appointments to the Galaxy Argentina local management team were made including, the General Manager –
Argentina, Human Resources Manager and Legal Manager
Evaluation and optimisation works will continue in H2 2019. Preliminary opportunities identified to de-risk project execution and potential sources of capital cost reduction will be explored in greater detail. An updated execution plan and timeline is expected to be completed during H2 2019.
James Bay The James Bay lithium pegmatite project (“James Bay” or “Project”) is located in northwest Quebec, Canada two kilometres south of the Eastmain River and 100 kilometres east of James Bay. The project contains a JORC-compliant mineral resource of 40.3 Mt @1.40% Li20, with substantial further upside being open at depth.
The James Bay deposit occurs at surface and comprises a swarm of pegmatite dykes that form a discontinuous band or “corridor” approximately four kilometres long and 300 metres wide. Outcrops are common, allowing for a low average strip ratio and resource modelling indicates it is amenable to open pit extraction. Spodumene crystals are relatively coarse, usually more than 5cm in length and sometimes exceeding one metre.
The quality of the underlying resource, proximity to local infrastructure and the cheap cost of power in the region are natural advantages and key to the development of James Bay.
Feasibility and permitting works continued throughout the Half-Year and will continue to be the major focus in H2 2019.
The key achievements at James Bay during the Half-Year were:
• Key outputs delivered on the upstream feasibility included detailed geotechnical, waste management and mine plan studies • Phase 2 test work program for the James Bay upstream operation is nearing completion • Test work results to date have validated the process design criteria for the 2.0Mtpa concentrator • Phase 2 test work on the downstream operation has commenced, designed to underpin the feasibility work • The Canadian Environmental Assessment Agency (“CEAA”) confirmed that the Environmental and Social Impact Assessment
(“ESIA”) for the James Bay Project is consistent with the EIS Guidelines • The first round of clarifications regarding the ESIA were received in June with responses to be provided in Q3 2019 • Galaxy signed a Pre-Development Agreement (“PDA”) with the local Cree community • Galaxy has assembled a specialist team to work with the Cree to negotiate the Impact and Benefit Agreement (“IBA”) with
negotiations to commence in September 2019
For
per
sona
l use
onl
y
DIRECTORS’ REPORT (CONTINUED)
HALF-YEAR FINANCIAL REPORT 30 JUNE 2019 6
Exploration Exploration at Mt Cattlin during the period focused on brownfields reverse circulation (“RC”) drilling for resource definition purposes, as well as selected greenfields drilling and further geochemical analysis for target delineation.
• A total of 23 RC drill holes were completed in the June quarter 2019, with 12 holes drilled within the 2 South East (“2SE”) pit for resource definition purposes and the remainder of drill holes being targeted exploration holes. A total of 313 single meter samples from drill holes were submitted to Nagrom in Perth, with assays pending
• 4,479m of development drilling was completed at Mt Cattlin in support of works approvals, sterilisation and mine-planning, including 274m of diamond tail core
No exploration work occurred at either Sal de Vida or James Bay during the Half-Year.
CORPORATE Sale of a package of tenements located on the northern area of the Salar del Hombre Muerto The sale of a package of tenements located on the northern area of the Salar del Hombre Muerto in Argentina to POSCO was completed in February 2019 – refer to note 7. Galaxy received US$257.05 million (after deduction of withholding tax of US$7.95 million paid in November 2018) in sale proceeds from escrow on 25 February 2019 and the remaining US$14.55 million (after deduction of withholding tax of US$0.45 million paid in November 2018) in sale proceeds from POSCO on 1 March 2019.
Strategic Investments Galaxy increased its shareholding in Alita Resources (ASX: A40) (“Alita”, formerly, “Alliance Mineral Assets”) through participation in a strategic institutional placement. Galaxy subscribed for 112,500,000 ordinary shares in Alita at an issue price of A$0.20 per share for a total investment of A$22.5 million. Galaxy is now the largest shareholder in Alita, holding approximately 12.22% of the total shares on issue.
Galaxy subscribed A$1.2 million for it’s entitlement in the Lepidico (ASX: LPD) rights issue during the Half-Year.
Appointment of New Chief Executive Officer Mr. Simon Hay was appointed as Galaxy’s new Chief Executive Officer (“CEO”) in the June quarter 2019 and commenced on 1 July 2019. Mr Hay’s previous experience includes senior positions at major Australian mining companies including BHP Billiton, WMC Resources and Iluka Resources incorporating broad expertise across global mining operations, project development and construction, as well as mineral product marketing in China and globally.
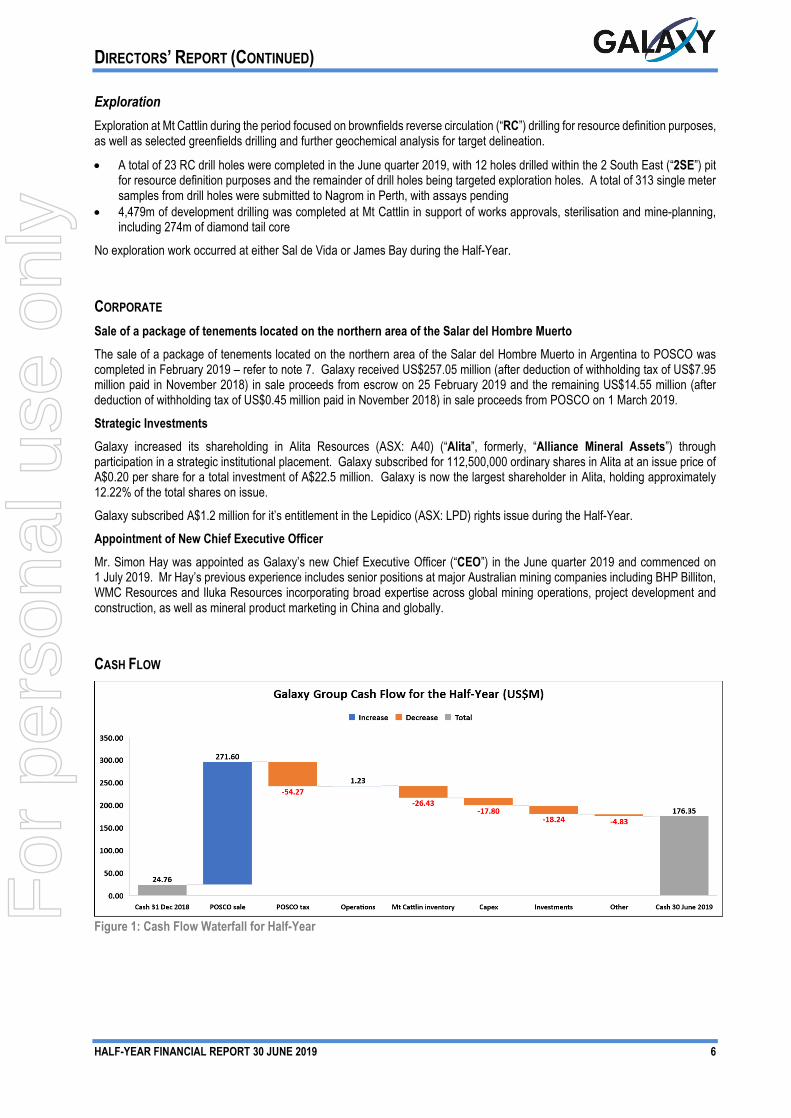
CASH FLOW
Figure 1: Cash Flow Waterfall for Half-Year
For
per
sona
l use
onl
y
DIRECTORS’ REPORT (CONTINUED)
HALF-YEAR FINANCIAL REPORT 30 JUNE 2019 7
Operating Cash Flows Operating cash outflows for the Half-Year were US$25.2 million, a decrease of US$56.4 million over the comparative period. This decrease was a result of:
• Lower sales volumes and reduced spodumene pricing; and • US$26.4million build up of ore and spodumene inventory.
The Half-Year included a payment of income tax payable in Argentina for the year ended 31 December 2018 of US$54.3 million.
Investing Cash Flows Net investing cash inflows of US$237.9 million comprised the receipt of funds from the POSCO transaction of US$271.6 million and a combination of payments associated with investment in property plant and equipment at Mt Cattlin, and the capitalisation of project development costs at Sal de Vida and James Bay.
Other payments incurred during the Half-Year related to:
• Strategic investment in Alita • Subscription of Galaxy’s entitlement in Lepidico
Financing Cash Flows Cash outflows relating to financing activities totalled US$5.4 million including US$5.2 million on lease payments.
ROUNDING The amounts contained in this report and in the financial report have been rounded to the nearest $1,000 (unless otherwise stated) under the option available to the Company under ASIC Corporations (Rounding in Financial/Directors’ Reports) Instrument 2016/191. The Company is an entity to which the legislative instrument applies.
AUDITOR’S INDEPENDENCE DECLARATION In accordance with section 307C of the Corporations Act 2001, the directors received the attached independence declaration set out on page 8 and forms part of the directors’ report for the Half-Year.
Signed in accordance with a resolution of the Directors.
Martin Rowley Chairman Dated at Perth on 29 August 2019.
For
per
sona
l use
onl
y
PricewaterhouseCoopers, ABN 52 780 433 757 Brookfield Place, 125 St Georges Terrace, PERTH WA 6000, GPO Box D198, PERTH WA 6840 T: +61 8 9238 3000, F: +61 8 9238 3999, www.pwc.com.au
Liability limited by a scheme approved under Professional Standards Legislation.
Auditor’s Independence Declaration As lead auditor for the review of Galaxy Resources Limited for the half-year ended 30 June 2019, I declare that to the best of my knowledge and belief, there have been:
(a) no contraventions of the auditor independence requirements of the Corporations Act 2001 in relation to the review; and
(b) no contraventions of any applicable code of professional conduct in relation to the review.
This declaration is in respect of Galaxy Resources Limited and the entities it controlled during the period.
Douglas Craig Perth Partner PricewaterhouseCoopers
29 August 2019
For
per
sona
l use
onl
y
HALF-YEAR FINANCIAL REPORT 30 JUNE 2019 9
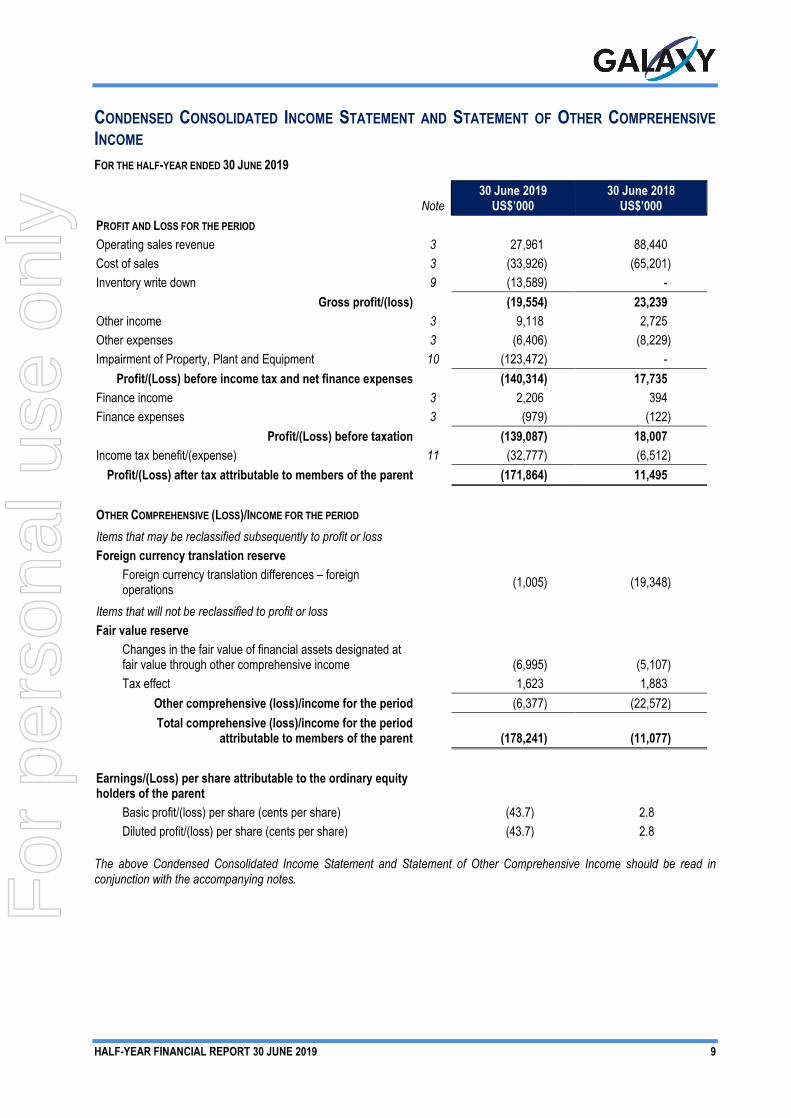
CONDENSED CONSOLIDATED INCOME STATEMENT AND STATEMENT OF OTHER COMPREHENSIVE INCOME FOR THE HALF-YEAR ENDED 30 JUNE 2019
Note 30 June 2019
US$’000 30 June 2018
US$’000 PROFIT AND LOSS FOR THE PERIOD Operating sales revenue 3 27,961 88,440 Cost of sales 3 (33,926) (65,201) Inventory write down 9 (13,589) -
Gross profit/(loss) (19,554) 23,239 Other income 3 9,118 2,725 Other expenses 3 (6,406) (8,229) Impairment of Property, Plant and Equipment 10 (123,472) -
Profit/(Loss) before income tax and net finance expenses (140,314) 17,735 Finance income 3 2,206 394 Finance expenses 3 (979) (122)
Profit/(Loss) before taxation (139,087) 18,007 Income tax benefit/(expense) 11 (32,777) (6,512)
Profit/(Loss) after tax attributable to members of the parent (171,864) 11,495 OTHER COMPREHENSIVE (LOSS)/INCOME FOR THE PERIOD Items that may be reclassified subsequently to profit or loss Foreign currency translation reserve
Foreign currency translation differences – foreign operations
(1,005) (19,348)
Items that will not be reclassified to profit or loss Fair value reserve
Changes in the fair value of financial assets designated at fair value through other comprehensive income
(6,995) (5,107)
Tax effect 1,623 1,883 Other comprehensive (loss)/income for the period (6,377) (22,572) Total comprehensive (loss)/income for the period
attributable to members of the parent
(178,241) (11,077) Earnings/(Loss) per share attributable to the ordinary equity holders of the parent
Basic profit/(loss) per share (cents per share) (43.7) 2.8 Diluted profit/(loss) per share (cents per share) (43.7) 2.8
The above Condensed Consolidated Income Statement and Statement of Other Comprehensive Income should be read in conjunction with the accompanying notes. F
or p
erso
nal u
se o
nly
HALF-YEAR FINANCIAL REPORT 30 JUNE 2019 10
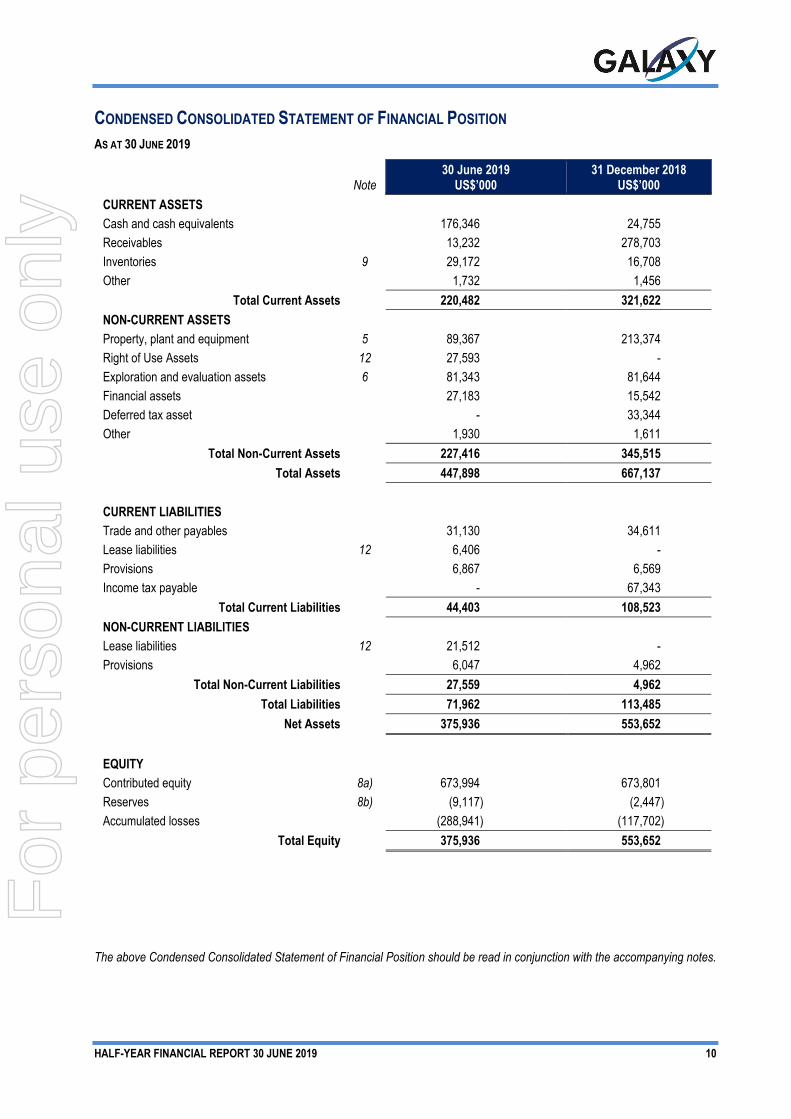
CONDENSED CONSOLIDATED STATEMENT OF FINANCIAL POSITION AS AT 30 JUNE 2019
Note 30 June 2019
US$’000 31 December 2018
US$’000 CURRENT ASSETS Cash and cash equivalents 176,346 24,755 Receivables 13,232 278,703 Inventories 9 29,172 16,708 Other 1,732 1,456
Total Current Assets 220,482 321,622 NON-CURRENT ASSETS Property, plant and equipment 5 89,367 213,374 Right of Use Assets 12 27,593 - Exploration and evaluation assets 6 81,343 81,644 Financial assets 27,183 15,542 Deferred tax asset - 33,344 Other 1,930 1,611
Total Non-Current Assets 227,416 345,515 Total Assets 447,898 667,137
CURRENT LIABILITIES Trade and other payables 31,130 34,611 Lease liabilities 12 6,406 - Provisions 6,867 6,569 Income tax payable - 67,343
Total Current Liabilities 44,403 108,523 NON-CURRENT LIABILITIES Lease liabilities 12 21,512 - Provisions 6,047 4,962
Total Non-Current Liabilities 27,559 4,962 Total Liabilities 71,962 113,485
Net Assets 375,936 553,652
EQUITY Contributed equity 8a) 673,994 673,801 Reserves 8b) (9,117) (2,447) Accumulated losses (288,941) (117,702)
Total Equity 375,936 553,652
The above Condensed Consolidated Statement of Financial Position should be read in conjunction with the accompanying notes.
For
per
sona
l use
onl
y
HALF-YEAR FINANCIAL REPORT 30 JUNE 2019 11
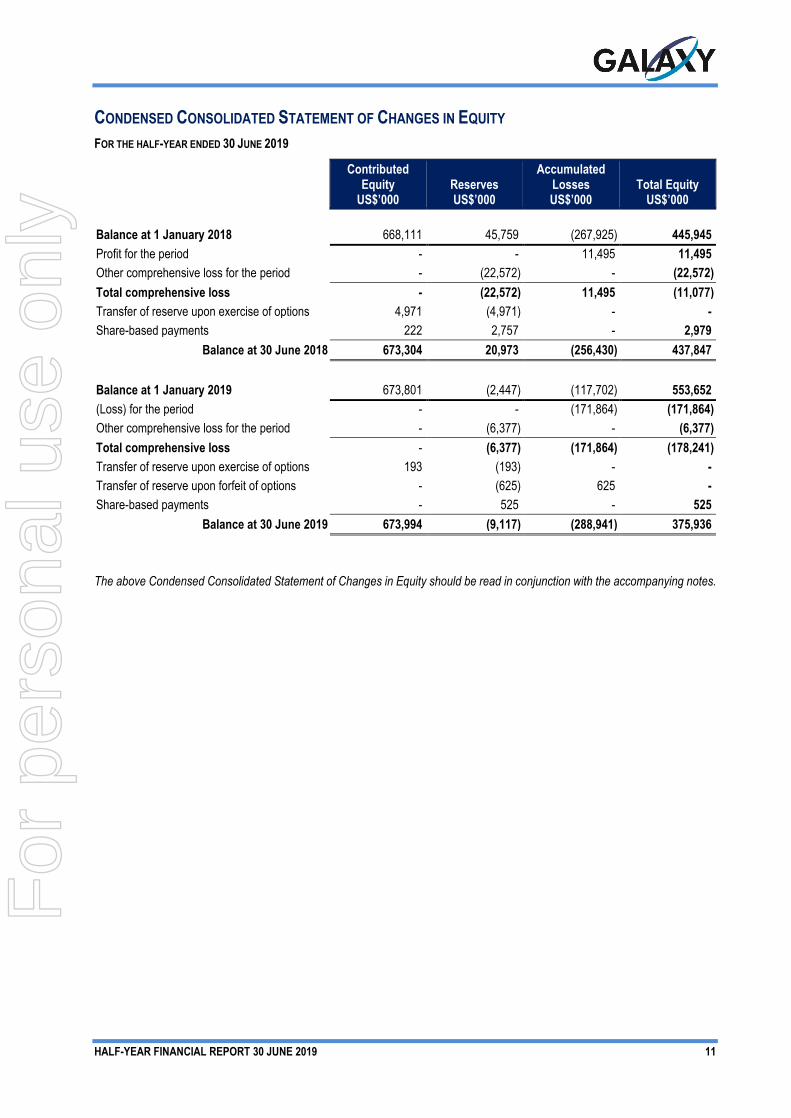
CONDENSED CONSOLIDATED STATEMENT OF CHANGES IN EQUITY FOR THE HALF-YEAR ENDED 30 JUNE 2019
Contributed Equity
US$’000 Reserves US$’000
Accumulated Losses US$’000
Total Equity US$’000
Balance at 1 January 2018 668,111 45,759 (267,925) 445,945 Profit for the period - - 11,495 11,495 Other comprehensive loss for the period - (22,572) - (22,572) Total comprehensive loss - (22,572) 11,495 (11,077) Transfer of reserve upon exercise of options 4,971 (4,971) - - Share-based payments 222 2,757 - 2,979
Balance at 30 June 2018 673,304 20,973 (256,430) 437,847
Balance at 1 January 2019 673,801 (2,447) (117,702) 553,652 (Loss) for the period - - (171,864) (171,864) Other comprehensive loss for the period - (6,377) - (6,377) Total comprehensive loss - (6,377) (171,864) (178,241) Transfer of reserve upon exercise of options 193 (193) - - Transfer of reserve upon forfeit of options - (625) 625 - Share-based payments - 525 - 525
Balance at 30 June 2019 673,994 (9,117) (288,941) 375,936
The above Condensed Consolidated Statement of Changes in Equity should be read in conjunction with the accompanying notes.
For
per
sona
l use
onl
y
HALF-YEAR FINANCIAL REPORT 30 JUNE 2019 12
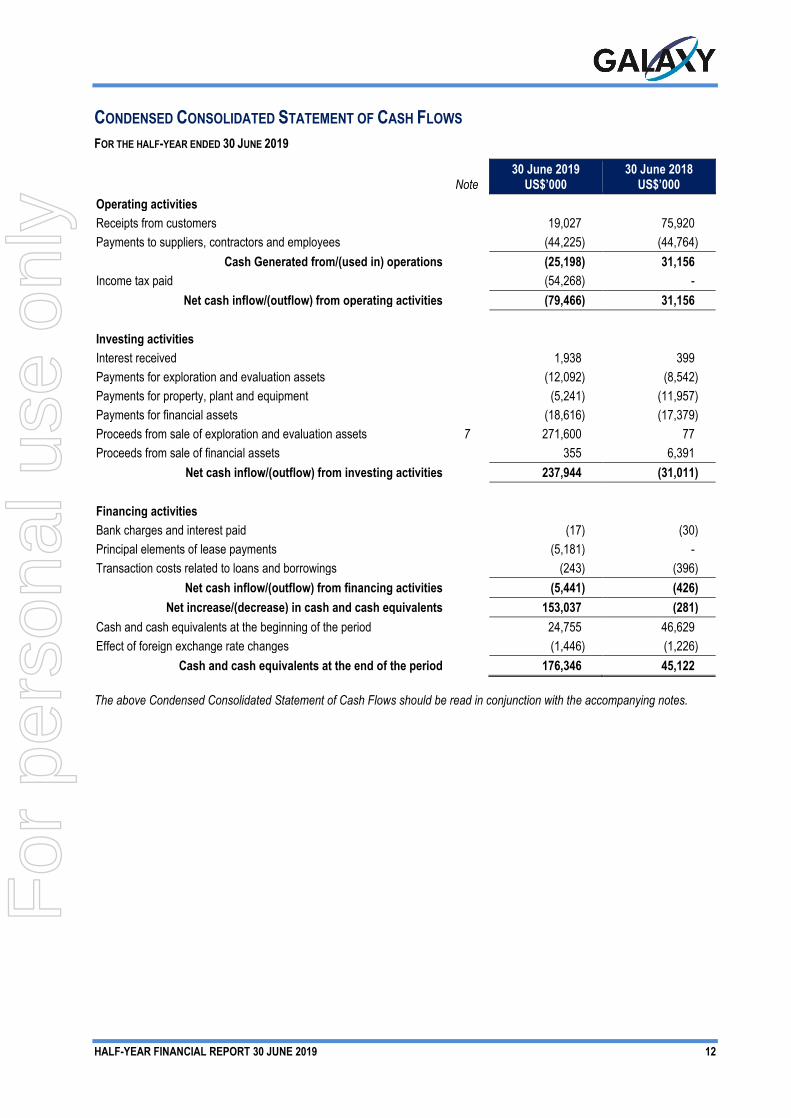
CONDENSED CONSOLIDATED STATEMENT OF CASH FLOWS FOR THE HALF-YEAR ENDED 30 JUNE 2019
Note 30 June 2019
US$’000 30 June 2018
US$’000 Operating activities Receipts from customers 19,027 75,920 Payments to suppliers, contractors and employees (44,225) (44,764)
Cash Generated from/(used in) operations (25,198) 31,156 Income tax paid (54,268) -
Net cash inflow/(outflow) from operating activities (79,466) 31,156 Investing activities Interest received 1,938 399 Payments for exploration and evaluation assets (12,092) (8,542) Payments for property, plant and equipment (5,241) (11,957) Payments for financial assets (18,616) (17,379) Proceeds from sale of exploration and evaluation assets 7 271,600 77 Proceeds from sale of financial assets 355 6,391
Net cash inflow/(outflow) from investing activities 237,944 (31,011) Financing activities Bank charges and interest paid (17) (30) Principal elements of lease payments (5,181) - Transaction costs related to loans and borrowings (243) (396)
Net cash inflow/(outflow) from financing activities (5,441) (426) Net increase/(decrease) in cash and cash equivalents 153,037 (281)
Cash and cash equivalents at the beginning of the period 24,755 46,629 Effect of foreign exchange rate changes (1,446) (1,226)
Cash and cash equivalents at the end of the period 176,346 45,122 The above Condensed Consolidated Statement of Cash Flows should be read in conjunction with the accompanying notes.
For
per
sona
l use
onl
y
HALF-YEAR FINANCIAL REPORT 30 JUNE 2019 13
NOTES TO THE CONDENSED CONSOLIDATED FINANCIAL STATEMENTS
1. CORPORATE INFORMATION Galaxy Resources Limited (“Company”) is a for-profit company limited by shares, incorporated and domiciled in Australia, whose shares are publicly traded. The condensed consolidated financial statements of the Company for the half-year ended 30 June 2019 (“Half-Year”) comprise the Company and the entities it controlled (“Group”).
The Group is primarily involved in mineral exploration and processing.
The financial statements were authorised for issue by the Board of Directors on 23 August 2019.
2. BASIS OF PREPARATION & CHANGES TO THE GROUP’S ACCOUNTING POLICIES a) Basis of preparation The interim condensed consolidated financial statements for the Half-Year have been prepared in accordance with AASB 134 Interim Financial Reporting and the Corporations Act 2001.
The interim condensed consolidated financial statements do not include all of the information required for full annual financial statements and should be read in conjunction with the annual financial statements of the Group for the year ended 31 December 2018 and any public announcements made by the Company during the Half-Year in accordance with the continuous disclosure requirements of the Corporations Act 2001 and the ASX Listing Rules.
Selected explanatory notes are included to explain events and transactions that are significant to an understanding of the changes in financial position and performance of the Group since the last annual consolidated financial statements.
All amounts in the financial statements have been rounded to the nearest thousand dollars, except as indicated, under the option available to the Company under ASIC Corporations (Rounding in Financial/Directors’ Reports) Instrument 2016/191.
b) New standards, interpretations and amendments adopted by the Group The accounting policies adopted in the preparation of the interim condensed consolidated financial statements are consistent with those applied in the preparation of the Group’s annual consolidated financial statements for the year ended 31 December 2018, except for the adoption of new standards and interpretations effective as of 1 January 2019. The Group has not early adopted any other standard, interpretation or amendment that has been issued but is not yet effective.
The Group applied, for the first time, AASB 16 Leases. As required by AASB 134, the nature and effect of these changes are disclosed in note 12.
Several other amendments and interpretations apply for the first time in 2019, but do not have an impact on the interim condensed consolidated financial statements of the Group.
For
per
sona
l use
onl
y
NOTES TO THE CONDENSED CONSOLIDATED FINANCIAL STATEMENTS
HALF-YEAR FINANCIAL REPORT 30 JUNE 2019 14
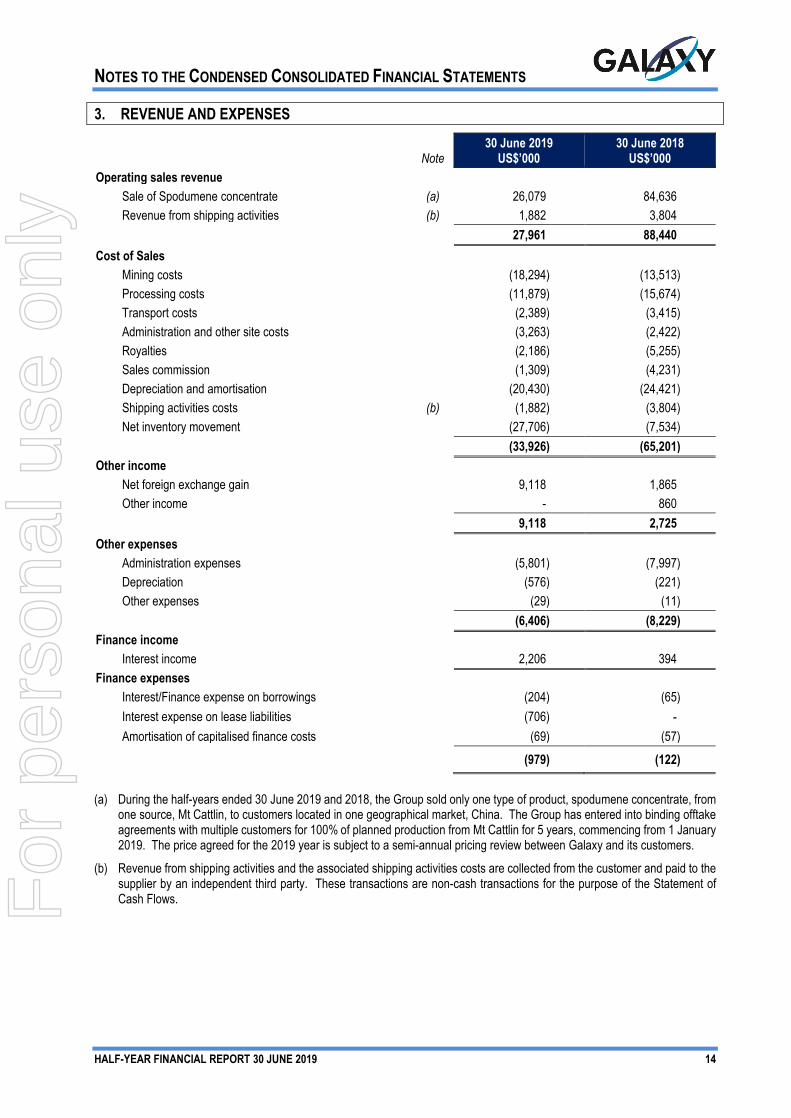
3. REVENUE AND EXPENSES
Note 30 June 2019
US$’000 30 June 2018
US$’000 Operating sales revenue
Sale of Spodumene concentrate (a) 26,079 84,636 Revenue from shipping activities (b) 1,882 3,804
27,961 88,440 Cost of Sales
Mining costs (18,294) (13,513) Processing costs (11,879) (15,674) Transport costs (2,389) (3,415) Administration and other site costs (3,263) (2,422) Royalties (2,186) (5,255) Sales commission (1,309) (4,231) Depreciation and amortisation (20,430) (24,421) Shipping activities costs (b) (1,882) (3,804) Net inventory movement (27,706) (7,534)
(33,926) (65,201) Other income
Net foreign exchange gain 9,118 1,865 Other income - 860
9,118 2,725 Other expenses
Administration expenses (5,801) (7,997) Depreciation (576) (221) Other expenses (29) (11)
(6,406) (8,229) Finance income
Interest income 2,206 394 Finance expenses
Interest/Finance expense on borrowings (204) (65) Interest expense on lease liabilities (706) - Amortisation of capitalised finance costs (69) (57)
(979) (122)
(a) During the half-years ended 30 June 2019 and 2018, the Group sold only one type of product, spodumene concentrate, from one source, Mt Cattlin, to customers located in one geographical market, China. The Group has entered into binding offtake agreements with multiple customers for 100% of planned production from Mt Cattlin for 5 years, commencing from 1 January 2019. The price agreed for the 2019 year is subject to a semi-annual pricing review between Galaxy and its customers.
(b) Revenue from shipping activities and the associated shipping activities costs are collected from the customer and paid to the supplier by an independent third party. These transactions are non-cash transactions for the purpose of the Statement of Cash Flows.
For
per
sona
l use
onl
y
NOTES TO THE CONDENSED CONSOLIDATED FINANCIAL STATEMENTS
HALF-YEAR FINANCIAL REPORT 30 JUNE 2019 15
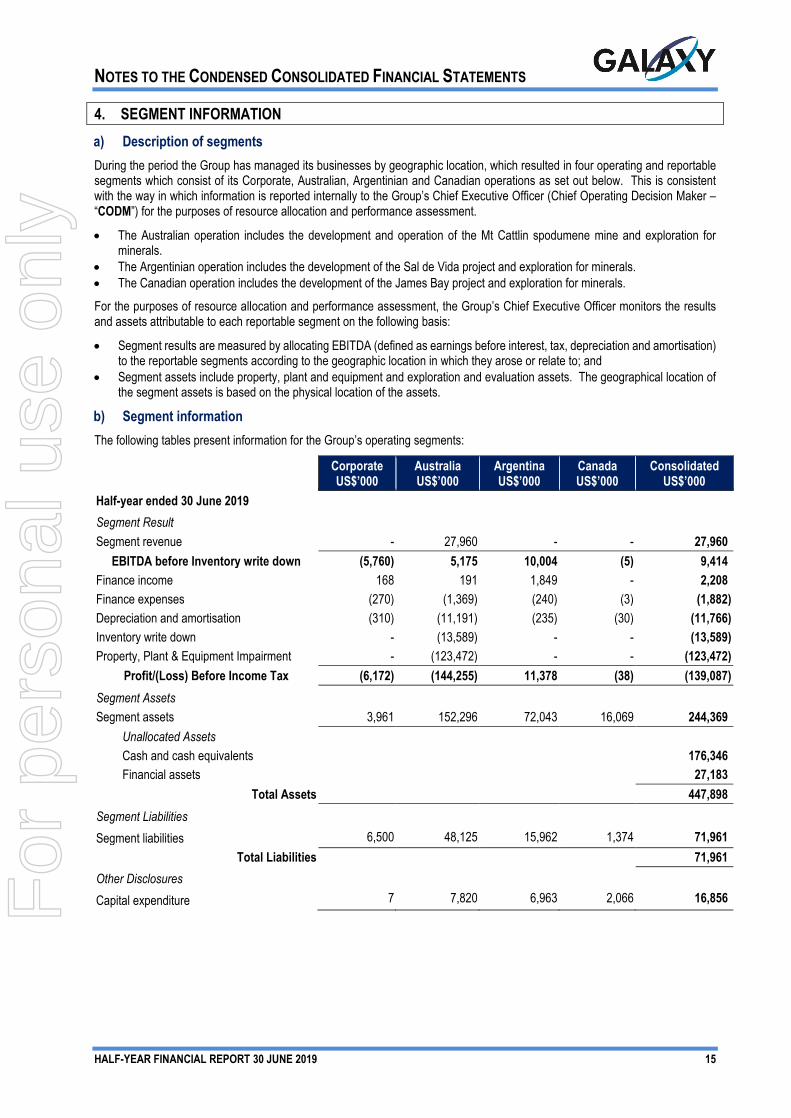
4. SEGMENT INFORMATION a) Description of segments During the period the Group has managed its businesses by geographic location, which resulted in four operating and reportable segments which consist of its Corporate, Australian, Argentinian and Canadian operations as set out below. This is consistent with the way in which information is reported internally to the Group’s Chief Executive Officer (Chief Operating Decision Maker – “CODM”) for the purposes of resource allocation and performance assessment.
• The Australian operation includes the development and operation of the Mt Cattlin spodumene mine and exploration for minerals.
• The Argentinian operation includes the development of the Sal de Vida project and exploration for minerals. • The Canadian operation includes the development of the James Bay project and exploration for minerals.
For the purposes of resource allocation and performance assessment, the Group’s Chief Executive Officer monitors the results and assets attributable to each reportable segment on the following basis:
• Segment results are measured by allocating EBITDA (defined as earnings before interest, tax, depreciation and amortisation) to the reportable segments according to the geographic location in which they arose or relate to; and
• Segment assets include property, plant and equipment and exploration and evaluation assets. The geographical location of the segment assets is based on the physical location of the assets.
b) Segment information The following tables present information for the Group’s operating segments:
Corporate US$’000
Australia US$’000
Argentina US$’000
Canada US$’000
Consolidated US$’000
Half-year ended 30 June 2019 Segment Result Segment revenue - 27,960 - - 27,960
EBITDA before Inventory write down (5,760) 5,175 10,004 (5) 9,414 Finance income 168 191 1,849 - 2,208 Finance expenses (270) (1,369) (240) (3) (1,882) Depreciation and amortisation (310) (11,191) (235) (30) (11,766) Inventory write down - (13,589) - - (13,589) Property, Plant & Equipment Impairment - (123,472) - - (123,472)
Profit/(Loss) Before Income Tax (6,172) (144,255) 11,378 (38) (139,087) Segment Assets Segment assets 3,961 152,296 72,043 16,069 244,369
Unallocated Assets Cash and cash equivalents 176,346 Financial assets 27,183
Total Assets 447,898 Segment Liabilities Segment liabilities 6,500 48,125 15,962 1,374 71,961
Total Liabilities 71,961 Other Disclosures Capital expenditure 7 7,820 6,963 2,066 16,856
For
per
sona
l use
onl
y

NOTES TO THE CONDENSED CONSOLIDATED FINANCIAL STATEMENTS
HALF-YEAR FINANCIAL REPORT 30 JUNE 2019 16
Corporate US$’000
Australia US$’000
Argentina US$’000
Canada US$’000
Consolidated US$’000
Half-year ended 30 June 2018 Segment Result Segment revenue - 88,440 - - 88,440
EBITDA (4,780) 47,660 (501) (2) 42,377 Finance income 24 370 - - 394 Finance expenses (119) - (1) (2) (122) Depreciation and amortisation (55) (24,421) (147) (19) (24,642)
Profit/(Loss) Before Income Tax
(4,930) 23,609 (649) (23) 18,007
Segment Assets Segment assets 1,721 263,092 96,338 12,336 373,487
Unallocated assets Cash and cash equivalents 45,122
Financial assets 23,239 Deferred tax assets 34,644
Total Assets 476,492 Segment Liabilities Segment liabilities 6,520 25,172 2,052 4,901 38,645
Total Liabilities 6,520 25,172 2,052 4,901 38,645 Other Disclosures Capital expenditure 269 12,056 5,166 4,895 22,386
For
per
sona
l use
onl
y
NOTES TO THE CONDENSED CONSOLIDATED FINANCIAL STATEMENTS
HALF-YEAR FINANCIAL REPORT 30 JUNE 2019 17
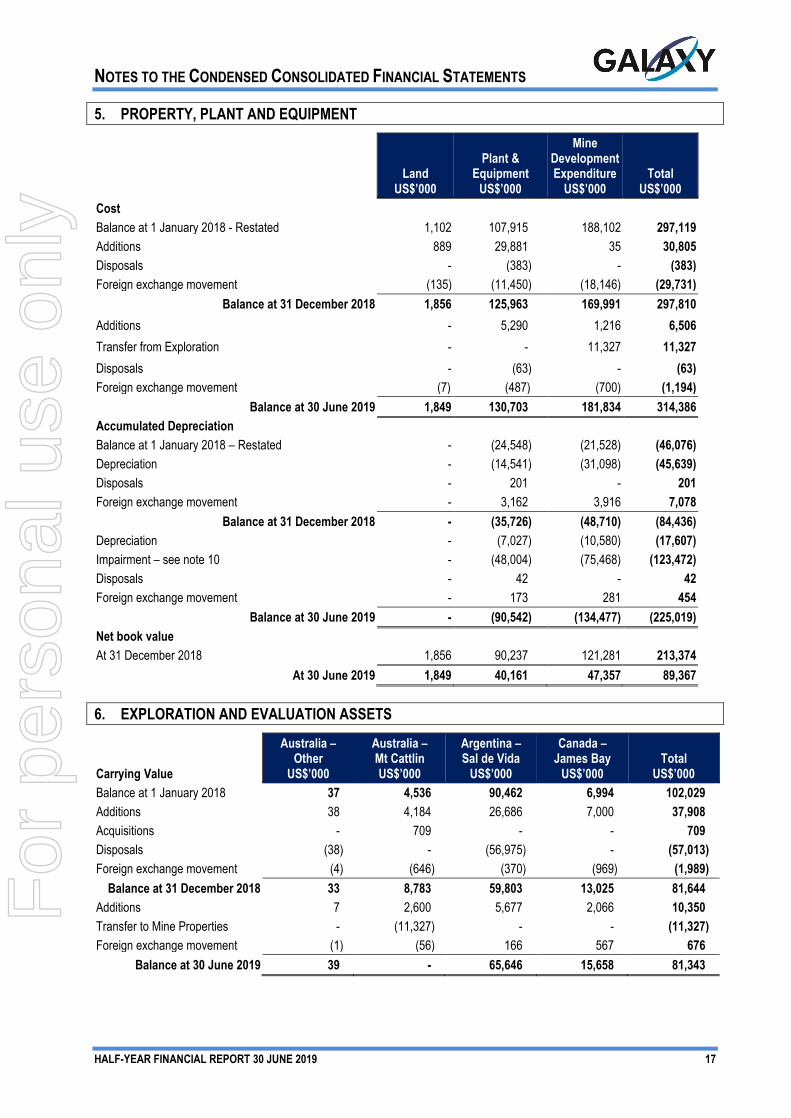
5. PROPERTY, PLANT AND EQUIPMENT
Land
US$’000
Plant & Equipment
US$’000
Mine Development Expenditure
US$’000 Total
US$’000 Cost Balance at 1 January 2018 - Restated 1,102 107,915 188,102 297,119 Additions 889 29,881 35 30,805 Disposals - (383) - (383) Foreign exchange movement (135) (11,450) (18,146) (29,731)
Balance at 31 December 2018 1,856 125,963 169,991 297,810 Additions - 5,290 1,216 6,506 Transfer from Exploration - - 11,327 11,327 Disposals - (63) - (63) Foreign exchange movement (7) (487) (700) (1,194)
Balance at 30 June 2019 1,849 130,703 181,834 314,386 Accumulated Depreciation Balance at 1 January 2018 – Restated - (24,548) (21,528) (46,076) Depreciation - (14,541) (31,098) (45,639) Disposals - 201 - 201 Foreign exchange movement - 3,162 3,916 7,078
Balance at 31 December 2018 - (35,726) (48,710) (84,436) Depreciation - (7,027) (10,580) (17,607) Impairment – see note 10 - (48,004) (75,468) (123,472) Disposals - 42 - 42 Foreign exchange movement - 173 281 454
Balance at 30 June 2019 - (90,542) (134,477) (225,019) Net book value At 31 December 2018 1,856 90,237 121,281 213,374
At 30 June 2019 1,849 40,161 47,357 89,367
6. EXPLORATION AND EVALUATION ASSETS
Carrying Value
Australia – Other
US$’000
Australia – Mt Cattlin US$’000
Argentina – Sal de Vida
US$’000
Canada – James Bay
US$’000 Total
US$’000 Balance at 1 January 2018 37 4,536 90,462 6,994 102,029 Additions 38 4,184 26,686 7,000 37,908 Acquisitions - 709 - - 709 Disposals (38) - (56,975) - (57,013) Foreign exchange movement (4) (646) (370) (969) (1,989)
Balance at 31 December 2018 33 8,783 59,803 13,025 81,644 Additions 7 2,600 5,677 2,066 10,350 Transfer to Mine Properties - (11,327) - - (11,327) Foreign exchange movement (1) (56) 166 567 676
Balance at 30 June 2019 39 - 65,646 15,658 81,343
For
per
sona
l use
onl
y
NOTES TO THE CONDENSED CONSOLIDATED FINANCIAL STATEMENTS
HALF-YEAR FINANCIAL REPORT 30 JUNE 2019 18
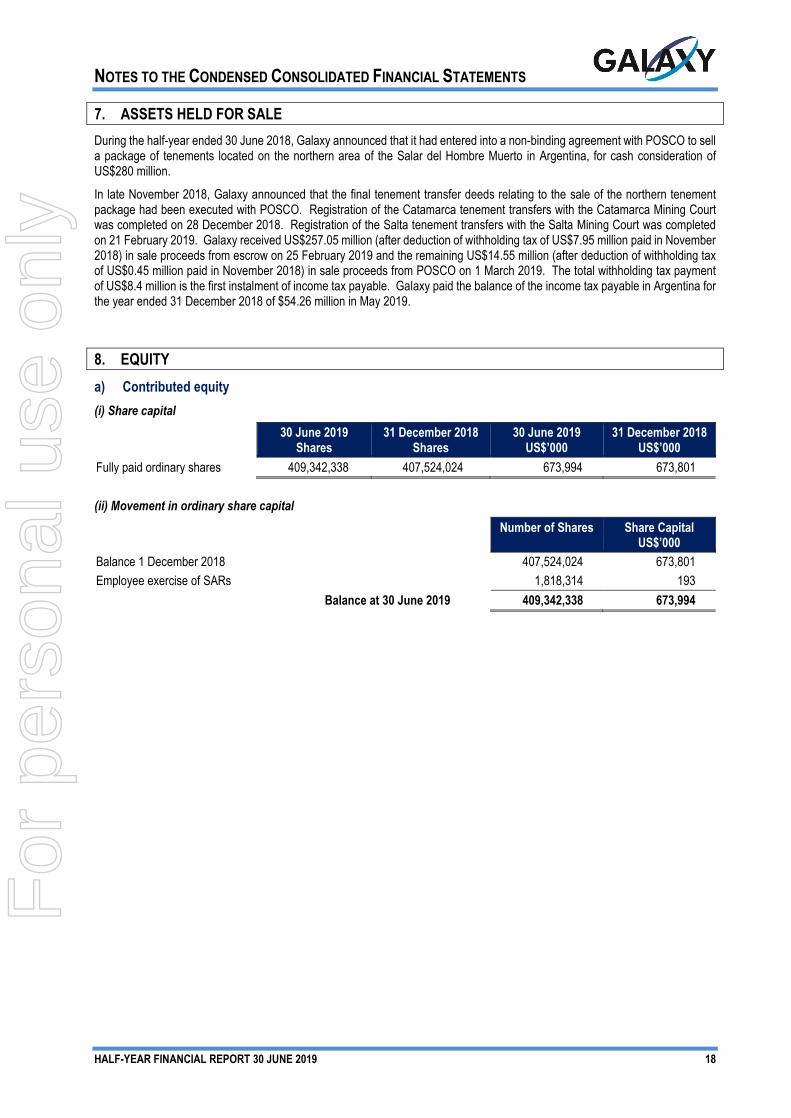
7. ASSETS HELD FOR SALE During the half-year ended 30 June 2018, Galaxy announced that it had entered into a non-binding agreement with POSCO to sell a package of tenements located on the northern area of the Salar del Hombre Muerto in Argentina, for cash consideration of US$280 million.
In late November 2018, Galaxy announced that the final tenement transfer deeds relating to the sale of the northern tenement package had been executed with POSCO. Registration of the Catamarca tenement transfers with the Catamarca Mining Court was completed on 28 December 2018. Registration of the Salta tenement transfers with the Salta Mining Court was completed on 21 February 2019. Galaxy received US$257.05 million (after deduction of withholding tax of US$7.95 million paid in November 2018) in sale proceeds from escrow on 25 February 2019 and the remaining US$14.55 million (after deduction of withholding tax of US$0.45 million paid in November 2018) in sale proceeds from POSCO on 1 March 2019. The total withholding tax payment of US$8.4 million is the first instalment of income tax payable. Galaxy paid the balance of the income tax payable in Argentina for the year ended 31 December 2018 of $54.26 million in May 2019.
8. EQUITY a) Contributed equity (i) Share capital 30 June 2019
Shares 31 December 2018
Shares 30 June 2019
US$’000 31 December 2018
US$’000 Fully paid ordinary shares 409,342,338 407,524,024 673,994 673,801 (ii) Movement in ordinary share capital
Number of Shares
Share Capital US$’000
Balance 1 December 2018 407,524,024 673,801 Employee exercise of SARs 1,818,314 193
Balance at 30 June 2019 409,342,338 673,994
For
per
sona
l use
onl
y
NOTES TO THE CONDENSED CONSOLIDATED FINANCIAL STATEMENTS
HALF-YEAR FINANCIAL REPORT 30 JUNE 2019 19
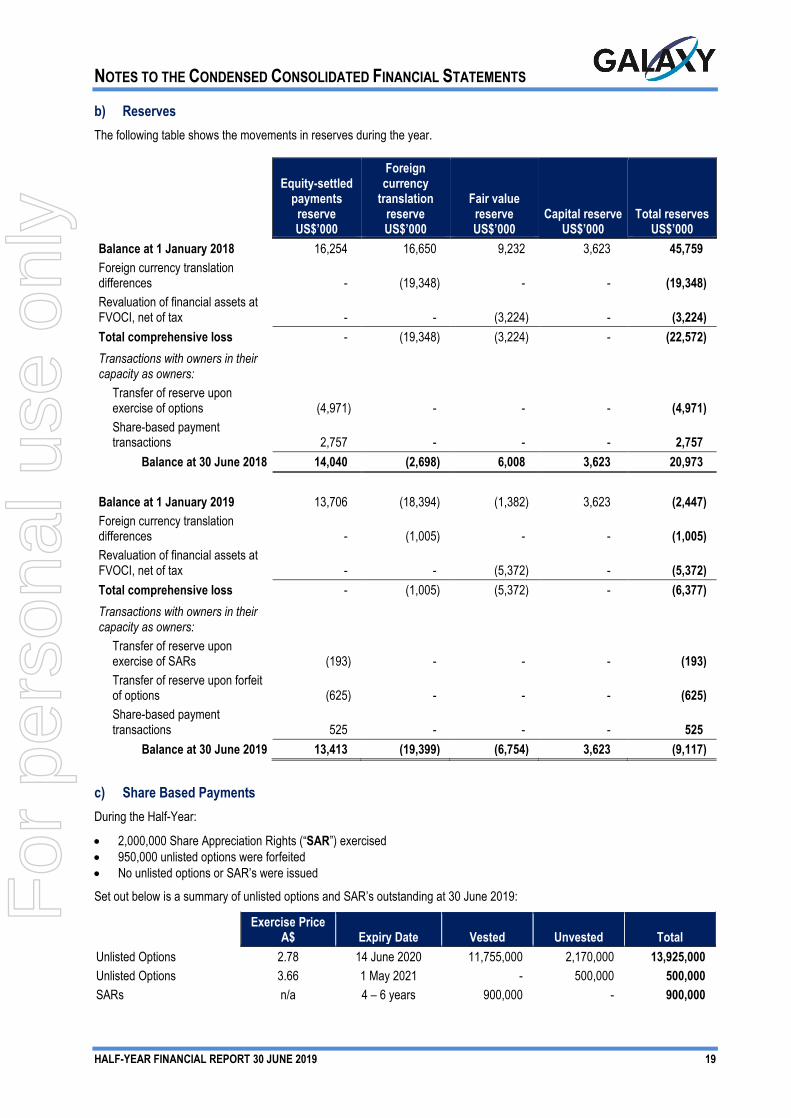
b) Reserves The following table shows the movements in reserves during the year.
Equity-settled payments
reserve US$’000
Foreign currency
translation reserve US$’000
Fair value reserve US$’000
Capital reserve US$’000
Total reserves US$’000
Balance at 1 January 2018 16,254 16,650 9,232 3,623 45,759 Foreign currency translation differences - (19,348) - - (19,348) Revaluation of financial assets at FVOCI, net of tax - - (3,224) - (3,224) Total comprehensive loss - (19,348) (3,224) - (22,572) Transactions with owners in their capacity as owners:
Transfer of reserve upon exercise of options (4,971) - - - (4,971) Share-based payment transactions 2,757 - - - 2,757
Balance at 30 June 2018 14,040 (2,698) 6,008 3,623 20,973 Balance at 1 January 2019 13,706 (18,394) (1,382) 3,623 (2,447) Foreign currency translation differences - (1,005) - - (1,005) Revaluation of financial assets at FVOCI, net of tax - - (5,372) - (5,372) Total comprehensive loss - (1,005) (5,372) - (6,377) Transactions with owners in their capacity as owners:
Transfer of reserve upon exercise of SARs (193) - - - (193) Transfer of reserve upon forfeit of options (625) - - - (625) Share-based payment transactions 525 - - - 525
Balance at 30 June 2019 13,413 (19,399) (6,754) 3,623 (9,117)
c) Share Based Payments During the Half-Year:
• 2,000,000 Share Appreciation Rights (“SAR”) exercised • 950,000 unlisted options were forfeited • No unlisted options or SAR’s were issued
Set out below is a summary of unlisted options and SAR’s outstanding at 30 June 2019:
Exercise Price A$ Expiry Date Vested Unvested
Total
Unlisted Options 2.78 14 June 2020 11,755,000 2,170,000 13,925,000 Unlisted Options 3.66 1 May 2021 - 500,000 500,000 SARs n/a 4 – 6 years 900,000 - 900,000
For
per
sona
l use
onl
y
NOTES TO THE CONDENSED CONSOLIDATED FINANCIAL STATEMENTS
HALF-YEAR FINANCIAL REPORT 30 JUNE 2019 20
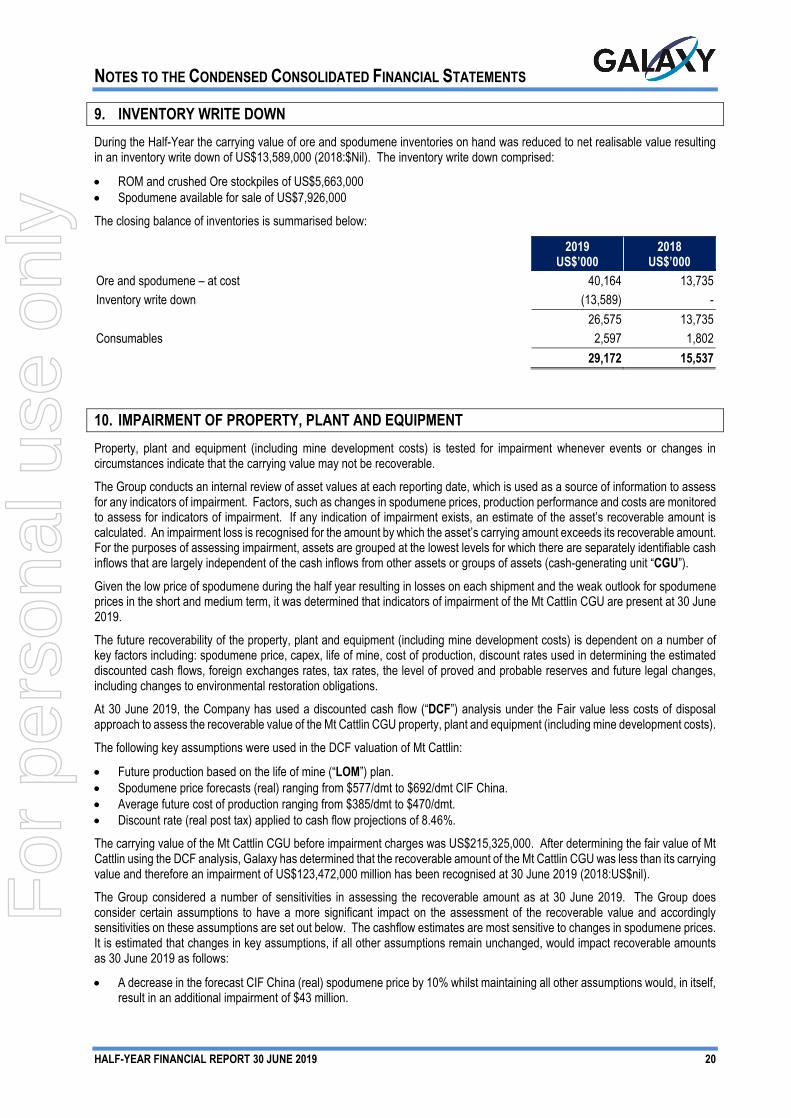
9. INVENTORY WRITE DOWN During the Half-Year the carrying value of ore and spodumene inventories on hand was reduced to net realisable value resulting in an inventory write down of US$13,589,000 (2018:$Nil). The inventory write down comprised:
• ROM and crushed Ore stockpiles of US$5,663,000 • Spodumene available for sale of US$7,926,000
The closing balance of inventories is summarised below:
2019 US$’000
2018 US$’000
Ore and spodumene – at cost 40,164 13,735 Inventory write down (13,589) - 26,575 13,735 Consumables 2,597 1,802 29,172 15,537
10. IMPAIRMENT OF PROPERTY, PLANT AND EQUIPMENT Property, plant and equipment (including mine development costs) is tested for impairment whenever events or changes in circumstances indicate that the carrying value may not be recoverable.
The Group conducts an internal review of asset values at each reporting date, which is used as a source of information to assess for any indicators of impairment. Factors, such as changes in spodumene prices, production performance and costs are monitored to assess for indicators of impairment. If any indication of impairment exists, an estimate of the asset’s recoverable amount is calculated. An impairment loss is recognised for the amount by which the asset’s carrying amount exceeds its recoverable amount. For the purposes of assessing impairment, assets are grouped at the lowest levels for which there are separately identifiable cash inflows that are largely independent of the cash inflows from other assets or groups of assets (cash-generating unit “CGU”).
Given the low price of spodumene during the half year resulting in losses on each shipment and the weak outlook for spodumene prices in the short and medium term, it was determined that indicators of impairment of the Mt Cattlin CGU are present at 30 June 2019.
The future recoverability of the property, plant and equipment (including mine development costs) is dependent on a number of key factors including: spodumene price, capex, life of mine, cost of production, discount rates used in determining the estimated discounted cash flows, foreign exchanges rates, tax rates, the level of proved and probable reserves and future legal changes, including changes to environmental restoration obligations.
At 30 June 2019, the Company has used a discounted cash flow (“DCF”) analysis under the Fair value less costs of disposal approach to assess the recoverable value of the Mt Cattlin CGU property, plant and equipment (including mine development costs).
The following key assumptions were used in the DCF valuation of Mt Cattlin:
• Future production based on the life of mine (“LOM”) plan. • Spodumene price forecasts (real) ranging from $577/dmt to $692/dmt CIF China. • Average future cost of production ranging from $385/dmt to $470/dmt. • Discount rate (real post tax) applied to cash flow projections of 8.46%.
The carrying value of the Mt Cattlin CGU before impairment charges was US$215,325,000. After determining the fair value of Mt Cattlin using the DCF analysis, Galaxy has determined that the recoverable amount of the Mt Cattlin CGU was less than its carrying value and therefore an impairment of US$123,472,000 million has been recognised at 30 June 2019 (2018:US$nil).
The Group considered a number of sensitivities in assessing the recoverable amount as at 30 June 2019. The Group does consider certain assumptions to have a more significant impact on the assessment of the recoverable value and accordingly sensitivities on these assumptions are set out below. The cashflow estimates are most sensitive to changes in spodumene prices. It is estimated that changes in key assumptions, if all other assumptions remain unchanged, would impact recoverable amounts as 30 June 2019 as follows:
• A decrease in the forecast CIF China (real) spodumene price by 10% whilst maintaining all other assumptions would, in itself, result in an additional impairment of $43 million.
For
per
sona
l use
onl
y
NOTES TO THE CONDENSED CONSOLIDATED FINANCIAL STATEMENTS
HALF-YEAR FINANCIAL REPORT 30 JUNE 2019 21
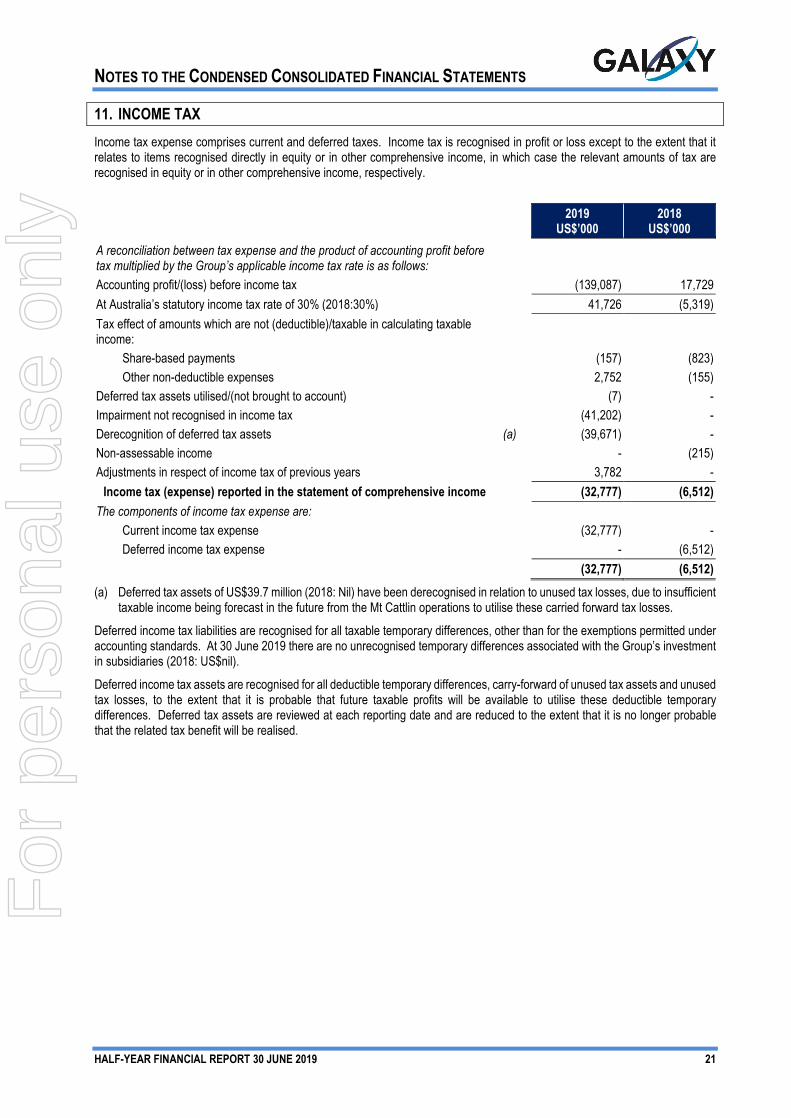
11. INCOME TAX Income tax expense comprises current and deferred taxes. Income tax is recognised in profit or loss except to the extent that it relates to items recognised directly in equity or in other comprehensive income, in which case the relevant amounts of tax are recognised in equity or in other comprehensive income, respectively.
2019 US$’000
2018 US$’000
A reconciliation between tax expense and the product of accounting profit before tax multiplied by the Group’s applicable income tax rate is as follows:
Accounting profit/(loss) before income tax (139,087) 17,729 At Australia’s statutory income tax rate of 30% (2018:30%) 41,726 (5,319) Tax effect of amounts which are not (deductible)/taxable in calculating taxable income:
Share-based payments (157) (823) Other non-deductible expenses 2,752 (155)
Deferred tax assets utilised/(not brought to account) (7) - Impairment not recognised in income tax (41,202) - Derecognition of deferred tax assets (a) (39,671) - Non-assessable income - (215) Adjustments in respect of income tax of previous years 3,782 -
Income tax (expense) reported in the statement of comprehensive income (32,777) (6,512) The components of income tax expense are:
Current income tax expense (32,777) - Deferred income tax expense - (6,512)
(32,777) (6,512) (a) Deferred tax assets of US$39.7 million (2018: Nil) have been derecognised in relation to unused tax losses, due to insufficient
taxable income being forecast in the future from the Mt Cattlin operations to utilise these carried forward tax losses.
Deferred income tax liabilities are recognised for all taxable temporary differences, other than for the exemptions permitted under accounting standards. At 30 June 2019 there are no unrecognised temporary differences associated with the Group’s investment in subsidiaries (2018: US$nil).
Deferred income tax assets are recognised for all deductible temporary differences, carry-forward of unused tax assets and unused tax losses, to the extent that it is probable that future taxable profits will be available to utilise these deductible temporary differences. Deferred tax assets are reviewed at each reporting date and are reduced to the extent that it is no longer probable that the related tax benefit will be realised.
For
per
sona
l use
onl
y
NOTES TO THE CONDENSED CONSOLIDATED FINANCIAL STATEMENTS
HALF-YEAR FINANCIAL REPORT 30 JUNE 2019 22
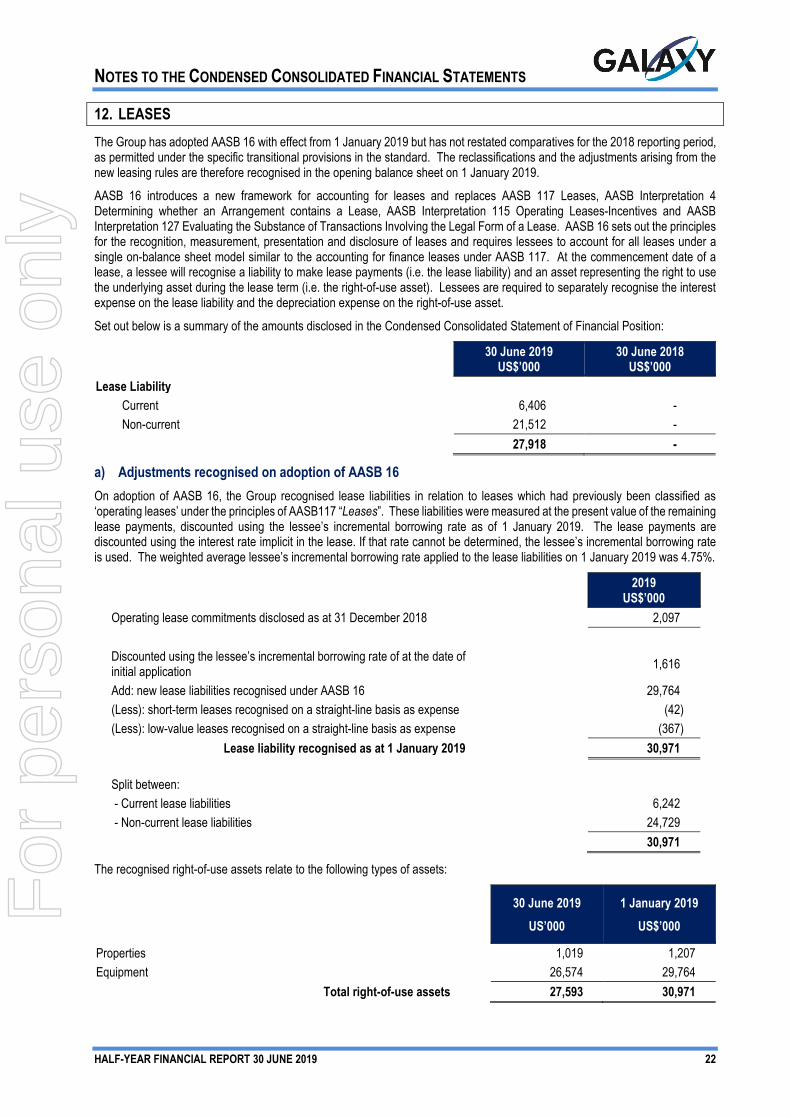
12. LEASES The Group has adopted AASB 16 with effect from 1 January 2019 but has not restated comparatives for the 2018 reporting period, as permitted under the specific transitional provisions in the standard. The reclassifications and the adjustments arising from the new leasing rules are therefore recognised in the opening balance sheet on 1 January 2019.
AASB 16 introduces a new framework for accounting for leases and replaces AASB 117 Leases, AASB Interpretation 4 Determining whether an Arrangement contains a Lease, AASB Interpretation 115 Operating Leases-Incentives and AASB Interpretation 127 Evaluating the Substance of Transactions Involving the Legal Form of a Lease. AASB 16 sets out the principles for the recognition, measurement, presentation and disclosure of leases and requires lessees to account for all leases under a single on-balance sheet model similar to the accounting for finance leases under AASB 117. At the commencement date of a lease, a lessee will recognise a liability to make lease payments (i.e. the lease liability) and an asset representing the right to use the underlying asset during the lease term (i.e. the right-of-use asset). Lessees are required to separately recognise the interest expense on the lease liability and the depreciation expense on the right-of-use asset.
Set out below is a summary of the amounts disclosed in the Condensed Consolidated Statement of Financial Position:
30 June 2019 US$’000
30 June 2018 US$’000
Lease Liability Current 6,406 - Non-current 21,512 - 27,918 -
a) Adjustments recognised on adoption of AASB 16 On adoption of AASB 16, the Group recognised lease liabilities in relation to leases which had previously been classified as ‘operating leases’ under the principles of AASB117 “Leases”. These liabilities were measured at the present value of the remaining lease payments, discounted using the lessee’s incremental borrowing rate as of 1 January 2019. The lease payments are discounted using the interest rate implicit in the lease. If that rate cannot be determined, the lessee’s incremental borrowing rate is used. The weighted average lessee’s incremental borrowing rate applied to the lease liabilities on 1 January 2019 was 4.75%.
2019 US$’000
Operating lease commitments disclosed as at 31 December 2018 2,097 Discounted using the lessee’s incremental borrowing rate of at the date of initial application 1,616
Add: new lease liabilities recognised under AASB 16 29,764 (Less): short-term leases recognised on a straight-line basis as expense (42) (Less): low-value leases recognised on a straight-line basis as expense (367)
Lease liability recognised as at 1 January 2019 30,971 Split between:
- Current lease liabilities 6,242 - Non-current lease liabilities 24,729 30,971
The recognised right-of-use assets relate to the following types of assets:
30 June 2019
US’000 1 January 2019
US$’000
Properties 1,019 1,207 Equipment 26,574 29,764
Total right-of-use assets 27,593 30,971
For
per
sona
l use
onl
y
NOTES TO THE CONDENSED CONSOLIDATED FINANCIAL STATEMENTS
HALF-YEAR FINANCIAL REPORT 30 JUNE 2019 23
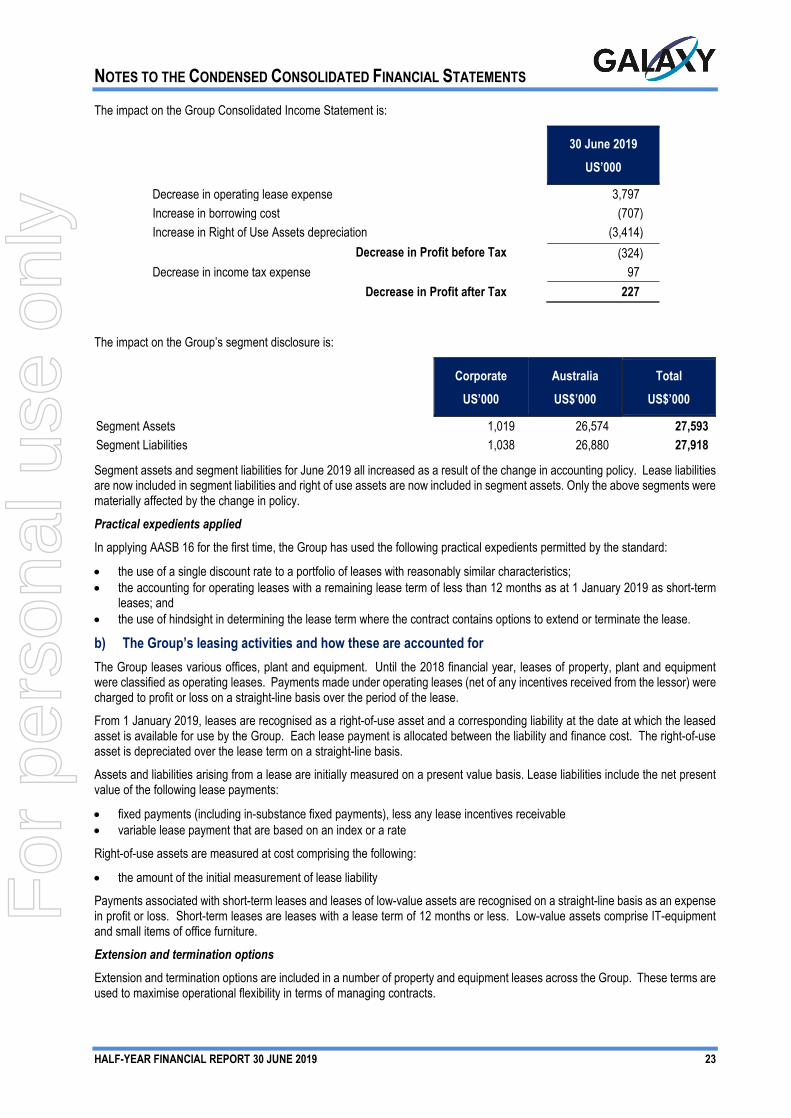
The impact on the Group Consolidated Income Statement is:
30 June 2019
US’000
Decrease in operating lease expense 3,797 Increase in borrowing cost (707) Increase in Right of Use Assets depreciation (3,414)
Decrease in Profit before Tax (324) Decrease in income tax expense 97
Decrease in Profit after Tax 227
The impact on the Group’s segment disclosure is:
Corporate
US’000 Australia US$’000
Total US$’000
Segment Assets 1,019 26,574 27,593 Segment Liabilities 1,038 26,880 27,918
Segment assets and segment liabilities for June 2019 all increased as a result of the change in accounting policy. Lease liabilities are now included in segment liabilities and right of use assets are now included in segment assets. Only the above segments were materially affected by the change in policy.
Practical expedients applied In applying AASB 16 for the first time, the Group has used the following practical expedients permitted by the standard:
• the use of a single discount rate to a portfolio of leases with reasonably similar characteristics; • the accounting for operating leases with a remaining lease term of less than 12 months as at 1 January 2019 as short-term
leases; and • the use of hindsight in determining the lease term where the contract contains options to extend or terminate the lease.
b) The Group’s leasing activities and how these are accounted for The Group leases various offices, plant and equipment. Until the 2018 financial year, leases of property, plant and equipment were classified as operating leases. Payments made under operating leases (net of any incentives received from the lessor) were charged to profit or loss on a straight-line basis over the period of the lease.
From 1 January 2019, leases are recognised as a right-of-use asset and a corresponding liability at the date at which the leased asset is available for use by the Group. Each lease payment is allocated between the liability and finance cost. The right-of-use asset is depreciated over the lease term on a straight-line basis.
Assets and liabilities arising from a lease are initially measured on a present value basis. Lease liabilities include the net present value of the following lease payments:
• fixed payments (including in-substance fixed payments), less any lease incentives receivable • variable lease payment that are based on an index or a rate
Right-of-use assets are measured at cost comprising the following:
• the amount of the initial measurement of lease liability
Payments associated with short-term leases and leases of low-value assets are recognised on a straight-line basis as an expense in profit or loss. Short-term leases are leases with a lease term of 12 months or less. Low-value assets comprise IT-equipment and small items of office furniture.
Extension and termination options Extension and termination options are included in a number of property and equipment leases across the Group. These terms are used to maximise operational flexibility in terms of managing contracts.
For
per
sona
l use
onl
y
NOTES TO THE CONDENSED CONSOLIDATED FINANCIAL STATEMENTS
HALF-YEAR FINANCIAL REPORT 30 JUNE 2019 24
13. COMMITMENTS AND CONTINGENCIES a) Capital commitments Mining tenements In order to maintain current rights of tenure to mining tenements, the Group will be required to perform minimum exploration work to meet the minimum expenditure requirements. This expenditure will only be incurred should the Group retain its existing level of interest in its various exploration areas and provided access to mining tenements is not restricted. These obligations will be fulfilled in the normal course of operations, which may include exploration and evaluation activities. There have been no significant changes to the commitments and contingencies disclosed in the most recent financial report.
b) Contingent assets and liabilities The Group had no material contingent liabilities or contingent assets at 30 June 2019 (31 December 2018: nil). The Group occasionally receives claims arising from its activities in the normal course of business. It is expected that any liabilities arising from such claims would not have a material effect on the Group’s operating results or financial performance.
14. EVENTS SUBSEQUENT TO REPORTING DATE Other than the matter set out below, in the interval between the end of the Half-Year and the date of this report there has not arisen any item, transaction or event of a material and unusual nature likely, in the opinion of the Directors of the Company, to affect significantly the operations of the Group, the results of those operations, or the state of affairs of the Group, in future financial years:
• Simon Hay commenced as Chief Executive Officer on 1 July 2019. Anthony Tse remains as an Executive Director. • As at 30 June 2019, the fair value of Galaxy's investment in Alita Resources Limited (“Alita”) was US$17.4 million
(31 December 2018: US$11.1 million). On 19 August 2019, Alita announced that they had received a notice of default from its consortium of lenders under their secured A$40 million loan facility. On 27 August 2019, Galaxy acquired the secured A$40 million loan facility from the consortium of lenders for a total acquisition cost of US$31.1 million including accrued interest and costs. On 28 August 2019, voluntary administrators were appointed to Alita and each of its Australian subsidiaries by their directors. On 29 August 2019, Galaxy appointed KPMG as Receiver and Manager of Alita and some of its Australian subsidiaries. As the outcome of the voluntary administration and receivership is not certain, it could have a material negative impact on the recoverability of the value of Galaxy’s investment in Alita of US$17.4 million included in Financial Assets on the Balance Sheet at 30 June 2019. Galaxy measures the fair value of all of its Financial Assets at Level 1 (being quoted prices (unadjusted) in active markets for identical assets or liabilities).
For
per
sona
l use
onl
y
HALF-YEAR FINANCIAL REPORT 30 JUNE 2019 25
DIRECTORS’ DECLARATION In the Directors’ opinion:
(a) the half-year financial statements and notes set out on pages 9 to 24 are in accordance with the Corporations Act 2001 including:
i. complying with Accounting Standards, the Corporations Regulations 2001 and other mandatory professional reporting requirements; and
ii. giving a true and fair view of the Group’s financial position as at 30 June 2019 and its performance for the half-year ended on that date; and
(b) there are reasonable grounds to believe that the Company will be able to pay its debts as and when they become due and payable.
The Directors have been given the declarations required by Section 295A of the Corporations Act 2001 from the Chief Executive Officer and Chief Financial Officer for the half-year ended 30 June 2019.
This declaration is made in accordance with a resolution of the Directors.
Martin Rowley Chairman
Dated in Perth on 29 August 2019.
For
per
sona
l use
onl
y
PricewaterhouseCoopers, ABN 52 780 433 757 Brookfield Place, 125 St Georges Terrace, PERTH WA 6000, GPO Box D198, PERTH WA 6840 T: +61 8 9238 3000, F: +61 8 9238 3999, www.pwc.com.au
Liability limited by a scheme approved under Professional Standards Legislation.
Independent auditor's review report to the members of Galaxy Resources Limited
Report on the Condensed Consolidated Half-Year Financial Report We have reviewed the accompanying condensed consolidated half-year financial report of Galaxy Resources Limited (the Company), which comprises the condensed consolidated statement of financial position as at 30 June 2019, the condensed consolidated statement of changes in equity, condensed consolidated statement of cash flows and condensed consolidated income statement and statement of other comprehensive income for the half-year ended on that date, selected other explanatory notes and the directors' declaration for Galaxy Resources Limited. The Group comprises the Company and the entities it controlled during that half-year.
Directors' responsibility for the half-year financial report The directors of the Company are responsible for the preparation of the half-year financial report that gives a true and fair view in accordance with Australian Accounting Standards and the Corporations Act 2001 and for such internal control as the directors determine is necessary to enable the preparation of the half-year financial report that is free from material misstatement whether due to fraud or error.
Auditor's responsibility Our responsibility is to express a conclusion on the half-year financial report based on our review. We conducted our review in accordance with Australian Auditing Standard on Review Engagements ASRE 2410 Review of a Financial Report Performed by the Independent Auditor of the Entity, in order to state whether, on the basis of the procedures described, we have become aware of any matter that makes us believe that the half-year financial report is not in accordance with the Corporations Act 2001 including giving a true and fair view of the Group’s financial position as at 30 June 2019 and its performance for the half-year ended on that date; and complying with Accounting Standard AASB 134 Interim Financial Reporting and the Corporations Regulations 2001. As the auditor of Galaxy Resources Limited, ASRE 2410 requires that we comply with the ethical requirements relevant to the audit of the annual financial report.
A review of a half-year financial report consists of making enquiries, primarily of persons responsible for financial and accounting matters, and applying analytical and other review procedures. A review is substantially less in scope than an audit conducted in accordance with Australian Auditing Standards and consequently does not enable us to obtain assurance that we would become aware of all significant matters that might be identified in an audit. Accordingly, we do not express an audit opinion.
Independence In conducting our review, we have complied with the independence requirements of the Corporations Act 2001.
For
per
sona
l use
onl
y
2
Conclusion Based on our review, which is not an audit, we have not become aware of any matter that makes us believe that the half-year financial report of Galaxy Resources Limited is not in accordance with the Corporations Act 2001 including:
1. giving a true and fair view of the Group’s financial position as at 30 June 2019 and of its performance for the half-year ended on that date;
2. complying with Accounting Standard AASB 134 Interim Financial Reporting and the Corporations Regulations 2001.
PricewaterhouseCoopers
Douglas Craig Perth Partner
29 August 2019
For
per
sona
l use
onl
y