Embed Size (px)
Citation preview
Slide 1[xx]
GALAXY RESOURCES LIMITED
Investor PresentationMarch 2018
ASX:GXY
Slide 2[xx]Galaxy Resources Limited (ASX:GXY)
Disclaimer
This document contains forward looking statements concerning the projects owned by Galaxy. Statements concerning mining reserves and resources may also be deemed to be forward looking statements in that they involve estimates based on specific assumptions. Forward-looking statements are not statements of historical fact and actual events and results may differ materially from those described in the forward looking statements as a result of a variety of risks, uncertainties and other factors. Forward-looking statements are inherently subject to business, economic, competitive, political and social uncertainties and contingencies. Many factors could cause the Company’s actual results to differ materially from those expressed or implied in any forward-looking information provided by the Company, or on behalf of, the Company. Such factors include, among other things, risks relating to additional funding requirements, metal prices, exploration, development and operating risks, competition, production risks, regulatory restrictions, including environmental regulation and liability and potential title disputes. Forward looking statements in this document are based on Galaxy’s beliefs, opinions and estimates of Galaxy as of the dates the forward looking statements are made, and no obligation is assumed to update forward looking statements if these beliefs, opinions and estimates should change or to reflect other future developments. There can be no assurance that Galaxy’s plans for development of its mineral properties will proceed as currently expected. There can also be no assurance that Galaxy will be able to confirm the presence of additional mineral deposits, that any mineralization will prove to be economic or that a mine will successfully be developed on any of Galaxy’s mineral properties.Circumstances or management’s estimates or opinions could change. The reader is cautioned not to place undue reliance on forward-looking statements. Data and amounts shown in this document relating to capital costs, operating costs, potential or estimated cashflow and project timelines are internally generated best estimates only. All such information and data is currently under review as part of Galaxy’s ongoing operational, development and feasibility studies. Accordingly, Galaxy makes no representation as to the accuracy and/or completeness of the figures or data included in the document. Not For Release in US This presentation does not constitute an offer of securities for sale in any jurisdiction, including the United States. Any securities described in this presentation may not be offered or sold in the United States absent registration or an exemption from registration under the United States Securities Act of 1933, as amended, following the preparation of required documents and completion of required processes to permit such offer or sale.
2
CONTACT INFORMATIONLevel 4 / 21 Kintail Road, Applecross, Western Australia 6153 PO Box 1337, Canning Bridge LPOApplecross WA 6953T: +61 8 9215 1700F: +61 8 9215 1799E: [email protected]
Slide 3[xx]Galaxy Resources Limited (ASX:GXY)
Galaxy Overview
3
Slide 4[xx]Galaxy Resources Limited (ASX:GXY)
Company Highlights
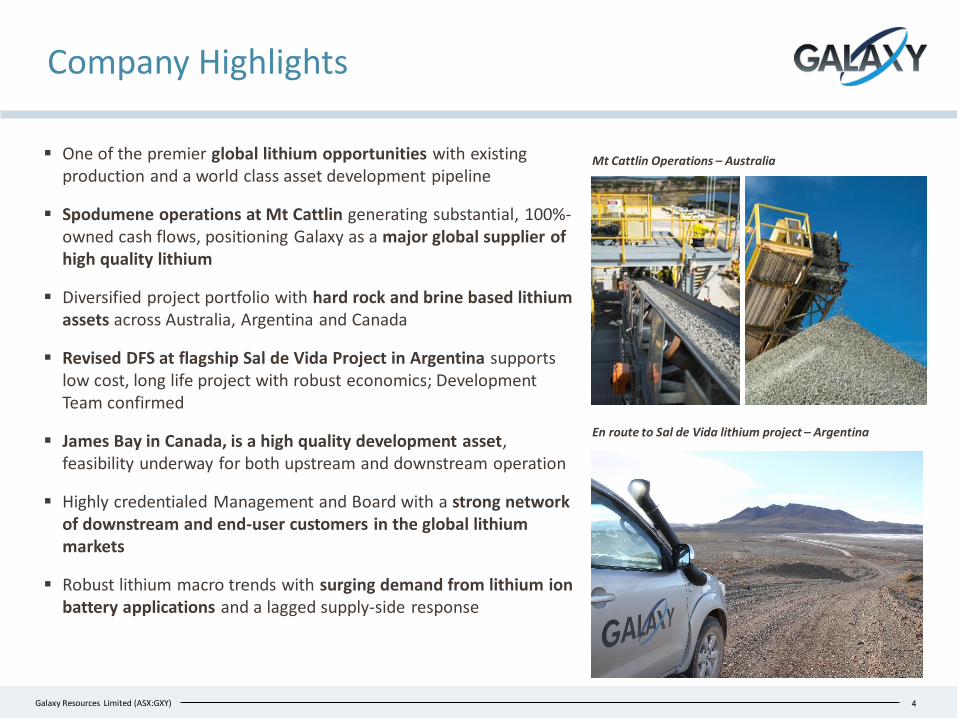
▪ One of the premier global lithium opportunities with existing production and a world class asset development pipeline
▪ Spodumene operations at Mt Cattlin generating substantial, 100%-owned cash flows, positioning Galaxy as a major global supplier of high quality lithium
▪ Diversified project portfolio with hard rock and brine based lithium assets across Australia, Argentina and Canada
▪ Revised DFS at flagship Sal de Vida Project in Argentina supports low cost, long life project with robust economics; Development Team confirmed
▪ James Bay in Canada, is a high quality development asset, feasibility underway for both upstream and downstream operation
▪ Highly credentialed Management and Board with a strong network of downstream and end-user customers in the global lithium markets
▪ Robust lithium macro trends with surging demand from lithium ion battery applications and a lagged supply-side response
4
Mt Cattlin Operations – Australia
En route to Sal de Vida lithium project – Argentina
Slide 5[xx]Galaxy Resources Limited (ASX:GXY)
Corporate Snapshot
5
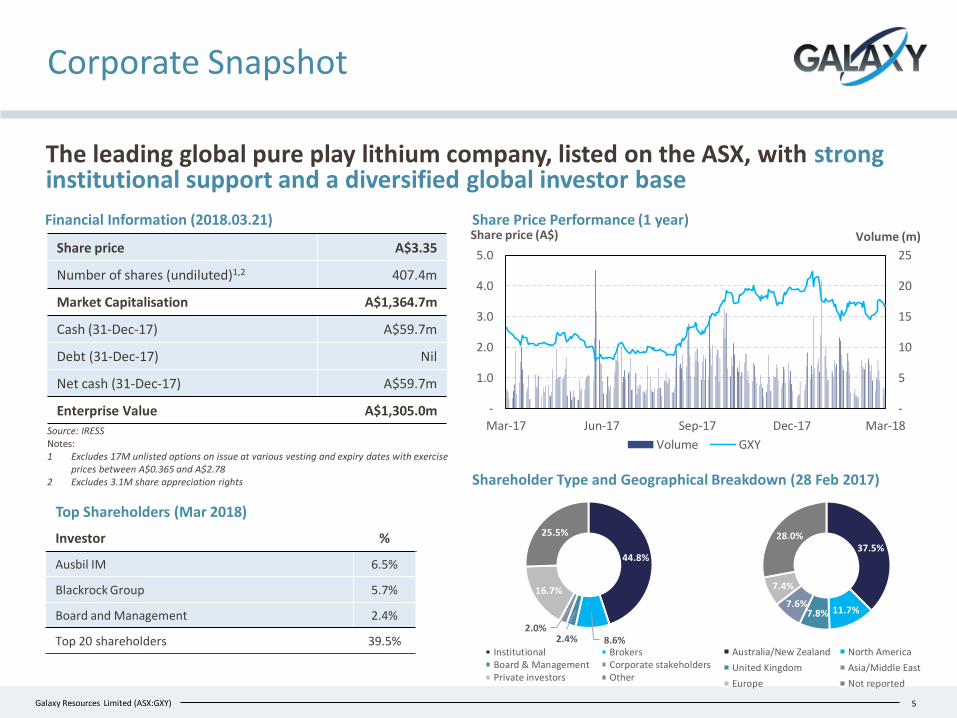
Financial Information (2018.03.21)
The leading global pure play lithium company, listed on the ASX, with strong institutional support and a diversified global investor base
Share Price Performance (1 year)
Share price A$3.35
Number of shares (undiluted)1,2 407.4m
Market Capitalisation A$1,364.7m
Cash (31-Dec-17) A$59.7m
Debt (31-Dec-17) Nil
Net cash (31-Dec-17) A$59.7m
Enterprise Value A$1,305.0m
Investor %
Ausbil IM 6.5%
Blackrock Group 5.7%
Board and Management 2.4%
Top 20 shareholders 39.5%
Top Shareholders (Mar 2018)
Shareholder Type and Geographical Breakdown (28 Feb 2017)
Source: IRESSNotes:1 Excludes 17M unlisted options on issue at various vesting and expiry dates with exercise
prices between A$0.365 and A$2.78 2 Excludes 3.1M share appreciation rights
-
5
10
15
20
25
-
1.0
2.0
3.0
4.0
5.0
Mar-17 Jun-17 Sep-17 Dec-17 Mar-18
Volume (m)Share price (A$)
Volume GXY
44.8%
8.6%2.4%2.0%
16.7%
25.5%
Institutional BrokersBoard & Management Corporate stakeholdersPrivate investors Other
37.5%
11.7%7.8%7.6%
7.4%
28.0%
Australia/New Zealand North America
United Kingdom Asia/Middle East
Europe Not reported
Slide 6[xx]Galaxy Resources Limited (ASX:GXY)
Diverse Asset Portfolio
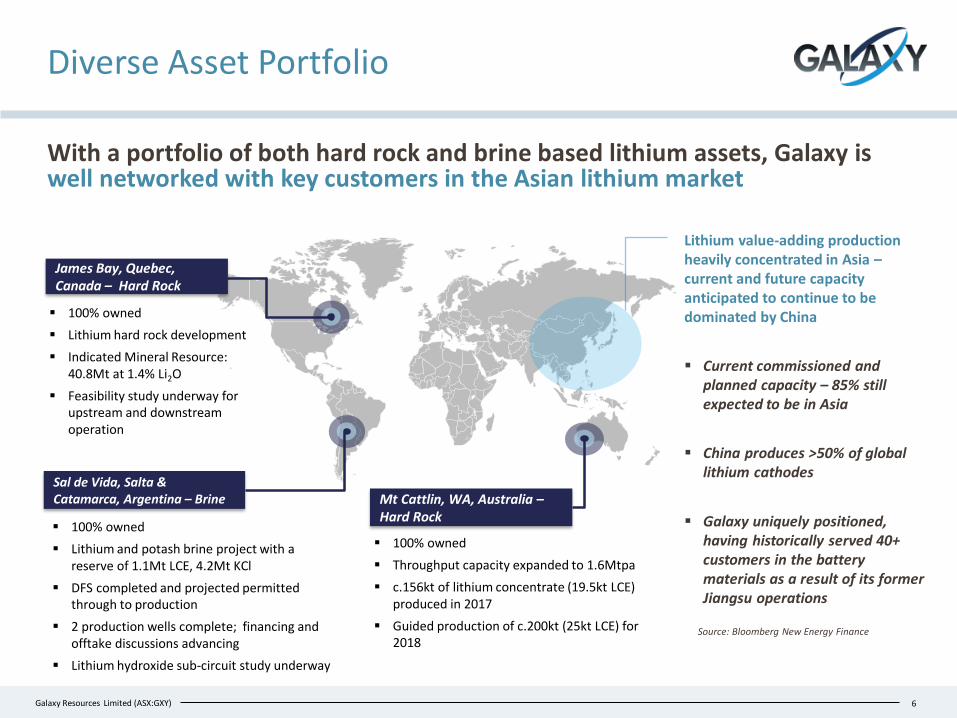
With a portfolio of both hard rock and brine based lithium assets, Galaxy is well networked with key customers in the Asian lithium market
6
Mt Cattlin, WA, Australia –Hard Rock
Sal de Vida, Salta & Catamarca, Argentina – Brine
James Bay, Quebec, Canada – Hard Rock
▪ 100% owned
▪ Lithium hard rock development
▪ Indicated Mineral Resource: 40.8Mt at 1.4% Li2O
▪ Feasibility study underway for upstream and downstream operation
▪ 100% owned
▪ Lithium and potash brine project with a reserve of 1.1Mt LCE, 4.2Mt KCl
▪ DFS completed and projected permitted through to production
▪ 2 production wells complete; financing and offtake discussions advancing
▪ Lithium hydroxide sub-circuit study underway
Lithium value-adding production heavily concentrated in Asia –current and future capacity anticipated to continue to be dominated by China
▪ Current commissioned and planned capacity – 85% still expected to be in Asia
▪ China produces >50% of global lithium cathodes
▪ Galaxy uniquely positioned, having historically served 40+ customers in the battery materials as a result of its former Jiangsu operations
Source: Bloomberg New Energy Finance
▪ 100% owned
▪ Throughput capacity expanded to 1.6Mtpa
▪ c.156kt of lithium concentrate (19.5kt LCE) produced in 2017
▪ Guided production of c.200kt (25kt LCE) for 2018
Slide 7[xx]Galaxy Resources Limited (ASX:GXY)
Market Review
7
Slide 8[xx]Galaxy Resources Limited (ASX:GXY) 8
Lithium-Ion Batteries – Demand Drivers
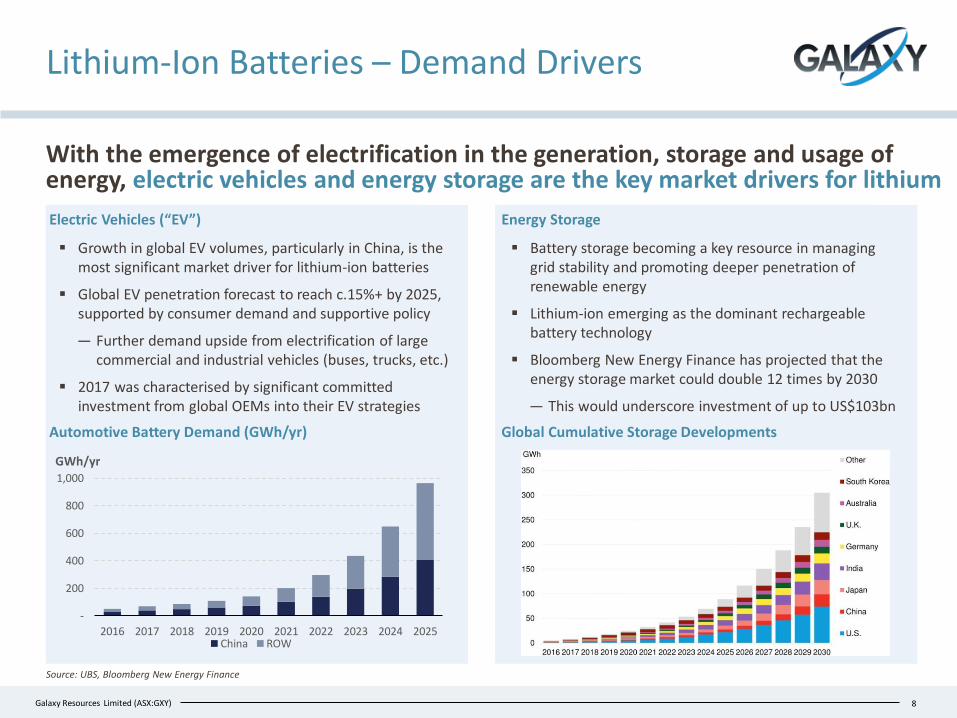
With the emergence of electrification in the generation, storage and usage of energy, electric vehicles and energy storage are the key market drivers for lithium
Electric Vehicles (“EV”) Energy Storage
▪ Battery storage becoming a key resource in managing grid stability and promoting deeper penetration of renewable energy
▪ Lithium-ion emerging as the dominant rechargeable battery technology
▪ Bloomberg New Energy Finance has projected that the energy storage market could double 12 times by 2030
— This would underscore investment of up to US$103bn
▪ Growth in global EV volumes, particularly in China, is the most significant market driver for lithium-ion batteries
▪ Global EV penetration forecast to reach c.15%+ by 2025, supported by consumer demand and supportive policy
— Further demand upside from electrification of large commercial and industrial vehicles (buses, trucks, etc.)
▪ 2017 was characterised by significant committed investment from global OEMs into their EV strategies
Source: UBS, Bloomberg New Energy Finance
Global Cumulative Storage DevelopmentsAutomotive Battery Demand (GWh/yr)
-
200
400
600
800
1,000
2016 2017 2018 2019 2020 2021 2022 2023 2024 2025
GWh/yr
China ROW
Slide 9[xx]Galaxy Resources Limited (ASX:GXY) 9
Lithium Sector Growth In China
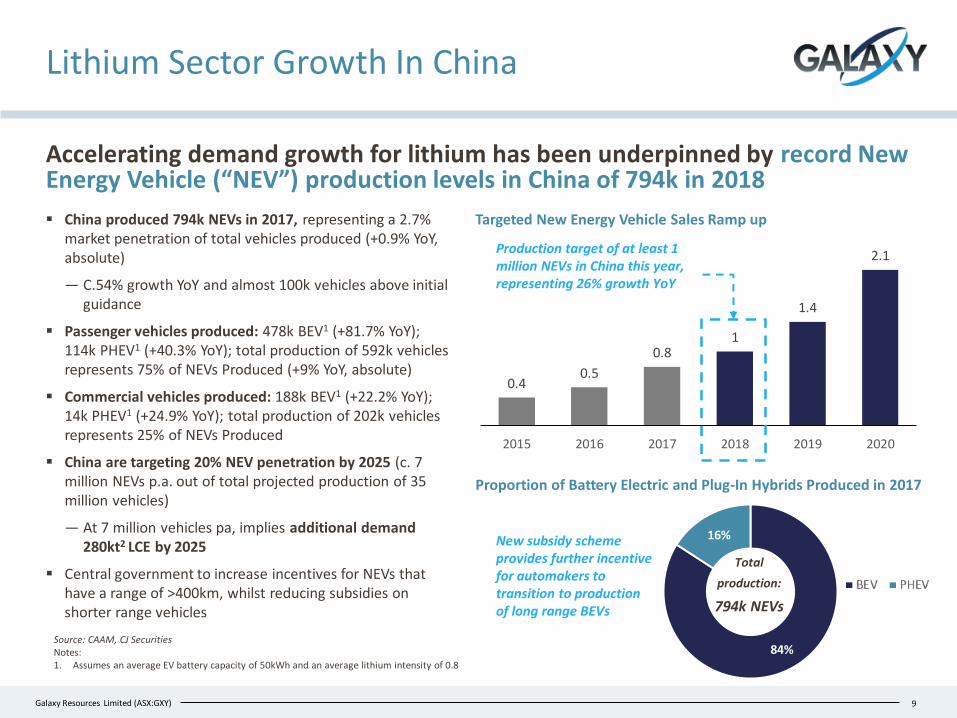
Accelerating demand growth for lithium has been underpinned by record New Energy Vehicle (“NEV”) production levels in China of 794k in 2018
Source: CAAM, CJ SecuritiesNotes: 1. Assumes an average EV battery capacity of 50kWh and an average lithium intensity of 0.8
Targeted New Energy Vehicle Sales Ramp up
0.40.5
0.81
1.4
2.1
2015 2016 2017 2018 2019 2020
Production target of at least 1 million NEVs in China this year, representing 26% growth YoY
Total
production:
794k NEVs
84%
16%
Proportion of Battery Electric and Plug-In Hybrids Produced in 2017
New subsidy scheme provides further incentive for automakers to transition to production of long range BEVs
▪ China produced 794k NEVs in 2017, representing a 2.7% market penetration of total vehicles produced (+0.9% YoY, absolute)
— C.54% growth YoY and almost 100k vehicles above initial guidance
▪ Passenger vehicles produced: 478k BEV1 (+81.7% YoY); 114k PHEV1 (+40.3% YoY); total production of 592k vehicles represents 75% of NEVs Produced (+9% YoY, absolute)
▪ Commercial vehicles produced: 188k BEV1 (+22.2% YoY); 14k PHEV1 (+24.9% YoY); total production of 202k vehicles represents 25% of NEVs Produced
▪ China are targeting 20% NEV penetration by 2025 (c. 7 million NEVs p.a. out of total projected production of 35 million vehicles)
— At 7 million vehicles pa, implies additional demand 280kt2 LCE by 2025
▪ Central government to increase incentives for NEVs that have a range of >400km, whilst reducing subsidies on shorter range vehicles
Slide 10[xx]Galaxy Resources Limited (ASX:GXY)
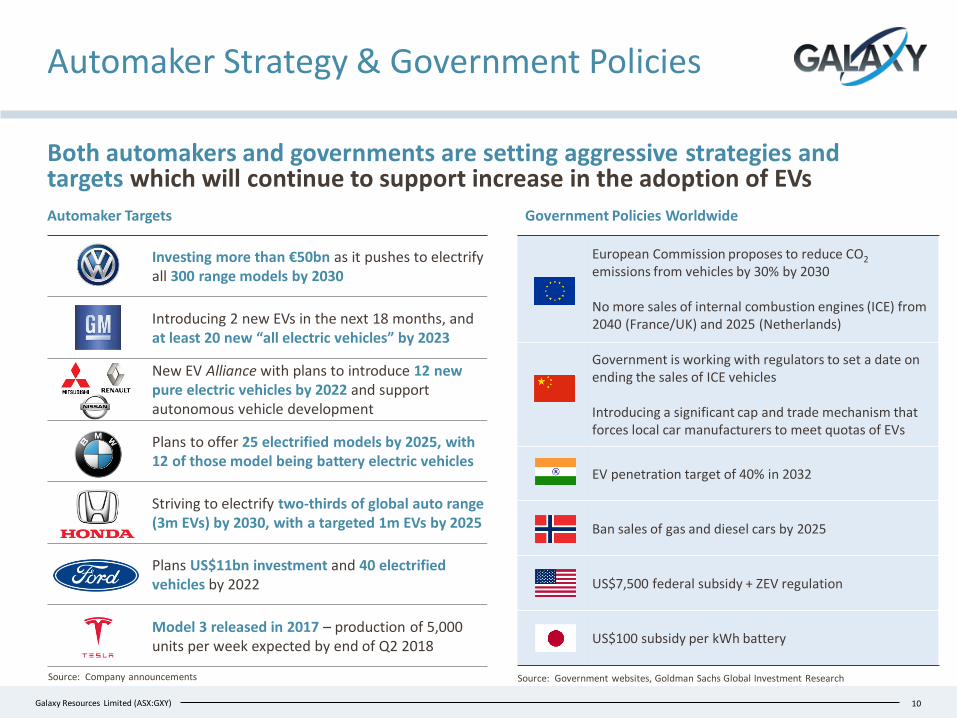
Investing more than €50bn as it pushes to electrify all 300 range models by 2030
Introducing 2 new EVs in the next 18 months, and at least 20 new “all electric vehicles” by 2023
New EV Alliance with plans to introduce 12 new pure electric vehicles by 2022 and support autonomous vehicle development
Plans to offer 25 electrified models by 2025, with 12 of those model being battery electric vehicles
Striving to electrify two-thirds of global auto range (3m EVs) by 2030, with a targeted 1m EVs by 2025
Plans US$11bn investment and 40 electrified vehicles by 2022
Model 3 released in 2017 – production of 5,000 units per week expected by end of Q2 2018
European Commission proposes to reduce CO2
emissions from vehicles by 30% by 2030
No more sales of internal combustion engines (ICE) from 2040 (France/UK) and 2025 (Netherlands)
Government is working with regulators to set a date on ending the sales of ICE vehicles
Introducing a significant cap and trade mechanism that forces local car manufacturers to meet quotas of EVs
EV penetration target of 40% in 2032
Ban sales of gas and diesel cars by 2025
US$7,500 federal subsidy + ZEV regulation
US$100 subsidy per kWh battery
Automaker Strategy & Government Policies
Both automakers and governments are setting aggressive strategies and targets which will continue to support increase in the adoption of EVs
10
Source: Company announcements
Automaker Targets Government Policies Worldwide
Source: Government websites, Goldman Sachs Global Investment Research
Slide 11[xx]Galaxy Resources Limited (ASX:GXY)
52.7
118.3
13.7
22.0
3.3
1.5
Jan-16 to Dec-16 Jan-17 to Dec-17
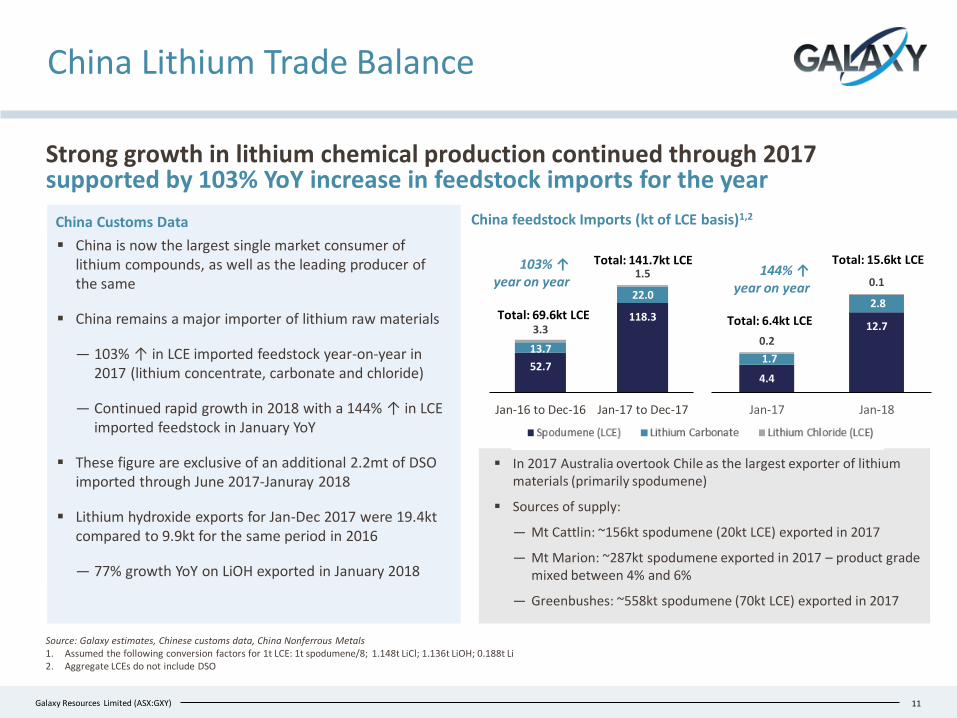
China Customs Data
▪ China is now the largest single market consumer of lithium compounds, as well as the leading producer of the same
▪ China remains a major importer of lithium raw materials
— 103% ↑ in LCE imported feedstock year-on-year in 2017 (lithium concentrate, carbonate and chloride)
— Continued rapid growth in 2018 with a 144% ↑ in LCE imported feedstock in January YoY
▪ These figure are exclusive of an additional 2.2mt of DSO imported through June 2017-Januray 2018
▪ Lithium hydroxide exports for Jan-Dec 2017 were 19.4kt compared to 9.9kt for the same period in 2016
— 77% growth YoY on LiOH exported in January 2018
China feedstock Imports (kt of LCE basis)1,2
103% ↑year on year
China Lithium Trade Balance
Source: Galaxy estimates, Chinese customs data, China Nonferrous Metals1. Assumed the following conversion factors for 1t LCE: 1t spodumene/8; 1.148t LiCl; 1.136t LiOH; 0.188t Li2. Aggregate LCEs do not include DSO
Strong growth in lithium chemical production continued through 2017 supported by 103% YoY increase in feedstock imports for the year
11
Total: 69.6kt LCE
Total: 141.7kt LCE
▪ In 2017 Australia overtook Chile as the largest exporter of lithium materials (primarily spodumene)
▪ Sources of supply:
— Mt Cattlin: ~156kt spodumene (20kt LCE) exported in 2017
— Mt Marion: ~287kt spodumene exported in 2017 – product grade mixed between 4% and 6%
— Greenbushes: ~558kt spodumene (70kt LCE) exported in 2017
4.4
12.7
1.7
2.8
0.2
0.1
Jan-17 Jan-18
Total: 6.4kt LCE
Total: 15.6kt LCE144% ↑
year on year
Slide 12[xx]Galaxy Resources Limited (ASX:GXY)
-
200
400
600
800
1,000
1,200
2016 2017 2018 2019 2020 2021 2022 2023 2024 2025
Non LiB applications LiB applications
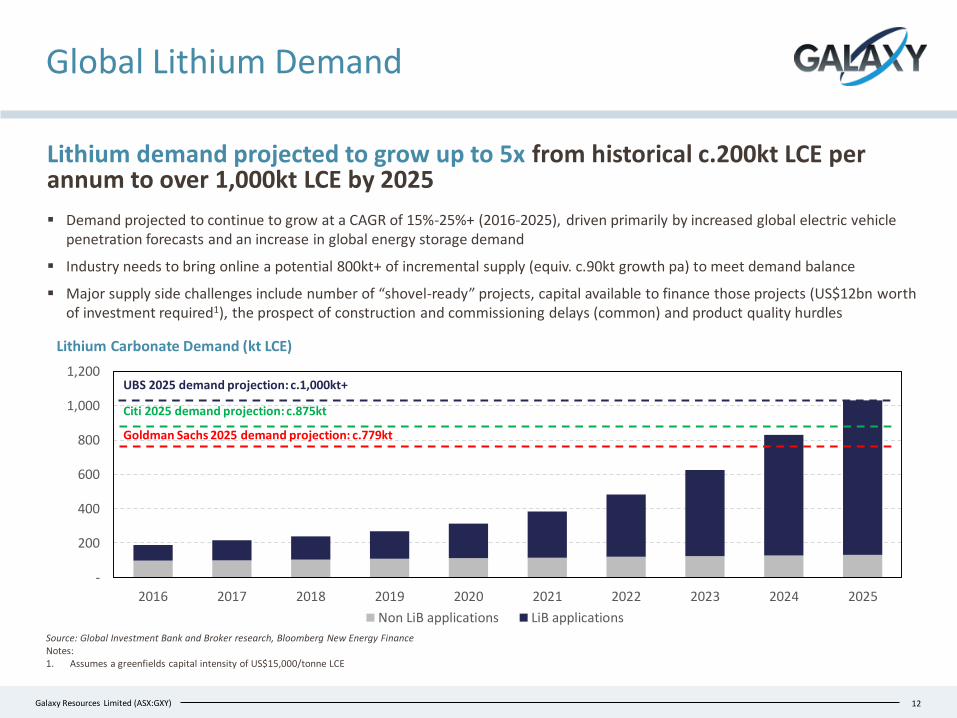
Global Lithium Demand
Lithium demand projected to grow up to 5x from historical c.200kt LCE per annum to over 1,000kt LCE by 2025
Lithium Carbonate Demand (kt LCE)
Source: Global Investment Bank and Broker research, Bloomberg New Energy FinanceNotes:1. Assumes a greenfields capital intensity of US$15,000/tonne LCE
12
▪ Demand projected to continue to grow at a CAGR of 15%-25%+ (2016-2025), driven primarily by increased global electric vehicle penetration forecasts and an increase in global energy storage demand
▪ Industry needs to bring online a potential 800kt+ of incremental supply (equiv. c.90kt growth pa) to meet demand balance
▪ Major supply side challenges include number of “shovel-ready” projects, capital available to finance those projects (US$12bn worth of investment required1), the prospect of construction and commissioning delays (common) and product quality hurdles
Goldman Sachs 2025 demand projection: c.779kt
Citi 2025 demand projection: c.875kt
UBS 2025 demand projection: c.1,000kt+
Slide 13[xx]Galaxy Resources Limited (ASX:GXY)
-
40,000
80,000
120,000
160,000
200,000
20
15
Sta
rt-
Ch
ina
Pri
ce
Big
3 -
Li2
CO
3p
rice
Lith
ium
Car
bo
nat
eP
rice
Lith
ium
Hyd
roxi
de
Pri
ce
Gross Pricing/t
Net Pricing/t
40,000
80,000
120,000
160,000
200,000
BG Li2CO3 BG LiOH
Lithium Pricing Trends
13
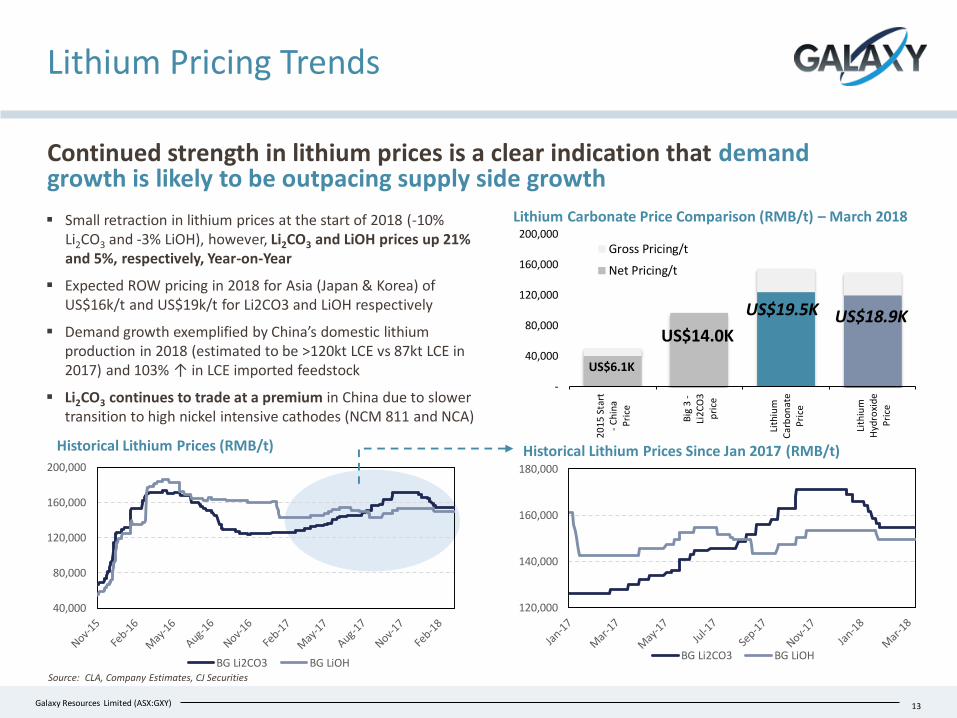
Continued strength in lithium prices is a clear indication that demand growth is likely to be outpacing supply side growth
Source: CLA, Company Estimates, CJ Securities
Historical Lithium Prices (RMB/t) Historical Lithium Prices Since Jan 2017 (RMB/t)
Lithium Carbonate Price Comparison (RMB/t) – March 2018
US$6.1K
US$19.5K US$18.9KUS$14.0K
▪ Small retraction in lithium prices at the start of 2018 (-10% Li2CO3 and -3% LiOH), however, Li2CO3 and LiOH prices up 21% and 5%, respectively, Year-on-Year
▪ Expected ROW pricing in 2018 for Asia (Japan & Korea) of US$16k/t and US$19k/t for Li2CO3 and LiOH respectively
▪ Demand growth exemplified by China’s domestic lithium production in 2018 (estimated to be >120kt LCE vs 87kt LCE in 2017) and 103% ↑ in LCE imported feedstock
▪ Li2CO3 continues to trade at a premium in China due to slower transition to high nickel intensive cathodes (NCM 811 and NCA)
120,000
140,000
160,000
180,000
BG Li2CO3 BG LiOH
Slide 14[xx]Galaxy Resources Limited (ASX:GXY) 14
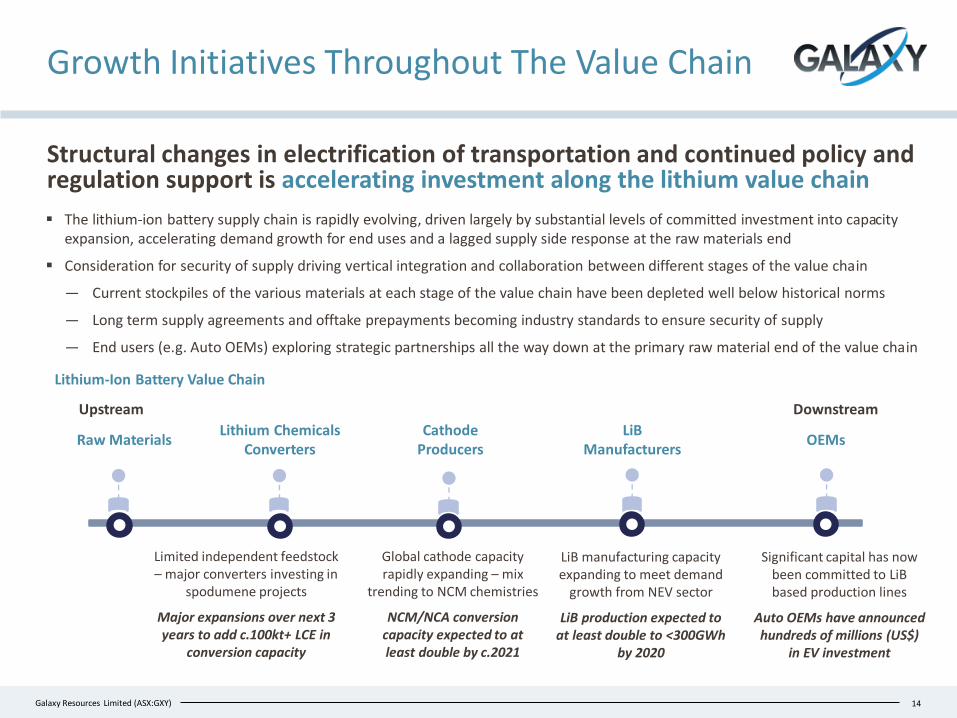
Structural changes in electrification of transportation and continued policy and regulation support is accelerating investment along the lithium value chain
Lithium-Ion Battery Value Chain
Downstream Upstream
Raw MaterialsLithium Chemicals
Converters Cathode
ProducersLiB
Manufacturers
Growth Initiatives Throughout The Value Chain
OEMs
▪ The lithium-ion battery supply chain is rapidly evolving, driven largely by substantial levels of committed investment into capacity expansion, accelerating demand growth for end uses and a lagged supply side response at the raw materials end
▪ Consideration for security of supply driving vertical integration and collaboration between different stages of the value chain
— Current stockpiles of the various materials at each stage of the value chain have been depleted well below historical norms
— Long term supply agreements and offtake prepayments becoming industry standards to ensure security of supply
— End users (e.g. Auto OEMs) exploring strategic partnerships all the way down at the primary raw material end of the value chain
Limited independent feedstock – major converters investing in
spodumene projects
Major expansions over next 3 years to add c.100kt+ LCE in
conversion capacity
Global cathode capacity rapidly expanding – mix
trending to NCM chemistries
NCM/NCA conversion capacity expected to at least double by c.2021
LiB manufacturing capacity expanding to meet demand
growth from NEV sector
LiB production expected to at least double to <300GWh
by 2020
Significant capital has now been committed to LiBbased production lines
Auto OEMs have announced hundreds of millions (US$)
in EV investment

Slide 15[xx]Galaxy Resources Limited (ASX:GXY)
Project Update
15
Slide 16[xx]Galaxy Resources Limited (ASX:GXY)
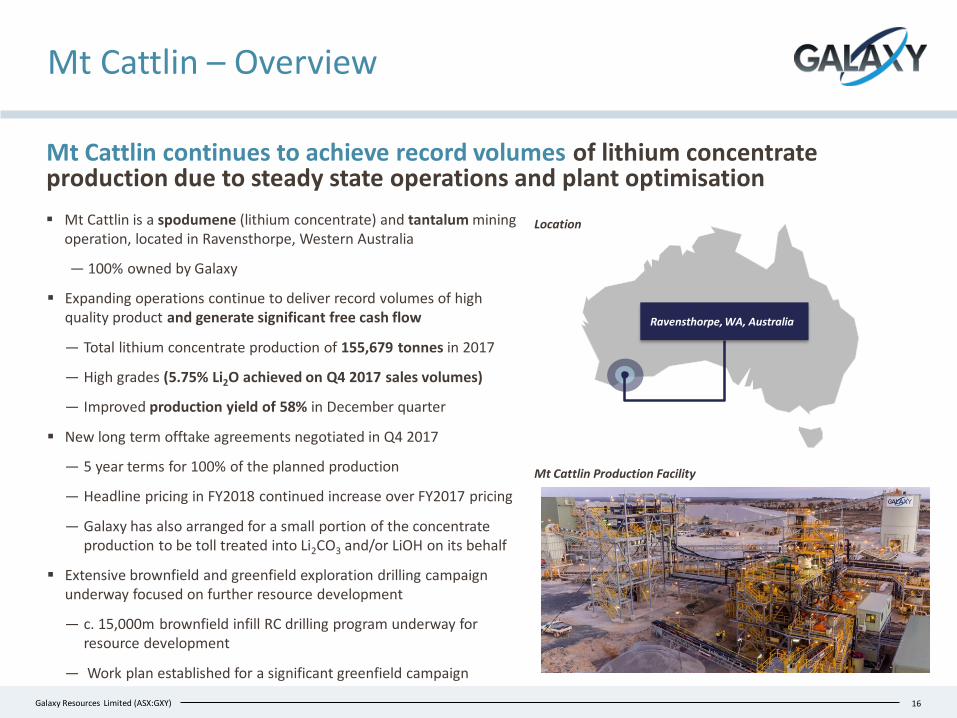
Mt Cattlin continues to achieve record volumes of lithium concentrate production due to steady state operations and plant optimisation
▪ Mt Cattlin is a spodumene (lithium concentrate) and tantalum mining operation, located in Ravensthorpe, Western Australia
― 100% owned by Galaxy
▪ Expanding operations continue to deliver record volumes of high quality product and generate significant free cash flow
― Total lithium concentrate production of 155,679 tonnes in 2017
― High grades (5.75% Li2O achieved on Q4 2017 sales volumes)
― Improved production yield of 58% in December quarter
▪ New long term offtake agreements negotiated in Q4 2017
― 5 year terms for 100% of the planned production
― Headline pricing in FY2018 continued increase over FY2017 pricing
― Galaxy has also arranged for a small portion of the concentrate production to be toll treated into Li2CO3 and/or LiOH on its behalf
▪ Extensive brownfield and greenfield exploration drilling campaign underway focused on further resource development
― c. 15,000m brownfield infill RC drilling program underway for resource development
― Work plan established for a significant greenfield campaign
16
Location
Ravensthorpe, WA, Australia
Mt Cattlin – Overview
Mt Cattlin Production Facility
Slide 17[xx]Galaxy Resources Limited (ASX:GXY)
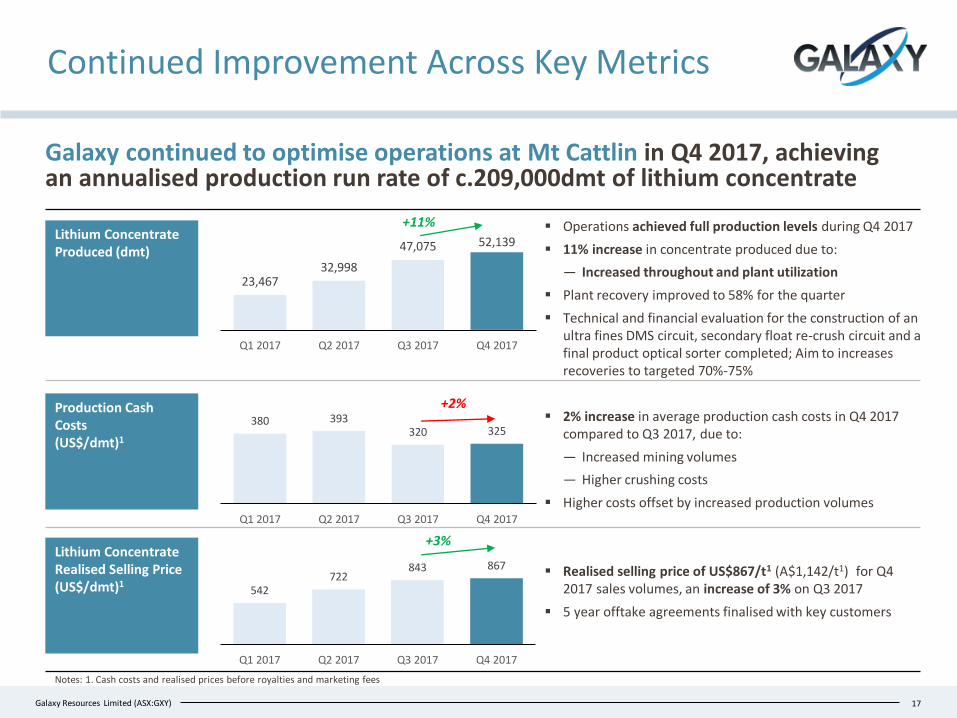
380 393320 325
Q1 2017 Q2 2017 Q3 2017 Q4 2017
542722
843 867
Q1 2017 Q2 2017 Q3 2017 Q4 2017
+3%
+2%
Continued Improvement Across Key Metrics
17
Notes: 1. Cash costs and realised prices before royalties and marketing fees
▪ Operations achieved full production levels during Q4 2017
▪ 11% increase in concentrate produced due to:
― Increased throughout and plant utilization
▪ Plant recovery improved to 58% for the quarter
▪ Technical and financial evaluation for the construction of an ultra fines DMS circuit, secondary float re-crush circuit and a final product optical sorter completed; Aim to increases recoveries to targeted 70%-75%
▪ 2% increase in average production cash costs in Q4 2017 compared to Q3 2017, due to:
― Increased mining volumes
― Higher crushing costs
▪ Higher costs offset by increased production volumes
▪ Realised selling price of US$867/t1 (A$1,142/t1) for Q4 2017 sales volumes, an increase of 3% on Q3 2017
▪ 5 year offtake agreements finalised with key customers
Galaxy continued to optimise operations at Mt Cattlin in Q4 2017, achieving an annualised production run rate of c.209,000dmt of lithium concentrate
Lithium ConcentrateProduced (dmt)
Production Cash Costs (US$/dmt)1
Lithium Concentrate Realised Selling Price (US$/dmt)1
+11%
23,46732,998
47,075 52,139
Q1 2017 Q2 2017 Q3 2017 Q4 2017
Slide 18[xx]Galaxy Resources Limited (ASX:GXY)
Sal de Vida – Overview
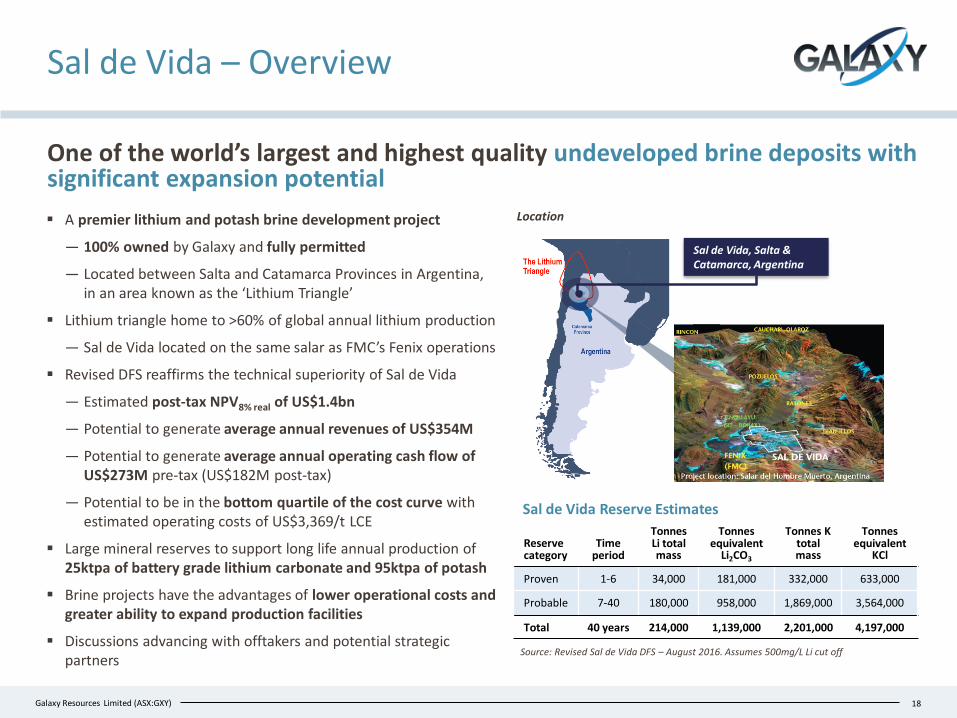
One of the world’s largest and highest quality undeveloped brine deposits with significant expansion potential
Reserve category
Time period
TonnesLi total mass
Tonnes equivalent
Li2CO3
Tonnes K total mass
Tonnes equivalent
KCl
Proven 1-6 34,000 181,000 332,000 633,000
Probable 7-40 180,000 958,000 1,869,000 3,564,000
Total 40 years 214,000 1,139,000 2,201,000 4,197,000
Source: Revised Sal de Vida DFS – August 2016. Assumes 500mg/L Li cut off
18
Sal de Vida Reserve Estimates
Location
Sal de Vida, Salta & Catamarca, Argentina
▪ A premier lithium and potash brine development project
― 100% owned by Galaxy and fully permitted
― Located between Salta and Catamarca Provinces in Argentina, in an area known as the ‘Lithium Triangle’
▪ Lithium triangle home to >60% of global annual lithium production
― Sal de Vida located on the same salar as FMC’s Fenix operations
▪ Revised DFS reaffirms the technical superiority of Sal de Vida
― Estimated post-tax NPV8% real of US$1.4bn
― Potential to generate average annual revenues of US$354M
― Potential to generate average annual operating cash flow of US$273M pre-tax (US$182M post-tax)
― Potential to be in the bottom quartile of the cost curve with estimated operating costs of US$3,369/t LCE
▪ Large mineral reserves to support long life annual production of 25ktpa of battery grade lithium carbonate and 95ktpa of potash
▪ Brine projects have the advantages of lower operational costs and greater ability to expand production facilities
▪ Discussions advancing with offtakers and potential strategic partners
Slide 19[xx]Galaxy Resources Limited (ASX:GXY) 19
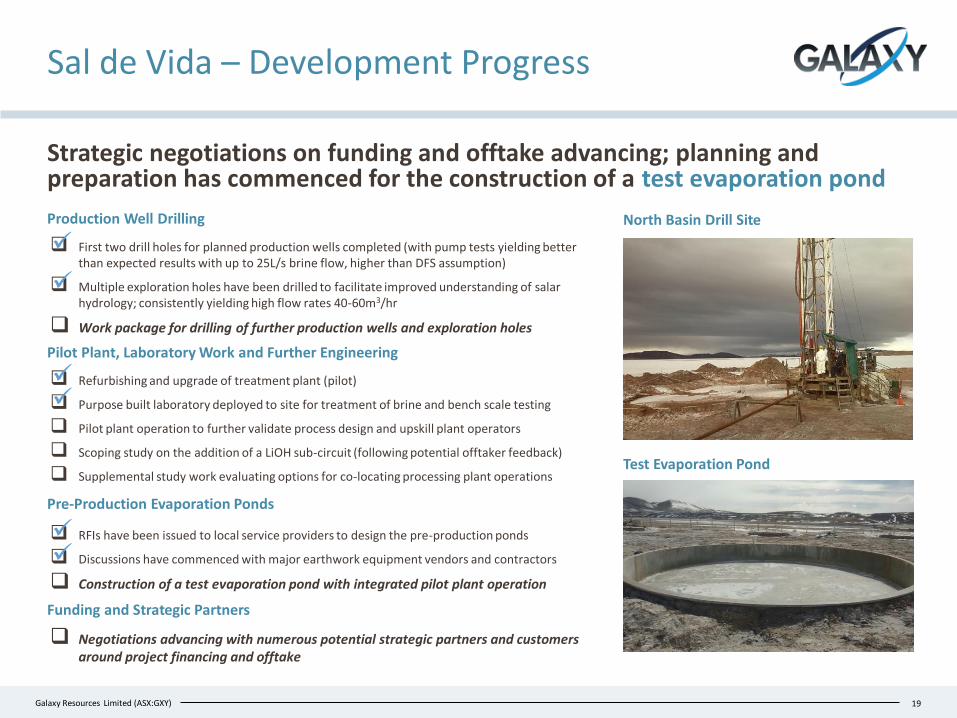
First two drill holes for planned production wells completed (with pump tests yielding better than expected results with up to 25L/s brine flow, higher than DFS assumption)
Multiple exploration holes have been drilled to facilitate improved understanding of salarhydrology; consistently yielding high flow rates 40-60m3/hr
Work package for drilling of further production wells and exploration holes
Production Well Drilling
Pilot Plant, Laboratory Work and Further Engineering
Refurbishing and upgrade of treatment plant (pilot)
Purpose built laboratory deployed to site for treatment of brine and bench scale testing
Pilot plant operation to further validate process design and upskill plant operators
Scoping study on the addition of a LiOH sub-circuit (following potential offtaker feedback)
Supplemental study work evaluating options for co-locating processing plant operations
Pre-Production Evaporation Ponds
RFIs have been issued to local service providers to design the pre-production ponds
Discussions have commenced with major earthwork equipment vendors and contractors
Construction of a test evaporation pond with integrated pilot plant operation
Funding and Strategic Partners
Negotiations advancing with numerous potential strategic partners and customers around project financing and offtake
✓
✓
North Basin Drill Site
Test Evaporation Pond
✓
✓
✓
✓
Sal de Vida – Development Progress
Strategic negotiations on funding and offtake advancing; planning and preparation has commenced for the construction of a test evaporation pond
Slide 20[xx]Galaxy Resources Limited (ASX:GXY)
James Bay – Overview
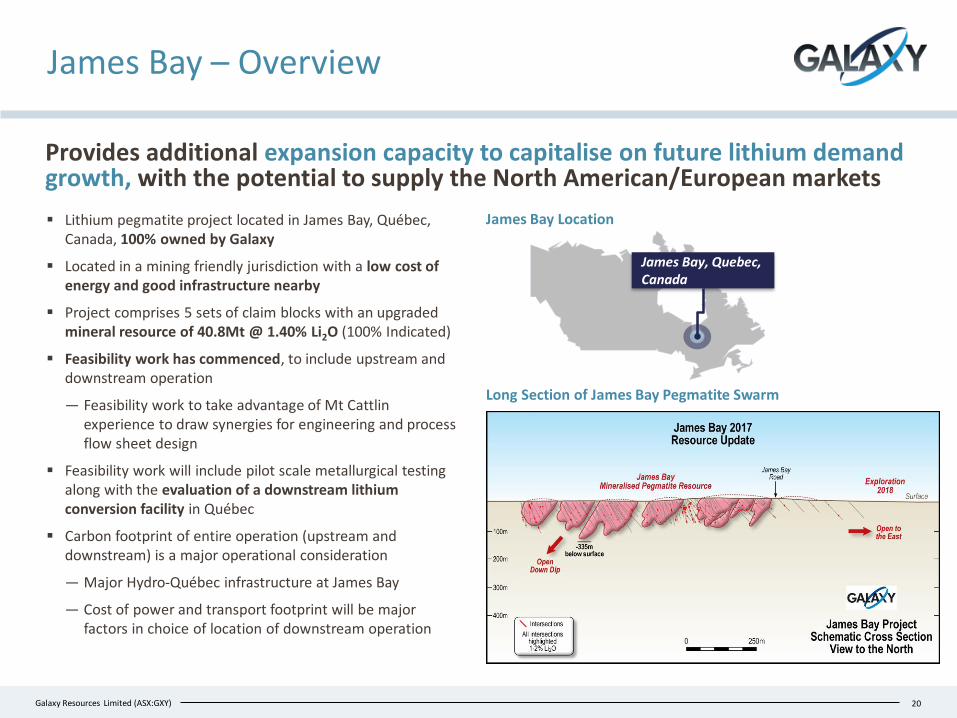
Provides additional expansion capacity to capitalise on future lithium demand growth, with the potential to supply the North American/European markets
▪ Lithium pegmatite project located in James Bay, Québec, Canada, 100% owned by Galaxy
▪ Located in a mining friendly jurisdiction with a low cost of energy and good infrastructure nearby
▪ Project comprises 5 sets of claim blocks with an upgraded mineral resource of 40.8Mt @ 1.40% Li2O (100% Indicated)
▪ Feasibility work has commenced, to include upstream and downstream operation
― Feasibility work to take advantage of Mt Cattlin experience to draw synergies for engineering and process flow sheet design
▪ Feasibility work will include pilot scale metallurgical testing along with the evaluation of a downstream lithium conversion facility in Québec
▪ Carbon footprint of entire operation (upstream and downstream) is a major operational consideration
― Major Hydro-Québec infrastructure at James Bay
― Cost of power and transport footprint will be major factors in choice of location of downstream operation
20
James Bay, Quebec, Canada
James Bay Location
Long Section of James Bay Pegmatite Swarm
Slide 21[xx]Galaxy Resources Limited (ASX:GXY)
James Bay – Comparison To Mt Cattlin
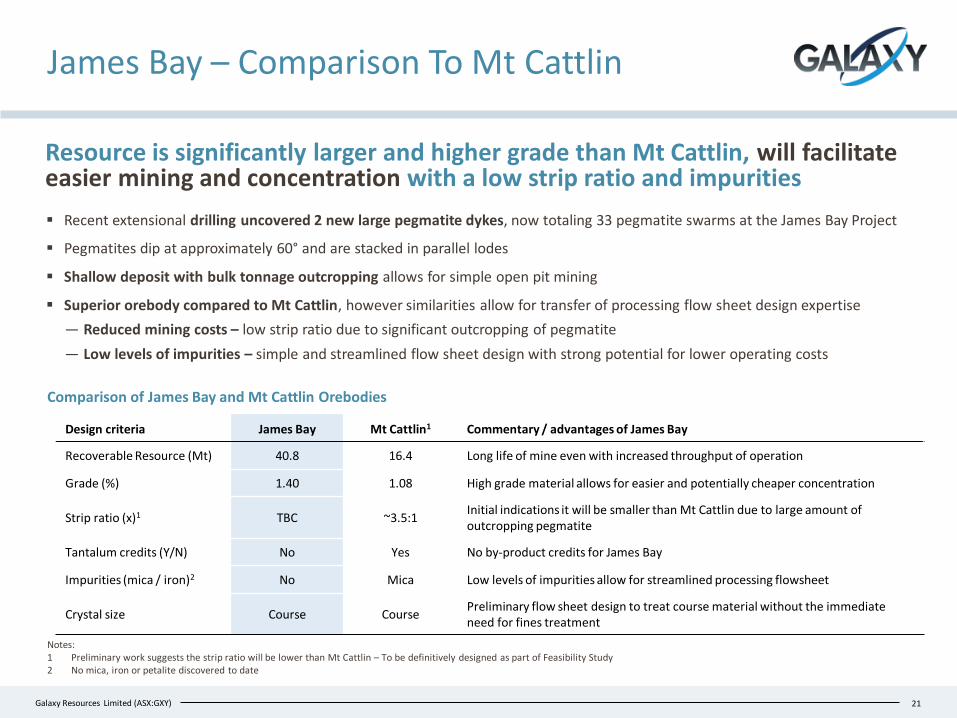
Resource is significantly larger and higher grade than Mt Cattlin, will facilitate easier mining and concentration with a low strip ratio and impurities
21
▪ Recent extensional drilling uncovered 2 new large pegmatite dykes, now totaling 33 pegmatite swarms at the James Bay Project
▪ Pegmatites dip at approximately 60° and are stacked in parallel lodes
▪ Shallow deposit with bulk tonnage outcropping allows for simple open pit mining
▪ Superior orebody compared to Mt Cattlin, however similarities allow for transfer of processing flow sheet design expertise
― Reduced mining costs – low strip ratio due to significant outcropping of pegmatite
― Low levels of impurities – simple and streamlined flow sheet design with strong potential for lower operating costs
Notes:1 Preliminary work suggests the strip ratio will be lower than Mt Cattlin – To be definitively designed as part of Feasibility Study2 No mica, iron or petalite discovered to date
Comparison of James Bay and Mt Cattlin Orebodies
Design criteria James Bay Mt Cattlin1 Commentary / advantages of James Bay
Recoverable Resource (Mt) 40.8 16.4 Long life of mine even with increased throughput of operation
Grade (%) 1.40 1.08 High grade material allows for easier and potentially cheaper concentration
Strip ratio (x)1 TBC ~3.5:1Initial indications it will be smaller than Mt Cattlin due to large amount of outcropping pegmatite
Tantalum credits (Y/N) No Yes No by-product credits for James Bay
Impurities (mica / iron)2 No Mica Low levels of impurities allow for streamlined processing flowsheet
Crystal size Course CoursePreliminary flow sheet design to treat course material without the immediate need for fines treatment
Slide 22[xx]Galaxy Resources Limited (ASX:GXY)
Outlook
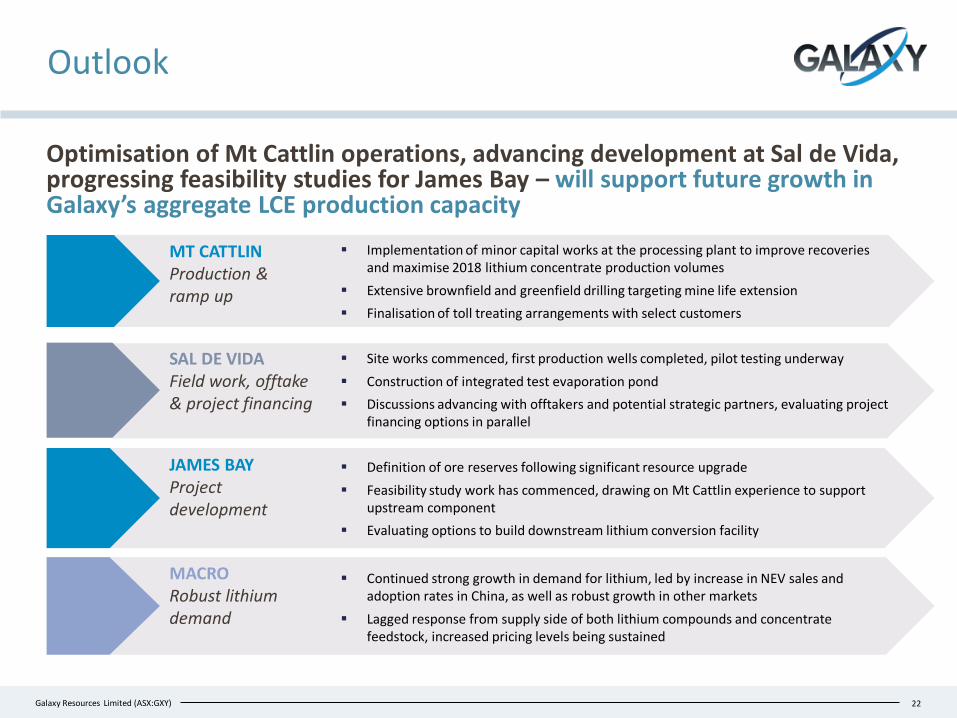
Optimisation of Mt Cattlin operations, advancing development at Sal de Vida, progressing feasibility studies for James Bay – will support future growth in Galaxy’s aggregate LCE production capacity
MT CATTLINProduction & ramp up
▪ Implementation of minor capital works at the processing plant to improve recoveries and maximise 2018 lithium concentrate production volumes
▪ Extensive brownfield and greenfield drilling targeting mine life extension
▪ Finalisation of toll treating arrangements with select customers
22
▪ Continued strong growth in demand for lithium, led by increase in NEV sales and adoption rates in China, as well as robust growth in other markets
▪ Lagged response from supply side of both lithium compounds and concentrate feedstock, increased pricing levels being sustained
MACRORobust lithium demand
JAMES BAYProject development
▪ Definition of ore reserves following significant resource upgrade
▪ Feasibility study work has commenced, drawing on Mt Cattlin experience to support upstream component
▪ Evaluating options to build downstream lithium conversion facility
SAL DE VIDAField work, offtake & project financing
▪ Site works commenced, first production wells completed, pilot testing underway
▪ Construction of integrated test evaporation pond
▪ Discussions advancing with offtakers and potential strategic partners, evaluating project financing options in parallel
Slide 23[xx]Galaxy Resources Limited (ASX:GXY) 23
Slide 24[xx]Galaxy Resources Limited (ASX:GXY)
Competent & Qualified Persons’ Statement
Competent Person Statement
Sal de Vida Any information in this report that relates to relates to the estimation and reporting of the Sal de Vida Project Mineral Resources and Mineral Reserves is extracted from the report entitled “Sal De Vida: Revised Definitive Feasibility Study Confirms Low Cost, Long Life and Economically Robust Operation ” created on 22 August 2016 which is available to view on www.galaxylithium.com and www.asx.com.au. The Company confirms that it is not aware of any new information or data that materially affects the information included in the original market announcement and that all material assumptions and technical parametres underpinning the Mineral Resources and Mineral Reserves estimates in the relevant market announcement continue to apply and have not materially changed. The Company confirms that the form and context in which the Competent Person’s findings are presented have not been materially modified from the original market announcement.
James Bay The information in this report that relates to relates to the estimation and reporting of the James Bay Mineral Resources is extracted from the ASX announcement dated 4 December 2017 which is available to view on www.galaxylithium.com and www.asx.com.au. The Company confirms that it is not aware of any new information or data that materially affects the information included in the original market announcement and that all material assumptions and technical parameters underpinning the Mineral Resources in the relevant market announcement continue to apply and have not materially changed. The Company confirms that the form and context in which the Competent Person’s findings are presented have not been materially modified from the original market announcement.
Mt Cattlin
The information in this report that relates to relates to the estimation and reporting of the Mt Cattlin Project Mineral Resources and Mineral Reserves is extracted from the report entitled “Mt Cattlin Update: Revised Resource & Reserve Statement” created on 4 August 2015 published by General Mining Limited (ASX: GMM) which is available to view on www.asx.com.au. The Company confirms that it is not aware of any new information or data that materially affects the information included in the original market announcement made by GMM. The Company understands that the form and context in which the Competent Person’s findings are presented have not been materially modified from the original market announcement.
Caution Regarding Forward Looking InformationThis document contains forward looking statements concerning Galaxy. Forward-looking statements are not statements of historical fact and actual events and results may differ materially from those described in the forward looking statements as a result of a variety of risks, uncertainties and other factors. Forward-looking statements are inherently subject to business, economic, competitive, political and social uncertainties and contingencies. Many factors could cause the Company’s actual results to differ materially from those expressed or implied in any forward-looking information provided by the Company, or on behalf of the Company. Such factors include, among other things, risks relating to additional funding requirements, metal prices, exploration, development and operating risks, competition, production risks, regulatory restrictions, including environmental regulation and liability and potential title disputes.Forward looking statements in this document are based on Galaxy’s beliefs, opinions and estimates of Galaxy as of the dates the forward looking statements are made and no obligation is assumed to update forward looking statements if these beliefs, opinions and estimates should change or to reflect other future developments.
Not For Release in the United StatesThis announcement has been prepared for publication in Australia and may not be released in the United States. This announcement does not constitute an offer of securities for sale in any jurisdiction, including the United States and any securities described in this announcement may not be offered or sold in the United States absent registration or an exemption from registration under the United States Securities Act of 1933, as amended. Any public offering of securities to be made in the United States will be made by means of a prospectus that may be obtained from the issuer and that will contain detailed information about the company and management, as well as financial statements.
24