Embed Size (px)
Citation preview
Does the crowd forgive?
Gaël Leboeuf
SKEMA Business School – Université de Lille
Avenue Willy Brandt, 59777 Euralille – FRANCE
E-mail: [email protected]
This version: March 14, 2016
Keywords: Crowdfunding, Serial Entrepreneur, Self-Efficacy, Reputation
JEL Classification: G21, G24, G32, L26
Does the crowd forgive?
This version: March 14, 2016
Abstract:
In the literature about serial entrepreneurs, experience and network gained from
previous entrepreneurial projects is considered having a positive impact on the outcome
of following ventures, offsetting the negatives effects of past failures. In this paper, we
show that serial entrepreneurs with a first failed crowdfunding campaign are unable to
reverse the negative opinion of the crowd on their ability to lead a project. Despite the
adjustments made by the entrepreneurs on their new crowdfunding campaigns based on
what they have learned from previous experience, we show that their new campaigns,
despite an increase in the number of backers and in the money raised, still show lower
success rate than for first timers or for entrepreneurs with a successful previous
campaign.
Keywords: Crowdfunding, Serial Entrepreneur, Self-Efficacy, Reputation
JEL Classification: G21, G24, G32, L26
1. Introduction
“Failure is a step to success” said William Whewell1. By the way, when a project's
success depends on others' faith in the leaders capacities, to recover their confidence
after a first failure may be much more difficult than succeeding the project in itself.
In entrepreneurial finance, serial entrepreneurs are entrepreneurs reentering a new
project after the success or the failure of a previous entrepreneurial project. In this
paper, we analyze the process of serial crowdfunding: the fact for an entrepreneur to
start a new campaign after a successful or failed previous crowdfunding's experience2.
Our analysis focuses on the reward-based crowdfunding. In this type of crowdfunding,
the entrepreneur asks to the crowd for a donation and promises a reward if the project
is successful. The reward is most of the time the product created or produced by the
entrepreneur with the funds collected during the campaign. Some extra features are
generally added to create various “super-rewards" in order to induce the backers to give
more money than the value of the basic product (for instance a limited collector edition
of the product).
Here we use the term "new project" instead of "new venture" to account for various
forms that an entrepreneurial activity can take (Wright, Robbie, & Ennew, 1997a).
Moreover, in crowdfunding, and more specifically in the reward-based crowdfunding , a
new project is not necessarily a new venture.
For instance, a music band can create a crowdfunding campaign to finance the recording
of a new album without creating a new venture. In the same way, a new music album
can in some way be seen as a new entrepreneurial activity since it involve a “new
combination of resources” (Guth & Ginsberg, 1990). In our case, we talk about the new
funding. The band creates a new product, which is different from previous one, with new
funding coming from the crowdfunding campaign.
1. Nineteenth century's British polymath from University of Cambridge.2. Crowdfunding is the fact to finance a project by making a call to many individuals – the crowd, toprovide money in the form of small contributions compared to the project size. This call is made most ofthe time through the Internet, on a crowdfunding platform – some kind of “market place” whereentrepreneur present their project and individuals choose to participate or not (Schwienbacher & Larralde,2012).
In crowdfunding, when an entrepreneur decides to launch a second campaign, he
already knows the first opinion of the crowd toward his project, positive or negative. If
the first campaign failed, and even if he is able to use the first campaign's feedbacks to
improve his project and to match his new project with the crowd's expectations, we
think that a harder work may be needed to tackle the reputation of "loser" that he
inherited from his first public failure. Crowdfunding campaigns leaded by serial
entrepreneurs offer us a unique opportunity to analyze the ability of an entrepreneur to
adapt his offer to the market. At the same time, we are able to observe the reaction of
the crowd to these second funding attempt, taking into account the reputation gained
from a first campaign. Moreover, due to the fee mechanism of the crowdfunding's
platforms (fees are proportional to amount raised), launching a new crowdfunding
campaign have almost no other friction than the will of the entrepreneur.
This study is based on a database of more than 22,000 crowdfunding projects including
687 second campaigns. We show that, when the entrepreneurs are persevering in the
crowdfunding after a first failure, and even if they adjust the characteristics of the
campaign to mimic the successful projects, they are unable to regain the faith of the
crowd in their ability to succeed. As expected, the outcome of a second campaign leaded
by an entrepreneur with a first failed experience is lower than the second campaigns of
successful entrepreneurs. Moreover, this paper shows that it is even inferior to the
results of first-timers, involving that they are unable to circumvent the bad reputation
inherited from the first public failure. Based on these results, we show that a
crowdfunding campaigns need to be highly prepared because the entrepreneurs won't be
able to get a second chance to seduce the crowd. Like the adage said : You never get a
second chance to make a first impression.
The rest of this paper is structured as follow: in the following chapter, we review
the literature about crowdfunding and about serial entrepreneurship in order to
construct our hypotheses about the existence of a second crowdfunding campaign and
about the characteristics and the outcome of that new attempt to rise funding. The
third chapter describes our database and the variables used in our models. The chapter
four presents our results which will be discussed in the last chapter.
2. Literature and Hypothesis
Previous empirical research on crowdfunding does not distinguish between
projects leaded by serial, and thus more experienced, entrepreneurs or by first-timers
(Agrawal, Catalini, & Goldfarb, 2015; Cumming, Leboeuf, & Schwienbacher, 2015;
Mollick, 2014).
Despite that the size of the network increases with experience (Starr & Bygrave,
1991) it is not a good indicator of the experience in crowdfunding. On the Internet,
network size is more associated to community activities than to experience in a field.
Many crowdfunding guides recommend to entrepreneurs interested in crowdfunding to
create a community around their project, on Facebook or similar website, before
launching a crowdfunding campaign (Lawton & Marom, 2013). As far as we know, no
previous research takes into account the impact of the experience of the entrepreneur in
crowdfunding on the strategy set up for his campaign (goal, funding model, disclosure)
nor in the reaction of the crowd and on the success or failure of the new crowdfunding
campaign.
On the other side, research on serial entrepreneurs shows the importance of
experience and reputation for the entrepreneur in the success of his new project. Two
main theories discuss the consequences of a venture success or failure on the
entrepreneurs behavior. On one hand, the prospect theory, applied to serial
entrepreneurs, propose that entrepreneurs with past unsuccessful experience will more
likely be risk-takers, will “play again” and will even play bigger, trying to recover their
losses until they succeed (Hsu, Wiklund, & Cotton, 2015). On the other hand, the
literature on self-efficacy shows that successful entrepreneur will gain confidence in their
ability to reach their goals and to overcome difficulties, leading to a positive effect on
outcome (Bandura, 1982).
Hypothesis on the launch of a second campaign
Based on Hsu et al.'s research, we should expect to find, at least at short term,
more second campaigns by entrepreneurs with unsuccessful first experience than by
entrepreneurs with successful fundraising. Indeed, assuming that entrepreneur with
successful campaign had fixed their first campaign's goal at the right level, no extra
funding should be needed to complete the project and they should be working at
completing their first project before launching a new one. By the way, overall, on a long
enough period and based on Bandura's conclusions, a successful entrepreneur should be
more prone to re-enter a new crowdfunding campaign. So we can conclude that based on
self-efficacy literature, the success will increase the entrepreneurs self-efficacy and their
motivation to pursue new projects in the future. Our first hypothesis on the launch of a
second crowdfunding campaign can then be formulated as:
→ H1: Overall, entrepreneurs with a successful first crowdfunding campaign will
more likely launch a second campaign to finance a new project.
Hypotheses on the characteristics of a second campaign
As shown in Cumming et al. (2015), the outcome of a crowdfunding campaign is
linked to a risk/return trade-of faced by the entrepreneur when he set the goal and the
funding model of his crowdfunding campaign. We can assume that the entrepreneur sets
the goal of his campaign based, of course, on his financial needs but also by taking into
account the price of the product he is offering as reward and the potential number of
backers he is able to attract.
Concomitantly to the goal, he chooses a funding models, “Keep-It-All” (KIA) or “All-or-
Nothing” (AON). On the AON funding model, the entrepreneur receive the money if,
and only if, the total amount offered by the backers reaches the goal set at the
beginning of the campaign. On the other hand, in the KIA funding model, he can choose
to keep the money offered by the backers even if the goal is not reached. Thus, he starts
the project underfunded and relies on a future fundraising (through crowdfunding or
not) to complete his project3.
To construct our hypotheses on the choices made by the entrepreneurs based on
their previous experience, we can rely on prospect theory (Sitkin & Pablo, 1992). This
theory shows us that failures increase attractiveness of risky option to gain back the
losses and that entrepreneurs exposed to gains have the feeling that they have more to
lose so they are less likely to take risks. In our crowdfunding context, it can be
translated as choosing less risk for entrepreneurs with previous success: lower goal
3. The choice between crowdfunding models is discussed in detail in Cumming et al. (2015).
and/or KIA funding model and more risk for entrepreneurs with previous failure: higher
goal and/or AON funding model. As exposed in previous reward-based crowdfunding's
research (Cumming et al., 2015; Mollick, 2014), choosing the AON funding model and
setting a high goal can be interpreted as a measure of the risk for the entrepreneur. He
bear the risk not to receive any money from the crowdfunding campaign. Indeed, the
higher the goal, the more backers the entrepreneur will need to convince to reach his
goal, thus increasing the risk of failure.
We can thus write the following hypothesis:
→ H2: Entrepreneurs with previously failed campaign will most likely take risk by
setting higher goal and by opting for AON funding model.
Since the entrepreneur presents his project on an internet website, he is able
decide freely of the soft information (text, pictures, video,...) he will publicly disclose to
attract backers and to arouse enough confidence in his project to induce crowd
participation. Based on previous research, we can assume that the amount of disclosed
information is positively impacting success (Cumming et al., 2015; Mollick, 2014) and
that experience will increase the amount of disclosure (Yamakawa, Peng, & Deeds,
2015). Our third hypothesis can be formulated as:
→ H3: Second campaign will disclose more information.
Hypotheses on the outcome of a second campaign
The literature about entrepreneurial finance is almost unanimous on the benefits
from a previous entrepreneurial experience on subsequent projects, either the previous
experience has been a success or a failure (Chandler & Hanks, 1998; Macmillan, Siegel,
& Narasimha, 1985; Stuart & Abetti, 1990; Ucbasaran, Westhead, Wright, & Binks,
2003) . We can assume this should be the same for crowdfunding.
We observe also that VCs tend to prefer serial entrepreneurs (Wright, Robbie, & Ennew,
1997b) since experience is a good signal for outcome of new ventures. Here also, we can
expect that the crowd see experience as a good signal and that previous experience is
positive for crowdfunding.
The main reasons for these benefits come essentially from two factors. The first factor is
the reputation. Winners gain good reputation which is important to attract investors
(Ebbers & Wijnberg, 2012) and the lack of reputation may be a cause of failure (Nicolò,
2015). The second factor is the experience. By providing network (Starr & Bygrave,
1991), it permit to find more investors (Mahto & Khanin, 2013). Here, a previous
campaign already attracted some viewers and backers. The entrepreneur is able to
recontact them easily, creating a first pool of potential backers for the new project, even
before the campaign launch.
Thus, even if we can expect the effect to be more pronounced for entrepreneurs with a
successful first campaign, overall, we can hypothesize that:
→ H4: A second crowdfunding campaign will always be more likely successful.
3. Methodology
Database
The dataset used in this study is the same as used in Cumming et al. (2015).
Data includes all finished crowdfunding campaigns presented on Indiegogo website until
October 2013. This dataset includes campaigns with a goal of at least $5,000. Since
Indiegogo allow to raise money in other currencies, we converted all amount in USD
using the yearly average exchange rate. This lower bound of $5,000 is used in most other
research about reward-based crowdfunding (Cumming et al., 2015; Mollick, 2014) to
avoid projects that rely mostly on money from family, friends and relatives. The dataset
was also truncated for goals above the 99th percentile (i.e. above $200,000). Computer-
based data collection led to a loss of less than 5% of observations due to inconsistency in
the HTML tags across indigogo website. As far as we are able to investigate, the loss
seems randomly distributed and should not lead to any corruption of our results. Since
all entrepreneurs are identified by a unique number, we were able to classify campaigns
in 3 categories: a “unique campaign” if the entrepreneur's identifier is unique in the
dataset, a “first campaign” if the entrepreneur is the leader of more than one campaign
and if the campaign was the first to start (based on the campaign's launch date) and a
“second campaign” if the campaign was leaded by an entrepreneur with already a first
campaign. It is important to notice that since the database is observed at a defined
date, some serial entrepreneurs may not have entered a second campaign but will do in
the future. In our sample he is considered in the pool of first-projects but does not
account as a serial. This can have some issues that will be discussed further in the
chapter and that we will take into account. We dropped all campaigns after the second
(if an entrepreneur has three or more campaigns, we dropped all campaigns starting
from the third). Our final sample is composed of 22,739 crowdfunding campaigns.
Variables
Most of the control variables used in our analysis were previously used in
Cumming et al. (2015). We will here describe all the new variables generated for this
paper and all the variables of interest useful for our analysis. All other control variables
are fully described in appendix A1.
All variables constructed on entrepreneur's identifier are based on the campaign
leader. When there are several team members for a project, we assume that the first
presented on Indiegogo is the team leader. For the rest of this paper we will assume that
“the entrepreneur” refers to the team leader.
The variable “First was successful” is a dummy that identifies serial entrepreneurs
with a first successful campaign. It is equal to 1 for serial entrepreneurs with a first
success and zero if the first campaign failed. It allows us to take into account the
reputation of the entrepreneur.
The variable “Time between project 1 & 2” is the number of days between the
start of the first and the start of the second campaign for a serial entrepreneur. It allows
us to gauge the preparation of the entrepreneur for his second campaign.
The variable “New category” identifies an entrepreneur that switches from the
category of the first project to another category for his second campaign. Since we can
think that the crowd will more likely forgive an entrepreneur when he starts a totally
new project, this variable allows us to control for this case.
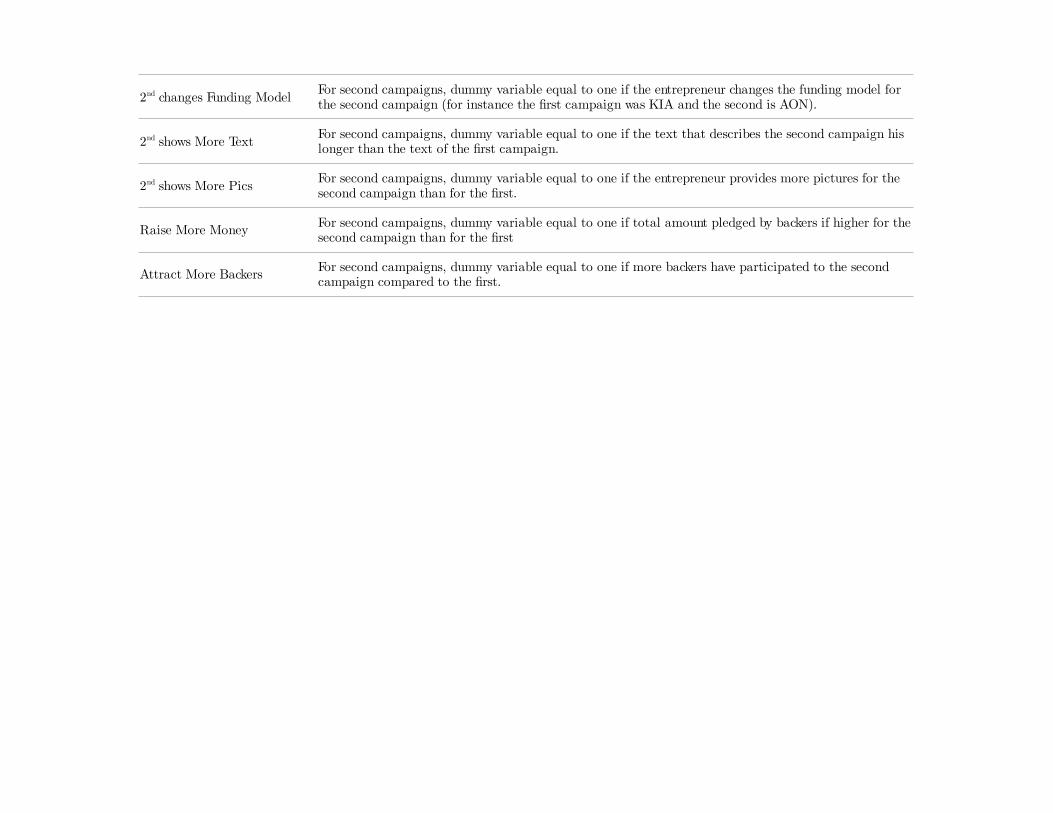
We also created four variables comparing the characteristics of the second
campaign with the characteristics of the first campaign leaded by the same entrepreneur.
These variables are “2nd have higher goal”, “2nd changes funding model”, “2nd shows
more text” and “2nd shows more pics”. These are dummy variables and these account
respectively for an increase in the goal of the campaign, a switch of funding model (from
KIA to AON or from AON to KIA), an increase in text length and a increase in the
number of pictures or graphics provided.
We finally created 2 variables comparing outcome between both campaigns of the
serial entrepreneur : “Raise more money” and “Attract more backers”. Both are dummy
variables equal to one if the money or the number of backers increased between the first
and the second project.
The other variables of interest are goal, flexible dummy, full text length, video,
gallery's items, success dummy and percentage of completion. “Goal” is the amount that
the entrepreneur sets as the campaign's target. “Flexible dummy” is equal to 1 if the
funding model is KIA and to 0 otherwise. “Full text length” is the length, in number of
characters, of the text describing the campaign on the projects presentation page.
“Gallery's items” gives the number of pictures presented by the entrepreneur. “Video” is
a dummy variable equal to one if the project's page presents a videopitch introducing
the project. “Success dummy” is equal to 1 if the amount raised during the campaign
from backers is at least equal to the goal and “Percentage of Completion” is the ratio
between the amount raised and the goal sets by the entrepreneur.
Summary Statistics
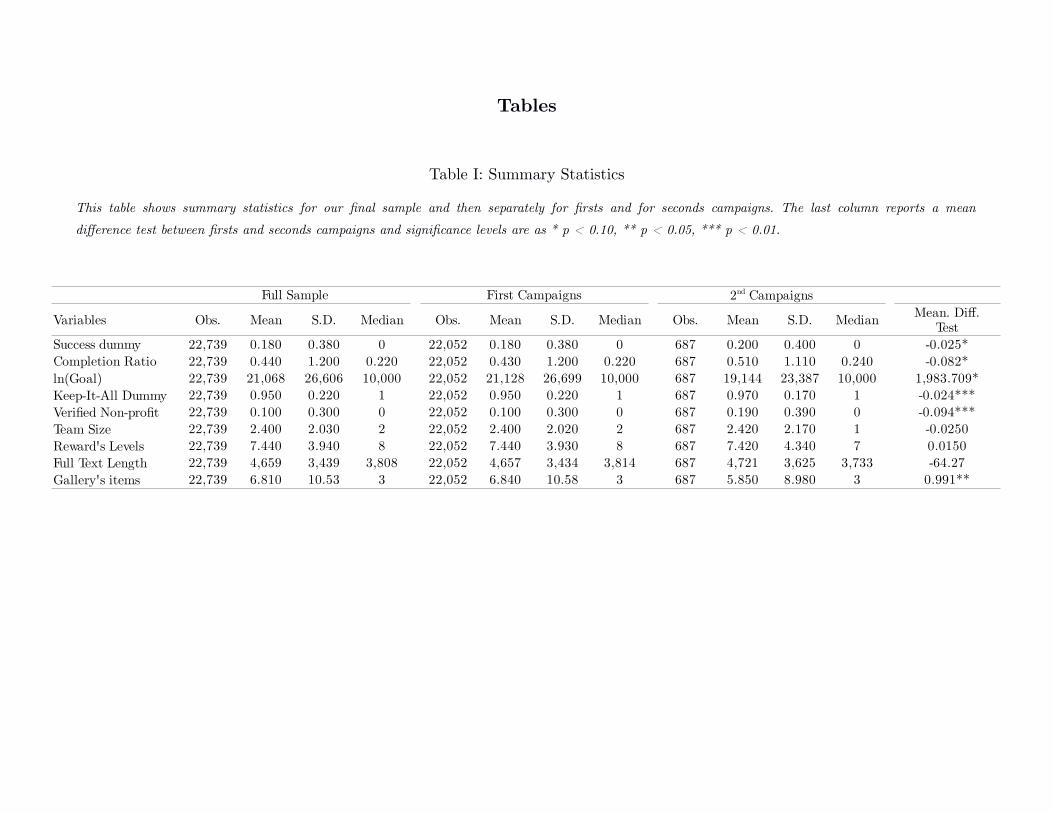
Table I presents the summary statistics for our full sample and for two subsamples, one
showing only the firsts campaigns and the other only the second campaigns. A mean
difference test between both subsamples is also provided.
[Table I about here]
In line with our hypothesis 1, we observe that 18% of the first campaigns succeeded in
fund raising. We also observe that 20% of second campaigns succeeded as well, showing
a significant increase in outcome (even if it is low). The table shows that, if the average
goal of a second campaign is lower, it is weakly significant and that the median goal is
the same for both subsamples. Overall, a second campaign will more likely use the Keep-
It-All funding model, will be more used by non-profit organizations and will disclose
approximately the same amount of information: on average, the full text length and the
median number of pictures in the gallery are similar.
In table II, we compare the second campaigns leaded by an entrepreneur with a first
successful experience with those having an unsuccessful first experience. Here also, a
mean difference test is provided between the both subsamples.
[Table II about here]
We can observe that the second campaigns leaded by an entrepreneur with an
unsuccessful first experience, despite similar goals and disclosures (full text length),
show lower success rates and lower percentages of completion compared with campaigns
with a first success. It is also interesting to note that these outcomes are lower than
values for first campaigns in table I. Overall, first campaigns show 18% of success rate.
This success rate drops to 13% for second campaigns of entrepreneur with past failure
and raises up to 43% for the entrepreneurs with previous success. The results are similar
for the percentage of completion. The first campaigns reach an average completion of
44% where second campaigns reach, on average, 36% or 100% depending on whether the
first campaign was a failure or a success.
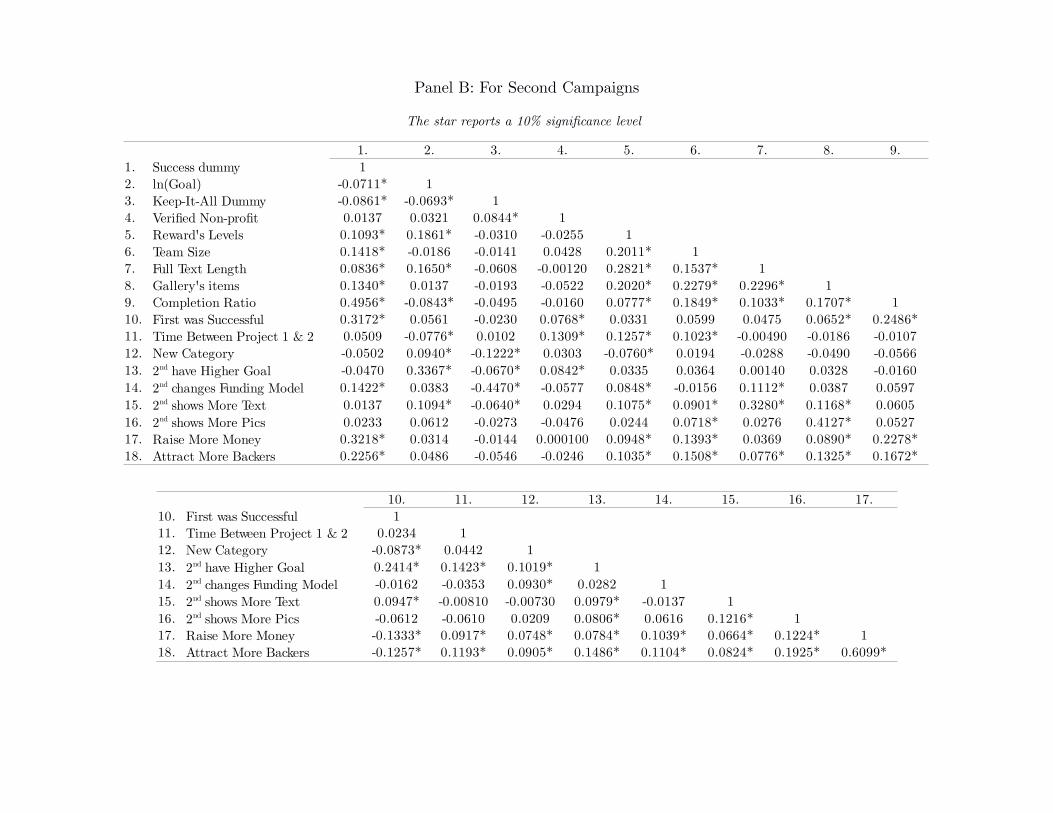
[Table III about here]
In the correlation matrix (see Table III-B), we can observe high correlation for the
second campaigns between a first success (variable “First was successful”) and the
outcome variables “Success Dummy” and “Percentage of Completion”. Moreover, the first
campaign's outcome seems to have also impact on second campaign characteristics. The
variable “First was successful” shows positive and significant correlations with “2nd have
higher goal” and “2nd shows more text”. Nevertheless, a first success seems to have
negative correlation with the amount raised and the number of backers.
4. Empirical Results
About the launch of a second campaign
The table IV shows the determinants of the launch of a second crowdfunding campaign
by an entrepreneur. The dependent variable for this table is a dummy equal to 1 if the
entrepreneur is a serial entrepreneur and equal to 0 if the entrepreneur didn't start a
new campaign during the observed period. For all the models in this table, we used
probit regressions and we reported the marginal effects. The standard errors are
clustered by category. All models show a positive and highly significant coefficient for
the success dummy. The entrepreneurs with a first successful crowdfunding campaign are
thus more likely to launch second campaign. This validates our hypothesis 1 and is in
accordance with self-efficacy theory's predictions. When an entrepreneur succeeds in a
first campaign, self-efficacy feelings will increase and he will gain motivation and self-
confidence to launch a new campaign.
[Table IV about here]
In the models 2, 3 and 4, we introduce also the characteristics of the project as
independent variables. We observe that the goal of the first campaign shows also a
positive and highly significant impact on the existence of a second campaign by the
same entrepreneur. This new result can be formulated as follow: an entrepreneur leading
a first campaign with a high goal is more likely to launch a second campaign. This is in
line with the idea that financial needs for large projects are quite complicated to
evaluate before to start the project. Such type of projects may need several funding
rounds to be fully funded. Since the crowdfunding has low barriers to entry, this process
allows entrepreneurs to launch easily a second campaign to complete the funding of their
project. Our conclusions are robust to project's category, semester and country fixed
effects (see model 4).
A problem still remains in these models : we are unable to observe entrepreneurs
that will reenter a new campaign in the future, especially for first campaigns starting
very close of our observation date. Intuitively, we may think that entrepreneur will need
some time to launch a second campaign and that after a too long time, he will not be
willing to launch a new campaign (if the venture goes well or if he finds another job).
Thus we can expect a distribution of delay with a first low period, then a period with
high rate of reentrant and again declining at the end. Figure 1 shows the distribution
of delay between first and second campaigns and figure 2 shows the estimated
cumulative hazard function.
[Figure 1 & 2 about here]
We observe that if the overall shape of the distribution is declining, the very first period
is a little lower and that we have two major peaks, a first after 30/60 days and a second
after 350/400 days. These results seems quite similar for second campaigns with a first
success or with a first failure. The cumulative hazard function shows similar results
(convex-concave-convex). To account for the lack of information about serial
entrepreneurs that are going to reenter but that we are unable to observe at the time of
the extraction, we use survival analysis (Hosmer, Lemeshow, & May, 2008)to estimate
hazard rate by taking into account for these. Many hazard models exist depending on
the expected shape of the distribution. By plotting our hazard function with several
models, we observe that each of them have specific interest in our case.
[Figure 3 about here]
Cox's model takes into account our two peaks, Weibull model fit more closely the highly
declining rate of events and the gamma and log-normal models take into account the
three periods (low-high-low) and the general shape of our observed distribution. Table V
shows regressions similar to table IV but using various hazard models.
[Table V about here]
The coefficients are positives and highly significant for success dummy and for goal, as
expected an in accordance with our previous findings. Projects with high capital needs
are more likely to reenter a second campaigns and hazard rates indicates that successful
entrepreneurs have 68% more chance to reenter a second campaign than entrepreneurs
with a first failure. These results are stable across models.
About the characteristics of the second campaign
The table VI shows us the strategic changes made by an entrepreneur when he decides
to launch a second campaign. These decisions are here analyzed through the adjustment
of the goal, of the funding model and of the disclosures (text and photos). Models 1, 2
and 3 present the goal's adjustments. The dependent variable is a dummy equal to one
if the goal of the second campaign is higher than the first. As shown, the outcome of the
first campaign and the time between both campaigns have a high impact on the goal.
If the first campaign was successful, the entrepreneur will more likely increase the goal
and will more likely decrease in case of a first failure. These conclusions are not in line
with our second hypothesis. By the way, this result tends to confirm self-efficacy theory
(i.e. the “winners” will gain more self-confidence and feel able to reach higher levels) and
to invalidate prospect theory (i.e. the “losers” are willing to choose riskier options to
compensate their loss).
[Table VI about here]
The model 4 presents the adjustment of the funding model for the second campaigns. If
globally, an entrepreneur will prefer the less risky option for the second campaign by
opting more likely for the KIA funding model (see tables I & II). We can see that this is
not linked to the outcome of the first campaign but, as presented in Cumming et al.
(2015), linked to the intrinsic goal's level.
The third part of the table VI (models 5 & 6) shows the changes in disclosure for the
second campaigns. By looking at the text length or at the number of pictures presented
in the projects gallery, we can not observe any highly significant change in the quantity
of information disclosed by the entrepreneurs. Nevertheless, even if the coefficients are
not significant for text, results for pictures show a small positive link between a first
failure and the number of pictures disclosed in the second campaign. By the way, the
global adjustment made by entrepreneur with a failed first campaign are very small (no
adjustment in text size and low adjustment in number of pictures). A limitations of our
measure is that it assess only the quantity and not the quality of disclosures. Since we
observe highly positive impact of information disclosure on success, we are unable to
explain why an entrepreneur with a first failure will not adjust his disclosures to increase
his chances of success, invalidating our third hypothesis.
About the outcome of the second campaign
The table VII shows the impact of intrinsic characteristics of projects, of strategical
choices made for the second campaigns and of first campaigns' outcome on the outcome
of the second campaigns.
[Table VII about here]
Models 1 and 2 shows results including all projects. The dependent variable is a success
dummy. The model 1 confirms results observed in previous researches: the high goal and
the flexible funding model have negative impact on outcome. Non-profit, team size and
number of rewards offered to backers are positively affecting the success, ditto for
disclosures (text length and gallery items). In model 2, we add two variables to
distinguish the second projects and the second projects after a success. We can see that
if second campaigns have globally less success, it's not the case for second campaigns
after a first success, where the coefficient is positive and highly significant. Based on
model 2, we can assume that a first success will increase by 22% the chance of success of
the second campaign. In models 3 and 4, we keep only the second campaigns and we
find similar results for the impact of a first success on the outcome of the second
campaign. Results in model 4 shows that reputation (result of the first campaign) is
much more important on the second campaign's success than any of other adjustment
made by the entrepreneur. Neither the project characteristics changes (goal level or
category) nor the disclosures (more text or more pictures) will have any significant
impact on the second campaign's success. This highlight one very important result: in
literature about serial entrepreneurs, past experiences will most likely have a positive
effect on future ventures outcome, through reputation or through experience. In the case
of crowdfunding, the effect of reputation is so important that, if the reputation is bad
(first failure), it will be much more difficult for entrepreneur to convince the crowd to
participate, and thus much more difficult to succeed.
Our models 5 and 6 highlight one additional result. Here, the dependent variables are
dummies equal to one if the second campaign raised more money or if the second
campaign convinced more backers than the first. The coefficients for our "First was
successful" variable are negative and highly significant, indicating that a first success
will lower the absolute amount raised during the second campaign. The second success,
if more probable, is less brilliant.
5. Discussion
If serial entrepreneurship is usually seen as a good thing, this paper shows that the
crowdfunding can not, in this case, be compared with the classical financing methods.
We show that the two main benefits of serial ventures, experience and network, are
unable to overcome the negative effects of a bad public reputation. The behavior of
uninitiated crowd cannot be compared to the financing decisions of professional
investors.
Our findings show that even if entrepreneurs with a first failed crowdfunding experience
try to reenter a new campaign, and despite the fact that their second attempt seems
similar on key points with entrepreneurs with a first success (they mimic goal, funding
model, disclosures), they get a lower outcome. Their probability of success is lower than
for successful serial entrepreneurs, and even lower than for first-timers.
Nevertheless, there are still some key questions which this paper doesn't address yet. To
be able to learn from business failure, the entrepreneur needs feedbacks (Shepherd,
2003). For the entrepreneurs with a first failed experience, maybe the formal feedbacks
are insufficient (did they get enough comments during their first campaign to be able to
adjust?) and thus we should expect some results by looking at the impact of this
parameter on the adjustment and on the outcome of the second campaign.
Moreover, there are many cultural differences across countries, and these differences are
fundamental on the way we look at failure (Landier, 2005). These effects are not
observed in our study for the moment.
References
Agrawal, A., Catalini, C., & Goldfarb, A. (2015). Crowdfunding: Geography, Social Networks,
and the Timing of Investment Decisions. Journal of Economics & Management Strategy,
24(2), 253–274. http://doi.org/10.1111/jems.12093
Bandura, A. (1982). Self-efficacy mechanism in human agency. American Psychologist, 37(2),
122–147. http://doi.org/10.1037/0003-066X.37.2.122
Chandler, G. N., & Hanks, S. H. (1998). An examination of the substitutability of founders
human and financial capital in emerging business ventures. Journal of Business
Venturing, 13(5), 353–369. http://doi.org/10.1016/S0883-9026(97)00034-7
Cumming, D. J., Leboeuf, G., & Schwienbacher, A. (2015). Crowdfunding Models: Keep-It-All
vs. All-Or-Nothing (SSRN Scholarly Paper No. ID 2447567). Rochester, NY: Social
Science Research Network. Retrieved from http://papers.ssrn.com/abstract=2447567
Ebbers, J. J., & Wijnberg, N. M. (2012). Nascent ventures competing for start-up capital:
Matching reputations and investors. Journal of Business Venturing, 27(3), 372–384.
http://doi.org/10.1016/j.jbusvent.2011.02.001
Guth, W. D., & Ginsberg, A. (1990). Guest editors’ introduction: Corporate entrepreneurship.
Strategic Management Journal, Summer Special Issue, pp. 5–15.
Hosmer, D. W., Lemeshow, S., & May, S. (2008). Applied Survival Analysis: Regression
Modeling of Time-to-Event Data. Hoboken, NJ, USA: John Wiley & Sons, Inc. Retrieved
from http://doi.wiley.com/10.1002/9780470258019
Hsu, D. K., Wiklund, J., & Cotton, R. D. (2015). Success, Failure, and Entrepreneurial Reentry:
An Experimental Assessment of the Veracity of Self-Efficacy and Prospect Theory.
Entrepreneurship Theory and Practice, n/a–n/a. http://doi.org/10.1111/etap.12166
Landier, A. (2005). Entrepreneurship and the Stigma of Failure (SSRN Scholarly Paper No. ID
850446). Rochester, NY: Social Science Research Network. Retrieved from
http://papers.ssrn.com/abstract=850446
Lawton, K., & Marom, D. (2013). The Crowdfunding Revolution: How to Raise Venture Capital
Using Social Media. New York: McGraw-Hill Professional.
Macmillan, I. C., Siegel, R., & Narasimha, P. N. S. (1985). Criteria used by venture capitalists
to evaluate new venture proposals. Journal of Business Venturing, 1(1), 119–128.
http://doi.org/10.1016/0883-9026(85)90011-4
Mahto, R. V., & Khanin, D. (2013). Speed of Venture Financing for Emerging Technology-Based
Entrepreneurial Firms as a Function of Founder Reputation. Creativity and Innovation
Management, 22(1), 84–95. http://doi.org/10.1111/caim.12018
Mollick, E. (2014). The dynamics of crowdfunding: An exploratory study. Journal of Business
Venturing, 29(1), 1–16. http://doi.org/10.1016/j.jbusvent.2013.06.005
Nicolò, D. (2015). Towards a Theory on Corporate Reputation and Survival of Young Firms.
Procedia Economics and Finance, 22, 296–303. http://doi.org/10.1016/S2212-
5671(15)00289-0
Schwienbacher, A., & Larralde, B. (2012). Crowdfunding of Small Entrepreneurial Ventures. In
The Oxford Handbook of Entrepreneurial Finance (Oxford University Press). Retrieved
from http://papers.ssrn.com/abstract=1699183
Shepherd, D. A. (2003). Learning from Business Failure: Propositions of Grief Recovery for the
Self-Employed. The Academy of Management Review, 28(2), 318–328.
http://doi.org/10.2307/30040715
Sitkin, S. B., & Pablo, A. L. (1992). Reconceptualizing the Determinants of Risk Behavior. The
Academy of Management Review, 17(1), 9–38. http://doi.org/10.2307/258646
Starr, J., & Bygrave, W. (1991). The assets and liabilities of prior start-up experience: An
exploratory study of multiple venture entrepreneurs. In Frontiers of Entrepreneurship
Research. Babson College, Wellesley, MA.
Stuart, R. W., & Abetti, P. A. (1990). Impact of entrepreneurial and management experience on
early performance. Journal of Business Venturing, 5(3), 151–162.
http://doi.org/10.1016/0883-9026(90)90029-S
Ucbasaran, D., Westhead, P., Wright, M., & Binks, M. (2003). Does Entrepreneurial Experience
Influence Opportunity Identification? The Journal of Private Equity, 7(1), 7–14.
http://doi.org/10.3905/jpe.2003.320059
Wright, M., Robbie, K., & Ennew, C. (1997a). Serial Entrepreneurs. British Journal of
Management, 8(3), 251–268. http://doi.org/10.1111/1467-8551.00064
Wright, M., Robbie, K., & Ennew, C. (1997b). Venture capitalists and serial entrepreneurs.
Journal of Business Venturing, 12(3), 227–249. http://doi.org/10.1016/S0883-
9026(96)06115-0
Yamakawa, Y., Peng, M. W., & Deeds, D. L. (2015). Rising From the Ashes: Cognitive
Determinants of Venture Growth After Entrepreneurial Failure. Entrepreneurship Theory
and Practice, 39(2), 209–236. http://doi.org/10.1111/etap.12047
Tables
Table I: Summary Statistics
This table shows summary statistics for our final sample and then separately for firsts and for seconds campaigns. The last column reports a mean
difference test between firsts and seconds campaigns and significance levels are as * p < 0.10, ** p < 0.05, *** p < 0.01.
Full Sample First Campaigns
Variables Obs. Mean S.D. Median Obs. Mean S.D. Median Obs. Mean S.D. Median
Success dummy 22,739 0.180 0.380 0 22,052 0.180 0.380 0 687 0.200 0.400 0 -0.025*Completion Ratio 22,739 0.440 1.200 0.220 22,052 0.430 1.200 0.220 687 0.510 1.110 0.240 -0.082*ln(Goal) 22,739 21,068 26,606 10,000 22,052 21,128 26,699 10,000 687 19,144 23,387 10,000 1,983.709*Keep-It-All Dummy 22,739 0.950 0.220 1 22,052 0.950 0.220 1 687 0.970 0.170 1 -0.024***Verified Non-profit 22,739 0.100 0.300 0 22,052 0.100 0.300 0 687 0.190 0.390 0 -0.094***Team Size 22,739 2.400 2.030 2 22,052 2.400 2.020 2 687 2.420 2.170 1 -0.0250Reward's Levels 22,739 7.440 3.940 8 22,052 7.440 3.930 8 687 7.420 4.340 7 0.0150Full Text Length 22,739 4,659 3,439 3,808 22,052 4,657 3,434 3,814 687 4,721 3,625 3,733 -64.27Gallery's items 22,739 6.810 10.53 3 22,052 6.840 10.58 3 687 5.850 8.980 3 0.991**
2nd CampaignsMean. Diff.
Test
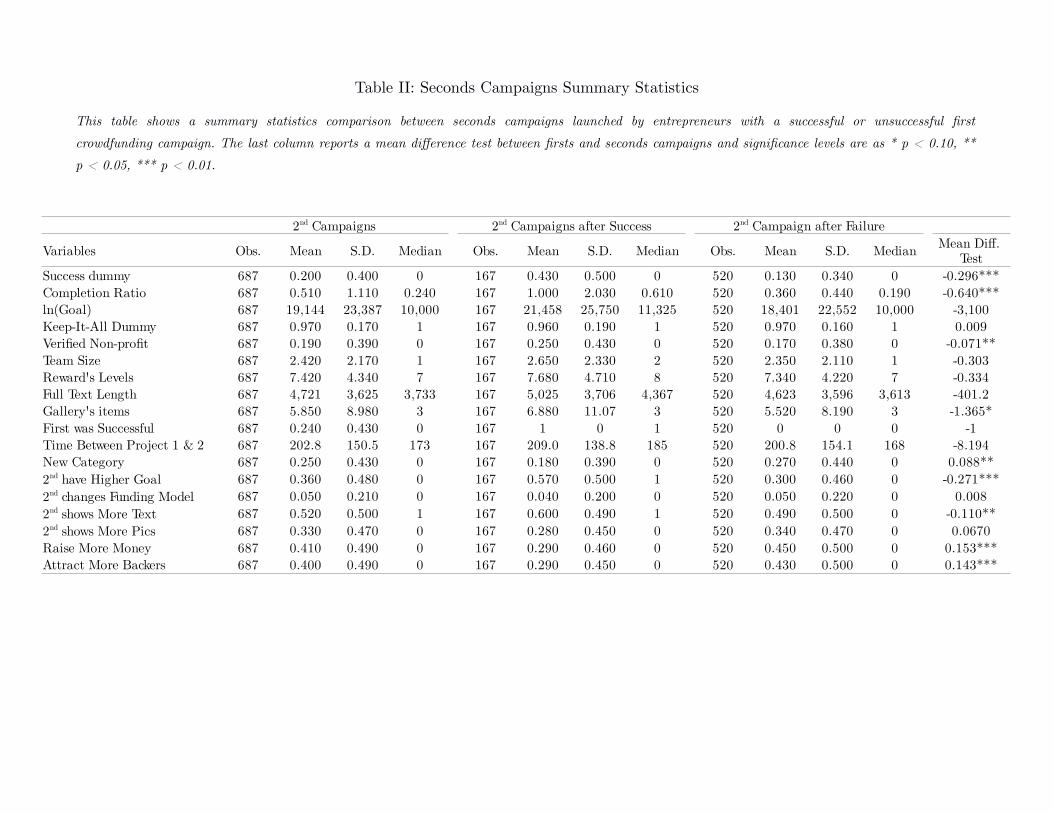
Table II: Seconds Campaigns Summary Statistics
This table shows a summary statistics comparison between seconds campaigns launched by entrepreneurs with a successful or unsuccessful first
crowdfunding campaign. The last column reports a mean difference test between firsts and seconds campaigns and significance levels are as * p < 0.10, **
p < 0.05, *** p < 0.01.
Variables Obs. Mean S.D. Median Obs. Mean S.D. Median Obs. Mean S.D. Median
Success dummy 687 0.200 0.400 0 167 0.430 0.500 0 520 0.130 0.340 0 -0.296***Completion Ratio 687 0.510 1.110 0.240 167 1.000 2.030 0.610 520 0.360 0.440 0.190 -0.640***ln(Goal) 687 19,144 23,387 10,000 167 21,458 25,750 11,325 520 18,401 22,552 10,000 -3,100Keep-It-All Dummy 687 0.970 0.170 1 167 0.960 0.190 1 520 0.970 0.160 1 0.009Verified Non-profit 687 0.190 0.390 0 167 0.250 0.430 0 520 0.170 0.380 0 -0.071**Team Size 687 2.420 2.170 1 167 2.650 2.330 2 520 2.350 2.110 1 -0.303Reward's Levels 687 7.420 4.340 7 167 7.680 4.710 8 520 7.340 4.220 7 -0.334Full Text Length 687 4,721 3,625 3,733 167 5,025 3,706 4,367 520 4,623 3,596 3,613 -401.2Gallery's items 687 5.850 8.980 3 167 6.880 11.07 3 520 5.520 8.190 3 -1.365*First was Successful 687 0.240 0.430 0 167 1 0 1 520 0 0 0 -1Time Between Project 1 & 2 687 202.8 150.5 173 167 209.0 138.8 185 520 200.8 154.1 168 -8.194New Category 687 0.250 0.430 0 167 0.180 0.390 0 520 0.270 0.440 0 0.088**
687 0.360 0.480 0 167 0.570 0.500 1 520 0.300 0.460 0 -0.271***687 0.050 0.210 0 167 0.040 0.200 0 520 0.050 0.220 0 0.008687 0.520 0.500 1 167 0.600 0.490 1 520 0.490 0.500 0 -0.110**687 0.330 0.470 0 167 0.280 0.450 0 520 0.340 0.470 0 0.0670
Raise More Money 687 0.410 0.490 0 167 0.290 0.460 0 520 0.450 0.500 0 0.153***Attract More Backers 687 0.400 0.490 0 167 0.290 0.450 0 520 0.430 0.500 0 0.143***
2nd Campaigns 2nd Campaigns after Success 2nd Campaign after FailureMean Diff.
Test
2nd have Higher Goal2nd changes Funding Model2nd shows More Text2nd shows More Pics
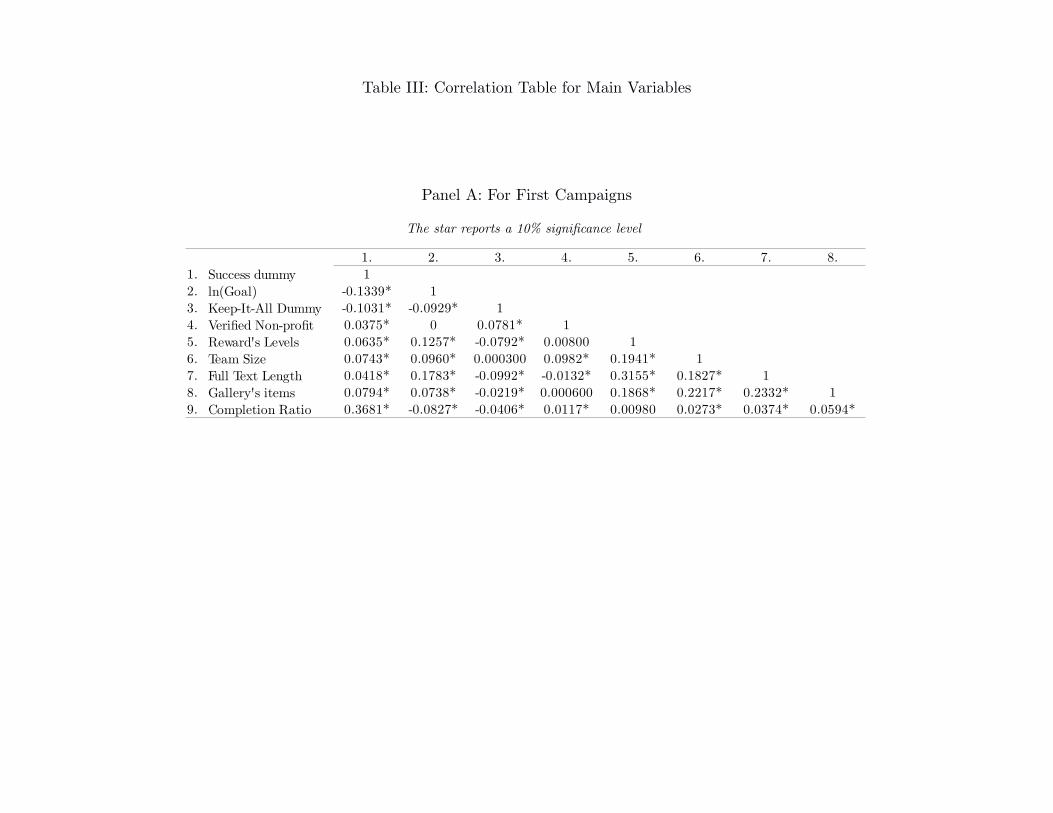
Table III: Correlation Table for Main Variables
Panel A: For First Campaigns
The star reports a 10% significance level
1. 2. 3. 4. 5. 6. 7. 8.1. Success dummy 12. ln(Goal) -0.1339* 13. Keep-It-All Dummy -0.1031* -0.0929* 14. Verified Non-profit 0.0375* 0 0.0781* 15. Reward's Levels 0.0635* 0.1257* -0.0792* 0.00800 16. Team Size 0.0743* 0.0960* 0.000300 0.0982* 0.1941* 17. Full Text Length 0.0418* 0.1783* -0.0992* -0.0132* 0.3155* 0.1827* 18. Gallery's items 0.0794* 0.0738* -0.0219* 0.000600 0.1868* 0.2217* 0.2332* 19. Completion Ratio 0.3681* -0.0827* -0.0406* 0.0117* 0.00980 0.0273* 0.0374* 0.0594*
Panel B: For Second Campaigns
The star reports a 10% significance level
1. 2. 3. 4. 5. 6. 7. 8. 9.1. Success dummy 12. ln(Goal) -0.0711* 13. Keep-It-All Dummy -0.0861* -0.0693* 14. Verified Non-profit 0.0137 0.0321 0.0844* 15. Reward's Levels 0.1093* 0.1861* -0.0310 -0.0255 16. Team Size 0.1418* -0.0186 -0.0141 0.0428 0.2011* 17. Full Text Length 0.0836* 0.1650* -0.0608 -0.00120 0.2821* 0.1537* 18. Gallery's items 0.1340* 0.0137 -0.0193 -0.0522 0.2020* 0.2279* 0.2296* 19. Completion Ratio 0.4956* -0.0843* -0.0495 -0.0160 0.0777* 0.1849* 0.1033* 0.1707* 110. First was Successful 0.3172* 0.0561 -0.0230 0.0768* 0.0331 0.0599 0.0475 0.0652* 0.2486*11. Time Between Project 1 & 2 0.0509 -0.0776* 0.0102 0.1309* 0.1257* 0.1023* -0.00490 -0.0186 -0.010712. New Category -0.0502 0.0940* -0.1222* 0.0303 -0.0760* 0.0194 -0.0288 -0.0490 -0.056613. -0.0470 0.3367* -0.0670* 0.0842* 0.0335 0.0364 0.00140 0.0328 -0.016014. 0.1422* 0.0383 -0.4470* -0.0577 0.0848* -0.0156 0.1112* 0.0387 0.059715. 0.0137 0.1094* -0.0640* 0.0294 0.1075* 0.0901* 0.3280* 0.1168* 0.060516. 0.0233 0.0612 -0.0273 -0.0476 0.0244 0.0718* 0.0276 0.4127* 0.052717. Raise More Money 0.3218* 0.0314 -0.0144 0.000100 0.0948* 0.1393* 0.0369 0.0890* 0.2278*18. Attract More Backers 0.2256* 0.0486 -0.0546 -0.0246 0.1035* 0.1508* 0.0776* 0.1325* 0.1672*
2nd have Higher Goal2nd changes Funding Model2nd shows More Text2nd shows More Pics
10. 11. 12. 13. 14. 15. 16. 17.10. First was Successful 111. Time Between Project 1 & 2 0.0234 112. New Category -0.0873* 0.0442 113. 0.2414* 0.1423* 0.1019* 114. -0.0162 -0.0353 0.0930* 0.0282 115. 0.0947* -0.00810 -0.00730 0.0979* -0.0137 116. -0.0612 -0.0610 0.0209 0.0806* 0.0616 0.1216* 117. Raise More Money -0.1333* 0.0917* 0.0748* 0.0784* 0.1039* 0.0664* 0.1224* 118. Attract More Backers -0.1257* 0.1193* 0.0905* 0.1486* 0.1104* 0.0824* 0.1925* 0.6099*
2nd have Higher Goal2nd changes Funding Model2nd shows More Text2nd shows More Pics
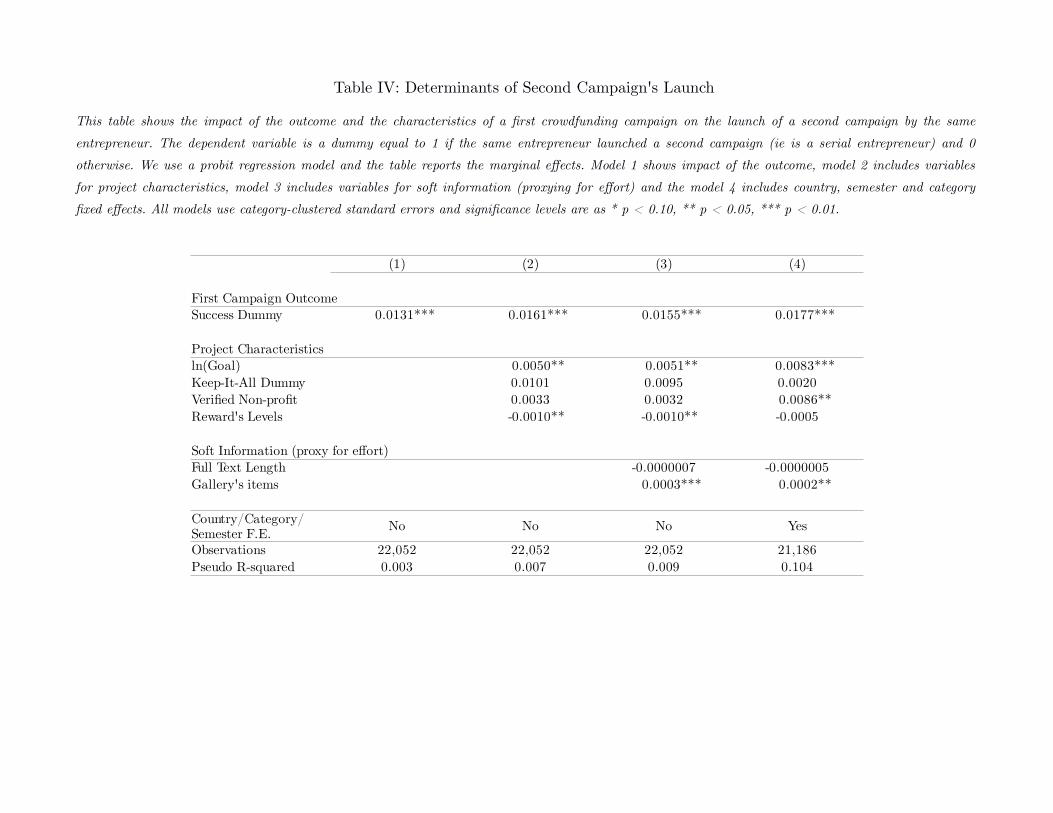
Table IV: Determinants of Second Campaign's Launch
This table shows the impact of the outcome and the characteristics of a first crowdfunding campaign on the launch of a second campaign by the same
entrepreneur. The dependent variable is a dummy equal to 1 if the same entrepreneur launched a second campaign (ie is a serial entrepreneur) and 0
otherwise. We use a probit regression model and the table reports the marginal effects. Model 1 shows impact of the outcome, model 2 includes variables
for project characteristics, model 3 includes variables for soft information (proxying for effort) and the model 4 includes country, semester and category
fixed effects. All models use category-clustered standard errors and significance levels are as * p < 0.10, ** p < 0.05, *** p < 0.01.
(1) (2) (3) (4)
First Campaign OutcomeSuccess Dummy 0.0131*** 0.0161*** 0.0155*** 0.0177***
Project Characteristicsln(Goal) 0.0050** 0.0051** 0.0083***Keep-It-All Dummy 0.0101 0.0095 0.0020Verified Non-profit 0.0033 0.0032 0.0086**Reward's Levels -0.0010** -0.0010** -0.0005
Soft Information (proxy for effort)Full Text Length -0.0000007 -0.0000005Gallery's items 0.0003*** 0.0002**
No No No Yes
Observations 22,052 22,052 22,052 21,186Pseudo R-squared 0.003 0.007 0.009 0.104
Country/Category/Semester F.E.
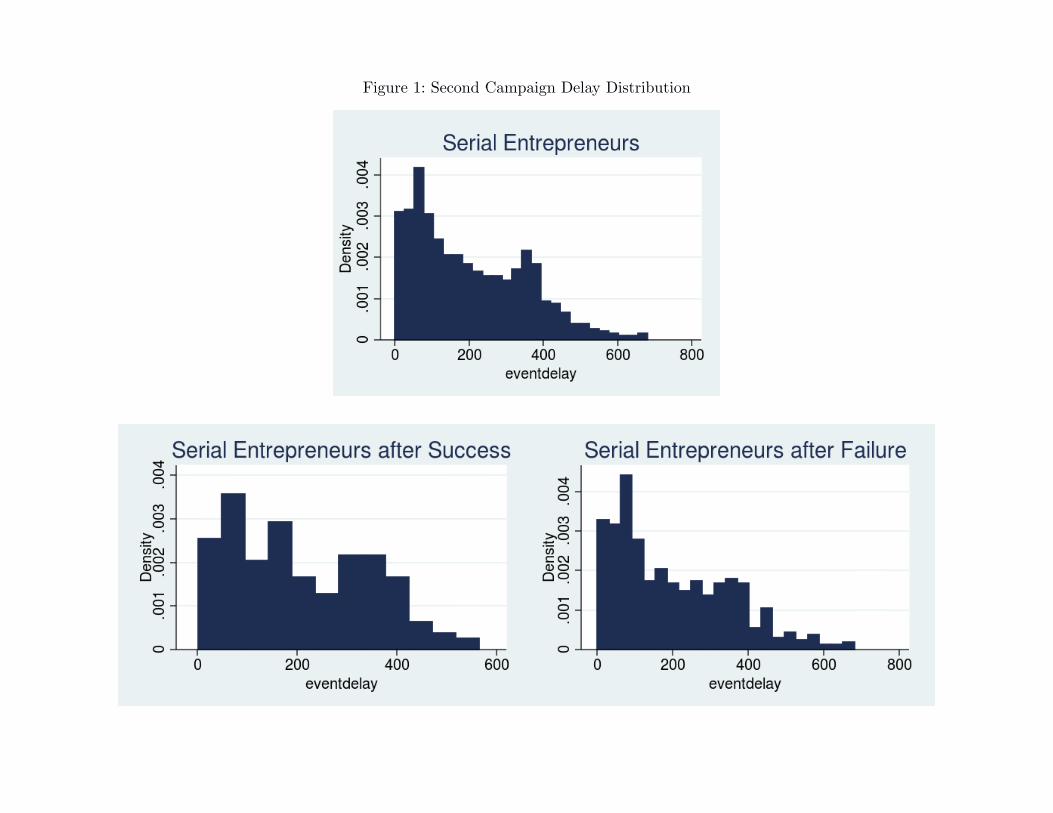
Figure 1: Second Campaign Delay Distribution
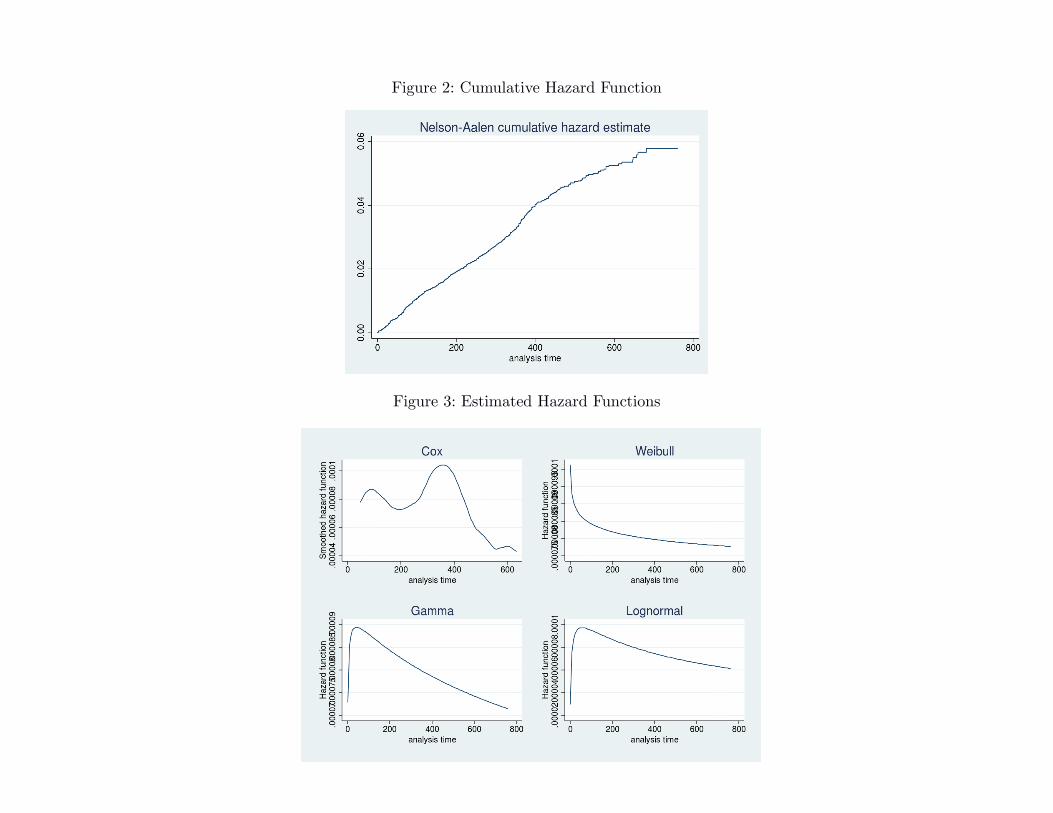
Figure 2: Cumulative Hazard Function
Figure 3: Estimated Hazard Functions
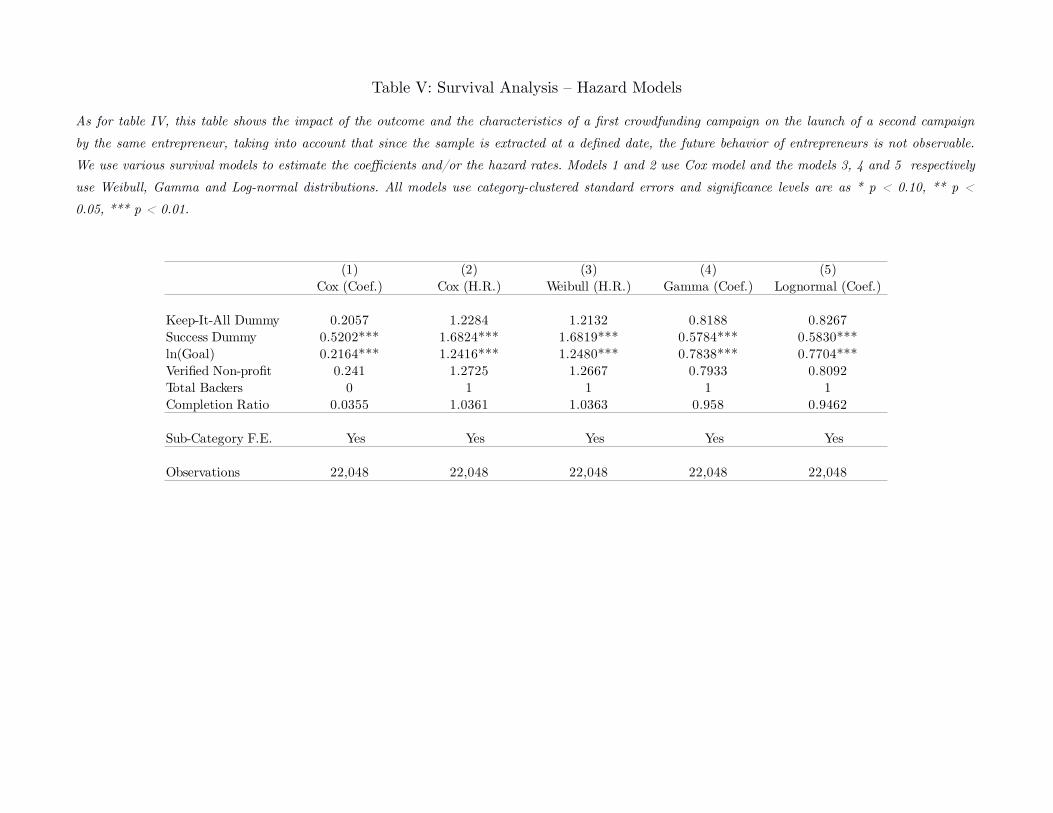
Table V: Survival Analysis – Hazard Models
As for table IV, this table shows the impact of the outcome and the characteristics of a first crowdfunding campaign on the launch of a second campaign
by the same entrepreneur, taking into account that since the sample is extracted at a defined date, the future behavior of entrepreneurs is not observable.
We use various survival models to estimate the coefficients and/or the hazard rates. Models 1 and 2 use Cox model and the models 3, 4 and 5 respectively
use Weibull, Gamma and Log-normal distributions. All models use category-clustered standard errors and significance levels are as * p < 0.10, ** p <
0.05, *** p < 0.01.
(1) (2) (3) (4) (5)Cox (Coef.) Cox (H.R.) Weibull (H.R.) Gamma (Coef.) Lognormal (Coef.)
Keep-It-All Dummy 0.2057 1.2284 1.2132 0.8188 0.8267Success Dummy 0.5202*** 1.6824*** 1.6819*** 0.5784*** 0.5830***ln(Goal) 0.2164*** 1.2416*** 1.2480*** 0.7838*** 0.7704***Verified Non-profit 0.241 1.2725 1.2667 0.7933 0.8092Total Backers 0 1 1 1 1Completion Ratio 0.0355 1.0361 1.0363 0.958 0.9462
Sub-Category F.E. Yes Yes Yes Yes Yes
Observations 22,048 22,048 22,048 22,048 22,048
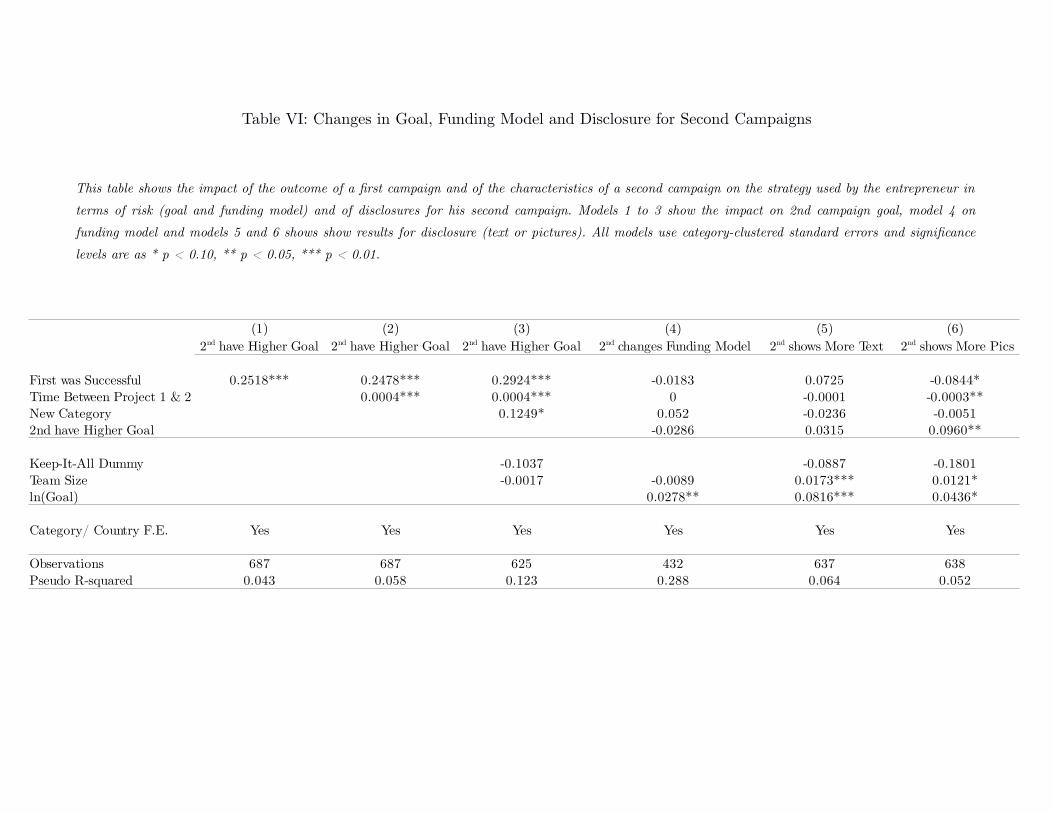
Table VI: Changes in Goal, Funding Model and Disclosure for Second Campaigns
This table shows the impact of the outcome of a first campaign and of the characteristics of a second campaign on the strategy used by the entrepreneur in
terms of risk (goal and funding model) and of disclosures for his second campaign. Models 1 to 3 show the impact on 2nd campaign goal, model 4 on
funding model and models 5 and 6 shows show results for disclosure (text or pictures). All models use category-clustered standard errors and significance
levels are as * p < 0.10, ** p < 0.05, *** p < 0.01.
(1) (2) (3) (4) (5) (6)
First was Successful 0.2518*** 0.2478*** 0.2924*** -0.0183 0.0725 -0.0844*Time Between Project 1 & 2 0.0004*** 0.0004*** 0 -0.0001 -0.0003**New Category 0.1249* 0.052 -0.0236 -0.00512nd have Higher Goal -0.0286 0.0315 0.0960**
Keep-It-All Dummy -0.1037 -0.0887 -0.1801Team Size -0.0017 -0.0089 0.0173*** 0.0121*ln(Goal) 0.0278** 0.0816*** 0.0436*
Category/ Country F.E. Yes Yes Yes Yes Yes Yes
Observations 687 687 625 432 637 638Pseudo R-squared 0.043 0.058 0.123 0.288 0.064 0.052
2nd have Higher Goal 2nd have Higher Goal 2nd have Higher Goal 2nd changes Funding Model 2nd shows More Text 2nd shows More Pics
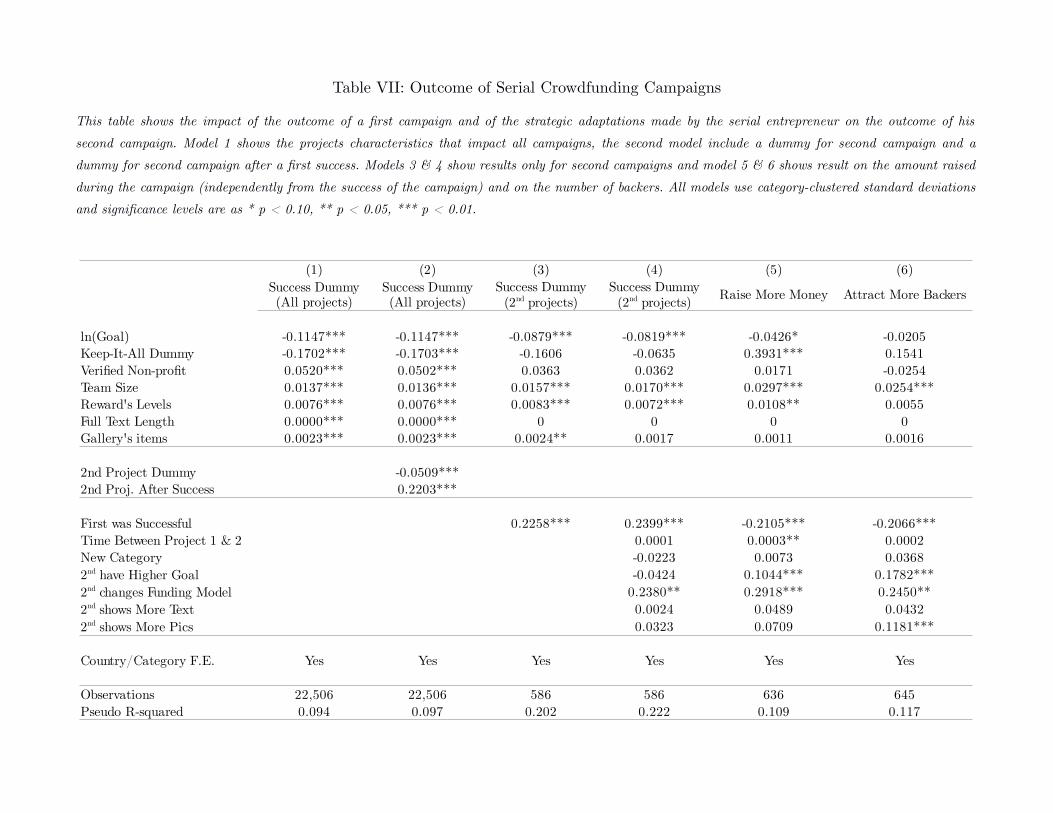
Table VII: Outcome of Serial Crowdfunding Campaigns
This table shows the impact of the outcome of a first campaign and of the strategic adaptations made by the serial entrepreneur on the outcome of his
second campaign. Model 1 shows the projects characteristics that impact all campaigns, the second model include a dummy for second campaign and a
dummy for second campaign after a first success. Models 3 & 4 show results only for second campaigns and model 5 & 6 shows result on the amount raised
during the campaign (independently from the success of the campaign) and on the number of backers. All models use category-clustered standard deviations
and significance levels are as * p < 0.10, ** p < 0.05, *** p < 0.01.
(1) (2) (3) (4) (5) (6)
Raise More Money Attract More Backers
ln(Goal) -0.1147*** -0.1147*** -0.0879*** -0.0819*** -0.0426* -0.0205Keep-It-All Dummy -0.1702*** -0.1703*** -0.1606 -0.0635 0.3931*** 0.1541Verified Non-profit 0.0520*** 0.0502*** 0.0363 0.0362 0.0171 -0.0254Team Size 0.0137*** 0.0136*** 0.0157*** 0.0170*** 0.0297*** 0.0254***Reward's Levels 0.0076*** 0.0076*** 0.0083*** 0.0072*** 0.0108** 0.0055Full Text Length 0.0000*** 0.0000*** 0 0 0 0Gallery's items 0.0023*** 0.0023*** 0.0024** 0.0017 0.0011 0.0016
2nd Project Dummy -0.0509***2nd Proj. After Success 0.2203***
First was Successful 0.2258*** 0.2399*** -0.2105*** -0.2066***Time Between Project 1 & 2 0.0001 0.0003** 0.0002New Category -0.0223 0.0073 0.0368
-0.0424 0.1044*** 0.1782***0.2380** 0.2918*** 0.2450**0.0024 0.0489 0.04320.0323 0.0709 0.1181***
Country/Category F.E. Yes Yes Yes Yes Yes Yes
Observations 22,506 22,506 586 586 636 645Pseudo R-squared 0.094 0.097 0.202 0.222 0.109 0.117
Success Dummy(All projects)
Success Dummy(All projects)
Success Dummy(2nd projects)
Success Dummy(2nd projects)
2nd have Higher Goal2nd changes Funding Model2nd shows More Text2nd shows More Pics
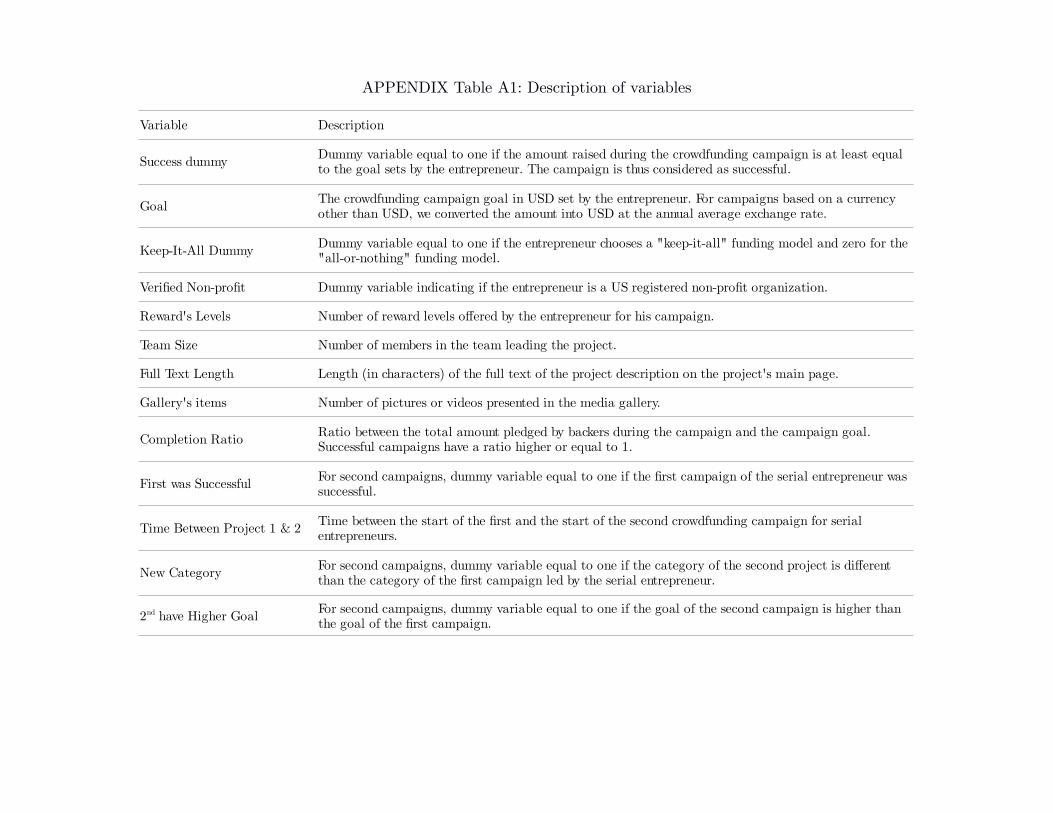
APPENDIX Table A1: Description of variables
Variable Description
Success dummy
Goal
Keep-It-All Dummy
Verified Non-profit Dummy variable indicating if the entrepreneur is a US registered non-profit organization.
Reward's Levels Number of reward levels offered by the entrepreneur for his campaign.
Team Size Number of members in the team leading the project.
Full Text Length Length (in characters) of the full text of the project description on the project's main page.
Gallery's items Number of pictures or videos presented in the media gallery.
Completion Ratio
First was Successful
Time Between Project 1 & 2
New Category
Dummy variable equal to one if the amount raised during the crowdfunding campaign is at least equal to the goal sets by the entrepreneur. The campaign is thus considered as successful.
The crowdfunding campaign goal in USD set by the entrepreneur. For campaigns based on a currency other than USD, we converted the amount into USD at the annual average exchange rate.
Dummy variable equal to one if the entrepreneur chooses a "keep-it-all" funding model and zero for the "all-or-nothing" funding model.
Ratio between the total amount pledged by backers during the campaign and the campaign goal. Successful campaigns have a ratio higher or equal to 1.
For second campaigns, dummy variable equal to one if the first campaign of the serial entrepreneur was successful.
Time between the start of the first and the start of the second crowdfunding campaign for serial entrepreneurs.
For second campaigns, dummy variable equal to one if the category of the second project is different than the category of the first campaign led by the serial entrepreneur.
2nd have Higher Goal For second campaigns, dummy variable equal to one if the goal of the second campaign is higher than the goal of the first campaign.
Raise More Money
Attract More Backers
2nd changes Funding Model For second campaigns, dummy variable equal to one if the entrepreneur changes the funding model for the second campaign (for instance the first campaign was KIA and the second is AON).
2nd shows More Text For second campaigns, dummy variable equal to one if the text that describes the second campaign his longer than the text of the first campaign.
2nd shows More Pics For second campaigns, dummy variable equal to one if the entrepreneur provides more pictures for the second campaign than for the first.
For second campaigns, dummy variable equal to one if total amount pledged by backers if higher for the second campaign than for the first
For second campaigns, dummy variable equal to one if more backers have participated to the second campaign compared to the first.