Embed Size (px)
Citation preview
Gladstone Investment Corporation
Quarterly Overview
for the period ended December 31, 2012
Legal Disclaimer
This presentation may include forward-looking statements. These forward-looking statements include comments with respect to our objectives and strategies, and the results of our operations and our business. However, by their nature, these forward-looking statements involve numerous assumptions, uncertainties and opportunities, both general and specific. The risk exists that these statements may not be fulfilled. We caution readers of this presentation not to place undue reliance on these forward-looking statements as a number of factors could cause future company results to differ materially from these statements including those factors listed under the caption “Risk Factors” in our 10K and 10Q filings and our registration statement as filed with the Securities and Exchange Commission, all of which can be found on our web site at www.GladstoneInvestment.com or the SEC web site, www.SEC.gov. Forward-looking statements may be influenced in particular by factors such as fluctuations in interest rates and stock indices, the effects of competition in the areas in which we operate, and changes in economic, political, regulatory and technological conditions. We caution that the foregoing list is not exhaustive. When relying on forward-looking statements to make decisions, investors should carefully consider the aforementioned factors as well as other uncertainties and events.
2
Overview
• Gladstone Investment Corporation
• Business Development Company (BDC) with publicly traded common and preferred stock
• Common stock (NASDAQ: GAIN)
• Preferred stock (NASDAQ: GAINP)
• Current common stock dividend is $0.60 per share (per year), paid monthly at $0.05 per share
• Paid $0.03 bonus dividend per common share in March 2012
• First preferred stock dividend was paid in March 2012. The annual rate per month is 7.125% or $0.1484 per share
• Managed by Gladstone Management Corporation, an investment adviser registered with the SEC that manages more than a billion dollars of assets
• One of a family of funds known as The Gladstone Companies (www.gladstone.com)
• Focused on investing in subordinated debt, preferred stock, and common stock or warrants to purchase common stock in buyouts of private U.S. businesses
• Went public in 2005 and has never missed paying a monthly dividend
• Current Portfolio
• Over $273 million at fair value in total investments as of December 31, 2012
• Invested in 21 companies across 15 states and 13 industries as of December 31, 2012
Disclaimer: Past performance is not an indication of future performance
3
What is Gladstone Investment?
• Gladstone Investment Corporation is a publicly traded business
development company (BDC) that invests in debt and equity
securities consisting primarily of senior loans, subordinated loans,
mezzanine debt, preferred equity, and common stock or warrants to
purchase common stock in small and medium-sized U.S. businesses in
connection with buyouts and other recapitalizations.
• The company seeks to:
• Lend to and invest in companies with proven cash flows and
successful track records led by great managers
• Generate current income to pay monthly dividends to stockholders
• Achieve capital gains from the sale of appreciated equity
securities
• Gladstone Investment is operated by an experienced management
team
4
Experienced Management Team
David Gladstone, Chairman & CEO
• Over 25 years of experience investing in mid-sized and small private
businesses
• Current Chairman and CEO of all four Gladstone public funds; these are
public companies #7 - #10 in his career (most recent IPO in January 2013)
• Past Chairman of Allied Capital and American Capital while both were very
profitable
• MBA from Harvard Business School; MA from American University; BA
from University of Virginia
5
Experienced Management Team
6
Terry Brubaker, COO
• More than 25 years experience in managing businesses
• Currently COO and head of portfolio management for all four Gladstone public funds
• Previously on the acquisition team of James River Corp., as it grew from $200 million to $7 billion in revenues
• Group VP of two operating divisions at James River with 2,300 employees, $440 million in revenue and 14 locations
• After James River, was CEO of two businesses with 800 employees, $250 million in revenue and 4 locations
• Former consultant with McKinsey & Company
• MBA from Harvard Business School; BSE in Aeronautical Engineering from Princeton University
David Dullum, President
• More than 25 years experience in portfolio investing
• Currently President of Gladstone Investment
• Experienced in investing, due diligence, reviewing hundreds of new opportunities and reviewing each new investment
• Past partner of New England Partners, a small buyout fund located in Boston and Washington, DC
• Past partner of Frontenac Company for over 14 years in Chicago, investing in many mid-market businesses in the Midwest
• MBA from Stanford; BS in Engineering from Georgia Tech
Experienced Management Team
7
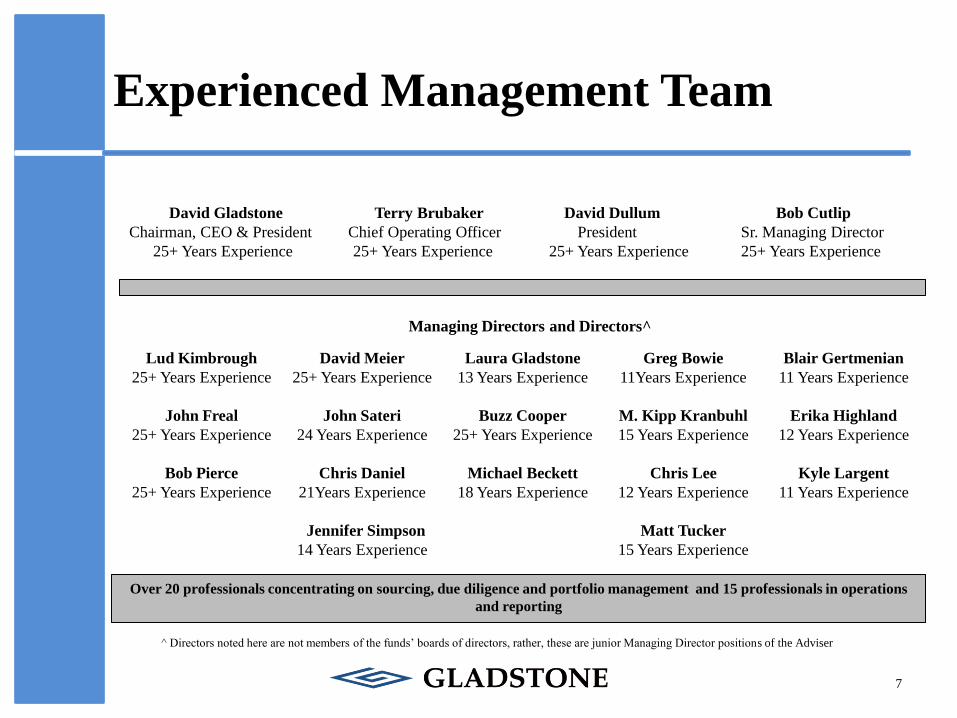
David Gladstone Terry Brubaker David Dullum Bob Cutlip
Chairman, CEO & President Chief Operating Officer President Sr. Managing Director
25+ Years Experience 25+ Years Experience 25+ Years Experience 25+ Years Experience
Over 20 professionals concentrating on sourcing, due diligence and portfolio management and 15 professionals in operations
and reporting
^ Directors noted here are not members of the funds’ boards of directors, rather, these are junior Managing Director positions of the Adviser
Managing Directors and Directors^
Lud Kimbrough
25+ Years Experience
John Freal
25+ Years Experience
Bob Pierce
25+ Years Experience
David Meier
25+ Years Experience
John Sateri
24 Years Experience
Chris Daniel
21Years Experience
Jennifer Simpson
14 Years Experience
Laura Gladstone
13 Years Experience
Buzz Cooper
25+ Years Experience
Michael Beckett
18 Years Experience
Greg Bowie
11Years Experience
M. Kipp Kranbuhl
15 Years Experience
Chris Lee
12 Years Experience
Matt Tucker
15 Years Experience
Blair Gertmenian
11 Years Experience
Erika Highland
12 Years Experience
Kyle Largent
11 Years Experience
Target Market
8
Why we target companies in the lower middle market
Smaller companies typically offer a more compelling investment profile
than larger ones because of:
Lower purchase price multiples
Lower debt multiples
More protective covenants for lenders
Meaningful equity investment and likely multiple expansion upon exit
Small businesses are often less complicated
Examples of Investments Made in Private Businesses
• Small manufacturer of a product or a service business needs money to grow
• Banks will make short-term loans if the business has collateral and solid cash flow
• The business gets from us: – Management expertise,
– A long-term loan, but at a higher interest rate, and
– Additional capital in the form of an equity co-investment
• We typically get: – An attractive long-term loan that pays monthly interest that we can
pass on as monthly dividends to our shareholders,
– Board seats and an ownership stake in the company through our equity investment, and
– Potential for accrued dividend payouts on our preferred equity, as well as capital appreciation of our common stock upon an exit
9
Focus on Certain Industries
Areas where opportunities exist
• Light and specialty manufacturing
• Established software companies
• Business services
• Distribution/Logistics
• Healthcare services
• Consumer products
Areas we avoid and have not invested in
• Housing and home mortgage companies
• Banking, financial institutions or leasing companies
• High technology or early stage companies
10
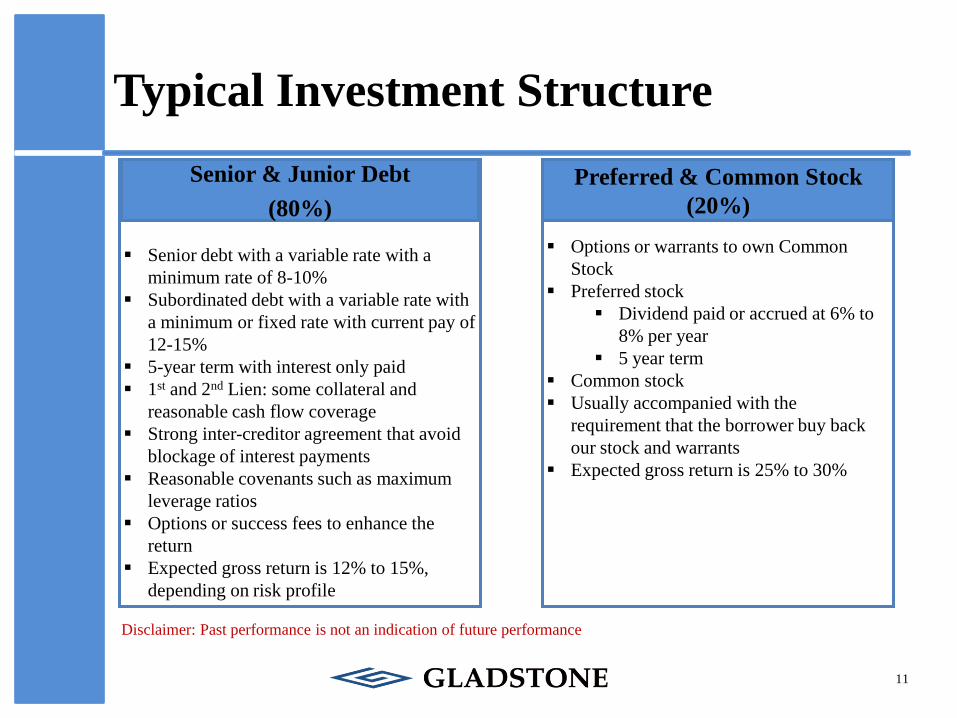
Typical Investment Structure
11
Options or warrants to own Common
Stock
Preferred stock
Dividend paid or accrued at 6% to
8% per year
5 year term
Common stock
Usually accompanied with the
requirement that the borrower buy back
our stock and warrants
Expected gross return is 25% to 30%
Preferred & Common Stock
(20%)
Senior debt with a variable rate with a
minimum rate of 8-10%
Subordinated debt with a variable rate with
a minimum or fixed rate with current pay of
12-15%
5-year term with interest only paid
1st and 2nd Lien: some collateral and
reasonable cash flow coverage
Strong inter-creditor agreement that avoid
blockage of interest payments
Reasonable covenants such as maximum
leverage ratios
Options or success fees to enhance the
return
Expected gross return is 12% to 15%,
depending on risk profile
Senior & Junior Debt
(80%)
Disclaimer: Past performance is not an indication of future performance
Track Record as of December 31, 2012
• Common Stock dividend of 5 cents per month, $0.60 per year – Raised the dividend twice in 2011 for a total increase of 25%, plus paid an
extra dividend of $0.03 per share in March of 2012
• Paid 91 consecutive monthly dividends as of January 31, 2013 – Dividend yield is 8.0% as of February 1, 2013
– Dividends have been 100% covered by cash earnings over the past three years
• Had $345.9 million in assets and had $44.5 million of short-term borrowings (repaid January 3, 2013) and $24.5 million outstanding under the revolving credit facility – Ratio of debt to equity is relatively low for a public lending company and is
always less than 1-to-1 by law
• Currently invested in 21 companies across 15 states and 13 different industries
Disclaimer: Past performance is not an indication of future performance
12
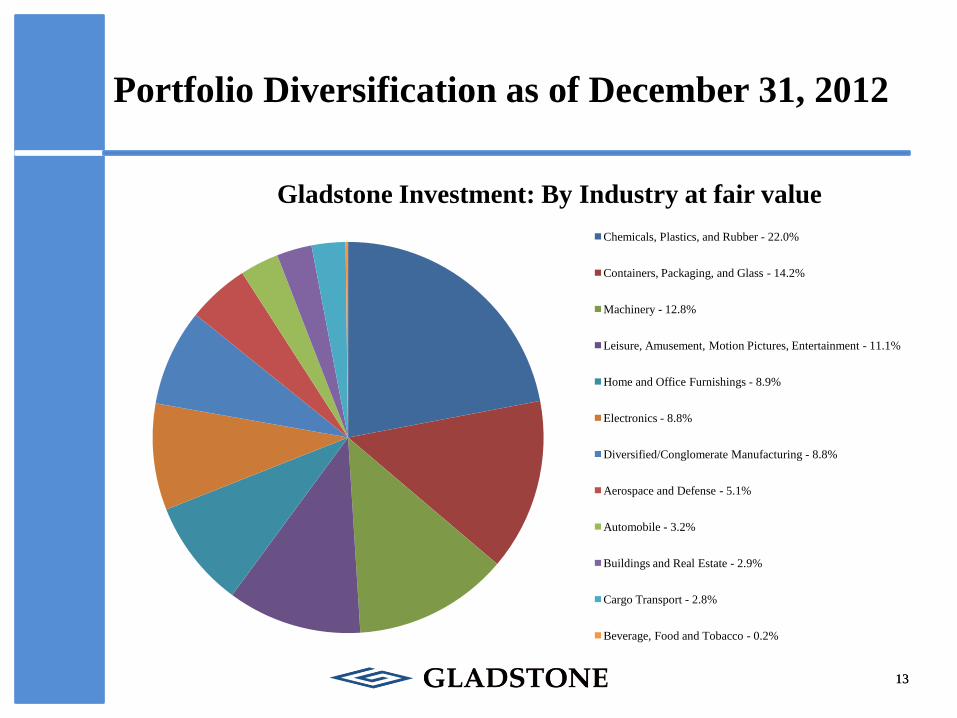
Portfolio Diversification as of December 31, 2012
13
Gladstone Investment: By Industry at fair value
Chemicals, Plastics, and Rubber - 22.0%
Containers, Packaging, and Glass - 14.2%
Machinery - 12.8%
Leisure, Amusement, Motion Pictures, Entertainment - 11.1%
Home and Office Furnishings - 8.9%
Electronics - 8.8%
Diversified/Conglomerate Manufacturing - 8.8%
Aerospace and Defense - 5.1%
Automobile - 3.2%
Buildings and Real Estate - 2.9%
Cargo Transport - 2.8%
Beverage, Food and Tobacco - 0.2%
13
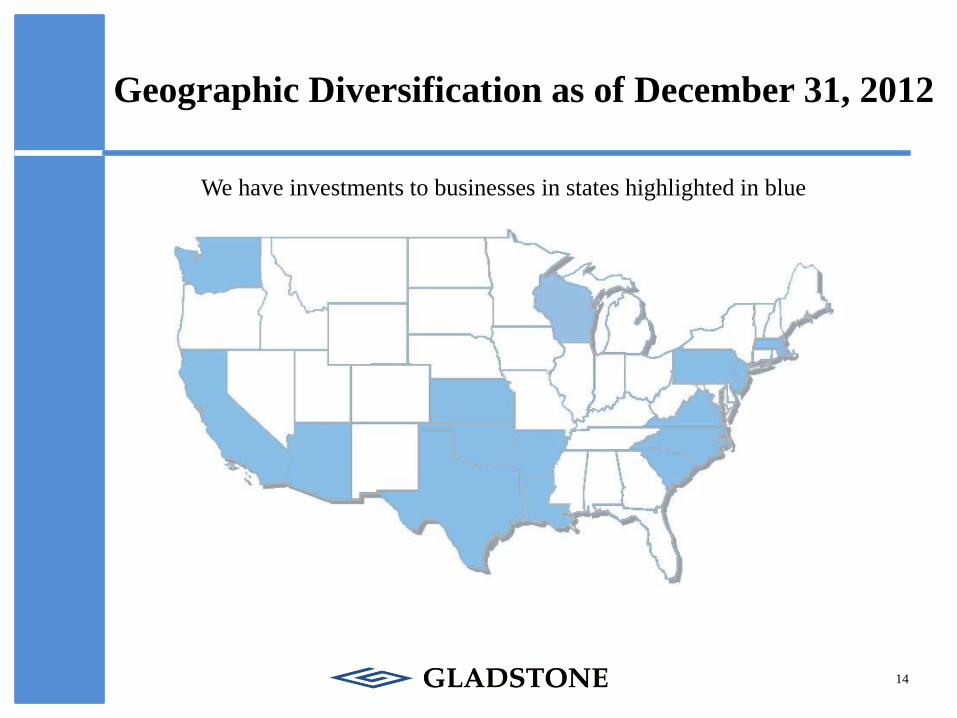
Geographic Diversification as of December 31, 2012
14
We have investments to businesses in states highlighted in blue
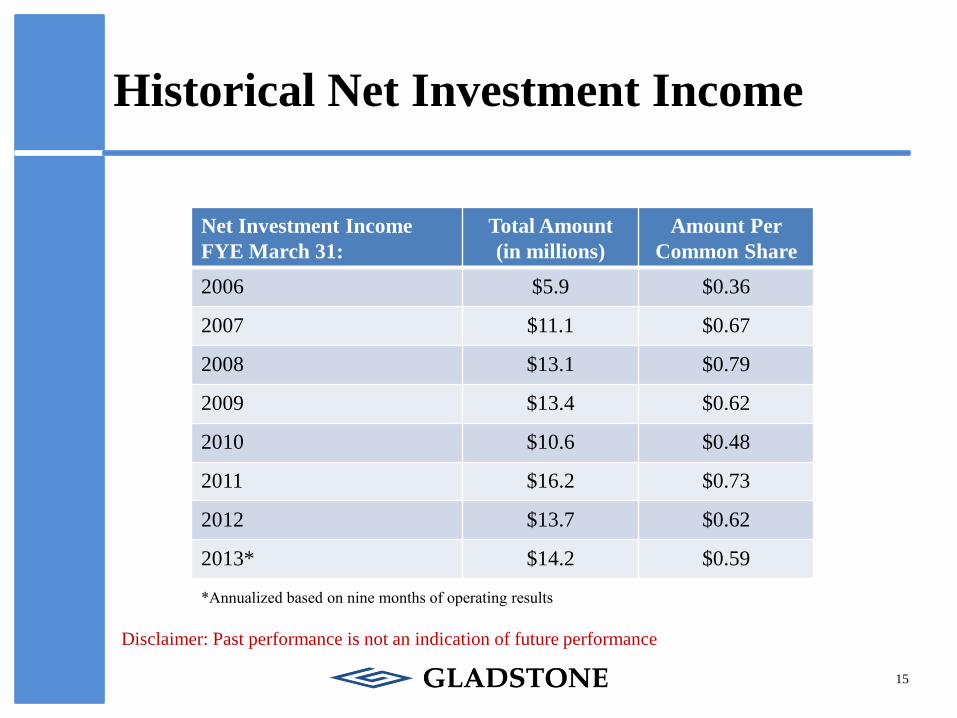
Historical Net Investment Income
15
Net Investment Income
FYE March 31:
Total Amount
(in millions)
Amount Per
Common Share
2006 $5.9 $0.36
2007 $11.1 $0.67
2008 $13.1 $0.79
2009 $13.4 $0.62
2010 $10.6 $0.48
2011 $16.2 $0.73
2012 $13.7 $0.62
2013* $14.2 $0.59
*Annualized based on nine months of operating results
Disclaimer: Past performance is not an indication of future performance
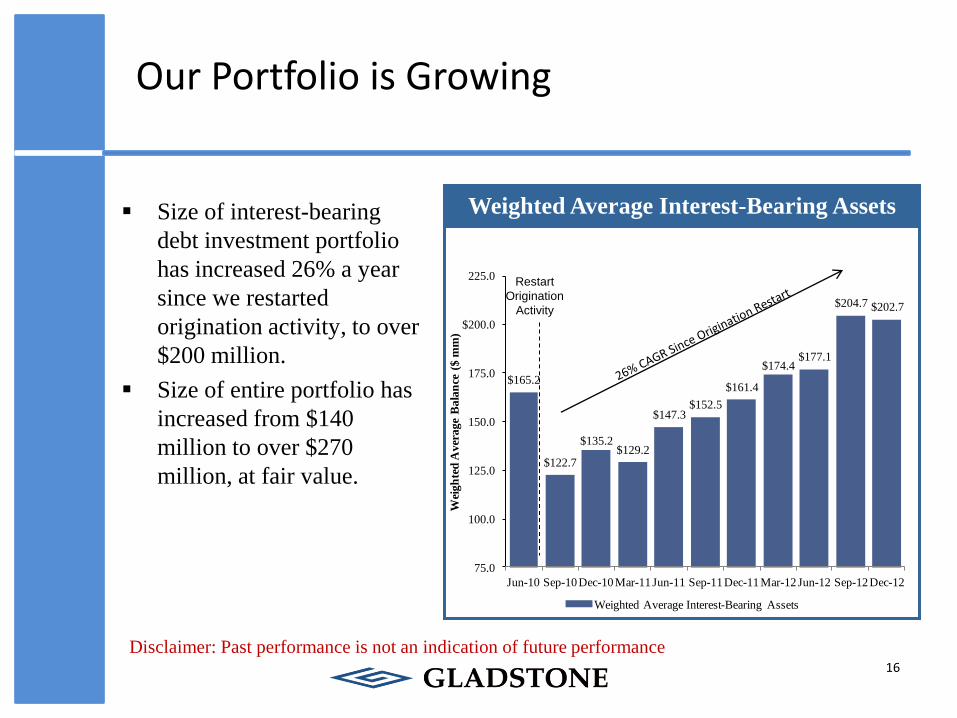
Our Portfolio is Growing
16
Weighted Average Interest-Bearing Assets
$165.2
$122.7
$135.2$129.2
$147.3$152.5
$161.4
$174.4$177.1
$204.7 $202.7
75.0
100.0
125.0
150.0
175.0
$200.0
225.0
Jun-10 Sep-10Dec-10Mar-11Jun-11 Sep-11Dec-11Mar-12Jun-12 Sep-12Dec-12
Wei
gh
ted
Aver
age
Bala
nce
($
mm
)
Weighted Average Interest-Bearing Assets 33.2%
Restart
Origination
Activity
Size of interest-bearing
debt investment portfolio
has increased 26% a year
since we restarted
origination activity, to over
$200 million.
Size of entire portfolio has
increased from $140
million to over $270
million, at fair value.
Disclaimer: Past performance is not an indication of future performance
17
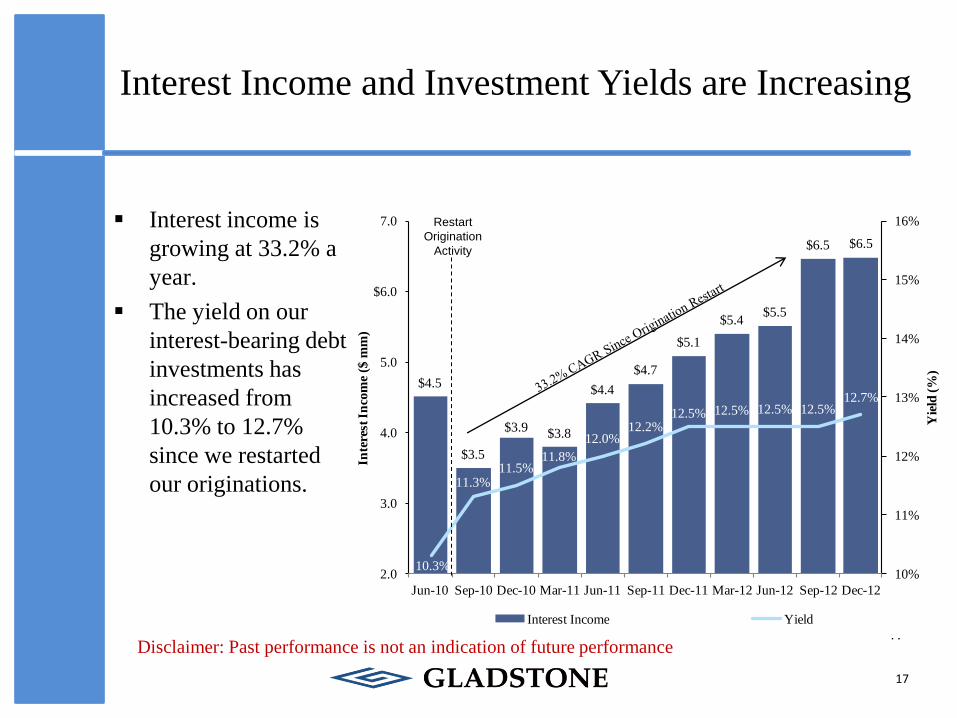
Interest Income and Investment Yields are Increasing
Restart
Origination
Activity Interest income is
growing at 33.2% a
year.
The yield on our
interest-bearing debt
investments has
increased from
10.3% to 12.7%
since we restarted
our originations.
$4.5
$3.5
$3.9$3.8
$4.4
$4.7
$5.1
$5.4$5.5
$6.5 $6.5
10.3%
11.3% 11.5%
11.8%
12.0% 12.2%
12.5% 12.5% 12.5% 12.5% 12.7%
10%
11%
12%
13%
14%
15%
16%
2.0
3.0
4.0
5.0
$6.0
7.0
Jun-10 Sep-10 Dec-10 Mar-11 Jun-11 Sep-11 Dec-11 Mar-12 Jun-12 Sep-12 Dec-12
Yie
ld (
%)
Inte
rest
In
com
e ($
mm
)
Interest Income Yield
Restart
Origination
Activity
Disclaimer: Past performance is not an indication of future performance
17
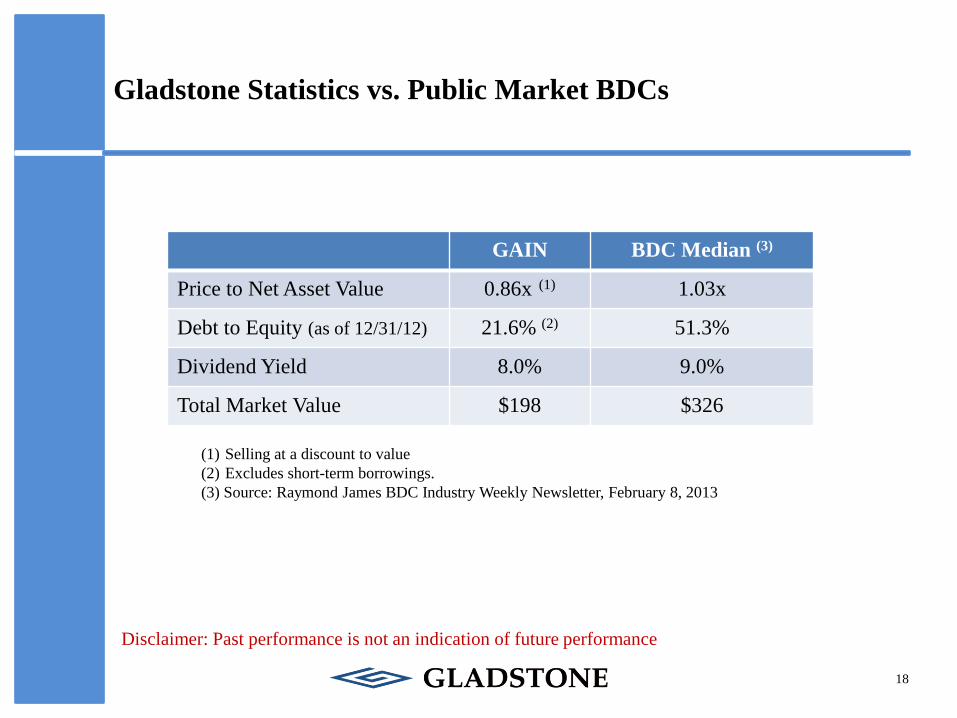
Gladstone Statistics vs. Public Market BDCs
18
GAIN BDC Median (3)
Price to Net Asset Value 0.86x (1) 1.03x
Debt to Equity (as of 12/31/12) 21.6% (2) 51.3%
Dividend Yield 8.0% 9.0%
Total Market Value $198 $326
(1) Selling at a discount to value
(2) Excludes short-term borrowings.
(3) Source: Raymond James BDC Industry Weekly Newsletter, February 8, 2013
Disclaimer: Past performance is not an indication of future performance
We are a Shareholder Focused Company
• Maintain the monthly distribution and dividends to stockholders and grow that distribution when earnings increase
• Emphasis on stability of income first and growth in income second
• Maintain liquidity so shareholder may buy or sell the stock in the market
• Published quarterly reports and hold quarterly calls for shareholders
• Robust informational website (www.gladstoneinvestment.com) and notifications by e-mail to those who sign up
• Shareholder dividend reinvestment plan for common stock
• Audited by PricewaterhouseCoopers LLP
• Investor Relations Hotline: (866) 366-5745
• Adviser with strong reputation (www.gladstone.com)
19
Highlights
• Experienced Management Team: Operating team with a successful track record underwriting private businesses
• Successful CEO: Has a “brand name” reputation demonstrated by the success of ten public companies
• Business Model: Emphasis on deal flow from a proprietary originations network and strategic relationships with LBO funds
• Conservative Underwriting: Focused on the cash flow of the small value-oriented businesses
• Focused on Interest Income Plus Capital Gains: Interest payments on our loans allow us to pay dividends to our shareholders and capital gains are extra
20
Why own Gladstone Investment Common Stock?
Disclaimer: Past performance is not an indicator of future performance.
High Monthly Dividends Paid From Cash Earnings:
Current annual yield of 8.0% as of February 1, 2013
Increased the dividend last year by 25% and paid a bonus dividend of $0.03
Dividends have been 100% covered by cash earnings over the past three years
Paid 91 consecutive monthly dividends since the IPO (over 7 years ago)
Capital Gains Upside: 32% of assets are invested in the stock of businesses. The
stocks do not contribute to our monthly dividend, but do provide for potential
realized capital gains
Conservative Balance Sheet with Low Leverage: Weighted average leverage
during the latest quarter was less than 30% of net assets ($1 debt to $3 equity)
Diversification: Investments in multiple companies in multiple states and industries
Strong and Experienced Management: Operating team of 50+ professionals with
a successful track record of investing in private businesses
Liquidity for Investors: Common stock is listed on NASDAQ: GAIN
21
Other Information
• Website for Gladstone Investment
• www.gladstoneinvestment.com
• Contains much more information about our company and the companies in our portfolio
• Website for our investment adviser
• www.gladstonemanagement.com
• Information on all funds managed by the company’s investment adviser
• www.gladstone.com
• Common stock traded on NASDAQ (GAIN)
• Preferred stock traded on NASDAQ (GAINP)
22