Embed Size (px)
Citation preview


GAIN Working Paper Series no. 4
ii
Published 2012
Use of this Working Paper
© Copyright GAIN - Global Alliance for Improved Nutrition 2012. All rights reserved.
Cover photo credit: Jennifer Coates
This Working Paper and its contents are owned by or licensed to the Global Alliance for Improved Nutrition (GAIN). You may copy or reproduce all or parts of this Working Paper without further permission from GAIN provided that:
• the copy or reproduction is solely for the purposes of private study, research, criticism, review or education or for other non-commercial purposes;
• you exercise due diligence to ensure the accuracy of what is copied or reproduced; • you include the following statement with the materials copied or reproduced to identify GAIN
as the copyright owner: “© Copyright GAIN – Global Alliance for Improved Nutrition 2012.Used by permission.”
• the following citation is used: Coates, Jennifer; Colaiezzi, Brooke; Fiedler, Jack; Wirth, James; Lividini, Keith; and Rogers, Beatrice: Applying Dietary Assessment Methods for Food Fortification and Other Nutrition Programs; Global Alliance for Improved Nutrition (GAIN). Geneva, Switzerland, 2012;
• a hyperlink to the GAIN website (www.gainhealth.org) is included if any information from the Working Paper or about GAIN is posted on an internet site; and
• the reproduced material is not represented as an official version of this Working Paper or as having been reproduced with the support of or endorsed by GAIN.
Reproduction of all or part of this Working Paper for commercial purposes is prohibited except with GAIN’s prior written permission. For permission or questions on commercial use of this Working Paper, please contact GAIN at: [email protected] The contents of this Working Paper are believed to be correct at the time of publication. GAIN attempts to ensure that the contents of this Working Paper are accurate and current however content is liable to change and GAIN does not guarantee its currency or accuracy. GAIN cannot be held liable for any kind of damages, whether direct or indirect, resulting from your use of or your reliance on this Working Paper or its contents.
GAIN Working Paper Series no. 4
iii
Executive Summary
i. Introduction Dietary assessment data are essential for designing, implementing and evaluating food fortification and other food-based nutrition programs. Planners and managers must understand the validity, usefulness and cost tradeoffs of employing alternative dietary assessment methods to obtain requisite programming information, but little guidance exists for doing so.
This paper strives to fill this gap in the literature while providing practical guidance to inform programming decisions. Twenty-five semi-structured expert interviews were conducted and literature reviewed for scientific and operational information on four of the most common dietary assessment methods used in nutrition programming: Twenty-four hour recall (24HR), Food Frequency Questionnaires/Fortification Rapid Assessment Tool (FFQ/FRAT), Food Balance Sheets (FBS), and Household Consumption and Expenditure Surveys (HCES).
A conceptual framework, presented in Section 2, details the types of food consumption and nutrient intake information required at each phase of the program cycle. Sections 3-6 provide a description of each of the dietary assessment methods, their validity for measuring food consumption and nutrient intake, the resources required, and the methods’ strengths and weaknesses. In addition, Sections 3-6 detail the analytical steps necessary to use the method in addressing the information needs outlined in Section 2. Where relevant, the sections recommend options for strengthening these methods to improve the quality, availability, or use of data for decision-making. Section 7 of the paper synthesizes this information into a decision framework intended to guide the choice of among methods, given a set of information needs and resource considerations. ii. Program Information Needs A typical program cycle involves stages of needs and feasibility assessment, program design, implementation (including monitoring), and evaluation. In food fortification and other food-based nutrition programs, dietary data are used to inform each of these phases in the cycle. Dietary data are typically complemented by other types of information; for instance, the design of a fortification program also relies on data related to technical feasibility, market structure, and regulatory capacity. Monitoring a Food Fortification Program (FFP) requires tracking production, distribution, and quality control as well as regulatory and social marketing activities. Evaluating a fortification program may include the measurement of biomarkers in conjunction with dietary data to assess impact. While each of these types of information plays a critical role, this paper focuses only on dietary information needs. iii. Twenty-Four Hour Recall (24HR) The 24HR method is one of the most frequently used approaches for collecting individual-level, quantitative dietary information. A multiple pass interviewing technique is used to guide the respondent in recalling all foods consumed in the previous day, while methods such as food models, photographs, or weighing or volumetric estimation techniques are used to quantify the amounts consumed [1]. One 24HR can provide valid estimates of the mean usual food and nutrient intake for a group but not for individuals. To obtain valid estimates of usual food and nutrient intakes of individuals, a second dietary recall must be performed on at least a sub-set of the sample if not the whole sample. If properly implemented, the 24HR yields a higher degree of accuracy in assessing nutrient intake than the other methods reviewed in this paper. However, the substantial costs associated with 24HR data collection on a nationally representative sample have limited its use in fortification programs. Those programs that have employed the technique have primarily used it to facilitate program design – namely, to elucidate the extent of inadequate micronutrient intakes and to complement other approaches in selecting vehicles and determining appropriate fortificant levels [2, 3].
GAIN Working Paper Series no. 4
iv
iv. Food Frequency Questionnaires (FFQ) The food frequency questionnaire (FFQ) is the most common method of measuring dietary patterns in large epidemiological studies of diet and health [4]. The method attempts to capture an individual’s usual food consumption and nutrient intake by querying the frequency with which the respondent consumed the items on a predefined food list over a period of time ranging usually from one week to a year. A semi-quantitative FFQ (SQFFQ) also asks the respondent to report the usual portion size consumed during the recall period, typically from a predefined range of portion size options. In the context of commercial fortification programming, the use of FFQs has been largely confined to applications of the Fortification Rapid Assessment Tool, or FRAT. The FRAT, developed in the 1990’s by HealthBridge (formerly PATH Canada), under contract to the Micronutrient Initiative, is a method created specifically for the purpose of identifying food vehicles for fortification and for setting appropriate and safe fortificant levels [5]. The FRAT is a hybrid of a food-frequency questionnaire and a 24HR that seeks to measure consumption of a small set of “potentially fortifiable foods.” The FRAT also collects additional data to complement consumption information – data related to processing and storage, constraints in obtaining/consuming the product, and product availability in the market. The FRAT (and other FFQs) can be readily tailored to fulfill context-specific information needs, e.g. by including locally relevant brand names of products made with fortifiable commodities. As the FRAT does not involve the additional analytical step of transforming foods into their nutrient constituents, the data are relatively simple to analyze. The FRAT (as well as other FFQs), typically measures consumption over at least a one-week period, thereby providing a better picture of “usual consumption” than a single 24HR.While the FRAT is a useful method for informing program design and for assessing coverage, FRAT data cannot be used to quantify total nutrient intake or the total intake of a particular nutrient for the purposes of setting fortificant levels or evaluating program-related changes in nutrient intake, as the method does not collect information on the full range of foods that contribute to total intake or to that of a specific nutrient. On the other hand, SQFFQs can be designed to quantify nutrient intake for the purposes described above. However, the data yielded are not as accurate as those generated by a 24HR, as questions on usual frequency of intake and usual portion size are cognitively challenging for respondents to answer and are thus prone to measurement error. Developing and validating an SQFFQ also requires substantial up-front investment of resources. v. Household Consumption and Expenditure Surveys (HCES) Household Consumption and Expenditure Surveys (HCES) are multi-component surveys conducted on a nationally representative sample to characterize important aspects of household socio-economic conditions. The results of such surveys have wide-ranging utility; however their primary purpose is to provide information for poverty monitoring, the calculation of national accounts, and the construction of the consumer price index [6].The food data collected in HCES can be analyzed to produce a variety of indicators that are valuable for food fortification feasibility assessment and design, and for this reason the approach merits the increased attention it has received recently within the nutrition community [7-9]. An enormous advantage of HCES is that they are available as secondary data, saving nutrition programmers the cost of implementing a national level survey. Another advantage of HCES is that the data enable the distinction of whether foods that are being consumed were purchased (rather than home-produced).Information on food purchases is quite relevant to commercial fortification programs, given their reliance on the market as their distribution mechanism. Like the FFQ, most HCES have a recall period of a week or more, making the method suitable for assessing typical consumption patterns (though seasonality remains an issue). HECS data can be disaggregated in useful ways; the surveys typically have accompanying modules that can be used to examine the results by income level, geographic location, gender of household head and other household characteristics. These features of the HCES make it suitable for modelling potential reach and coverage and for estimating likely benefit based on apparent consumption levels. At the same time, since HCES are used as secondary data, nutrition program analysts are limited by the food lists that were included in the survey. Key potentially fortifiable food items may be excluded from the list or may not be specified in a disaggregated format that allows them to be distinguished. Influencing the design of future HCES to incorporate relatively simple modifications holds great
GAIN Working Paper Series no. 4
v
potential for making the method more “fortification” and “nutrition”-friendly. While the 24HR and FFQ collect individual-level data, the HCES collects data at the household level, requiring the analyst to make assumptions about consumption by individual members. For this reason, the HCES method is not as well-suited as the other two methods for estimating individual nutrient intakes for the purposes of setting fortificant levels or obtaining a baseline intake estimate. The question of how best to approximate individual consumption from household data is an area that requires further research. vi. Food Balance Sheets Developed by the Food and Agriculture Organization (FAO) of the United Nations, food balance sheets (FBS) – also referred to as national food accounts, supply/utilization accounts, food disappearance data, and food consumption level estimates – are the most commonly used data sources for estimating information on “patterns, levels and trends of national diets” [10, p.13]. Production data are a key input into the FBS. If current FBS data are unavailable, food production data are sometimes obtained in order to inform the design of food fortification programs in much the same way FBS data are used. FBS data report food that is ‘apparently available’ for consumption at the national level. They do not directly measure individual food consumption or how food or nutrients are distributed within the population. Due to the low-cost and high accessibility of FBS data they have historically been the main data source used to meet food fortification program design-related information needs. They have appealed to food fortification program specialists because of their affordability, accessibility, and ability to illustrate long-term trends in the national food supply. To a certain degree, FBS data can inform the design of food fortification programs by suggesting which macro- and micronutrient deficiencies might be common in the population due to shortfalls in nutrient availability and can be used to infer the extent of these nutrient gaps, on an aggregate level, while also providing data on potentially fortifiable or already fortified foods. However, compared to the other three dietary assessment methods examined in this review, FBS data are the least suitable for meeting most of the program information needs of food fortification and other food-based micronutrient programs. Their ability to identify potentially fortifiable or already fortified foods is constrained by the fact that the data are limited to primary commodities and minimally processed foods and therefore do not capture more highly processed potential vehicles or distinguish the proportion of potentially fortifiable foods consumed that are purchased. FBS data cannot be used for making coverage projections, as they contain no information about target population consumption. FBS data are also not very useful for program monitoring as there are often lengthy delays in updating annual FBS figures, and they cannot be used to estimate individual intakes as part of setting fortificant levels or evaluating changes due to the program. vii. Discussion and Conclusions The considerations of validity, usefulness, and cost of the four methods can be distilled into guidance for choosing dietary assessment methods that are suitable for program life-cycle specific decisions. Assuming a realistic resource endowment, typically, though not always, one would select a method meeting at least moderate standards of validity and usefulness for the purpose and requiring moderate to low levels of resources. Needs Assessment: Needs assessment data are used to identify micronutrients that are lacking in the diet and to compare results across geographic and socioeconomic strata to prioritize target groups at relatively higher risk. For prioritizing which micronutrients and subgroups require public intervention in a given context, the HCES method offers moderate validity at the lowest cost for estimating the risk of inadequate intakes, though the results are less valid than those yielded by a 24HR or (SQ) FFQ for this purpose. Since data at this stage will not be used for more specific information such as setting fortificant levels or estimating effective or excessive coverage, implementing a more intensive survey such as a 24HR is likely not necessary. Feasibility Assessment and Program Design: As above, the HCES strikes the best balance among validity, usefulness and cost considerations for designing fortification programs – to identify vehicles and as a tool for projecting coverage and modelling potential impact.

GAIN Working Paper Series no. 4
vi
Program Baseline: The 24HR is the most valid but also the most costly method for estimating nutrient intakes. However, every effort should be made to conduct a 24HR as part of the baseline survey – at least on a representative subsample, to confirm estimates of nutrient intake by HCES and to serve as the starting point against which all program progress will be assessed. At this stage, accurate estimates of food and nutrient intake are required in order to calculate the average gap in the estimated average micronutrient requirement (EAR) that needs to be overcome, to estimate the prevalence of “excessive coverage” (those at risk for exceeding the upper level (UL) of micronutrient intake), and to fine-tune fortificant levels. The 24HR is best equipped for these purposes. Program Monitoring: Tracking reach and coverage could be handled by a brief FFQ/FRAT that focuses only on the consumption of the food vehicle and associated products. Highly valid for this purpose, this type of short and focused instrument would be less expensive than a 24HR or a full-blown SQFFQ and, unlike the secondary data methods, can be integrated when needed into a coverage survey. Monitoring effective and excessive coverage requires more highly quantified information on nutrient intakes, including from food other than the fortificant vehicle, and thus would require a SQFFQ or 24HR to yield at least moderately valid results. Impact Evaluation: Assessing impact should entail re-administering the baseline assessment of nutrient intake using a 24HR method, in association with the collection of biomarkers where feasible and appropriate. Whereas the biomarkers would be used to assess changes in deficiency status, the 24HR data would be useful for attributing changes in deficiency to increased nutrient intakes via fortified foods, holding constant intake of other sources of the nutrient. Five overarching conclusions emerge from this review. 1) None of the dietary assessment methods discussed here is a perfect gold standard. Each one
has strengths and weaknesses that vary according to the specific purpose to which it is applied. 2) Because some methods are better suited for particular applications than others, the methods
should be used complementarily to answer different, but related, questions and to triangulate results.
3) Method selection should be driven by its validity and usefulness for a given purpose, but resource requirement considerations are also unavoidable. There are trade-offs between the degree of validity of a method for a particular purpose and its cost.
4) Understanding the sources of potential bias and error introduced by a particular methodological choice is important for making a selection and interpreting the results.
5) Many of the weaknesses identified in this paper are not immutable. Simple modifications to the way that data are collected or processed, or just a few additions to a questionnaire, can further strengthen these methods and their results for use in micronutrient programming (see [7] for HCES-related suggestions).

GAIN Working Paper Series no. 4
vii
Acknowledgements
We would like to extend our utmost appreciation to the following individuals, as well as two anonymous key informants, who generously shared their time, expertise, and invaluable insights into the practical considerations of using dietary assessment methods in relation to food fortification and other food-based nutrition programs. Name Affiliated Organization • Isabelle Aeberli St. John’s Research Institute • Maria Andersson Swiss Federal Institute of Technology • Jack Bagriansky Fortification Consultant • Peter Berti Healthbridge • Odilia Bermudez Tufts University • Omar Dary AED/A2Z • Reina Engle-Stone University of California Davis • John Fiedler HarvestPlus • Celia Greenberg Medical Research Council (UK) • Quentin Johnson Quican Inc. • Keith Lividini HarvestPlus • Janneke Jorgensen World Bank • Arnaud Laillou GAIN • Alison Lennox Medical Research Council (UK) • Chessa Lutter PAHO • Barbara Macdonald GAIN • Yves Martin-Prével L'Institut de Recherche pour le Développement (France) • Mourad Moursi IFPRI • Lynnette Neufeld Micronutrient Initiative • Juan Pablo Pena-Rosas World Health Organization • Ellen Piwoz Bill and Melinda Gates Foundation • Fabian Rohner Consultant to GAIN • Shelly Sundberg Bill and Melinda Gates Foundation We are particularly grateful to the following individuals who generously reviewed draft versions of this paper. Their critical insights and thoughtful commentary invaluably strengthened the final product. Any remaining omissions or errors are the sole responsibility of the authors. • Grant Aaron GAIN • Peter Berti Healthbridge • Christine Clewes Consultant to GAIN • Rosalind Gibson University of Otago (New Zealand) • Arnaud Laillou GAIN • Barbara Macdonald GAIN • Lisa Smith TANGO
GAIN Working Paper Series no. 4
viii
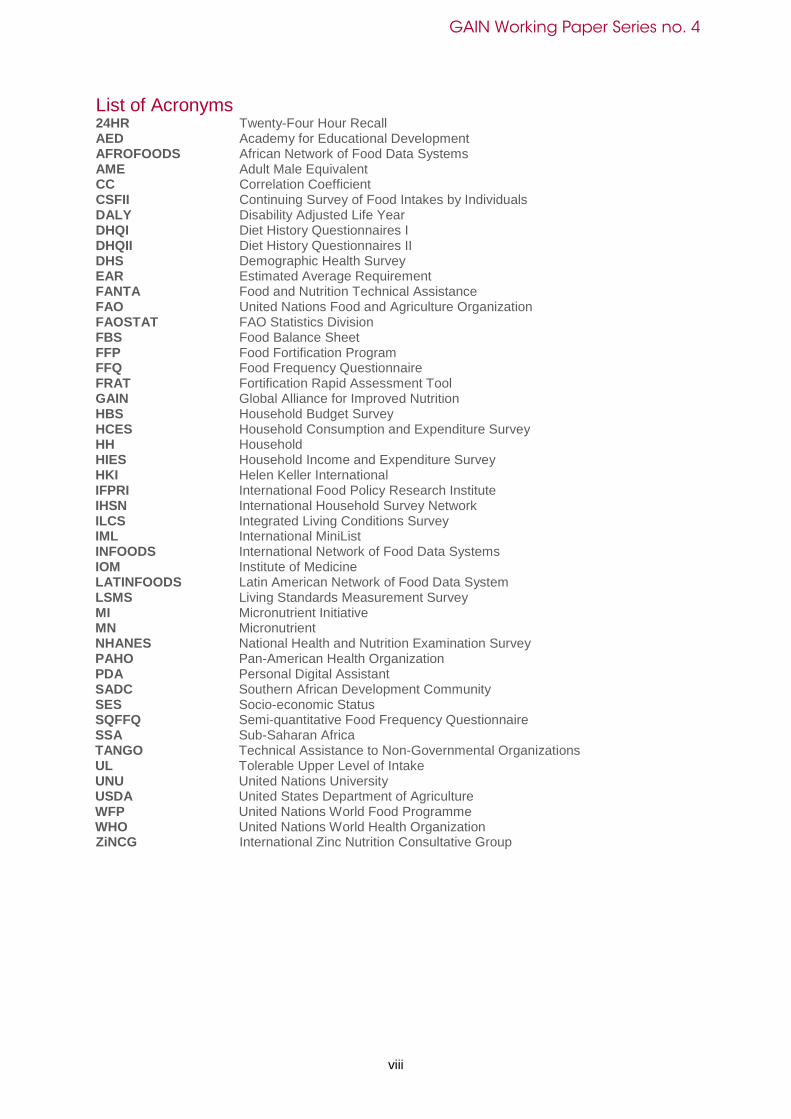
List of Acronyms 24HR Twenty-Four Hour Recall AED Academy for Educational Development AFROFOODS African Network of Food Data Systems AME Adult Male Equivalent CC Correlation Coefficient CSFII Continuing Survey of Food Intakes by Individuals DALY Disability Adjusted Life Year DHQI Diet History Questionnaires I DHQII Diet History Questionnaires II DHS Demographic Health Survey EAR Estimated Average Requirement FANTA Food and Nutrition Technical Assistance FAO United Nations Food and Agriculture Organization FAOSTAT FAO Statistics Division FBS Food Balance Sheet FFP Food Fortification Program FFQ Food Frequency Questionnaire FRAT Fortification Rapid Assessment Tool GAIN Global Alliance for Improved Nutrition HBS Household Budget Survey HCES Household Consumption and Expenditure Survey HH Household HIES Household Income and Expenditure Survey HKI Helen Keller International IFPRI International Food Policy Research Institute IHSN International Household Survey Network ILCS Integrated Living Conditions Survey IML International MiniList INFOODS International Network of Food Data Systems IOM Institute of Medicine LATINFOODS Latin American Network of Food Data System LSMS Living Standards Measurement Survey MI Micronutrient Initiative MN Micronutrient NHANES National Health and Nutrition Examination Survey PAHO Pan-American Health Organization PDA Personal Digital Assistant SADC Southern African Development Community SES Socio-economic Status SQFFQ Semi-quantitative Food Frequency Questionnaire SSA Sub-Saharan Africa TANGO Technical Assistance to Non-Governmental Organizations UL Tolerable Upper Level of Intake UNU United Nations University USDA United States Department of Agriculture WFP United Nations World Food Programme WHO United Nations World Health Organization ZiNCG International Zinc Nutrition Consultative Group
GAIN Working Paper Series no. 4
ix
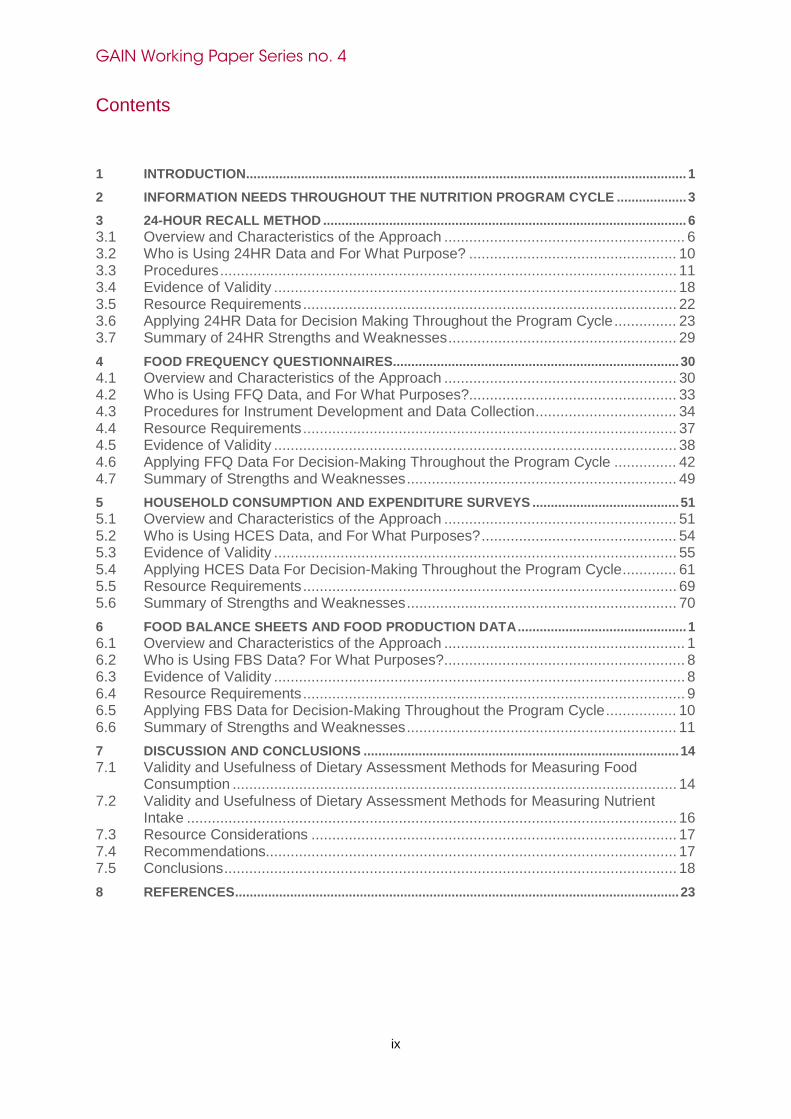
Contents 1 INTRODUCTION ........................................................................................................................ 1
2 INFORMATION NEEDS THROUGHOUT THE NUTRITION PROGRAM CYCLE ................... 3
3 24-HOUR RECALL METHOD ................................................................................................... 6 3.1 Overview and Characteristics of the Approach .......................................................... 6 3.2 Who is Using 24HR Data and For What Purpose? .................................................. 10 3.3 Procedures .............................................................................................................. 11 3.4 Evidence of Validity ................................................................................................. 18 3.5 Resource Requirements .......................................................................................... 22 3.6 Applying 24HR Data for Decision Making Throughout the Program Cycle ............... 23 3.7 Summary of 24HR Strengths and Weaknesses ....................................................... 29
4 FOOD FREQUENCY QUESTIONNAIRES.............................................................................. 30 4.1 Overview and Characteristics of the Approach ........................................................ 30 4.2 Who is Using FFQ Data, and For What Purposes?.................................................. 33 4.3 Procedures for Instrument Development and Data Collection .................................. 34 4.4 Resource Requirements .......................................................................................... 37 4.5 Evidence of Validity ................................................................................................. 38 4.6 Applying FFQ Data For Decision-Making Throughout the Program Cycle ............... 42 4.7 Summary of Strengths and Weaknesses ................................................................. 49
5 HOUSEHOLD CONSUMPTION AND EXPENDITURE SURVEYS ........................................ 51 5.1 Overview and Characteristics of the Approach ........................................................ 51 5.2 Who is Using HCES Data, and For What Purposes? ............................................... 54 5.3 Evidence of Validity ................................................................................................. 55 5.4 Applying HCES Data For Decision-Making Throughout the Program Cycle ............. 61 5.5 Resource Requirements .......................................................................................... 69 5.6 Summary of Strengths and Weaknesses ................................................................. 70
6 FOOD BALANCE SHEETS AND FOOD PRODUCTION DATA .............................................. 1 6.1 Overview and Characteristics of the Approach .......................................................... 1 6.2 Who is Using FBS Data? For What Purposes? .......................................................... 8 6.3 Evidence of Validity ................................................................................................... 8 6.4 Resource Requirements ............................................................................................ 9 6.5 Applying FBS Data for Decision-Making Throughout the Program Cycle ................. 10 6.6 Summary of Strengths and Weaknesses ................................................................. 11
7 DISCUSSION AND CONCLUSIONS ...................................................................................... 14 7.1 Validity and Usefulness of Dietary Assessment Methods for Measuring Food
Consumption ........................................................................................................... 14 7.2 Validity and Usefulness of Dietary Assessment Methods for Measuring Nutrient
Intake ...................................................................................................................... 16 7.3 Resource Considerations ........................................................................................ 17 7.4 Recommendations................................................................................................... 17 7.5 Conclusions ............................................................................................................. 18
8 REFERENCES ......................................................................................................................... 23

GAIN Working Paper Series no. 4
x
List of Tables Table 2.1 Food consumption and nutrient intake information needs throughout the program cycle ...................................................................................................................... 4 Table 3.1 Selection of methodology to measure nutrient intakes to meet four possible levels of objectives .............................................................................................................. 8 Table 3.2 Parameters for calculating the quantities of input requirements for conducting a 24 HR survey of 480 households (with no blood or food analyses) ............................. 22 Table 3.3 The cost of conducting a 24 HR survey on the 8,500 households included in an HCES survey ................................................................................................................. 23 Table 4.1 Summary of key characteristics of FFQ and FRAT .......................................... 32 Table 5.1 Summary of key characteristics of HCES ......................................................... 53 Table 6.1 FAO FBS food categories and commonly fortified and biofortified foods ........ 4 Table 7.1 Validity of dietary assessment methods for measuring food consumption, as commonly implemented .................................................................................................... 20 Table 7.2 Validity of dietary assessment methods for measuring nutrient intake, as commonly implemented .................................................................................................... 21 Table 7.3 Relative resource requirements of dietary assessment methods ................... 22

GAIN Working Paper Series no. 4
1
1 INTRODUCTION
Food consumption and dietary intake data provide essential information for informing fundamental design, monitoring, and evaluation decisions in food fortification and other food-based nutrition programs. Critical questions, related to such issues as the type and severity of nutrient deficiencies in a population, the proportion of the population consuming potentially fortifiable foods, and the proportion of the target population that achieve significant reductions in micronutrient deficiency due to an intervention, must all rely, at least in part, on information yielded by dietary intake data. The most commonly used dietary assessment methods within the context of such programs are:
• 24-hour dietary recall
• Food frequency data, including the Fortification Rapid Assessment Tool (FRAT)
• Household Consumption and Expenditure Surveys (HCES)
• Food and Agriculture Organization (FAO) food balance sheets and industrial food production data.
The data generated by these approaches vary in terms of how validly they meet information requirements at each phase of program implementation. Validity is defined as the extent to which a method captures the phenomenon it is trying to measure for a particular purpose [11, 12]. A method is “neither valid nor invalid in and of itself, but only in regard to how it is used and what interpretations are given to the scores for particular groups of people” [13, p.329]. Validity includes the concept of accuracy (i.e., criterion validity), which is the degree of closeness of a quantity to that quantity’s true value [13].
Dietary assessment methods also range widely in terms of the time, cost, and expertise required for implementation. A method’s a) validity for a particular purpose, combined with b) its resource demands, and c) other elements of usefulness, such as the timeliness of data availability (for methods using secondary data) and adaptability of instruments to different contexts, should be considered together to make judgments about d) the overall suitability of any given method for a given programmatic objective. Furthermore, as Habicht et al. [14] have pointed out, not all programmatic decisions require ‘gold standard’ data.
Program planners and managers must be able to select the most suitable dietary assessment method(s) for their objectives, while bearing in mind the degree of confidence needed in the results. Yet, the implicit assumptions, trade-offs, and practical implications of relying on one approach over another are not always evident to policy makers or program managers. As a result, food fortification and other food-based nutrition programs are commonly designed and implemented without adequate context-specific evidence to tailor the solution to the problem. Data constraints may yield delays and possibly produce sub-optimally effective program designs.

GAIN Working Paper Series no. 4
2
In order to better design and implement food fortification and other food-based nutrition programs, program planners must be able to select the most suitable dietary assessment method for the type of information required, given available resources. They should also be able to understand the sources of uncertainty, or error, introduced by a particular methodological choice, and consider options for complementing one method with another in order to minimize these limitations. While there exist reviews of some of the individual approaches noted above [7, 15-17] and of information needs for nutrition programming [18], to date there is no comprehensive, comparative analysis that considers these factors, particularly in the context of the information needed for large-scale food-based nutrition programs.
This paper strives to fill this gap in the literature and to provide practical guidance to inform programming decisions. The structure and content of the paper are guided by a conceptual framework, presented in Section 2, that details the types of food consumption and nutrient intake information required at each phase of the program cycle.
Sections 3-6 treat the four primary dietary assessment methods individually, providing a description of the method and the analytical steps necessary to use the method in addressing the information needs outlined in Section 2. In addition, each method section includes an assessment of the resources required to implement the approach and the strengths and weaknesses of the method for use in each informational application. Where relevant, the sections recommend options for strengthening these methods to improve the quality, availability, or use of data for decision-making.
Detailed information related to the four primary methods and their validity for different purposes, along with their strengths and weaknesses was derived from a review of the peer-reviewed and gray literature. As many of the operational aspects and constraints to the application of these methods are unpublished, the literature review was complemented by semi-structured interviews with 25 internationally-recognized subject matter experts who have had direct experience using, validating, and applying the results of these methods and the data they yield. The concluding chapter, Section 7, synthesizes this information into a decision framework that can be used to choose among methods, given a set of information needs and resource considerations.

GAIN Working Paper Series no. 4
3
2 INFORMATION NEEDS THROUGHOUT THE NUTRITION PROGRAM CYCLE
A typical program cycle involves phases that include needs assessment, feasibility assessment, program design, implementation, and evaluation. In food fortification and other food-based nutrition programs, food consumption information is used throughout the cycle to inform planning, implementation monitoring, and the measurement of impact.
Food consumption data are typically complemented by other types of information at each stage of the process; for instance, the design of a fortification program also requires data related to technical feasibility, market structure, and regulatory capacity. Evaluating this type of program often entails the measurement of biomarkers in conjunction with dietary data to assess impact. The selection of an appropriate method for measuring food consumption to complement this other information depends, in part, on the question(s) being asked. In order to tailor the program design to contextual realities and to ensure its relevance and effectiveness, it is important to first ask the right questions and then to select and apply data in a way that can validly inform the response.
Table 1 presents a conceptual framework identifying the most important types of food and nutrient-related information needs at each stage of the program cycle, along with the indicators most commonly used to quantify this information. Such indicators provide a critical level of specificity for choosing appropriate assessment methods. While some of these indicators are commonly used by operational agencies, others, such as “reach”, and “effective coverage” (defined in Table 2.1) are recommended variants on more familiar indicators, providing useful additional information with which to judge the successful implementation of a program.
The indicators in Table 1 can be distilled into two broad types. The first type, labelled “food consumption” is made up of those indicators that seek to capture patterns of consumption of potentially fortifiable (or currently fortified) commodities and processed foods. The general purpose of such indicators is to assess the extent to which fortification is likely to contribute, or is contributing, additional micronutrients to the diet and (sometimes) at what level, without necessarily establishing the overall nutrient gap that these added micronutrients are intended to fill. The second type, labelled “nutrient intake”, is comprised of those indicators that seek to quantify total usual intake of a micronutrient (either by individuals, in the case of estimating risk of inadequacy, or of a population, in the case of capturing mean usual intakes [1]. The second category of indicator is more demanding in terms of data requirements.

GAIN Working Paper Series no. 4
4
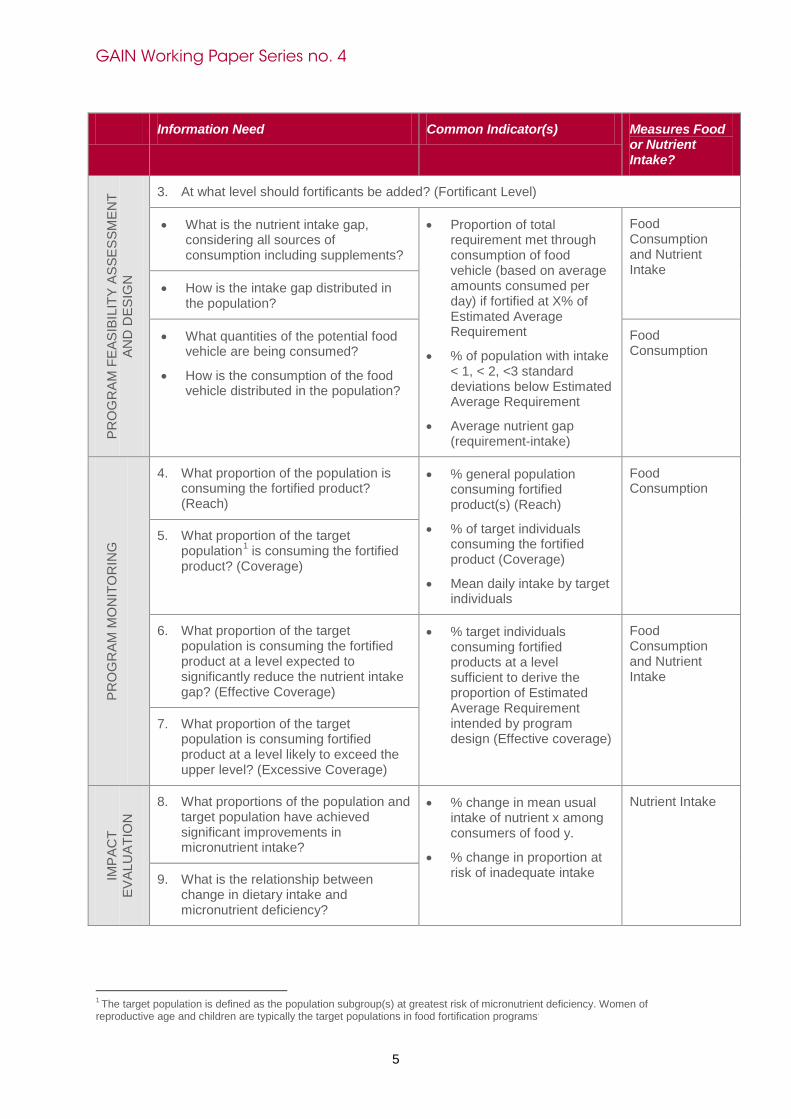
Table 2.1 Food consumption and nutrient intake information needs throughout the program cycle
Information Need Common Indicator(s) Measures Food or Nutrient Intake?
PRO
GR
AM
FE
ASIB
ILIT
Y AS
SES
SMEN
T A
ND
DES
IGN
1. Which micronutrients should be provided? (Needs Assessment)
• What proportion of the population suffers from inadequate intake of a micronutrient?
• % at risk of inadequate intake (Estimated Average Requirement cut-point method)
• % at risk of inadequate intake (full probability approach)
• % at risk of inadequate intake < 1 and < 2 standard deviations below Estimated Average Requirement.
(disaggregated by age, sex, socio-economic status, urban/rural etc.)
• Relative risk of deficiency by quintile of nutrient intake
• % change in proportion at risk of inadequate intake
Nutrient Intake
• At what levels of severity?
• How is the problem distributed in the population?
• What is the relationship of deficiency to inadequate intake?
2. Which food(s) should be fortified?(Vehicle Selection)
• What foods are being consumed regularly by large proportions of the population?
• Mean daily intake (g) per adult equivalent of food x
• % of individuals in target group consuming food x or foods made with x
Food Consumption
• What proportion of this consumption is obtained through the purchase of centrally processed foods?
• How do these consumption patterns appear to be changing over time?
• What proportion of the population purchasing these foods has inadequate intake of a micronutrient that can be added to this food vehicle?
• % of population with inadequate intake consuming food x or foods made with x
Food Consumption and Nutrient Intake
GAIN Working Paper Series no. 4
5
Information Need Common Indicator(s) Measures Food
or Nutrient Intake?
PRO
GR
AM
FE
ASIB
ILIT
Y AS
SES
SMEN
T AN
D D
ESIG
N
3. At what level should fortificants be added? (Fortificant Level)
• What is the nutrient intake gap, considering all sources of consumption including supplements?
• Proportion of total requirement met through consumption of food vehicle (based on average amounts consumed per day) if fortified at X% of Estimated Average Requirement
• % of population with intake < 1, < 2, <3 standard deviations below Estimated Average Requirement
• Average nutrient gap (requirement-intake)
Food Consumption and Nutrient Intake
• How is the intake gap distributed in the population?
• What quantities of the potential food vehicle are being consumed?
• How is the consumption of the food vehicle distributed in the population?
Food Consumption
PRO
GR
AM
MO
NIT
OR
ING
4. What proportion of the population is consuming the fortified product? (Reach)
• % general population consuming fortified product(s) (Reach)
• % of target individuals consuming the fortified product (Coverage)
• Mean daily intake by target individuals
Food Consumption
5. What proportion of the target population1 is consuming the fortified product? (Coverage)
6. What proportion of the target population is consuming the fortified product at a level expected to significantly reduce the nutrient intake gap? (Effective Coverage)
• % target individuals consuming fortified products at a level sufficient to derive the proportion of Estimated Average Requirement intended by program design (Effective coverage)
Food Consumption and Nutrient Intake
7. What proportion of the target population is consuming fortified product at a level likely to exceed the upper level? (Excessive Coverage)
IMP
ACT
EVAL
UAT
ION
8. What proportions of the population and target population have achieved significant improvements in micronutrient intake?
• % change in mean usual intake of nutrient x among consumers of food y.
• % change in proportion at risk of inadequate intake
Nutrient Intake
9. What is the relationship between change in dietary intake and micronutrient deficiency?
1 The target population is defined as the population subgroup(s) at greatest risk of micronutrient deficiency. Women of reproductive age and children are typically the target populations in food fortification programs.
GAIN Working Paper Series no. 4
6
3 24-HOUR RECALL METHOD
3.1 OVERVIEW AND CHARACTERISTICS OF THE APPROACH
The 24HR method is one of the most frequently used methods for gathering quantitative dietary information at the individual level. This approach is undertaken as part of a survey or research study, and involves an interview (conducted by an interviewer trained in interviewing techniques related to food consumption) where a respondent is asked to recall their exact food and beverage intake during the previous 24-hour period or previous day using one of several methods for quantifying the amounts consumed. Research indicates that a four stage, multiple pass interviewing technique yields the most accurate recall data [1]. The multiple pass technique “permits the respondent to follow a logical memory sequence all the way through the day, without constantly changing focus from what was consumed to how much was consumed” [19, p.9].
Gibson and Ferguson have developed a modified version of the 24HR – called an interactive 24HR – for use in collecting dietary data from rural populations in developing countries. The interactive 24HR was developed as an easier, faster, and less expensive alternative to the weighed food record [1]. Though no dietary assessment methodology can completely prevent measurement error or behaviour modification in respondents, weighed food records (also called weighed food diaries or simply weighed records) are considered “the most precise method available for estimating usual food and nutrient intakes of individuals” [20, p.45]. As a result of the high degree of accuracy that they produce, weighed food records are often used as the reference method in validation studies of other dietary assessment methods such as the 24HR (see Section 3.4). The weighed food record method requires the subject, parent, or caretaker to weigh all food and beverages at the time of consumption. Any plate waste must also be recorded. Subjects are also asked to document a description of the food as well as details on preparation methods and brand names. Though the weighed food record provides very accurate estimates of dietary intake it is highly intrusive, time-consuming, and risks distorting the behaviour of respondents. It also requires a high-degree of literacy and numeracy and is thus unsuitable for populations with low education levels. The interactive 24HR attempts to overcome some of the shortfalls of weighed food record dietary assessments. Its modifications to the traditional 24HR include “providing some group training on portion size estimation before the actual recall; supplying picture charts on the day before the recall for use as a checklist on the day the food is actually consumed and for comparison with the recall to reduce memory lapses; and providing bowls and plates for use on the recall days to help respondents visualize the amount of food consumed” [1, p.10]. The method also calls for interviewers to weigh the portion size of replicas of actual staple foods consumed by respondents.
The 24HR provides comprehensive, quantitative information on individual diets. If done appropriately, the 24HR allows the enumerator to assess such indicators as mean or median daily consumption of particular foods and micronutrients, household food preparation and cooking methods which may affect the stability or bioavailability of fortificants in fortified foods, the brand names of typical foods consumed within the household and, if at least some 24-hr recalls are repeated, the prevalence of high and low intakes of specific micronutrients. These data components can be used to inform the
GAIN Working Paper Series no. 4
7
selection of food vehicles for fortification, to determine the fortificant levels, to assess indicators such as effective coverage and excessive coverage, and to identify the magnitude of inadequate intakes as part of a program baseline or endline evaluation.
The strengths of the 24HR method are tempered by the resource requirements, which often render the use of 24HRs for programming cost-prohibitive. This section describes the key characteristics of the 24HR method. Subsequent sections discuss the procedures for conducting a 24HR survey and for processing and analyzing the data to generate useful indicators for nutrition programming. A discussion of resource requirements compares the costs of a 24HR to another method treated in this paper, the Household Consumption and Expenditure Survey (HCES).
Data Collection Modality. Data are typically collected via enumerator-administered household surveys using face-to-face interviews with a member of the target group. If a household-level 24HR is being conducted, then one member of the household will provide consumption information for each of the household members. The respondent in this case is the individual primarily responsible for food preparation, generally the mother or female head of household (typically a woman of reproductive age; 15-49 years).Data are recorded either on a paper data work sheet or with the use of personal digital assistants (PDAs), or other handheld electronic devices. If possible, it is advisable to conduct the interviews in the homes so that the actual utensils used by the respondent can be calibrated.
Definition of Food Categories. The 24HR survey asks about all foods consumed. Interviewers should have some knowledge of the locally eaten foods and their preparation methods to better ensure that all information relevant to assessing nutrient intake is captured. The 24HR survey may be adapted to the information needs of the program cycle stage in which the survey is conducted. For example, when a 24HR is conducted as part of a baseline survey for a food fortification program, particular emphasis may be placed on determining the origin of foods eaten (i.e., home-produced or purchased) that may also be potentially fortifiable products. If a large-scale commercial food fortification program is to succeed, the vehicle must be a processed food that is purchased as opposed to home produced. Section 3.6 discusses in greater detail the usefulness of 24HR in meeting the information needs of food fortification programs throughout the program cycle.
Frequency of Collection. The frequency of collection depends on whether the objective of the 24HR is to obtain dietary information at the individual or group level [21, personal communication]. Table 3.1, from Gibson (2005), describes the dietary assessment methodology and frequency of data collection one should employ depending on the specificity of dietary information desired.
GAIN Working Paper Series no. 4
8
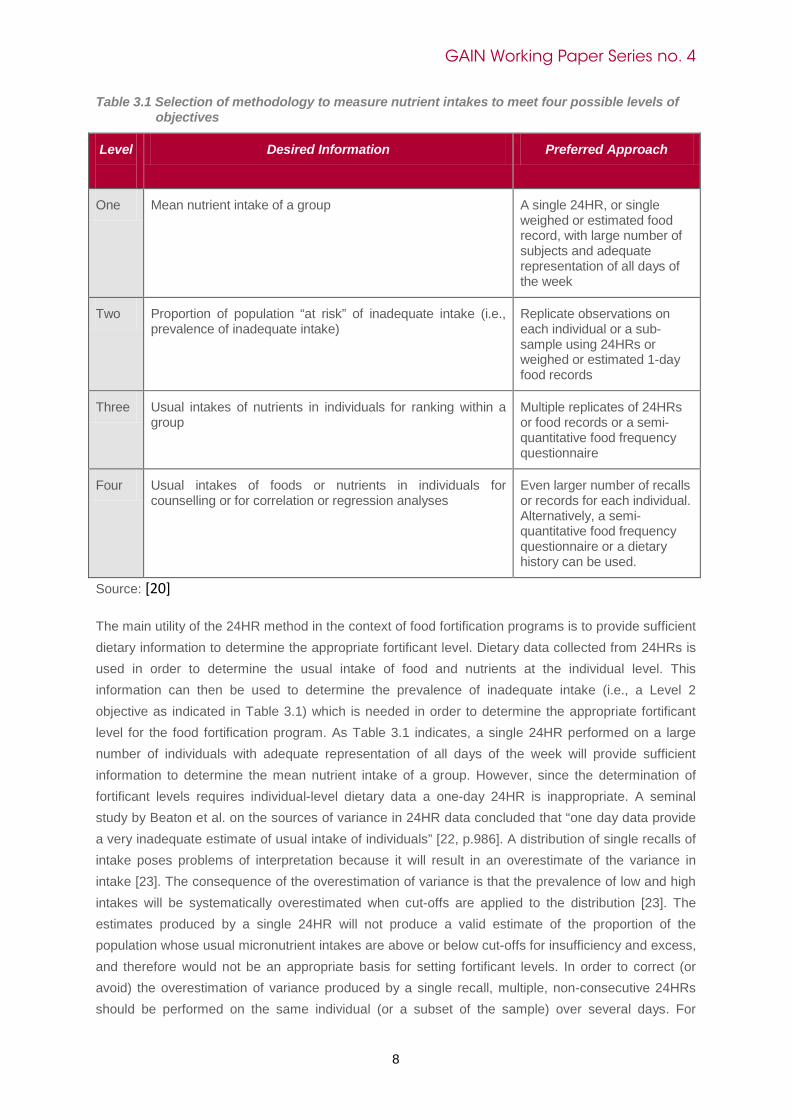
Table 3.1 Selection of methodology to measure nutrient intakes to meet four possible levels of objectives
Level
Desired Information Preferred Approach
One Mean nutrient intake of a group A single 24HR, or single weighed or estimated food record, with large number of subjects and adequate representation of all days of the week
Two Proportion of population “at risk” of inadequate intake (i.e., prevalence of inadequate intake)
Replicate observations on each individual or a sub-sample using 24HRs or weighed or estimated 1-day food records
Three Usual intakes of nutrients in individuals for ranking within a group
Multiple replicates of 24HRs or food records or a semi-quantitative food frequency questionnaire
Four Usual intakes of foods or nutrients in individuals for counselling or for correlation or regression analyses
Even larger number of recalls or records for each individual. Alternatively, a semi-quantitative food frequency questionnaire or a dietary history can be used.
Source: [20]
The main utility of the 24HR method in the context of food fortification programs is to provide sufficient dietary information to determine the appropriate fortificant level. Dietary data collected from 24HRs is used in order to determine the usual intake of food and nutrients at the individual level. This information can then be used to determine the prevalence of inadequate intake (i.e., a Level 2 objective as indicated in Table 3.1) which is needed in order to determine the appropriate fortificant level for the food fortification program. As Table 3.1 indicates, a single 24HR performed on a large number of individuals with adequate representation of all days of the week will provide sufficient information to determine the mean nutrient intake of a group. However, since the determination of fortificant levels requires individual-level dietary data a one-day 24HR is inappropriate. A seminal study by Beaton et al. on the sources of variance in 24HR data concluded that “one day data provide a very inadequate estimate of usual intake of individuals” [22, p.986]. A distribution of single recalls of intake poses problems of interpretation because it will result in an overestimate of the variance in intake [23]. The consequence of the overestimation of variance is that the prevalence of low and high intakes will be systematically overestimated when cut-offs are applied to the distribution [23]. The estimates produced by a single 24HR will not produce a valid estimate of the proportion of the population whose usual micronutrient intakes are above or below cut-offs for insufficiency and excess, and therefore would not be an appropriate basis for setting fortificant levels. In order to correct (or avoid) the overestimation of variance produced by a single recall, multiple, non-consecutive 24HRs should be performed on the same individual (or a subset of the sample) over several days. For
GAIN Working Paper Series no. 4
9
reasons of both program effectiveness and safety fortificant levels should be established on the basis of accurate estimates of the percentage of the population with inadequate or excess intake. Sometimes a “short-cut” approach is used to set fortificant levels. In this situation rough estimates of consumption (g/capita/day) are used as a basis for determining the amount of fortificant needed to provide x desired amount of the EAR.
The day on which the 24HR is collected should be randomly distributed across all 7 days of the week, to prevent biases related to differential consumption patterns on different days of the week. To capture seasonal variation in the diet one should repeat the survey in each season of interest. The effect of seasonal variation on diets can be substantial in many developing countries. For example, a 24HR study conducted in rural Kenya observed large differences in intakes of vitamin A, vitamin C, and niacin between different seasons [24]. The effect of seasonal variation can only be captured by multiple recalls that encompass different seasons.
Dietary intake patterns differ according to the day of the week (e.g. between work days and non-work days) [22, 25]. In order to ensure that estimates are valid the 24HR should be scheduled so that each day of the week is represented in the final sample of days. The interview for replicate days should be scheduled on a different day from the first interview. It is sometimes assumed that intra-individual food intake varies little in developing country settings where diets tend to be monotonous. It may be tempting to justify forgoing multiple recalls in settings such as these; however, this practice should be avoided. The assumption of low intra-individual variation in dietary intake is “not supported by evidence, and it remains critical to investigate and document the extent of intra-individual variability in each specific survey setting” [23, p.117].
Typical Sample Size Requirements. There have only been a small number of large-scale 24HR studies conducted in developing countries; most of the published 24HR studies have used a relatively small sample size that is only locally representative [7, 26]. Large-scale food fortification programs that intend to provide national coverage of fortified foods require nationally representative sample sizes. The few studies of this nature have used sample sizes of approximately 2000 households; however, independent sample size calculations should be conducted for each prospective 24HR study in order to ensure validity of estimates for the subgroups for which representativeness is required.
In food fortification programs the dietary reference value used to define the prevalence of inadequate micronutrient intakes is the Estimated Average Requirement (EAR). The EAR is defined as the average daily micronutrient intake that is estimated to meet the requirements of half of the healthy individuals in a particular life stage and gender subgroup (e.g., women of reproductive age) [27]. Whether an individual is at risk of micronutrient deficiency is dependent upon the discrepancy between their intake levels and the EAR for their age and sex category. Certain population sub-groups are particularly at risk of either inadequate or excessive micronutrient consumption. Individuals with the highest risk of deficiency are preschool-aged children and women of reproductive age in the lowest rural income group. Men in the highest urban income group face the greatest risk of excess micronutrient intake, particularly when consumption of staple foods is at issue [28]. In every scenario, it is essential that the sample provides adequate representation for these population subgroups of
GAIN Working Paper Series no. 4
10
interest. However, the final number of population subgroups of interest sampled is governed by the age-sex categories of the EARs to be used to define the prevalence of inadequate intakes. Food fortification programmers will find that even within preschool aged children for example, there are often two age groups used to define the EAR: 1-3 and 4-6 y which means it is necessary to ensure that there is adequate representation in each of these two age groups [21].
Potential for disaggregation. The 24HR method is generally applied to individuals but can be performed at the household level as well. A technical guide has been developed by The Food and Nutrition Technical Assistance (FANTA) Project for use in measuring household food consumption with a 24HR [19, 20]. During a household-level survey, the member who is responsible for the food preparation of the household (usually the mother or female head of household) is selected as the survey respondent. The interviewer asks the respondent to provide information on the composition of the household and the dietary intake of the household members during the last 24-hours.
Performing a 24HR at the household level is appropriate in situations where household members eat most of their meals inside the home, as nutrient intake will be underestimated if respondents do not report foods consumed outside the home by other members of the household. Other situations in which a household-level 24HR may be appropriate include when accurate estimates of the intake of a particular target group are not required or when the desire is to measure overall energy adequacy in the context of food security programming. The majority of studies examining the proportion of total dietary intake consumed outside of the home have been conducted in industrialized countries and have indicated that the share of overall energy contributed by food eaten outside the home is increasing [29, 30]. A handful of studies in developing countries [31-34] also suggest the proportion of daily food consumption attributed to food eaten outside the home (e.g., street food) is substantial. Dietary patterns of the study population should be taken into consideration prior to selecting a household-level 24HR over an individual survey. Cost savings involved in doing a household level survey may not justify losing critical information for the design of a micronutrient intervention.
3.2 WHO IS USING 24HR DATA AND FOR WHAT PURPOSE?
Most of the available examples of the use of the 24HR in food fortification programs have been studies conducted to assist in the design of such programs. For instance, the 24HR has been used by Helen Keller International (HKI), A2Z, the World Food Programme (WFP), and the Global Alliance for Improved Nutrition (GAIN), and country governments (South Africa, Uganda) to assess program-design consumption information needs of food fortification programs. HKI has used the method as part of the Fortification Rapid Assessment Tool (FRAT) in the design of national fortification programs in Cameroon and Mozambique. South Africa’s National Food Consumption Survey, introduced in 1999, provided dietary data on a nationally representative sample of all children aged 1-9 years in the country based on 24HRs. A large-scale 24HR as part of the 2008 Uganda Food Consumption Survey was carried out mainly under the auspices of A2Z with some aspects of the survey implemented by The World Food Program.
GAIN Working Paper Series no. 4
11
A number of key informants interviewed as part of this review agreed that the 24HR is an appropriate method to use in the evaluation of food fortification programs. To our knowledge, there have not been any studies in developing countries where 24HR data were collected for both baseline and endline assessments. There are only a few examples of the use of 24HR in evaluations of large-scale food fortification programs. The limited number of examples of the use of this method as an evaluation tool is at least partially due to the fact that few evaluations of large-scale food fortification programs have been conducted as well as to the technical and financial resources required to implement a large-scale 24HR survey.
Twenty four hour recall survey data have been used to evaluate the impact of folic acid fortification programs on folate intakes in Chile [35] and the United States [36]. In the Chilean study, a 24HR was used to assess average consumption of bread and other wheat-based products in the target population (women of reproductive age and of low socioeconomic status) to evaluate the impact of a wheat flour fortification program. The authors also calculated the mean additional supply of folate available per person after fortification and the percentage of total bread consumed that was made with fortified flour (i.e., industrially processed bread). To evaluate the impact of a national initiative to fortify flour with folic acid, the authors of the U.S. study used 24HR data from the United States Department of Agriculture’s (USDA) 1994–1996 Continuing Survey of Food Intakes by Individuals (CSFII) and the Centers for Disease Control and Prevention’s National Health and Nutrition Examination Survey III (NHANES) (1988–1994) which were the most current available national food consumption surveys at the time of the article’s publication. The 24HR data were used to calculate the change in the percentage of the overall population and subgroups that met or exceeded EARs of folate or had intakes above the tolerable upper intake level. In both cases, 24HR data were able to evaluate the proportion of the population and target population that achieved significant improvements in micronutrient intake after the introduction of a large-scale food fortification program.
Broadly speaking, the 24HRs that have been performed in low income countries have not consistently been validated prior to their use [21, personal communication] due to the resource intensiveness and potential observation bias of validating a 24HR against a weighed food record. Though the protocol for conducting the 24HR (i.e., the multiple pass technique) is the same in every setting the approaches used to estimate portion sizes are context-specific. If the 24HR method is going to be used to support food fortification programming, at any program cycle stage, careful field-testing prior to implementation is critical.
3.3 PROCEDURES
The section below details the steps involved in using the 24HR method from preparation of the instrument through processing and analysis of data. The resource requirements of each stage in the use of the method are also discussed. Gibson and Ferguson’s procedural manual An interactive 24HR for assessing the adequacy of iron and zinc intakes in developing countries [1] is the most detailed resource available on conducting a 24HR in a developing country setting, and thus their recommended procedures will be described throughout this section.
GAIN Working Paper Series no. 4
12
3.3.1 Instrument and Materials Preparation
The instruments involved in 24HR surveys include the questionnaire, lists of probes, and tools used to assist respondents in estimating portion size (set of dietary scales, cups, bowls, utensils, food models, photographs, etc.).
The first step in the instrument preparation process should be to investigate whether such instruments for that particular region already exist. The questionnaire itself is fairly context free; however, time and finances may need to be budgeted to hire a translator to translate the questionnaire into the local language or dialect, and time is required to develop appropriate probes (e.g., to know what foods are commonly consumed together)2. A 24HR baseline survey conducted by GAIN in Cote d’Ivoire was adapted from a previous survey used in the country, thereby reducing the time necessary to devote to instrument development from what would have been several weeks to just three days [37, personal communication]. Many of the key informants interviewed were able to adapt survey instruments from previously used ones, and as a result there was consensus that the instrument preparation process from adapted instruments was relatively easy, requiring neither a large amount of time nor financial resources. Food fortification programmers should be selective about using a pre-existing instrument since the results will only be as good as the amount of time invested in developing the instrument in the first place. Adapted questionnaires and other survey instruments should still be pre-tested to ensure that any modifications made to the original instrument have not hindered their utility.
Despite the relative ease of adapting survey instruments, developing the necessary materials to estimate portion size can be an enormously time consuming process3. Gibson and Ferguson give a detailed accounting of several methods that can be used to estimate portion size [1]. There are several challenges associated with portion size estimation in developing countries including “shared dishes, sequential eating, non-standard serving and eating tools, intake of items added at the table, and eating outside the home” [38, p.409]. To assist respondents in estimating portion size the interviewer should obtain or develop graduated sizes (a small, medium, and large version of the item, if appropriate) of foods or food models, respectively. If salted foods will be used then the enumerator will need to have a member of the community familiar with local dishes prepare the dish. This approach is sometimes challenging since individuals may not be eager/willing to cook if it is not meal time or if they do not have the ingredients on hand. It may also be difficult to obtain local household utensils, particularly if non-standard eating tools are used [38]. It is, however, also possible to measure quantities using the respondent’s own dishes by estimating the volume consumed in the respondent’s dish and then taking a volumetric measurement using a graduated beaker which can be converted to gram weight. Lastly, using photographs entails gathering all the relevant local foods (including some prepared dishes), taking photographs of graduated portion sizes of the items, and then printing copies of the pictures for the interviewers. If interviewers will be travelling from house to house and perhaps village to village on foot then the portion size estimation tools must not be more than one could reasonably carry. All in all this can be a very time consuming part of the research process.
2 Probes are used by interviewers to elicit detailed descriptions of foods and beverages consumed by respondents. Gibson and Ferguson (2008) provide a list of probes useful in attaining detailed information from respondents
3 See Section 3.3.4. for more information on the development of portion size estimation tools.

GAIN Working Paper Series no. 4
13
Developing the tools necessary to estimate portion size is only one part of a multi-step process in collecting quantitative estimates of food and nutrient intake. In order to attain quantitative information in grams on food intake the household measures must be converted into gram-weight equivalents. Most countries do not have data on gram-weight equivalents of portion size estimates so these data usually have to be generated from scratch, which is extremely time-consuming and expensive. Gibson and Ferguson [1] outline a number of methods that can be used to convert portion size estimates into gram-weight equivalents. One approach is to use direct weighing. In this case, the interviewer asks the respondent to serve themselves (preferably using their own dishes) an amount of food or salted replica equivalent to the amount consumed. After accounting for any food leftover, the final amount is weighed using dietary scales and recorded in grams. Alternatively, the interviewer could convert household measures used to estimate portion size (e.g., bowls, cups, etc.) into weight equivalents by weighing an equivalent amount of each food or beverage and recording the weight in grams. This technique requires that the researcher record five to ten measurements for each food item in order to attain an average household measure weight-equivalent conversion factor for a specific food item. For example, if a household cup is used to estimate the portion of cooked rice consumed then five to ten weighed measurements of one cup of rice should be recorded and subsequently averaged in order to attain the average weight (g) of one cup of rice.
Another means of attaining gram-weight equivalents is to convert the monetary value of a purchased food item into weight equivalents. This process is enormously time consuming because it requires that the researcher visit multiple local vendors and purchase and then weigh a range of samples of the foods, meals, or pre-packaged foods that represent a single monetary value or a range of monetary values. The number of samples purchased depends on the range in portion sizes sold; wide variability requires that a larger number of purchases be sampled in order to attain an estimate of average weight (g). Non-standardized portion sizes and frequently changing prices are two factors which can reduce the accuracy of weight equivalent estimates derived from this approach.
Other means of acquiring gram weight equivalents discussed by Gibson and Ferguson include using volume equivalents, linear dimensions, and clay or play dough food models. The authors also discuss how to attain gram weight equivalents for irregular shaped foods, cooked vs. raw food, and mixed recipes. Whatever method employed, food fortification programmers must budget substantial time and money for the process of converting portion size estimates into gram weight equivalents since this information will generally not be available.
Once the field tools have been developed and the questionnaire is translated, it must be pre-tested. The goals of pre-testing a questionnaire are to identify any potential problems, ensure that the survey questions are well understood by respondents and worded in a way that addresses sensitivities appropriately, and to address more practical concerns such as ensuring that the worksheet provides enough space for interviewers to record answers and that the interview is not too long [1]. Gibson and Ferguson provide more information about the steps involved in instrument preparation including fostering community participation and obtaining ethical approval and informed consent [1].

GAIN Working Paper Series no. 4
14
3.3.2 Training
In order to conduct the 24HR it is necessary to recruit interviewers and field supervisors. Gibson and Ferguson provide a list of traits that survey coordinators should look for when selecting interviewers and field supervisors and a thorough description of their job responsibilities [1]. Briefly, field supervisors and interviewers should have a strong familiarity with the foods, sensitivities, customs, and language of the study population. Previous field experience is usually a prerequisite. Female interviewers are preferred since respondents often feel that it is more appropriate to speak to a woman about food, and they are most likely to have knowledge of local foods and preparation methods [1].
The costs associated with hiring field staff are dependent upon the number of field personnel required to conduct the survey. The number of interviewers hired is influenced by a number of factors including the number of households in the sample, the size of the geographic coverage of the survey, the number of recalls required per respondent, the length of time available for data collection, and other factors [1]. It should also be noted that adding interviewers introduces inter-interviewer variability, which may reduce data reliability [39, personal communication]. The use of a computerized interviewing technique can, however, help to reduce interviewer biases by standardizing the interview protocol among interviewers [21, personal communication]. Usually one field supervisor is hired to oversee four or five interviewers. The length of the training period will depend on the skill and experience level of the interviewers. Gibson and Ferguson recommend that a minimum of seven days be devoted to training the field staff [1]. The authors’ manual on conducting interactive 24HRs includes a suggested 7-day training schedule [1].
3.3.3 Developing a Sampling Frame
The time required to develop an appropriate sampling frame can also be significant. Depending on the population of interest, census enumeration districts are often used as an area-based sampling frame. Alternatively, a list of communities in the geographic area of interest may be used. Once the primary sampling units have been selected, they often must be mapped in order to provide a basis for selecting individual households. Mapping requires in-person travel to the selected areas and therefore time must be budgeted for completing the mapping process. Shortcut methods such as choosing a random starting point and selecting every nth house in a particular direction are often used in area-based sampling to save time.
3.3.4 Data Collection
Gibson and Ferguson provide detailed information on the multiple pass approach to collecting 24HR data [1]. Briefly, the four passes utilized during an interview are as follows:
First Pass: The interviewer should begin the interview by asking the respondent whether the previous day was “typical” for the household. If the day before was unusual – e.g., a special occasion such as a funeral or feast, or if a large number of household members were absent – the interview should be rescheduled to another day. If this is not possible, another household should be interviewed instead rather than conduct the interview using an earlier day in the week [19]. The interviewer then proceeds
GAIN Working Paper Series no. 4
15
with the interview. In the first pass of the 24HR the interviewer obtains a list of all foods and drinks consumed (including water, snacks, and foods eaten away from home) from the time the respondent awoke until he/she went to bed the day before.
Second Pass: During the second pass the interviewer goes over in chronological order the list of foods and beverages obtained during the first pass. He or she will also ask for more specific descriptions of the items listed such as cooking methods or brand names of products. Gibson and Ferguson [1] provide examples of standardized probes that can be used to improve the accuracy and completeness of information obtained during the second pass.
Third Pass: The third pass is the most challenging and critical stage of the 24HR interview. During the third pass respondents are asked to estimate the portion sizes of foods and beverages consumed. A number of strategies can be employed to help respondents estimate portion sizes, including providing actual foods or salted replicas, or foods that can be used as models (such as rice for massed quantities and water for liquids), local household utensils (cups, bowls, spoons), graduated portion-size photographs of foods, or food models to help respondents identify the portion size of food consumed. The interviewers may also provide modelling clay or play dough that respondents can mould into the portion size of the food consumed. The clay model is then immersed in water, and the volume of water displaced can then be converted into grams of the food. Information on ingredients of homemade dishes is also recorded during the third pass. If the respondent cannot provide the recipe, standard recipes can be sought from key informants, or recipe data can be constructed via observation and recording of local cooking practices that use local ingredients.
Fourth Pass: During the final pass the interviewer reviews the detail of the recall to ensure that all items, including any use of vitamin and mineral supplements, are correctly recorded.
All four passes must be utilized each time a 24HR is repeated.
3.3.5 Data Processing
Once the data collection period is complete (i.e., all 24HR surveys have been conducted) the next step is to convert the food consumption data that has been collected into energy and nutrient data. Food composition databases or food composition tables and recipe conversions are needed in order to calculate both macronutrient (carbohydrate, protein, and fat) and micronutrient (vitamins and minerals) content of foods and beverages recorded during the 24HR.
Food composition databases are used to convert recipe ingredients and individual foods consumed into nutrient data. Food composition databases are “the foundation for all calculations of nutrient intakes derived from dietary surveys” [20, p.69]. Ideally they should represent the average composition of a particular foodstuff on a year-round nationwide basis [1]. Food composition tables are just printed versions of the same information provided in computer-based food composition databases. Food composition databases may be composed of foods consumed within a single country, or may include regional or even multi-regional data. Usually the nutrient composition values of foods are expressed in terms of nutrient content per 100 grams (or per common household measure) of the edible portion of the food [20]. Some databases also contain information on
GAIN Working Paper Series no. 4
16
components of foods known to inhibit bioavailability of nutrients such as phytates and dietary fibre as well as more descriptive components such as water content and pH level.
The USDA maintains a large, comprehensive, and frequently updated database of nutrient and non-nutrient dietary components called “USDA National Nutrient Database for Standard Reference” [40]. Though the database is based on foods found in a typical American diet nutrition researchers may find it useful to refer to it for nutrient information on foods that are more global in nature (cereals, oils, etc.).4
Perhaps more relevant to food fortification practitioners working in less developed countries is The International Network of Food Data Systems (INFOODS). INFOODS was developed by the United Nations University (UNU) in 1984 to respond to the need for standardized, high quality food composition databases throughout the world [1, 41]. In 1990 the Food and Agriculture Organization (FAO) partnered with UNU in its efforts to promote INFOODS and since 1999 FAO has served as its coordinator. The goal of INFOODS is “to stimulate and coordinate efforts to improve the quality and worldwide availability of food analysis data and to ensure that anyone anywhere would be able to obtain adequate and reliable food composition data” [41]5. Since its inception INFOODS has developed software for the electronic storage of food composition data and interchange among databases as well as standards and guidelines for the collection, compilation, and reporting of food component data. It is also coordinates a global network of regional food composition data centers and acts as a general and specific resource for persons and organizations interested in food composition data.
A valuable resource for nutritionists is WorldFood 2 Dietary Assessment System, an international dietary assessment system developed by Dr. Doris Calloway and Dr. Suzanne Murphy at the University of California at Berkley to respond to the lack of context-specific food composition data in developing countries [42]. WorldFood 2 is a comprehensive, high-quality food composition database that contains values for 48 nutrients and associated dietary components such as absorption inhibitors for eighteen hundred foods consumed in Egypt, Kenya, Mexico, Senegal, India, and Indonesia. Nutritionists are encouraged to augment the WorldFood 2 Dietary Assessment System with external nutrient values on specific foods that are not found in the database. An overview of how to augment existing food composition databases with additional data is described by Gibson and Ferguson [1].
Despite the strides that have been made in this area, users will find that food composition databases can vary significantly in quality. A 1997 article by Scrimshaw identified wide variability in the databases’ comprehensiveness, size, reference units used to express portion size and nutrient content, and the source and reliability of the values for the food components listed [43]. More recently, the 9th International Food Data Conference, held in September 2011 in Norwich, United Kingdom, identified key challenges to the advancement of INFOODS’ agenda. Dr. Hettie Schönfeldt, Scientific Advisor to AFROFOODS, the African network of regional food composition data systems, and Dr. Adriana Blanco Metzler, president of LATINFOODS, the network of food composition data systems in
4 Users can access the most recent version of the USDA’s food composition database at the following web address: http://www.ars.usda.gov/Services/docs.htm?docid=8964. 5 More information about INFOODS can be found on the Food and Agriculture Organization (FAO) website: http://www.fao.org/infoods/index_en.stm.

GAIN Working Paper Series no. 4
17
Latin America, identified similar challenges in their presentations [44, 45]. Data quality and availability including the need to update data was identified as a key area for improvement. As the development of food composition databases is complex and time-consuming, they are not regularly updated and thus often contain inadequate dietary information. Many key informants interviewed as part of this review expressed frustration over the poor quality of food composition databases in many developing countries. The absence of information on local foods was cited by key informants as one of the greatest challenges in working with food composition databases. Further challenges highlighted by Schönfeldt and Blanco Metzler were the need for establishment and implementation of database software; funding constraints; and enhancing national capacities for generating, compiling, and using high-quality food composition data. Schönfeldt argued that governments are under increasing global pressure to recognize the important role of food composition data due to enhanced understanding of the link between healthy lifestyles and less burdened health care systems. The prospects for overcoming these challenges may therefore be promising.
Dr. Rosalind Gibson notes that, in many circumstances, food composition tables simply do not exist that contain complete composition data for all foods mentioned in a 24HR survey [21, personal communication]. It is therefore incumbent upon the researcher or food fortification program specialist to either compile a food composition table themselves or (if possible) augment an existing one with data from other sources. This is an immensely time consuming and expensive process. Thankfully there is quite an extensive literature available on how to complete this stage of the 24HR. The INFOODS website contains several publications which would be of use to individuals attempting to translate information on food intake into nutrient values [41]. Rand et al. have written a manual called “Compiling data for food composition databases” which provides a thorough overview of how to compile a food composition database for those unfamiliar with the process [46].Users may also wish to consult Greenfield and Southgate’s guidelines on the production, management, and use of food composition data [47].
Gibson and Ferguson’s guide to conducting an interactive 24HR devotes an entire chapter to how to compile a local food composition table [1]. There are essentially four major ways in which food composition data are derived from food intake data. The four approaches to obtaining food composition data are listed below. Gibson and Ferguson [1], Murphy et al. [48] and Rand et al. [46] address these approaches in greater detail.
• Direct chemical analysis of locally collected foods
• Use of ‘best estimates’ from other food composition tables and published literature
• Estimation of missing values by substituting with data on similar foods
• Calculation of nutrient values of mixed dishes via conversion of recipe information to nutrient data.
Each of these methods is incredibly time and resource-intensive. For example, many factors need to be considered to convert recipe ingredient information into nutrient data. The difficulty of this task depends on the number of ingredients in the dish, the availability of nutrient information of the

GAIN Working Paper Series no. 4
18
ingredients, and the preparation and cooking methods of the dish. Cooking-related changes in volume or weight (i.e., yield factors) and nutrient content (i.e., retention factors), both need to be considered; however, this information is often unavailable. Some countries’ food composition tables only have information available on raw foods which requires that the information be converted to cooked foods via application of retention and yield factors [21, personal communication]. The USDA maintains a database of yield and retention factors which may be of use to those conducting a 24HR in a country with limited food composition data [40].
3.4 EVIDENCE OF VALIDITY
Criterion validity is established by comparing the results of the test method to a gold standard, or reference method. The reference method in 24HR validation literature is typically a weighed food record. There are two basic challenges to assuring the valid measurement of habitual food consumption: attaining accurate estimates of a subjects’ usual food intake and converting this information to nutrient and energy intake [49]. In the case of 24HRs, there is a trade-off between accuracy of measurement and the measurement of habitual diet: any one day can be measured with reasonable accuracy, but may not be a valid representation of ‘usual’ consumption. All dietary assessment approaches are vulnerable to both random (non-systematic) and biased (systematic) errors. Some of this measurement error, like that which derives from improper sampling, is not specific to 24HR but are relevant to all survey-based dietary assessment methods. The most common errors that affect the accuracy and validity of 24HR data are presented below.
3.4.1 Biases in the 24HR Method
Biases are essentially tendencies to under- or over-report intakes of foods or nutrients. One form of bias common to all methods that rely on subject memory (including the FFQ and the recall form of the HCES) is recall bias, which is the tendency for recalled intakes to be under- or over-reported depending on what the respondent remembers. The 24HR data are less accurate when performed on populations whose memory skills may be less reliable such as the elderly and young children (i.e., less than eight years old) [20]. Children between the ages of four and eight years old should be interviewed with their primary caretaker to ensure that foods eaten outside the home are reported [1, 50]. Inaccurate portion size estimation may also result from a failure to recall the amount consumed. Recall errors can manifest themselves as failing to report items due to faulty memory or the inclusions of items eaten outside of the recall reference period. Sweets, savory snacks, and alcoholic and non-alcoholic beverages (coffee, milk, soda, etc.) have been identified as items most often forgotten by 24HR respondents [51, 52]. To improve the accuracy of recalled intakes, the USDA has developed a multiple-pass 24HR that includes an extra layer of questions that deals exclusively with probes relating to forgotten foods [53]. This method is considered valid for assessing dietary intake in both adult females [54] and adult males [55].
Another form of bias known to influence results collected via 24HRs is the social approval or normative bias (also referred to as response bias) which is the tendency for subjects to provide answers they think are desirable, or that the interviewer wants to hear as opposed to answers that

GAIN Working Paper Series no. 4
19
represent their true beliefs or behavior. The available evidence suggests that there is a general bias towards under-reporting total energy intakes [56, 57] and that under-reporting is more pronounced among those with a high body mass index (BMI) [57]. Studies in industrialized nations indicate a tendency to under-report intake of foods considered ‘bad for health’ [49, 58] such as sugary and high carbohydrate foods [59] and over-report those considered healthy such as fruit and vegetables [60]. It is unclear how strongly a food’s perceived healthiness affects self-reports of dietary intake among populations in developing countries. It has been documented in at least one country (Jamaica) [61].
Social approval bias manifests itself differently in developing countries due to differences in culture and attitudes toward food. Kigutha’s research on assessment of dietary intake in rural communities in Africa [24] cautions nutritionists to be aware of the reluctance of some subjects to report the consumption of foods considered to be of low social status such as cereals and vegetables [1]. Though foods considered “low status” may sometimes be of poor micronutrient quality, knowledge of their intakes is important since such foods (for example, whole grains) are frequently high in phytates, which affect the bioavailability of micronutrients of interest to food fortification programmers (e.g., iron and zinc). Some vegetables and fruits that are high in micronutrients may also be considered low status, or only appropriate for children, and therefore are under-reported. Foods that convey high social status such as meat and refined carbohydrates may be over-reported [1]. Alcohol and tobacco use may be omitted from reports due to religious and cultural norms disapproving of their use [1]. Dietary data collected via FFQs and HCES, which also rely on self-reporting, can also be affected by social approval bias. Training interviewers to be warm but neutral and non-judgmental in their interactions with respondents, along with emphasizing the confidentiality of responses, may be helpful in addressing this bias. Thorough training of interviewers is also critical in order to avoid interviewer bias – the tendency for interviewers to distort results by asking leading questions or skipping questions, making assumptions about consumption, or reacting positively or negatively to a subject’s report.
3.4.2 Non-systematic Errors
No dietary assessment method is immune to non-systematic (also called random errors) because such errors are always introduced, to some degree, when measurements are taken. Random errors may be introduced to any of the methods discussed in this report when food composition databases are used to calculate nutrient composition. Food composition databases provide the mean nutrient value in a given food item on a year-round, nation-wide basis (provided the food items for analysis have been sampled correctly). The true nutrient value of a food item reported during a 24HR may be greater or lower than the value indicated for the same item and of the same size in a food composition database, due to factors such as variations in soil nutrient content and nutritional variations among varietals. Though less predictable than systematic errors random errors are easier to mitigate; they are most commonly corrected for by repeating measurements and averaging results. In the case of the 24HR, ensuring that estimates are representative of usual intakes is best accomplished by performing repeated recalls on different days of the week.
GAIN Working Paper Series no. 4
20
3.4.3 Accuracy of Nutrient Intake Data
There have been mixed findings regarding the ability of 24HR to accurately assess nutrient intakes in studies conducted in developing countries, depending on whether the objective has been to examine nutrient intakes at the group or individual level.
Strong agreement between recalled and actual nutrient intakes was observed by Kigutha in research conducted in rural Kenya [24]. Kigutha compared dietary intake data collected via repeat 24HRs with data collected via weighed food records over the course of six days and during three different seasons [24]. Among preschool children in the Kigutha study, there was agreement between intakes of energy, protein, fat, vitamin A, thiamine, riboflavin, and niacin measured by the two methods [24]. The 24HR tended to overestimate intakes of calcium, iron, and vitamin C during all three seasons, though these results were not statistically significant (p>0.05). The Kigutha study found no significant differences in nutrient intakes of elderly persons measured by 24HR and those measured by weighed food records.
The relative validity of the interactive 24HR was tested in a population of sixty pregnant women in rural Malawi [62]. There was comparable agreement between the estimates of average iron and zinc intake provided by the interactive 24HR (i.e., test method) and those assessed using weighed food records (i.e., the reference method). The estimates of proportion of women at risk of inadequate intakes of zinc and iron were also comparable between the test and reference method. When dietary variables of zinc and iron were collected with an interactive 24HR and validated against biochemical markers for these nutrients in a population of rural Malawian women, results indicated significant associations between the two measures [1, 63]. It was therefore determined that the use of the interactive 24HR in this group of rural Malawian women provided valid estimates of the amounts of dietary iron and zinc available for absorption.
The results of a validation study by Soares et al. [64] were less consistent than those observed by Kigutha. In this study healthy Indian adult males6 (N=8), aged 18-24, were provided with meals for three consecutive days, and 24HRs were conducted the day following consumption. There was a significant overestimation in energy and protein recall on the second day of measurement. The authors also observed a treatment effect: the subjects’ ability to recall their nutrient and energy intake improved over the course of the three days of measurement. Two 24HRs and two 24-hour estimated records (i.e., food diaries) were conducted after the subjects returned to their former diets. No differences in energy or nutrient intakes were observed between the two methods7. The validation of 24HR in this study is somewhat weakened by its small sample size and the observation of a treatment effect.
Two additional validation studies undertaken in developing countries support the idea that the validity of 24HR is dependent upon the nutrient in question. The first study, conducted by Ferguson and Gibson et al., assessed the validity of the 24HR for the purpose of determining group and individual
6 The full length of the Soares et al. article was not accessible. Information obtained was limited to that contained in the abstract. Consequently, the socioeconomic and demographic characteristics of the subjects and the specific nutrients examined by the authors could not be determined. 7 Significance unknown (not reported in the article’s abstract).
GAIN Working Paper Series no. 4
21
intakes of energy, protein, calcium, iron, zinc and vitamin C of 29 rural Malawian children (4-6 years) [65]. The authors observed a low level of agreement between intakes measured by 24HRs and those measured by weighed food records. The authors attributed the discrepancy in measures of energy and nutrient intake between methods to “errors in reporting snack food consumption, the use of average recipes, and imprecision in the recall of quantities of main meal dishes consumed” [65, p.273] The authors ultimately concluded that “24 hour recall could be substituted for the weighed food record when estimates within ± 10% of actual group mean intakes of energy, protein, iron, and zinc are required” [65, p.273]. Because of the large discrepancy between 24HR and weighed food record estimates of vitamin C and calcium intake, the authors deemed 24HR an unsuitable method for measuring these nutrients.
The second 24HR study supporting the notion of nutrient-dependent validity examined the relative validity of a multiple pass interactive 24HR for assessing nutrient intakes in rural Ethiopian women [66]. The authors compared the results of a 24HR with same-day estimates of food intake measured with a weighed food record. Results showed that median intakes of energy and most nutrients were lower (P < 0.05) by the 24HR versus the weighed food record. The authors attributed underestimation of intakes mainly to inaccuracies in portion size estimates. Interestingly, when energy density was controlled for, there was agreement between the two methods for median adjusted intakes for the majority of nutrients (i.e., energy, protein, carbohydrate, calcium, iron, zinc, retinol, total dietary fiber, and phytate) with the exception of fat and vitamin C. This finding is noteworthy because it “suggests that the underestimation of portion sizes in the 24HR was not selective under-reporting of specific types of high-energy foods, as reported in certain Western populations” [66, p.293, 67]. The authors thus concluded that 24HR should not be substituted for weighed food records when assessing absolute nutrient intakes or the prevalence of inadequate intakes within a group unless adjustments are made to energy intakes.
To summarize, only a handful of studies have tested the relative validity of the 24HR method in a developing country. Comparison of their findings is difficult because not every study repeated the recalls the same number of times. Inaccuracy of estimates for different nutrient intakes may result from some of the errors discussed above (e.g., recall errors, inaccurate portion size estimation, etc.). Though a number of factors affect the accuracy of 24HR data, it is recognized that a) calculating usual individual nutrient intakes requires multiple recall days, and b) the number of recall days required differs by nutrient and the setting. Calculating the number of replicate days requires an estimate of the within-subject variation for the nutrient of interest which is dependent on both the nutrient and the setting. The variation in a subject’s intake of the nutrient is affected by the distribution of the micronutrient in the available food supply which of course varies from setting to setting. As such both the nutrient and the setting will affect the number of replicate days required of the 24HR.
The within-subject variation in nutrient intakes is a very under-studied area in dietary assessment research. Beaton et al. [68] have created an equation for use in calculating the within-subject variation of micronutrient intakes. Using the equation developed by Beaton and his colleagues, Persson et al. [69] determined that four times as many recalls were needed to estimate usual intakes of calcium within +/- 20% of true intake levels as compared to vitamin A and iron. Specific nutrients are of interest to food fortification programmers, namely those that are commonly inadequate in many diets
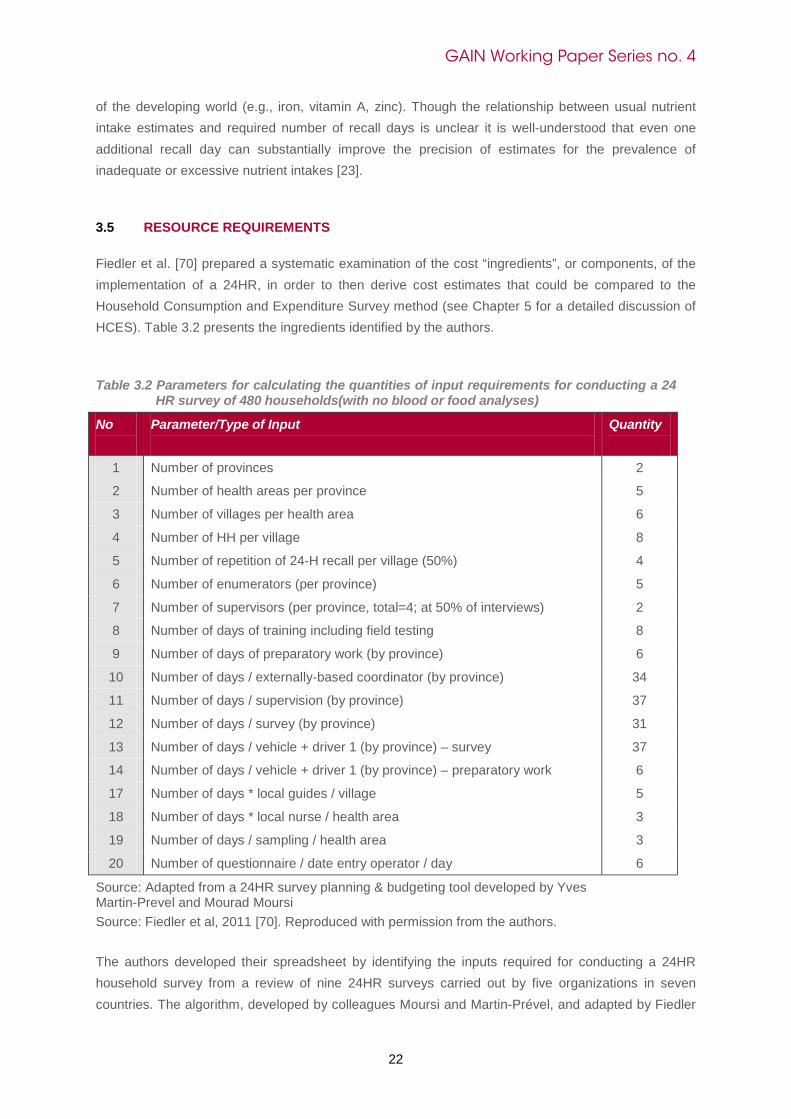
GAIN Working Paper Series no. 4
22
of the developing world (e.g., iron, vitamin A, zinc). Though the relationship between usual nutrient intake estimates and required number of recall days is unclear it is well-understood that even one additional recall day can substantially improve the precision of estimates for the prevalence of inadequate or excessive nutrient intakes [23].
3.5 RESOURCE REQUIREMENTS
Fiedler et al. [70] prepared a systematic examination of the cost “ingredients”, or components, of the implementation of a 24HR, in order to then derive cost estimates that could be compared to the Household Consumption and Expenditure Survey method (see Chapter 5 for a detailed discussion of HCES). Table 3.2 presents the ingredients identified by the authors.
Table 3.2 Parameters for calculating the quantities of input requirements for conducting a 24
HR survey of 480 households(with no blood or food analyses)
No
Parameter/Type of Input
Quantity
1 Number of provinces 2
2 Number of health areas per province 5
3 Number of villages per health area 6
4 Number of HH per village 8
5 Number of repetition of 24-H recall per village (50%) 4
6 Number of enumerators (per province) 5
7 Number of supervisors (per province, total=4; at 50% of interviews) 2
8 Number of days of training including field testing 8
9 Number of days of preparatory work (by province) 6
10 Number of days / externally-based coordinator (by province) 34
11 Number of days / supervision (by province) 37
12 Number of days / survey (by province) 31
13 Number of days / vehicle + driver 1 (by province) – survey 37
14 Number of days / vehicle + driver 1 (by province) – preparatory work 6
17 Number of days * local guides / village 5
18 Number of days * local nurse / health area 3
19 Number of days / sampling / health area 3
20 Number of questionnaire / date entry operator / day 6
Source: Adapted from a 24HR survey planning & budgeting tool developed by Yves Martin-Prevel and Mourad Moursi Source: Fiedler et al, 2011 [70]. Reproduced with permission from the authors.
The authors developed their spreadsheet by identifying the inputs required for conducting a 24HR household survey from a review of nine 24HR surveys carried out by five organizations in seven countries. The algorithm, developed by colleagues Moursi and Martin-Prével, and adapted by Fiedler
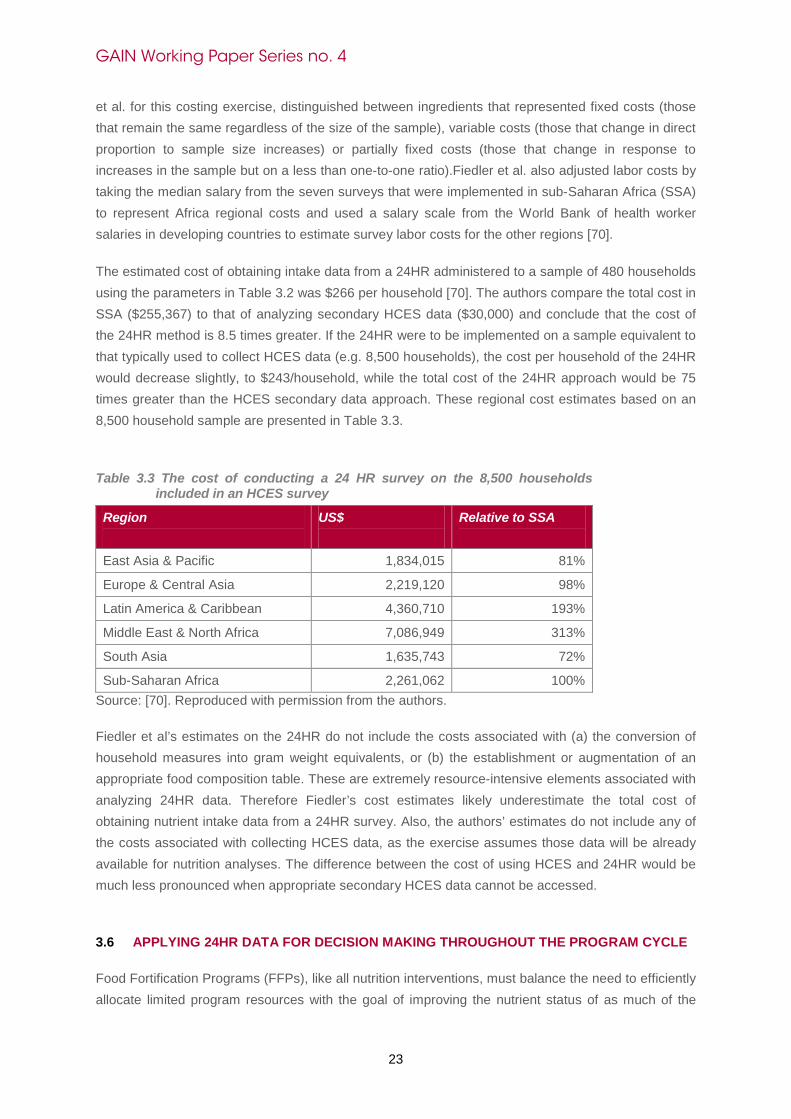
GAIN Working Paper Series no. 4
23
et al. for this costing exercise, distinguished between ingredients that represented fixed costs (those that remain the same regardless of the size of the sample), variable costs (those that change in direct proportion to sample size increases) or partially fixed costs (those that change in response to increases in the sample but on a less than one-to-one ratio).Fiedler et al. also adjusted labor costs by taking the median salary from the seven surveys that were implemented in sub-Saharan Africa (SSA) to represent Africa regional costs and used a salary scale from the World Bank of health worker salaries in developing countries to estimate survey labor costs for the other regions [70].
The estimated cost of obtaining intake data from a 24HR administered to a sample of 480 households using the parameters in Table 3.2 was $266 per household [70]. The authors compare the total cost in SSA ($255,367) to that of analyzing secondary HCES data ($30,000) and conclude that the cost of the 24HR method is 8.5 times greater. If the 24HR were to be implemented on a sample equivalent to that typically used to collect HCES data (e.g. 8,500 households), the cost per household of the 24HR would decrease slightly, to $243/household, while the total cost of the 24HR approach would be 75 times greater than the HCES secondary data approach. These regional cost estimates based on an 8,500 household sample are presented in Table 3.3.
Table 3.3 The cost of conducting a 24 HR survey on the 8,500 households
included in an HCES survey
Region
US$
Relative to SSA
East Asia & Pacific 1,834,015 81%
Europe & Central Asia 2,219,120 98%
Latin America & Caribbean 4,360,710 193%
Middle East & North Africa 7,086,949 313%
South Asia 1,635,743 72%
Sub-Saharan Africa 2,261,062 100% Source: [70]. Reproduced with permission from the authors.
Fiedler et al’s estimates on the 24HR do not include the costs associated with (a) the conversion of household measures into gram weight equivalents, or (b) the establishment or augmentation of an appropriate food composition table. These are extremely resource-intensive elements associated with analyzing 24HR data. Therefore Fiedler’s cost estimates likely underestimate the total cost of obtaining nutrient intake data from a 24HR survey. Also, the authors’ estimates do not include any of the costs associated with collecting HCES data, as the exercise assumes those data will be already available for nutrition analyses. The difference between the cost of using HCES and 24HR would be much less pronounced when appropriate secondary HCES data cannot be accessed.
3.6 APPLYING 24HR DATA FOR DECISION MAKING THROUGHOUT THE PROGRAM CYCLE
Food Fortification Programs (FFPs), like all nutrition interventions, must balance the need to efficiently allocate limited program resources with the goal of improving the nutrient status of as much of the

GAIN Working Paper Series no. 4
24
target population as possible. Though the 24HR is the most resource-intensive dietary assessment method of the four examined in this review (see the Discussion and conclusions, section 7 for a more detailed discussion of the relative validity and resource requirements of the four dietary assessment methods), its comparative advantage lies in its ability to generate the types of quantitative dietary intake data required at each stage of the FFP program cycle. It is, however, important to note that not all program cycle information needs require the level of detail or accuracy yielded from a 24HR. Using 24HR data, food fortification programmers can identify and prioritize target population groups and decide which micronutrients and (in what amounts) should be added to which foods. They can then monitor the coverage of the program and the effectiveness of consuming fortified products on inadequate intakes of specific nutrients. The suitability of 24HR data in addressing information needs throughout the program cycle and the necessary steps involved in its application are discussed below.
3.6.1 Program Design: What Micronutrient Deficiencies Exist?
The World Health Organization (WHO) Guidelines on Food Fortification with Micronutrients recommend that health authorities not initiate a food fortification program “without first collecting food intake data, supported by ancillary information such as biochemical data on nutritional status” [28, p.140]. Biochemical data are useful for confirming estimates of the prevalence of inadequate dietary intakes derived from food and nutrient intake data. Though 24HR data can suggest which MN deficiencies are likely prevalent based on dietary intake data, biomarkers are often considered the most robust method of determining micronutrient deficiency.
Though use of biomarker data is, in many cases, the preferred option, there are circumstances in which confirmation of MN deficiencies with biochemical data would not be possible. The collection of biomarker data may be infeasible due to its large expense or owing to the fact that some micronutrients lack a reliable biomarker of deficiency status. In the event that biomarker data is not collected, quantitative dietary intake data, such as those provided by the 24HR, must be used. Before considering the collection of primary 24HR data to determine the nutrient gaps in the population, food fortification programmers should investigate whether population-level dietary intake data already exist in the country. The data can be used to construct an indicator for the distribution of usual dietary intakes of nutrients within a population which “provides the most useful basis on which to justify and design a micronutrient fortification program to correct micronutrient deficiencies” [28, p. 177].
3.6.2 Program Design: Determining the Prevalence of Inadequate MN Intakes in Specific Population Subgroups
Knowing the distribution of dietary nutrient intakes across the population is critical to the decisions of which food(s) to fortify, with which micronutrients, and in what amounts. As mentioned above (see Section 3.4), single day 24HR data will not provide valid estimates of usual dietary intake. Single day dietary recall data will in fact result in an overestimation of high and low nutrient intakes since some individuals will eat uncharacteristically small amounts and others will eat unusually large amounts of food on the day the recall was performed. An overestimated variance in nutrient intake, if left unadjusted, may result in the selection of an excessively high fortificant level [28]. Ultimately, invalid estimates of usual dietary intake could place individuals erroneously classified as at risk of nutrient

GAIN Working Paper Series no. 4
25
inadequacy in danger of nutrient toxicity. If additional recall data (preferably performed on non-consecutive days) are not collected then at the very least some form of statistical adjustment must be made to adjust for the variability of the single-recall data. Section 3.4 discusses in greater detail the issue of adjusting for day-to-day variation in dietary recall data.
Having collected the 24HR data and adjusted it for variability the next step is to convert the quantitative food intake information into nutrient data. As discussed in section 3.3.5 food composition databases are used to convert food intake data into nutrient intake data. Once nutrient intake data is available the consumption patterns of various population subgroups should be assessed with the use of statistical software. Women of reproductive age and children tend to be at highest risk of MN inadequacy while adult men are most at risk of exceeding the tolerable upper level (UL) of MN intakes. The nutrient intake data should be analyzed to confirm which population subgroups are at risk of nutrient inadequacy and exceeding the UL. The Estimated Average Requirement (EAR) cut-point method is used to calculate the population prevalence of inadequate intakes in order to be able to determine the appropriate fortificant level [28]. This approach identifies the proportion of the group with intakes below the median requirement (i.e., EAR) as at risk for nutrient inadequacy. This method is discussed in greater detail below.
3.6.3 Program Design: Selecting which Foods to Fortify
The 24HR method, if conducted on more than one day, provides a comprehensive picture of foods consumed by individuals and households. However, the level of detail provided by the 24HR may be more than is required to answer the question of which foods should be fortified; secondary data sources such as HCES (see Chapter 5) and Food Balance Sheet data (see Chapter 6) may suffice. An appropriate vehicle for a FFP requires the satisfaction of a number of different criteria (see Figure 2 in Chapter 2). The 24HR method can satisfy some of these criteria though 24HR surveys do not always ask respondents about the origin of food consumed (i.e., purchased, gifted, or home produced). Adding a question about the origin of food consumed to the 24HR module is, however, an easy modification to make to the survey. Alternatively, the 24HR can be used complementarily with another approach (such as HCES) that provides essential information on food purchasing behaviors. After identifying population subgroups with the highest risk of MN inadequacy, the food intake data for these population subgroups can be analyzed to assist in the determination of an appropriate vehicle for fortification. Other FCM may be used to identify potential vehicles but 24HR data can be analyzed at this stage to confirm whether or not the quantity consumed of the potential vehicle (e.g., grams/day) by the target population is large enough to justify fortification. There is a technical limit to how much fortificant can be added to a food and as a result foods that are consumed in very small quantities by target populations tend to be poor candidates for fortification.
3.6.4 Program Design: Selecting the Fortificant Level Using the EAR cut-point Method
The WHO Guidelines recommend using the EAR cut-point method to calculate the distribution of intakes for most nutrients (with the exception of iron) within a population and, ultimately, to determine the appropriate fortificant level for a food fortification initiative. The EAR cut-point approach is a derivation of the probability approach. Both methods are used to establish nutrient adequacy. Each
GAIN Working Paper Series no. 4
26
method requires knowledge of the median requirement (the EAR) for the nutrient and the distribution of usual intakes in the population [71, p.81]. One of the main factors differentiating the two approaches is that the EAR cut-point method assumes that the distribution of nutrient requirements in the group under study is symmetrical about the EAR (i.e., normally distributed) [20]. The probability method is used when the distribution of nutrient requirements in the group under study is not normally distributed. For more information on the probability method see The Institute of Medicine [71].
Since the iron requirements of children and premenopausal women (i.e., children aged 1 to 3 years; children aged 4 to 8 years; menstruating adolescent women aged 14 to 18 years; and menstruating adult women) are not normally distributed due to the elevated iron needs of these groups, the EAR cut-point method is not valid for calculating the prevalence of inadequate iron intake in these groups and thus the probability method must be used. The WHO Guidelines discuss how to calculate the prevalence of inadequate iron intakes in a population using the probability method [28]. Though the EAR cut-point method is considered a simplified approach due to its less stringent information requirements, it can be as accurate at estimating risk for inadequate micronutrient intakes as the probability method if properly applied [71, p.81].
The ultimate goal of a FFP is to reduce the proportion of a population group that is at risk of inadequate micronutrient consumption. By combining 24HR data on the range of usual intakes in a population group with information on the nutrient requirements of that group (i.e., the EAR), food fortification programmers can determine the fortificant level that will shift an intake distribution so that the requirements of all but a small specified proportion of the subgroup are met by usual dietary intakes [28]. As a general rule, FFPs aim to provide 97.5% of individuals in the population group at greatest risk of deficiency with adequate intake of specific MNs, without causing a risk of excessive intake in this group or any other [28]. Adolescent boys and adult men are most at risk of excessive micronutrient intakes.
The determination of fortificant levels is one of the last key decisions made during the program design phase. The selection of a fortificant level requires the following information: the specific micronutrient(s) that are deficient in the diet and therefore will be added to the food supply in the form of a fortificant, the rates of inadequate consumption among different population subgroups, the vehicle(s) selected for fortification, and the usual intake (g/day) of the vehicle(s) among the target subgroups. All of this information can and should be used to model and compare the effects of different fortificant levels [28]. Fortification programs aim to meet the EAR for a given nutrient among 97.5% of individuals within a population subgroup most at risk of inadequate intake, without causing a risk of excessive intakes in this group or any other.
The WHO Guidelines contain an example of how to simulate different fortificant levels in order to predict the effect on the intake distributions of a population subgroup (e.g., adult women). Briefly, the model involves comparing the effects of different fortificant levels on individuals within the subgroup who are at risk of nutrient deficiency (i.e., those with usual intakes below the EAR; at or below the 50th percentile of intake distributions) and those at risk of excess (i.e., intakes above the EAR but below the UL and intakes above the UL; 75th percentile and above). Using data on the distribution of vehicle intakes (g/day) and the distribution of nutrient intakes from all food sources, one can simulate

GAIN Working Paper Series no. 4
27
how different fortificant levels would alter nutrient intake distributions and the resultant number of individuals classified as “at risk of deficiency” and “at risk of excess”. This approach also permits the assessment of nutrient intake levels in relation to the EAR and the UL before fortification and after the addition of moderate or high levels of fortificant. Similar fortificant level simulations should be performed for other population subgroups, particularly adult men, since they are generally the largest consumers of staple foods [28]. Once the effect of varying levels of fortificant on different population subgroups is known, food fortification programmers will be in a position to select the most appropriate fortificant level; the one that will meet its goal of improving the nutrient status of the most deficient consumers while minimizing the risk of excessive nutrient intake in other population subgroups.
3.6.5 Program Monitoring: Reach, Coverage, Effective Coverage, and Excessive Coverage
“Reach” and “coverage” are defined, respectively, as the proportion of the population consuming the fortified product and the proportion of the target population consuming the fortified product. Data on reach and coverage can be provided by the 24HR. The strength of the 24HR lies in its ability to provide accurate quantitative estimates of individual dietary intake; however, the cost of attaining this level of accuracy is substantial. If all the dietary information that is required from respondents is a “Yes/No” answer when asked whether they have consumed the fortified product, the use of the 24HR may be hard to justify for the sole purpose of assessing reach and coverage. The Food Frequency Questionnaire (FFQ) has the comparative advantage over the 24HR in this respect since it can assess reach and coverage relatively quickly and cost-effectively owing to the fact that estimation of portion sizes are usually excluded from this method. Section 4.6 of Chapter 4 discusses in more detail how to use the FFQ to determine reach and coverage.
“Effective coverage” and “excessive coverage” are more complex indicators in that they require quantitative information on nutrient and food intakes. Effective coverage is defined as the proportion of the target population consuming the fortified product at a level expected to significantly reduce the nutrient intake gap. Excessive coverage, on the other hand, is the proportion of the target population consuming the fortified product at a level likely to exceed the safe ULs of the nutrient. The process involved in deriving these indicators is similar to the steps undertaken to construct many of the indictors used during the program design phase. To determine the effective and excessive coverage one would need to collect quantitative dietary information from a representative sample of the population group being targeted by the FFP. If a 24HRwas selected to calculate these indicators then one would need to develop recipe conversions for dishes made with fortified foods to determine their additional nutrient content. After converting all food intake data into nutrient intake data the next step would be to analyze the distribution of nutrient intakes within the target population in order to examine the rates of nutrient adequacy (i.e., the proportion of individuals whose nutrient intake levels meet the EAR but do not exceed the UL) post-fortification. Since the 24HR provides information on all foods consumed and not just the fortified product, the data can be analyzed to ascertain what proportion of the observed improvement in nutrient intake is due to consumption of the fortified product as opposed to increased consumption of other sources of the micronutrient. One would then be able to calculate effective coverage by counting the number of individuals in the target population who consumed the fortified food(s) in quantities predicted at baseline and whose nutrient intake increases were due to that consumption rather than alternative sources of the nutrient. To calculate excessive coverage one
GAIN Working Paper Series no. 4
28
would examine the proportion of the individuals in the target population who reported consuming the fortified product and whose intakes exceeded the UL for the nutrient. Again, only those individuals whose increased nutrient intakes could be attributed to the fortified foods rather than increased consumption of other sources of the nutrient would be included in the calculation of excessive coverage.
3.6.6 Program Evaluation
The collection of biomarker data – that is, an observed improvement in biomarker levels at the intervention’s endline in comparison to baseline data – is often the most robust method of assessing program effectiveness. Dietary data help establish the attribution of a change in micronutrient status to the food fortification program. Several key informants interviewed for this review indicated that the 24HR is an appropriate method for evaluating the effectiveness of fortification programs. It can be used to measure indicators such as the proportion of the population and target population that have achieved significant improvements in micronutrient intake and reductions in deficient micronutrient intake. These indicators require information about the entire diet, not just consumption of the fortificant vehicles. The 24HR data can also effectively determine what proportion of this change can be attributed to the fortification initiative, since it identifies specific foods. Several key informants agreed that the importance of evaluation of food fortification programs has not been adequately emphasized. The focus among nutrition professionals has been largely on expanding the number of food fortification initiatives in areas with high levels of micronutrient deficiencies, and less so on the evaluation of existing programs. If project evaluation were given greater emphasis, the 24HR would be an appropriate method to provide the detailed consumption information that would permit measurement of changes in total nutrient intake and attribution of such changes to the specific fortificant vehicles.
To recap, the primary objective of a FFP is to provide 97.5% of individuals in the population group at greatest risk of deficiency with an adequate supply of certain micronutrients (that is, enough to meet the EAR for that nutrient) without causing a risk of excessive intake in other groups. Evaluating the success of a FFP against this objective is relatively straightforward. One would have to compare the proportion of the target population whose nutrient intakes met or exceeded the EAR at endline with the proportion of the target population below the EAR at baseline. Of course, as discussed above, in order to accurately determine the contribution of the FFP to the improvement in nutrient status one would have to control for increased consumption of additional sources of the nutrient. If, between baseline and endline, consumption of the fortified product increased or stayed the same8 and other sources of the nutrient were controlled for then one could conclude that the food fortification intervention was likely to have improved the micronutrient composition of the diet.
8 Assuming the quantity of the vehicle consumed at baseline was sufficiently large to provide 97.5% of the population with the EAR.

GAIN Working Paper Series no. 4
29
3.7 SUMMARY OF 24HR STRENGTHS AND WEAKNESSES
This section reviews the strengths and weaknesses of the 24HR method discussed throughout the chapter. The final chapter presents guidance on the suitability of 24HR relative to other dietary assessment methods for various programmatic purposes.
3.7.1 Strengths
• If properly implemented, offers a high degree of accuracy in assessing nutrient intake, relative to other the other methods reviewed in this paper
• Provides quantitative estimates of individual food consumption and nutrient intake
• Includes all foods included that the respondent can recall (i.e., food eaten inside and outside home). It is not limited to a checklist
• Measured at the individual rather than the household level
• Takes into account preparation methods and their effect on estimated nutrient content
• Can be structured to take account of foods consumed together that may enhance or inhibit micronutrient absorption.
3.7.2 Weaknesses
• High resource requirements: Expensive, significant training requirements, and databases (e.g., food composition tables) often need to be updated
• Generalizability depends on sampling frame and sampling method
• Usually conducted on a small sub-sample of target population due to cost considerations; generalizable only to the population sampled
• Often not representative of geographic subgroups needed to design programs at national or sub-national/regional level
• A single 24-hr recall will provide population estimates, but will not capture intra-individual variation in daily consumption patterns. Unless the 24HR is repeated on at least two non-consecutive days it cannot be used to estimate the prevalence of inadequate or excess intakes of a nutrient
• To capture seasonal variation, the survey must be repeated appropriately to cover the entire year, and repeat 24HRs are expensive
• Inter-interviewer variation.
GAIN Working Paper Series no. 4
30
4 FOOD FREQUENCY QUESTIONNAIRES
4.1 OVERVIEW AND CHARACTERISTICS OF THE APPROACH
A food frequency questionnaire (FFQ) is a type of dietary assessment instrument that attempts to capture an individual’s usual food consumption by querying the frequency at which the respondent consumed food items on a predefined list. FFQs were popularized in the 1980’s as part of research efforts to study the associations between diet and various health risks, particularly cancer [72]. The FFQ was seized on as a more accurate approach to collecting population-level consumption data than food balance sheets and as a less time-consuming and less expensive method than the diet history approach that was popular at the time [72].Today, the FFQ is the most common method of measuring dietary patterns in large epidemiological studies of diet and health [4].
Within the context of fortification programming, the use of FFQs has been largely confined to applications of the Fortification Rapid Assessment Tool, or FRAT. The FRAT, developed in the 1990’s by HealthBridge (formerly PATH Canada), under contract to the Micronutrient Initiative, is a method created specifically for the purpose of identifying food vehicles for fortification and for setting appropriate and safe fortificant levels [5]. The FRAT is a hybrid of a food-frequency questionnaire and a 24HR that seeks to measure consumption of a small set of “potentially fortifiable foods”9. This chapter will discuss the use and potential use of FFQs in fortification programming, both as a component of the FRAT and as a standalone, more generic method.
4.1.1 Highlighting Differences between FFQ/FRAT and 24HR
Recall Period. One difference between FFQs and 24HR (described in Section 3) is the recall period. A 24HR collects detailed information on the previous day’s consumption, while a weighed food record usually documents up to 3 days of intake. FFQs are administered once, but rely on a longer recall period in order to capture foods that are not consumed every day but are still part of the individual’s typical diet; these measures of ‘usual intakes’ are a more valid indicator of the relationship between diet and health outcomes than those capturing only a single 24-hour snapshot.
FFQ recall periods vary greatly, but typically range from 7 days to 1 year. The FFQ portion of the FRAT uses a recall period of 7 days [5]. The optimal recall period strikes a balance between being long enough to offer a representative picture of the diet and short enough that the respondent can accurately recall their consumption. Studies have shown that a recall period longer than a few days introduces recall bias, where respondents can not accurately remember consumption in the past and thus rely on recent experiences or general nutrition knowledge to answer the questionnaire [73].
Method of Soliciting Intake in Interview. A second distinction between the FFQ and the weighed food record or 24HR relates to how information on intake is collected. Whereas a weighed food record and
9 The FRAT includes additional components that are important for fortification program planning, including market assessment guidelines and other questions such as storage and preparation information to provide additional context for program design decisions. The discussion of FRAT in this document focuses on the consumption assessment aspects of the tool.

GAIN Working Paper Series no. 4
31
24HR method ‘walks’ a respondent through the day, noting everything consumed from morning until night, the FFQ solicits information about a pre-defined list of food items. In this regard, the FFQ is similar to the HCES, from the standpoint that the number and type of food items selected for the questionnaire influences the comprehensiveness of the data and the accuracy of the results. Designers of FFQs often limit the food items in the questionnaire to those that are a source of nutrients related to the particular dietary exposures under study – low fat diets, for example, or folate-rich foods, or foods high in antioxidants. A review by Wakai of Japanese FFQs, published between 1980 and 2008, found that the number of items ranged greatly depending on the objectives of the study, from 9 to 169 [74]. Of the 21 FFQs that the author reviewed, two questionnaires were developed with the intention of estimating calcium intake, two were created to measure consumption of specific individual foods or food groups, while the remaining 17 were designed to measure total macro- and micronutrient intake more broadly. Studies have shown that more detailed FFQ food lists yield more accurate estimates of consumption than less detailed lists when compared with a weighed food record (see Section 3 for a description of the weighed food record method) [74].
The food list in the FRAT is meant to be limited to those food items that have potential as fortification vehicles. The definition of “potential” includes factors such as the proportion of the population vulnerable to deficiency that is consuming the food, the technical feasibility of fortification, and the processing, storage, and marketing of the fortified product [5]. In order to narrow down the list of potential food vehicles to be assessed, the FRAT guidelines recommend an initial review of secondary data, including an examination of per capita consumption information from food balance sheets. In addition to listing potential vehicles, the FRAT also includes information related to foods, beverages, or condiments that are typically consumed concurrently with the food vehicle, as they may serve as inhibitors or enhancers of absorption [5].
Identifying “Typical” Frequency of Consumption. A third characteristic of the FFQ method is that the instrument requires respondents to report the typical frequency of their consumption of each item over the recall period. Frequency may be collected using an open-ended question or in ranges (e.g. 1-10 times, 11-20 times), though more often the information is collected in categories – (e.g. once a day, more than once a day, once a week, more than once a month). The FRAT records the number of days in the previous week on which items were consumed, so that the maximum frequency per item is 7. The review by Wakai [74] of Japanese FFQs showed that 3 of the 21 studies used an open-ended question to record frequency, whereas the remainder used between 3-12 different frequency categories.
Portion Sizes and Cooking Methods. A fourth distinguishing characteristic of the FFQ is that the approach does not typically collect detailed information on portion size or cooking methods. A specific type of FFQ, also called a “semi-quantitative food frequency questionnaire” (SQFFQ), does include questions about portion sizes consumed; however, because foods are not typically weighed or measured or estimated using household utensils, many SQFFQs are not considered to be very valid for the purpose of quantifying food or nutrient intake [72, 75, 76]. SQFFQs use varying approaches to estimating portion sizes. For example, the National Cancer Institute’s Diet History Questionnaires (DHQI and DHQII) derived typical portion sizes from national surveys that used a 24-hr recall
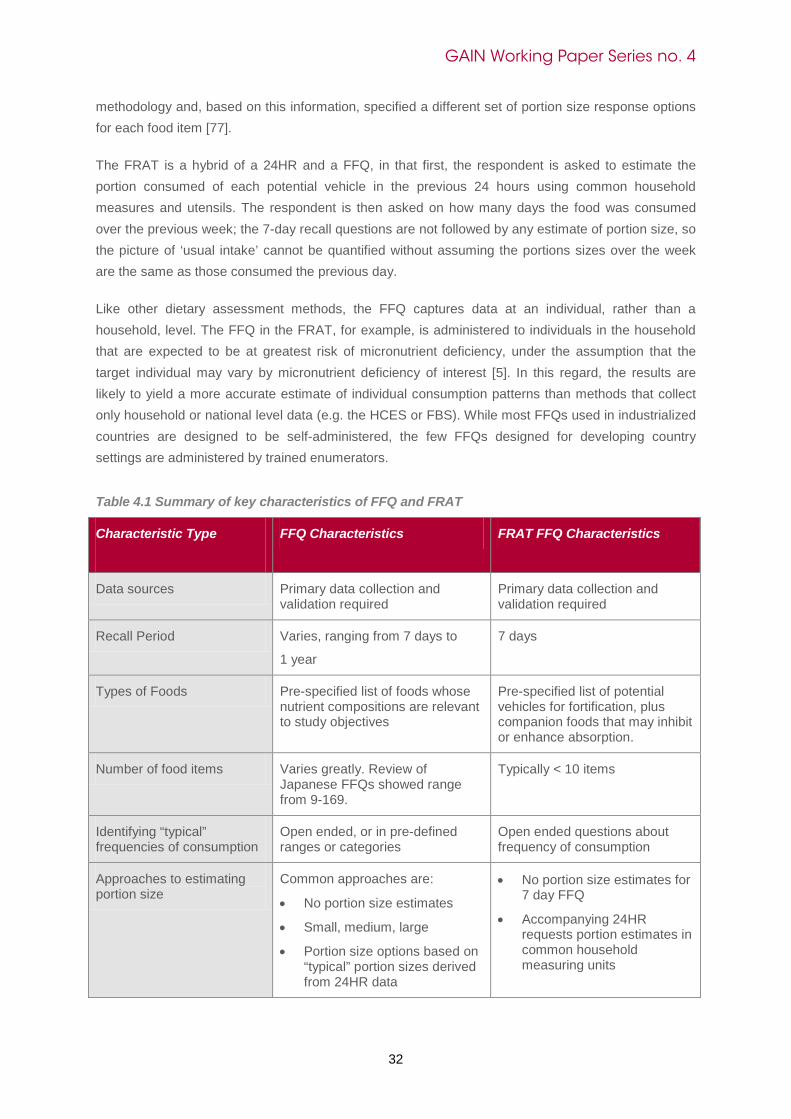
GAIN Working Paper Series no. 4
32
methodology and, based on this information, specified a different set of portion size response options for each food item [77].
The FRAT is a hybrid of a 24HR and a FFQ, in that first, the respondent is asked to estimate the portion consumed of each potential vehicle in the previous 24 hours using common household measures and utensils. The respondent is then asked on how many days the food was consumed over the previous week; the 7-day recall questions are not followed by any estimate of portion size, so the picture of ‘usual intake’ cannot be quantified without assuming the portions sizes over the week are the same as those consumed the previous day.
Like other dietary assessment methods, the FFQ captures data at an individual, rather than a household, level. The FFQ in the FRAT, for example, is administered to individuals in the household that are expected to be at greatest risk of micronutrient deficiency, under the assumption that the target individual may vary by micronutrient deficiency of interest [5]. In this regard, the results are likely to yield a more accurate estimate of individual consumption patterns than methods that collect only household or national level data (e.g. the HCES or FBS). While most FFQs used in industrialized countries are designed to be self-administered, the few FFQs designed for developing country settings are administered by trained enumerators. Table 4.1 Summary of key characteristics of FFQ and FRAT
Characteristic Type
FFQ Characteristics FRAT FFQ Characteristics
Data sources Primary data collection and validation required
Primary data collection and validation required
Recall Period Varies, ranging from 7 days to
1 year
7 days
Types of Foods Pre-specified list of foods whose nutrient compositions are relevant to study objectives
Pre-specified list of potential vehicles for fortification, plus companion foods that may inhibit or enhance absorption.
Number of food items Varies greatly. Review of Japanese FFQs showed range from 9-169.
Typically < 10 items
Identifying “typical” frequencies of consumption
Open ended, or in pre-defined ranges or categories
Open ended questions about frequency of consumption
Approaches to estimating portion size
Common approaches are:
• No portion size estimates
• Small, medium, large
• Portion size options based on “typical” portion sizes derived from 24HR data
• No portion size estimates for 7 day FFQ
• Accompanying 24HR requests portion estimates in common household measuring units
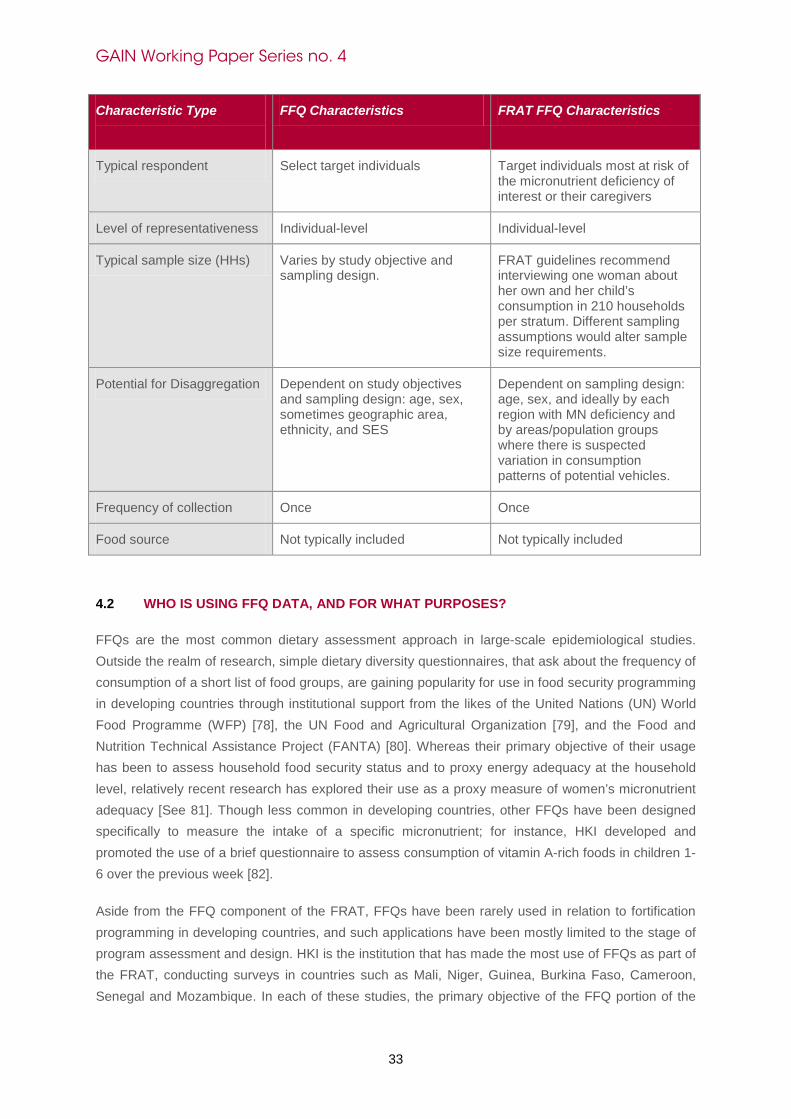
GAIN Working Paper Series no. 4
33
Characteristic Type
FFQ Characteristics FRAT FFQ Characteristics
Typical respondent Select target individuals Target individuals most at risk of the micronutrient deficiency of interest or their caregivers
Level of representativeness Individual-level Individual-level
Typical sample size (HHs) Varies by study objective and sampling design.
FRAT guidelines recommend interviewing one woman about her own and her child’s consumption in 210 households per stratum. Different sampling assumptions would alter sample size requirements.
Potential for Disaggregation Dependent on study objectives and sampling design: age, sex, sometimes geographic area, ethnicity, and SES
Dependent on sampling design: age, sex, and ideally by each region with MN deficiency and by areas/population groups where there is suspected variation in consumption patterns of potential vehicles.
Frequency of collection Once Once
Food source Not typically included Not typically included
4.2 WHO IS USING FFQ DATA, AND FOR WHAT PURPOSES?
FFQs are the most common dietary assessment approach in large-scale epidemiological studies. Outside the realm of research, simple dietary diversity questionnaires, that ask about the frequency of consumption of a short list of food groups, are gaining popularity for use in food security programming in developing countries through institutional support from the likes of the United Nations (UN) World Food Programme (WFP) [78], the UN Food and Agricultural Organization [79], and the Food and Nutrition Technical Assistance Project (FANTA) [80]. Whereas their primary objective of their usage has been to assess household food security status and to proxy energy adequacy at the household level, relatively recent research has explored their use as a proxy measure of women’s micronutrient adequacy [See 81]. Though less common in developing countries, other FFQs have been designed specifically to measure the intake of a specific micronutrient; for instance, HKI developed and promoted the use of a brief questionnaire to assess consumption of vitamin A-rich foods in children 1-6 over the previous week [82].
Aside from the FFQ component of the FRAT, FFQs have been rarely used in relation to fortification programming in developing countries, and such applications have been mostly limited to the stage of program assessment and design. HKI is the institution that has made the most use of FFQs as part of the FRAT, conducting surveys in countries such as Mali, Niger, Guinea, Burkina Faso, Cameroon, Senegal and Mozambique. In each of these studies, the primary objective of the FFQ portion of the

GAIN Working Paper Series no. 4
34
FRAT was to identify consumption patterns that would indicate which vehicles were most appropriate for fortification and to raise national awareness of the potential feasibility of fortification programming. The FRAT study in Mozambique was jointly implemented in 2010 by the Ministry of Health, the Technical Secretariat for Food Security and Nutrition, HKI and World Vision [83]. In addition to using the FRAT to inform a fortification strategy, HKI and World Vision also intended to use the survey results to develop a consumer information campaign that could be tailored to the specific consumption patterns of groups living in different urban centers and to better understand the price implications of fortification on consumption trends [83]. The survey sampled 2,506 households in urban centers in 3 regions of the country, interviewing women and children between 6-59 months of age. Ultimately, resources were not sufficient to collect the estimates of portion size that are built into the 24HR component of the FRAT, so the survey collected only the frequency of consumption of five foods: maize flour, wheat flour, cooking oil, sugar and salt. The resulting data were indicative of likely coverage of potential vehicles, however without quantitative estimates of portion size, the authors concluded that the calculation of micronutrient fortification levels would require further assessment.
In addition to its use by HKI, other institutions have adopted elements of the FRAT for a similar purpose. For instance, the government of Zimbabwe, together with WHO and UNICEF, administered both a FFQ and a FRAT as part of a national assessment of non-communicable disease risk factors, in order to assess overall dietary patterns as well as the food consumption patterns of potentially fortifiable vehicles [84]. To our knowledge, the FFQ (or FRAT) has not been used to inform other information needs related to fortification interventions, including for the purpose of assessing coverage or impact.
4.3 PROCEDURES FOR INSTRUMENT DEVELOPMENT AND DATA COLLECTION
This section outlines the procedures and resources required to develop and implement the food frequency portion of the FRAT, as well as the procedures and resource requirements for developing and implementing a more comprehensive FFQ or SQFFQ.
4.3.1 FRAT
The FRAT Guidelines [5] describe in detail the steps required to design and implement a FRAT survey. The process will not be further reviewed here except to note that the procedures, like any household survey, require questionnaire adaptation, pre-testing, enumerator training, data collection, and analysis. The FRAT Guidelines also describe the resources required to conduct a survey using the FRAT method. A typical FRAT survey, if administered according to the suggested guidelines, might assess consumption of 3 or more food vehicles through interviews with a sample of 210 households, spread across 30 clusters, using a team of 7 enumerators. The FRAT Guidelines estimate that each interview takes approximately one hour to complete, allowing the enumerator team to complete an estimated 5-6 clusters in a day. The administration time is largely a function of the number of vehicles being assessed. Based on the assumptions in the FRAT Guidelines, the authors estimated that the 210 households can be covered in 5-6 days, not including travel time to the survey site and time for notifying authorities and calibrating household and market measuring utensils, steps

GAIN Working Paper Series no. 4
35
that are likely to require an additional 2 days. Accounting for potential delays, the total estimated implementation time is 11 days, or 42 person days. Though the FRAT Guidelines estimate administration time to be about an hour, a personal communication with the Guidelines author has suggested that this is a high-end approximation [85, personal communication]. To guide future applications of the FRAT, it would be useful to obtain more precise field-level information on the time to implement the FRAT module, including differentiating the time requirements by the number of vehicles assessed and by whether it is administered as a stand-alone module or as part of a larger survey. Analysis of the data generated by FRAT is straightforward and can probably be completed in a few days once the data are entered. Changes in any of key assumptions (e.g. increases in the number of food vehicles assessed, or the sample size) will influence the amount of time required to complete the survey and the associated cost.
The total cost of implementing a FRAT survey includes the cost of developing instruments, preparing for and implementing data collection, and entering and analyzing data. The Guidelines estimate that the cost of a FRAT survey, meeting the specifications described above and conducted in 4-5 sampling areas in West Africa (e.g. 210 households x 5), is approximately $18,000-20,00010. Note that these estimates assume the implementation of the entire consumption module of the FRAT, which includes both an FFQ (7-day recall) as well as the mini 24HR component that also measures portion size. If portion size is not estimated (i.e. if just the 7-day FFQ component of the FRAT is administered, as was done in the Mozambique FRAT survey [86]) then the implementation time per survey is likely to be reduced by 15-20 minutes.
The relative simplicity of using the FRAT lies in the fact that both the FFQ and modified 24HR components assess consumption of only a few foods that are being considered as potential vehicles for fortification. The data are also relatively simple to analyze, as analysis for the purpose of identifying vehicles and setting fortificant levels considers intake in terms of the amount of food consumed -- it does not involve the additional analytical step of transforming foods into their nutrient constituents. Though not discussed in the FRAT Guidelines, additional analyses can be performed to quantify the amount of a given nutrient supplied by the amount consumed of the potential food vehicle. However, quantifying total nutrient intake or the total intake of a particular nutrient cannot be accomplished from the data generated by the FRAT, as it does not collect information on the full range of foods that contribute to total intake or to that of a specific nutrient. Methods like the 24HR or a detailed SQFFQ (described below) can be used to generate estimates of intake and adequacy.
4.3.2 Other Food Frequency Questionnaires
While the implementation of an FFQ (or SQFFQ) is relatively straightforward, the development of this type of questionnaire is complex. The creation of a valid FFQ “requires a large time commitment and attention to detail if it is to succeed” [87, p.769].
Instrument Development and Validation. As a first step in the process, FFQ developers must identify a list of foods whose nutrient composition collectively contributes most of the intake of the nutrient(s) of interest across the target population. To keep the food list to a reasonable length, individual foods
10 FRAT Guidelines estimated $15,000-$17,000 in 2003 dollars, inflated by authors to its equivalent in 2012 dollars.
GAIN Working Paper Series no. 4
36
must typically be grouped according to their nutrient similarities, while also making cognitive sense to the respondents. The list must remain disaggregated enough that an estimate of nutrient content can be derived from the response, however proxy estimations using a food composition database with values for a reduced number of nutritionally similar groupings of foods have been shown to yield adequate results. For example, the International MiniList (IML), developed in the early 1990’s from data from Egypt, Kenya, and Mexico as well as from the US MiniList [88] and other international food composition databases, reduced from over 1800 to 234 foods with complete information on 48 nutrients [89].
The development of the food item list requires in-depth knowledge of the types of foods typically consumed by the population under study. There are three main methods used to develop a FFQ food list [74].One common approach relies on experienced dietitians or other experts to choose the food items for the list. A second approach uses secondary dietary data to determine which foods explain most of the variability in inter-individual intake of specific nutrients [74]. The third approach relies on data from the administration of a “full” FFQ in order to shorten the number of items to a “short version” of the FFQ based on those items that explain most of the variability in intake [74].
The food lists of some of the most well-known FFQs used in the US, such as the Diet History Questionnaires I and II (DHQI and DHQ II), were developed from national surveys of food intake, which relied on 24HR data from the 1994-96 US Department of Agriculture's Continuing Survey of Food Intake by Individuals (CSFII) [75], and the National Health and Nutrition Examination Surveys (NHANES) conducted in 2001-02, 2003-04, and 2005-06 [77]. When national level data are not available, conducting a small-scale 24HR survey of the target population of interest can provide an alternative source of information for FFQ development. Note that the more ethnically or culturally heterogeneous the population, the more challenging it is to develop a single FFQ that is valid across population subgroups.
Following this step, the developers must define a recall period, and must determine how frequency information will be captured. As mentioned previously, typically frequencies are collected either through an open-ended question or by defining frequency categories based on typical consumption patterns.
A SQFFQ involves the assessment of portion sizes as well as the frequency of consumption. The development of standard portion size categories is a challenge, as it requires knowledge of the range of serving sizes that might be consumed for a particular food or set of foods in that population, as well as an understanding of how a serving is likely to be expressed in common household units. Typically the former must be ascertained from secondary dietary data or by implementing a small-scale survey using the 24HR method.
Once the questionnaire is developed, it must be validated against a reference measure, typically a 3-day diet record or set of 3 non-consecutive 24HRs administered to the same population, and revised if correlation coefficients are unacceptably low (though Bland and Altman have argued that correlation coefficients are not the best method of validating one measure against another [90], FFQ validation
GAIN Working Paper Series no. 4
37
studies have traditionally relied on this technique, and often judge coefficients in the range of 0.4 to be acceptably valid [72]).
Implementation and Analysis. Implementation of the developed, validated FFQ is likely to be relatively quicker than other dietary assessment methods as it does not require direct weighing or other form of direct portion size estimation. However, most FFQs are designed to be self-administered, which is not usually feasible in contexts of low levels of literacy. We could find no examples comparing the time required to implement self-administered and enumerator-administered FFQs in a developing country (or industrialized country) setting.
When the objective is to quantify intake of a particular nutrient or set of nutrients, the estimates of food item portion sizes captured through the FFQ must be multiplied by the daily frequency of consumption and then converted into estimates of the nutrients provided by each portion of that food item. The process of doing so with FFQ information requires developing a modified nutrient database based on assumptions about the quantity of nutrient per estimated portion of each item. For instance, the DHQ I relied on nationally representative 24HR data to identify three portion size options per item for the questionnaire [75]. As individual food items in the DHQ were typically aggregated into slightly larger categories (E.g. many different foods were condensed into the line “lasagna, stuffed shells, stuffed manicotti, ravioli, or tortellini"), questionnaire developers calculated the mean nutrient value for three different portion sizes of each food items comprising this category, in order to yield a single nutrient value by portion size for each food. Their decision to take this approach was based on the findings of a prior study that developed 10 possible nutrient databases for a FFQ that varied in the approach used to estimate nutrient values for portion sizes within categories of foods that had been aggregated from individual food items [91]. Variations included the use of means versus medians and weighting by nutrient density. The authors compared the FFQ nutrient intake estimates generated from each of these nutrient databases to intakes calculated directly from 24HR data, and found that methods using means were consistently better than those using medians. Though the DHQ I and II are considered to be fine examples of a carefully constructed and validated SQFFQ, even these instruments exhibited a high degree of error (the departure from the reference estimates yielded by 24HR data), underscoring the caution in interpretation that must be taken when using FFQ data to quantify intakes [72, 76].
4.4 RESOURCE REQUIREMENTS
Kristal et al. [92] compare the cost of using a 4-day diet record to the cost of food frequency questionnaires for the purpose of monitoring women’s diets in the Women’s Health Initiative. The authors report that the cost of implementation, processing, and quality control of the 4-day diet record was $49.97 per respondent, compared to a cost of $2.18 per respondent for the FFQ.A more recent paper by Kristal and colleagues compares the estimated costs of 1) a 3-day food record 2) 3 24HRs, and 3) a single FFQ [72]. In this paper they estimate the cost per day of the food record to be $48.3 and that of a single 24HR to be $52, compared to a cost of $7.5 per FFQ. The authors conclude, “Although we may wish to mount a large cohort study using multiple 24HRs….the likelihood of obtaining funding for such a study is bleak” [72, p.2826].
GAIN Working Paper Series no. 4
38
While the magnitude of difference in costs between the FFQ, 24HR and the diet record are indicative, the absolute cost estimates described above are not directly transferable to a developing country setting. One of the big cost savings with FFQs in the US is that they are self-administered on machine-readable forms. In developing countries, similar savings on data entry may be realized by using PDAs for data capture (though PDAs themselves carry an equipment cost).Without PDAs the cost of labor for data entry must be factored into the total estimate. In a household survey setting in developing countries, all three types of methods (diet record, 24HR, FFQ) typically need to be administered by trained enumerators, incurring an additional labor cost (albeit probably at a lower price per unit than the equivalent in the US).Most importantly, this cost estimate does not include the upfront time/cost required to develop and validate the FFQ and, as a separate step, to develop a nutrient database that can be used to transform responses into valid estimates of nutrient intake – a task that is even more time-intensive than constructing a ‘typical’ food composition database. Once the time-cost of FFQ instrument development and validation is considered, the large gap in cost between the 24HR and FFQ cited above is likely to be significantly narrowed (as the FFQ cost increases).It is clear that, once an FFQ has been developed, it is a much less costly tool than 24HR or diet records for ongoing, large-scale population based studies.
4.5 EVIDENCE OF VALIDITY
Any discussion of the validity of FFQs to assess dietary intake must necessarily be general, as the design of FFQs is quite variable and the validity of the instrument is highly dependent on context and study objectives. For this reason, any new FFQ must undergo a process of validation before it can be used to survey nutrient intakes. The fact that each individual FFQ often requires its own validation study is reflected in the vast size of the literature on FFQ validation. In a recent review of 5,476 dietary assessment validation studies, 82% of articles (approximately 4,490 studies) were studies that tested an FFQ against a reference method [93]. FFQs differ in this way from the 24HR method, which may be adapted to different contexts but essentially follows the same protocol during every application. Nevertheless, despite the overwhelmingly vast validation literature, it is possible to draw some conclusions about the validity of FFQs for assessing nutrient intake.
The most commonly used reference method in FFQ validation studies is the food record, which often includes a weighing component (i.e., weighed food record). It is an ideal reference method because it does not share the same sources of error as the FFQ [94]. Like all dietary methods that rely on self-reporting, FFQs are vulnerable to various sources of bias and measurement error. Section 3.4 contains an extensive discussion of errors commonly found in self-reports of dietary assessment, in particular 24HRs.While FFQs are believed to do a better job than 24HRs of capturing “usual intake”, due to their longer recall period, the recall period of an FFQ often extends beyond the point at which the respondent can accurately recall her consumption, even the ‘habitual consumption’ which is the focus of the FFQ. For instance, Gibson and Ferguson [1] reported that, in their research experience with SQFFQs in Africa, women in rural areas found it challenging to report habitual intakes over a lengthy time period. It was easier for them to respond to questions asking about their specific experience on the previous day. In addition to the recall bias, other potentially significant sources of error common to the (SQ)FFQ include a lack of precision in the approach to collecting information on
GAIN Working Paper Series no. 4
39
portion sizes, and omission of food items from the list that may contribute toward the nutrient of interest.
FFQs are typically validated by comparing their intake estimates to those produced by the reference method and by using measurement error models to estimate correlations between the two methods’ results [75]. Despite the frequency with which correlation coefficients are used to illustrate the relative validity of FFQs, this approach has received criticism. Bland and Altman are strong opponents of using correlation coefficients to compare two measures and have argued for the use of the mean and difference in standard deviation between the two [90]. The standard deviation of the difference is not influenced by the between-person variation (also called “inter-individual variation”) in intake [94]. In practice the statistical tests developed by Bland and Altman have not been used nearly as frequently as correlation coefficients. This may be partly due to the fact that interpretation of Bland-Altman test results is difficult unless one has a very high degree of knowledge about absolute usual nutrient intakes and between-subject variation [94]. Willett has suggested that although the dependence of correlation coefficients upon within-subject variation has some disadvantages11, “this can also be viewed as an advantage because the capacity of a questionnaire to discriminate between subjects, and thus the power of a study, is a function of the within-subject variation” [94, p.138]. Readers may wish to consult Willet [94] for a more thorough treatment of the subject of addressing within-subject variation in food frequency questionnaire data.
FFQ validity: nutrient intakes. The difficult task of obtaining precise estimates for the usual nutrient intake of individuals or a group, no matter what dietary assessment tool is being used, requires consideration of the between-subject and within-subject variation. As mentioned in the previous chapter the between-subject and within-subject variation in intakes (also called inter-individual and intra-individual variation, respectively) differs depending on the nutrient in question. Gibson and Ferguson state that "generally, for nutrients found in high concentrations in few foods (e.g., vitamins A and D, sodium, and cholesterol), between-subject and within-subject variation is high: between-subject and within-subject variation tends to be lower for iron and zinc because they are more widely distributed in foods that are eaten on most days of the year” [1, p.20]. Evidence from FFQ validation studies suggests that there may be a large degree of reporting error for nutrients with high between- and within-subject variation. For instance, vitamin A intakes were underreported in two FFQ validation studies with different recall periods. Underreporting of vitamins A and C, energy, and macronutrients was observed in a validation study of an FFQ with a recall period of one week [95]. Willett et al. reported poor correlation in nutrient intake results for vitamin A and polyunsaturated fats in a validation of an SQFFQ with a recall period of one year [96]. Though other factors relating to study design may have influenced the results, the potential for the FFQ to inaccurately report vitamin A intake is noteworthy for food fortification specialists since vitamin A is commonly used to fortify foods.
Generally speaking, it is difficult to design an FFQ that performs equally well for all nutrients. There has been increasing debate in recent years among epidemiologists about the bar used to deem an FFQ as valid for assessing nutrient intakes. According to Subar et al. [75], even the most carefully
11 Namely, the generalizability of the correlation coefficient is limited to populations with similar between-person variation as the test population (Willett, 1998)
GAIN Working Paper Series no. 4
40
designed FFQs attain validity correlation coefficients (CC) between 0.4 and 0.7, leading at least one observer to note that, for FFQs generally, “the glass of validity is only half full” [76, p.1087].
Food Lists. The number of foods listed in an FFQ “has been classically considered a key component to assure validity of dietary intakes” [93, p.S32]. A study by Wakai [74] compared the correlation coefficients of long FFQs to shorter ones. “Long FFQs” were defined as those that listed 97 or more food items while questionnaires with less than 70 food items were considered “short FFQs”. The CCs in comparisons of longer, data-based, and systematically prepared FFQs with weighed food records were slightly higher than the CCs between shorter, more basic FFQs and weighed food records. In the validation of long FFQs, the median CCs for nutrients ranged from 0.42 to 0.52 (median of medians, 0.46), while the range for validation of short FFQs was 0.31 to 0.45 (median, 0.41). A large review of FFQ validation literature by Henriquez-Sanchez et al. [93] supports the observation of improved validity with longer versus shorter food lists. The mean CC for FFQs with less than 100 items was 0.47 compared to 0.52 for FFQs with more than 100 food items, the latter having less variation as well.
In contrast to the findings of Wakai [74] and Henriquez-Sanchez et al. [93], Willett [97] found that a longer questionnaire that was developed using current information on changes in the food supply was not appreciably better at assessing dietary intake than a shorter, more out-of-date questionnaire. A validation study by Hickling et al. [4] concluded that a short FFQ that limits food lists to foods high in folate was a valid and reliable rapid assessment tool for measuring usual folate intake. Another validation study also concluded that rapid assessment tools with short food item lists can produce valid estimates of specific nutrient intakes [98]. Ultimately the length of the list may be less important than the technique used to develop it and whether the foods on the list collectively represent the key sources of the nutrient(s) of interest in the diet. A short list of items for assessing vitamin A is likely to be more valid than a short list for assessing zinc or iron, which are found in many more food sources [1].In any case, lengthy FFQs are more expensive and may decrease participation rates [93], such that researchers who wish to measure usual dietary intake are potentially presented with a tradeoff between improvements in estimates of dietary accuracy with higher respondent burden and resource demands that longer FFQs present.
The level of detail of foods listed within FFQs also influences the validity of dietary data. Unlike the 24HR, investigators often do not know the contents of the prepared foods listed in an FFQ [99]. For example, an FFQ may simply ask respondents to state the frequency with which they consume “pizza” without indicating a particular kind of pizza or the key ingredients in the food. If brands of foods are listed then ingredient information should be reasonably easy to attain; however, detailed descriptions of mixed dishes are essential in order to attain reliable estimates of dietary intake.
Portion Size Estimation. The issue of whether or not FFQs should include questions on portion size is contentious. Limiting respondents to a finite list of portion size options clearly has the potential to introduce data errors. Kristal et al. [72] cite the portion size descriptions of “small”, “medium”, and “large” carbonated beverages as an example of out-of-date portion size presentation: these categories do not reflect the current marketplace availability (in the US) of 8 oz. to 32 oz. servings. Willett [94] argues that including portion size estimates in SQFFQs may actually do more harm than

GAIN Working Paper Series no. 4
41
good since the amount of variation from portion size errors may actually exceed the amount of information gained on the true variation in portion size. A comparative study of dietary assessment methods by Bingham et al. [100] found that when respondents were given the opportunity to assess their own portion size the accuracy of the SQFFQ was reduced rather than improved. Faggiano et al.’s research found that respondents who selected small serving sizes tended to underestimate intake while those that selected large sizes overestimated their consumption [101].
Though there is considerable research calling into question the accuracy of portion size information from SQFFQs, numerous SQFFQs that included portion size estimates have produced valid estimates of dietary intakes. Large reviews of FFQ validation studies [74, 93] have detailed dozens of rigorously developed SQFFQs that have produced correlation coefficients on par or in excess of those that have excluded portion size estimates. The magnitude of error caused by portion size misreporting is not clear, nor is it clear that other issues such as inappropriate serving size categories are not to blame for the misreporting. It would therefore be premature to abandon assessment of portion size completely. Of course, without estimates of portion size, it is not possible to determine absolute intakes of food and nutrients. However, detailed information on absolute intakes of food and nutrients is less important in the case of program monitoring than it is during the program design phase. (SQ)FFQs may therefore be more appropriate for program monitoring purpose, or as a complement to approaches that are better able at capturing portion size such as the 24HR.
Maximizing FFQ validity. It has been suggested that there is a limit to the extent to which the accuracy of FFQ data can be improved. Willett observed in 2001 that correlation coefficients above 0.7 are rare and subsequent validation research has supported this observation [102]. Though Willett may be correct in that FFQs face a “ceiling of validity” there are a couple of characteristics of FFQs that appear to improve the accuracy of the dietary data collected. For example, fortification programmers should opt for face-to-face, interviewer-administered FFQs since they produce more accurate dietary data than self-administered FFQs [103].If the goal is to obtain dietary information on a specific nutrient(s) then FFQ food lists that are limited to foods high in the nutrient(s) of interest will help to produce more valid estimates. Whether or not portion size can be accurately estimated by FFQs is a contentious question. FFQ data may therefore be most useful in addressing the information needs of program monitoring, that do not require accurate quantitative estimates of food consumption.
FRAT Validity. After the original FRAT guidelines were developed in 1997, pilot studies in Brazil, Bangladesh, and Burkina Faso were conducted between the years 1998 and 2000 [104]. The market component of the FRAT performed very poorly in each of the field tests and required substantial revisions, however the dietary component of the FRAT necessitated only minor revisions. The insights gained from the field tests were incorporated into the 2003 revised FRAT guidelines [5].It is important to note that this exercise was a field test, not a validation study. Until recently, (see below) there has been no documented validation of the FRAT against a 24HR or weighed food record.
The Micronutrient Initiative (MI) has recently completed a study in Ethiopia to validate the FRAT against 24HR data [105]. One reason the FRAT has not been validated before now is that PATH Canada, the organization that developed the FRAT, believed that it was likely to be “at least as accurate as the conventional 24HR and food frequency methods on which it draws”, though it

GAIN Working Paper Series no. 4
42
concedes that this was an untested assumption [104, p.2]. The FRAT validation study will be an add-on to Ethiopia’s National Food Consumption Survey (NFCS), which has as one objective to guide the government of Ethiopia in creating a national, evidence-based food fortification program. Results of the FRAT validation study are expected to be released in 2012 [106]. The results will be used to update the 2003 FRAT Guidelines.
4.6 APPLYING FFQ DATA FOR DECISION-MAKING THROUGHOUT THE PROGRAM CYCLE
4.6.1 Program Design: What Micronutrient Deficiencies Exist?
In order to prioritize investments in micronutrient interventions and to ensure that solutions are guided by a contextual understanding of the problem, it is important to know which micronutrient deficiencies in a particular country pose a public health problem, the groups that are most affected, and the underlying causes of the problem. This indicates the role of inadequate nutrient intake in contributing to these deficiencies and their health outcomes.
While biomarkers are considered the criterion measures of deficiency, information about the risk of deficiency and the role of diet in deficiency and associated health outcomes can be usefully obtained from several different dietary assessment methods, including 24HR and FFQs. Though the FRAT is a hybrid between a 24HR and FFQ, a standard FRAT cannot be used to quantify nutrient intakes, as it only collects data on a very limited number of food items (potential fortification vehicles). Quantifying intake using a FFQ method requires expanding the foods assessed to include those foods that, collectively, are likely to contribute the bulk of the nutrients of interest to the total diet. For some nutrients, such as vitamin A, this may actually be a relatively short list of foods, in which case a simplified semi-quantitative food frequency questionnaire may be feasible to implement for this purpose [1]. In the case of nutrients like iron or zinc, which are found in many types of foods, a more comprehensive SQFFQ (or one of the reference methods) would be required.
There are several indicators that can be usefully generated for this purpose, including mean usual intake and the proportion of the population at risk of inadequate intakes. Section 3.6 describes the process of calculating these indicators using data derived from one or more 24HRs.Constructing these indicators using FFQ data is a very similar process, except that the procedures for transforming quantities and frequencies of foods consumed into nutrients requires a couple of additional steps. In order to construct intake indicators, the first step is to convert all portion sizes into standard measures of weight or volume. Information on portion sizes is often collected in the questionnaire using common household measurement units, therefore these units will need to be calibrated to determine the equivalent weight (in grams) or volume (in ml) of a single portion of each food item reported in one of the household units.
Once this process is complete, the portion size (in standardized units) should be multiplied by the frequency of consumption and divided by the recall period to derive the average amount consumed per day. The next step requires transforming the information about foods consumed into data on nutrient intake. This transformation requires a special nutrient database developed specifically for the FFQ. Such a database contains the same type of information as a food composition table, but is not
GAIN Working Paper Series no. 4
43
as straightforward. As described in Section 4.3, because individual foods are often aggregated into more generic categories (e.g. rice, noodles, lasagna), it is necessary to assign to each questionnaire item (rather than each food item) a nutrient content based on the portion size in question. The nutrient database is a key component of the FFQ/SQFFQ, and should be validated along with the questionnaire before using it in a population-based survey. Section 4.3 describes this process in greater detail. Once the consumption data have been transformed to derive the nutrient composition of the food, calculating intake of a particular nutrient for an individual record requires multiplying the nutrient value by the amount of food consumed per day for each food item and nutrients of interest, and then summing the result by nutrient. At this stage, the process for constructing intake indicators from SQFFQ data is the same as from 24HR data. Section 3.6 describes this process in greater detail.
4.6.2 Program Design: Which Food(s) Should be Fortified?
FFQ data offer a valid means of determining which foods are promising candidates for fortification, and for projecting absolute reach and coverage as well as the relative coverage of potential vehicles. As mentioned previously, a “potential candidate” for fortification is defined by whether the food is consumed regularly by large proportions of the population that are at risk of inadequate intake of a priority micronutrient – a micronutrient that can be feasibly added to the fortification vehicle. While technical, economic and supply-side (production and market) considerations must also be taken into account, consumption considerations related to identifying fortification vehicles are the focus of this section. The recommendations in this section are modified from the MI FRAT Guidelines [5].
The indicator, “% of households in which the individual in target group X consumed food Y in last 7 days,” can be calculated from the FRAT or other FFQ Data for this purpose. Generating this indicator from FFQ data or from the FRAT survey is a fairly straightforward process. The sample percentage is calculated as the proportion of sampled households in which the target individual is reported to have consumed the food at least once during the recall period, divided by the total number of households in the sample. These percentages should be calculated separately by target group (e.g. women or children) for each stratum in the sample – e.g. for urban and rural, or by region – as well as across the entire sample. Because each stratum in the sample is likely to have a different population size, in order to calculate the prevalence of consumption of the food item across the entire sample the data must be weighted by the population size. To do so, multiply the proportion consuming the food in each sample area by the population size, and sum these results to obtain the numerator (the number of people across the entire sample consuming the food item).Then sum the total number of people in the population across each stratum to obtain the denominator. Dividing the numerator by the denominator will provide the estimate of the total proportion of the population consuming the food item [5].
While this information is useful, it alone is not sufficient to determine whether the vehicle is suitable for fortification. In order to ensure that households will have access to the fortified version of the food vehicle, it is important to know whether the food being consumed was industrially processed and purchased from the type of outlet that is likely to stock such products. The sample FRAT survey provided in the MI guidelines does not include information on the food source, however, such a

GAIN Working Paper Series no. 4
44
question is simple to incorporate, does not add much additional respondent burden or time, and provides critical contextual information for analysis. With data on food source, it should be possible to further hone the indicator above, to “% of households in which the individual in target group X consumed food Y in last 7 days, in which the consumed item was purchased”. Of course, foods can be purchased from locations, such as local outdoor markets, that may not typically sell processed, fortified products. If possible, the question and indicator should be further modified to context in order to specify the type of retail outlets that are more likely to carry fortified foods.
To calculate this indicator, determine the number of households in each stratum with a target group member who consumed the food item where the item was purchased (as opposed to grown, or received as a gift), and divide by the total number of households in that stratum. Calculate the proportion for the total sample using the population weights as described above.
Common guidance for determining whether a given vehicle should be further considered for fortification, based on evidence of consumption is as follows: If a vehicle is consumed by 90% of the population, then it merits fortification. If it’s consumed by 30-90% of the population, then it should be considered for fortification, but with the understanding that additional vehicles or interventions will be necessary. If it is consumed by less than 30% of the population, then fortification should be reconsidered, as other vehicles may be more suitable [5]. However, this rule of thumb does not take into account additional, important information that can be gleaned from the FFQ-generated indicators described above. Arguably, the decision should be based not on the first consumption indicator, but on the second indicators related to the consumption of purchased items. The rule of thumb also does not take into account the distribution of deficiency or inadequate nutrient intake and whether the distribution of consumption patterns is relevant to the distribution of deficiency. If the vehicle is consumed by 60% of the female population, but if deficiency is concentrated in 30% of the population that is poorest, and only 10% of this population purchases the vehicle, then fortification may achieve extensive reach, but low coverage of those that need it most. Thirdly, this rule of thumb does not take into account the quantity or frequency consumed -- whether it is consumed in an amount and at a rate that, if sufficiently fortified, could contribute significantly to closing the presumed nutrient gap in order to reduce existing deficiencies and to prevent new cases from occurring.
4.6.3 Which Food(s) Should be Fortified?- Identifying Rates of Adequate Consumption
As described above, the decision of which foods to fortify should be based on more than binary information about the proportion of the population consuming a food or not. Also important is the percentage of the population that is consuming a purchased quantity of the vehicle in ‘adequate’ and ‘regular’ enough amounts such that fortification will be effective in reducing and preventing deficiency.
Fortificant concentrations can be increased up to a point to compensate for low levels of consumption, however there are limits related to the cost and technical feasibility of fortification at increasingly higher levels and to consumer acceptance (economic and organoleptic) of a highly fortified product. Infants face anatomical and physiological constraints to consuming large enough amounts of certain fortified foods that would otherwise help meet their nutrient needs (hence the development of age-appropriate nutrient dense complementary foods). Designers must also avoid excessive intakes
GAIN Working Paper Series no. 4
45
among those in the higher vehicle consumption or nutrient intake percentiles, particularly adolescent and adult males who tend to consume the most food but whose consumption is rarely surveyed. Therefore, there is a limit to which adjusting fortificant levels upward can compensate for low levels of consumption of the vehicle among some of the population.
While there is no scientific operational definition for ‘adequate’ and ‘regular’ that applies to every circumstance, if more than one vehicle is being considered for fortification then, all else equal, preference should be given to the vehicle that is consumed more regularly and in greater quantities by a bigger proportion of the target group. Knowing the amount that people are consuming is critical, therefore, to selecting among vehicles and to making decisions about fortificant levels.
The FRAT Guidelines provide some instruction for using information from the FRAT survey to calculate the rate of consumption as an aid in selecting vehicles and determining fortificant levels [5]. Though some of the details of this procedure are not made explicit in the guidelines, essentially the quantity of the potential vehicle consumed, collected through the 24HR (rather than through the non-quantitative FFQ [7-day recall] portion of the FRAT), should be used to calculate the number of grams consumed per day of the vehicle of interest. Using portion size information from the FRAT, or any SQFFQ that collects portion size information, requires transforming consumption from the units in which it is reported/collected (usually in local household measuring units) into a standardized measure of weight or volume. This procedure is described in greater detail in Section 3.3.1. A limitation of using the 24HR component from the FRAT to construct this information is that a single 24 hr. recall will not yield an accurate representation of distribution of ‘usual’ intakes, although it will accurately estimate the mean intake. If the FRAT were to collect information on ‘usual’ portion size across the previous 7 days, as a SQFFQ would do, then the validity of the measure for this purpose might be improved. Following this transformation (into grams/day), it is possible to compute the median number of grams per day consumed for each vehicle, along with the distribution of consumption in the 5th and 95th percentiles. These data can be further disaggregated to examine them by age and other major target subgroup. Ideally, information on socioeconomic status (SES) would be collected as an additional module of the FFQ or FRAT survey, in which case the data can be examined by income or wealth category (or SES proxy) to determine the consumption distribution in both higher and lower income groups.
4.6.4 Program Design: Modeling Fortificant Levels
Setting fortificant levels is a process that involves safety, technological, and cost considerations in addition to the information yielded by consumption data [28]. However, consumption data play a critical role in modelling the potential impact on different segments of the population of fortifying at various levels. Calculating the amount of food consumed (e.g. grams per day) is a first step to being able to use FRAT or SQFFQ data for this purpose. Section 5.4 describes two approaches to setting fortificant levels. The first approach, the “marginal/provisional” method can be carried out using the daily consumption data yielded from the FRAT/SQFFQ in the steps above.

GAIN Working Paper Series no. 4
46
4.6.5 Program Monitoring: Reach, Coverage, Effective Coverage, and Excessive Coverage
Once the program has been designed and is being implemented, it is important to monitor its progress. Common indicators used to monitor program implementation include “reach” and “coverage”. Less common, but important indicators to monitor include “effective coverage”, and “excessive coverage”. GAIN defines “reach” as the proportion of people in the population consuming the fortified product. Coverage is defined as proportion of people in the target population consuming the fortified product. Effective coverage can be defined as the proportion of the target population consuming the fortified product at effective levels (a level expected to significantly reduce the nutrient intake gap), and excessive coverage is the proportion of the target population consuming the fortified product at a level likely to exceed the Upper Tolerable Level of Intake (ULs).
4.6.6 Reach and Coverage
Reach and coverage are often estimated during program implementation from production figures and information on typical per capita intakes of the food vehicle. The daily production quantity divided by the daily per capita intake will yield a rough estimate of reach -- the number of people that may be consuming the fortified product. To derive coverage estimates from these types of data, the figure for “reach” is multiplied by the proportion of the population believed, from census or other demographic data, to be in each of the target groups. There are obvious issues with this approach, particular for estimating coverage, since it does not take into account the actual distribution of consumption and access to fortified products by target group members. However, this method does not require the collection of household survey data, and is therefore an inexpensive approach to monitoring programmatic trends. Ideally, periodic coverage surveys would be used to validate coverage prior to an end-line evaluation. GAIN is drawing on past survey experiences in Uzbekistan, Ghana, Mali, Côte d’Ivoire and Uganda as well as survey methodology used for humanitarian assistance purposes, to develop a rapid survey tool for this purpose.
Though we have not found instances of FFQs (FRAT or other) being applied to measure reach and coverage in fortification programs, the method is well suited for this purpose. Assessing reach and coverage using an FFQ requires developing a food list that includes the food vehicle(s) and the various types of processed products that contain the fortified food(s) as an ingredient. The food list should be adapted to the context of the fortification intervention, in that it should specify the brand names of fortified processed foods in situations where fortification is not mandatory. The FFQ should ask about the frequency of consumption, typically over the previous week. The FFQ instrument developed for a reach/coverage survey should also contain information on food source and may seek to ask questions about reasons for non-consumption12. To generate basic indicators of reach and coverage, the quantity of food consumed does not necessarily need to be collected.
12 In addition to the information collected from an FFQ, it is GAIN’s practice to take samples of food from the household on the day of the survey (or from the market that the household reports as the source of procurement) in order to test whether the food has been fortified, as an additional piece of monitoring data.
GAIN Working Paper Series no. 4
47
To provide data for calculating an indicator of reach, the FFQ must be administered to a sample of individuals, target and non-target, to derive the proportion of those individuals consuming the fortified food. To generate the coverage indicator, the FFQ questionnaire must be administered to target individuals(or their caretakers if the targets are children), and their responses used to calculate the proportion of those consuming a source of fortified food out of the total number of individuals in the target population group(s). One possible approach to collecting information on both indicators together is to take a representative sample of households, administering the FFQ to members of the target population in selected households about their individual consumption, while also asking a respondent per household to report on household consumption. Calculating the reach indicator would use the household level information multiplied by the number of members in the household. The coverage indicator would be calculated from the responses to the individual-level questionnaire. Alternative sampling approaches, such as Lot Quality Assurance Sampling (LQAS), could be explored using these instruments for estimating reach and coverage. LQAS is a small sample survey technique that originated in industry for quality control purposes and is particularly well-suited to tracking dichotomous variables (e.g. “covered” or “not”) [107].
In order to calculate indicators of effective coverage and excessive coverage, more complex data are needed, as food and nutrient intakes need to be quantified. Effective coverage can be defined in various ways. A very rigorous definition is the proportion of individuals consuming food who (a) are in the target groups, (b) are deficient in the consumption of the target nutrient prior to the initiation of the program and (c) consume the fortified food(s) in sufficient quantities to provide a meaningful amount of the micronutrient in question13.
Note that the approach to measuring effective coverage as defined above requires the ability to quantify the amount consumed of the fortified products as well as the amount consumed of the nutrient in question from all sources. Without quantitative information on consumption and nutrient intake, these measures cannot be calculated. Generating quantitative information on intakes from an FFQ is challenging – it requires the development and validation of a SQFFQ that captures portion sizes, as described in Section 4.3.2.Estimates of intake, even when captured by a carefully developed SQFFQ, are still likely to have fairly significant measurement error.
A much simpler definition of effective coverage would be to define the indicator according to the same criteria that were used to set fortification levels. Setting fortification levels is not always based on reducing a known nutrient gap (the gap between intake and requirements), since information on intakes are often not available to program designers. Rather, the intention is to provide a certain proportion of the nutrient requirement from the fortified product. When this approach is taken, effective coverage could be defined as the proportion of the target population that is deriving the intended proportion of the nutrient requirement from their consumption of the fortified food or from processed foods made with it.
In order to measure effective coverage, the instrument developed to measure reach and coverage would need to be expanded in order to estimate portion size for each of the fortified foods on the FFQ
13 For a detailed explanation of calculating effective coverage using this definition, please see Coates J and Rogers B. GAIN Integrated Program Services (IPS) Rajasthan/India Monitoring and Evaluation Plan, June 2011.

GAIN Working Paper Series no. 4
48
list. Data from administering this questionnaire to a sample of target individuals would be processed in order to convert the estimates to a total amount of fortified food consumed per day, as described above, after converting household measurement units into standard quantities using a conversion table developed for this purpose. Similarly, there will need to be a “recipe” list that estimates the proportion of the fortified commodity per unit of processed product. For example, to estimate the proportion of pasta weight that is comprised of fortified wheat flour. Following this step, information on fortificant levels should be used to convert the total quantity consumed of the fortified product into the total quantity of micronutrient supplied by that particular quantity of food. Once this information has been calculated for each respondent, then it is relatively straightforward to compare the amount of nutrient consumed to the amount intended by the program designers. An individual would be effectively covered if he/she were consuming at least the intended proportion of their requirement from the fortified product. Whether or not this amount is actually effective in closing the total nutrient gap and reducing the inadequacy of intakes depends on the individual’s total intake of the micronutrient from all sources in addition to the fortified product. Quantification at that level requires an even more extensive SQFFQ or a more valid method such as multiple 24HRs or a weighed food record.
Measurement of “excessive intake” would again ideally be done by calculating total MN intake and comparing the results to MN requirements in order to determine the percentage of population exceeding ULs. This resource-intensive type of assessment is not practical for routine monitoring, as it would require the development of an extensive SQFFQ or multiple 24HR recalls administered to a representative household sample. Alternatively, excessive intake could be proxied by the degree to which the quantity of micronutrient supplied by the fortified product consumed exceeds the ULs. Of course, this method is not very precise as it excludes from the calculation all other sources of the micronutrient aside from the fortified products. As a result, excessive intake would be underestimated when individuals are consuming significant natural sources of the micronutrient in addition to the fortified foods.
4.6.7 Program Evaluation: What Proportion of the Population and Target Population has Achieved Significant Improvements in Micronutrient Intake?
Measuring mean usual intake of the population and the proportion of the population with inadequate intake at baseline and comparing the results to the same indicators at the midterm or endline provides important ‘supporting evidence’ to link reductions in deficiency, evidenced by biomarkers, to the effects of the micronutrient intervention. That is, if consumption of the fortified product stays the same or increases relative to the baseline, controlling for consumption of other sources of the micronutrient, then one could conclude that reductions in deficiency are related to the intervention. The calculation of these indicators was described briefly in Section 4.6.1 and is treated thoroughly in Section 3.6 of the 24HR chapter.
GAIN Working Paper Series no. 4
49
4.7 SUMMARY OF STRENGTHS AND WEAKNESSES
This section reviews the strengths and weaknesses of the FFQ discussed throughout the chapter. The final chapter presents guidance on when to choose the FFQ relative to other methods, and for what purpose.
4.7.1 FRAT Strengths
• Relatively simple to design and administer
• Designed specifically to identify ideal food vehicles for fortification programs
• Can be tailored to needs more readily than the HCES or FBS. For example it can assess the consumption of specific food items of interest for fortification, listed by brand name if necessary
• Measures intake across 7 days as well as 24 hours, and therefore should provide a better picture of “usual intake” than a 24HR alone (though quantities are only collected for the previous 24 hour period)
• Provides a picture of individual-level consumption of key target population groups (e.g. women of reproductive age, children 6-59 months)
• Collects additional data to complement consumption information – data related to processing and storage, constraints in obtaining/consuming the product, and product availability in the market.
4.7.2 FRAT Weaknesses
• Only asks about intake of potential food vehicles, therefore the FRAT does not capture an individual’s total nutrient gap
• Without nutrient gap information, it is less useful for measuring the magnitude of the problem of inadequate micronutrient intake, for setting fortification levels, or for measuring effective coverage or impact
• While the FRAT could be used for program monitoring, it has not been tested for such purposes
• The method has been field-tested but not validated (though MI is planning to conduct a validation exercise in Ethiopia).
4.7.3 FFQ Strengths
• Better then single 24HRs or weighed food records at characterizing the ‘usual’ diet, with a longer recall period

GAIN Working Paper Series no. 4
50
• Captures individual-level dietary patterns
• Useful for assessing suitable vehicles and fortificant levels as list can be tailored to include all significant sources of a MN.
• Useful for monitoring reach, coverage, effective coverage, as list can specify brand names of fortified foods
• A short, focused FFQ is easier and less time-consuming to implement than a 24HR14.
4.7.4 FFQ Weaknesses
• Even SQFFQs do not provide a precise quantitative measure of nutrient intake
• The usual frequency of intake and usual portion size questions are difficult for respondents to answer and are prone to measurement error [108]
• Requires substantial up-front investment to develop and test FFQ instrument and nutrient database
• Few FFQs have been developed, validated, and used in developing country contexts.
14 FFQs are of variable length – an FFQ with 100 items might take as long or longer than a thorough 24HR
GAIN Working Paper Series no. 4
51
5 HOUSEHOLD CONSUMPTION AND EXPENDITURE SURVEYS
5.1 OVERVIEW AND CHARACTERISTICS OF THE APPROACH
Household Consumption and Expenditure Surveys (HCES), also referred to by a variety of other names including Household Income and Expenditure Surveys (HIES), Household Budget Surveys (HBS), or Living Standards Measurement Surveys (LSMS), are elaborate surveys conducted on a nationally representative sample to characterize important aspects of household socio-economic conditions. The results of such surveys have wide-ranging utility, however their primary purpose is to provide information for poverty monitoring, the calculation of national accounts, and the construction of the consumer price index [6]. The food data collected in HCES can be analyzed to produce a variety of indicators that are valuable for food fortification feasibility assessment and design, and for this reason the approach merits the increased attention it has received recently within the nutrition community.
Table 5.1 summarizes some key characteristics of Chas.’s illustrated in the table, HCES are characterized by their variability – that is, aside from the fact that most HCES include a module in which food data are collected, there is little consistency across different country surveys with regards to instrument design. One key source of variability across HCES has to do the proportion of questions within a given survey that ask about food consumption (and the value of the amount consumed) vs. acquisition (the value and sometimes the quantity of food purchased).While nearly all surveys contain a question asking the respondent how much was consumed from the household’s own production of food, in only rare cases are respondents asked directly about how much food is consumed that was purchased or received in-kind. Only rarely do the HCES questionnaires contain data needed to distill information about pure consumption, leading some to refer to the data derived from these surveys as “estimates of apparent consumption” [109, 110]. The implications of this issue for the validity of food consumption and nutrient intake estimates are discussed in detail in section 5.3.
A second source of variability across HCES is the recall period, which ranges from 7-30 days and up. A review by Fiedler et al [110] of 31 different HCES found that none of the HCES relied on a 24-hour recall period, which is the period commonly used for surveys of dietary intake. With a longer recall period, HCES can be said to do a better job of capturing “usual”, or typical, patterns of consumption expenditure. They do not necessarily do a better job than a 24–hour recall of assessing seasonal variation in consumption, as the HCES recall period is rarely large enough to extend across more than one season. Quite often, though, the data collection for the HCES is stretched over the course of multiple seasons in order to smooth out any seasonal effects [9].
A third important source of variation across HCES pertains to the number and types of food items that are included in the questionnaire. Of the 31 HCES reviewed in the Fiedler et al [110] study, 20 included 200 food items or fewer. Generally speaking, shorter, more aggregated food lists result in lower and less accurate estimates of consumption [111]. The types of food items included are perhaps even more important than the number of food items. HCES surveys tend to include mostly
GAIN Working Paper Series no. 4
52
primary commodities and contain fewer processed food items [112]. Those processed foods that are included do not generally distinguish whether or not they are fortified with additional micronutrients, which is a relevant issue for several reasons. Without information on the purchase of processed foods with added micronutrients, it is not possible to estimate accurately the micronutrients supplied to households by the product. Second, not having this type of information means that it is more difficult to assess how many people are consuming certain processed foods (e.g. bread, noodles) made from primary commodity ingredients that are likely candidates for fortification. It also makes it difficult to estimate the consumption of non-traditional food items, like bouillon cubes or fish sauce, that may be effective vehicles for fortification if they are widely consumed by the target population [112]. HCES surveys generally only collect data on households’ total expenditures on foods consumed outside the home, which does not allow identification and quantification of the foods consumed - a significant issue when using HCES to estimate total nutrient intake [112]. Section 5.3 discusses these issues in more detail and makes recommendations for modifying the design of HCES instruments to overcome these constraints.
Another relevant characteristic of the HCES data is that it is representative at the household, not individual, level. The respondent, typically the household head or the person in charge of food purchases, is asked to provide information about the household’s food acquisition or consumption patterns. Therefore, the data obtained from the HCES cannot be disaggregated to the individual level (E.g. by age/sex), without making assumptions about the intra-household distribution of consumption (see Section 5.5). Despite this limitation, HCES data can be usefully disaggregated in other ways; the surveys typically have accompanying modules that can be used to examine the results by income level, geographic location, gender of household head and other household characteristics.
The Fiedler et al review [110] showed that 42% of the surveys had a sample size in the range of 5,000-10,000 households, while 49% had samples that exceeded 10,000 households. These large-scale surveys are often representative not only at the national level, but also at the sub national (e.g. state or provincial) level.
HCES are conducted every 3-5 years in most industrialized countries. In developing countries, HCES surveys are still relatively common, but are often undertaken more sporadically [6]. Most HCES are implemented by national statistical agencies, often with technical assistance from the World Bank [6]. The World Bank maintains a repository of LSMS survey data sets that are freely accessible for download and use. Additionally, the International Household Survey Network (IHSN) is a body that provides mechanisms and tools for the harmonization of international survey efforts and the improved accessibility and use of the resulting data.15 Though the IHSN does not maintain data online, its website offers useful links to data catalogs and provides contact information for the specific units within the agencies that were the producers and the depositors of the data and from which the data may be obtained.16 Despite the relative frequency with which HCES surveys are conducted, the microdata is not always easily accessible, and microdata documentation is often lacking in essential detail [6]. IHSN members, such as the World Bank, are exploring options to improve accessibility and
15 http://www.internationalsurveynetwork.org/home/index.php?q=about/objectives. 16 http://www.internationalsurveynetwork.org/home/?q=activities/national-catalogs
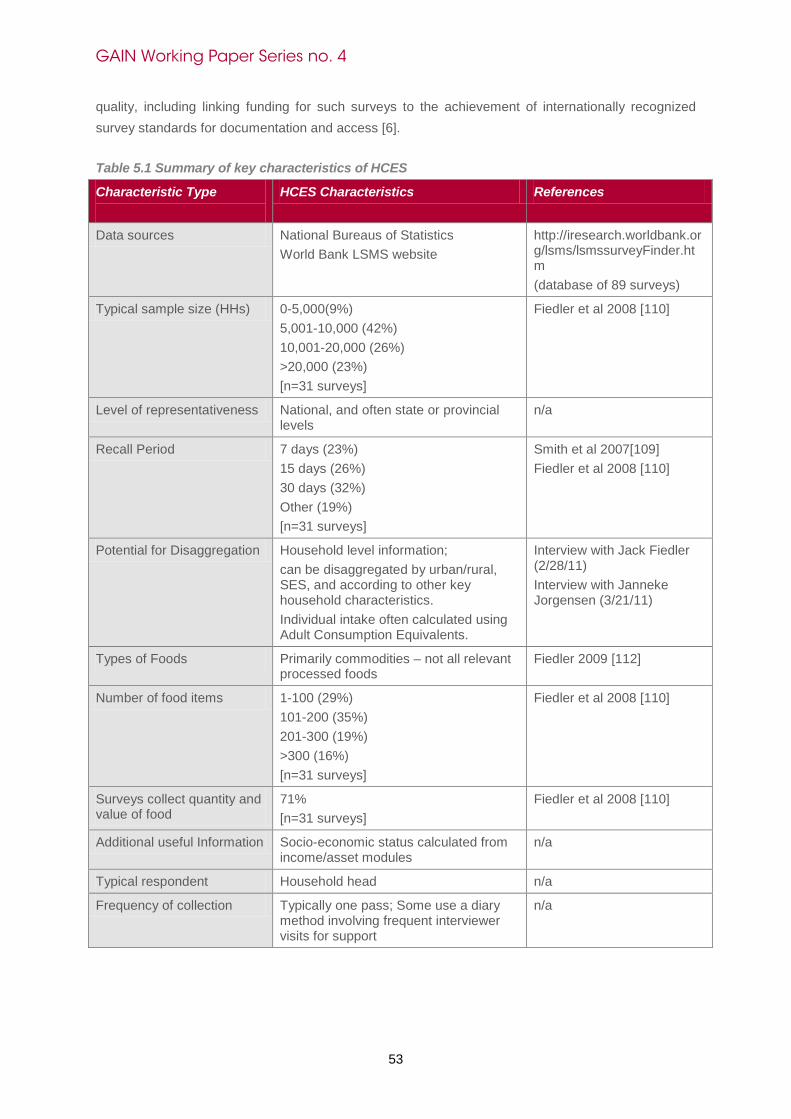
GAIN Working Paper Series no. 4
53
quality, including linking funding for such surveys to the achievement of internationally recognized survey standards for documentation and access [6]. Table 5.1 Summary of key characteristics of HCES
Characteristic Type
HCES Characteristics References
Data sources National Bureaus of Statistics World Bank LSMS website
http://iresearch.worldbank.org/lsms/lsmssurveyFinder.htm (database of 89 surveys)
Typical sample size (HHs) 0-5,000(9%) 5,001-10,000 (42%) 10,001-20,000 (26%) >20,000 (23%) [n=31 surveys]
Fiedler et al 2008 [110]
Level of representativeness National, and often state or provincial levels
n/a
Recall Period 7 days (23%) 15 days (26%) 30 days (32%) Other (19%) [n=31 surveys]
Smith et al 2007[109] Fiedler et al 2008 [110]
Potential for Disaggregation Household level information; can be disaggregated by urban/rural, SES, and according to other key household characteristics. Individual intake often calculated using Adult Consumption Equivalents.
Interview with Jack Fiedler (2/28/11) Interview with Janneke Jorgensen (3/21/11)
Types of Foods Primarily commodities – not all relevant processed foods
Fiedler 2009 [112]
Number of food items 1-100 (29%) 101-200 (35%) 201-300 (19%) >300 (16%) [n=31 surveys]
Fiedler et al 2008 [110]
Surveys collect quantity and value of food
71% [n=31 surveys]
Fiedler et al 2008 [110]
Additional useful Information Socio-economic status calculated from income/asset modules
n/a
Typical respondent Household head n/a
Frequency of collection Typically one pass; Some use a diary method involving frequent interviewer visits for support
n/a

GAIN Working Paper Series no. 4
54
5.2 WHO IS USING HCES DATA, AND FOR WHAT PURPOSES?
Traditionally HCES have been used to provide information for poverty monitoring, the calculation of national accounts, and the construction of the consumer price index. However, over the past 4 years there has been increasing recognition of the utility of HCES data to inform food fortification and other nutrition program decision-making. Though Food Balance sheets and producer data are probably still more common data sources for this purpose, there are several examples of the successful application of HCES in this context. For instance, Harvest Plus, a project of IFPRI, is using HCES data from several countries (as part of its “Micronutrient Program Portfolio Analysis” study) to explore the feasibility of fortification and to model the potential coverage, impact, and cost of fortifying promising food vehicles [113, personal communication]. An additional component of the study is to assess the strengths and weaknesses of using HCES data in designing and implementing large-scale micronutrient programs. Similar analyses are also being conducted using National Sample Survey data from India to look at the potential impact of rolling out fortification programs in Gujarat and Rajasthan [114, personal communication].
A second example of recent application of HCES data for fortification program decision-making is in Tanzania. In this instance, the 2007 Tanzanian Household Budget Survey was used to identify potential food vehicles for fortification and to set fortificant levels in these vehicles [115, personal communication]. To do so, the HCES was used to estimate consumption patterns of potentially fortifiable foods including wheat flour, maize flour, sugar, and oil. While the HCES results were not the only factor in the selection of vehicles (e.g. technical and political feasibility was also an issue) the results of the analysis contributed to the choice of wheat flour, maize flour, and cooking oil as viable fortification vehicles in Tanzania. For setting fortificant levels, HCES data were triangulated with information from Food Balance Sheets, the Fortification Rapid Assessment Tool (FRAT), as well as industry data. Though HCES estimates showed lower food consumption levels than the other data sources, stakeholders used HCES to help set fortification levels in Tanzania as they considered the estimates from this source to be the most accurate information available [115, personal communication].
A third example of the application of HCES data in the context of large-scale fortification programs relates to work that Fiedler and colleagues carried out on behalf of the Inter-American Development Bank. Using data from the 2005-06 Encrust de Conditions de Vida (ENCOVI) for Guatemala, Fiedler and Helleranta [116] reviewed Guatemala’s existing fortification program from an evidence-based perspective. They found that the wheat flour fortification program appeared to have greater potential impact than was previously realized and that, based on current consumption, fortificant levels for sugar with vitamin A were potentially too high. The authors identified an additional vehicle (semolina flour) that, if fortified, would extend coverage to a greater proportion of the population, including to a high proportion of the extreme poor [116].A similar study in Uganda [117] examined the feasibility of fortifying sugar with vitamin A and estimated the comparative coverage, costs, and cost-effectiveness of fortifying sugar instead of, and in addition to, the already fortified vegetable oil.
HCES data have also been used to model the impact of biofortification of staple crops. Using data from the India National Sample Survey, Stein and colleagues examined the likely effect of introducing

GAIN Working Paper Series no. 4
55
golden rice on vitamin A deficiency [118], and of bio fortifying rice and wheat crops with zinc [119] and iron [120]. The authors also compared the cost-benefit of investments in biofortification versus other interventions by calculating the potential disability adjusted life years (Daly’s) saved through the additional consumption of these crops across different geographic and demographic groups in India.
To date, the use of HCES data for fortification programs has been limited to a relatively few experts in the field. However, efforts are being made (including within this publication), to extend, to a wider audience, information about the potential applications, analysis procedures, and limitations of HCES data for meeting specific decision needs. A recent publication by Dary and Imhoff-Kunsch [8] offers detailed, step-by-step guidance for estimating per capita consumption of staple foods using HCES data, while a useful manual prepared by Smith and Subandoro [109] discusses the use of HCES data for calculating various types of national food security indicators. Though the focus of the Smith and Subandoro manual is the assessment of national level food security, it nonetheless offers useful guidance on collecting and processing HCES data and on calculating indicators, some of which are transferrable to the context of food fortification and other nutrition programs. Additional sources of useful information on the use of HCES data include a publication by Fiedler on improving the quality of HCES surveys for food fortification programming [112], and an edited volume released by the FAO that discusses how to derive FAO measures of food security indicators from HCES [9]
5.3 EVIDENCE OF VALIDITY
This section will examine the literature assessing the validity of HCES data for a) estimating food consumption (for determining the level of consumption of foods that are under consideration as potential vehicles for fortification, and/or estimating coverage of food items that are already fortified) and b) estimating nutrient intakes (in order to determine whether micronutrient deficiencies are likely to exist in the population, and in order to set fortification levels).
5.3.1 Sources of Error in Estimating Food and Nutrient Consumption
Before reviewing the validation literature, it is useful to discuss known sources of error in the assessment of consumption using HCES data. Understanding specific sources of error introduced by the design or application of HCES can help to interpret the results of validation studies and can inform the confidence with which one can trust HCES results for specific purposes. A FAO compendium of papers regarding the topic of using HCES data to construct FAO-specific food security indicators makes the distinction between “acquisition data”, “consumption data”, and “intake data” [9].As mentioned in section 5.1, HCES surveys typically collect a mix of “acquisition data” – information on a household’s purchases of food or food received in-kind, and “consumption data” – information that quantifies the amount of food that is actually consumed in a given time period from own production [9].Intake data, such as that collected through individual 24-hour recalls, take information on consumption one step further, in order to measure what different individuals within the household are actually ingesting. Intake data provide more accurate measurements of food and nutrient intake than consumption data, which in turn provide closer proxy estimates of food and nutrient intake than do

GAIN Working Paper Series no. 4
56
purely acquisition data. For this reason, many refer to the measurements generated by HCES, based on a mix of acquisition and consumption data, as measures of “apparent consumption” [110].
There are several elements of potential error introduced by those components of HCES that rely on acquisition data to estimate consumption. These elements include: food given away, food wasted or fed to animals or livestock, and food purchased or received in kind that is stored rather than consumed during the recall period17. Additional error may be introduced in trying to assess individual intake, as the HCES captures information at the household level.
Most HCES, whether in the form of diaries or questionnaires, do not track in-kind food transfers given as payment. A study by Kachaka et al [121] found that there was a differential effect in high-income houses, where food is likely to be given to laborers as a wage, versus low-income houses, where it is likely to be received. The authors found that acquisition data from high-income households overestimated consumption while in low-income households the reverse was true. Earlier studies by Bouis et al. [122] of expenditure data in Kenya and the Philippines found this same positive correlation between income and measurement error, that the authors attributed largely to under-reporting of food transfers as meals for hired workers.
Food wastage includes food spoiled between acquisition and use, or food that is thrown away during preparation.Leftovers and food fed to animals are not types of wastage, but they are potential sources of discrepancies between acquisition and consumption or intake data. A study done in Turkey [123] found that wastage accounts for a significant proportion of acquired food. Household daily energy lost due to waste averaged 481.7 kcal, or 8.9% of dietary energy consumption. Lower income groups showed slightly less waste, and waste levels also varied by type of food. The authors point out that the level of waste found in their study was slightly higher than those detected in other similar studies, where waste levels ranged from 3.8-7% [123]. Whereas many of these studies were performed in relatively higher income countries, a study in the Philippines by Sibrian et al [124] found even higher levels of wastage -- e.g. 62% for milk products, 34% for vegetables -- that also differed significantly by income group as well as food type.
An additional source of error common to HCES surveys has to do with the specificity of food items in the questionnaire. When food lists are not specific enough, not only may they not capture all of the foods consumed, but they may also not be easy to match with descriptions in food composition tables [9, 112].Recall error is a potential issue with HCES as the recall period tends to be a week or longer. The farther back in time a respondent must remember, the more difficult it can be to do so accurately.
Furthermore, error can be introduced during the process of converting the local measurement units used to collect information on quantities into standardized metric equivalents. Many HCES use locally relevant measurement units to facilitate reporting quantities acquired or consumed. This is necessary to ease the cognitive burden and to improve the accuracy of responses. However these units are
17 If the timing of the food acquisition is random, which one might expect, the mean estimates of acquisition will be statistically similar to those of consumption. The issue occurs when trying to estimate the percentage of households consuming food using data based on the percent that are acquiring it, as would be the case when using HCES acquisition data to estimate fortification program coverage. This poses a particular problem when dealing with foods that are acquired and consumed with different frequencies (which is likely for anything that can be stored, like staple goods). (Smith, personal communication, 2/5/12).

GAIN Working Paper Series no. 4
57
often non-standardized, and differ in terms of their corresponding weight or volume across foods and geographic locations. Well-designed conversion tables can help to reduce this type of error.
In order to examine the effect that varying instrument designs have on the validity of food expenditure estimates, Beegle et al. conducted an experimental study in Tanzania that compared 8 different variants of the questionnaire, modifying the instruments’ recall periods, data capture method, and food lists [111]. A personal diary method, completed under regular supervision by enumerators, was considered to be the benchmark against which the other variants were compared. In terms of the list length, the shortest list was associated with 32% lower total food expenditure compared to the benchmark, while a list of the 17 most important food items recorded only 6% lower food expenditure than the longest list of 58 items. Mean food expenditure captured using household diaries was significantly less than using personal diaries, suggesting that respondents have a hard time accurately recalling the expenditures of individuals within their household who may be consuming from outside the ‘family pot’, while the results of the diary method and enumerator-administered recall method did not differ significantly from one another. Illiterate household members were able to complete the diary with the same statistical level of expenditures when visits from supervisors were frequent. Mean food expenditures were higher in the modules with the 7-day recall than with the 14-day recall. This is an important study that drives home the degree to which the design of an HCES instrument matters to the accuracy of measurement.
5.3.2 Validation Studies Comparing Acquisition and Consumption
Several studies have attempted to validate consumption estimates derived from HCES data against the same type of estimates derived from consumption or intake surveys. Most of these studies have focused on estimates of dietary energy, rather than on micronutrients, so it is possible that the findings of these studies may not apply more generally. A study of the Armenia National Household Integrated Living Conditions Survey (ILCS) compared the consumption module results to the results of an HCES-type “acquisition” module [125] and found that, on average, estimates of dietary energy supply were statistically similar using the two methods. However, the average masked inter-income disparities – the acquisition data underestimated consumption relative to consumption data for households in the two lowest quintiles, whereas it overestimated consumption relative to consumption data for the two highest income quintiles [125]. A similar pattern was found in rural (underestimate) versus urban (overestimate) areas. Two additional studies, one in Cape Verde [126] and another in Republic of Georgia [127] yielded similar results, leading to an overestimation of energy deprivation in low-income groups and the reverse in high income groups.
5.3.3 Validation Studies Comparing Acquisition and Individual Intake
HCES are not designed to assess individual food consumption and nutrient intake, as the data are collected at the household level. However, because many nutrition programming decisions require individual intake data, there has been a recent push to identify methods of estimating intra-household food distribution using a range of assumptions and modelling techniques. The most common, but perhaps least robust, approach assumes that all food is distributed according to physiological need, specifically energy requirements, relative to an adult male. The literature reviewed in this section is
GAIN Working Paper Series no. 4
58
comprised of studies that have explored the degree to which the application of such assumptions to HCES data yields accurate estimates of individual intake when compared to a reference measure like the weighed food record or 24HR.
Berti reviewed the literature on intra-household food distribution and analyzed data from 17 different countries in order to assess whether these assumptions can be borne out by empirical evidence [128]. He calculated energy adequacy ratios -- energy intakes relative to energy needs -- of several types of household members, including male and female children, adolescent males and females, and female adults who were and were not pregnant or lactating. The preliminary results of his review suggested that, in the Americas, the energy adequacy ratios of the non-adult males were within 10% of the EAR for adult males. In Asia, young children tended to have energy adequacy ratios that were similar to that of adult men, but were at a moderate disadvantage in Bangladesh and Sri Lanka, where both female and male children suffered equally. In India, both girl and boy children were at a “mild” disadvantage. This finding is not entirely surprising given other evidence suggesting that the male income earner is buffered from food insecurity over children in the household. Women in the Asian country studies were at a mild to moderate disadvantage relative to men in every country but (surprisingly) India.
The results for 5 African countries suggested similar patterns, in that women were mild or moderately disadvantaged across the board. The picture was much more mixed for younger children, where their energy adequacy ratios compared favorably to men in Ethiopia and Zimbabwe but were considered “moderately disadvantaged” relative to men in Kenya, Nigeria and, in the case of young boys, Madagascar. Overall, Berti concludes that intra-household distribution was, in the majority of cases examined, equitable (+/- 20% of male energy adequacy ratio), suggesting that the Adult Male Equivalents (AME) assumptions might be a relatively valid approach in many contexts. It is important to recognize, however, that there was a lot of variability in these results, and in many cases the values predicted by the AME method were not well correlated with those of the reference method. Additionally, his review focused on the distribution of energy only, and not on the distribution of micronutrients. There is some reason to believe that micronutrients, often concentrated in “preferred foods” such as meat, vegetables, or fruit, may not adhere to this same pattern of equity, which would influence the validity of estimates of micronutrient intake. On the other hand, commercial fortification programs are nearly always focused on the fortification of staples, the biggest sources of energy in the diet, and therefore projections of coverage and the level of coverage from fortification of staples might be relatively more valid in relying on AME to approximate intra-household distribution.
In presenting preliminary results from an analysis of Bangladesh data, Lividini [129] compared estimates from a twelve-hour weighed food record containing a subsequent twelve-hour recall including one weekend day obtained from 2 divisions in Bangladesh, to estimates from a national level-HCES that collected acquisition data through a 14 day diary method. The two data sets were used, comparatively, to explore several questions related to food fortification decision-making, including the coverage of vehicles and the intake of fortified vehicles. The author found that the two datasets provided equivalent results in terms of the degree of relative coverage of various vehicles, namely oil, sugar, and wheat flour. However, estimates of absolute coverage varied with respect to wheat flour and sugar. Estimates of food intake for oil by women and children were similar, but varied

GAIN Working Paper Series no. 4
59
for sugar and wheat flour. In this case, the HCES appeared to underestimate intakes of both vehicles relative to the weighed food record.
These findings are cautionary, though some of the difference between the values yielded by the two methods may lie in the design of the validation study. In this instance, the two sets of data used for this study were collected from two samples representative of different populations. Additionally, the two questionnaires were implemented far apart in time and during a period when food prices, and thus consumption patterns, could have been changing quite dramatically [130, personal communication]. Data for these types of validation analyses should be derived from the same households or for the same population around the same time, using similar recall periods.
Smith presents data comparing household energy acquisition and energy intake that she compiled from household surveys in Kenya, the Philippines and Bangladesh. The results of the comparison revealed little difference between the values of the two metrics; in Bangladesh, intake was lower than predicted by acquisition by 1.2%. In Kenya and the Philippines, intake was higher than acquisition by 4.6 and 2.6% respectively [131].Notably, the acquisition and intake data compared in this study were derived from the same survey of the exact same households, which is an optimal validation study design [130, personal communication].
Dary et al. [132] compared household expenditure data with 24-hour recall data for women of reproductive age and children 24-59 months from a survey of two urban and one rural region in Uganda in 2008.The primary purpose of the analysis was to compare “users” (acquirers) of the food product, as a means of determining the utility of HCES data in identifying potential vehicles for fortification. Though the results varied by region and population group, the authors conclude that HCES data provide “acceptable” estimates of usage. Intake estimates were found to be within a range of acceptability, but were considered underestimated for wheat flour. The authors recommend further analysis before drawing conclusions about intake estimates for sugar and animal foods for children.
An additional study in Poland compared acquisition data from a Household Budget Survey collected using a 30-day recall to the results of a 24-hour recall administered on a nationally representative sample of households (all members) as part of the Individual Nutrition Survey [133]. There was reasonable consistency between median consumption of some foods, but there was little correspondence between consumption of bread and rolls, flour, vegetable fats and oils, milk, and five additional food categories. Interestingly, despite poor correspondence in the consumption of several types of foods, energy and nutrient intake corresponded within +/-10% for most nutrients except potassium, vitamin C, and polyunsaturated fat. The authors hypothesize that differences between the surveys may be due to the difference in recall periods, or to some related seasonal effects, and conclude that with some exceptions the estimates are in good agreement. Notably, several of the food products that were not in agreement were among those vehicles most often considered candidates for fortification.
In Sweden, a study compared food purchased by the household, using a 1-month food diary, and food intake by one randomly selected individual in the household, using a 7-day food record [134].Agreement between the methods was +/- 20% for several major food groups, while they differed
GAIN Working Paper Series no. 4
60
by a greater margin for foods like oils and fats, cream, and sugar. The authors conclude that, “Household-based consumption data are useful for many purposes provided the limitations of the data are accounted for” [134, p.1177].
Each of the studies reviewed here examined HCES questionnaires that differed from each other in important ways, including the method of data capture (diary versus enumerator-administered), the recall period, and the number of food items in the expenditure list. There were also important differences in many of the studies between the design or implementation of the instrument being validated and the ‘reference measure’ – for example, many HCES with recalls of 7 days or more were validated against a single 24-hour recall. Because of these factors, it is not possible to draw any firm conclusions from the current literature regarding the degree to which the AME or other approach accurately estimates individual nutrient intakes from household level data. More rigorous and appropriately designed validation studies are critical, as is the need to explore more promising approaches, including statistical methods for modelling individual intakes from household data [See 135].

GAIN Working Paper Series no. 4
61
5.4 APPLYING HCES DATA FOR DECISION-MAKING THROUGHOUT THE PROGRAM CYCLE
5.4.1 Processing HCES Data
This section presents a general overview of the basic steps involved in processing commonly available HCES data to inform various phases of the fortification programming cycle18. HCES are country-specific datasets that reflect the variability of the origins of these multiple purpose household surveys, variations in data collection methods, as well as country-specific variations that occur in food-growing, purchasing, storage, preparation and consumption-related practices [111, 136, 137].Despite their variations, HCES share many common characteristics, including a general questionnaire structure and a general database structure. Most HCES contain weighting or expansion factors (corrected for non-responses) that should be used to “blow up” the sample to the national population totals to enable more directly discussing inferences about the entire population. The questionnaire is organized into sections by topic, and the structure of the HCES database, which will usually be comprised of 15 to 20 files, mirrors the structure of the questionnaire.
There are three HCES files that are of particular interest for food and nutrition analysts:
• the household register file, which has one record for each household,
• the household member roster file, which has one record for each household member/person and
• the food item file, which has one record per food item per household.
Most HCES ask the household if it acquired or consumed each item in the food list (ranging from a single item in some HCES to upwards of 300 items in others) during a specific recall period, most commonly the past 7, 14 or 30 days19.Most HCES ask about three potential sources for each food:
• Was it purchased?
• Consumed from own production?
• Received as a gift or donation?
18 For a more extended description of using HCES to address food and nutrition-related issues see Fiedler et al., 2008 and 2011. For guidelines for designing and/or processing HCES to address food and nutrition-related issues see Smith & Subandoro 2007; Sibrián, Ramasawmy and Mernies 2008; and Fiedler 2009.
19 While most HCES are based on recall (and that is the type presumed in this discussion), there are a substantial number that use a diary approach. The diary approach is often regarded as more precise (Beegle et al., 2010), but has distinct disadvantages, as well: its quality is a function of the level of literacy (among other things) and it requires more field supervisory visits, making the field work more expensive. Beegle and colleagues estimate that the implementation of a diary-based survey costs 6 to 10 times more than a recall-based approach, and, after conducting a comparative analysis of eight different permutations of diary-and recall-based field work designs, they conclude that the 7-day recall approach provides the best combination of tradeoffs of accuracy and cost (while emphasizing that country-specific contextual considerations caution against making broad generalizations from this Tanzanian study).
GAIN Working Paper Series no. 4
62
Most HCES are designed to capture the responses to these three questions by collecting information the foods acquired/consumed using volume or weight measures. Some HCES capture both the quantity and the value of the food (in monetary terms), some only collect information on quantity, and a small (and declining) number record only the value. In instances where HCES capture only values, it is necessary to convert monetary units into physical volume or weight measures. This is obviously a critically important step in the processing of such HCES. There are several different ways this may be done well and will not be discussed here.
HCES data that have been made publicly available have already been cleaned by the agencies implementing them. A common shortcoming of HCES is that there is little discussion of the principles or criteria that should guide, or that have been used, in cleaning the data, and little discussion of what has actually been done. Generally, most publically available HCES will be relatively clean, although additional cleaning may be required. This is not the place for a full discussion of HCES data cleaning criteria and procedures, but some comments and observations are in order.
Food consumption distributions are not normally distributed. For most food items, there will be some persons who do not consume any of that particular food, while at the same time there will be a few individuals who consume a very large amount of it and account for a disproportionate amount of its consumption. A challenge in using HCES data is how to distinguish and treat “outliers” which are outliers due to: (1) errors in data reporting, data recording or data entry, (2) what appear to be outliers based on plausible consumption levels but whose responses might indeed be plausible when the fact that acquisition data are being collected is taken into account, and (3) what are true outliers because these households and their members consume inordinate quantities of the food item in question. Simply regarding large quantities as “outliers” and dropping them from the analysis, is ill advised. Doing so compromises the sample weighting scheme, which will affect the point estimates as well as the confidence intervals estimated using HCES. It is important to first flag extreme values in the dataset. Then flagged values should be more closely inspected for reporting or recoding errors and plausibility before being deemed outliers. Finally, all outliers should be adjusted using an appropriate method of imputation. (See Smith & Subandoro [109] for a more complete discussion about cleaning HCES in preparation for doing a somewhat different type of study; food security analyses).
5.4.2 Using HCES Data to Select Potential Food Vehicle Candidates-1: Identifying Popular Foods
The most fundamental issue in designing a fortification program is: Which food (or foods) should be fortified? Addressing this question requires first reviewing the food list and identifying potential fortification vehicles. For purposes of this exercise, we will assume that the candidate foods are the four most commonly used fortification foods; viz., sugar, vegetable oil, wheat flour and maize flour (meal). The initial analysis consists of running simple frequencies of the food item file to quantify the percent of households that report acquiring or consuming each item.
While the determination of what is “feasible” to fortify is a country-specific outcome of a number of technical, industrial, economic and political issues, in most cases, it is advisable to presume that food consumed from own production and that which is “gifted” are not as likely to be as amenable to being
GAIN Working Paper Series no. 4
63
fortified, and to restrict the analysis to only the purchased portions of candidate foods that are consumed by at least 30 percent of the population [28].It is important to include in the frequency analysis any processed foods that contain a substantial amount of the candidate food commodities. For instance, in the case of wheat flour, the food item list should be reviewed to see if it contains foods—such as bread, biscuits, cakes, pie, pastry, crackers and/or pasta20. To enable identifying the “complete” coverage of fortified wheat flour, a composite variable should be constructed that includes all of the individual food items in the food item list that contain substantial amounts of wheat flour. The same should be done for maize flour. (See Fiedler &Helleranta[116], for a detailed example from Guatemala.)
The initial analysis of the HCES is done using the food item file. This file contains one record for each household for each of the items contained in the food list that indicates whether or not the food item was acquired/consumed by the household. Thus a food file will commonly be comprised of a quarter of a million records or more. By combining the food record with the household record-based data file, it is possible to analyze the distribution of the acquisition of each food item by the various household characteristics the HCES collected data on, including household size, urban-rural and usually (depending upon the sampling frame of the HCES) by region or state. This can be useful program design information. It might reveal, for instance, that maize meal is eaten primarily in rural areas, while wheat flour is eaten primarily in urban areas, such that it would be best to fortify both flours, rather than choosing to fortify only maize or only wheat flour.
5.4.3 Using HCES Data to Select Potential Food Vehicle Candidates-2: Assessing the Adequacy of Consumption Rates
In addition to the number and percentage of households consuming a food, another essential criterion in selecting a fortification vehicle is the amount of food that is usually consumed and, in particular, the proportion of the food consumed that is purchased (since commercially fortified products are typically obtained through purchase). Appealing fortification vehicles are ones that are purchased and eaten regularly and in “sufficient” quantities to ensure that their fortification will result in a “meaningful” contribution to improving nutrition status. As suggested by the quotation marks, these are concepts for which it is difficult to establish a priori, definitive quantified cut-off points or threshold levels. Nevertheless, these concepts suggest ways in which to compare alternative potential food vehicles that should be undertaken in selecting food fortification vehicles. To maximize the additional nutrient intake provided by a fortification program, a food that is generally consumed in small quantities should be fortified at a relatively high level. Conversely, foods that are consumed in large quantities should be fortified at a relatively low level so as not to expose those consuming large amounts at risk of excess intake (thereby ensuring compliance with the public health principle to “first, do no harm”).
20 Foods commonly included in HCES food lists with significant amounts of wheat flour are white (European) bread, whole wheat bread, biscuits, crackers, pasta (cooked/wet), cakes and pastries, which consist of 60%, 75%, 60%, 90%, 28%, 55% and 45% wheat flour (by weight), respectively. A composite measure of the total wheat flour consumed by the household can be constructed by multiplying the quantity of each of these foods consumed by the household by its wheat flour content and summing. These estimates were provided by Quentin Johnson, noted wheat flour fortification specialist, (www.Quican.com, personal communication). Estimates for other foods are available from FAO
GAIN Working Paper Series no. 4
64
All HCES quantify the amount and/or the value21 of household food purchases, but only a handful of them distinguish food that is purchased from food that is consumed. Thus, for most countries, designing fortification programs requires estimating food consumption from food purchase data. Most HCES collect data on the volume or weight of food by using a substantial number of different reporting units. Many of these units are standardized and universal, such as grams, ounces or liters. Others, however, may be regional or local measures, and still others may have common names but may not be standardized in terms of how they are measured.
Information on the quantities of foods consumed is inadequate in and of itself; it is also necessary to incorporate the time dimension, thereby having a rate of consumption measure. Developing a standardized proxy measure of consumption (e.g., grams per day) requires first standardizing the units in which food purchases are reported and then dividing by the number of days in the recall period22. Using HCES data—which is usually a mix of household acquisition and consumption—as a proxy measure of consumption implicitly assumes that the food that is purchased is not wasted, given away or stored for future use, and that none of the food that is consumed during the recall period was previously purchased23. In light of these various potential discrepancies between actual consumption and this proxy measure, it is best to explicitly recognize these shortcomings of the proxy variable and to note that it is most accurately labeled “apparent consumption”. Throughout the remainder of this discussion it is important to bear in mind that HCES-data based discussions of consumption are almost always about “apparent consumption”.
Up until this point, the discussion has focused on how to go about estimating the level of apparent consumption of the household. The setting of fortification levels, however, should be guided by information on the consumption levels of individuals, not households. HCES do not contain information about how food that is apparently consumed by the household is distributed among its members. To use HCES to develop person level estimates of apparent consumption requires additional information or assumptions about intra-household food distribution. Clearly, because nutrition requirements vary by age, gender, physical activity level and other personal characteristics, we can do better than simply using the per capita average.
One method, that takes into account variations in household size, composition and nutritional requirements, assumes that the distribution of food within the household is in direct proportion to energy requirement (i.e., biological need), as captured in the Food and Agriculture Organization’s adult male consumption equivalent (AME) units, and assuming a medium physical activity level [138]. Two literature reviews suggest that the assumption that the intra-household distribution of energy and
21 When data on only the value of purchases is collected, the conversion to quantities can be done by using food price information from other HCES modules or other sources of price data. In making this conversion, given the oftentimes-substantial temporal and spatial variation in prices, it is important to attempt to use, regional- or district-level monthly data, rather than a single national price. If community-level questionnaires are part of the HCES survey, they are the preferred source for this data. If community surveys are not conducted, other common sources of such data are central statistical agencies, central banks, and ministries of finance/economy or of agriculture. 22 Community level surveys are conducted as part of many HCES and may be useful in standardizing measures. These surveys collect information on the price, volume and weight of foods, reporting more standardized unit measure equivalents—such grams or decilitres—for: (1) items that may more commonly be sold in more local, less standardized units (e.g., Uganda’s ngorogoro or Kenya’s pakaacha or its debe), (2) for providing more quantified parameters for general categories (e.g., a “piece” or “heap”) or (3) distinguishing relative size categories (e.g., providing an average weight of a small banana, as opposed to a medium or large one). 23 A common shortcoming of many HCES is that food purchased and/or eaten away from home is not asked about or is asked about in a manner that generally is thought to result in under-reporting.
GAIN Working Paper Series no. 4
65
food approximates the household members’ relative energy requirements is reasonably accurate [128, 139].
Developing measures of the intra-household distribution of food using the “AME method” requires using the person-level file of the HCES. First, each person’s AME is calculated using information about his/her age and gender. Then, each household’s total number of AMEs is computed as the sum of the AMEs of its individual members. Next, each household member’s AME is divided by his/her household’s total AMEs. The quotient is used as a proxy estimate of an individual’s share of the household’s food—i.e., of all food that the household apparently consumes24. This quotient is then multiplied by the household’s quantity of food apparently consumed per day (recall, we are considering only consumption from purchases in this food fortification application discussion) to provide a proxy estimate of the number of grams of the food consumed per day by individual household members.
It should be noted that a variety of permutations of food types and food quantities—which might contain different types and quantities of nutrients -- can be used to reach individual energy requirements, raising the possibility that the distribution of micronutrients within the household may not adhere to the same assumptions as those on which the AME method is based. While some studies have shown that applying the AME-approach to individualize HCES data yielded similar estimates of micronutrient intake as that of a 24-hr recall conducted in Uganda [See 26], further work is required to explore the assumption that the AME method can approximate micronutrient distribution. Alternatively, other methods based on using a semi-parametric regression approach to individualize the data have been explored and also look promising [140, 141]. The question of how best to approximate individual consumption from household data is an area that requires further research.
To recap the discussion to this point, we now have calculated from HCES data the number and percent of households purchasing each of the candidate food vehicles and the quantities of each that are purchased and apparently consumed per day per AME. These are the two key HCES tools for (1) selecting food fortification vehicles and (2) modelling the potential coverage and quantifying the additional nutrient intake of a fortified food. These same two measures can also be used to simulate fortification program parameters and to set fortification levels and/or to assess existing fortification levels.
5.4.4 Modeling Fortification with HCES Data: Setting or Assessing Fortification Levels
How to go about setting or assessing fortification levels is the outcome of simultaneously considering public health, technical and economic considerations as is discussed in detail in the WHO-FAO Guidelines on Food Fortification with Micronutrients [28] and the “Food Fortification Formulator” [142], and need not be repeated here. The focus here, instead, is on the “how to’s” related to modelling fortification levels.
24 It is important to recognize that this assumption probably overestimates the amount of fortifiable foods received by an especially vulnerable group; viz., the youngest children (those under five) and, in particular, those who are breastfeeding.
GAIN Working Paper Series no. 4
66
HCES can be used in two different ways to set or assess fortification levels. One approach is to use them to quantitatively model the additional nutrient intake that fortification can provide (what we label a “marginal, provisional” approach), without explicitly taking into consideration either individuals’ total nutrient intake or individuals’ nutritional status. The second approach is to use HCES to first estimate the individual’s usual intake of nutrients and nutrient status, and then use this information in combination with the “marginal, provisional” approach to set or assess fortification. The latter of these methodologies is of a more recent vintage and, because there have been few comparative analyses of results produced using this method and more commonly employed methods, it is somewhat more controversial. We discuss the two approaches in greater detail.
5.4.4.1 Setting or Assessing Fortification Levels Using the Marginal, Provisional Approach
The marginal, provisional approach to using HCES is commonly used in situations where because other information on nutrient status is not available or because deficiencies, in general, are so highly prevalent and/or so commonly severe that is thought to be “unnecessary” to know more specifics about individuals’ nutritional status or to estimate the impact of fortification on individuals’ nutrition status because there is an imperative to “do something now”. We label this approach “marginal/provisional” because it does not address the bigger, more comprehensive issue of the usual intake of the nutrient(s) in question, is not definitive, and is focused on only the incremental additional intake attributable to fortification.
Where fortification levels are established, the additional intake attributable to fortification can be readily estimated using the person-level HCES file. Generally fortification levels are specified in terms of milligrams per kilogram (or, independent of units of measure, in parts per million or ppm)25. The computations are as follows: if the “apparent consumption” level of the food vehicle (based only on food purchases) is expressed in grams per day, it is divided by 1,000 in order to express it in kilograms. Then multiplying this result by the fortification level yields the additional intake of the micronutrient in milligrams per day. The resulting quantity divided by the individual’s Estimated Average Requirement (being sure to take into account the appropriate characteristics of the individual—including age, gender, pregnant/lactating) provides a measure of the impact of fortification; viz., the percent of the EAR provided by the individual’s apparent consumption of the fortified food26.
HCES data can also be used to ex ante model alternative fortification policy options in countries that do not yet have fortification programs or established fortification standards. Many countries, even 25 The analyst must be careful in reviewing fortification regulations as there are important differences in the ways in which they are commonly reported. In some countries, regulations establish official required minimum micronutrient levels that must be added to foods. In other instances, they establish minimums that must be contained in the food—which will be the outcome of what is added and what is lost before sale to households for final consumption. In yet other instances, laws and regulations establish an average level that must be maintained and sometimes identify a range of levels that the average must fall within. These differences need to be taken into account in simulating fortification. 26 The discussion here is simplistic, and ignores the possibility that some of the food item sold is not fortified. If fortification is mandated, this is not likely to be a significant issue, as long as there is adequate policing of compliance. If fortification is voluntary, however, there may be a significant amount of supply that is not fortified. In that case, it is necessary to supplement the HCES data with information about the supply side—the industrial structure of the particular food market in question—and to adjust the HCES simulation parameters to avoid over-estimating the impact of fortification. For more detailed discussion of potential sources of this supplementary data and how this adjustment might be done see Fiedler 2009a. For a Guatemalan-specific application and set of considerations, see Fiedler & Helleranta 2010.

GAIN Working Paper Series no. 4
67
some in which there is no fortification, already have legally established fortification levels, which should be used in these modelling exercises. Furthermore, given that in many countries fortification standards have been set without sound national data, the modelling of fortification levels need not be—indeed, should not be—restricted to investigating only the established legal standards. A critical public health issue in setting or assessing fortification levels is the issue of the upper limit for vitamin A, and whether or not fortification with vitamin A contributes to some individuals being at risk of excess vitamin A intake. Using HCES to simulate fortification programs can provide useful information about the likelihood that the upper limit (equal to 3,000 µg per day for women 15-49 years of age) has been crossed, as well as the number and percentage of households and individuals who have exceeded it. It is noteworthy that there have been at least two HCES-based studies that have shown that legally mandated fortification levels are likely to be contributing to some persons being at risk of excess vitamin A intake, and suggesting, therefore, that fortification levels may be too high [116, 117].Moreover, using HCES to investigate the additional potential impact could find just the opposite to be true as well: i.e., that fortification standards have been set lower than necessary to ensure safety and that increasing fortification levels could improve nutrition status.
5.4.4.2 Setting or Assessing Fortification Levels: Using HCES Data to Measure Nutrient Intake
The second way in which HCES can be used to set or assess fortification levels is to first estimate individuals’ usual intakes of nutrients and nutrient status and then to use this information in combination with the “marginal, provisional” approach to set or assess fortification levels. The estimation of usual intake is calculated from information on all of the items in the food list and all of the sources of those foods (purchases, consumption from own production and gifted), together with information on the nutrient content of each food item, which is obtained from a food composition table (preferably one for the same country). In essence, this approach uses HCES data as a substitute for the same type of information that would be provided by a 24 HR or observed-weighed food records of food consumption that nutritionists generally employ. How well the HCES data proxy the 24 HR or observed-weighed food records’ data is largely a function of (a) how comprehensive the food item list is (being extensive and inclusive, yet not being so detailed as to encourage over-reporting or to cause interview or interviewee fatigue so as to undermine the accuracy of quantitative recall estimates) and (b) how well the food item list captures important differences in the nutrient content of a food (due primarily to variations in how it is prepared) which could otherwise be a source of discrepancy between the two food consumption methodologies’ estimates of nutrient intake.
Each individual’s intake of each nutrient is calculated as the product of the quantity of each food item apparently consumed by the individual and the nutrient content of the food (reported as per 100 grams in the food consumption tables), and summed across all foods. To minimize the potential discrepancies in applying the two methods (i.e., ensure HCES more closely track what would be estimated using 24 HR) several adjustments should be made in the HCES-reported data:
• Edible portion: Food quantities should be adjusted downward by including in the nutrient content estimates only the estimated percentage of the food that is edible
GAIN Working Paper Series no. 4
68
• Bioavailability: The estimates of total iron and zinc intakes are compared to EARs which are adjusted for bioavailability based on the age and gender characteristics and the average estimated phytate content of the average diet in the country in question (IOM 2001, IZiNCG 2004). Age- and gender-group specific adjustments in EARs are made for bioavailability based on the Institute of Medicine (2001) standards for iron and International Zinc Nutrition Consultative Group (IZiNCG) (2004) standards for zinc. While it depends on the specific country being analyzed, generally an unrefined cereal-based diet is assumed to be the norm. For women of 14 to 50 years of age, this results in bioavailability rates of 5 percent for iron and 25 percent for zinc. For vitamin A, bioavailability is assumed to be 100 percent and the conversion rate from beta-carotene to retinol is assumed to be 12:1
• Vitamin A losses in fortified foods: Another adjustment that is made is to reduce the vitamin A content of fortified foods to take into account the fact that the amount of vitamin A added by the fortification process is likely to subsequently be compromised when the fortified food item is prepared. Drawing on commonly reported food preparation-based estimates of losses, the vitamin A content of fortified foods is reduced assuming that the losses of VA due to cooking or baking are 20 percent for vegetable oil, 15 percent for wheat flour and maize flour and 15 percent for sugar [142].We assume there are no food preparation losses in the iron or zinc content of fortified foods.
5.4.5 Using HCES Data to Characterize Nutrient Adequacy
The cut-point method is used to evaluate the adequacy of vitamin A and zinc intake. Individuals whose intakes are below the EAR for their age and gender (and taking into account the usual diet) are classified as having inadequate intake. Those whose intakes are equal to or above that average are classified as having adequate intake. In the case of iron, because the distribution of daily requirements for women of child-bearing age or young children is not normally distributed, the probability method is used to classify the adequacy of individuals’ intakes. First, the individual’s usual iron intake is calculated from the HCES. Then the IOM Dietary Reference Intake for iron guidelines are used to assign a probability of inadequacy to the individual, based on that intake level together with age and gender characteristics (IOM, 2001, Appendix I). Thus, whereas in the case of vitamin A and zinc, the individual’s inadequate intake status is characterized dichotomously (0/1), in the case of iron the individual is assigned a probability that varies between 0.00 and 1.00.For all three micronutrients, the prevalence of inadequate intake is equal to the mean of the population-based measures of inadequate intake.
5.4.6 Reporting Food Fortification Results, Estimating Additional Nutrient Intakes and Impacts
In reporting food fortification results it is imperative to distinguish households that are consumers of the fortified food and those that are non-consumers. To state the obvious, non-consumers do not benefit from fortification. Fortification results, however, are sometimes reported in terms of population averages, which combine consumers and non-consumers, and may unwittingly encourage potentially misleading inferences and conclusions with undesirable consequences for policymaking [e.g.
GAIN Working Paper Series no. 4
69
143]Population-based impact measures of fortification programs that are not conditioned on consumption ignore the entire issue of the coverage of the intervention, and provide measures of impact in terms of the average increased intake or average reduction in inadequate intake (a proxy for reduced deficiency)—both of which will under-estimate the impact of fortification on individuals who consume the food vehicle. By including non-consumers in the impact measure denominator, unconditional measures of impact, reduce the average estimated impacts. Rather than presenting population-based estimates of the average impact, the preferred way to report fortification program results is using two parameters:
• the prevalence or percent of persons apparently consuming the vehicle—which equals the coverage of the program; i.e., the proportion of persons who will be reached by the intervention, and,
• the amount of food consumed per day by those individuals consuming some of the food vehicle; i.e., conditional upon their apparent consumption of the food vehicle.
Compared to the single parameter, population-based approach, the two parameter approach makes clear that the entire population is not likely to benefit from fortification, but that those that do will benefit relatively more than the population-based approach would seem to suggest. Both parameters are pertinent for policymakers.
It is important to note that, for some fortification vehicle candidates such as salt, the purchase and consumption patterns are likely to be different. In these cases, the food item is likely to be purchased more infrequently than it is consumed, and in larger quantity. Scenarios like this result in overestimating consumption among apparent consumers of the fortification vehicle. In turn, fortification levels are likely to be set lower because consumption appears high. However, while the use of HCES data in this instance would result in setting fortification levels lower than might be desirable from an impact-maximization perspective, the direction of this bias is appropriate from a public health (safety) perspective, because it ensures that individuals consuming substantial amounts of the food item are not unintentionally put at risk of excess intake of a nutrient due to fortification.
5.5 RESOURCE REQUIREMENTS
HCES data are collected by central statistics agencies for purposes other than food and nutrition analysis. The data are publicly available, thus the cost to nutrition or food security program planners for using HCES data is limited to the time and other resources associated with data analysis. Because of this key difference between using HCES and dietary assessment methods, like 24-hour recalls or food frequency questionnaires, which rely heavily on primary data collection for nutrition programmatic decision-making, the assumption has been that using HCES data is a relatively less expensive option. Just how much less expensive was an unanswered empirical question, until recently, when Fiedler et al. [70] tackled this question by estimating the costs of HCES and 9 24-hr recall surveys using an ‘ingredients’ approach in order to derive a detailed cost comparison.
GAIN Working Paper Series no. 4
70
Section 3.5 presents the parameters and assumptions by Fiedler et al. related to costing the 24-hour recall for comparison to HCES data. This section focuses on the resource requirements of HCES data. According to Fiedler et al, the component costs of HCES data analysis are the cost of the time involved to obtain the data from the sponsoring agency and time to analyze it [70]. Analytical demands are quite similar to those needed to analyze 24-hour recall data, in that both methods require transforming information on quantities of food consumed into the quantities of nutrients consumed using a food composition database – HCES often involves the added step of transforming information collected in common household measurement units into standardized measures of weight and volume. This task is sometimes carried out as part of the data collection phase (via a separate community level survey) or must be done post-hoc by local food experts.
Fiedler et al. estimate that 25 days of person time is required to process HCES data and to model potential fortification scenarios, without transforming ‘food’ quantities into nutrient constituents [70]. Analyzing nutrient intake, which requires the use of the food composition database and assumptions related to intra-household distribution of nutrients, would increase the total level of effort to approximately 50 days of person time. If an analyst were paid commensurate with the going rate of approximately $600/day, then the cost of analysis of HCES survey data for the purposes of fortification program design would range from $15,000-$30,000, depending on the nature of the analyses, as specified above. Based on these estimates, the analysis of HCES data costs 8.5 times less than the implementation and analysis of a 24-hr. recall. If the 24-hour recall were performed on a nationally representative sample the size of the HCES (E.g. 8500 households), the implementation and analysis of 24 hr. recall data would cost approximately 75 times more than the analysis of the HCES [70].
5.6 SUMMARY OF STRENGTHS AND WEAKNESSES
This section reviews the strengths and weaknesses of the HCES discussed throughout the chapter. The final chapter presents guidance on when to choose the HCES relative to other methods, and for what purpose.
5.6.1 Strengths
• HCES can determine intakes at the household level from combinations of foods
• Data are already available, and updated at regular intervals
• Longer recall period makes it more suitable for assessing “usual intake”
• Can be used to identify which foods are being consumed by various population subgroups of interest (e.g. region, urban/rural, income level, gender of household head)
• Can be used to model potential reach and coverage and estimate likely benefit based on apparent consumption levels.

GAIN Working Paper Series no. 4
71
5.6.2 Weaknesses
• HCES usually yield only household level data
• HCES usually only measure “apparent consumption” - does not account for food wasted, given to pets or given away, and often does not adequately account for food consumed away from home
• Does not always identify food items specifically enough to accurately calculate their nutrient content or to determine whether they are suitable vehicles for fortification.

GAIN Working Paper Series no. 4
1
6 FOOD BALANCE SHEETS AND FOOD PRODUCTION DATA
6.1 OVERVIEW AND CHARACTERISTICS OF THE APPROACH
Food Balance Sheets (FBS) are important sources of secondary data for use in determining country-level food consumption patterns. Developed by the Food and Agriculture Organization (FAO) of the United Nations, food balance sheets (also referred to as national food accounts, supply/utilization accounts, food disappearance data, and food consumption level estimates) are the most commonly used data sources for estimating food consumption at the national level in developing countries [20]. Food Balance Sheets were developed during the First World War, but considerable interest in them did not emerge until the after the second world war when post-war food shortages created a need for a tool to measure national food supplies. The purpose of the earliest Food Balance Sheets was similar to its present day objective, that is, to illustrate the food and agricultural situation at the level of individual countries and to allow for comparison of international data.
Food Balance Sheets (FBS) “present a comprehensive picture of the pattern of a country’s food supply during a specified reference period” [10, p.1]. They also “provide comprehensive information on patterns, levels, and trends of national diets” [10, p.v].Food Balance Sheets report food available for consumption at the national level. They do not directly measure individual food intake, or how food or nutrients are distributed within the population. Despite some of the limitations of FBS data, one of their key strengths is that they are a source of nationally-representative, low cost, and freely accessible food data. FBS data can be used to estimate which foods may be suitable fortification vehicles. They may also be used to broadly suggest which micronutrient deficiencies may be common in the country due to shortfalls in availability of nutrient-rich foods.
FBS for individual commodities, and for the overall food supply, are calculated using the following simplified equation:
Food available for consumption = (quantity imported + quantity produced) – (quantity exported + seed + animal feed + waste + other uses) + changes in stocks.
Foods tracked through the FBS include both primary commodities (e.g., wheat, rice, fruit, vegetables) and a number of processed commodities (e.g., vegetable oils, butter) [10]. The quantity of food exported and relegated to seed, animal feed, other uses and waste are known as “utilization elements”, which represent the use of commodities for purposes other than human consumption. It is important to note that all deductions from the available food supply are those that occur within the commercial sphere; household level food losses (e.g., allocation of food to pets and livestock, wastage at home, etc.) are not factored into calculations. In principle, the “changes in stock” variable covers increases or decreases in the stocks of governments, farms, wholesale and retail merchants, manufacturers, importers, exporters, and transport and storage enterprises [144]. Usually, only government stock changes are included and even this information may not be available for all
GAIN Working Paper Series no. 4
2
commodities and in all countries. As a result of the often incomplete information on changes in stock, food balance sheets are often calculated as an average for several years “as this is believed to reduce the degree of inaccuracy contributed by the absence of information on stocks” [10, p.12].
Data sources. The main source of food balance sheets globally is FAO; however, country governments occasionally calculate national FBS themselves. In all cases FBS are composed of the following four categories of data: production and trade, production stocks, feeding and seeding rates, and losses in industrial processing. Losses in industrial production do not typically include the losses that occur during milling since food balance sheets constructed by FAO often do not include data on flours (e.g., wheat and maize flours). Even though FAO does not calculate FBS data on flours, flour data can be derived by applying the extraction rate reported by the milling industry.
Data within each category are obtained from multiple sources. Table 6.1 presents the types of data included in FBS calculations and their most common sources. The data themselves are usually collected routinely by governments and private sector actors listed in Table 6.1. These data are then compiled by the Basic Data Branch (ESSB) of FAO’s Statistics Division (ESS), and used to generate Food Balance Sheets, among other types of agricultural statistics. Since FBS data are public goods, collected for purposes other than nutrition program analysis, food and nutrition analysts that wish to use the data can do so free of cost. All statistics generated by FAO, including Food Balance Sheets, are available to the public on its website, http://faostat.fao.org/. The generation and public dissemination of food and agricultural statistics is an element of FAO’s core mandate.
As is often the case with secondary data, the types of data described above are not usually collected with the sole intention of being used to construct a FBS. Instead, they are typically collected to support the operations of a country’s public and private food and agriculture sector. As a result, the information available may not be entirely consistent with respect to measurement unit or time period. FAO statisticians tasked with creating a country’s Food Balance Sheet therefore often have to make adjustments to the basic data and estimate the missing data in order “to maintain a certain degree of consistency, completeness, and reliability of the resulting food balance sheets” [10, p.4]. If insufficient data are available then FAO will not produce a FBS for that particular country until more data are provided.
Potential for disaggregation. FBS data cannot be disaggregated beyond the national level and do not provide direct information on individual levels of consumption. FAO applies food composition factors to calculate per capita annual and daily energy (kcals), protein, and fat (g) available for consumption in a given country, and food composition tables can also be employed to estimate per capita availability of micronutrients. However this approach does not factor in the actual distribution of food intake among individuals comprising a country’s population, so consumption estimates cannot be disaggregated validly below the national level or according to other variables of interest to food fortification programmers, such as socio-economic status, age, or gender.
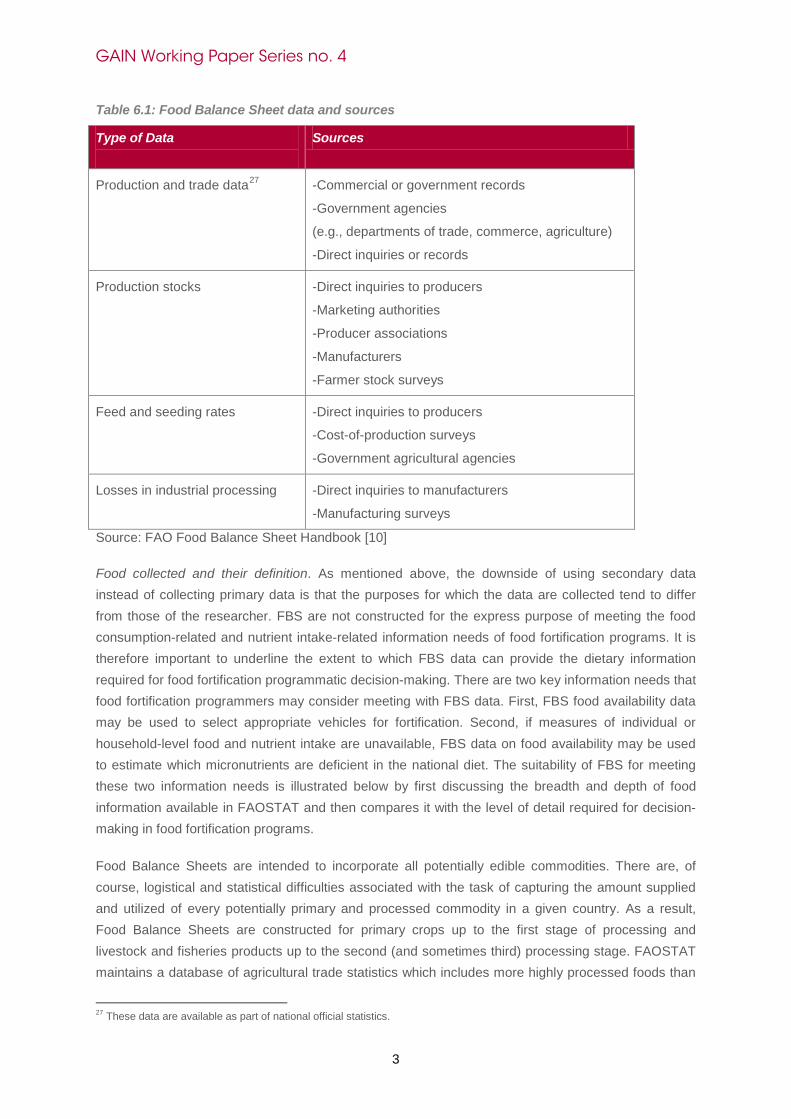
GAIN Working Paper Series no. 4
3
Table 6.1: Food Balance Sheet data and sources
Type of Data
Sources
Production and trade data27
-Commercial or government records
-Government agencies
(e.g., departments of trade, commerce, agriculture)
-Direct inquiries or records
Production stocks -Direct inquiries to producers
-Marketing authorities
-Producer associations
-Manufacturers
-Farmer stock surveys
Feed and seeding rates -Direct inquiries to producers
-Cost-of-production surveys
-Government agricultural agencies
Losses in industrial processing -Direct inquiries to manufacturers
-Manufacturing surveys
Source: FAO Food Balance Sheet Handbook [10]
Food collected and their definition. As mentioned above, the downside of using secondary data instead of collecting primary data is that the purposes for which the data are collected tend to differ from those of the researcher. FBS are not constructed for the express purpose of meeting the food consumption-related and nutrient intake-related information needs of food fortification programs. It is therefore important to underline the extent to which FBS data can provide the dietary information required for food fortification programmatic decision-making. There are two key information needs that food fortification programmers may consider meeting with FBS data. First, FBS food availability data may be used to select appropriate vehicles for fortification. Second, if measures of individual or household-level food and nutrient intake are unavailable, FBS data on food availability may be used to estimate which micronutrients are deficient in the national diet. The suitability of FBS for meeting these two information needs is illustrated below by first discussing the breadth and depth of food information available in FAOSTAT and then compares it with the level of detail required for decision-making in food fortification programs.
Food Balance Sheets are intended to incorporate all potentially edible commodities. There are, of course, logistical and statistical difficulties associated with the task of capturing the amount supplied and utilized of every potentially primary and processed commodity in a given country. As a result, Food Balance Sheets are constructed for primary crops up to the first stage of processing and livestock and fisheries products up to the second (and sometimes third) processing stage. FAOSTAT maintains a database of agricultural trade statistics which includes more highly processed foods than
27 These data are available as part of national official statistics.

GAIN Working Paper Series no. 4
4
are found in the food balance sheet database of FAOSTAT [145]. Though trade data may be available for certain highly processed foods without additional information on national production and utilization food fortification programmers cannot make judgments about the national food supply. It is also worth noting that the lack of data on highly processed foods in FAOSTAT makes it difficult to accurately estimate the availability of micronutrients in the food supply since processing alters the nutrient profile of a food.
Table 6.2 includes a list of the food categories covered in a typical Food Balance Sheet and indicates common fortification and biofortification vehicles that fall within these categories. More details on the specific commodities that are often collected within each of these seventeen categories can be found in FAO’s Food Balance Sheet Handbook [10] and FAOSTAT’s FBS database [146]. Information on FAO’s commodity classification scheme and commodity definitions can be found on FAO’s website [147]. FAO recommends that countries use its list of foods as a guide and adapt the construction of their Food Balance Sheets according to the types of commodities available within the country [10]. As a result the precise commodities covered in food balance sheets tend to differ from country to country. Table 6.1 FAO FBS food categories and commonly fortified and biofortified foods
Food categories represented in FAO Food Balance Sheets
Foods within categories that are commonly fortified or biofortified?
1. CEREALS AND PRODUCTS28
Milled rice, wheat flour, and maize flour: fortified and biofortified
2. ROOTS, TUBERS AND PRODUCTS
Roots and tubers, particularly sweet potatoes: biofortified
3. SUGARS AND SYRUPS Raw and refined sugar: fortified
4. PULSES Beans: biofortified
5. OILS AND FATS29 Vegetable oils: fortified
6. MILK AND CHEESE Milk: fortified
7. TREE NUTS To date commodities from these categories have not been selected as vehicles for fortification or biofortification 8. FRUIT AND PRODUCTS
9. MEAT
10. EGGS
11. FISH AND FISHERIES PRODUCTS
28Unless otherwise stated production data for all commodities are reported in FAOSTAT at the farm-level (excluding harvesting losses). FAOSTAT does not provide data on flours this estimates must be calculated manually using the extraction rate reported by the milling industry. 29 The “oils and fats” category refers to both vegetable oils and fats of animal origin.

GAIN Working Paper Series no. 4
5
Food categories represented in FAO Food Balance Sheets
Foods within categories that are commonly fortified or biofortified?
12. STIMULANTS To date commodities from these categories have not been selected as vehicles for fortification or biofortification 13. VEGETABLES AND PRODUCTS
14. SPICES
15. ALCOHOLIC BEVERAGES
16. OILCROPS
17. MISCELLANEOUS (infant food, ice cream, non-alcoholic beverages, etc.)
Source: FAO FBS Handbook [10],Wirth [148, personal communication]
As Table 6.2 indicates, FBS categories cover all major food groups. Though the breadth of coverage is fairly comprehensive, reference to the FBS Handbook and FAOSTAT’s FBS database reveals that the depth of each category, that is, the number of commodities and the degree to which they are processed, is quite limited. Fortification vehicles are often minimally processed foods; the vehicles listed in Table 6.2 are an example. Despite the tendency toward fortification of largely unprocessed foods, biscuits, noodles, soy sauce, fish sauce, and bouillon cubes are examples of more highly processed foods that are currently being fortified that are not identifiable from FBS data [7, 149].When there is no option to collect primary data or to use secondary data like HCES, and when FAOSTAT only provides limited data on a vehicle of interest (or no data at all) food fortification specialists should seek information from food industry organizations (e.g. food manufacturers, industry associations, etc.) or relevant government departments (e.g., international trade data).
The decision as to whether one should use FBS data to determine the availability of a specific fortification or biofortification vehicles requires assurance that such information can be derived from the FAO FBS. FAOSTAT’s food balance sheet database contains at least some level of information on all of the common vehicles listed in Table 6.2; however, the level of information varies from commodity to commodity. The way in which FAO defines and classifies its commodities is important because fortification vehicles may be slightly more processed than the commodities referred to in FAOSTAT (e.g., wheat vs. wheat flour, raw sugar vs. refined sugar). Salient features of FAOSTAT’s classification scheme and commodity definitions as they relate to fortification and biofortification programmers are discussed below.
Rice, wheat and maize: Rice, wheat flour, and maize flour are common fortification vehicles. FAOSTAT’s food balance sheet database contains information on milled rice, which is defined as “white rice” [147]. White rice is the typical vehicle in rice fortification programs since high rice-consuming nations tend to consume white rice rather than brown [150]. FBS can therefore provide useful information to fortification programmers on the type of rice that is most typically fortified. Wheat and maize data reported in FAOSTAT food balance sheets are reported at the farm-level in terms of grains. Since it is wheat and maize flour which are typically fortified and food balance sheets available on FAOSTAT’s website do not report data on the amount of wheat and maize flour available for
GAIN Working Paper Series no. 4
6
consumption these data must be calculated manually. In order to calculate the amount of flour available for consumption (and the daily g/capita availability) in a country the extraction rate reported by the milling industry must be applied30. For wheat and maize flours the extraction rate tends to fall between sixty and eighty percent depending on the type of flour (e.g., more refined flours, such as pastry flour, have lower extraction rates than whole wheat flour) [151]. Section III of the Food Balance Sheet Handbook outlines the necessary steps to construct FBS data for wheat flour [10]. Though procedures for constructing maize flour data are not discussed in the FBS Handbook they would follow the same protocol outlined for wheat flour data.
Milk: Data for “milk” that are reported in FAOSTAT’s food balance sheet database refer to fresh whole cow’s milk [147]. Trade data, on the other hand, may contain information on milk from a number of animals (e.g., cows, goats, sheep, buffalo); skimmed milk; and condensed, evaporated, and dried milk [145]. It is important to recognize this distinction in definition because a milk fortification program may not fortify liquid whole milk; the fortificant is often not added to the milk until it is processed into dry skimmed milk [149].
Pulses, roots, and tubers: As noted in Table 6.2 pulses, roots and tubers are common biofortification vehicles. Data on the “pulses (or beans)” in FAOSTAT’s food balance sheet database are not disaggregated by commodity. According to FAO’s commodity classification scheme, in FAOSTAT’s food balance sheet database the variable “Beans” actually encompasses a number of different varieties of bean (kidney, lima, adzuki, etc.); however, there are trade data available for only lentils and cowpeas [145, 147]. The FAOSTAT food balance sheet database contains more detailed information on roots and tubers; yams, sweet potatoes, and potatoes are listed separately31.
Vegetable oils: A number of different vegetable oils that are commonly fortified such as soybean, palm, and maize are listed in FAOSTAT’s food balance sheet database.
Sugar: Either refined or raw sugar can be fortified [152]. FAOSTAT’s food balance sheet database contains information on raw sugar (a grainier, less refined sugar than typical table sugar) though trade data on refined sugar can be found in the TRADESTAT database.
As the discussion above notes, it is important for fortification programmers to be aware of how FAOSTAT defines foods listed in its FBS database. The FAO definition may differ significantly from the food that fortification programmers are seeking information on. In some cases the data available may require additional processing in order to meet the information needs of food fortification programmers (e.g., application of the extraction rate to wheat data to calculate FBS data for wheat flour). Readers should consult the FAO commodity classification and definition document for more information [147].
Frequency of collection. As of the printing of this publication FAOSTAT’s food balance sheet database contains annual country data up until the year 2007. The statistics used in the construction of FBS are
30 The extraction rate is the percentage of the original amount retained after milling. The rate also determines the food composition regarding energy and nutrients which changes according to the type of wheat (soft or hard) and the milling rate (FAO, 2001). 31 Biofortification specialists can consult FAO’s webpage on commodity classifications and definitions to find more information on the specific plant species referred to by the FAO data (FAO Unknown date).

GAIN Working Paper Series no. 4
7
collected by government and private sector actors but the degree and frequency with which they are collected varies from country to country. FAOSTAT’s website currently states that FBS are not available for some countries due to insufficient data and that updates will proceed when more information is provided to FAO’s statisticians (http://faostat.fao.org). On a positive note, a 2006 study by the Southern African Development Community (SADC) found that all fourteen of its member states had constructed one or more food balance sheets in the last year, suggesting that some countries with limited resources available for data collection still make a fairly consistent effort at collecting commodity data [153]. The study also noted, however, that the highest quality and most frequently collected data tend to be for cereals while data on other crops, livestock, and fisheries tend to be scarcer and/or of lesser quality[153].
Temporality of data generated. The coverage period for Food Balance Sheets is one year; however, the estimates may be expressed in either calendar year or crop year. When the temporality of variables used to construct FBS differs statistical adjustments must be made to improve the accuracy of the data. As mentioned previously, FBS are sometimes constructed to report averages over a number of years as a means of improving the accuracy of the data.
Degree and type of quantification. FAOSTAT food balance sheets provide data on the annual per capita quantity of food available for consumption (kg/capita/year). This indicator is a national estimate of apparent consumption only, but has been used as a proxy estimate for “annual per capita consumption”; however, this approach assumes universal consumption of the food item which is rarely true. Since FAOSTAT data are not disaggregated by household or individual, they do not provide information on the proportion of the population that actually consumes the food. Using FAOSTAT’s food supply quantity (kg/capita/year) indicator as a proxy for “annual per capita consumption” thus underestimates individual consumption of a fortified product because the number of food vehicle eaters is often lower than the total population. FBS data therefore cannot be used to estimate reach and coverage of a fortification vehicle.
In addition, FAOSTAT calculates the per person daily availability of energy (kcal/capita/day), protein (g/capita/day), and fat (g/capita/day) for the total food supply and individual commodities, but does not calculate the availability of micronutrients yielded from the foods. Consequently food fortification programmers will need to consult food composition databases to derive this information (see Section 3.3 for more information on food composition databases).

GAIN Working Paper Series no. 4
8
6.2 WHO IS USING FBS DATA? FOR WHAT PURPOSES?
FBS data are used in the design of both food fortification and biofortification programs. The Global Alliance for Improved Nutrition (GAIN) compares FBS data from different sources and data from different dietary assessment methods to approximate consumption of the food vehicle, in order to recommend fortification levels according to the WHO guidelines or other regional standard [148, personal communication]. Section 6.5 presents a case study provided by GAIN which details how FBS data are used in combination with other data sources to estimate the daily food consumption by the target population and calculate the appropriate level of fortificant to add to the vehicle.
FBS data are used by other prominent organizations involved in food-based micronutrient programs. The Flour Fortification Initiative uses FBS trend data on wheat production, imports, exports, and total amount available for consumption in its feasibility assessments for prospective country programs. FBS have also been used by HarvestPlus to identify countries with high per capita consumption of key staples (rice, wheat, maize, etc.) in order to determine appropriate country candidates for its biofortification programs [154]. There is also evidence of FBS data being used to advocate for greater public attention to micronutrient deficiencies. Dr. Kenneth Brown of the University of California at Davis has used FBS data to “estimate the zinc content of national food supplies […], the assumed bioavailability of that zinc based on phytate, zinc molar ratios; and the relation between absorbable zinc and theoretical requirements according to country-specific demographics” [155, p.113]. Brown’s estimates have been used to advocate for greater focus on combating zinc deficiency through fortification programs [155, 156].
6.3 EVIDENCE OF VALIDITY
The validity of FBS data in estimating population or individual-level food consumption and nutrient intake has received very little attention among researchers. Despite the limited validation literature, there is a strong conceptual basis to believe that FBS will not measure food consumption and nutrient intake with a high degree of validity. FBS data exclude information on significant sources of food and nutrients such as foods that are highly processed, homegrown, and sold in the informal sector. FBS data are also reported in per capita terms and therefore differences in distribution according to age, sex, and socio-economic status are not captured. The discussion below summarizes the available literature on the FBS validity.
Only one study could be identified that compared the dietary data from FBS to individual-level dietary intake data. Serra-Majem et al. conducted a comparative analysis of mean food consumption (g/person/day) data from national-, household-, and individual-level surveys for four countries; Canada, Finland, Poland, and Spain [16]. The study concluded that Food Balance Sheets overestimated food consumption and nutrient (energy, carbohydrate, fat, protein, and alcohol) intake when compared to estimates provided by individual dietary surveys (i.e., 24HR and a food record). Micronutrient levels were not examined in this study. This effect was observed in all four countries. Drawing conclusions from the results of this study is difficult, however, because the dietary assessment methods compared across the four countries differed in design and scope.
GAIN Working Paper Series no. 4
9
Preliminary data from unpublished research by the International Food Policy Research Institute (IFPRI) show mixed results in terms of agreement between per capita food availability levels predicted by FBS and individual intakes measured in 24HR surveys. The multi-country study showed a high level of agreement between per capita levels of maize availability predicted by Food Balance Sheets and maize intake measured by 24HR surveys [157, personal communication]. FBS estimates of per capita maize consumption (grams/day) for adult women and children aged 4-6 years were 400 and 200, respectively [154]. Maize consumption levels measured in 24HR surveys in the same population were strikingly similar: 365g/day for adult women and 182g/day for children aged 4-6 years, respectively [157, personal communication]. On the other hand, FBS estimates of per capita consumption of sweet potato in adult women and children were double that amount actually consumed (as measured by 24HR) [157, personal communication]. Mourad Moursi, nutritionist at IFPRI/Harvest Plus, hypothesized that FBS might be better able to predict consumption levels of foods widely consumed in the population (such as maize) rather than less frequently consumed items (i.e., sweet potato) [157, personal communication]. To our knowledge, this hypothesis has not been explored in the literature.
The accuracy and reliability of FBS estimates depend heavily on the quality of the data used to construct the FBS. The challenge of incompleteness and inaccuracy of data are most problematic in countries with poorly funded statistical departments. Several factors complicate efforts in this area. For one, FBS do not capture production excluded from official production statistics – that is, any production intended for the exclusive use of the household, and food attained via gathering, fishing, or hunting. Given the significance of the informal sector and subsistence production in many developing countries, the risk of incomplete FBS data is correspondingly high.
Another factor affecting the reliability and accuracy of FBS data is the incentive to underreport production statistics in environments with severe taxation systems [158, personal communication]. Furthermore, the FAO reports that although “import and export data may be reasonably accurate in the majority of countries, […] in some countries significant amounts of trade across national boundaries go unrecorded” [159]. Customs officials may focus their attention on imports at the expense of exports since taxes and/or quantitative controls are generally concentrated more on imports than exports [159].
6.4 RESOURCE REQUIREMENTS
Perhaps the greatest benefit of using FBS to estimate food consumption and nutrient intake levels is that they are publically available, secondary data and therefore accessible and cost-effective to use. Relying on FBS data to make food fortification programming decisions avoids a number of the costs associated with primary data collection and analysis. Since FAOSTAT does not provide information on the micronutrient content of foods a food fortification program planner will have to consult a food composition database to obtain this information. Additional resources should be allotted for the purpose of converting quantities of food available into estimates of available micronutrients; however, as mentioned above this process should be quite straightforward.
GAIN Working Paper Series no. 4
10
6.5 APPLYING FBS DATA FOR DECISION-MAKING THROUGHOUT THE PROGRAM CYCLE
Though limited in many aspects, food balance sheets can be used to provide crude estimates to inform the program design information needs described in this section.
6.5.1 Which Micronutrients Should be Provided?
Food Balance Sheets provide a snapshot of the amount of food available for consumption within a specified reference period in a country. This snapshot of a country’s food supply can give an indication of which micronutrients may be lacking in the national diet. For instance, if a country’s food balance sheet indicates that supply of vitamin-A rich foods is very low that may mean that vitamin A deficiency is common, though the FBS provides no information on the distribution of poor intakes or deficiency. In reality the population may be receiving additional micronutrients via foods that were not included in the FBS (e.g., home-produced food) or supplements. FBS data therefore can be viewed as a useful starting point to address this question but individual-level data should be collected to confirm FBS estimates. FBS data alone cannot provide a sufficient answer to this question as the basis for determining which micronutrients, if any, should be added to the food supply.
6.5.2 Which Foods Should be Fortified?
FBS data can be used to suggest candidate vehicles for fortification; however, they lack key information on which to base program design decisions. Commodities that FBS indicate are consumed at ‘adequate’ levels on a g/per capita/day basis may be appropriate fortification vehicles. However, fortification vehicles tend not to be consumed universally or in equal amounts by all population sub-groups, despite the assumptions made by the FBS. The FBS does not provide information on the proportion of the population that consumes a vehicle, which is a key data need for vehicle selection, as the higher the proportion the greater the fortification program coverage is likely to be. Individual or household-level data, such as that provided by the FRAT or the HCES, can be used complementarily with FBS data to provide information on the percentage of individuals or households in the country who purchase the commodity, the socioeconomic and demographic traits of household purchasers, and the form in which the commodity is consumed.
6.5.3 What Should the Fortification Level Be?
Food fortification programs strive to reduce the prevalence of micronutrient deficiencies while minimizing the risk of excessive micronutrient intakes among individuals who consume the vehicle in the greatest quantities. In order to achieve this objective, the use of individual and household-level data should be prioritized over FBS data when determining fortification levels. However, FBS data can be used as part of a complementary approach to determine fortification levels, as detailed in the following case study of GAIN’s use of FBS for this purpose:

GAIN Working Paper Series no. 4
11
GAIN case study: Using FBS data to determine fortification levels [160, personal communication]
A vegetable oil fortification project is being planned in an unnamed country. Consumption statistics from various sources are used to determine ‘average consumption’ and to set fortification levels. Data from Food Balance Sheets (g/capita/day) from 1998 and 2007, a 2005 HCES, and a 2008 industry study on the national vegetable oil supply were triangulated in order to produce an estimate of average daily intake (g) of vegetable oil/person. Five-year growth rates (2000-2005) produced by FAO were used to estimate daily per capita consumption for the year 2010 since a Food Balance Sheet for this year is not currently available. HCES data for the country indicate that not every household purchases vegetable oil therefore necessitating adjustments to the average per capita intake (g) figure. Demographic statistics derived from the country’s 2005 Demographic and Health Survey (DHS), purchasing information from a 2000 HCES, and the per capita consumption estimate are then used to calculate the per capita intake (g) by consumers of the fortified product. This figure is assumed to apply to the entire adult population so distinctions in intake between males and females and adults of different ages are not made. GAIN uses the hypothesis that children aged 1-2.9 years and 3-5 years old eat 1/3 and 2/3 the quantities of adults, respectively. The estimated average daily consumption (g) of vegetable oil among adults and children from purchasing households can then be used to determine the appropriate amount of fortificant to add to the vehicle. Estimated Average Requirements (EARs) for women of reproductive age and children ages 3-5 and 1-2.9 are used in combination with estimates of daily consumption to determine fortification levels.
6.6 SUMMARY OF STRENGTHS AND WEAKNESSES
6.6.1 Strengths
FBS offer unique benefits to nutrition professionals that are unmatched by the other approaches to measuring food consumption discussed in this paper. A key strength in using FBS data is that FBS data are publicly available and thus can be obtained easily and with zero data collection costs to the nutrition programmer. Analyzing FBS data for the purposes of food fortification program design is a relatively simple process and therefore does not require a large investment in time, finances or human capital. However, a common refrain among nutrition professionals interviewed as part of this review was that there is often a tradeoff between cost and data quality.
The ease in attaining FBS data and the relative simplicity in analyzing it will be of benefit to programmers with limited resources. The fact that FBS data are official, government data can also be of benefit to food fortification programmers, since fortification recommendations based on FBS data may confer greater acceptance among governments since the recommendations are based on data collected by the governments themselves. In a sense, it is difficult for governments to dispute these recommendations when they are accountable for the data on which the recommendations were based [161, personal communication].
An additional strength of FBS data is that it provides information on trends in population-level food consumption patterns. The World Health Organization (WHO) Guidelines on Food Fortification with
GAIN Working Paper Series no. 4
12
Micronutrients state that FBS provide “useful information about usual dietary patterns and also on the average consumption of certain foods that are rich in micronutrients or in absorption inhibitors, which in turn can be used to predict probable micronutrient deficiencies” [28, p.142]. This statement should be understood as referring to the utility of FBS data to provide information on average consumption of certain foods on a year-by-year, national-level basis and not on the basis of usual daily consumption of individual sub-groups. National food consumption patterns are ever changing and FBS data continue to be the most often used source of information in assessing these trends. For example, Fiedler [162] recently used FBS data from forty-four countries to illustrate rapid changes in consumption of wheat flour between 1995 and 2007. Though there are areas in which FBS data could be improved upon, this data source has been, and continues to be, valuable to researchers attempting to monitor the dynamic nature of national food consumption patterns.
6.6.2 Weaknesses
Despite the unique advantages offered by FBS data, these data also have a number of limitations worth consideration. In terms of their ability to measure food consumption for the purpose of informing food fortification programs, perhaps the greatest weakness of FBS data is its inability to provide disaggregated information on the distribution of food and nutrient intake across a number of different variables (i.e., geographic, demographic, socio-economic, seasonal). Decisions relevant to food fortification programs generally require information on the consumption habits of key target populations. Lack of information in FBS on variables of key importance to food fortification programmers (i.e., socioeconomic status, age, and gender) make the estimates yielded by FBS data crude at best.
The limited level of specificity of the information provided by FBS data presents a second weakness in its ability to inform food fortification programs. Although FBS include estimates of both primary and minimally processed commodities, the food categories employed may be too vague to capture potentially fortifiable products such as biscuits, noodles, or bouillon cubes.
A third weakness in using FBS is the inability to take into account the impact of storage and cooking practices on bioavailability of micronutrient content of foods. FBS data provide information on the quantity of food available at the point of sale but storage and cooking techniques have the potential to reduce micronutrient content. Without this information the ability to accurately predict appropriate vehicles for fortification, fortificant levels or the prevalence of population-level micronutrient deficiencies becomes increasingly difficult.
A fourth weakness of FBS is the lag in reporting of FBS data. The most current FBS data on the FAOSTAT website is from 2007; however, in some cases country data are more than five years out-of-date. Data from developing countries with poorly funded statistical departments are even more likely to be out of date. These same countries are often confronted with high levels of micronutrient deficiencies and are therefore likely to be appropriate candidates for food fortification programs; however, the use of FBS data for the purposes of informing such programs may prove difficult or inaccurate due to the lack of timely information.

GAIN Working Paper Series no. 4
13
A fifth weakness associated with FBS and industrial production data32 is the issue of incomplete or underreported data that is used to construct FBS. This limits its usefulness to food fortification programmers. As mentioned above, punitive taxation systems may create a disincentive to producers to register as formal businesses. Beyond the needs of fortification programmers, there is also little commercial interest in using production data, which is another reason this type of information is not readily available [158, personal communication].As a result industrial production, and therefore FBS, may underestimate the size of the available food supply. The task of obtaining more accurate data on production often requires speaking directly with producers and producer associations. Quentin Johnson and Jack Bagriansky, two food fortification specialists with extensive experience in the field, state that establishing a level of trust is necessary in order to overcome producer reluctance to report production statistics. The ability to fill in information gaps by speaking with producers directly is largely dependent on the number of producers in a given market since obtaining producer information in a highly decentralized market will be infeasible.
32 Industrial food production data are a component of FBS data. These data are derived from many different sources including relevant government bodies (agriculture, industry, trade, and tax departments) and the private sector (merchants, trade associations, etc.). Occasionally, current FBS data will not be available in which case industrial food production data may be used in its place in food fortification programming. Often industrial food production data are used to answer production-related questions (e.g., market capacity, number of millers, etc.) but it is noteworthy that they can also be used in much the same way FBS data are used - to illustrate the pattern of dietary intake at the national level.
GAIN Working Paper Series no. 4
14
7 DISCUSSION AND CONCLUSIONS
Food consumption and nutrient intake data are essential for informing design, monitoring, and evaluation decisions in food fortification and other food-based nutrition programs. Together with technical, regulatory, and supply-side considerations, food consumption and nutrient intake data form part of the core package of information needed to develop and implement effective fortification interventions. Dietary habits are dynamic and evolving, particularly in this era of rapid globalization. Monitoring long-term dietary trends and regularly updating data enables fortification programs to adapt to changing conditions and maintain as relevant a design as possible.
This paper reviewed four of the most common methods of dietary, describing their key characteristics, resource requirements, and evidence of their validity. For each method, the paper also recommended procedures for generating key indicators that can be used to identify the extent of inadequate micronutrient intake across the population, to select vehicles for fortification, set fortificant levels, monitor coverage, and evaluate impact. The objective of the paper was to assist program designers in choosing the most suitable and valid methods for their purposes within given budget constraints and requirements for precision. By providing guidance in the use of different types of data to answer key questions of programmatic interest, the hope is that program implementers will find these tools to be more accessible for designing and implementing contextually-appropriate, effective food fortification and other food-based nutrition interventions.
The remainder of this section discusses the relative validity and resource requirements of the four methods for programmatic purposes requiring the measurement of food consumption and nutrient intake. Tables 7.1a and 7.1b rate each method as “highly valid” in satisfying a data element (meeting high standards of validity, recommended as a first choice option if resources allow), “moderately valid” (meeting moderate standards of validity, recommended as a second best option if resources do not permit the first choice option),“low validity” (meeting few standards of validity and generally not recommended) and “no validity” (not feasible to accomplish with the method and thus not recommended for the purpose).Summary ratings of the methods’ validity for different programmatic purposes were calculated by averaging the ratings of the individual data elements needed to measure food consumption and nutrient intake.
Table 7.2 rates the level of resources required (high, moderate, low to none) to carry out various aspects of the dietary assessment method, from instrument development to data analysis. All ratings represent the judgment of the authors based on a synthesis of the data collected for the paper. The information from these tables formed the basis for guidance regarding method selection.
7.1 VALIDITY AND USEFULNESS OF DIETARY ASSESSMENT METHODS FOR MEASURING FOOD CONSUMPTION
The data needs for measuring food consumption, in order to a) identify appropriate food vehicles to fortify and b) to measure reach and coverage, are less demanding than for constructing indicators of nutrient intake, as the information does not need to be precisely quantified and there is no need to convert food quantities into their constituent nutrients.

GAIN Working Paper Series no. 4
15
7.1.1 Identifying Food Vehicles for Fortification
As shown in Table 7.1a, the 24HR and SQFFQ/FRAT were both rated as highly valid methods for measuring food consumption for the purpose of identifying food vehicles. The advantages of both methods, relative to the HCES, which received an overall “moderately valid” rating, are that they measure consumption of the potential food vehicles by target individuals, whereas the HCES collects data at the household level, requiring the analyst to make assumptions about consumption by individual members. Both the 24HR and the (SQ)FFQ/FRAT have the flexibility to collect data on potentially fortifiable but less conventional vehicles, like bouillon cubes, that are often not represented in an HCES food list. However, the fact that the nationally-representative HCES data do not need to be collected first-hand, while 24HR and FRAT data do, may trump the advantages of the other methods in many cases. Moreover, because HCES are conducted routinely, they could be modified to capture potentially fortifiable foods, though the method is not as flexible for this purpose as those relying on primary data.
Traditionally, FBS data have been used for identifying candidate vehicles by calculating estimated per capita daily consumption of various food items. The FBS data measure “apparent consumption” at the national, level – a proxy approach that is less valid than direct measures like 24-hour recall and also less valid for this purpose than the HCES, which derives per capita consumption estimates from household-level measures of apparent consumption. The FBS estimates are gross averages across the population, whereas HCES data can assess the distribution of consumption by socio-economic status or geographic area. Unlike the FBS, HCES can distinguish whether or not a food vehicle that is ‘apparently consumed’ is amenable to being fortified, as reflected in whether or not it is industrially processed and widely obtained through purchase. Collected annually, FBS data are useful for charting trends in food available for consumption over time, and thus for projecting the likely continued demand for candidate vehicles. However, because the method is unable to yield most of the key data elements listed in Table 7.1.a, it received a summary rating of ‘low, to no validity’ for measuring food consumption for the purpose of vehicle identification.
7.1.2 Assessing Coverage
Estimates of reach and coverage during routine monitoring have been proxied using production data coupled with estimates from secondary data of the per capita consumption of the fortified product. Such indirect approaches, however, are best suited for tracking general trends in the production of fortified products rather than for actually confirming that the intended beneficiaries are consuming fortified foods as planned.
Coverage surveys, implemented either as periodic monitoring assessments or as part of an impact evaluation, are a more expensive but reasonable complement to the use of secondary data, when production and distribution estimates indicate that coverage has reached a critical mass within a given geographic area. In order to estimate reach and coverage from a coverage survey, target individuals must be queried about their consumption of the fortified food and products that contain it. The 24HR method is rated as ‘highly valid’ for this purpose, as is the FFQ. The FFQ is a flexible method that allows for an assessment of only those food(s) being fortified and the various types of processed
GAIN Working Paper Series no. 4
16
products that contain the fortified food(s).While the precise information on portion sizes offered by the 24HR would be useful, it is not essential for the calculation of reach and coverage indicators, so the tool can remain short and easy to administer. With its approach to assessing frequency of consumption over a period longer than a single day, a simplified FFQ can provide a picture of coverage that is more representative of usual consumption than a 24HR.The sample for the FFQ can be designed to enable the assessment of coverage of target population subgroups.
As described above, the HCES received a rating of “moderate validity” for the measurement of food consumption. In terms of usefulness, though the HCES can be used to project estimates of reach and coverage at the outset of the project, HCES data are generally not collected often enough to provide timely information for the purpose of program monitoring. FBS data cannot be used for making coverage projections, as they contain no information about target population consumption. FBS data are also not very useful for program monitoring as there are often lengthy delays in updating annual FBS figures.
7.2 VALIDITY AND USEFULNESS OF DIETARY ASSESSMENT METHODS FOR MEASURING NUTRIENT INTAKE
As discussed above, indicators of nutrient intakes (and inadequate intake) should be measured for the following purposes: (1) identifying the risk of micronutrient deficiencies in the population, (2) providing a baseline measurement against which to assess impact, (3) setting fortificant levels, (4) measuring “effective coverage”, (5) measuring “excessive coverage” and, (6) evaluating impact, sometimes in conjunction with biomarkers.
As shown in Table 7.1.b, the 24HR method was rated as the most valid, of those reviewed here, for generating estimates of the nutrient intake. However, to capture usual intakes, a 24-hour recall must be performed on at least two non-consecutive days on at least a subset of the total sample, which is not commonly done [137]. The SQFFQ is better than 24HR method at assessing usual intakes due to its longer recall period though, conversely, a reliance on long recall periods places a high cognitive burden on the respondent that has been shown to affect the accuracy of the responses [111]. Like the SQFFQ, the HCES relies on a recall longer than a single day. Both methods are only as good as the food lists that they contain, and both only approximate portion sizes by asking the respondent to recall the amount acquired/consumed according to common local measures. The HCES method adds additional error due to the fact that it measures “apparent consumption”. HCES estimates are derived from a mix of consumption and acquisition data reported at the household level and rely on assumptions about intra-household food distribution, which would likely result in less accurate estimates than data from a carefully developed SQFFQ administered to individuals. HCES data are nationally representative, and can be disaggregated geographically and by socio-economic subgroups. SQFFQ are typically, though not necessarily, administered on a relatively small sample due to resource constraints. While FBS data are readily available, they are not valid for estimating intakes: they are blunt, national level measures of food availability – not acquisition or consumption – and cannot measure variations in the distribution of food availability across key geographic or demographic segments of the population.

GAIN Working Paper Series no. 4
17
7.3 RESOURCE CONSIDERATIONS
The resource demands of each of these approaches must be taken into consideration in determining the optimal choice of methods for a particular programmatic purpose. As summarized in Table 7.2, the 24HR method was rated as the most resource-intensive overall due to the time and expertise required at each step of the process – from the development of locally relevant weights and measures and/or food models to the time necessary to collect the portion sizes of all foods consumed during the course of a day. Of all four methods, the (SQ) FFQ requires the largest up-front investment of time and expertise -- to develop and validate the instrument comprised of contextually appropriate food lists and portion size options -- but a validated (SQ) FFQ is typically less time-consuming to administer than a 24-hour recall, particularly when its focus is limited to foods associated with a small set of key nutrients. HCES are comparable to 24-hour recall data and FFQs in terms of data collection burden; however the HCES was scored as requiring “low” levels of resources due to the fact that HCES data are commonly available as secondary data collected for purposes other than nutrition programming. The time and expertise required to analyze HCES data to calculate food consumption or nutrient intake is comparable to that required by the 24HR and FFQ methods. FBS, like HCES, are readily available as secondary data. As such the use of FBS is likely to be as or slightly less resource intensive than HCES and much less resource intensive than the 24HR method.
There are few studies that quantify the relative cost of applying these four methods. Fiedler et al. [70] conducted an ingredients-based costing exercise comparing the marginal cost of obtaining and analyzing secondary HCES data to the cost of collecting and analyzing 24-hour recalls. The authors calculated that implementing a 24-hour recall on a typical HCES-sized, nationally representative sample (~8,500 households) would cost approximately 75 times more than the analysis of HCES to generate nutrient intake indicators. A recent paper by Kristal and colleagues compared the estimated costs of 1) a 3-day food record 2) 3 24-hour recalls, and 3) a single FFQ developed and administered in the United States [72]. In this paper they calculated the cost per day of the food record to be $48.3 and that of a single 24 hr. recall to be $52, compared to a cost of $7.5 per FFQ, suggesting that the 24-hour recall is up to 7 times more expensive than an SQFFQ to implement. These authors’ estimates are US-based, and do not consider the labor-intensive, up-front resources needed to develop and validate the SQFFQ. Once a SQFFQ has been rigorously developed and validated, it is much less expensive than a 24-hour recall to implement on a nationally representative sample. The HCES and FBS methods are the least expensive options, as the only associated costs are those of obtaining and analyzing the data from the sponsoring agency.
7.4 RECOMMENDATIONS
The considerations of validity, usefulness, and cost discussed above can be distilled into guidance for choosing dietary assessment methods that are suitable for program life-cycle specific decisions. Assuming a realistic resource endowment, typically, though not always, one would select a method meeting at least moderate standards of validity and usefulness for the purpose and requiring moderate to low levels of resources. Large-scale FFP require considerable resources to implement, and spending at least a small percentage of total program cost on assessments is justified.
GAIN Working Paper Series no. 4
18
Needs Assessment: Needs assessment data are used to identify micronutrient deficiency at the level of a public health problem and to compare results across geographic and socioeconomic strata to prioritize target groups at relatively higher risk. For prioritizing which micronutrients and subgroups require public intervention in a given context, the HCES method offers moderate validity at the lowest cost for estimating the risk of inadequate intakes, though the results are less valid than those yielded by a 24-hour recall or (SQ) FFQ for this purpose. Since data at this stage will not be used for more specific information such as setting fortificant levels or estimating effective or excessive coverage, implementing a more intensive survey such as a 24-hr recall is likely not necessary.
Feasibility Assessment and Program Design: As above, the HCES strikes the best balance among validity, usefulness and cost considerations for designing fortification programs – to identify vehicles and as a tool for projecting coverage and modelling potential impact.
Program Baseline: The 24-hour recall is the most valid but also the most costly method for estimating nutrient intakes. However, every effort should be made to conduct a 24-hour recall as part of the baseline survey – at least on a representative subsample, to confirm estimates of nutrient intake by HCES and to serve as the starting point against which all program progress will be assessed. At this stage, accurate estimates of food and nutrient intake are required in order to calculate the average gap in the estimated average micronutrient requirement (EAR) that needs to be overcome, to estimate the prevalence of “excessive coverage” (those at risk for exceeding the upper level (UL) of micronutrient intake), and to fine-tune fortificant levels. The 24-hr recall is best equipped for these purposes.
Program Monitoring: Tracking reach and coverage could be handled by a brief FFQ/FRAT that focuses only on the consumption of the food vehicle and associated products. Highly valid for this purpose, this type of short and focused instrument would be less expensive than a 24-hour recall or a full-blown SQFFQ and, unlike the secondary data methods, can be integrated when needed into a coverage survey. Monitoring effective and excessive coverage requires more highly quantified information on nutrient intakes, including from food other than the fortificant vehicle, and thus would require a SQFFQ or 24-hour recall to yield at least moderately valid results.
Impact Evaluation: Assessing impact should entail re-administering the baseline assessment of nutrient intake using a 24HR method, in association with the collection of biomarkers where feasible and appropriate. Whereas the biomarkers would be used to assess changes in deficiency status, the 24HR data would be useful for attributing changes in deficiency to increased nutrient intakes via fortified foods, holding constant intake of other sources of the nutrient.
7.5 CONCLUSIONS
Five overarching conclusions emerge from this review.
1) None of the dietary assessment methods discussed here is a perfect gold standard. Each one has strengths and weaknesses that vary according to the specific purpose to which it is applied.
GAIN Working Paper Series no. 4
19
2) Because some methods are better suited for particular applications than others, the methods should be used complementarily to answer different, but related, questions and to triangulate results.
3) Method selection should be driven by its validity and usefulness for a given purpose, but resource requirement considerations are also unavoidable. There are trade-offs between the degree of validity of a method for a particular purpose and its cost.
4) Understanding the sources of potential bias and error introduced by a particular methodological choice is important for making a selection and interpreting the results.
5) Many of the weaknesses identified in this paper are not immutable. Simple modifications to the way that data are collected or processed, or just a few additions to a questionnaire, can further strengthen these methods and their results for use in micronutrient programming (see Fiedler [7]for HCES-related suggestions).
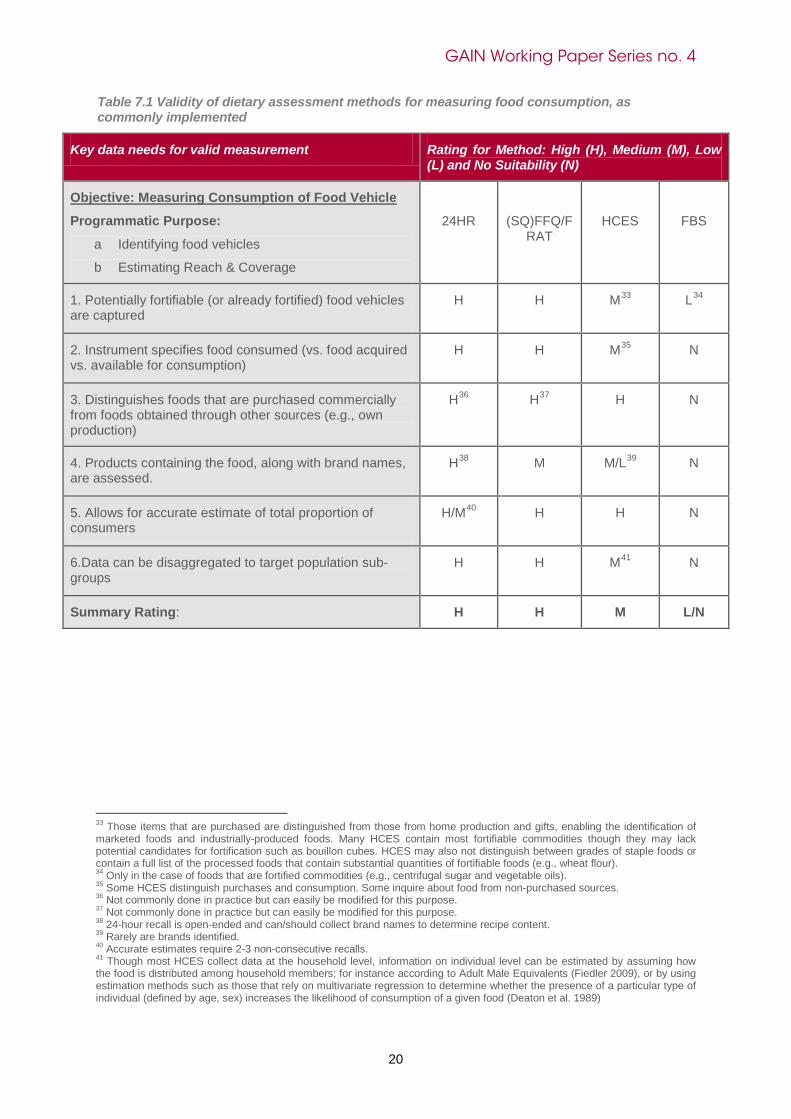
GAIN Working Paper Series no. 4
20
Table 7.1 Validity of dietary assessment methods for measuring food consumption, as commonly implemented
Key data needs for valid measurement Rating for Method: High (H), Medium (M), Low (L) and No Suitability (N)
Objective: Measuring Consumption of Food Vehicle
Programmatic Purpose:
a Identifying food vehicles
b Estimating Reach & Coverage
24HR
(SQ)FFQ/FRAT
HCES
FBS
1. Potentially fortifiable (or already fortified) food vehicles are captured
H H M33 L34
2. Instrument specifies food consumed (vs. food acquired vs. available for consumption)
H H M35 N
3. Distinguishes foods that are purchased commercially from foods obtained through other sources (e.g., own production)
H36
H37 H N
4. Products containing the food, along with brand names, are assessed.
H38 M M/L39 N
5. Allows for accurate estimate of total proportion of consumers
H/M40 H H N
6.Data can be disaggregated to target population sub-groups
H H M41 N
Summary Rating: H H M L/N
33 Those items that are purchased are distinguished from those from home production and gifts, enabling the identification of marketed foods and industrially-produced foods. Many HCES contain most fortifiable commodities though they may lack potential candidates for fortification such as bouillon cubes. HCES may also not distinguish between grades of staple foods or contain a full list of the processed foods that contain substantial quantities of fortifiable foods (e.g., wheat flour). 34 Only in the case of foods that are fortified commodities (e.g., centrifugal sugar and vegetable oils). 35 Some HCES distinguish purchases and consumption. Some inquire about food from non-purchased sources. 36 Not commonly done in practice but can easily be modified for this purpose. 37 Not commonly done in practice but can easily be modified for this purpose. 38 24-hour recall is open-ended and can/should collect brand names to determine recipe content. 39 Rarely are brands identified. 40 Accurate estimates require 2-3 non-consecutive recalls. 41 Though most HCES collect data at the household level, information on individual level can be estimated by assuming how the food is distributed among household members; for instance according to Adult Male Equivalents (Fiedler 2009), or by using estimation methods such as those that rely on multivariate regression to determine whether the presence of a particular type of individual (defined by age, sex) increases the likelihood of consumption of a given food (Deaton et al. 1989)

GAIN Working Paper Series no. 4
21
Table 7.2Validity of dietary assessment methods for measuring nutrient intake, as commonly implemented
Key data needs for valid measurement Rating for Method: High (H), Medium (M), Low (L) and No Suitability (N)
Objective: Quantifying Nutrient Intake
Programmatic Purpose
c Identifying the extent of Inadequate Intake
d Setting fortificant levels
e Estimating Effective Coverage & Excessive Coverage
f Evaluating Impact
24HR
(SQ)FFQ/
FRAT
HCES
FBS
8. Data are at an individual-level H H L42 N
9. Foods consumed containing micronutrient (MN) of interest are measured
H M M/L43 L
10. Foods consumed outside the home as well as inside are included
H H L44 N
11. Waste, food fed to livestock, and portions given to guests are accounted for
H H L N45
12. Quantity consumed is accurately estimated and is convertible to standard measurement units
H M M/L46 L47
13. “Usual intake” is adequately captured M48 H49 M50 N
14. Food lists are disaggregated sufficiently to enable conversion to nutrients using food composition database
H M M/L L
SUMMARY RATING H H/M M/L L/N
42 Though most HCES collect data at the household level, information on individual level can be estimated by assuming how the food is distributed among household members; for instance according to Adult Male Equivalents (Fiedler 2009), or using estimation methods such as those that rely on multivariate regression to determine whether the presence of a particular type of individual (defined by age, sex) increases the likelihood of consumption of a given food (Deaton et al. 1989) 43 Many HCES contain most fortifiable commodities though they may lack potential candidates for fortification. HCES may also not distinguish between grades of staple foods or contain a full list of processed foods. Foods lists can be modified to meet this data need. 44 Few HCES currently include data on food consumed outside the home. Whether or not this data need is met is dependent upon the food list. 45 It contains a function related to wastage, but not related to food for livestock or portions for guests. 46 Most provide quantitative estimates of apparent consumption (not consumption) at the household (not individual) level. 47 It does not measure consumption but food availability is convertible to standard units. 48 Usual intakes at the individual level can be captured at the “H” level with multiple non-consecutive recalls, which are often not done due to resource considerations. 49 SQFFQ/FRAT will capture “usual” (average) but not variability (e.g., seasonal variation) unless repeated. 50 HCES can only proxy intake by assuming how the food is distributed within the household (e.g., according to adult male equivalents), but it generally has a recall period long enough to capture “usual” apparent consumption.
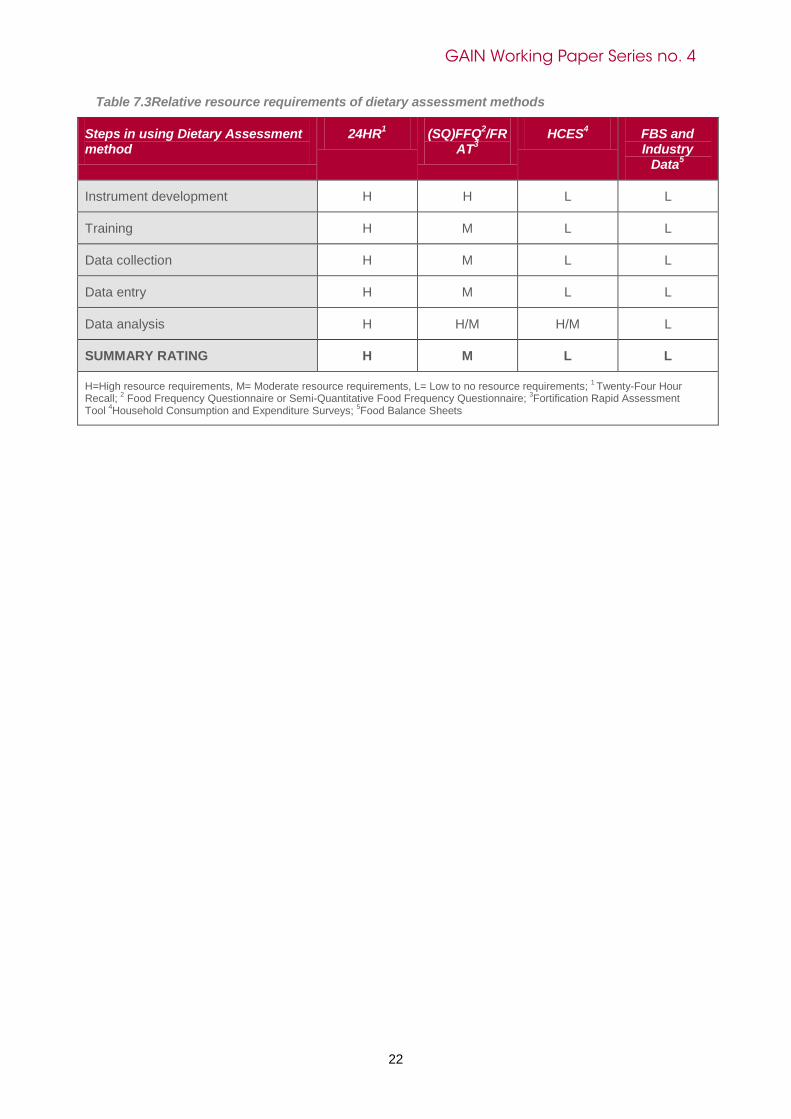
GAIN Working Paper Series no. 4
22
Table 7.3Relative resource requirements of dietary assessment methods
Steps in using Dietary Assessment method
24HR1 (SQ)FFQ2/FRAT3
HCES4 FBS and Industry
Data5
Instrument development H H L L
Training H M L L
Data collection H M L L
Data entry H M L L
Data analysis H H/M H/M L
SUMMARY RATING H M L L
H=High resource requirements, M= Moderate resource requirements, L= Low to no resource requirements; 1 Twenty-Four Hour Recall; 2 Food Frequency Questionnaire or Semi-Quantitative Food Frequency Questionnaire; 3Fortification Rapid Assessment Tool 4Household Consumption and Expenditure Surveys; 5Food Balance Sheets
GAIN Working Paper Series no. 4
23
8 REFERENCES 1. Gibson RS, Ferguson, E.L. An interactive 24-hour recall for assessing the adequacy of iron
and zinc intakes in developing countries. Washington, D.C.: HarvestPlus, 2008. 2. Labadarios D, Steyn NP, Maunder E, MacIntryre U, Gericke G, Swart R, Huskisson J,
Dannhauser A, Vorster HH, Nesmvuni AE, Nel JH. The National Food Consumption Survey (NFCS): South Africa, 1999. Public Health Nutrition 2005;8:533-43.
3. Phil Harvey ZR, Omar Dary. The 2008 Uganda Food Consumption Survey. Washington, D.C.: A2Z: The USAID Micronutrient and Child Blindness Project, AED, 2010.
4. Hickling S, Knuimana M, Jamrozikb K, Hungc J. A rapid dietary assessment tool to determine intake of folate was developed and validated. Journal of Clinical Epidemiology 2005; 58: 802–08.
5. Micronutrient Initiative. Fortification Rapid Assessment Tool (FRAT) Guidelines: Micronutrient Initiative, 2003.
6. Dupriez O. What Can/Should Be Changed in HIES? Monitoring, Assessment and Data (MAD) Working Group Workshop on Measurement of Food Consumption for Food Fortification and other Nutritional Purposes: Methods, Applications and Policy Implications. Washington, D.C.; 2011.
7. Fiedler J. Strengthening Household Income and Expenditure Surveys as a Tool for Designing and Assessing Food Fortification Programs. International Household Survey Network 2009;IHSN Working Paper No. 1.
8. Dary O, Imhoff-Kunsch B. Guide to estimating per capita consumption of staple foods using Household Income and Expenditure Survey (HIES) data. ECSA/A2Z Monitoring and Evaluation Workshop Kampala, Uganda; 2010.
9. Sibrian R, editor. Deriving Food Security Information from National Household Budget Surveys: Experiences, Achievements, Challenges. Rome: Food and Agriculture Organization of the United Nations; 2008.
10. FAO. Food Balance Sheets: A Handbook. Rome, 2001. 11. Messick S. Validity of psychological assessment: validation of inferences from persons’
responses and performance as scientific inquiry into score meaning. . American Psychology 1995;50:741–9.
12. Goodwin LD, Leech NL. The meaning of validity in the new Standards for Educational and Psychological Testing: implications for measurement courses. Meas Eval Couns Dev 2003;36:181–91.
13. Streiner DL, Norman GR. ‘‘Precision’’ and ‘‘Accuracy’’: Two Terms That Are Neither. Journal of Clinical Epidemiology 2006;59:327–30.
14. Habicht J, Victora C, JP V. Evaluation Designs for Adequacy, Plausibility, and Probability of Public Health Programme Performance and Impact. International Journal of Epidemiology 1999;28:10-18.
15. Murphy SP. Dietary Assessment for Improving the Design of Food Fortification Programs:S33-3. [Abstract]: Annals of Nutrition & Metabolism 2009;55 Sup 1:47; 2009.
16. Serra-Majem L, MacLean D, Ribas L, Brule D, Sekula W, Prattala R, Garcia-Closas R, Yngve A, Lalonde M, Petrasovits A. Comparative analysis of nutrition data from national, household, and individual levels: results from a WHO-CINDI collaborative project in Canada, Finland, Poland, and Spain. Journal of Epidemiology & Community Health 2003;57:74-80.
17. Ferro-Luzzi A. Keynote Paper: Individual food intake survey methods. International Scientific Symposium on Measurement and Assessment of Food Deprivation and Undernutrition. Rome: FAO; 2002.
18. Allen LH. New approaches for designing and evaluating food fortification programs. Journal of Nutrition 2006;136:1055-8.
19. Swindale A; Ohri-Vachaspati P. Measuring Household Food Consumption: A Technical Food Guide. Food and Nutrition Technical Assistance (FANTA); 2005.
20. Gibson RS. Principles of Nutritional Assessment 2nd ed. New York, New York: Oxford University Press; 2005.
21. Gibson R. Personal communication. In: Colaiezzi B, ed.; 2011. 22. Beaton GH, Milner J, McGuire V, Feather TE, Little JA. Source of variance in 24-hour dietary
recall data: implications for nutrition study design and interpretation. Carbohydrate sources, vitamins, and minerals. American Journal of Clinical Nutrition 1983;37:986-95.

GAIN Working Paper Series no. 4
24
23. Harrison GG. Proceedings of the workshop on food-consumption surveys in developing countries: methodologic considerations in descriptive food-consumption surveys in developing countries. Food & Nutrition Bulletin 2004;25:415-9.
24. Kigutha HN. Assessment of dietary intake in rural communities in Africa: experiences in Kenya. American Journal of Clinical Nutrition 1997;65:1168S-72S.
25. De Boer JO, Knuiman JT, West CE, Burema J, Rasanen L, Scaccini C, Villavieja GM, Lokko P. Within-person variation in daily dietary intake of boys from Finland, the Netherlands, Italy, the Philippines and Ghana. Human Nutrition - Applied Nutrition 1987;41:225-32.
26. Rambeloson Z. Assessing Nutrient Density Using Household Income and Expenditure Survey (HIES): Women of Reproductive Age and Children from 24 to 59 months old in Uganda. Monitoring, Assessment and Data (MAD) Working Group Workshop on Measurement of Food Consumption for Food Fortification and other Nutritional Purposes: Methods, Applications and Policy Implications, Washington, D.C.2011.
27. Institute of Medicine. Dietary Reference Intakes: Applications in Dietary Planning. Washington DC: National Academy Press; 2003.
28. Allen L, de Benoist, B., Dary, O., and Hurrell, R. Guidelines on food fortification with micronutrients. Geneva: World Health Organization, Food and Agriculture Organization, 2006.
29. Hayden Stewart NB, Dean Joliffe. Let's Eat Out: Americans Weigh Taste, Convenience and Nutrition. In: United States Department of Agriculture ERS, ed.; 2006.
30. Government of the Uniked Kingdom. Food Matters: Toward a Strategy for the 21st Century. In: Cabinet Office TSU, ed.; 2008.
31. Oguntona CR, Kanye O. Contribution of street foods to nutrient intakes by Nigerian adolescents. Nutrition & Health 1995;10:165-71.
32. Oguntona CR, Razaq MA, Akintola TT. Pattern of dietary intake and consumption of street foods among Nigerian students. Nutrition & Health 1998;12:247-56.
33. Oguntona CR, Tella TO. Street foods and dietary intakes of Nigerian urban market women. International Journal of Food Sciences & Nutrition 1999;50:383-90.
34. van't Riet H, den Hartog AP, van Staveren WA. Non-home prepared foods: contribution to energy and nutrient intake of consumers living in two low-income areas in Nairobi. Public Health Nutrition 2002;5:515-22.
35. Hertrampf E, Cortes F. Folic acid fortification of wheat flour: Chile. Nutrition Reviews 2004;62:S44-8; discussion S49.
36. Lewis CJ, Crane NT, Wilson DB, Yetley EA. Estimated folate intakes: data updated to reflect food fortification, increased bioavailability, and dietary supplement use. American Journal of Clinical Nutrition 1999;70:198-207.
37. Rohner F. Personal communication. In: Colaiezzi B, ed.; 2011. 38. Tee ES, Dop MC, Winichagoon P. Proceedings of the workshop on food-consumption
surveys in developing countries: future challenges. Food & Nutrition Bulletin 2004;25:407-14. 39. Fiedler J. Personal communication. In: Colaiezzi B, ed.; 2011. 40. USDA. USDA Table of Nutrient Retention Factors Release 6. Available
at: www.nal.usda.gov/fnic/foodcomp/Data/retn6/retn06.pdf. 41. FAO. The International Network of Food Data Systems. Available
at: http://www.fao.org/infoods/index_en.stm 2011. 42. FAO. Food composition: Overview of the WorldFood Dietary Assessment System. Available
at: http://www.fao.org/infoods/software_overview_en.stm. 43. Scrimshaw NS. INFOODS: the international network of food data systems. American Journal
of Clinical Nutrition 1997;65:1190S-93S. 44. Schonfeldt H. Capacity Building in Food Composition for Africa. 9th International Food Data
Conference. Norwich, United Kingdom; 2011. 45. Blanco A, L. de Nunez, N. Samman, L. Masson, J. Salazar, E. W. Menezes, S. de Pablo.
LATINFOODS: Current Status, Activities, and Challenges. 9th International Food Data Conference. Norwich, United Kingdom; 2011.
46. Rand WM, J.A.T. Pennington, S.P. Murphy, J.C. Klensin. Compiling Data for Food Composition Data Bases. Tokyo: United Nations University; 1991.
47. Greenfield H, D.A.T.Southgate. Food Composition Data: Production, Management and Use. 2nd ed. Rome: FAO; 2003.
48. Murphy S, S. Weinberg-Andersson, C. Neumann, K. Mulligan, and D. Calloway. Development of research nutrient databases: An example using foods consumed in rural Kenya. Journal of Food Composition and Analysis 1991;4:2-17.

GAIN Working Paper Series no. 4
25
49. Westerterp KR, Goris AHC. Validity of the assessment of dietary intake: problems of misreporting. Current Opinion in Clinical Nutrition & Metabolic Care 2002;5:489-93.
50. Gewa CA, Murphy SP, Neumann CG. Out-of-home food intake is often omitted from mothers' recalls of school children's intake in rural Kenya. Journal of Nutrition 2007;137:2154-9.
51. Johnson RK. Dietary intake--how do we measure what people are really eating? Obesity Research 2002;10 Suppl 1:63S-68S.
52. Ingwersen LA, N.R Raper, J Anand, A.J Moshfegh Validation study shows importance of probing for forgotten foods during a dietary recall. Journal of the American Dietetic Association 2004;104.
53. USDA. Products & Services: 5-Step Multiple Pass Approach. Available at: http://www.ars.usda.gov/Services/docs.htm?docid=7711.
54. Conway JM, L.A. Ingwersen, B.T. Vinyard, A.J. Moshfegh. Effectiveness of the USDA’s Five-Step Multiplepass method to assess food intake in obese and nonobese women. American Journal of Clinical Nutrition 2003;77:1171-78.
55. Conway JM, Ingwersen LA, Moshfegh AJ. Accuracy of dietary recall using the USDA five-step multiple-pass method in men: an observational validation study. Journal of the American Dietetic Association 2004;104:595-603.
56. Hill RJ, Davies PS. The validity of self-reported energy intake as determined using the doubly labelled water technique. British Journal of Nutrition 2001;85:415-30.
57. Johansson G, Wikman A, Ahren AM, Hallmans G, Johansson I. Underreporting of energy intake in repeated 24-hour recalls related to gender, age, weight status, day of interview, educational level, reported food intake, smoking habits and area of living. Public Health Nutrition 2001;4:919-27.
58. Lafay L, Mennen L, Basdevant A, Charles MA, Borys JM, Eschwege E, Romon M. Does energy intake underreporting involve all kinds of food or only specific food items? Results from the Fleurbaix Laventie Ville Sante (FLVS) study. International Journal of Obesity & Related Metabolic Disorders: Journal of the International Association for the Study of Obesity 2000;24:1500-6.
59. Poppitt SD, Swann D, Black AE, Prentice AM. Assessment of selective under-reporting of food intake by both obese and non-obese women in a metabolic facility. International Journal of Obesity & Related Metabolic Disorders: Journal of the International Association for the Study of Obesity 1998;22:303-11.
60. Miller TM, Abdel-Maksoud MF, Crane LA, Marcus AC, Byers TE. Effects of social approval bias on self-reported fruit and vegetable consumption: a randomized controlled trial. Nutrition Journal 2008;7:18.
61. Mendez MA, Wynter S, Wilks R, Forrester T. Under- and overreporting of energy is related to obesity, lifestyle factors and food group intakes in Jamaican adults. Public Health Nutrition 2004;7:9-19.
62. Ferguson EL, Gadowsky SL, Huddle JM, Cullinan TR, Lehrfeld J, Gibson RS. An interactive 24-h recall technique for assessing the adequacy of trace mineral intakes of rural Malawian women; its advantages and limitations. European Journal of Clinical Nutrition 1995;49:565-78.
63. Gibson RS, Huddle JM. Suboptimal zinc status in pregnant Malawian women: its association with low intakes of poorly available zinc, frequent reproductive cycling, and malaria. American Journal of Clinical Nutrition 1998;67:702-9.
64. Soares MJ, Kraai L, Shetty PS. The relative validity of the 24 hour recall: implications for dietary intake methodology. Indian Journal of Nutrition and Dietetics;31:241-46.
65. Ferguson EL, Gibson RS, Ounpuu S, Sabry JH. The validity of the 24 hour recall for estimating the energy and selected nutrient intakes of a group of rural Malawian preschool children. Ecology of Food and Nutrition 1989;23:273-85.
66. Alemayehu AA, Y. Abebe, and R.S. Gibson. A 24-h recall does not provide a valid estimate of absolute nutrient intakes for rural women in southern Ethiopia. Nutrition 2011;27:919-24.
67. Johansson L, Solvoll K, Bjorneboe GE, Drevon CA. Under- and overreporting of energy intake related to weight status and lifestyle in a nationwide sample. American Journal of Clinical Nutrition 1998;68:266-74.
68. Beaton GH, Milner J, Corey P, McGuire V, Cousins M, Stewart E, de Ramos M, Hewitt D, Grambsch PV, Kassim N, Little JA. Sources of variance in 24-hour dietary recall data: implications for nutrition study design and interpretation. American Journal of Clinical Nutrition 1979;32:2546-59.
GAIN Working Paper Series no. 4
26
69. Persson V, Winkvist A, Ninuk T, Hartini S, Greiner T, Hakimi M, Stenlund H. Variability in nutrient intakes among pregnant women in Indonesia: implications for the design of epidemiological studies using the 24-h recall method. Journal of Nutrition 2001;131:325-30.
70. Fiedler JL, Martin-Prével Y, Mourisi M. Comparing the Costs of 24 HR Surveys and Household Consumption & Expenditures Surveys (HCES): A Nutrition Analysis Perspective. Washington, D.C.: Harvest Plus/IFPRI and IRD; 2011.
71. Institute of Medicine. Dietary Reference Intakes: Applications in Dietary Assessment. Washington D.C.: National Academy Press; 2000.
72. Kristal AR, Peters U, Potter JD. Is It Time to Abandon the Food Frequency Questionnaire? Cancer Epidemiol Biomarkers Prev 2005;14:2826-28.
73. Smith AF, Jobe JB, Mingay DL. Retrieval from memory of dietary information. Appl Cogn Psychol 1991;5:269-96.
74. Wakai K. A Review of Food Frequency Questionnaires Developed and Validated in Japan. Journal of Epidemiology 2009;19:1-11.
75. Subar AF, Thompson FE, Kipnis V, Midthune D, Hurwitz P, McNutt S, McIntosh A, Rosenfeld2 S. Comparative Validation of the Block, Willett, and National Cancer Institute Food Frequency Questionnaires: The Eating at America’s Table Study. American Journal of Epidemiology 2001;154:1089-99.
76. Byers T. Food Frequency Dietary Assessment: How Bad Is Good Enough? American Journal of Epidemiology;154:1087-88.
77. National Cancer Institute. Development of the DHQ II Nutrient & Food Group Database. Available at: http://riskfactor.cancer.gov/dhq2/database/ Accessed July 20 2011.
78. World Food Programme Vulnerability Analysis and Mapping Branch. Food Consumption Analysis. Calculation and Use of the Food Consumption Score in Food Security Analysis. Rome: United Nations World Food Programme; 2008.
79. Kennedy G, Ballard T, Dop M. Guidelines for Measuring Household and Individual Dietary Diversity. Rome: Nutrition and Consumer Protection Division,Food and Agriculture Organization of the United Nations, 2011.
80. Swindale A, Bilinsky P. Household Dietary Diversity Score (HDDS) for Measurement of Household Food Access: Indicator Guide (v.2). Washington, D.C.: Food and Nutrition Technical Assistance Project, Academy for Educational Development, 2006.
81. Arimond M, Wiesmann D, Becquey E, Carriquiry A, Daniels MC, Deitchler M, Fanou-Fogny N, Joseph ML, Kennedy G, Martin-Prevel Y, Torheim LE. Simple food group diversity indicators predict micronutrient adequacy of women's diets in 5 diverse, resource-poor settings. Journal of Nutrition 2010;140:2059S-69S.
82. Viveka Persson, Ted Greiner, Sirajul Islam, Gebre-Medhin M. The Helen Keller International Food Frequency Method Understimates Vitamin A Intake Where Sustained Breastfeeding is Common. Food and Nutrition Bulletin 1998;19:343-46.
83. Mozambique Ministry of Health, Technical Secretariat for Food Security and Nutrition, Helen Keller International, Vision W. National Urban Food Consumption Survey for Mozambique: Recommendations and Conclusions for Food Fortification in Mozambique. 2010.
84. Hakim JG, Mujuru N, Rusakaniko S, Gomo Z. National Survey of Zimbabwe Non-Communicable Disease Risk Factors - (ZiNCoDs): Preliminary Report: Zimbabwe Ministry of Health & Child Welfare, University of Zimbabwe, World Health Organization, United Nations Children’s Fund, 2005.
85. Berti PR. Personal Communication. In: Coates J, ed.; 2012. 86. Mozambique Ministry of Health, SETSAN, World Vision, International HK. Food Consumption
Study in Urban Areas of Mozambique: Development of a Food Fortification Strategy, 2010. 87. Subar AF. Developing Dietary Assessment Tools. Journal of the American Dietetic
Association 2004;104:769-70. 88. Pennington J. Dietary nutrient guide. . Westport, CT: AVI; 1976. 89. Murphy SP, Calloway DH. Development of a database for the nutrition CRSP Project. In:
Stewart M, ed. 15th National Nutrient Databank Conference. Ithaca, NY: CBORD Group Inc.; 1991: 125-30.
90. Bland JM, Altman DG. Statistical methods for assessing agreement between two methods of clinical measurement. Lancet 1986;1:307-10.
91. Subar AF, Midthune D, Kulldorff M, Brown CC T, hompson FE, Kipnis V, A S. Evaluation of alternative approaches to assign nutrient values to food groups in food frequency questionnaires. Am J Epidemiol 2000;152:279-86.
GAIN Working Paper Series no. 4
27
92. Kristal AR, Shattuck A, Williams A. Food Frequency Questionnaires for Diet Intervention Research. 17th National Nutrient Databank Conference, June 7-10 1992, Baltimore1994.
93. Henríquez-Sánchez P, Sánchez-Villegas A, Doreste-Alonso J, Ortiz-Andrellucchi A, Pfrimer K, Serra-Maje L. Dietary assessment methods for micronutrient intake: a systematic review on vitamins. British Journal of Nutrition 2009;102:S10-S37.
94. Willett W. Nutritional Epidemiology. 2nd ed. Oxford: Oxford University Press; 1998. 95. Krall EA, Dwyer JT. Validity of a food frequency questionnaire and a food diary in a short-term
recall situation. Journal of the American Dietetic Association;87:1374-7. 96. Willett WC, Sampson L, Stampfer MJ, Rosner B, Bain C, Witschi J, Hennekens CH, Speizer
FE. Reproducibility and validity of a semiquantitative food frequency questionnaire. American Journal of Epidemiology 1985;122:51-65.
97. Willett W. Special Issue: Dietary assessment methods for micronutrient intake: a systematic review of validation studies, the EURRECA Network of Excellence. (Special Issue: Dietary assessment methods for micronutrient intake: a systematic review of validation studies, the EURRECA Network of Excellence.). British Journal of Nutrition 2009;102:S1-S149.
98. Calfas KJ, Zabinski MF, Rupp J. Practical nutrition assessment in primary care settings: a review. American Journal of Preventive Medicine 2000;18:289-99.
99. Signorello LB, Munro HM, Buchowski MS, Schlundt DG, Cohen SS, Hargreaves MK, Blot WJ. Estimating nutrient intake from a food frequency questionnaire: incorporating the elements of race and geographic region. American Journal of Epidemiology;170:104-11.
100. Bingham SA, Gill C, Welch A, Day K, Cassidy A, Khaw KT, Sneyd MJ, Key TJ, Roe L, Day NE. Comparison of dietary assessment methods in nutritional epidemiology: weighed records v. 24 h recalls, food-frequency questionnaires and estimated-diet records. British Journal of Nutrition 1994;72:619-43.
101. Faggiano F, Vineis P, Cravanzola D, Pisani P, Xompero G, Riboli E, Kaaks R. Validation of a method for the estimation of food portion size. Epidemiology 1992;3:379-82.
102. Willett W. Invited commentary: a further look at dietary questionnaire validation. American Journal of Epidemiology 2001;154:1100-2; discussion 05-6.
103. Serra-Majem L, Frost Andersen L, Henrique-Sanchez P, Doreste-Alonso J, Sanchez-Villegas A, Ortiz-Andrelluchi A, Negri E, La Vecchia C. Evaluating the quality of dietary intake validation studies. British Journal of Nutrition 2009;102 Suppl 1:S3-9.
104. Berti PR, FitzGerald S, Budiman C. Field Test of Fortification Rapid Assessment Tool: PATH Canada for the Micronutrient Initiative, nd.
105. Harding K. Personal Communication. In: Colaiezzi B, ed.; 2011. 106. Wuehler S. Personal Communication. In: Colaiezzi B, ed.; 2011. 107. Morris S. Commentary: Learning to Love Lot Quality Assurance Sampling. International
Journal of Epidemiology 2007;36:864-65. 108. Subar Thompson FE, Subar AF, Brown CC, Smith AF, Sharbaugh CO, Jobe JB, Mittl B,
Gibson JT, RG Z. Cognitive research enhances accuracy of food frequency questionnaire reports: results of an experimental validation study. J Am Diet Assoc 2002;102:212-25.
109. Smith LC, Subandoro A. Measuring Food Security: Using Household Expenditure Surveys. Washington D.C.: International Food Policy Research Institute, 2007.
110. Fiedler JL, Marc-Francois Smitz, Olivier Dupriez a, Friedman J. Household income and expenditure surveys: A tool for accelerating the development of evidence-based fortification programs. Food and Nutrition Bulletin 2008;29.
111. Beegle K, Weerdt JD, Friedman J, Gibson J. Methods of Household Consumption Measurement through Surveys: Experimental Results from Tanzania. Washington, D.C.: The World Bank Development Research Group: Poverty and Inequality Team, 2010.
112. Fiedler JL. Strengthening Household Income and Expenditure Surveys as a Tool for Designing and Assessing Food Fortification Programs: International Household Survey Network, 2009.
113. Lividini K. Personal communication. February 28, 2011. 114. Fiedler J. Personal communication. February 28, 2011. 115. Jorgensen JH. Personal communication. March 23, 2011. 116. Fiedler JL, Helleranta M. Recommendations for improving Guatemala’s food fortification
program based on household income and expenditure survey (HIES) data. Food and Nutrition Bulletin 2010;31.
117. Fiedler JL, Afidra R. Vitamin A fortification in Uganda: Comparing the feasibility, coverage, costs, and cost-effectiveness of fortifying vegetable oil and sugar. Food and Nutrition Bulletin 2010;31.
GAIN Working Paper Series no. 4
28
118. Stein AJ, Sachdev H, Qaim M. Genetic Engineering for the Poor: Golden Rice and Public Health in India. World Development 2008;36:144-58.
119. Stein AJ, Nestel P, Meenakshi J, Qaim M, Sachdev H, Bhutta ZA. Plant breeding to control zinc deficiency in India: how cost-effective is biofortification? Public Health Nutrition 2005;10 492–501.
120. Stein AJ, Meenakshi JV, Qaim M, Nestel P, Sachdev HPS, Bhutta ZA. Potential impacts of iron biofortification in India. Social Science and Medicine 2008;66:1797-808.
121. Kachaka W, Mtembezeka M, Chilimbila C. Food insecurity assessment based on food consumption statistics derived from the Malawi 2004/2005 Integrated Household Survey: preliminary summary report (unpublished). Rome: IDC/Malawi; 2007.
122. Bouis H, Haddad L, Kennedy E. Does it matter how we survey demand for food?: Evidence from Kenya and the Philippines. Food Policy 1992;17:349-60.
123. Pekcan G, Köksal E, Küçükerdönmez O, Ozel H. Household food wastage in Turkey. FAO Statistics Division Working Paper Series No ESS/ESSA/004e, available at wwwfaoorg/es/ess/faostat/foodsecurity/papers_enhtm. Ankara: Hacettepe University, Department of Nutrition and Dietetics; 2005.
124. Sibrián R, Komorowska, J. & Mernies, J. . Estimating household and institutional food wastage and losses in the context of measuring food deprivation and food excess in the total population. FAO Statistics Division Working Paper Series No ESS/ESSA/001e, available at wwwfaoorg/es/ess/faostat/foodsecurity/papers_enhtm. Rome: Food and Agricultural Organization of the United Nations; 2005.
125. Martirosova D. Food data collected using acquisition and consumption approaches with daily diaries in Armenia’s ILCS 2004. In: Sibrian R, ed. Deriving Food Security Information from National Household Budget Surveys: Experiences, Achievements, Challenges. Rome: Food and Agriculture Organization of the United Nations; 2008.
126. Pereira C, Troubat N, Sibrian R. Food data collected using acquisition and intake approaches in Cape Verde’s IDRF 2001/2002. In: Sibrian R, ed. Deriving Food Security Information from National Household Budget Surveys: Experiences, Achievements, Challenges. Rome: Food and Agriculture Organization of the United Nations; 2008.
127. Kvinikadze G, Pantsulaia G, Sibrián R. Georgia: Integrating the Multiple Indicators Cluster Survey and Integrated Household Survey data to derive better estimates of food security statistics at sub-national levels. In: Sibrián R, ed. Deriving Food Security Information from National Household Budget Surveys: Experiences, Achievements, Challenges. Rome: Food and Agriculture Organization of the United Nations; 2008.
128. Berti PR, Zakaria A. Intrahousehold distribution of food: A review of the literature and discussion of the implications for nutrition programmes. Monitoring, Assessment and Data (MAD) Working Group Workshop on Measurement of Food Consumption for Food Fortification and other Nutritional Purposes: Methods, Applications and Policy Implications. Washington, D.C.; 2011.
129. Lividini K. An Empirical Comparison of the HIES and an Observed Weighed Food Record Conducted in Bangladesh. Monitoring, Assessment and Data (MAD) Working Group Workshop on Measurement of Food Consumption for Food Fortification and other Nutritional Purposes: Methods, Applications and Policy Implications. Washington, D.C.; 2011.
130. Smith L. Personal communication. 2012. 131. Smith LC, Alderman H, Aduayom D. Food Security in SubSaharan Africa: New Estimates
from Household Expenditure Surveys. Washington, D.C.: International Food Policy Research Institute, 2006.
132. Dary O, Rambeloson Z, Qasrawi R, Team F-JFS. Use of HIES Data: Validation Attempts for Assessing Food Intake. Monitoring, Assessment and Data (MAD) Working Group Workshop on Measurement of Food Consumption for Food Fortification and other Nutritional Purposes: Methods, Applications and Policy Implications. Washington, D.C.; 2011.
133. Sekula W, Nelson M, Figurska K, Oltarzewski M, Weisell R, L S. Comparison between household budget survey and 24-hour recall data in a nationally representative sample of Polish households. Public Health Nutrition 2005;8:430-39.
134. Becker W. Comparability of household and individual food consumption data evidence from Sweden. Public Health Nutrition 2001;4(5B):1177-82:1177-82.
135. Deaton A, Ruiz-Castillo J, Thomas D. The influence of household composition on household expenditure patterns: theory and Spanish evidence. Journal of Political Economy 1989;97:179-200.
GAIN Working Paper Series no. 4
29
136. Scott C, and B. Amenuvegbe. . Recall Loss and Recall Duration: an Experimental Study in Ghana. Inter-Stat 1991.
137. Gibson J. Statistical Tools and Estimation Methods for Poverty Measures Based on Cross- Sectional Household Surveys. In: Morduch J, ed. Handbook on Poverty Statistics. New York: United Nations Statistics Division; 2005.
138. Weisell R. FAO's development of the Adult Male Equivalent (AME) Concept. . Monitoring, Assessment and Data (MAD) Working Group Workshop on Measurement of Food Consumption for Food Fortification and other Nutritional Purposes: Methods, Applications and Policy Implications. Washington, D.C.; 2011.
139. Haddad L, Peña C, Nishida C, Quisumbing A, A. S. “Food Security and Nutrition Implications of Intrahousehold Bias: A Review of Literature.” Washington, D.C., 1996.
140. Chesher A. Diet Revealed?: Semiparametric Estimation of Nutrient Intake-Age Relationships. J R Statist Soc 1997;160:389-428.
141. Naska A, Vasdekis V, Trichopoulou A. A preliminary assessment of the use of household budget survey data for the prediction of individual food consumption. Public Health Nutrition 2001;4:1159-65.
142. Dary O, Hainsworth M. The Food Fortification Formulator: Technical Determination of Fortification evels and Standards for Mass Fortification. Washington DC.: A2Z: The USAID Micronutrient Project. Academy for Educational Development,, 2008.
143. Imhoff-Kunsch B, Flores R, Dary O, Martorell R. Wheat Flour Fortification Is Unlikely to Benefit the Neediest in Guatemala. Journal of Nutrition 2007;137:1017–22.
144. FAO. FAOSTAT Glossary definition for 'Opening stocks'. Available at: http://faostat.fao.org/site/379/DesktopDefault.aspx?PageID=379.
145. FAO. FAOSTAT: Trade. Available at: http://faostat.fao.org/site/535/default.aspx#ancor Accessed Feb. 17 2012.
146. FAO. FAOSTAT. Available at: http://faostat.fao.org/ Accessed 10 May 2011. 147. FAO. Definition and Classification of Commodities (draft). Available
at: http://www.fao.org/es/faodef/faodefe.htm Accessed February 17 2012. 148. Wirth J. Personal communication. In: Colaiezzi B, ed.; 2011. 149. WFP. World Food Programme: Food Quality Control. Available
at: http://foodquality.wfp.org/FoodSpecifications/tabid/56/Default.aspx. 150. A2Z. Rice Fortification in Developing Countries: A Critical Review of the Technical and
Economic Feasibility, 2008. 151. Ranum P. Existing standards for fortification of wheat and corn flour and flour products -
fortification Available at: http://www.sph.emory.edu/wheatflour/atlanta08/agenda.html. 152. BASF-SE. The Fortification of Staple Foods with Vitamin A. Available at: http://www.food-
fortification.com/About_Food_Fortification/Application/Sugar_Fortification.aspx. 153. SADC. Study on the Expanded Food Balance Sheets for the SADC Region. Gaborone: SADC
Secretariat, 2006. 154. Bouis H, C. Hotz, B. McClafferty, J.V. Meenakshi, W. H. Pfeiffer. Biofortification: A New Tool
to Reduce Micronutrient Malnutrition. In: Bouis HE, ed. 19th International Congress of Nutrition. Bangkok, Thailand: HarvestPlus; 2009.
155. Brown KH, Wuehler SE, Peerson JM. The importance of zinc in human nutrition and estimation of the global prevalence of zinc deficiency. Food and Nutrition Bulletin 2001;22:113-25.
156. Brown KH, Hambidge KM, Ranum P, Zinc Fortification Working G. Zinc fortification of cereal flours: current recommendations and research needs. Food & Nutrition Bulletin 2010;31:S62-74.
157. Moursi M. Personal communication. In: Colaiezzi B, ed.; 2011. 158. Bagriansky J. Personal communication. In: Colaiezzi B, ed.; 2011. 159. FAO. Food Balance Sheets and The Food Consumption Survey: A Comparison of
Methodologies and Results. Available at: http://www.fao.org/economic/the-statistics-division-ess/methodology/methodology-systems/food-balance-sheets-and-the-food-consumption-survey-a-comparison-of-methodologies-and-results/ru/.
160. Laillou A, James Wirth. Personal communication. In: Colaiezzi B, ed.; 2011. 161. Johnson Q. Personal communication. In: Colaiezzi B, ed.; 2011. 162. Fiedler J. Changing food consumption patterns and the changing potential role of fortification:
An ever-changing dynamic that requires on-going monitoring and adaptation. 2011.

www.gainhealth.org INVESTING IN PARTNERSHIPS TO STOP MALNUTRIT ION
About the Authors
Mickey Chopra, Director, Health Systems Research Unit, Medical Research Council, South Africa is a doctor with postgraduate quali�cations in public health and child health. He has worked for �fteen years in South Africa �rst as a district medical of�cer where he established an innovative child health and nutrition programme. He then taught and conducted research at the School of Public Health, University of the Western Cape, with a particular focus upon primary health care approaches towards maternal and child health. At the time of writing the director of the Health Systems Research Unit, Medical Research Council, South Africa that specializes in broader health systems improvements working from the policy level down to implementation in communities. He has published over 60 international peer reviewed papers and contributed to numerous book chapters concerned with child health and nutrition. He is also on the Steering Committee of Equinet, a network in the Southern Africa region whose goal is to promote and realise equity and social justice in health.
Scott Drimie is a Research Fellow with the International Food Policy Research Institute. His major responsibility is the coordination of the Regional Network on AIDS, Livelihoods and Food Security (RENEWAL), which facilitates research in Southern and East Africa, ensuring that scienti�c evidence is made accessible to decision makers through different communication strategies. He held a research position at the Human Sciences Research Coun-cil and ran a consultancy company from which he consulted for various public and private sector organisations. His PhD was on the political economy of land reform in South Africa, conferred by the University of Cambridge, United Kingdom.