Embed Size (px)
Citation preview
To Our Shareholders,
For the quarter ended March 31, 2018, the net asset value (“NAV”) per Class AAA Share of The Gabelli ABC
Fund decreased 0.1% compared with a decrease of 0.8% for the Standard & Poor’s (“S&P”) Long-Only Merger
Arbitrage Index. The performance of the ICE Bank of America Merrill Lynch 3 Month U.S. Treasury Bill Index for the
quarter was 0.4%. Another class of shares is available. See page 2 for performance information for both share classes.
Commentary
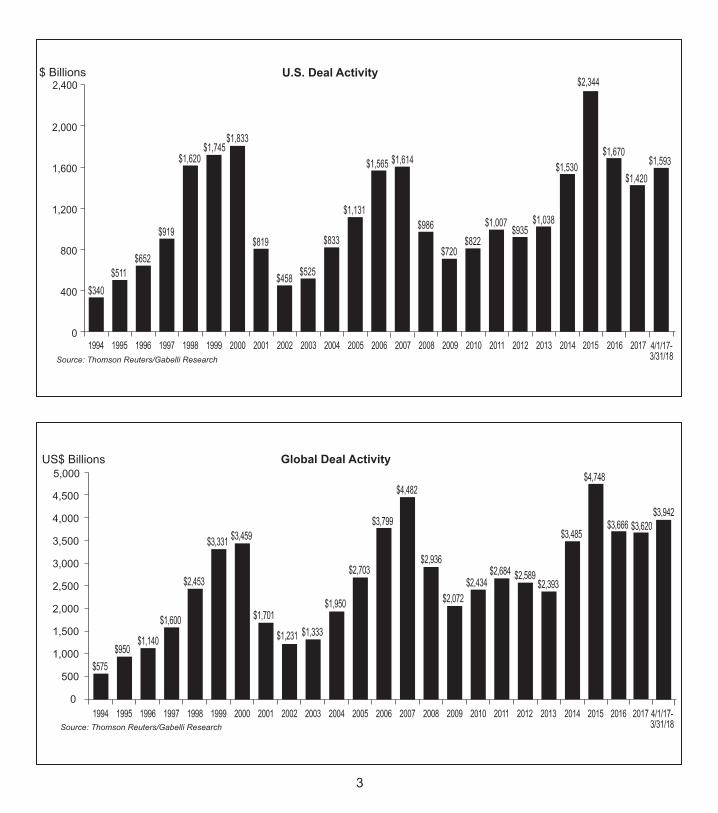
Corporations and financial sponsors were busy in the first quarter of 2018 as merger and acquisition
(M&A) activity moved at a record setting pace. Global transaction volume totaled $1.2 trillion in the first quarter,
representing a 60% year over year increase and the strongest first quarter on record1. The surge in global deal
activity was driven by larger transactions. There were forty-nine deals announced in the quarter that were
valued at more than $5 billion, representing $699.1 billion in total value, three times the 2017 levels. That is
the highest number and the largest total value of “mega” deals on record ever announced in a first quarter.
The Gabelli ABC Fund
Merger Arbitrage – “The Deal Fund”Shareholder Commentary – March 31, 2018
1Thomson Reuters Mergers & Acquisitions Review – First Quarter 2018
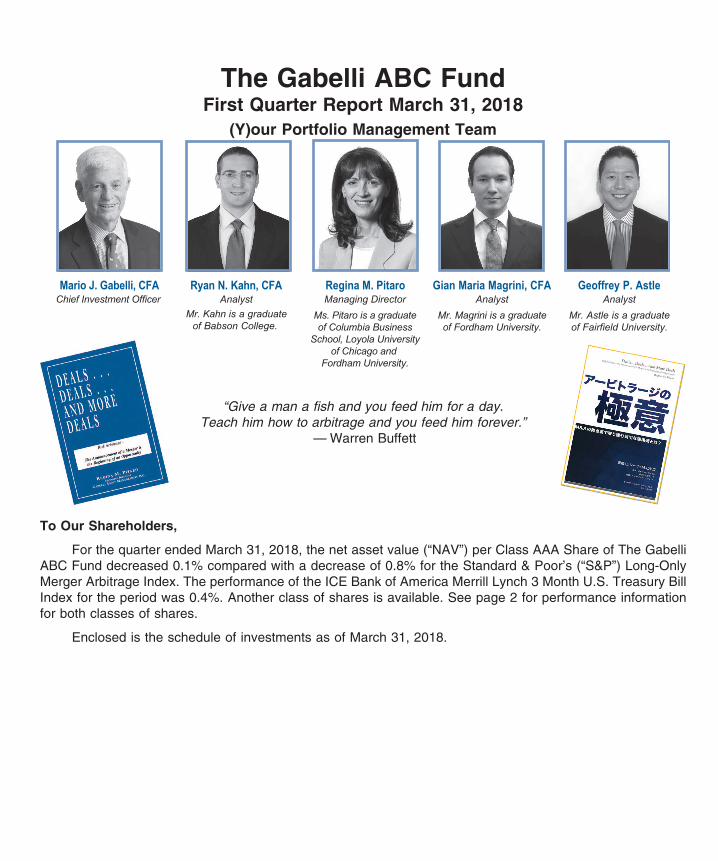
(Y)our Portfolio Management Team
Regina M. Pitaro
Managing Director
Ms. Pitaro is a graduateof Columbia Business
School, Loyola Universityof Chicago and
Fordham University.
Gian Maria Magrini, CFAAnalyst
Mr. Magrini is a graduate
of Fordham University.
Mario J. Gabelli, CFAChief Investment Officer
Ryan N. Kahn, CFAAnalyst
Mr. Kahn is is a graduate
of Babson College.
Geoffrey P. AstleAnalyst
Mr. Astle is a graduate
of Fairfield University.
“Give a man a fish and you feed him for a day.
Teach him how to arbitrage and you feed him forever.”
– Warren Buffett
2
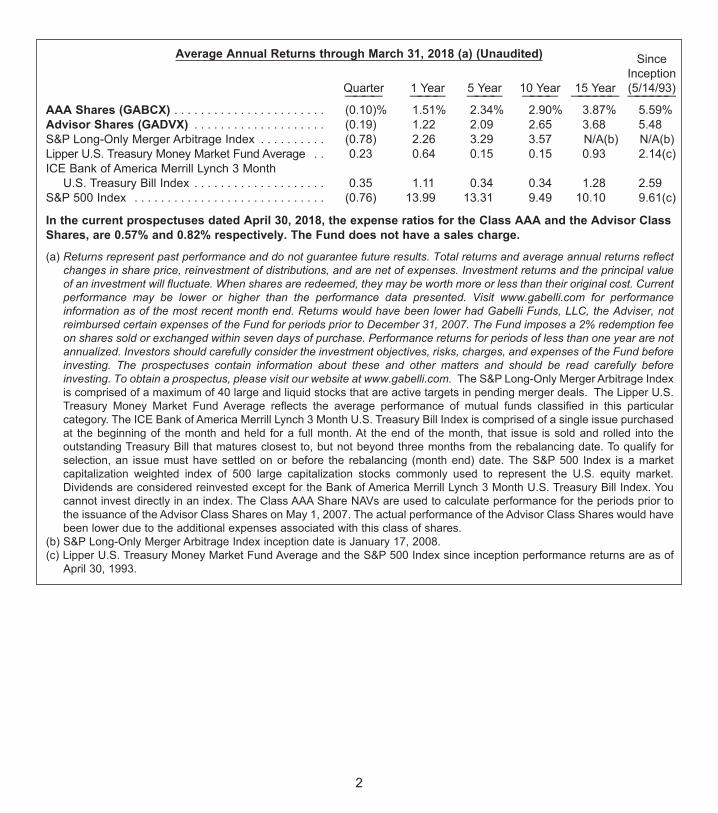
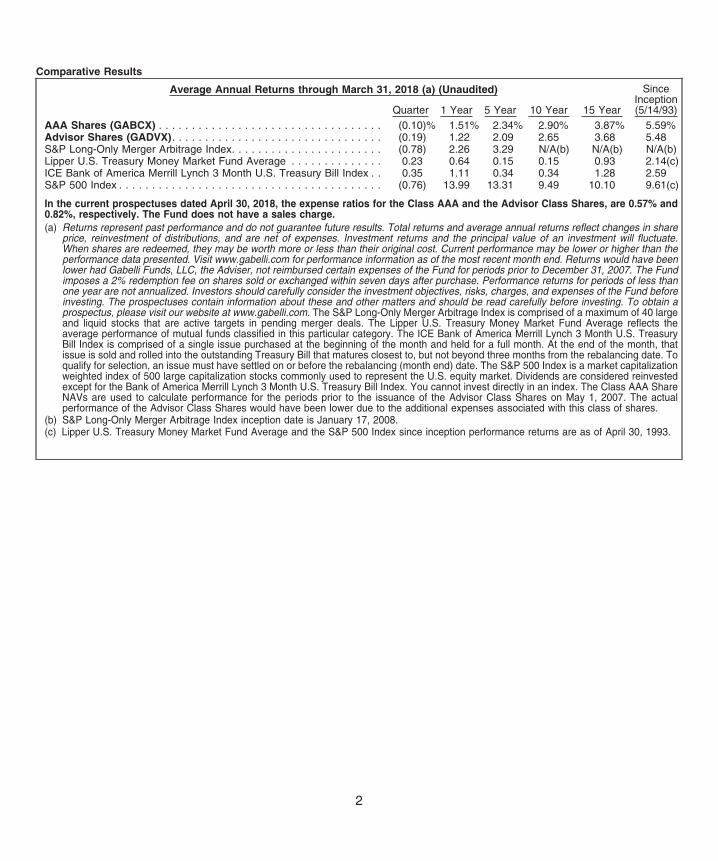
Average Annual Returns through March 31, 2018 (a) (Unaudited) Since
Inception
Quarter 1 Year 5 Year 10 Year 15 Year (5/14/93)———— ———— ———— ———— —————— ——————
AAA Shares (GABCX) . . . . . . . . . . . . . . . . . . . . . . . (0.10)% 1.51% 2.34% 2.90% 3.87% 5.59%
Advisor Shares (GADVX) . . . . . . . . . . . . . . . . . . . . (0.19) 1.22 2.09 2.65 3.68 5.48
S&P Long-Only Merger Arbitrage Index . . . . . . . . . . (0.78) 2.26 3.29 3.57 N/A(b) N/A(b)
Lipper U.S. Treasury Money Market Fund Average . . 0.23 0.64 0.15 0.15 0.93 2.14(c)
ICE Bank of America Merrill Lynch 3 Month
U.S. Treasury Bill Index . . . . . . . . . . . . . . . . . . . . 0.35 1.11 0.34 0.34 1.28 2.59
S&P 500 Index . . . . . . . . . . . . . . . . . . . . . . . . . . . . . (0.76) 13.99 13.31 9.49 10.10 9.61(c)
In the current prospectuses dated April 30, 2018, the expense ratios for the Class AAA and the Advisor Class
Shares, are 0.57% and 0.82% respectively. The Fund does not have a sales charge.
(a) Returns represent past performance and do not guarantee future results. Total returns and average annual returns reflect
changes in share price, reinvestment of distributions, and are net of expenses. Investment returns and the principal value
of an investment will fluctuate. When shares are redeemed, they may be worth more or less than their original cost. Current
performance may be lower or higher than the performance data presented. Visit www.gabelli.com for performance
information as of the most recent month end. Returns would have been lower had Gabelli Funds, LLC, the Adviser, not
reimbursed certain expenses of the Fund for periods prior to December 31, 2007. The Fund imposes a 2% redemption fee
on shares sold or exchanged within seven days of purchase. Performance returns for periods of less than one year are not
annualized. Investors should carefully consider the investment objectives, risks, charges, and expenses of the Fund before
investing. The prospectuses contain information about these and other matters and should be read carefully before
investing. To obtain a prospectus, please visit our website at www.gabelli.com. The S&P Long-Only Merger Arbitrage Indexis comprised of a maximum of 40 large and liquid stocks that are active targets in pending merger deals. The Lipper U.S.Treasury Money Market Fund Average reflects the average performance of mutual funds classified in this particularcategory. The ICE Bank of America Merrill Lynch 3 Month U.S. Treasury Bill Index is comprised of a single issue purchasedat the beginning of the month and held for a full month. At the end of the month, that issue is sold and rolled into theoutstanding Treasury Bill that matures closest to, but not beyond three months from the rebalancing date. To qualify forselection, an issue must have settled on or before the rebalancing (month end) date. The S&P 500 Index is a marketcapitalization weighted index of 500 large capitalization stocks commonly used to represent the U.S. equity market.Dividends are considered reinvested except for the Bank of America Merrill Lynch 3 Month U.S. Treasury Bill Index. Youcannot invest directly in an index. The Class AAA Share NAVs are used to calculate performance for the periods prior tothe issuance of the Advisor Class Shares on May 1, 2007. The actual performance of the Advisor Class Shares would havebeen lower due to the additional expenses associated with this class of shares.
(b) S&P Long-Only Merger Arbitrage Index inception date is January 17, 2008. (c) Lipper U.S. Treasury Money Market Fund Average and the S&P 500 Index since inception performance returns are as of
April 30, 1993.
3
2,000
1,600
1,200
800
400
01994 1995 1996 1997 1998 1999 2000 2001 2002 2003 2006 2007 20082004
$340
$ Billions U.S. Deal Activity
$511$652
$919
$1,620$1,745
$1,833
$819
$458 $525
$1,614
$720
$1,007
$1,530
$1,038$935
$822$986
$1,565
$1,131
$833
Source: Thomson Reuters/Gabelli Research
2005 2009 20142013201220112010 2015
$2,3442,400
2016
$1,670
2017
$1,420
4/1/17-3/31/18
$1,593
0
500
1,000
1,500
2,000
2,500
3,000
3,500
4,500
4,000
1994 1995 1996 1997 1998 1999 2000 2001 2002 2003 2006 20072004
$950$575
US$ Billions Global Deal Activity
$1,140
$1,600
$2,453
$3,331 $3,459
$1,701
$1,231 $1,333
$3,799
$4,482
$2,936
$2,072$2,434
$2,684
$
$2,393$2,589$2,703
$1,950
Source: Thomson Reuters/Gabelli Research
2009 2014201320122011201020082005
$3,485
2015
$4,7485,000
2016
$3,666 $3,620
2017
$3,942
4/1/17-3/31/18
4
It should be noted, that despite the record breaking nature of the quarter, there were weak spots,
including an 11% year over year decline in the number of deals announced. But it is evident that the weak spots
were few and far between. This was further reinforced by record deal activity for European targets, which
totaled $471 billion in the quarter and record cross-border deal activity, which totaled $520.1 billion. Strength
in cross-border M&A was underpinned by a wave in outbound European acquisitions, which totaled $314.7
billion in the quarter, more than double 2017 levels. M&A in the United States was not record setting, but the
$443.7 billion in announced deals during the quarter represented a 59% year over year increase.
The Energy & Power sector took part in the record breaking frenzy. M&A in the sector totaled
$176.8 billion during the quarter, the highest volume for the first time on record. Overall deal activity was also
driven by the Industrials and Healthcare sectors, which each contributed 12% to M&A in the quarter.
The Federal Reserve raised its benchmark interest rate by 25 basis points in the first quarter to a target
range of 1.50% to 1.75%. As the Federal Reserve continues to raise rates, it is important to recall that
historically there has been a positive correlation between interest rates and arbitrage spreads. This is due to
the fact that the spread is driven by the risks inherent to a particular deal as well as the risk-free rate. Typically,
as the risk-free rate rises, so do annualized spreads. Corporations have had high cash balances and an
appetite to grow inorganically since quantitative easing took effect in 2008. These two factors will be magnified
as businesses begin to digest the effects of U.S. tax reform. The new tax law will charge a 21% corporate tax
rate and one time repatriation charges of 15.5% for cash and 8% for illiquid assets overseas. These lower rates
will allow corporations to expand their cash balances and unlock cash overseas. Management teams will
deploy the additional excess capital in shareholder friendly ways, and we anticipate that this will continue to
drive M&A into the future.
Done Deals
Advanced Accelerator Application SA (AAAP) is a St-Genis-Pouilly, France based pharmaceuticals company
focused on nuclear medicine theragnostics. On October 30, 2017, AAAP agreed to be acquired by Novartis AG
for $41 cash per ordinary share and $82 cash per ADS, valuing the company’s equity at $3.9 billion. Completion
of the deal required the tender of at least 80% of AAAP shares and certain regulatory approvals. The deal
closed on January 22, 2018 and the Fund earned a 5.97% annualized return.
Amplify Snack Brands Inc. (BETR) is an Austin, Texas based snack company with a portfolio of better-for-you
brands that includes SkinnyPop, Oatmega, and Lisa’s Chips. On December 18, 2017, BETR agreed to be
acquired by The Hershey Company for $12 per share in cash, representing a $1.6 billion total enterprise value.
Completion of the deal required the tender of a simple majority of BETR shares outstanding and regulatory
approvals. The transaction closed on January 31, 2018 and the Fund earned a 1.81% annualized return.
Bob Evans Farms Inc. (BOBE) is a New Albany, Ohio based food services company. BOBE produces and
distributes frozen and refrigerated food items throughout the United States. On September 19, 2017, BOBE
agreed to be acquired by Post Holdings Inc. for $77 cash per share. The deal valued Bob Evans at $1.6 billion
5
and required regulatory and shareholder approvals. It closed on January 16, 2018 and the Fund earned a
2.17% annualized return.
Buffalo Wild Wings (BWLD) is a Minneapolis, Minnesota based restaurant owner and franchisor, operating
1,250 Buffalo Wild Wings Restaurants globally. On November 28, 2017, BWLD agreed to be acquired by
Arby’s Restaurant Group for $157 per share in cash, valuing the company at $2.9 billion. The transaction
required regulatory and shareholder approvals and closed on February 6, 2018. The Fund earned a 2.69%
annualized return.
Calpine Corporation (CPN) is a Houston, Texas based electric utilities company that owns and operates 80
power plants in North America. On August 18, 2017, CPN agreed to be acquired by Energy Capital Partners
and a consortium of investors led by Access Industries and the Canada Pension Plan Investment Board for
$15.25 cash per share representing a $5.6 billion equity value. The transaction required shareholder and
regulatory approvals and closed on March 8, 2018. The Fund earned a 3.37% annualized return.
Exactech Inc. (EXAC) is a Gainesville, Florida based medical device company that develops orthopedic
implant devices and other instruments used in surgery. On October 23, 2017, EXAC agreed to be taken private
by TPG Capital for $42 per share in cash which valued the company at $625 million. On December 4, 2017,
EXAC entered into an amended merger agreement with TPG Capital which increased the consideration to
EXAC shareholders to $49.25 per share in cash, representing a $737 million total enterprise value, after
another bidder emerged. The transaction required regulatory and shareholder approvals and closed on
February 15, 2018. The Fund earned a 56.18% annualized return.
Key Technology Inc. (KTEC) is a Walla Walla, Washington based automation systems manufacturer of food
processing technology. On January 25, 2018, KTEC agreed to be acquired by Duravant LLC for $26.75 per share
in cash, representing a transaction value of $175 million. Completion of the deal required the tender of a simple
majority of KTEC shares outstanding and regulatory approvals. The transaction closed on March 21, 2018 and
the Fund earned a 3.62% annualized return.
Regal Entertainment Group (RGC) is a Knoxville, Tennessee based movie theatre chain that operates one of
the largest theater circuits in the United States. On December 5, 2017, RGC agreed to be acquired by
Cineworld Group PLC for $23 per share in cash, representing a total transaction value of $5.9 billion. The deal
required shareholder and regulatory approvals and closed on March 1, 2018. The Fund earned a 9.99%
annualized return.
Snyder’s-Lance Inc. (LNCE) is a Charlotte, North Carolina based snack company with a portfolio of salty snack
brands, including Snyder’s of Hanover, Kettle, and Cape Cod. On December 18, 2017, LNCE agreed to be
acquired by Campbell Soup Company for $50 per share in cash, representing a $4.9 billion equity valuation.
The deal required shareholder and regulatory approvals, and closed on March 27, 2018. The Fund earned a
4.09% annualized return.
6
Pipeline
Blue Buffalo Pet Products Inc. (0.2% of net assets as of March 31, 2018) (BUFF – $39.81 – NASDAQ) is a
Wilton, Connecticut based pet food company that develops and sells food products under its various BLUE brand
lines, including BLUE Life Protection Formula, BLUE Wilderness, BLUE Basics, BLUE Freedom and BLUE
Natural Veterinary Diet. On February 23, 2018, BUFF agreed to be acquired by General Mills, Inc. (GIS) for $40
per share in cash, valuing the company at $8 billion. GIS received the necessary shareholder vote from Invus LP
and the founding Bishop family, but the transaction still requires regulatory approvals and is expected to close by
the end of May 2018.
Callidus Software Inc. (0.3%) (CALD – $35.95 – NASDAQ) is a Dublin, California based enterprise software
company that provides cloud based solutions around sales data. On January 29, 2018 CALD agreed to be
acquired by SAP SE for $36 per share in cash, representing $2.4 billion total enterprise value. The transaction
requires shareholder and regulatory approvals, and is expected to close in the coming weeks.
CSRA Inc. (3.2%) (CSRA – $41.23 – NYSE) is a Falls Church, Virginia based IT company that provides
services to enterprises and government agencies, including the NSA. On February 12, 2018, CSRA agreed to
be acquired by General Dynamics for $40.75 per share in cash. On March 18, 2018, CACI International offered
to acquire CSRA for $15 per share in cash and 0.184 CACI shares, representing a total consideration of $44
per share. In response, General Dynamics increased its all-cash offer to $41.25 per share and, subsequently,
CACI dropped out of the bidding war. General Dynamic’s new offer requires the tender of a simple majority of
CSRA shares outstanding and regulatory approvals. The transaction is expected to close in the coming weeks.
DST Systems Inc. (2.6%) (DST – $83.65 – NYSE) is a Kansas City, Missouri based information processing
company that provides data management and other services to the healthcare and financial services sectors.
On January 11, 2018, DST agreed to be acquired by SS&C Technologies Holdings Inc. for $84 per share in
cash, representing a $5.4 billion total enterprise value. The transaction requires DST shareholder approval and
regulatory clearances. The transaction is expected to close in the third quarter of 2018.
Fenner PLC (0.6%) (FENR – $8.54/£6.09 – London Stock Exchange) is a Hessle, England based polymer
manufacturer. On March 19, 2018, FENR agreed to be acquired by Michelin for £6.10 per share in cash. The
transaction will be implemented by a scheme of arrangement and requires regulatory approvals. It is expected
to close in the second quarter of 2018.
General Cable Corp. (0.5%) (BGC – $29.60 – NYSE) is Highland Heights, Kentucky based cable manufacturer
that sells fiber optic, copper, and aluminum cables to the telecom, industrial, and construction sectors. On
December 4, 2017, BGC agreed to be acquired by Prysmian Group for $30 per share in cash, representing a
$3 billion total enterprise value. The transaction requires shareholder and regulatory approvals, and is
expected to close in the third quarter of 2018.
MuleSoft Inc. (less than 0.1%) (MULE – $43.98 – NYSE) is a San Francisco, California based software
company that developed the Anypoint Platform, which creates a connected network for its customers. On
March 20, 2018, MULE agreed to be acquired by Salesforce for $36 in cash and 0.0711 CRM shares,
7
representing a total value $6.5 billion. The deal requires the tender of a simple majority of MULE shares
outstanding and regulatory approvals. It is expected to close in the second quarter of 2018.
Orbital ATK Inc. (1.1%) (OA – $132.61 – NYSE) is a Dulles, Virginia based aerospace and defense company.
On September 18, 2017, OA agreed to be acquired by Northrop Grumman Corp. for $134.50 per share in cash,
representing a $7.8 billion equity valuation. OA shareholders have approved the merger. Regulatory approvals
are still pending and the transaction is expected to close in the first half of 2018.
Rockwell Collins Inc. (0.1%) (COL – $134.85 – COL) is a Cedar Rapids, Iowa based aerospace and defense
company. On September 4, 2017, COL agreed to be acquired by United Technologies Corp. for $93 per share
in cash and $46.67 in UTC stock, representing a $23 billion equity valuation. The deal requires shareholder
and regulatory approvals, and is expected to close in the third quarter of 2018.
Validus Holdings Ltd. (0.2%) (VR – $67.45 – NYSE) is a Pembroke, Bermuda based insurance and
reinsurance holding company. On January 22, 2018 VR agreed to be acquired by American International Group
for $68 per share in cash, representing a $5.56 billion transaction value. The transaction requires shareholder
and regulatory approvals, and is expected to close in mid-2018.
XL Group Ltd. (1.5%) (XL – $55.26 – NYSE) is a Hamilton, Bermuda based insurance and reinsurance
company. On March 5, 2018, XL agreed to be acquired by AXA for $57.60 per share in cash representing total
consideration of $15.3 billion. The deal is subject to shareholder and regulatory approvals, and is expected to
close in the second half of 2018.
April 25, 2018
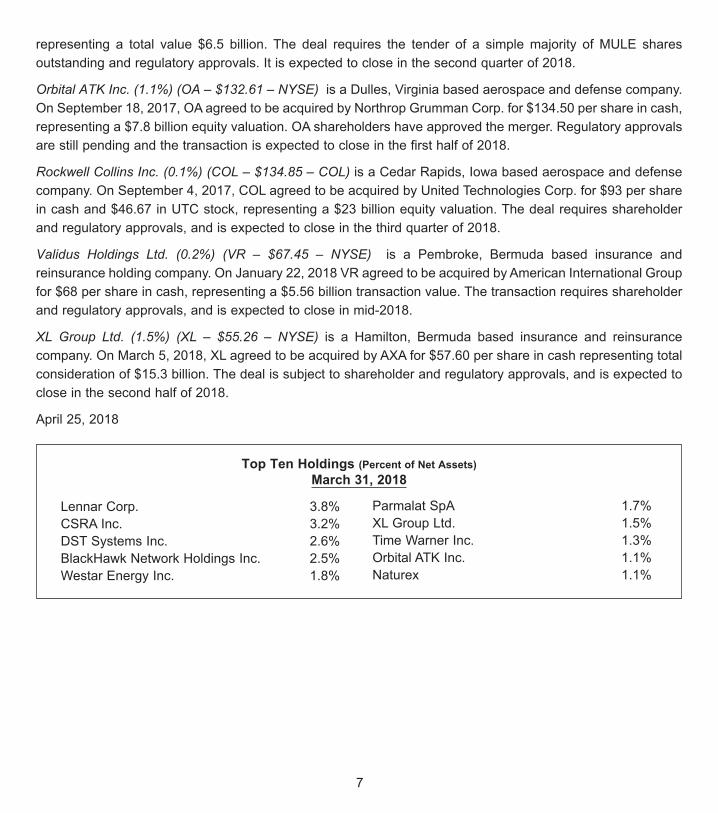
Top Ten Holdings (Percent of Net Assets)
March 31, 2018
Lennar Corp. 3.8%
CSRA Inc. 3.2%
DST Systems Inc. 2.6%
BlackHawk Network Holdings Inc. 2.5%
Westar Energy Inc. 1.8%
Parmalat SpA 1.7%
XL Group Ltd. 1.5%
Time Warner Inc. 1.3%
Orbital ATK Inc. 1.1%
Naturex 1.1%
8
Note: The views expressed in this Shareholder Commentary reflect those of the Portfolio Manager only
through the end of the period stated in this Shareholder Commentary. The Portfolio Manager’s views are
subject to change at any time based on market and other conditions. The information in this Portfolio Manager’s
Shareholder Commentary represents the opinions of the Portfolio Manager and is not intended to be a forecast
of future events, a guarantee of future results, or investment advice. Views expressed are those of the Portfolio
Manager and may differ from those of other portfolio managers or of the Firm as a whole. This Shareholder
Commentary does not constitute an offer of any transaction in any securities. Any recommendation contained
herein may not be suitable for all investors. Information contained in this Shareholder Commentary has been
obtained from sources we believe to be reliable, but cannot be guaranteed.
Merger Arbitrage Risk. The principal risk associated with the Fund’s investment strategy is that certain of the
proposed reorganizations in which the Fund invests may involve a longer time frame than originally
contemplated or be renegotiated or terminated, in which case losses may be realized. The Fund invests all or
a portion of its assets to seek short term capital appreciation. This can be expected to increase the portfolio
turnover rate and cause increased brokerage commission costs.
FOR THE BENEFICIAL OWNERS
The Gabelli ABC Fund remains open to new investors with the following characteristics:
Direct Ownership – Class AAA (GABCX)
• Purchases may be made through G.distributors, LLC or directly through the Fund’s Transfer Agent or
through brokers that have entered into selling agreements specifically with respect to Class AAA
Shares; and
• The minimum initial investment is $10,000; and
• The Fund may involuntarily redeem shares through brokers or financial consultants in omnibus and
individual accounts where the beneficial owner is not disclosed.
Ownership Through Intermediaries – Advisor Class (GADVX)
• The Advisor Share Class is available through brokers or financial intermediaries that have entered into
selling agreements with G.distributors, LLC, specifically with respect to this share class; and
• The minimum initial investment is $10,000.
www.gabelli.com
Please visit us on the Internet. Our homepage at www.gabelli.com contains information about GAMCO
Investors, Inc., the Gabelli/GAMCO Mutual Funds, IRAs, 401(k)s, current and historical quarterly reports,
closing prices, and other current news. We welcome your comments and questions via e-mail at
The Fund’s daily NAVs are available in the financial press and each evening after 7:00 PM (Eastern Time)
by calling 800-GABELLI (800-422-3554). Please call us during the business day, between 8:00 AM – 7:00 PM
(Eastern Time), for further information.
You may sign up for our e-mail alerts at www.gabelli.com and receive early notice of quarterly report
availability, news events, media sightings, and mutual fund prices and performance.
e-delivery
We are pleased to offer electronic delivery of Gabelli fund documents. Direct shareholders of our mutual
funds can elect to receive their Annual and Semiannual Reports, Manager Commentaries, and Prospectuses
via e-delivery. For more information or to sign up for e-delivery, please visit our website at www.gabelli.com.
9
10
We have separated the portfolio manager’s commentary from the financial statements and investment portfolio due to
corporate governance regulations stipulated by the Sarbanes-Oxley Act of 2002. We have done this to ensure that the
content of the portfolio manager’s commentary is unrestricted. Both the commentary and the financial statements,
including the portfolio of investments, are available on our website at www.gabelli.com.
Gabelli/GAMCO Funds and Your Personal Privacy
Who are we?
The Gabelli/GAMCO Funds are investment companies registered with the Securities and ExchangeCommission under the Investment Company Act of 1940. We are managed by Gabelli Funds, LLC andGAMCO Asset Management Inc., which are affiliated with GAMCO Investors, Inc. GAMCO Investors,Inc. is a publicly held company that has subsidiaries that provide investment advisory services for avariety of clients.
What kind of non-public information do we collect about you if you become a fund shareholder?
If you apply to open an account directly with us, you will be giving us some non-public information aboutyourself. The non-public information we collect about you is:
• Information you give us on your application form. This could include your name, address,telephone number, social security number, bank account number, and other information.
• Information about your transactions with us, any transactions with our affiliates, andtransactions with the entities we hire to provide services to you. This would include informationabout the shares that you buy or redeem. If we hire someone else to provide services—like atransfer agent—we will also have information about the transactions that you conduct through them.
What information do we disclose and to whom do we disclose it?
We do not disclose any non-public personal information about our customers or former customers toanyone other than our affiliates, our service providers who need to know such information, and asotherwise permitted by law. If you want to find out what the law permits, you can read the privacy rulesadopted by the Securities and Exchange Commission. They are in volume 17 of the Code of FederalRegulations, Part 248. The Commission often posts information about its regulations on its website,www.sec.gov.
What do we do to protect your personal information?
We restrict access to non-public personal information about you to the people who need to know thatinformation in order to provide services to you or the fund and to ensure that we are complying with thelaws governing the securities business. We maintain physical, electronic, and procedural safeguards tokeep your personal information confidential.
11
Portfolio Management Team Biographies
Mario J. Gabelli, CFA, is Chairman, Chief Executive Officer, and Chief Investment Officer – Value Portfolios
of GAMCO Investors, Inc. that he founded in 1977, and Chief Investment Officer – Value Portfolios of Gabelli
Funds, LLC and GAMCO Asset Management Inc. He is also Executive Chairman of the Board of Directors of
Associated Capital Group, Inc. Mr. Gabelli is a summa cum laude graduate of Fordham University and holds
an MBA degree from Columbia Business School, and Honorary Doctorates from Fordham University and
Roger Williams University.
Ryan N. Kahn, CFA, is an analyst dedicated to the Gabelli merger arbitrage portfolios, specific to our U.S.
open and closed end funds. He joined the team in 2013 after working as a generalist in the research
department. Mr. Kahn earned a Bachelor of Science in Business Management from Babson College.
Gian Maria Magrini, CFA, is an analyst dedicated to the Gabelli merger arbitrage portfolios specific to our U.S.
open and closed end funds. He joined the team in 2013 after serving various roles in the firm’s operations and
research departments. Mr. Magrini earned a Bachelor of Science in Finance from Fordham University.
Regina M. Pitaro is a Managing Director and Head of Institutional Marketing at GAMCO Investors, Inc. Ms.
Pitaro joined the firm in 1984 and coordinates the organization’s focus with consultants and plan sponsors. She
also serves as a Managing Director and Director of GAMCO Asset Management, Inc. Ms. Pitaro holds an
M.B.A. in Finance from the Columbia University Graduate School of Business, a Master's degree in
Anthropology from Loyola University of Chicago, and a Bachelor’s degree from Fordham University.
Geoffrey P. Astle is involved in the analytics and foreign and domestic trading for the Gabelli merger arbitrage
portfolios, specific to our U.S. open and closed end funds. He has been associated in this capacity since 2007.
Mr. Astle earned a Bachelor of Science in both Finance and Marketing from Fairfield University.
THE GABELLI ABC FUND One Corporate CenterRye, NY 10580-1422
t 800-GABELLI (800-422-3554)f 914-921-5118e [email protected]
GABELL I .COM
Net Asset Value per share available dailyby calling 800-GABELLI after 7:00 P.M.
BOARD OF DIRECTORS
Mario J. Gabelli, CFAChairman andChief Executive Officer,GAMCO Investors, Inc.Executive Chairman,Associated Capital Group Inc.
Anthony J. ColavitaPresident,Anthony J. Colavita, P.C.
Vincent D. EnrightFormer Senior Vice Presidentand Chief Financial Officer,KeySpan Corp.
Mary E. HauckFormer Senior PortfolioManager,Gabelli-O’Connor Fixed IncomeMutual Fund Management Co.
Kuni NakamuraPresident,Advanced Polymer, Inc.
Werner J. RoederFormer Medical Director,Lawrence Hospital
OFFICERS
Bruce N. AlpertPresident
John C. BallTreasurer
Agnes MulladyVice President
Andrea R. MangoSecretary
Richard J. WalzChief Compliance Officer
DISTRIBUTOR
G.distributors, LLC
CUSTODIAN
State Street Bank and Trust Company
TRANSFER AGENT ANDDIVIDEND DISBURSING AGENT
DST Asset Manager Solutions, Inc.
LEGAL COUNSEL
Skadden, Arps, Slate, Meagher &Flom LLP
This report is submitted for the general information of the shareholders of The Gabel l i ABC Fund. It is not authorizedfor distr ibution to prospective investors unless precededor accompanied by an effective prospectus.
THEGABELL IABCFUND
Shareholder CommentaryMarch 31, 2018
GAB408Q118SC
(Y)our Portfolio Management Team
Geoffrey P. AstleAnalyst
Mr. Astle is a graduateof Fairfield University.
Ryan N. Kahn, CFAMario J. Gabelli, CFAAnalyst
Mr. Kahn is a graduateof Babson College.
Chief Investment Officer Gian Maria Magrini, CFA
AnalystMr. Magrini is a graduateof Fordham University.
Regina M. PitaroManaging Director
Ms. Pitaro is a graduateof Columbia Business
School, Loyola Universityof Chicago and
Fordham University.
“Give a man a fish and you feed him for a day.Teach him how to arbitrage and you feed him forever.”
— Warren Buffett
To Our Shareholders,
For the quarter ended March 31, 2018, the net asset value (“NAV”) per Class AAA Share of The GabelliABC Fund decreased 0.1% compared with a decrease of 0.8% for the Standard & Poor’s (“S&P”) Long-OnlyMerger Arbitrage Index. The performance of the ICE Bank of America Merrill Lynch 3 Month U.S. Treasury BillIndex for the period was 0.4%. Another class of shares is available. See page 2 for performance informationfor both classes of shares.
Enclosed is the schedule of investments as of March 31, 2018.
The Gabelli ABC FundFirst Quarter Report March 31, 2018
Comparative Results
Average Annual Returns through March 31, 2018 (a) (Unaudited)
Quarter 1 Year 5 Year 10 Year 15 Year
SinceInception(5/14/93)
AAA Shares (GABCX) . . . . . . . . . . . . . . . . . . . . . . . . . . . . . . . . . . (0.10)% 1.51% 2.34% 2.90% 3.87% 5.59%Advisor Shares (GADVX). . . . . . . . . . . . . . . . . . . . . . . . . . . . . . . . (0.19) 1.22 2.09 2.65 3.68 5.48S&P Long-Only Merger Arbitrage Index. . . . . . . . . . . . . . . . . . . . . . . (0.78) 2.26 3.29 N/A(b) N/A(b) N/A(b)Lipper U.S. Treasury Money Market Fund Average . . . . . . . . . . . . . . 0.23 0.64 0.15 0.15 0.93 2.14(c)ICE Bank of America Merrill Lynch 3 Month U.S. Treasury Bill Index . . 0.35 1.11 0.34 0.34 1.28 2.59S&P 500 Index . . . . . . . . . . . . . . . . . . . . . . . . . . . . . . . . . . . . . . . . (0.76) 13.99 13.31 9.49 10.10 9.61(c)
In the current prospectuses dated April 30, 2018, the expense ratios for the Class AAA and the Advisor Class Shares, are 0.57% and0.82%, respectively. The Fund does not have a sales charge.(a) Returns represent past performance and do not guarantee future results. Total returns and average annual returns reflect changes in share
price, reinvestment of distributions, and are net of expenses. Investment returns and the principal value of an investment will fluctuate.When shares are redeemed, they may be worth more or less than their original cost. Current performance may be lower or higher than theperformance data presented. Visit www.gabelli.com for performance information as of the most recent month end. Returns would have beenlower had Gabelli Funds, LLC, the Adviser, not reimbursed certain expenses of the Fund for periods prior to December 31, 2007. The Fundimposes a 2% redemption fee on shares sold or exchanged within seven days after purchase. Performance returns for periods of less thanone year are not annualized. Investors should carefully consider the investment objectives, risks, charges, and expenses of the Fund beforeinvesting. The prospectuses contain information about these and other matters and should be read carefully before investing. To obtain aprospectus, please visit our website at www.gabelli.com. The S&P Long-Only Merger Arbitrage Index is comprised of a maximum of 40 largeand liquid stocks that are active targets in pending merger deals. The Lipper U.S. Treasury Money Market Fund Average reflects theaverage performance of mutual funds classified in this particular category. The ICE Bank of America Merrill Lynch 3 Month U.S. TreasuryBill Index is comprised of a single issue purchased at the beginning of the month and held for a full month. At the end of the month, thatissue is sold and rolled into the outstanding Treasury Bill that matures closest to, but not beyond three months from the rebalancing date. Toqualify for selection, an issue must have settled on or before the rebalancing (month end) date. The S&P 500 Index is a market capitalizationweighted index of 500 large capitalization stocks commonly used to represent the U.S. equity market. Dividends are considered reinvestedexcept for the Bank of America Merrill Lynch 3 Month U.S. Treasury Bill Index. You cannot invest directly in an index. The Class AAA ShareNAVs are used to calculate performance for the periods prior to the issuance of the Advisor Class Shares on May 1, 2007. The actualperformance of the Advisor Class Shares would have been lower due to the additional expenses associated with this class of shares.
(b) S&P Long-Only Merger Arbitrage Index inception date is January 17, 2008.(c) Lipper U.S. Treasury Money Market Fund Average and the S&P 500 Index since inception performance returns are as of April 30, 1993.
2

SharesMarketValue
COMMON STOCKS — 40.5%Aerospace — 1.2%
106,000 Orbital ATK Inc. . . . . . . . . . . . . . . . . . . . . . . . . . . . . . . . . $ 14,056,6609,000 Rockwell Collins Inc. . . . . . . . . . . . . . . . . . . . . . . . . . . . 1,213,650
15,270,310
Automotive: Parts and Accessories — 0.3%413,000 Federal-Mogul Holdings Corp.†(a). . . . . . . . . . . . . . 4,130,00020,000 GKN plc . . . . . . . . . . . . . . . . . . . . . . . . . . . . . . . . . . . . . . . 129,918
4,259,918
Aviation: Parts and Services — 0.1%50,000 Arconic Inc. . . . . . . . . . . . . . . . . . . . . . . . . . . . . . . . . . . . 1,152,000
Broadcasting — 0.4%8,000 Cogeco Inc.. . . . . . . . . . . . . . . . . . . . . . . . . . . . . . . . . . . . 425,288
10,000 MSG Networks Inc., Cl. A† . . . . . . . . . . . . . . . . . . . . . 226,000104,000 Tribune Media Co., Cl. A. . . . . . . . . . . . . . . . . . . . . . . . 4,213,040
4,864,328
Building and Construction — 4.4%3,800 ASH Grove Cement Co. . . . . . . . . . . . . . . . . . . . . . . . . 2,002,600
34,000 Johnson Controls International plc . . . . . . . . . . . . . 1,198,1601,030,000 Lennar Corp., Cl. B. . . . . . . . . . . . . . . . . . . . . . . . . . . . . 49,120,700
48,000 Norbord Inc., Toronto . . . . . . . . . . . . . . . . . . . . . . . . . . 1,740,272130,000 Ply Gem Holdings Inc.† . . . . . . . . . . . . . . . . . . . . . . . . 2,808,000
5,600 USG Corp.†. . . . . . . . . . . . . . . . . . . . . . . . . . . . . . . . . . . . 226,35257,096,084
Business Services — 0.1%79,000 Diebold Nixdorf Inc.. . . . . . . . . . . . . . . . . . . . . . . . . . . . 1,216,60030,000 exactEarth Ltd.† . . . . . . . . . . . . . . . . . . . . . . . . . . . . . . . 24,333
500,000 Gerber Scientific Inc., Escrow†(a) . . . . . . . . . . . . . . 020,000 GrainCorp Ltd., Cl. A . . . . . . . . . . . . . . . . . . . . . . . . . . . 130,10820,000 RR Donnelley & Sons Co. . . . . . . . . . . . . . . . . . . . . . . 174,600
1,545,641
Cable and Satellite — 1.8%1,500 AMC Networks Inc., Cl. A† . . . . . . . . . . . . . . . . . . . . . 77,550
12,500 Charter Communications Inc., Cl. A† . . . . . . . . . . . 3,890,25055,000 Liberty Global plc, Cl. A† . . . . . . . . . . . . . . . . . . . . . . . 1,722,050
105,000 Liberty Global plc, Cl. C† . . . . . . . . . . . . . . . . . . . . . . . 3,195,1508,020 Liberty Latin America Ltd., Cl. A†. . . . . . . . . . . . . . . 155,989
20,500 Liberty Latin America Ltd., Cl. C†. . . . . . . . . . . . . . . 391,345750,000 Sky plc . . . . . . . . . . . . . . . . . . . . . . . . . . . . . . . . . . . . . . . . 13,652,913
23,085,247
Computer Software and Services — 6.9%600,000 Aconex Ltd.† . . . . . . . . . . . . . . . . . . . . . . . . . . . . . . . . . . 3,589,86231,300 Avigilon Corp.† . . . . . . . . . . . . . . . . . . . . . . . . . . . . . . . . 655,46938,000 Business & Decision†. . . . . . . . . . . . . . . . . . . . . . . . . . 364,706
110,600 Callidus Software Inc.†. . . . . . . . . . . . . . . . . . . . . . . . . 3,976,0701,000,000 CSRA Inc. . . . . . . . . . . . . . . . . . . . . . . . . . . . . . . . . . . . . . 41,230,000
124,000 Digi International Inc.† . . . . . . . . . . . . . . . . . . . . . . . . . 1,277,20018,000 Donnelley Financial Solutions, Inc.† . . . . . . . . . . . . 309,060
SharesMarketValue
400,000 DST Systems Inc.. . . . . . . . . . . . . . . . . . . . . . . . . . . . . . $ 33,460,0005,900 Fidessa Group plc. . . . . . . . . . . . . . . . . . . . . . . . . . . . . . 303,377
31,800 Gemalto NV . . . . . . . . . . . . . . . . . . . . . . . . . . . . . . . . . . . 1,942,72352,000 iGO Inc.† . . . . . . . . . . . . . . . . . . . . . . . . . . . . . . . . . . . . . . 121,6803,000 InterXion Holding NV† . . . . . . . . . . . . . . . . . . . . . . . . . 186,330
10,000 MuleSoft Inc., Cl. A† . . . . . . . . . . . . . . . . . . . . . . . . . . . 439,8005,000 RealDolmen . . . . . . . . . . . . . . . . . . . . . . . . . . . . . . . . . . . 226,4035,500 Rockwell Automation Inc. . . . . . . . . . . . . . . . . . . . . . . 958,100
200 Synchronoss Technologies Inc.† . . . . . . . . . . . . . . . 2,11089,042,890
Consumer Products — 0.4%100 Accell Group. . . . . . . . . . . . . . . . . . . . . . . . . . . . . . . . . . . 2,180
89,000 Avon Products Inc.† . . . . . . . . . . . . . . . . . . . . . . . . . . . 252,76016,000 Bang & Olufsen A/S† . . . . . . . . . . . . . . . . . . . . . . . . . . 402,99719,000 Edgewell Personal Care Co.† . . . . . . . . . . . . . . . . . . . 927,58071,000 Yoox Net-A-Porter Group SpA†. . . . . . . . . . . . . . . . . 3,302,285
4,887,802
Diversified Industrial — 1.3%854,778 Fenner plc . . . . . . . . . . . . . . . . . . . . . . . . . . . . . . . . . . . . . 7,303,437220,000 General Cable Corp.. . . . . . . . . . . . . . . . . . . . . . . . . . . . 6,512,000160,000 Haldex AB† . . . . . . . . . . . . . . . . . . . . . . . . . . . . . . . . . . . . 1,636,44630,000 Katy Industries Inc.† . . . . . . . . . . . . . . . . . . . . . . . . . . . 9340,000 Myers Industries Inc. . . . . . . . . . . . . . . . . . . . . . . . . . . 846,00010,400 SLM Solutions Group AG† . . . . . . . . . . . . . . . . . . . . . 411,41424,000 Wartsila OYJ Abp . . . . . . . . . . . . . . . . . . . . . . . . . . . . . . 530,078
17,239,468
Electronics — 0.9%290,600 Axis Communications AB . . . . . . . . . . . . . . . . . . . . . . 11,589,475
Energy and Utilities — 2.9%64,800 Alerion Cleanpower SpA . . . . . . . . . . . . . . . . . . . . . . . 274,28250,000 Alvopetro Energy Ltd., Toronto† . . . . . . . . . . . . . . . . 4,85138,000 Anadarko Petroleum Corp. . . . . . . . . . . . . . . . . . . . . . 2,295,58013,000 Apache Corp. . . . . . . . . . . . . . . . . . . . . . . . . . . . . . . . . . . 500,24015,000 Avangrid Inc. . . . . . . . . . . . . . . . . . . . . . . . . . . . . . . . . . . 766,800
369 Connecticut Water Service Inc. . . . . . . . . . . . . . . . . . 22,33620,000 Endesa SA. . . . . . . . . . . . . . . . . . . . . . . . . . . . . . . . . . . . . 440,1321,000 Enduro Royalty Trust. . . . . . . . . . . . . . . . . . . . . . . . . . . 3,5501,000 Etablissements Maurel et Prom† . . . . . . . . . . . . . . . 4,750
500,000 Gulf Coast Ultra Deep Royalty Trust . . . . . . . . . . . . 32,0004,500 Hess Corp. . . . . . . . . . . . . . . . . . . . . . . . . . . . . . . . . . . . . 227,790
65,000 National Fuel Gas Co. . . . . . . . . . . . . . . . . . . . . . . . . . . 3,344,25080,000 Noble Energy Inc. . . . . . . . . . . . . . . . . . . . . . . . . . . . . . . 2,424,000
125,000 Severn Trent plc . . . . . . . . . . . . . . . . . . . . . . . . . . . . . . . 3,233,908800,000 Texas Competitive Electric Holdings Co. LLC,
Escrow†(a) . . . . . . . . . . . . . . . . . . . . . . . . . . . . . . . . . 0425,000 Weatherford International plc† . . . . . . . . . . . . . . . . . 973,250435,000 Westar Energy Inc.. . . . . . . . . . . . . . . . . . . . . . . . . . . . . 22,876,650
1,000 WGL Holdings Inc.. . . . . . . . . . . . . . . . . . . . . . . . . . . . . 83,650
The Gabelli ABC FundSchedule of Investments — March 31, 2018 (Unaudited)
See accompanying notes to schedule of investments.
3
SharesMarketValue
COMMON STOCKS (Continued)Energy and Utilities (Continued)
9,000 Whiting Petroleum Corp.†. . . . . . . . . . . . . . . . . . . . . . $ 304,56037,812,579
Entertainment — 1.4%17,000 Liberty Media Corp.-
Liberty Braves, Cl. A†. . . . . . . . . . . . . . . . . . . . . . . . 386,4101,300 The Madison Square Garden Co, Cl. A† . . . . . . . . . 319,540
180,000 Time Warner Inc. . . . . . . . . . . . . . . . . . . . . . . . . . . . . . . 17,024,40017,730,350
Financial Services — 5.2%7,000 Alimco Financial Corp.† . . . . . . . . . . . . . . . . . . . . . . . . 90,475
68,000 AllianceBernstein Holding LP. . . . . . . . . . . . . . . . . . . 1,825,80070,000 AmTrust Financial Services Inc. . . . . . . . . . . . . . . . . 861,700
710,000 Blackhawk Network Holdings Inc.† . . . . . . . . . . . . . 31,737,00034,500 CoBiz Financial Inc. . . . . . . . . . . . . . . . . . . . . . . . . . . . . 676,2006,000 Forestar Group Inc.† . . . . . . . . . . . . . . . . . . . . . . . . . . . 126,900
812 Horizon Bancorp. . . . . . . . . . . . . . . . . . . . . . . . . . . . . . . 24,36836,000 Kinnevik AB, Cl. A. . . . . . . . . . . . . . . . . . . . . . . . . . . . . . 1,310,69060,000 KKR & Co. LP . . . . . . . . . . . . . . . . . . . . . . . . . . . . . . . . . 1,218,0001,000 Mastercard Inc., Cl. A . . . . . . . . . . . . . . . . . . . . . . . . . . 175,160
78,000 MoneyGram International Inc.†. . . . . . . . . . . . . . . . . 672,36032,000 Navient Corp. . . . . . . . . . . . . . . . . . . . . . . . . . . . . . . . . . . 419,84010,000 Oritani Financial Corp. . . . . . . . . . . . . . . . . . . . . . . . . . 153,500
100 Patriot National Inc.† . . . . . . . . . . . . . . . . . . . . . . . . . . 1270,000 Sterling Bancorp. . . . . . . . . . . . . . . . . . . . . . . . . . . . . . . 6,088,500
2,200 Topdanmark A/S†. . . . . . . . . . . . . . . . . . . . . . . . . . . . . . 103,34439,300 Validus Holdings Ltd. . . . . . . . . . . . . . . . . . . . . . . . . . . 2,650,78518,000 Waddell & Reed Financial Inc., Cl. A . . . . . . . . . . . . 363,780
233,330 Wright Investors’ Service Holdings Inc.† . . . . . . . 114,623350,000 XL Group Ltd. . . . . . . . . . . . . . . . . . . . . . . . . . . . . . . . . . 19,341,000
67,954,026
Food and Beverage — 3.8%72,608 Blue Buffalo Pet Products Inc.† . . . . . . . . . . . . . . . . 2,890,52540,000 Dr Pepper Snapple Group Inc.. . . . . . . . . . . . . . . . . . 4,735,200
594 Huegli Holding AG . . . . . . . . . . . . . . . . . . . . . . . . . . . . . 569,14682,979 Naturex† . . . . . . . . . . . . . . . . . . . . . . . . . . . . . . . . . . . . . . 13,681,616
5,830,000 Parmalat SpA . . . . . . . . . . . . . . . . . . . . . . . . . . . . . . . . . . 21,484,7243,500 Pernod Ricard SA. . . . . . . . . . . . . . . . . . . . . . . . . . . . . . 582,465
4,000,000 Premier Foods plc† . . . . . . . . . . . . . . . . . . . . . . . . . . . . 2,121,33124,000 Remy Cointreau SA . . . . . . . . . . . . . . . . . . . . . . . . . . . . 3,419,6701,500 The Hershey Co. . . . . . . . . . . . . . . . . . . . . . . . . . . . . . . . 148,440
49,633,117
Health Care — 1.8%135,000 Ablynx NV†. . . . . . . . . . . . . . . . . . . . . . . . . . . . . . . . . . . . 7,405,22638,500 Akorn Inc.† . . . . . . . . . . . . . . . . . . . . . . . . . . . . . . . . . . . . 720,33525,000 Allergan plc. . . . . . . . . . . . . . . . . . . . . . . . . . . . . . . . . . . . 4,207,25090,000 AstraZeneca plc, ADR . . . . . . . . . . . . . . . . . . . . . . . . . . 3,147,300
800 Bio-Rad Laboratories Inc., Cl. A† . . . . . . . . . . . . . . . 200,06428,800 Cadus Corp.† . . . . . . . . . . . . . . . . . . . . . . . . . . . . . . . . . . 45,792
SharesMarketValue
31,400 Cogentix Medical Inc.† . . . . . . . . . . . . . . . . . . . . . . . . . $ 120,8907,000 Depomed Inc.† . . . . . . . . . . . . . . . . . . . . . . . . . . . . . . . . 46,130
18,000 Endo International plc† . . . . . . . . . . . . . . . . . . . . . . . . 106,9202,000 ICU Medical Inc.† . . . . . . . . . . . . . . . . . . . . . . . . . . . . . . 504,800
158,000 Idorsia Ltd.†. . . . . . . . . . . . . . . . . . . . . . . . . . . . . . . . . . . 3,788,034400 Illumina Inc.†. . . . . . . . . . . . . . . . . . . . . . . . . . . . . . . . . . 94,568
6,000 Incyte Corp.† . . . . . . . . . . . . . . . . . . . . . . . . . . . . . . . . . . 499,98075,000 Kindred Healthcare Inc. . . . . . . . . . . . . . . . . . . . . . . . . 686,25037,000 McKesson Europe AG . . . . . . . . . . . . . . . . . . . . . . . . . . 1,220,1155,000 Mylan NV† . . . . . . . . . . . . . . . . . . . . . . . . . . . . . . . . . . . . 205,850
433,000 Myrexis Inc.† . . . . . . . . . . . . . . . . . . . . . . . . . . . . . . . . . . 17,3204,500 Perrigo Co. plc. . . . . . . . . . . . . . . . . . . . . . . . . . . . . . . . . 375,030
312,000 Viralytics Ltd.† . . . . . . . . . . . . . . . . . . . . . . . . . . . . . . . . 403,77923,795,633
Hotels and Gaming — 0.2%30,000 Belmond Ltd., Cl. A† . . . . . . . . . . . . . . . . . . . . . . . . . . . 334,50011,500 Eldorado Resorts Inc.†. . . . . . . . . . . . . . . . . . . . . . . . . 379,5002,000 Mantra Group Ltd. . . . . . . . . . . . . . . . . . . . . . . . . . . . . . 6,037
25,000 Ryman Hospitality Properties Inc., REIT . . . . . . . . 1,936,2502,656,287
Machinery — 0.4%28,000 Astec Industries Inc. . . . . . . . . . . . . . . . . . . . . . . . . . . . 1,545,040
140,000 CNH Industrial NV . . . . . . . . . . . . . . . . . . . . . . . . . . . . . 1,736,00045,000 CNH Industrial NV, Borsa Italiana . . . . . . . . . . . . . . . 555,36412,000 Xylem Inc. . . . . . . . . . . . . . . . . . . . . . . . . . . . . . . . . . . . . . 923,040
4,759,444
Metals and Mining — 0.5%18,000 Alamos Gold Inc., Cl. A. . . . . . . . . . . . . . . . . . . . . . . . . 93,78042,000 Ampco-Pittsburgh Corp. . . . . . . . . . . . . . . . . . . . . . . . 373,800
170,000 Freeport-McMoRan Inc.† . . . . . . . . . . . . . . . . . . . . . . 2,986,90035,000 Newmont Mining Corp. . . . . . . . . . . . . . . . . . . . . . . . . 1,367,45012,000 Pan American Silver Corp. . . . . . . . . . . . . . . . . . . . . . 193,45710,000 Vulcan Materials Co. . . . . . . . . . . . . . . . . . . . . . . . . . . . 1,141,700
6,157,087
Paper and Forest Products — 1.0%360,000 KapStone Paper and Packaging Corp. . . . . . . . . . . 12,351,600
3,000 Smurfit Kappa Group plc . . . . . . . . . . . . . . . . . . . . . . . 121,51912,473,119
Publishing — 0.2%5,000 Meredith Corp. . . . . . . . . . . . . . . . . . . . . . . . . . . . . . . . . 269,000
14,000 Telegraaf Media Groep NV†(a). . . . . . . . . . . . . . . . . . 103,358150,000 The E.W. Scripps Co., Cl. A. . . . . . . . . . . . . . . . . . . . . 1,798,500
2,170,858
Real Estate — 0.6%500 American Tower Corp., REIT . . . . . . . . . . . . . . . . . . . 72,670
10,000 GGP Inc., REIT . . . . . . . . . . . . . . . . . . . . . . . . . . . . . . . . 204,600800,000 Pure Industrial Real Estate Trust, REIT. . . . . . . . . . 4,992,432
The Gabelli ABC FundSchedule of Investments (Continued) — March 31, 2018 (Unaudited)
See accompanying notes to schedule of investments.
4
SharesMarketValue
COMMON STOCKS (Continued)Real Estate (Continued)
36,000 Vastned Retail Belgium NV, REIT . . . . . . . . . . . . . . . $ 2,516,0277,785,729
Retail — 0.1%20,000 Macy’s Inc. . . . . . . . . . . . . . . . . . . . . . . . . . . . . . . . . . . . . 594,80041,770 The Bon-Ton Stores Inc.† . . . . . . . . . . . . . . . . . . . . . . 1,683
596,483
Semiconductors — 1.0%120,000 AIXTRON SE† . . . . . . . . . . . . . . . . . . . . . . . . . . . . . . . . . 2,314,47938,000 Microsemi Corp.†. . . . . . . . . . . . . . . . . . . . . . . . . . . . . . 2,459,36070,000 NXP Semiconductors NV† . . . . . . . . . . . . . . . . . . . . . 8,190,000
12,963,839
Specialty Chemicals — 0.6%96,986 A. Schulman Inc. . . . . . . . . . . . . . . . . . . . . . . . . . . . . . . 4,170,3986,000 Linde AG . . . . . . . . . . . . . . . . . . . . . . . . . . . . . . . . . . . . . . 1,203,381
11,000 Monsanto Co. . . . . . . . . . . . . . . . . . . . . . . . . . . . . . . . . . 1,283,59050,000 SGL Carbon SE† . . . . . . . . . . . . . . . . . . . . . . . . . . . . . . . 704,43315,000 Valvoline Inc. . . . . . . . . . . . . . . . . . . . . . . . . . . . . . . . . . . 331,950
7,693,752
Telecommunications — 1.2%290,000 Asia Satellite Telecommunications Holdings
Ltd. . . . . . . . . . . . . . . . . . . . . . . . . . . . . . . . . . . . . . . . . . 256,812320,000 CenturyLink Inc. . . . . . . . . . . . . . . . . . . . . . . . . . . . . . . . 5,257,600
8,500 Harris Corp. . . . . . . . . . . . . . . . . . . . . . . . . . . . . . . . . . . . 1,370,880130,000 Koninklijke KPN NV . . . . . . . . . . . . . . . . . . . . . . . . . . . . 389,819100,000 Pharol SGPS SA† . . . . . . . . . . . . . . . . . . . . . . . . . . . . . . 28,054650,000 Sprint Corp.† . . . . . . . . . . . . . . . . . . . . . . . . . . . . . . . . . . 3,172,00083,000 Telenet Group Holding NV†. . . . . . . . . . . . . . . . . . . . . 5,540,414
16,015,579
Transportation — 1.1%525,000 Abertis Infraestructuras SA. . . . . . . . . . . . . . . . . . . . . 11,769,881250,000 Student Transportation Inc. . . . . . . . . . . . . . . . . . . . . 1,872,500
2,000 XPO Logistics Europe SA† . . . . . . . . . . . . . . . . . . . . . 728,42714,370,808
Wireless Communications — 0.7%10,000 Blackberry Ltd.† . . . . . . . . . . . . . . . . . . . . . . . . . . . . . . . 115,000
122,000 Millicom International Cellular SA, SDR. . . . . . . . . 8,321,0387,500 T-Mobile US Inc.†. . . . . . . . . . . . . . . . . . . . . . . . . . . . . . 457,800
13,000 United States Cellular Corp.† . . . . . . . . . . . . . . . . . . . 522,4709,416,308
TOTAL COMMON STOCKS . . . . . . . . . . . . . . . . . . . . . 524,018,161
CLOSED-END FUNDS — 0.0%1,400 Altaba Inc.†. . . . . . . . . . . . . . . . . . . . . . . . . . . . . . . . . . . . 103,656
SharesMarketValue
PREFERRED STOCKS — 0.0%Financial Services — 0.0%
24,066 Steel Partners Holdings LP, Ser. A, 6.000% . . . . . $ 491,187
Telecommunications — 0.0%3,000 Cincinnati Bell Inc., 6.750%, Ser. B . . . . . . . . . . . . . 146,760
TOTAL PREFERRED STOCKS. . . . . . . . . . . . . . . . . . . 637,947
RIGHTS — 0.1%Entertainment — 0.0%
201,000 Media General Inc., CVR†(a) . . . . . . . . . . . . . . . . . . . 0
Health Care — 0.1%110,600 Adolor Corp., CPR, expire 07/01/19†(a) . . . . . . . . 0187,969 Ambit Biosciences Corp., CVR†(a). . . . . . . . . . . . . . 112,781135,000 American Medical Alert Corp., CPR†(a) . . . . . . . . . 1,350
5,000 Community Health Systems Inc., CVR†. . . . . . . . . 58795,000 Dyax Corp., CVR†(a) . . . . . . . . . . . . . . . . . . . . . . . . . . . 882,450640,000 Innocoll, CVR†(a). . . . . . . . . . . . . . . . . . . . . . . . . . . . . . 384,00095,400 Ocera Therapeutics, CVR†(a). . . . . . . . . . . . . . . . . . . 37,206
100 Omthera Pharmaceuticals Inc., CVR,expire 12/31/20†(a) . . . . . . . . . . . . . . . . . . . . . . . . . 0
400,000 Sanofi, CVR, expire 12/31/20† . . . . . . . . . . . . . . . . . 169,040739,500 Synergetics USA Inc., CVR†(a) . . . . . . . . . . . . . . . . . 73,950825,000 Teva Pharmaceutical Industries Ltd., CCCP,
expire 02/20/23†(a) . . . . . . . . . . . . . . . . . . . . . . . . . 012,000 Tobira Therapeutics Inc., CVR†(a) . . . . . . . . . . . . . . 720
1,661,555
Retail — 0.0%950,000 Safeway PDC, CVR† . . . . . . . . . . . . . . . . . . . . . . . . . . . 9,500
TOTAL RIGHTS . . . . . . . . . . . . . . . . . . . . . . . . . . . . . . . . 1,671,055
WARRANTS — 0.0%Metals and Mining — 0.0%
2,550 Hudbay Minerals Inc., expire 07/20/18† . . . . . . . . 139
PrincipalAmount
CORPORATE BONDS — 0.0%Health Care — 0.0%
$ 65,000 Constellation Health Promissory Note, PIK,5.000%, 01/31/24(a)(b) . . . . . . . . . . . . . . . . . . . . . 27,950
U.S. GOVERNMENT OBLIGATIONS — 59.4%771,010,000 U.S. Treasury Bills,
1.071% to 1.847%††,04/05/18 to 08/30/18(c) . . . . . . . . . . . . . . . . . . . . . 768,974,475
TOTAL INVESTMENTS — 100.0%(Cost $1,267,756,001) . . . . . . . . . . . . . . . . . . . $1,295,433,383
The Gabelli ABC FundSchedule of Investments (Continued) — March 31, 2018 (Unaudited)
See accompanying notes to schedule of investments.
5
SharesMarketValue
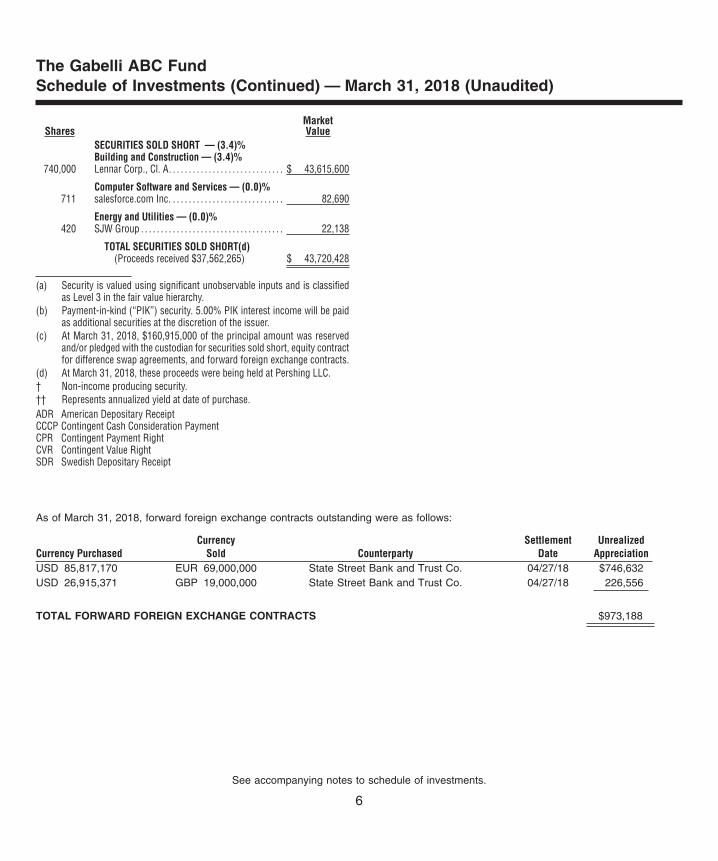
SECURITIES SOLD SHORT — (3.4)%Building and Construction — (3.4)%
740,000 Lennar Corp., Cl. A. . . . . . . . . . . . . . . . . . . . . . . . . . . . . $ 43,615,600
Computer Software and Services — (0.0)%711 salesforce.com Inc. . . . . . . . . . . . . . . . . . . . . . . . . . . . . 82,690
Energy and Utilities — (0.0)%420 SJW Group . . . . . . . . . . . . . . . . . . . . . . . . . . . . . . . . . . . . 22,138
TOTAL SECURITIES SOLD SHORT(d)(Proceeds received $37,562,265) $ 43,720,428
(a) Security is valued using significant unobservable inputs and is classifiedas Level 3 in the fair value hierarchy.
(b) Payment-in-kind (“PIK”) security. 5.00% PIK interest income will be paidas additional securities at the discretion of the issuer.
(c) At March 31, 2018, $160,915,000 of the principal amount was reservedand/or pledged with the custodian for securities sold short, equity contractfor difference swap agreements, and forward foreign exchange contracts.
(d) At March 31, 2018, these proceeds were being held at Pershing LLC.† Non-income producing security.†† Represents annualized yield at date of purchase.ADR American Depositary ReceiptCCCP Contingent Cash Consideration PaymentCPR Contingent Payment RightCVR Contingent Value RightSDR Swedish Depositary Receipt
As of March 31, 2018, forward foreign exchange contracts outstanding were as follows:
Currency PurchasedCurrency
Sold CounterpartySettlement
DateUnrealized
AppreciationUSD 85,817,170 EUR 69,000,000 State Street Bank and Trust Co. 04/27/18 $746,632USD 26,915,371 GBP 19,000,000 State Street Bank and Trust Co. 04/27/18 226,556
TOTAL FORWARD FOREIGN EXCHANGE CONTRACTS $973,188
The Gabelli ABC FundSchedule of Investments (Continued) — March 31, 2018 (Unaudited)
See accompanying notes to schedule of investments.
6
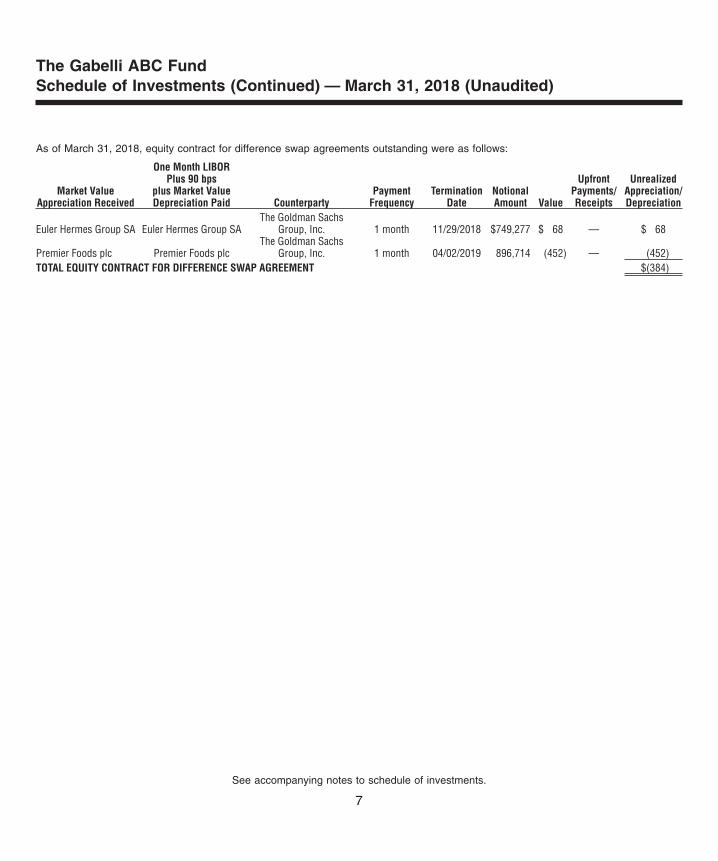
As of March 31, 2018, equity contract for difference swap agreements outstanding were as follows:
Market ValueAppreciation Received
One Month LIBORPlus 90 bps
plus Market ValueDepreciation Paid Counterparty
PaymentFrequency
TerminationDate
NotionalAmount Value
UpfrontPayments/Receipts
UnrealizedAppreciation/Depreciation
Euler Hermes Group SA Euler Hermes Group SAThe Goldman Sachs
Group, Inc. 1 month 11/29/2018 $749,277 $ 68 — $ 68
Premier Foods plc Premier Foods plcThe Goldman Sachs
Group, Inc. 1 month 04/02/2019 896,714 (452) — (452)TOTAL EQUITY CONTRACT FOR DIFFERENCE SWAP AGREEMENT $(384)
The Gabelli ABC FundSchedule of Investments (Continued) — March 31, 2018 (Unaudited)
See accompanying notes to schedule of investments.
7
As an investment company, the Fund follows the investment company accounting and reporting guidance,which is part of U.S. generally accepted accounting principles (“GAAP”) that may require the use of managementestimates and assumptions in the preparation of its schedule of investments. Actual results could differ fromthose estimates. The following is a summary of significant accounting policies followed by the Fund in thepreparation of its schedule of investments.
Security Valuation. Portfolio securities listed or traded on a nationally recognized securities exchange or tradedin the U.S. over-the-counter market for which market quotations are readily available are valued at the lastquoted sale price or a market’s official closing price as of the close of business on the day the securities arebeing valued. If there were no sales that day, the security is valued at the average of the closing bid and askedprices or, if there were no asked prices quoted on that day, then the security is valued at the closing bid priceon that day. If no bid or asked prices are quoted on such day, the security is valued at the most recentlyavailable price or, if the Board of Directors (the “Board”) so determines, by such other method as the Boardshall determine in good faith to reflect its fair market value. Portfolio securities traded on more than one nationalsecurities exchange or market are valued according to the broadest and most representative market, as determinedby Gabelli Funds, LLC (the “Adviser”).
Portfolio securities primarily traded on a foreign market are generally valued at the preceding closing valuesof such securities on the relevant market, but may be fair valued pursuant to procedures established by theBoard if market conditions change significantly after the close of the foreign market, but prior to the close ofbusiness on the day the securities are being valued. Debt obligations for which market quotations are readilyavailable are valued at the average of the latest bid and asked prices. If there were no asked prices quotedon such day, the security is valued using the closing bid price, unless the Board determines such amount doesnot reflect the securities’ fair value, in which case these securities will be fair valued as determined by theBoard. Certain securities are valued principally using dealer quotations. Futures contracts are valued at theclosing settlement price of the exchange or board of trade on which the applicable contract is traded. OTCfutures and options on futures for which market quotations are readily available will be valued by quotationsreceived from a pricing service or, if no quotations are available from a pricing service, by quotations obtainedfrom one or more dealers in the instrument in question by the Adviser.
Securities and assets for which market quotations are not readily available are fair valued as determined bythe Board. Fair valuation methodologies and procedures may include, but are not limited to: analysis and reviewof available financial and non-financial information about the company; comparisons with the valuation andchanges in valuation of similar securities, including a comparison of foreign securities with the equivalent U.S.dollar value American Depositary Receipt securities at the close of the U.S. exchange; and evaluation of anyother information that could be indicative of the value of the security.
The inputs and valuation techniques used to measure fair value of the Fund’s investments are summarizedinto three levels as described in the hierarchy below:
• Level 1 — quoted prices in active markets for identical securities;• Level 2 — other significant observable inputs (including quoted prices for similar securities, interest
rates, prepayment speeds, credit risk, etc.); and• Level 3 — significant unobservable inputs (including the Board’s determinations as to the fair value
of investments).
The Gabelli ABC FundNotes to Schedule of Investments (Unaudited)
8
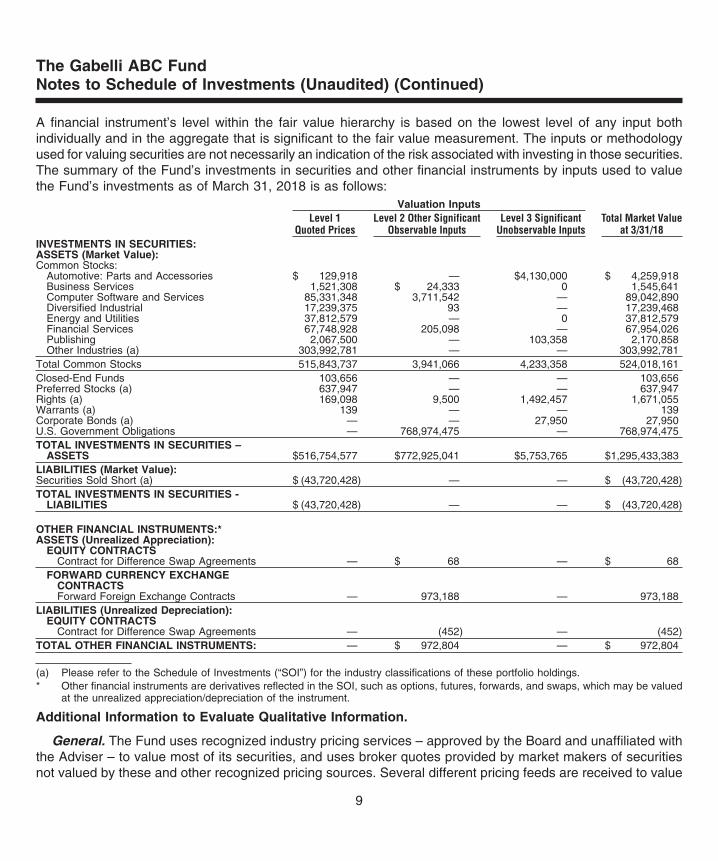
A financial instrument’s level within the fair value hierarchy is based on the lowest level of any input bothindividually and in the aggregate that is significant to the fair value measurement. The inputs or methodologyused for valuing securities are not necessarily an indication of the risk associated with investing in those securities.The summary of the Fund’s investments in securities and other financial instruments by inputs used to valuethe Fund’s investments as of March 31, 2018 is as follows:
Valuation InputsLevel 1
Quoted PricesLevel 2 Other Significant
Observable InputsLevel 3 Significant
Unobservable InputsTotal Market Value
at 3/31/18INVESTMENTS IN SECURITIES:ASSETS (Market Value):Common Stocks:
Automotive: Parts and Accessories $ 129,918 — $4,130,000 $ 4,259,918Business Services 1,521,308 $ 24,333 0 1,545,641Computer Software and Services 85,331,348 3,711,542 — 89,042,890Diversified Industrial 17,239,375 93 — 17,239,468Energy and Utilities 37,812,579 — 0 37,812,579Financial Services 67,748,928 205,098 — 67,954,026Publishing 2,067,500 — 103,358 2,170,858Other Industries (a) 303,992,781 — — 303,992,781
Total Common Stocks 515,843,737 3,941,066 4,233,358 524,018,161Closed-End Funds 103,656 — — 103,656Preferred Stocks (a) 637,947 — — 637,947Rights (a) 169,098 9,500 1,492,457 1,671,055Warrants (a) 139 — — 139Corporate Bonds (a) — — 27,950 27,950U.S. Government Obligations — 768,974,475 — 768,974,475TOTAL INVESTMENTS IN SECURITIES –
ASSETS $516,754,577 $772,925,041 $5,753,765 $1,295,433,383LIABILITIES (Market Value):Securities Sold Short (a) $ (43,720,428) — — $ (43,720,428)TOTAL INVESTMENTS IN SECURITIES -
LIABILITIES $ (43,720,428) — — $ (43,720,428)
OTHER FINANCIAL INSTRUMENTS:*ASSETS (Unrealized Appreciation):
EQUITY CONTRACTSContract for Difference Swap Agreements — $ 68 — $ 68
FORWARD CURRENCY EXCHANGECONTRACTSForward Foreign Exchange Contracts — 973,188 — 973,188
LIABILITIES (Unrealized Depreciation):EQUITY CONTRACTS
Contract for Difference Swap Agreements — (452) — (452)TOTAL OTHER FINANCIAL INSTRUMENTS: — $ 972,804 — $ 972,804
(a) Please refer to the Schedule of Investments (“SOI”) for the industry classifications of these portfolio holdings.* Other financial instruments are derivatives reflected in the SOI, such as options, futures, forwards, and swaps, which may be valued
at the unrealized appreciation/depreciation of the instrument.
Additional Information to Evaluate Qualitative Information.
General. The Fund uses recognized industry pricing services – approved by the Board and unaffiliated withthe Adviser – to value most of its securities, and uses broker quotes provided by market makers of securitiesnot valued by these and other recognized pricing sources. Several different pricing feeds are received to value
The Gabelli ABC FundNotes to Schedule of Investments (Unaudited) (Continued)
9
domestic equity securities, international equity securities, preferred equity securities, and fixed income securities.The data within these feeds are ultimately sourced from major stock exchanges and trading systems wherethese securities trade. The prices supplied by external sources are checked by obtaining quotations or actualtransaction prices from market participants. If a price obtained from the pricing source is deemed unreliable,prices will be sought from another pricing service or from a broker/dealer that trades that security or similarsecurities.
Fair Valuation. Fair valued securities may be common or preferred equities, warrants, options, rights, orfixed income obligations. Where appropriate, Level 3 securities are those for which market quotations are notavailable, such as securities not traded for several days, or for which current bids are not available, or whichare restricted as to transfer. Among the factors to be considered to fair value a security are recent prices ofcomparable securities that are publicly traded, reliable prices of securities not publicly traded, the use of valuationmodels, current analyst reports, valuing the income or cash flow of the issuer, or cost if the preceding factorsdo not apply. A significant change in the unobservable inputs could result in a lower or higher value in Level3 securities. The circumstances of Level 3 securities are frequently monitored to determine if fair valuationmeasures continue to apply.
The Adviser reports quarterly to the Board the results of the application of fair valuation policies and procedures.These may include backtesting the prices realized in subsequent trades of these fair valued securities to fairvalues previously recognized.
Derivative Financial Instruments. The Fund may engage in various portfolio investment strategies by investingin derivative financial instruments for the purposes of increasing the income of the Fund, hedging against changesin the value of its portfolio securities and in the value of securities it intends to purchase, or hedging againsta specific transaction with respect to either the currency in which the transaction is denominated or anothercurrency. Investing in certain derivative financial instruments, including participation in the options, futures, orswap markets, entails certain execution, liquidity, hedging, tax, and securities, interest, credit, or currency marketrisks. Losses may arise if the Adviser’s prediction of movements in the direction of the securities, foreign currency,and interest rate markets is inaccurate. Losses may also arise if the counterparty does not perform its dutiesunder a contract, or that, in the event of default, the Fund may be delayed in or prevented from obtainingpayments or other contractual remedies owed to it under derivative contracts. The creditworthiness of the counterpartiesis closely monitored in order to minimize these risks. Participation in derivative transactions involves investmentrisks, transaction costs, and potential losses to which the Fund would not be subject absent the use of thesestrategies. The consequences of these risks, transaction costs, and losses may have a negative impact onthe Fund’s ability to pay distributions.
The Fund’s derivative contracts held at March 31, 2018, if any, are not accounted for as hedging instrumentsunder GAAP and are disclosed in the Schedule of Investments together with the related counterparty.
Swap Agreements. The Fund may enter into equity contract for difference swap transactions for the purposeof increasing the income of the Fund. The use of swaps is a highly specialized activity that involves investmenttechniques and risks different from those associated with ordinary portfolio security transactions. In an equitycontract for difference swap, a set of future cash flows is exchanged between two counterparties. One of thesecash flow streams will typically be based on a reference interest rate combined with the performance of anotional value of shares of a stock. The other will be based on the performance of the shares of a stock.
The Gabelli ABC FundNotes to Schedule of Investments (Unaudited) (Continued)
10
Depending on the general state of short term interest rates and the returns on the Fund’s portfolio securitiesat the time an equity contract for difference swap transaction reaches its scheduled termination date, there isa risk that the Fund will not be able to obtain a replacement transaction or that the terms of the replacementwill not be as favorable as on the expiring transaction. Equity contract for difference swap agreements at March 31, 2018are presented within the Schedule of Investments.
Forward Foreign Exchange Contracts. The Fund may engage in forward foreign exchange contracts forthe purpose of hedging a specific transaction with respect to either the currency in which the transaction isdenominated or another currency as deemed appropriate by the Adviser. Forward foreign exchange contractsare valued at the forward rate and are marked-to-market daily. The change in market value is included inunrealized appreciation/depreciation on investments and foreign currency translations. When the contract isclosed, the Fund records a realized gain or loss equal to the difference between the value of the contract atthe time it was opened and the value at the time it was closed.
The use of forward foreign exchange contracts does not eliminate fluctuations in the underlying prices of theFund’s portfolio securities, but it does establish a rate of exchange that can be achieved in the future. Althoughforward foreign exchange contracts limit the risk of loss due to a decline in the value of the hedged currency,they also limit any potential gain that might result should the value of the currency increase. Forward foreignexchange contracts at March 31, 2018 are presented within the Schedule of Investments.
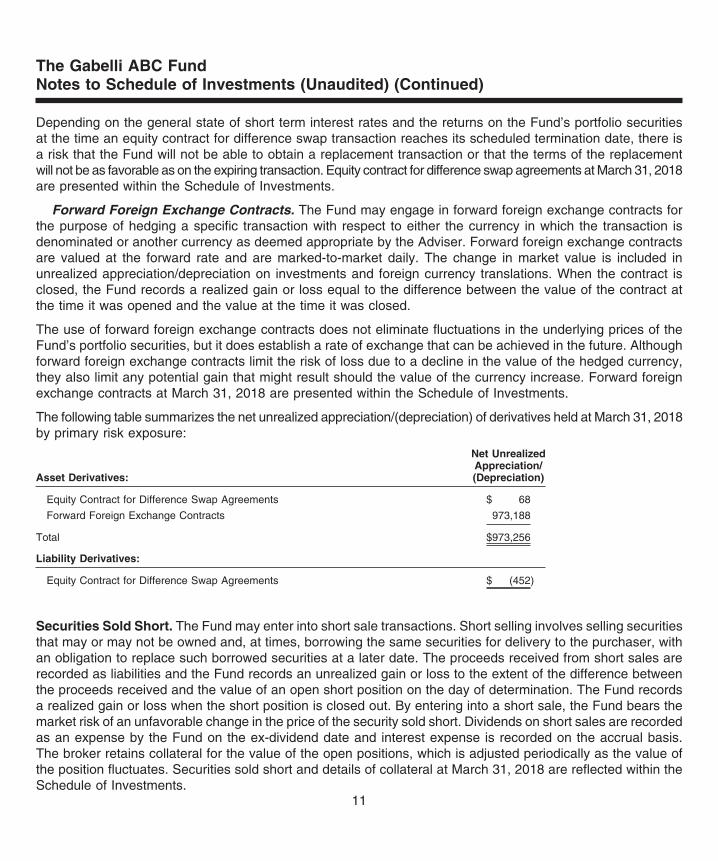
The following table summarizes the net unrealized appreciation/(depreciation) of derivatives held at March 31, 2018by primary risk exposure:
Asset Derivatives:
Net UnrealizedAppreciation/(Depreciation)
Equity Contract for Difference Swap Agreements $ 68
Forward Foreign Exchange Contracts 973,188
Total $973,256
Liability Derivatives:
Equity Contract for Difference Swap Agreements $ (452)
Securities Sold Short. The Fund may enter into short sale transactions. Short selling involves selling securitiesthat may or may not be owned and, at times, borrowing the same securities for delivery to the purchaser, withan obligation to replace such borrowed securities at a later date. The proceeds received from short sales arerecorded as liabilities and the Fund records an unrealized gain or loss to the extent of the difference betweenthe proceeds received and the value of an open short position on the day of determination. The Fund recordsa realized gain or loss when the short position is closed out. By entering into a short sale, the Fund bears themarket risk of an unfavorable change in the price of the security sold short. Dividends on short sales are recordedas an expense by the Fund on the ex-dividend date and interest expense is recorded on the accrual basis.The broker retains collateral for the value of the open positions, which is adjusted periodically as the value ofthe position fluctuates. Securities sold short and details of collateral at March 31, 2018 are reflected within theSchedule of Investments.
The Gabelli ABC FundNotes to Schedule of Investments (Unaudited) (Continued)
11
Foreign Currency Translations. The books and records of the Fund are maintained in U.S. dollars. Foreigncurrencies, investments, and other assets and liabilities are translated into U.S. dollars at current exchangerates. Purchases and sales of investment securities, income, and expenses are translated at the exchangerate prevailing on the respective dates of such transactions. Unrealized gains and losses that result from changesin foreign exchange rates and/or changes in market prices of securities have been included in unrealizedappreciation/depreciation on investments and foreign currency translations. Net realized foreign currency gainsand losses resulting from changes in exchange rates include foreign currency gains and losses between tradedate and settlement date on investment securities transactions, foreign currency transactions, and the differencebetween the amounts of interest and dividends recorded on the books of the Fund and the amounts actuallyreceived. The portion of foreign currency gains and losses related to fluctuation in exchange rates betweenthe initial purchase trade date and subsequent sale trade date is included in realized gain/(loss) on investments.
Foreign Securities. The Fund may directly purchase securities of foreign issuers. Investing in securities offoreign issuers involves special risks not typically associated with investing in securities of U.S. issuers. Therisks include possible revaluation of currencies, the inability to repatriate funds, less complete financial informationabout companies, and possible future adverse political and economic developments. Moreover, securities ofmany foreign issuers and their markets may be less liquid and their prices more volatile than securities ofcomparable U.S. issuers.
Foreign Taxes. The Fund may be subject to foreign taxes on income, gains on investments, or currency repatriation,a portion of which may be recoverable. The Fund will accrue such taxes and recoveries as applicable, basedupon its current interpretation of tax rules and regulations that exist in the markets in which it invests.
Restricted Securities. The Fund may invest up to 15% of its net assets in securities for which the marketsare restricted. Restricted securities include securities whose disposition is subject to substantial legal or contractualrestrictions. The sale of restricted securities often requires more time and results in higher brokerage chargesor dealer discounts and other selling expenses than does the sale of securities eligible for trading on nationalsecurities exchanges or in the over-the-counter markets. Restricted securities may sell at a price lower thansimilar securities that are not subject to restrictions on resale. Securities freely saleable among qualified institutionalinvestors under special rules adopted by the SEC may be treated as liquid if they satisfy liquidity standardsestablished by the Board. The continued liquidity of such securities is not as well assured as that of publiclytraded securities, and accordingly the Board will monitor their liquidity. At March 31, 2018 the Fund did nothold restricted securities.
Tax Information. The Fund intends to continue to qualify as a regulated investment company under Subchapter Mof the Internal Revenue Code of 1986, as amended.
The Gabelli ABC FundNotes to Schedule of Investments (Unaudited) (Continued)
12
p>
THE GABELLI ABC FUNDOne Corporate CenterRye, NY 10580-1422
Portfolio Management Team Biographies
Mario J. Gabelli, CFA, is Chairman, Chief Executive Officer, and Chief Investment Officer - Value Portfolios ofGAMCO Investors, Inc. that he founded in 1977, and Chief Investment Officer - Value Portfolios of Gabelli Funds, LLCand GAMCO Asset Management Inc. He is also Executive Chairman of Associated Capital Group, Inc. Mr. Gabelli isa summa cum laude graduate of Fordham University and holds an MBA degree from Columbia Business Schooland Honorary Doctorates from Fordham University and Roger Williams University.
Ryan N. Kahn, CFA, is an analyst dedicated to the Gabelli merger arbitrage portfolios, specifically to our U.S.open and closed-end funds. He joined the team in 2013 after working as a generalist in the research department.Mr. Kahn earned a Bachelor of Science in Business Management from Babson College.
Regina M. Pitaro is a Managing Director and Head of Institutional Marketing at GAMCO Investors, Inc. Ms. Pitarojoined the firm in 1984 and coordinates the organization’s focus with consultants and plan sponsors. She alsoserves as a Managing Director and Director of GAMCO Asset Management, Inc., and also serves as a portfoliomanager for Gabelli Funds, LLC. Ms. Pitaro holds an MBA in Finance from the Columbia University GraduateSchool of Business, a Master’s degree in Anthropology from Loyola University of Chicago, and a Bachelor’s degreefrom Fordham University.
Gian Maria Magrini, CFA, is an analyst dedicated to the Gabelli merger arbitrage portfolios, specifically to ourU.S. open and closed-end funds. He joined the team in 2013 after serving various roles in the operations andresearch departments. Mr. Magrini earned a Bachelor of Science in Finance from Fordham University.
Geoffrey P. Astle is involved in the analytics and foreign and domestic trading for the Gabelli merger arbitrageportfolios, specifically to our U.S. open and closed end funds. He has been associated in this capacity since 2007.Mr. Astle earned a Bachelor of Science in both Finance and Marketing from Fairfield University.
We have separated the portfolio manager’s commentary from the financial statements and investment portfolio due tocorporate governance regulations stipulated by the Sarbanes-Oxley Act of 2002. We have done this to ensure that thecontent of the portfolio manager’s commentary is unrestricted. Both the commentary and the financial statements, includingthe portfolio of investments, will be available on our website at www.gabelli.com.
THE GABELLI ABC FUNDOne Corporate CenterRye, New York 10580-1422
t 800-GABELLI (800-422-3554)f 914-921-5118e [email protected]
GABELLI.COM
Net Asset Value per share available dailyby calling 800-GABELLI after 7:00 P.M.
BOARD OF DIRECTORSMario J. Gabelli, CFAChairman and ChiefExecutive Officer,GAMCO Investors, Inc.Executive Chairman,Associated Capital Group, Inc.
Anthony J. ColavitaPresident,Anthony J. Colavita, P.C.
Vincent D. EnrightFormer Senior Vice Presidentand Chief Financial Officer,KeySpan Corp.
Mary E. HauckFormerSenior PortfolioManager,Gabelli-O'Connor FixedIncome Mutual FundManagement Co.
Kuni NakamuraPresident,Advanced Polymer, Inc.
Werner J. RoederFormer Medical Director,Lawrence Hospital
OFFICERSBruce N. AlpertPresident
John C. BallTreasurer
Agnes MulladyVice President
Andrea R. MangoSecretary
Richard J. WalzChief ComplianceOfficer
DISTRIBUTOR
G.distributors, LLC
CUSTODIAN
State Street Bank and TrustCompany
TRANSFER AGENT ANDDIVIDEND DISBURSING AGENT
DST Asset ManagerSolutions Inc.
LEGAL COUNSEL
Skadden, Arps, Slate, Meagher &Flom LLP
This report is submitted for the general information of the shareholdersof The Gabelli ABC Fund. It is not authorized for distribution to prospectiveinvestors unless preceded or accompanied by an effective prospectus.
THEGABELLIABCFUND
First Quarter ReportMarch 31, 2018
GAB408Q118QR