Embed Size (px)
Citation preview
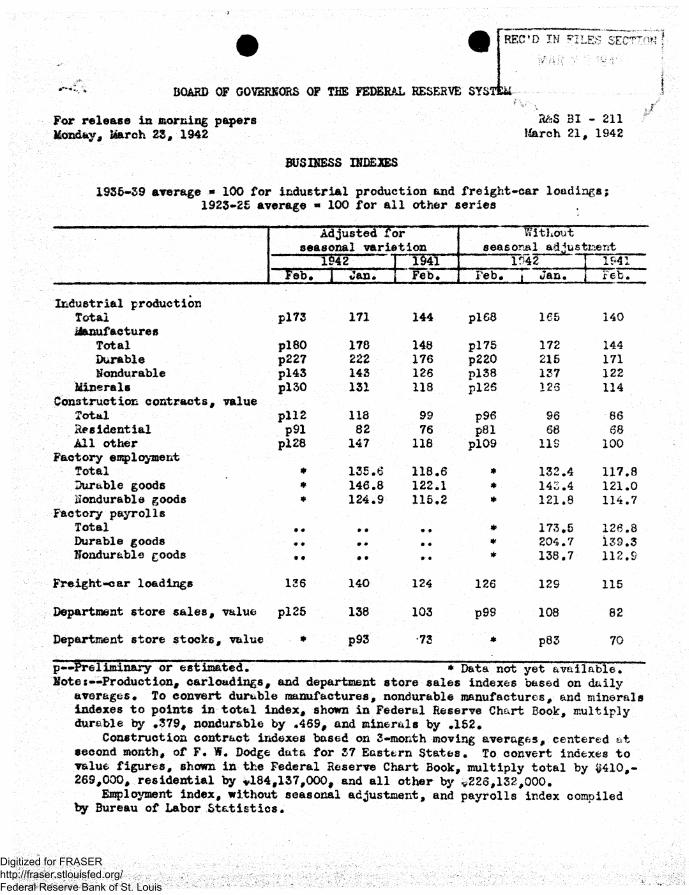
BOARD OF GOVERNORS OF THE FEDERAL RESERVE SYSTEM
For release in morning papers Monday, March 23, 1942
a&S 31 - 211 March 21, 1942
BUSINESS INDEXES
1936-39 average * 100 for industrial production and freight-car loadings; 1923-25 average * 100 for all other series
Adjusted for seasonal variation
Without seasonal adjustment
1942 ; 1941 1042 1P41 Feb. 1 Jan. i Feb# Feb, i Jan. Feb.
Industrial production Total P173 171 144 pi €8 165 140 ifenufactures
Total pi 80 178 148 pl76 172 144 Durable p227 222 176 p220 216 171 nondurable pl43 143 126 pl38 137 122
Minerals pi 30 131 118 pl2S 125 114 Construction contracts, value
Total piia 118 99 p96 96 86 Residential p91 82 76 p81 68 68 All other pi 28 147 118 pl09 IIS 100
Factory employment Total * 135.6 118.6 s 132.4 117.8 Durable goods * 146.8 122.1 * 143.4 121.0 nondurable goods * 124.9 115.2 * 121.8 114.7
Factory payrolls Total .. e » * 173,6 126.8 Durable goods • # * 204.7 139.3 nondurable goods
•• * 138.7 112.9
Freight-oar loadings 126 140 124 126 129 115
Department store sales, value pl25 138 103 p98 108 82
Department store stocks, value , * p93 73 * p83 70
p—Preliminary or estimated. "" * Data not yet available. Hotei—Production, carlo&dings, and department store sales indexes based on dally
averages. To convert durable manufactures, nondurable manufactures, and minerals indexes to points in total index, shown in Federal Reserve Chart Book, multiply durable by .379, nondurable by .469, and minerals by .162.
Construction contract indexes based on 3-month moving averages, centered at second month, of F. W. Dodge data for 37 Eastern States. To convert indexes to value figures, shown in the Federal Reserve Chart Book, multiply total by $410,-269,000, residential by *184,137,000, and all other by *226,132,000.
Employment index, without seasonal adjustment, and payrolls index compiled by Bureau of Labor Statistics.
Digitized for FRASER http://fraser.stlouisfed.org/ Federal Reserve Bank of St. Louis
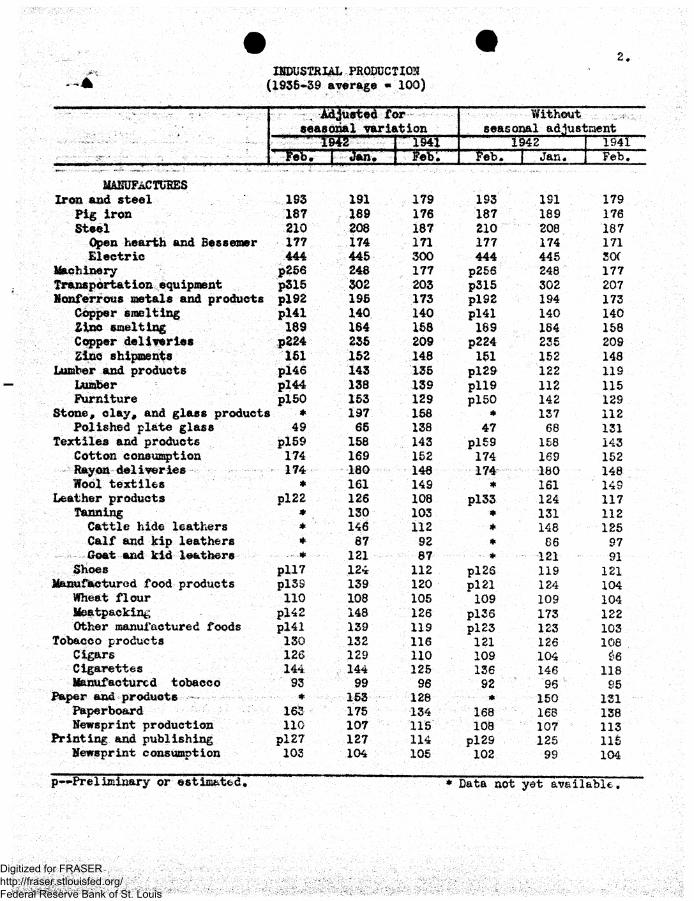
INDUSTRIAL PRODUCTION - - A (1936-39 average » 100)
- Adjusted for Without seasonal variation seasonal adjustment - 1942 - - ' 1941 1942 1941
' Feb. I Jen. Feb'. Feb. 1 Jan, &eb»
MOUFACTOBES Iron and steel 183 191 179 193 191 179
Fig iron 187 189 176 187 189 176 Steel 210 208 187 210 208 187 Open hearth and Bessemer 177 174 171 177 174 171 Electric 444 445 300 444 445 sex
Machinery p256 248 177 p256 248 177 transportation equipment p315 302 203 p315 302 207 tionferrous metals and products pl92 196 173 plS2 194 173
Copper smelting p H l 140 140 pl41 140 140 Zinc smelting 189 164 168 169 184 158 Copper deliveries p224 236 209 p224 236 209 Zinc shipments 161 152 148 151 152 148
Lumber and products pl46 143 135 pl29 122 119 Lusher pi 44 138 139 pile 112 115 Furniture plSO 153 129 pl50 142 129
Stone, clay, and glass products * 197 158 . * 137 112 Polished plate glass 49 66 138 47 68 131
Textiles and products pl59 158 143 pl59 168 143 Cotton consumption 174 169 152 174 169 152 Rayon deliveries 174 180 148 174 180 148 Wool textiles * 161 149 * 161 149
Leather products pl22 126 108 pi 33 124 117 fanning m ISO 103 * 131 112 Cattle hide leathers * 146 112 * 148 125 Calf and kip leathers * 87 92 * 66 97 Goat and kid leathers . * 121 87 - • * 121 91
Shoes pll7 124 112 pi 26 119 121 Manufactured food products piss 139 120 pi 21 124 104
Wheat flour 110 108 105 109 109 104 Meatpacking pl42 148 126 pl2S 173 122 Other manufactured foods pl41 139 119 pi 23 123 103
Tobacco products 130 132 116 121 126 108 Cigars 126 129 110 109 104 £6 Cigarettes 144 144 125 136 146 118 Manufactured tobacco 93 99 96 92 96 95
Paper and products * 163 128 * 150 131 Paperboard 163 175 134 168 168 138 Newsprint production 110 107 lis 108 107 113
Printing and publishing pl27 127 114 pl29 125 115 newsprint consumption 103 104 105 102 99 104
p—Preliminary or estimated. ' * Data not yet available.
Digitized for FRASER http://fraser.stlouisfed.org/ Federal Reserve Bank of St. Louis
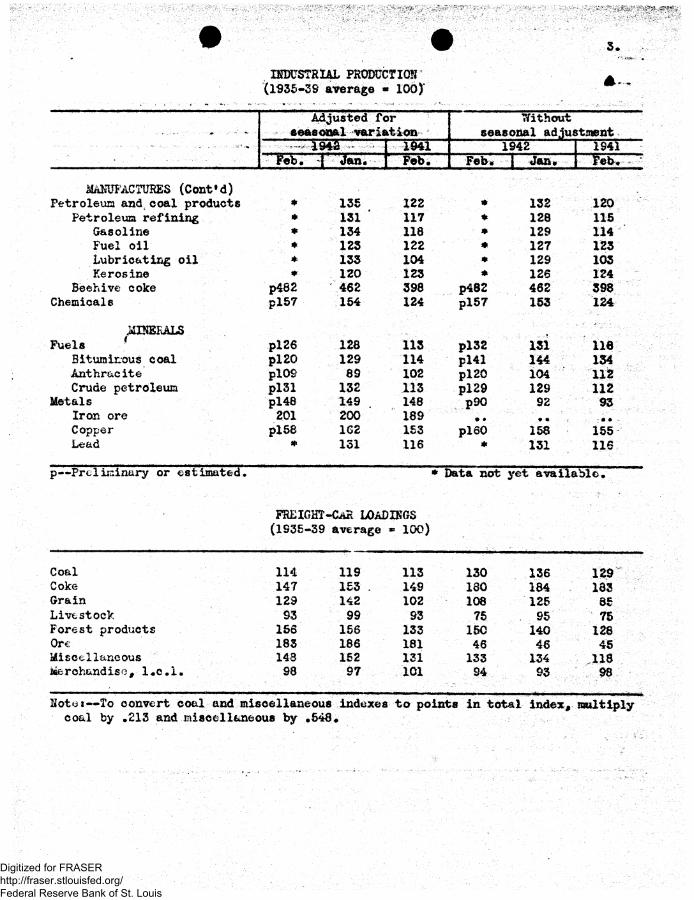
INDUSTRIAL PRODUCTION (1935-39 average - 100)'
Adjusted for Without .» ' ' •*> •" seasonal variation seasonal adjustment
1948 - 1941 1942 1941 " M : { Jan. Feb. Feb* I Jan. ieb.
MANUFACTURES (Cont'd) Petroleum and coal products * 135 122 # 132 120
Petroleum refining • 131 ' 117 # 128 115 Gasoline * 134 118 ~ m 129 114 Fuel oil * 125 122 • 127 123 Lubricating oil * 133 104 s 129 103 Kerosine * 120 123 * 126 124
Beehive coke p482 462 398 p482 462 398 Chemicals pl67 164 124 pl57 153 124
#D3ERALS - *
Fuels * pi 26 128 113 pi 32 131 lie Bituminous coal pi 20 129 114 pl41 144 134 Anthracite plOS 89 102 pi 20 104 112 Crude petroleum pl31 132 113 pi 29 129 112
Metals pl48 149 . 148 p90 92 93 Iron ore 201 200 189 ,. Copper pise 162 153 pi 60 158 155 Lead * 131 116 * 131 116
p—-Preliminary or estimated. * Data not yet available.
FREIGHT-CaR LOADINGS (1936-39 average - 100)
Coal 114 119 113 130 136 129 Coke 147 153 . 149 180 184 183 Grain 129 142 102 108 126 86 Livestock 93 99 93 75 • 95 75 Forest products 156 156 133 150 140 128 Ore 183 186 181 46 46 45 Miscellaneous 148 162 131 133 134 118 Merchandise# l*c.l» 98 97 101 . S4 93 98
Notu«--To convert coal and miscellaneous Indexes to points in total Index, multiply coal by .213 and miscellaneous by .546,
Digitized for FRASER http://fraser.stlouisfed.org/ Federal Reserve Bank of St. Louis


