Embed Size (px)
Citation preview

GEORGIA STATE EMPLOYEES POST-EMPLOYMENT
HEALTH BENEFIT FUND
&
GEORGIA SCHOOL PERSONNEL POST-EMPLOYMENT
HEALTH BENEFIT FUND
REPORT OF THE ACTUARY ON THE
RETIREE MEDICAL VALUATIONS
PREPARED AS OF JUNE 30, 2016
REVISED AS OF SEPTEMBER 11, 2017

September 11, 2017
Georgia Department of Community Health 2 Peachtree Street, N.W., 34th Floor Atlanta, GA 30303-3159
Members of the Board:
The State Health Benefit Plan is comprised of three health insurance plans: a plan primarily for State employees, established by O.C.G.A. § 45-18-2, a plan for teachers, established by O.C.G.A. § 20-2-881, and a plan for non-certificated public school employees, established by O.C.G.A. § 20-2-911. These health insurance plans are operated as one plan, and together they are referred to as the State Health Benefit Plan (SHBP). The statutes establishing the plans are referred to as “The Acts.” The State Health Benefit Plan covers active employees, retirees and their eligible dependents under The Acts for health insurance. Legislation was enacted in 2009 creating two separate OPEB funds, the Georgia State Employees Post-Employment Health Benefit Fund (the “State Employee OPEB Fund”), which provides for the payment of current and future retiree health benefits for State employees, and the Georgia School Personnel Post-Employment Health Benefit Fund (the “School Personnel OPEB Fund”), which provides for the payment of current and future retiree health benefits for teachers and non-certificated public school employees. The Georgia Department of Community Health (DCH) is the State agency responsible for obtaining the valuation of the two OPEB Funds. Enclosed are the results of the annual actuarial valuations of the State Employee OPEB Fund and the School Personnel OPEB Fund prepared as of June 30, 2016.
The impact of the Affordable Care Act (ACA) was addressed in this valuation. Review of the information currently available did not identify any specific provisions of the ACA that are anticipated to significantly impact results. While the impact of certain provisions such as the excise tax on high-value health insurance plans beginning in 2020 (if applicable), mandated benefits and participation changes due to the individual mandate should be recognized in the determination of liabilities, overall future plan costs and the resulting liabilities are driven by amounts employers and retirees can afford (i.e., trend). The trend assumption forecasts the anticipated increase to initial per capita costs, taking into account health care cost inflation, increases in benefit utilization, plan changes, government-mandated benefits, and technological advances. Given the uncertainty regarding the ACA’s implementation (e.g., the impact of excise tax on high-value health insurance plans, changes in participation resulting from the implementation of state-based health insurance exchanges), continued monitoring of the ACA’s impact on the Plan’s liability will be required. Plan design changes mandated by the ACA and incorporated in the plan designs are included in the current baseline claims costs.
Off
Cavanaugh Macdonald CC OO NN SS UU LL TT II NN GG,, LL LL CC
The experience and dedication you deserve
3550 Busbee Pkwy, Suite 250, Kennesaw, GA 30144Phone (678) 388-1700 • Fax (678) 388-1730
www.CavMacConsulting.com Offices in Englewood, CO • Kennesaw, GA • Bellevue, NE

Georgia Department of Community Health September 11, 2017 Page 2 As separate and distinct Cost Sharing Multiple-Employer Plans, both OPEB Funds separately value their own OPEB liabilities, report the results, and make the appropriate disclosures under GASB. The Plan and the employers will be required to comply with the financial reporting requirements of GASB Statements No. 74 and 75. The necessary disclosure information will be provided in separate supplemental reports. The OPEB liabilities of the State OPEB Fund are determined based on projected expenses for retired State employees enrolled in the SHBP. The OPEB liabilities of the School Personnel OPEB Fund are determined based on projected expenses for retired teachers and public school employees enrolled in the SHBP. Projected expenses are determined based on eligibility requirements in effect on January 1, 2017 and benefit offerings in effect on January 1, 2017. Results are shown separately for the State Employee OPEB Fund, which primarily includes members of the Employees’ Retirement System (ERS), the Judicial Retirement System (JRS), and the Legislative Retirement System (LRS), and the School Personnel OPEB Fund, which primarily includes members of the Teachers’ Retirement System (TRS) and the Public School Employees’ Retirement System (PSERS). Actuarial Certification Future actuarial results may differ significantly from the current results presented in this report due to such factors as the following: experience differing from that anticipated by the economic or demographic assumptions; changes in economic or demographic assumptions; increases or decreases expected as part of the natural operation of the methodology used for these measurements (such as the end of an amortization period or additional cost or contribution requirements based on the plan’s funded status); and changes in benefit provisions or applicable law. Since the potential impact of such factors is outside the scope of a normal annual actuarial valuation, an analysis of the range of results is not presented herein. This is to certify that the independent consulting actuary is a member of the American Academy of Actuaries and has experience in performing valuations for public retirement systems, that the valuations were prepared in accordance with principles of practice prescribed by the Actuarial Standards Board, and that the actuarial calculations were performed by qualified actuaries in accordance with accepted actuarial procedures, based on the current provisions of the medical plans and on actuarial assumptions that are internally consistent and reasonably based on the actual experience of each plan. Respectfully submitted,
Alisa Bennett, FSA, EA, FCA, MAAA Principal and Consulting Actuary
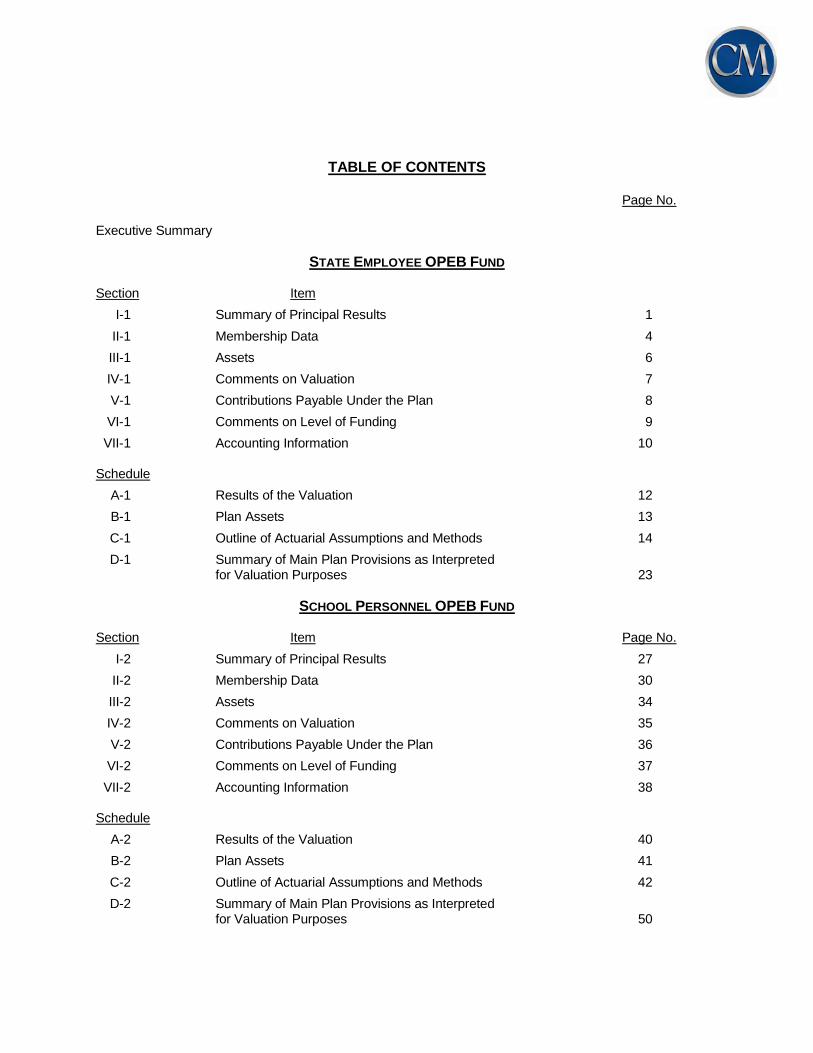
TABLE OF CONTENTS
Page No. Executive Summary
STATE EMPLOYEE OPEB FUND Section Item
I-1 Summary of Principal Results 1
II-1 Membership Data 4
III-1 Assets 6
IV-1 Comments on Valuation 7
V-1 Contributions Payable Under the Plan 8
VI-1 Comments on Level of Funding 9
VII-1 Accounting Information 10 Schedule
A-1 Results of the Valuation 12
B-1 Plan Assets 13
C-1 Outline of Actuarial Assumptions and Methods 14
D-1 Summary of Main Plan Provisions as Interpreted for Valuation Purposes 23
SCHOOL PERSONNEL OPEB FUND Section Item Page No.
I-2 Summary of Principal Results 27
II-2 Membership Data 30
III-2 Assets 34
IV-2 Comments on Valuation 35
V-2 Contributions Payable Under the Plan 36
VI-2 Comments on Level of Funding 37
VII-2 Accounting Information 38 Schedule
A-2 Results of the Valuation 40
B-2 Plan Assets 41
C-2 Outline of Actuarial Assumptions and Methods 42
D-2 Summary of Main Plan Provisions as Interpreted for Valuation Purposes 50
GEORGIA DEPARTMENT OF COMMUNITY HEALTH STATE AND SCHOOL OPEB FUNDS
REPORT OF ACTUARY ON THE RETIREE MEDICAL VALUATION PREPARED AS OF JUNE 30, 2016
EXECUTIVE SUMMARY
OVERVIEW The State Health Benefit Plan (SHBP) provides post-employment health benefits for State Employees, Public School Teachers, Public School Employees, Retirees and their eligible Dependents, and other entities under The Acts for health insurance.
Affordable Care Act The impact of the Affordable Care Act (ACA) was addressed in this valuation. Review of the information currently available did not identify any specific provisions of the ACA that are anticipated to significantly impact results. While the impact of certain provisions such as the excise tax on high-value health insurance plans beginning in 2020 (if applicable), mandated benefits and participation changes due to the individual mandate should be recognized in the determination of liabilities, overall future plan costs and the resulting liabilities are driven by amounts employers and retirees can afford (i.e., trend). The trend assumption forecasts the anticipated increase to initial per capita costs, taking into account health care cost inflation, increases in benefit utilization, plan changes, government-mandated benefits, and technological advances. Given the uncertainty regarding the ACA’s implementation (e.g., the impact of excise tax on high-value health insurance plans, changes in participation resulting from the implementation of state-based health insurance exchanges), continued monitoring of the ACA’s impact on the Plan’s liability will be required. Plan design changes mandated by the ACA and incorporated in the plan designs are included in the current baseline claims costs.
Total Covered Payroll Development For the June 30, 2016 OPEB valuation, census data was provided by DCH for both active and retired members participating in the SHBP health plans. This data included, among other items, a payroll location code which could be used in conjunction with the pension data provided by ERS, JRS, and LRS for the State Fund and TRS and PSERS for the School Fund, to obtain additional information and to determine eligibilities and participation election patterns. Additional data has been obtained for Fulton County school employees and City of Atlanta school employees who are members of the SHBP but not TRS or PSERS. In June 2017, additional data for 2,131 State members and 2,538 School members was provided. These members are included in this report. For the State Fund, the payroll location codes and the various pension plan data are used to develop a methodology to determine the Total Covered Payroll. The methodology attempts to estimate Total Covered Payroll for all eligible members, including waivers. Our methodology is as follows:
Use the Total Covered Payroll for the pension systems as a starting point.
Exclude compensation for pension plan members who are known to be ineligible for SHBP based on their payroll location codes. These would include, among others, certain Tax Officials, certain University or Charter School employees and certain library employees.
For the School Fund, the results are split between certificated teachers and non-certificated school employees rather than by retirement system. No salary information is available on the PSERS pension data, so the Total Covered payroll shown for the School Fund on page 27 is an estimate only. The contribution amounts are shown as dollar values only in some exhibits.

Total Covered Payroll Development
The Total Covered Compensation development for the State Fund is shown below.
State (ERS, JRS, LRS) 6/30/2016
Pension Payroll
ERS 2,384,358,000
JRS 57,401,000
LRS 3,907,000
Total 2,455,666,000
Ineligible based on payroll codes Additional data provided June 2017 (estimated)
(76,425,000)
35,660,000
State Total Covered Payroll
$ 2,404,901,000
The estimated Total Covered Compensation development for the School Fund is shown below.
School (TRS, PSERS, Atlanta and Fulton County Schools) 6/30/2016
Pension Payroll
TRS 10,783,277,000
PSERS (assume $27,000 average) 941,382,000
Atlanta and Fulton County Schools (estimate) 47,001,000
Total 11,771,660,000
Ineligible Board of Regents (1,654,295,000) Ineligible based on payroll codes Additional data provided June 2017 (estimated)
(80.456,000)
49,280,000
School Total Covered Payroll
$ 10,086,189,000
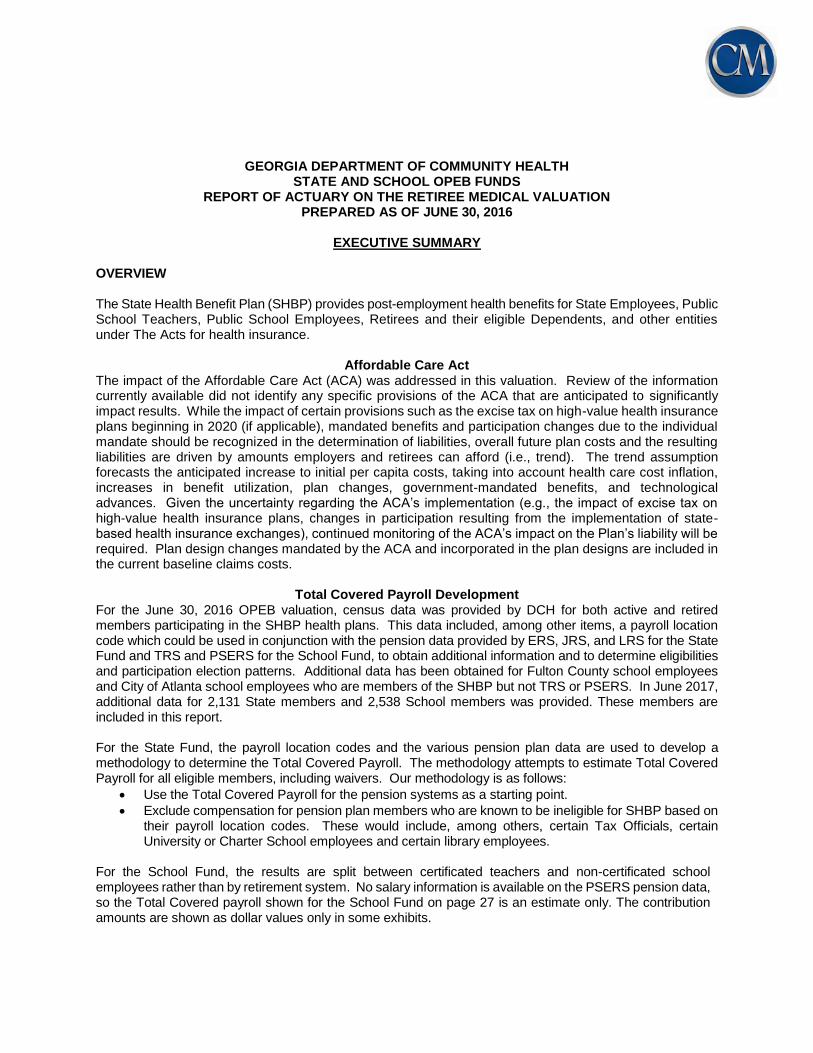
State Employee OPEB Fund Although the State Employee OPEB Fund intends to begin pre-funding benefits, the current assets have not yet accumulated to the level needed for significant long term investment. Therefore, the discount rate used to determine the present value of benefits needs to be reflective of the expected investment return on cash and other very short-term investments. For the June 30, 2016 valuation, a discount rate of 4.50% has been used for the State Employee OPEB Fund. The plan designs offered for the 2017 plan year are as follows: For Medicare-eligible members
UnitedHealthcare Medicare Advantage (MA) Plan Options (Standard and Premium)
Blue Cross and Blue Shield of Georgia (BCBSGa) Medicare Advantage (MA) Plan Options
(Standard and Premium)
Non-MA Plan Options
BCBSGa Gold, Silver, Bronze Health Reimbursement Arrangement (HRA) Plan Options
BCBSGa, Kaiser Permanente (KP) and UnitedHealthcare Health Maintenance Organization
(HMO) Plan Options
UnitedHealthcare High Deductible Health Plan (HDHP)
The valuation indicates that an actuarially determined employer contribution in the amount of $218,961,977, or 9.11% of total covered payroll, payable for the fiscal year ending June 30, 2019 is required to actuarially support the benefits of the State Employee OPEB Fund. If the employer contributions are increased to the required levels, then the Fund will be projected to cover the cost of all future benefits. If the assets are invested in such a way as to expect a rate of return higher than 4.50%, then the discount rate used in valuing liabilities could be increased. Schedule A shows the results of the valuation using a 6.00% discount rate for illustrative purposes. Medical and drug benefits of the SHBP offered in 2017 to State Employees are used as a basis for the actuarially calculated contribution rate which is developed using the unit credit actuarial cost method with projected benefits. Although there are State dental and vision plans, they are employee-pay-all and, therefore, not included in the liabilities. As of June 30, 2016, the assets in trust solely to provide benefits to retirees and their beneficiaries is $516,245,110. Gains and losses are reflected in the unfunded accrued liability that is assumed amortized by regular annual contributions as a level percentage of payroll within a 30-year period, on the assumption that payroll will increase by 3.25% annually. The assumptions are recommended by the actuary and are in the aggregate, reasonably related to the experience under the Fund and to reasonable expectations of anticipated experience under the Fund. School Personnel OPEB Fund Although the School Employee OPEB Fund intends to begin pre-funding benefits, the current assets have not yet accumulated to the level needed for significant long term investment. Therefore, the discount rate used to determine the present value of benefits needs to be reflective of the expected investment return on cash and other very short-term investments. For the June 30, 2016 valuation, a discount rate of 4.50% has been used for the School Personnel OPEB Fund.

The plan designs offered for the 2017 plan year are as follows: For Medicare-eligible members
UnitedHealthcare Medicare Advantage (MA) Plan Options (Standard and Premium)
Blue Cross and Blue Shield of Georgia (BCBSGa) Medicare Advantage (MA) Plan Options
(Standard and Premium)
Non-MA Plan Options
BCBSGa Gold, Silver, Bronze Health Reimbursement Arrangement (HRA) Plan Options
BCBSGa, Kaiser Permanente (KP) and UnitedHealthcare Health Maintenance Organization
(HMO) Plan Options
UnitedHealthcare High Deductible Health Plan (HDHP)
The valuation indicates that an actuarially determined employer contribution in the amount of $833,290,617 payable for the fiscal year ending June 30, 2019 is required to actuarially support the benefits of the School Personnel OPEB Fund. If the employer contributions are not increased to the required levels, the Fund will not be projected to cover the cost of all future benefits. If the employer contributions are increased to the required levels, then the Fund will be projected to cover the cost of all future benefits. If the assets are invested in such a way as to expect a rate of return higher than 4.50%, then the discount rate used in valuing liabilities could be increased. Schedule A shows the results of the valuation using a 6.00% discount rate for illustrative purposes. Medical and drug benefits of the SHBP offered in 2017 to teachers and non-certificated public school employees are used as a basis for the actuarially calculated contribution rate which is developed using the unit credit actuarial cost method with projected benefits. As of June 30, 2016, the assets in trust solely to provide benefits to retirees and their beneficiaries is $95,406,837. Gains and losses are reflected in the unfunded accrued liability that is assumed amortized by regular annual contributions as a level percentage of payroll within a 30-year period, on the assumption that payroll will increase by 3.25% annually. The assumptions are recommended by the actuary and are in the aggregate, reasonably related to the experience under the Fund and to reasonable expectations of anticipated experience under the Fund.

STATE EMPLOYEE OPEB FUND

Page 1
GEORGIA DEPARTMENT OF COMMUNITY HEALTH STATE EMPLOYEE OPEB FUND
REPORT OF ACTUARY ON THE RETIREE MEDICAL VALUATION PREPARED AS OF JUNE 30, 2016
SECTION I - SUMMARY OF PRINCIPAL RESULTS
1. For convenience of reference, the principal results of the valuation are summarized below. The
following table summarizes the June 30, 2016 and June 30, 2015 results for the State Employee
OPEB Fund.
Valuation Date June 30, 2016 June 30, 2015
Discount Rate 4.50% 4.50%
Members Receiving SHBP Benefits
Actives
Retirees
Spouses of Retirees
Total
47,326
36,493
12,329
96,148
45,753
35,963
12,203
93,919
Total Covered Payroll
Actuarial Accrued Liability
$ 2,404,901,000
$ 3,609,889,324
$ 2,333,060,000
$ 3,529,009,722
Assets:
Market value 516,245,110 101,450,424
Unfunded Actuarial Accrued Liability
$ 3,093,644,214
$ 3,427,559,298
Amortization period (years)
30 30
Fiscal Year 2019 2018
Actuarially Determined Employer Contribution (ADEC)
Normal Accrued Liability
Total
$ 96,844,959 $ 122,117,018 $ 218,961,977
$ 96,863,397 $ 135,297,820 $ 232,161,217
ADEC
as a % of payroll
Normal Accrued Liability
Total
4.03%
5.08%
9.11%
4.15%
5.80%
9.95%
Page 2
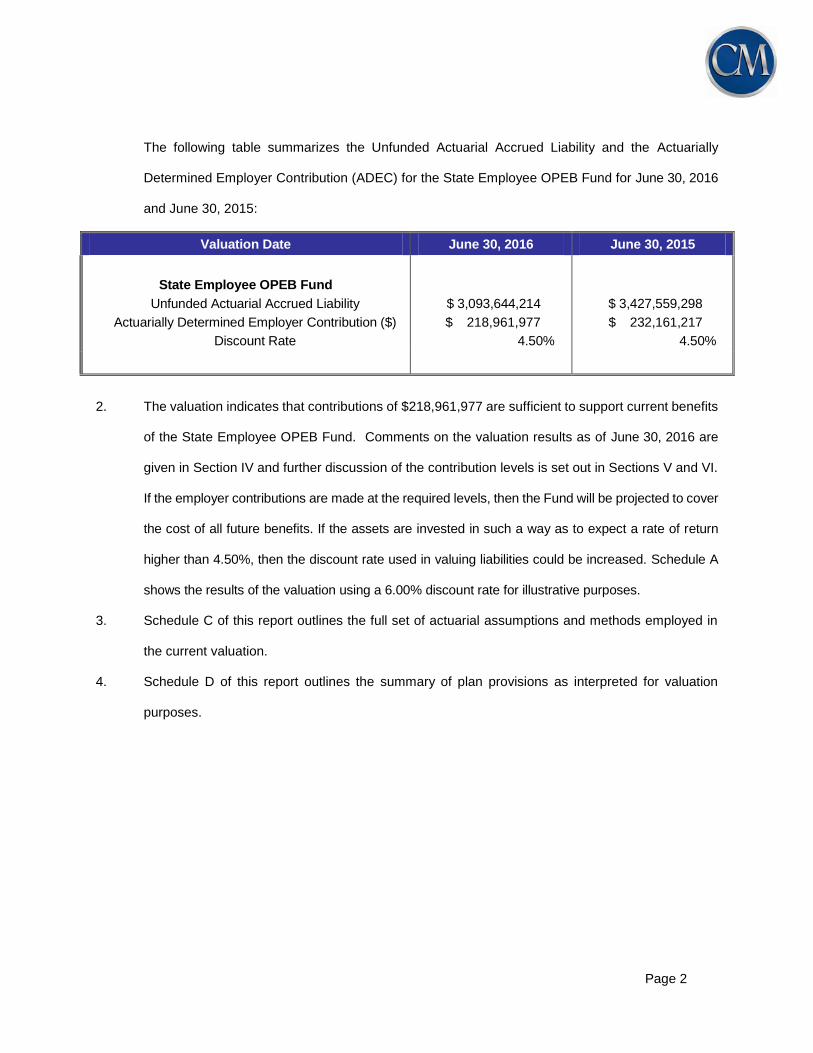
The following table summarizes the Unfunded Actuarial Accrued Liability and the Actuarially
Determined Employer Contribution (ADEC) for the State Employee OPEB Fund for June 30, 2016
and June 30, 2015:
Valuation Date June 30, 2016 June 30, 2015
State Employee OPEB Fund
Unfunded Actuarial Accrued Liability
Actuarially Determined Employer Contribution ($)
Discount Rate
$ 3,093,644,214
$ 218,961,977
4.50%
$ 3,427,559,298
$ 232,161,217
4.50%
2. The valuation indicates that contributions of $218,961,977 are sufficient to support current benefits
of the State Employee OPEB Fund. Comments on the valuation results as of June 30, 2016 are
given in Section IV and further discussion of the contribution levels is set out in Sections V and VI.
If the employer contributions are made at the required levels, then the Fund will be projected to cover
the cost of all future benefits. If the assets are invested in such a way as to expect a rate of return
higher than 4.50%, then the discount rate used in valuing liabilities could be increased. Schedule A
shows the results of the valuation using a 6.00% discount rate for illustrative purposes.
3. Schedule C of this report outlines the full set of actuarial assumptions and methods employed in
the current valuation.
4. Schedule D of this report outlines the summary of plan provisions as interpreted for valuation
purposes.
Page 3
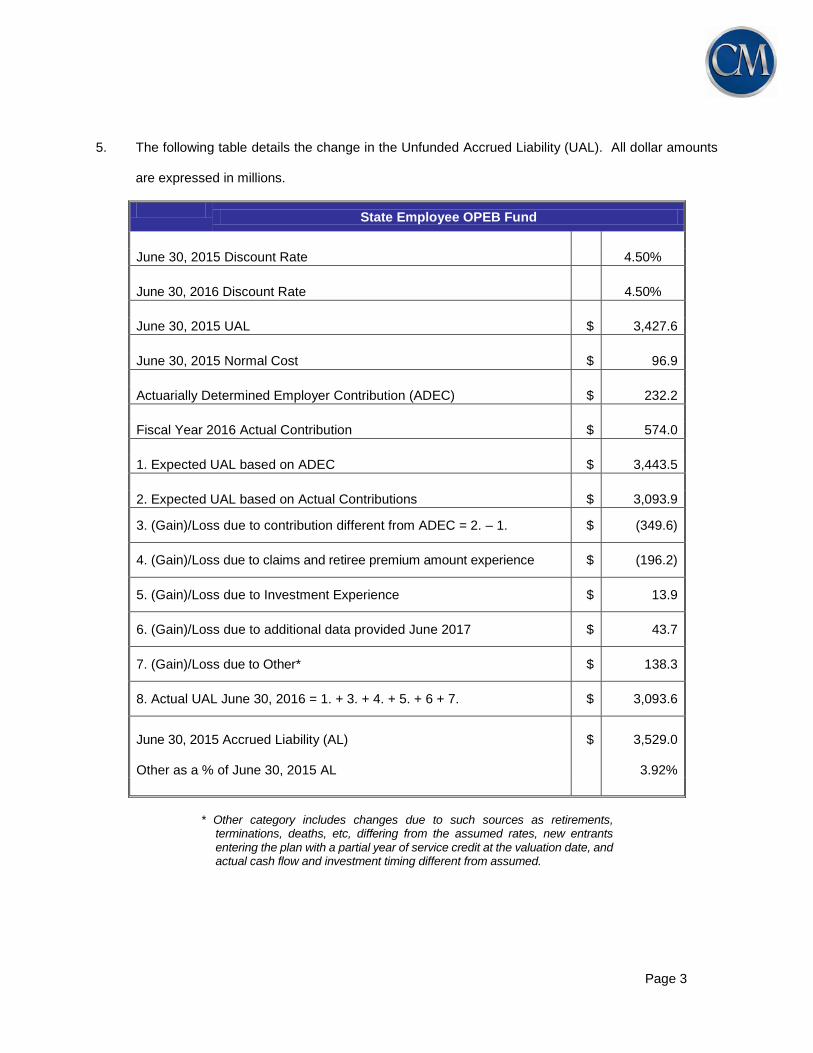
5. The following table details the change in the Unfunded Accrued Liability (UAL). All dollar amounts
are expressed in millions.
State Employee OPEB Fund
June 30, 2015 Discount Rate 4.50%
June 30, 2016 Discount Rate 4.50%
June 30, 2015 UAL $ 3,427.6
June 30, 2015 Normal Cost $ 96.9
Actuarially Determined Employer Contribution (ADEC) $ 232.2
Fiscal Year 2016 Actual Contribution $ 574.0
1. Expected UAL based on ADEC $ 3,443.5
2. Expected UAL based on Actual Contributions $ 3,093.9
3. (Gain)/Loss due to contribution different from ADEC = 2. – 1. $ (349.6)
4. (Gain)/Loss due to claims and retiree premium amount experience $ (196.2)
5. (Gain)/Loss due to Investment Experience $ 13.9
6. (Gain)/Loss due to additional data provided June 2017 $ 43.7
7. (Gain)/Loss due to Other* $ 138.3
8. Actual UAL June 30, 2016 = 1. + 3. + 4. + 5. + 6 + 7. $ 3,093.6
June 30, 2015 Accrued Liability (AL) Other as a % of June 30, 2015 AL
$
3,529.0
3.92%
* Other category includes changes due to such sources as retirements,
terminations, deaths, etc, differing from the assumed rates, new entrants entering the plan with a partial year of service credit at the valuation date, and actual cash flow and investment timing different from assumed.
Page 4
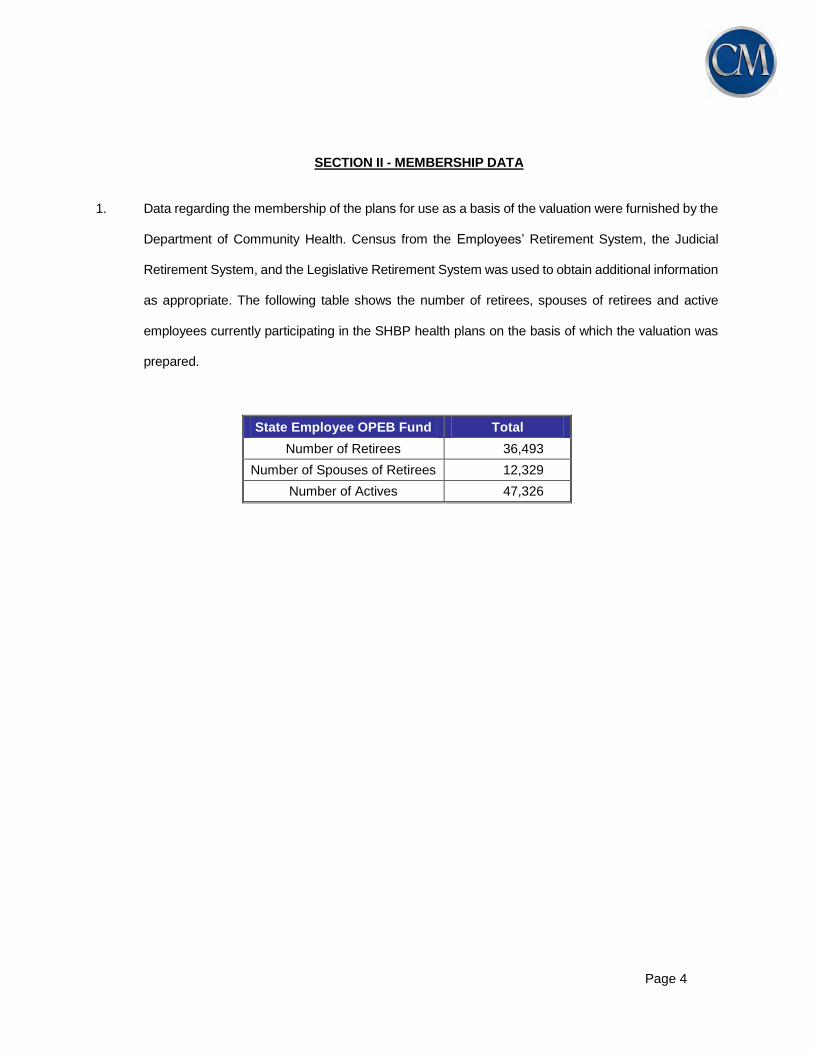
SECTION II - MEMBERSHIP DATA
1. Data regarding the membership of the plans for use as a basis of the valuation were furnished by the
Department of Community Health. Census from the Employees’ Retirement System, the Judicial
Retirement System, and the Legislative Retirement System was used to obtain additional information
as appropriate. The following table shows the number of retirees, spouses of retirees and active
employees currently participating in the SHBP health plans on the basis of which the valuation was
prepared.
State Employee OPEB Fund Total
Number of Retirees 36,493
Number of Spouses of Retirees 12,329
Number of Actives 47,326

Page 5
2. Detailed membership summaries are shown in the following tables:
STATE EMPLOYEE OPEB FUND
Active Employees Currently Participating in Health Plans by Age and Service
Service
Age Under 5 5 to 9 10 to 14 15 to 19 20 to 24 25 to 29 30 and
Up Total
Under 25 1,019 9 1,028
25 to 29 3,697 485 34 4,216
30 to 34 2,952 1,507 633 15 5,107
35 to 39 2,187 1,409 1,677 504 12 5,789
40 to 44 1,746 1,165 1,357 1,409 430 3 6,110
45 to 49 1,516 1,100 1,286 1,207 1,128 450 10 6,697
50 to 54 1,253 972 1,169 1,048 959 1,171 236 6,808
55 to 59 1,048 857 1,067 966 873 948 408 6,167
60 to 64 617 639 836 614 474 462 226 3,868
65 to 69 177 261 308 163 110 94 62 1,175
70 & up 33 61 106 44 48 39 30 361
Total 16,245 8,465 8,473 5,970 4,034 3,167 972 47,326
Enrolled Retirees and Covered Spouses
Retirees Spouses Total
Under 65 11,570 5,111 16,681
65 and Older 24,923 7,218 32,141
Total 36,493 12,329 48,822

Page 6
SECTION III - ASSETS
Schedule B shows information regarding assets for valuation purposes. As of June 30, 2016, assets held in
trust solely to provide benefits to retirees and their beneficiaries in accordance with the terms of the Fund
equal $516,245,110.
Although the State Employee OPEB Fund intends to begin pre-funding benefits, the current assets have not
yet accumulated to the level needed for significant long term investment. Therefore, the discount rate used
to determine the present value of benefits needs to be reflective of the expected investment return on cash
and other very short-term investments. For the June 30, 2016 valuation, a discount rate of 4.50% has been
used for the State Employee OPEB Fund.
Page 7
SECTION IV - COMMENTS ON VALUATION
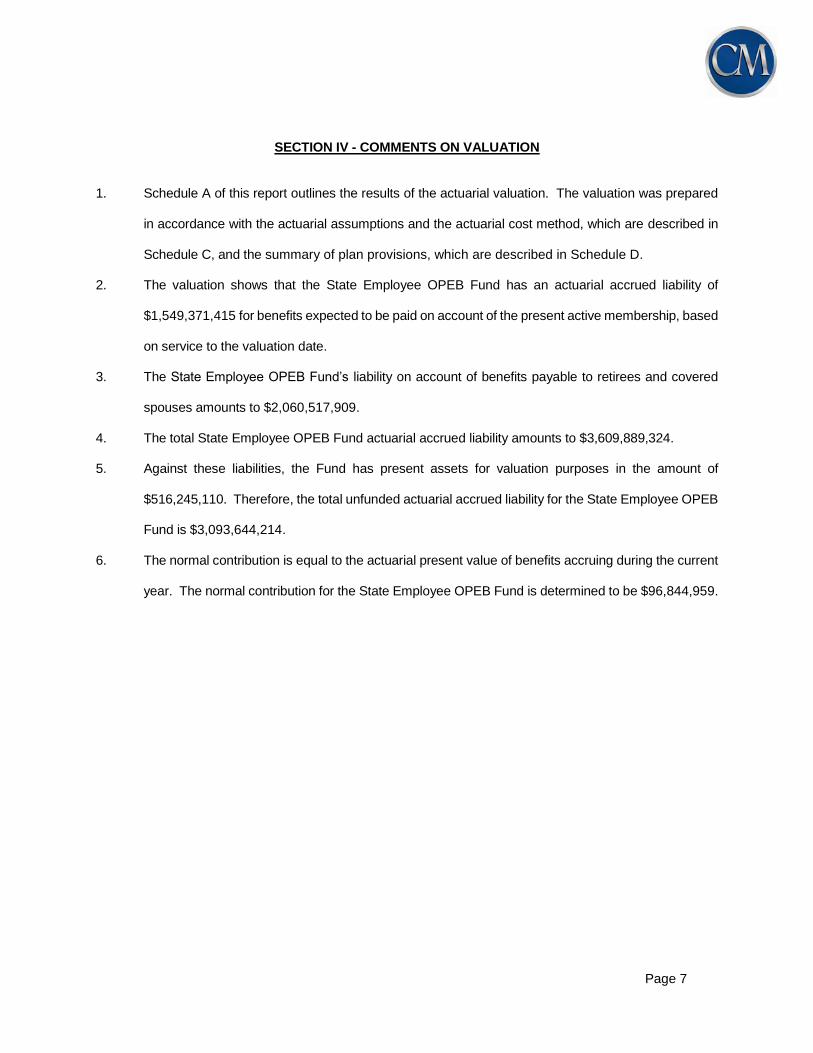
1. Schedule A of this report outlines the results of the actuarial valuation. The valuation was prepared
in accordance with the actuarial assumptions and the actuarial cost method, which are described in
Schedule C, and the summary of plan provisions, which are described in Schedule D.
2. The valuation shows that the State Employee OPEB Fund has an actuarial accrued liability of
$1,549,371,415 for benefits expected to be paid on account of the present active membership, based
on service to the valuation date.
3. The State Employee OPEB Fund’s liability on account of benefits payable to retirees and covered
spouses amounts to $2,060,517,909.
4. The total State Employee OPEB Fund actuarial accrued liability amounts to $3,609,889,324.
5. Against these liabilities, the Fund has present assets for valuation purposes in the amount of
$516,245,110. Therefore, the total unfunded actuarial accrued liability for the State Employee OPEB
Fund is $3,093,644,214.
6. The normal contribution is equal to the actuarial present value of benefits accruing during the current
year. The normal contribution for the State Employee OPEB Fund is determined to be $96,844,959.

Page 8
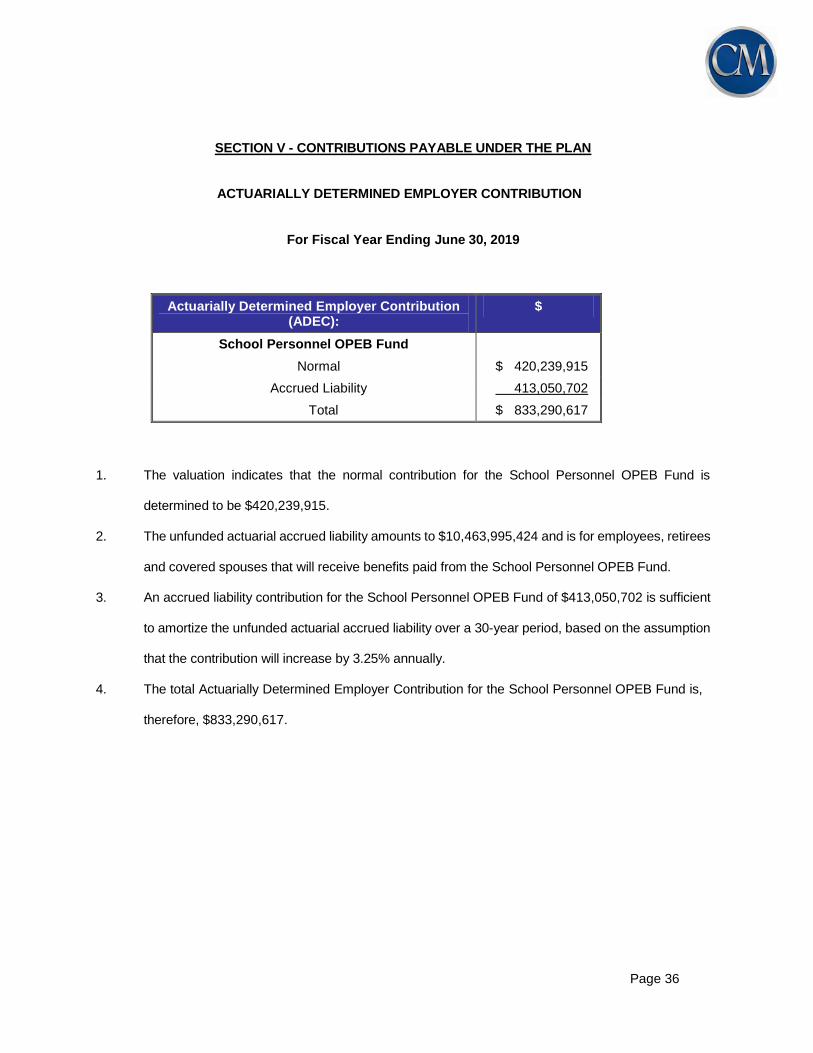
SECTION V - CONTRIBUTIONS PAYABLE UNDER THE PLAN
ACTUARIALLY DETERMINED EMPLOYER CONTRIBUTION
For Fiscal Year Ending June 30, 2019
Actuarially Determined Employer Contribution
$
State Employee OPEB Fund
Normal $ 96,644,959
Accrued Liability 122,117,018
Total $ 218,961,977
1. The valuation indicates that the normal contribution for the State Employee OPEB Fund is determined
to be $96,644,959.
2. The unfunded actuarial accrued liability amounts to $3,093,644,214 and is for employees, retirees
and covered spouses that will receive benefits paid from the State Employee OPEB Fund.
3. An accrued liability contribution for the State Employee OPEB Fund of $122,117,018 is sufficient to
amortize the unfunded actuarial accrued liability over a 30-year period, based on the assumption that
the contribution will increase by 3.25% annually.
4. The total Actuarially Determined Employer Contribution for the State Employee OPEB Fund is,
therefore, $218,961,977.
Page 9
SECTION VI - COMMENTS ON LEVEL OF FUNDING
1. The monthly contribution for retirees to opt into the medical plan is based on plan election, Medicare
eligibility and election, and dependent coverage election. Claims, premiums and associated costs paid
by the employer, on behalf of the retiree, as well as contributions placed in trust will be considered as
contributions towards the ADEC. All employer contributions shown in this report are net of retiree
monthly contributions, which are shown in Schedule D as Retiree Premiums.
2. The valuation indicates that a decrease in the recommended employer contribution for the State
Employee OPEB Fund from last year’s recommended amount of $232,161,217 to the current valuation
amount of $218,961,977 is required to fund the State Employee OPEB Fund.
3. This contribution of $218,961,977 is required to meet the cost of benefits currently accruing and provide
for the amortization of the unfunded actuarial accrued liability over a period of 30 years.
4. The decrease in the recommended contribution is primarily due to favorable claims and retiree
premium experience and employer contributions over the actuarially determined amount. Offsetting
the decrease is an increase due to lower than expected investment income.

Page 10
SECTION VII - ACCOUNTING INFORMATION
The information required under the Governmental Accounting Standards Board (GASB) Statements No. 74
and 75 will be issued in separate reports. The following information is provided for informational purposes
only.
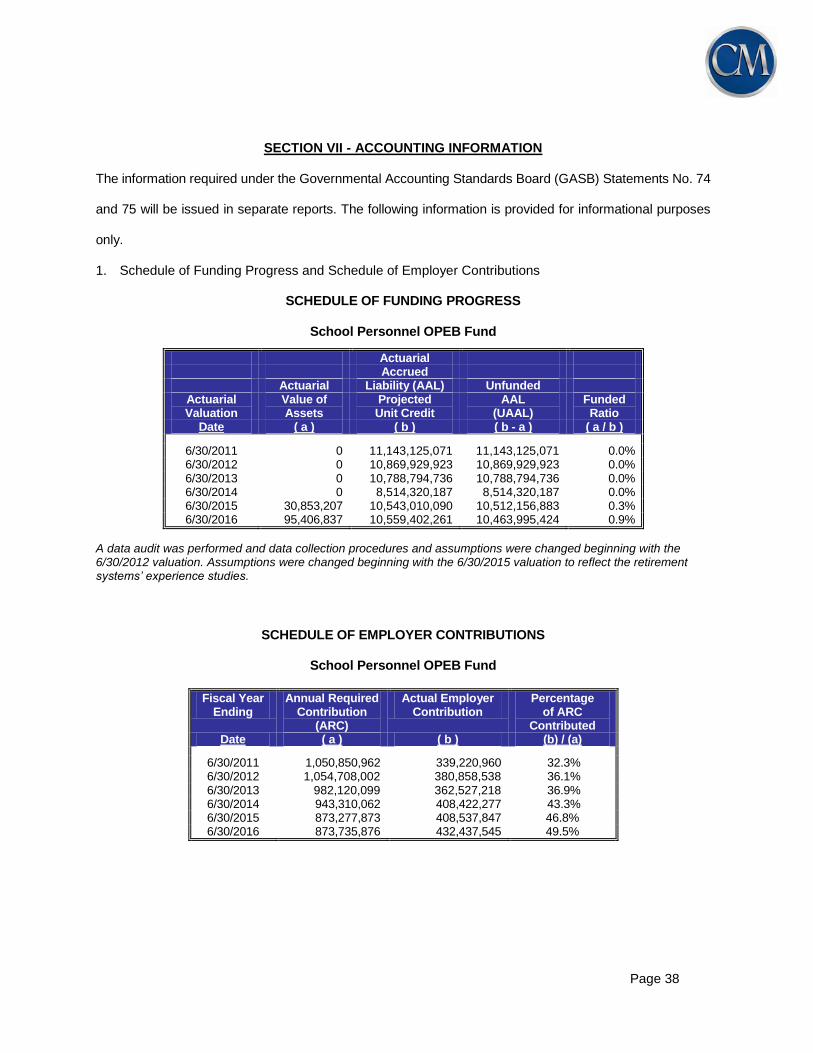
1. Schedule of Funding Progress and Schedule of Employer Contributions
SCHEDULE OF FUNDING PROGRESS State Employee OPEB Fund
Actuarial Accrued UAAL as a Actuarial Liability (AAL) Unfunded Percentage of
Actuarial Valuation
Value of Assets
Projected Unit Credit
AAL (UAAL)
Funded Ratio
Covered Payroll
Covered Payroll
Date ( a ) ( b ) ( b - a ) ( a / b ) ( c ) ( ( b - a ) / c )
6/30/2011 0 4,311,635,522 4,311,635,522 0.0% 2,542,890,541 169.6% 6/30/2012 0 3,867,926,833 3,867,926,833 0.0% 6/30/2013 0 3,587,913,000 3,587,913,000 0.0% 2,328,334,488 154.1% 6/30/2014 0 2,871,842,791 2,871,842,791 0.0% 2,293,104,232 125.2% 6/30/2015 101,450,424 3,529,009,722 3,427,559,298 2.9% 2,333,060,000 146.9% 6/30/2016 516,245,110 3,609,889,324 3,093,644,214 14.3% 2,404,901,000 128.6%
A data audit was performed and data collection procedures and assumptions were changed beginning with the 6/30/2012 valuation. Assumptions were changed beginning with the 6/30/2015 valuation to reflect the retirement systems’ experience studies.
SCHEDULE OF EMPLOYER CONTRIBUTIONS
State Employee OPEB Fund
Fiscal Year
Ending
Annual Required Contribution
(ARC)
Actual Employer
Contribution
Percentage of ARC
Contributed Date ( a ) ( b ) (b) / (a)
6/30/2011 327,052,844 168,384,048 51.5% 6/30/2012 317,100,335 181,898,661 57.4% 6/30/2013 338,819,221 181,503,596 53.6% 6/30/2014 321,455,891 177,045,380 55.1% 6/30/2015 275,680,773 267,235,185 96.9% 6/30/2016 259,249,981 574,015,317 221.4%
Page 11
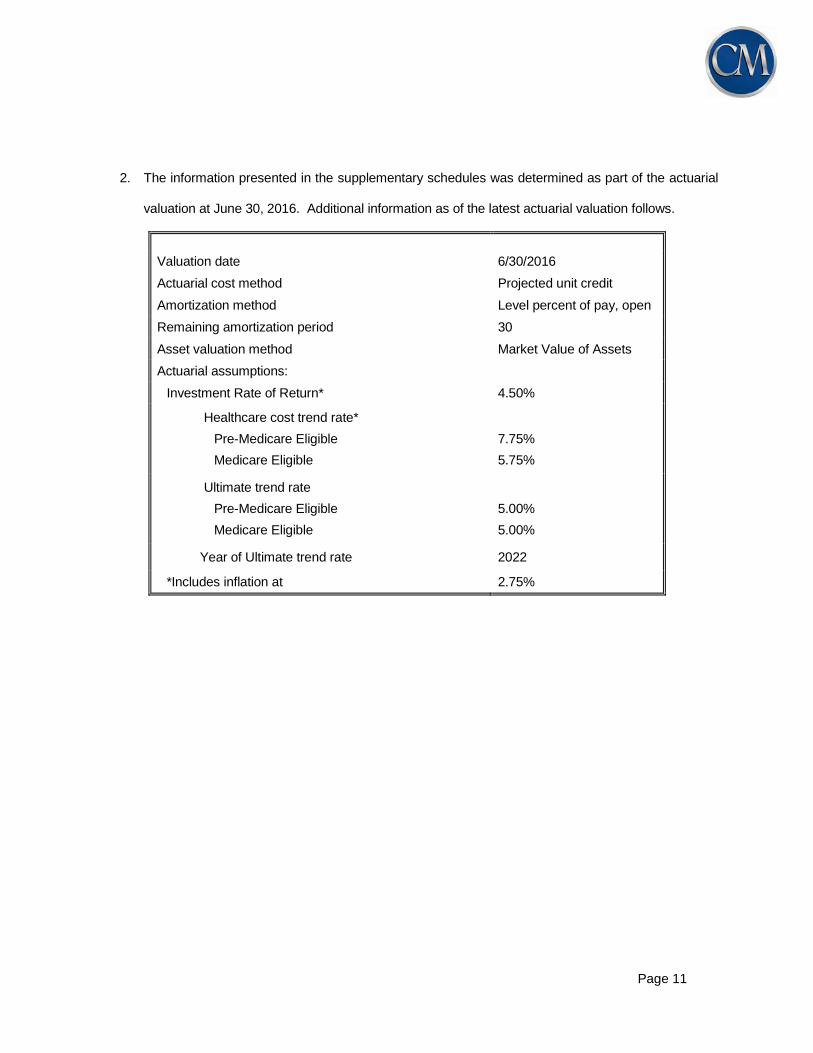
2. The information presented in the supplementary schedules was determined as part of the actuarial
valuation at June 30, 2016. Additional information as of the latest actuarial valuation follows.
Valuation date 6/30/2016
Actuarial cost method Projected unit credit
Amortization method Level percent of pay, open
Remaining amortization period 30
Asset valuation method Market Value of Assets
Actuarial assumptions:
Investment Rate of Return* 4.50%
Healthcare cost trend rate*
Pre-Medicare Eligible
Medicare Eligible
7.75%
5.75%
Ultimate trend rate
Pre-Medicare Eligible
Medicare Eligible
5.00%
5.00%
Year of Ultimate trend rate 2022
*Includes inflation at 2.75%

Page 12
SCHEDULE A
Benefit of Pre-Funding and Investing to Earn 6.0%
STATE EMPLOYEE OPEB FUND ($ shown in thousands)
Benefit of Prefunding
And Investing to earn 6.0%
Discount Rate Discount Rate
State Employee OPEB Fund 4.5%
6.0%
ACTUARIAL ACCRUED LIABILITY
Present value of prospective benefits payable in respect of:
(a) Present active members: $ 1,549,371 $1,209,848
(b) Present retired members and covered spouses: 2,060,518 1,775,236
(c) Total actuarial accrued liability $ 3,609,889 $ 2,985,084
PRESENT ASSETS FOR VALUATION PURPOSES
$ 516,245
$ 516,245
UNFUNDED ACTUARIAL ACCRUED LIABILITY
$ 3,093,644
$ 2,468,839
CONTRIBUTIONS FOR FISCAL YEAR ENDING
JUNE 30, 2019:
Normal $ 96,645 $ 72,482 Accrued Liability $ 122,117 $117,414 Total $ 218,762 $189,896

Page 13
SCHEDULE B
PLAN ASSETS
GASB defines plan assets as resources, usually in the form of stocks, bonds, and other classes of
investments, that have been segregated and restricted in a trust, or equivalent arrangement, in which (a)
employer contributions to the plan are irrevocable, (b) assets are dedicated to providing benefits to retirees
and their beneficiaries, and (c) assets are legally protected from creditors of the employers or plan
administrator, for the payment of benefits in accordance with the terms of the plan. Assets in the trust may
be used to pay health benefits to current retirees and their beneficiaries.
As of June 30, 2016, assets held in trust solely to provide benefits to retirees and their beneficiaries in
accordance with the terms of the State Employee OPEB Fund equal $516,245,110.
Although the State Employee OPEB Fund intends to begin pre-funding benefits, the current assets have not
yet accumulated to the level needed for significant long term investment. Therefore, the discount rate used
to determine the present value of benefits needs to be reflective of the expected investment return on cash
and other very short-term investments. For the June 30, 2016 valuation, a discount rate of 4.50% has been
used for the State Employee OPEB Fund.
Page 14
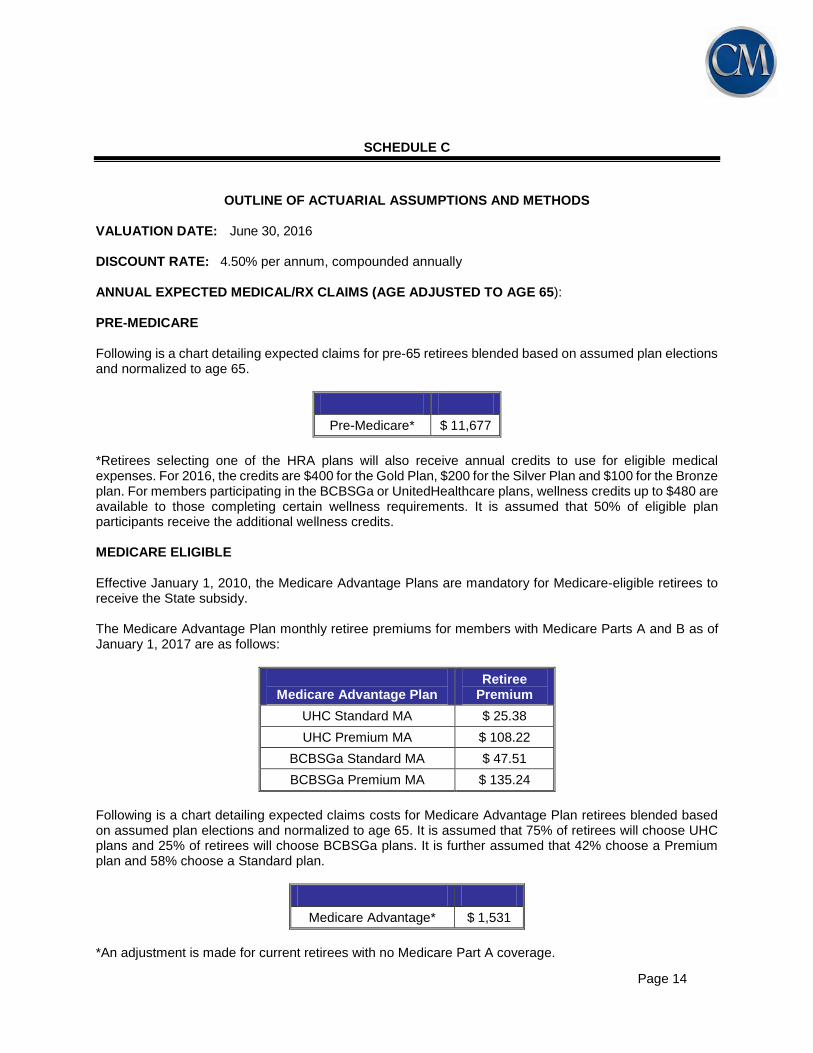
SCHEDULE C
OUTLINE OF ACTUARIAL ASSUMPTIONS AND METHODS
VALUATION DATE: June 30, 2016 DISCOUNT RATE: 4.50% per annum, compounded annually ANNUAL EXPECTED MEDICAL/RX CLAIMS (AGE ADJUSTED TO AGE 65): PRE-MEDICARE Following is a chart detailing expected claims for pre-65 retirees blended based on assumed plan elections and normalized to age 65.
Pre-Medicare* $ 11,677
*Retirees selecting one of the HRA plans will also receive annual credits to use for eligible medical expenses. For 2016, the credits are $400 for the Gold Plan, $200 for the Silver Plan and $100 for the Bronze plan. For members participating in the BCBSGa or UnitedHealthcare plans, wellness credits up to $480 are available to those completing certain wellness requirements. It is assumed that 50% of eligible plan participants receive the additional wellness credits. MEDICARE ELIGIBLE Effective January 1, 2010, the Medicare Advantage Plans are mandatory for Medicare-eligible retirees to receive the State subsidy. The Medicare Advantage Plan monthly retiree premiums for members with Medicare Parts A and B as of January 1, 2017 are as follows:
Medicare Advantage Plan
Retiree Premium
UHC Standard MA $ 25.38
UHC Premium MA $ 108.22
BCBSGa Standard MA $ 47.51
BCBSGa Premium MA $ 135.24
Following is a chart detailing expected claims costs for Medicare Advantage Plan retirees blended based on assumed plan elections and normalized to age 65. It is assumed that 75% of retirees will choose UHC plans and 25% of retirees will choose BCBSGa plans. It is further assumed that 42% choose a Premium plan and 58% choose a Standard plan.
Medicare Advantage* $ 1,531
*An adjustment is made for current retirees with no Medicare Part A coverage.

Page 15
HEALTH CARE COST TREND RATES: Following is a chart detailing trend assumptions:
Year
Pre-65 Retiree
Claims Trend
Post-65 Retiree
Claims Trend
2016
2017
2018
2019
2020
2021
2022 and beyond
7.75%
7.00%
6.50%
6.00%
5.50%
5.25%
5.00%
5.75%
5.50%
5.25%
5.00%
5.00%
5.00%
5.00%
AGE RELATED MORBIDITY: Per capita costs are adjusted to reflect expected cost changes related to age. The increase to the net incurred claims was assumed to be:
Participant Age Annual Increase
Under 20
20 – 24
25 – 29
30 – 34
35 – 39
40 – 44
45 – 49
50 – 54
55 – 59
60 – 64
65 – 69
70 – 74
75 – 79
80 – 84
85 – 89
90 and over
0.00%
0.65%
0.65%
1.25%
1.90%
2.50%
3.25%
4.15%
4.50%
5.25%
3.75%
3.15%
2.50%
1.25%
0.65%
0.00%

Page 16
ANTICIPATED PARTICIPATION: Representative values of the assumed annual rates of member participation and spouse coverage by future retirees are as follows:
State
Participation if currently participating in health coverage 100%
Participation if currently waiving health coverage 0%
Spouse Coverage 40%
ACTUARIAL METHOD: Costs were determined using the Projected Unit Credit Actuarial Cost Method. The annual service cost is the present value of the portion of the projected benefit attributable to participation service during the upcoming year, and the actuarial accrued liability (AAL) is equal to the present value of the portion of the projected benefit attributable to service before the valuation date. Service from hire date through the date of full retirement eligibility was used in allocating costs.
ACTUARIAL VALUE OF ASSETS: Market Value
Page 17
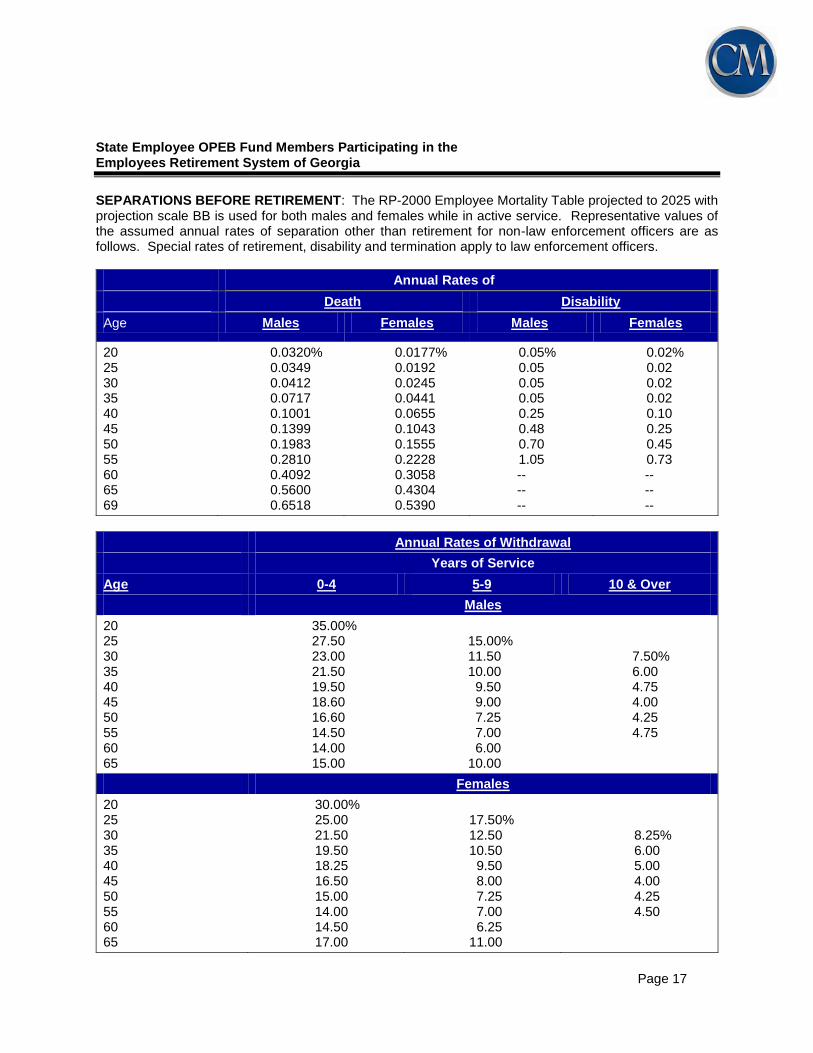
State Employee OPEB Fund Members Participating in the Employees Retirement System of Georgia
SEPARATIONS BEFORE RETIREMENT: The RP-2000 Employee Mortality Table projected to 2025 with projection scale BB is used for both males and females while in active service. Representative values of the assumed annual rates of separation other than retirement for non-law enforcement officers are as follows. Special rates of retirement, disability and termination apply to law enforcement officers.
Annual Rates of
Death Disability
Age Males Females Males Females
20 25 30 35 40 45 50 55 60 65 69
0.0320% 0.0349 0.0412 0.0717 0.1001 0.1399 0.1983 0.2810 0.4092 0.5600 0.6518
0.0177% 0.0192 0.0245 0.0441 0.0655 0.1043 0.1555 0.2228 0.3058 0.4304 0.5390
0.05% 0.05 0.05 0.05 0.25 0.48 0.70 1.05
-- -- --
0.02% 0.02 0.02 0.02 0.10 0.25 0.45 0.73 -- -- --
Annual Rates of Withdrawal
Years of Service
Age 0-4 5-9 10 & Over
Males
20 25 30 35 40 45 50 55 60 65
35.00% 27.50 23.00 21.50 19.50 18.60 16.60 14.50 14.00 15.00
15.00% 11.50 10.00 9.50 9.00 7.25 7.00 6.00
10.00
7.50% 6.00 4.75 4.00 4.25 4.75
Females
20 25 30 35 40 45 50 55 60 65
30.00% 25.00 21.50 19.50 18.25 16.50 15.00 14.00 14.50 17.00
17.50% 12.50 10.50 9.50 8.00 7.25 7.00 6.25
11.00
8.25% 6.00 5.00 4.00 4.25 4.50
Page 18
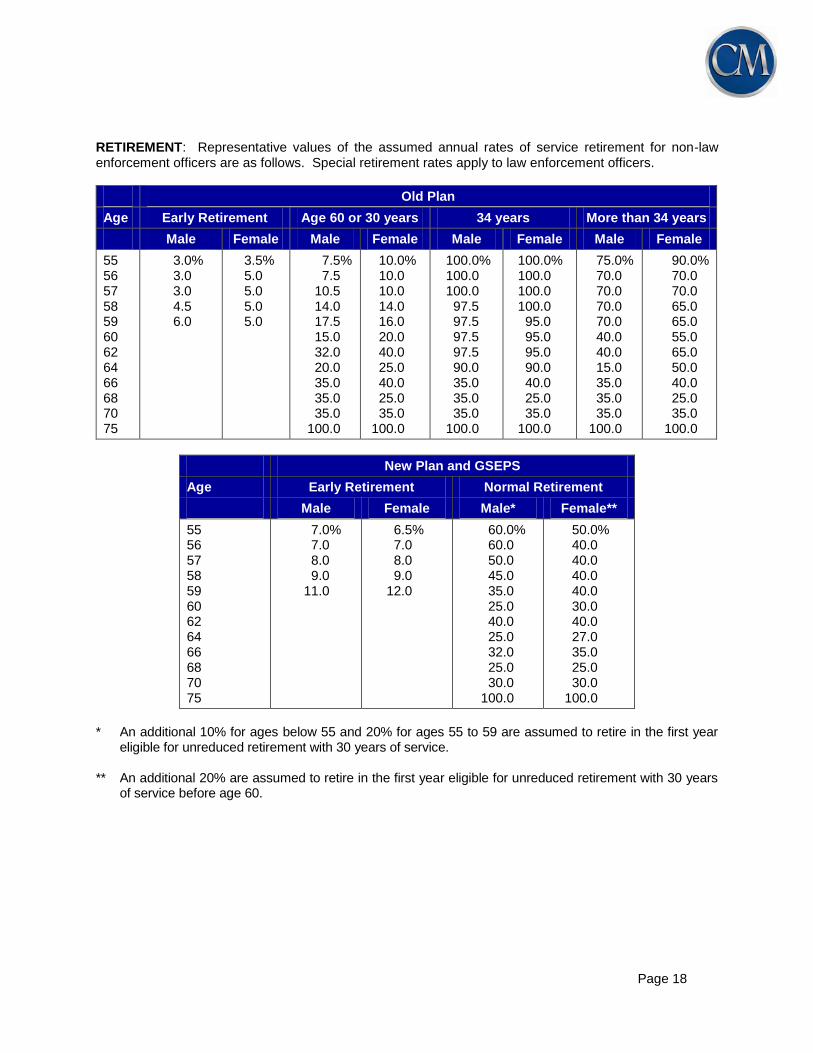
RETIREMENT: Representative values of the assumed annual rates of service retirement for non-law enforcement officers are as follows. Special retirement rates apply to law enforcement officers.
Old Plan
Age Early Retirement Age 60 or 30 years 34 years More than 34 years
Male Female Male Female Male Female Male Female
55 56 57 58 59 60 62 64 66 68 70 75
3.0% 3.0 3.0 4.5 6.0
3.5% 5.0 5.0 5.0 5.0
7.5% 7.5
10.5 14.0 17.5 15.0 32.0 20.0 35.0 35.0 35.0
100.0
10.0% 10.0 10.0 14.0 16.0 20.0 40.0 25.0 40.0 25.0 35.0
100.0
100.0% 100.0 100.0 97.5 97.5 97.5 97.5 90.0 35.0 35.0 35.0
100.0
100.0% 100.0 100.0 100.0 95.0 95.0 95.0 90.0 40.0 25.0 35.0
100.0
75.0% 70.0 70.0 70.0 70.0 40.0 40.0 15.0 35.0 35.0 35.0
100.0
90.0% 70.0 70.0 65.0 65.0 55.0 65.0 50.0 40.0 25.0 35.0
100.0
New Plan and GSEPS
Age Early Retirement Normal Retirement
Male Female Male* Female**
55 56 57 58 59 60 62 64 66 68 70 75
7.0% 7.0 8.0 9.0
11.0
6.5% 7.0 8.0 9.0
12.0
60.0% 60.0 50.0 45.0 35.0 25.0 40.0 25.0 32.0 25.0 30.0
100.0
50.0% 40.0 40.0 40.0 40.0 30.0 40.0 27.0 35.0 25.0 30.0
100.0
* An additional 10% for ages below 55 and 20% for ages 55 to 59 are assumed to retire in the first year
eligible for unreduced retirement with 30 years of service. ** An additional 20% are assumed to retire in the first year eligible for unreduced retirement with 30 years
of service before age 60.

Page 19
DEATHS AFTER RETIREMENT: The RP-2000 Combined Mortality Table projected to 2025 with projection scale BB and set forward 2 years for both males and females is used for the period after service retirement and for dependent beneficiaries. The RP-2000 Disabled Mortality Table projected to 2025 with projection scale BB and set back 7 years for males and set forward 3 years for females is used for the period after disability retirement. There is a margin for future mortality improvement in the tables used by the System. Based on the results of the most recent experience study adopted by the Board on December 17, 2015, the numbers of expected future deaths are 9-12% less than the actual number of deaths that occurred during the study period for service retirements and beneficiaries and for disability retirements. Representative values of the assumed annual rates of mortality after service retirement are as follows:
Age Males Females Age Males Females
40 45 50 55 60
0.1127% 0.1609 0.2474 0.4246 0.6985
0.0790% 0.1230 0.1872 0.2918 0.4923
65 70 75 80 85
1.1300% 1.8697 3.2147 5.5160 9.5631
0.8994% 1.5281 2.5220 4.1628 7.1239
Page 20
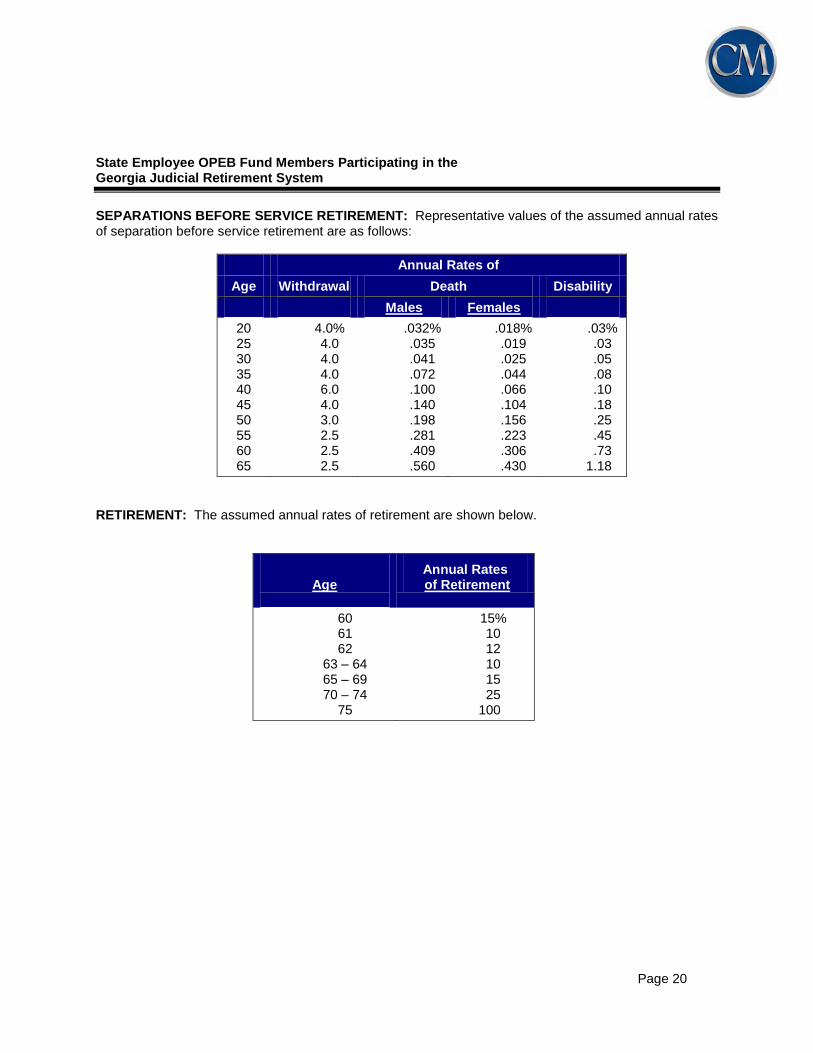
State Employee OPEB Fund Members Participating in the Georgia Judicial Retirement System
SEPARATIONS BEFORE SERVICE RETIREMENT: Representative values of the assumed annual rates of separation before service retirement are as follows:
Annual Rates of
Age Withdrawal Death Disability
Males Females
20 25 30 35 40 45 50 55 60 65
4.0% 4.0 4.0 4.0 6.0 4.0 3.0 2.5 2.5 2.5
.032% .035 .041 .072 .100 .140 .198 .281 .409 .560
.018% .019 .025 .044 .066 .104 .156 .223 .306 .430
.03% .03 .05 .08 .10 .18 .25 .45 .73
1.18
RETIREMENT: The assumed annual rates of retirement are shown below.
Age
Annual Rates of Retirement
60 61 62
63 – 64 65 – 69 70 – 74
75
15% 10 12 10 15 25 100
Page 21
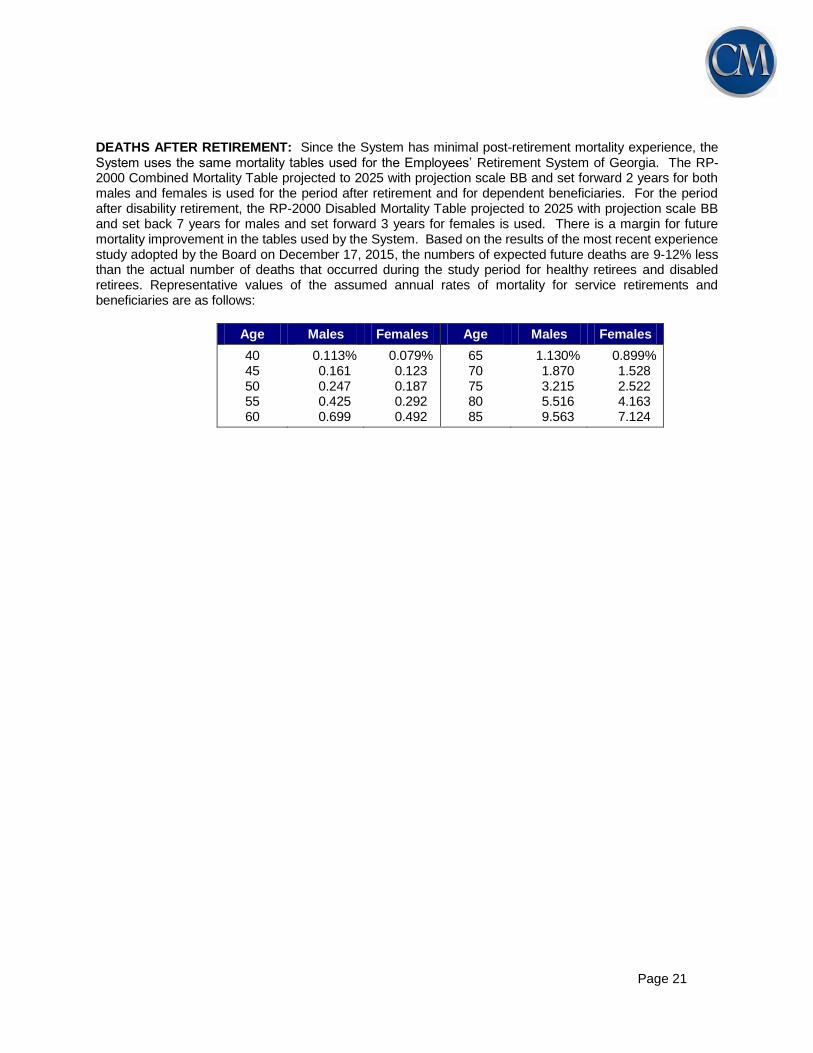
DEATHS AFTER RETIREMENT: Since the System has minimal post-retirement mortality experience, the System uses the same mortality tables used for the Employees’ Retirement System of Georgia. The RP-2000 Combined Mortality Table projected to 2025 with projection scale BB and set forward 2 years for both males and females is used for the period after retirement and for dependent beneficiaries. For the period after disability retirement, the RP-2000 Disabled Mortality Table projected to 2025 with projection scale BB and set back 7 years for males and set forward 3 years for females is used. There is a margin for future mortality improvement in the tables used by the System. Based on the results of the most recent experience study adopted by the Board on December 17, 2015, the numbers of expected future deaths are 9-12% less than the actual number of deaths that occurred during the study period for healthy retirees and disabled retirees. Representative values of the assumed annual rates of mortality for service retirements and beneficiaries are as follows:
Age Males Females Age Males Females
40 45 50 55 60
0.113% 0.161 0.247 0.425 0.699
0.079% 0.123 0.187 0.292 0.492
65 70 75 80 85
1.130% 1.870 3.215 5.516 9.563
0.899% 1.528 2.522 4.163 7.124

Page 22
State Employee OPEB Fund Members Participating in the Georgia Legislative Retirement System
SEPARATIONS BEFORE SERVICE RETIREMENT: Representative values of the assumed annual rates of separation before service retirement are as follows:
Annual Rates of
Age Withdrawal Death
Males Females 20 25 30 35 40 45 50 55 60 65
8.0% 8.0 8.0 8.0 8.0 8.5 8.5 9.0 9.0 9.0
.032%
.035
.041
.072
.100
.140
.198
.281
.409
.560
.018%
.019
.025
.044
.066
.104
.156
.223
.306
.430
SERVICE RETIREMENT: The assumed annual rates of retirement are shown below:
Age Annual Rate Age Annual Rate
60
61
62
63
64
65
10%
10%
15%
10%
10%
12%
66
67
68
69
70-74
75
12%
15%
12%
12%
20%
100%
DEATHS AFTER RETIREMENT: Since the System has minimal post-retirement mortality experience, the System uses the same mortality tables used for the Employees’ Retirement System of Georgia. The RP-2000 Combined Mortality Table projected to 2025 with projection scale BB and set forward 2 years for both males and females is used for the period after service retirement and for dependent beneficiaries. Since there are no disability retirements in the System, there are no disability mortality rates utilized at this time. There is a margin for future mortality improvement in the tables used by the System. Based on the results of the most recent experience study adopted by the Board on December 17, 2015, the numbers of expected future deaths are 9-12% less than the actual number of deaths that occurred during the study period for healthy retirees. Representative values of the assumed annual rates of mortality after service retirement are as follows:
Age Males Females Age Males Females
40 45 50 55 60
.113%
.161
.247
.425
.699
.079%
.123
.187
.292
.492
65 70 75 80 85
1.130% 1.870 3.215 5.516 9.563
.899% 1.528 2.522 4.163 7.124

Page 23
SCHEDULE D
SUMMARY OF MAIN PLAN PROVISIONS AS INTERPRETED FOR VALUATION PURPOSES
State Employee OPEB Fund Eligibility
Retiree medical eligibility is attained when an employee retires, and is immediately eligible to draw a retirement annuity from any of the retirement systems listed below. “Old Plan” means the plan applicable to members beginning employment prior to July 1, 1982. “New Plan” means the plan applicable to members employed on or after July 1, 1982 and before January 1, 2009. “GSEPS” means the plan applicable to members employed on or after January 1, 2009.
Employees’ Retirement System (GSEP Non-Police) o Service Retirement: 25 years of service or age 60 with 10 years of service o Disability Retirement: 15 years of service o Active Death Surviving Spouse: 15 years of service
Employees’ Retirement System (GSEP Police) o Service Retirement: 30 years of service or age 55 with 10 years of service o Disability Retirement: 15 years of service o Active Death Surviving Spouse: 13 years and 4 months of service
Employees’ Retirement System (Police) o Service Retirement: 30 years of service or age 55 with 10 years of service o Disability Retirement: 13 years and 4 months of service o Active Death Surviving Spouse: 13 years and 4 months of service
Employees’ Retirement System (Old & New Plan Non-Police) o Service Retirement: 25 years of service or age 60 with 10 years of service o Disability Retirement: 13 years and 4 months of service o Active Death Surviving Spouse: 13 years and 4 months of service or age 60 with 10 years of
service
Judicial Retirement System o Service Retirement: age 60 with 10 years of service o Disability Retirement: 4 years of service o Active Death Surviving Spouse: 10 years of service
Legislative Retirement System o Service Retirement: age 60 with 8 years of service o Disability Retirement: age 60 with 8 years of service o Active Death Surviving Spouse: 15 years of service or age 60 with 8 years of service
Retirees from other systems who may be eligible for post-employment benefits other than pensions were included in the valuation if they were included in the DCH census data. Coverage starts immediately at retirement, provided the retiree makes proper premium payments or has the premiums deducted from the annuity check. If elected, dependent coverage starts on the same day as retiree coverage. A change from single to family coverage as a retiree is allowed only with a qualified change in status. A tobacco surcharge of $80 per month is charged to those tobacco users not participating in the Medicare Advantage plans. Of the retirees not participating in the Medicare Advantage plans, it is assumed that 10% pay the tobacco surcharge.

Page 24
2017 Plan Options
The plan designs offered for the 2017 plan year are as follows: For Medicare-eligible members
UnitedHealthcare Medicare Advantage (MA) Plan Options (Standard and Premium)
Blue Cross and Blue Shield of Georgia (BCBSGa) Medicare Advantage (MA) Plan Options
(Standard and Premium)
Non-MA Plan Options
BCBSGa Gold, Silver, Bronze Health Reimbursement Arrangement (HRA) Plan Options
BCBSGa, Kaiser Permanente (KP) and UnitedHealthcare Health Maintenance Organization
(HMO) Plan Options
UnitedHealthcare High Deductible Health Plan (HDHP)
Premiums Retiree premiums vary based on plan election, dependent coverage, Medicare eligibility and election. Premiums shown are monthly and are effective January 1, 2017.
STATE HEALTH BENEFIT PLAN ANNUITANT UNDER 65 RATES
JANUARY 1 - DECEMBER 31, 2017
YOU YOU + CHILD(REN) YOU + SPOUSE YOU + FAMILY
BCBS Gold $164.36 $298.72 $405.84 $540.20
BCBS Silver $108.49 $203.74 $288.51 $383.76
BCBS Bronze $68.96 $136.54 $205.50 $273.08
BCBS HMO $130.96 $241.94 $335.69 $446.67
UHC HMO $166.23 $301.91 $409.78 $545.45
UHC HDHP $51.01 $106.02 $167.80 $222.82
Kaiser HMO $138.64 $255.10 $352.14 $468.59
The Medicare Advantage Plan monthly retiree premiums for members with Medicare Parts A and B as of January 1, 2017 are as follows:
Medicare Advantage Plan
Retiree Premium
UHC Standard MA $ 25.38
UHC Premium MA $ 108.22
BCBSGa Standard MA $ 47.51
BCBSGa Premium MA $ 135.24
For active employees with less than 5 years of service, premiums will be subject to the service based schedule shown on the next page.
Page 25
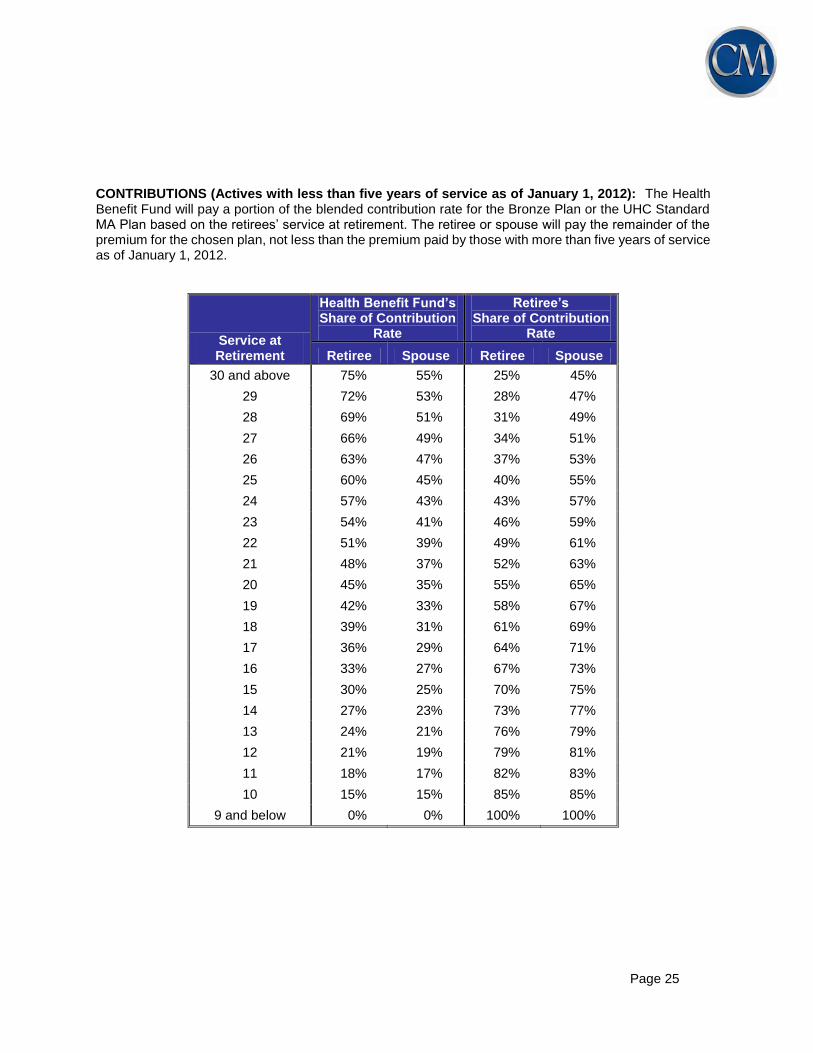
CONTRIBUTIONS (Actives with less than five years of service as of January 1, 2012): The Health Benefit Fund will pay a portion of the blended contribution rate for the Bronze Plan or the UHC Standard MA Plan based on the retirees’ service at retirement. The retiree or spouse will pay the remainder of the premium for the chosen plan, not less than the premium paid by those with more than five years of service as of January 1, 2012.
Service at Retirement
Health Benefit Fund’s Share of Contribution
Rate
Retiree’s Share of Contribution
Rate
Retiree Spouse Retiree Spouse
30 and above 75% 55% 25% 45%
29 72% 53% 28% 47%
28 69% 51% 31% 49%
27 66% 49% 34% 51%
26 63% 47% 37% 53%
25 60% 45% 40% 55%
24 57% 43% 43% 57%
23 54% 41% 46% 59%
22 51% 39% 49% 61%
21 48% 37% 52% 63%
20 45% 35% 55% 65%
19 42% 33% 58% 67%
18 39% 31% 61% 69%
17 36% 29% 64% 71%
16 33% 27% 67% 73%
15 30% 25% 70% 75%
14 27% 23% 73% 77%
13 24% 21% 76% 79%
12 21% 19% 79% 81%
11 18% 17% 82% 83%
10 15% 15% 85% 85%
9 and below 0% 0% 100% 100%

SCHOOL PERSONNEL OPEB FUND

Page 27
GEORGIA DEPARTMENT OF COMMUNITY HEALTH SCHOOL PERSONNEL OPEB FUND
REPORT OF ACTUARY ON THE RETIREE MEDICAL VALUATION PREPARED AS OF JUNE 30, 2016
SECTION I - SUMMARY OF PRINCIPAL RESULTS
1. For convenience of reference, the principal results of the valuation are summarized below. The following table summarizes the June 30, 2016 results for the School Personnel OPEB Fund. For illustrative purposes only, the School Fund as of June 30, 2016 has been split between certificated teachers and non-certificated school employees based on payroll location codes that were provided by DCH.
Valuation Date June 30, 2016 June 30, 2015
Certificated Teachers
Non-certificated School
Employees
School Total School Total
Discount Rate 4.50% 4.50% 4.50% 4.50%
Members Receiving SHBP
Benefits
Actives
Retirees
Spouses of Retirees
Total
107,227
56,957
20,120
184,304
67,748
24,021
8,182
99,951
174,975
80,978
28,302
284,255
168,309
81,658
28,441
278,408
Estimated Total Payroll
$10,086,189,000
Actuarial Accrued Liability $7,888,841,304 $2,670,560,957 $ 10,559,402,261 $ 10,543,010,090
Assets:
Market value $ 95,406,837 $ 30,853,207
Unfunded Actuarial Accrued Liability
$ 10,463,995,424 $ 10,512,156,883
Amortization period (years) 30 30
Fiscal Year 2019 2018
Actuarially Determined Employer Contribution (ADEC)) $
Normal
Accrued Liability
Total
$ 301,214,787
$ 119,025,128
$ 420,239,915 413,050,702
$ 833,290,617
$ 409,920,564 414,951,804
$ 824,872,368
ADEC as % of payroll
Normal
Accrued Liability
Total
4.17%
4.10%
8.27%

Page 28
The following table summarizes the Unfunded Actuarial Accrued Liability and the Actuarially
Determined Employer Contribution for the School Personnel OPEB Fund for June 30, 2016 and
June 30, 2015:
Valuation Date June 30, 2016 June 30, 2015
School Personnel OPEB Fund
Unfunded Actuarial Accrued Liability
Actuarially Determined Employer Contribution ($)
Discount Rate
$ 10,463,995,424
$ 833,290,617
4.50%
$ 10,512,156,883
$ 824,872,368
4.50%
2. The valuation indicates that total contributions of $833,290,617 are sufficient to support current
benefits of the School Personnel OPEB Fund. Comments on the valuation results as of
June 30, 2016 are given in Section IV and further discussion of the contribution levels is set out in
Sections V and VI. If the contributions are not increased to the required levels, the Fund will not be
projected to cover the costs of all future benefits. If contributions are made at the required levels and
the assets are invested in such a way as to earn more than 4.50%, then the discount rates for
valuing liabilities could be increased. The impact of this change, using a discount rate of 6.00% for
illustrative purposes, is shown on Schedule A.
3. Schedule C of this report outlines the full set of actuarial assumptions and methods employed in
the current valuation.
4. Schedule D of this report outlines the summary of plan provisions as interpreted for valuation
purposes.
Page 29
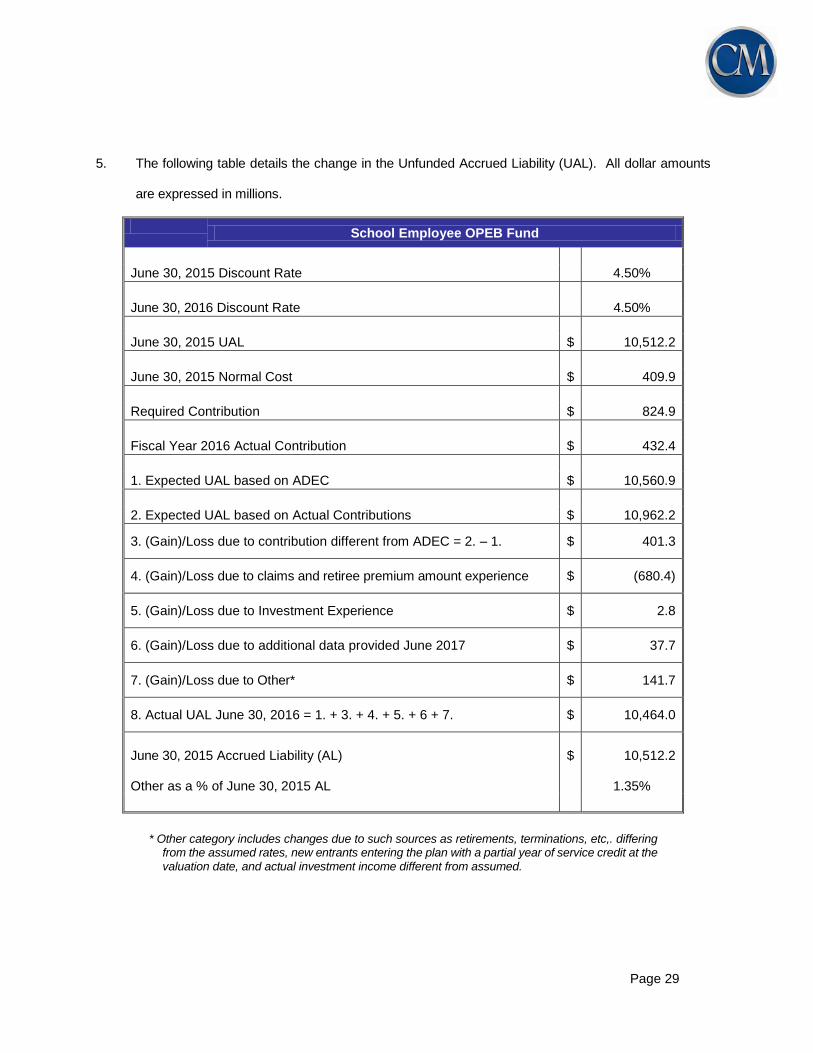
5. The following table details the change in the Unfunded Accrued Liability (UAL). All dollar amounts
are expressed in millions.
School Employee OPEB Fund
June 30, 2015 Discount Rate 4.50%
June 30, 2016 Discount Rate 4.50%
June 30, 2015 UAL $ 10,512.2
June 30, 2015 Normal Cost $ 409.9
Required Contribution $ 824.9
Fiscal Year 2016 Actual Contribution $ 432.4
1. Expected UAL based on ADEC $ 10,560.9
2. Expected UAL based on Actual Contributions $ 10,962.2
3. (Gain)/Loss due to contribution different from ADEC = 2. – 1. $ 401.3
4. (Gain)/Loss due to claims and retiree premium amount experience $ (680.4)
5. (Gain)/Loss due to Investment Experience $ 2.8
6. (Gain)/Loss due to additional data provided June 2017 $ 37.7
7. (Gain)/Loss due to Other* $ 141.7
8. Actual UAL June 30, 2016 = 1. + 3. + 4. + 5. + 6 + 7. $ 10,464.0
June 30, 2015 Accrued Liability (AL) Other as a % of June 30, 2015 AL
$
10,512.2
1.35%
* Other category includes changes due to such sources as retirements, terminations, etc,. differing from the assumed rates, new entrants entering the plan with a partial year of service credit at the valuation date, and actual investment income different from assumed.
Page 30
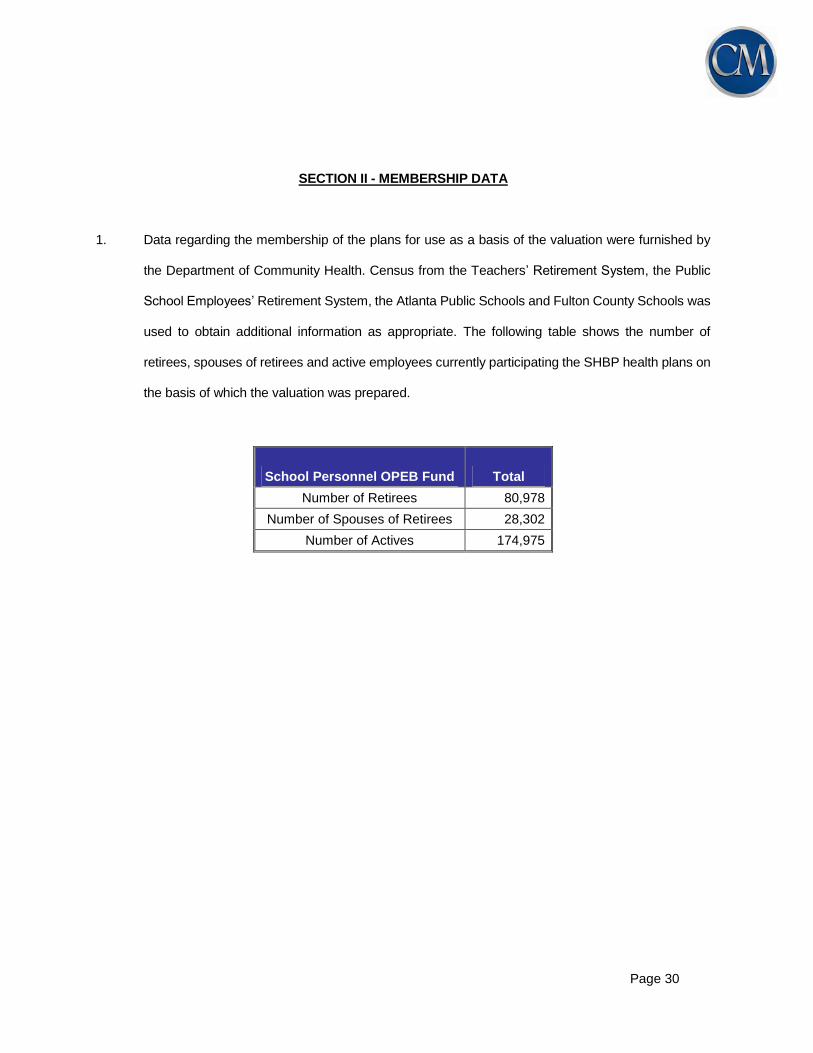
SECTION II - MEMBERSHIP DATA
1. Data regarding the membership of the plans for use as a basis of the valuation were furnished by
the Department of Community Health. Census from the Teachers’ Retirement System, the Public
School Employees’ Retirement System, the Atlanta Public Schools and Fulton County Schools was
used to obtain additional information as appropriate. The following table shows the number of
retirees, spouses of retirees and active employees currently participating the SHBP health plans on
the basis of which the valuation was prepared.
School Personnel OPEB Fund Total
Number of Retirees 80,978
Number of Spouses of Retirees 28,302
Number of Actives 174,975
Page 31
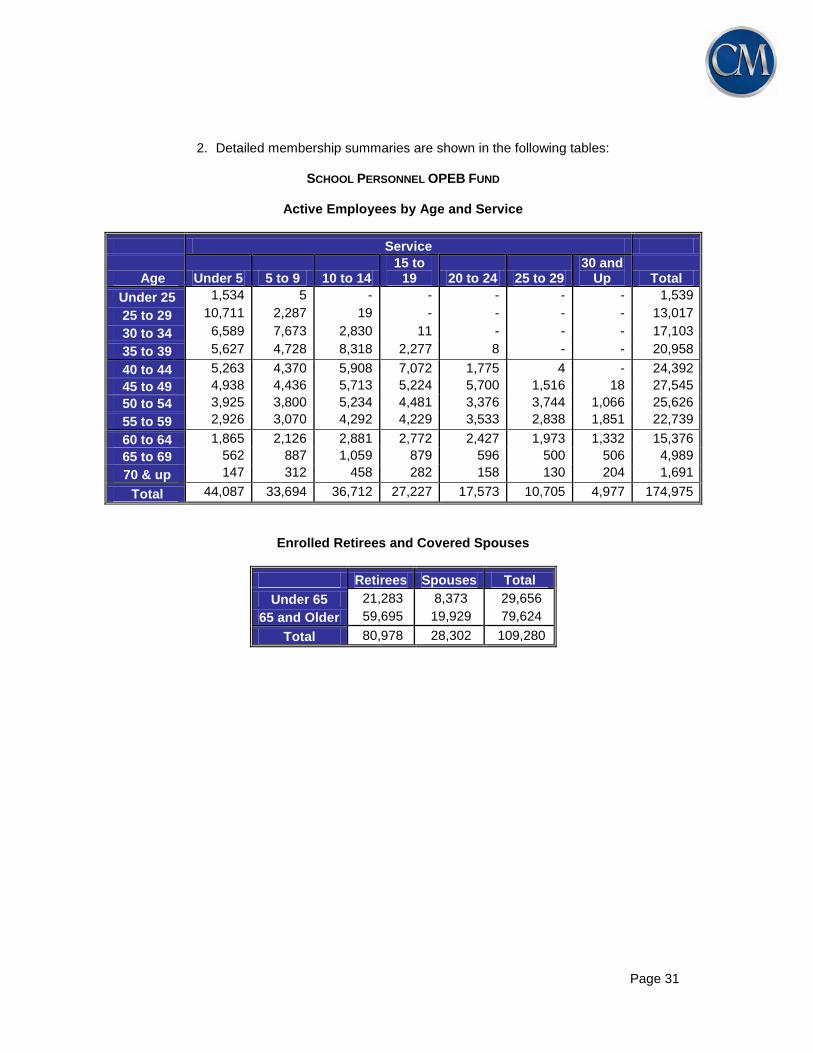
2. Detailed membership summaries are shown in the following tables:
SCHOOL PERSONNEL OPEB FUND
Active Employees by Age and Service
Service
Age Under 5 5 to 9 10 to 14 15 to
19 20 to 24 25 to 29 30 and
Up Total
Under 25 1,534 5 - - - - - 1,539
25 to 29 10,711 2,287 19 - - - - 13,017
30 to 34 6,589 7,673 2,830 11 - - - 17,103
35 to 39 5,627 4,728 8,318 2,277 8 - - 20,958
40 to 44 5,263 4,370 5,908 7,072 1,775 4 - 24,392
45 to 49 4,938 4,436 5,713 5,224 5,700 1,516 18 27,545
50 to 54 3,925 3,800 5,234 4,481 3,376 3,744 1,066 25,626
55 to 59 2,926 3,070 4,292 4,229 3,533 2,838 1,851 22,739
60 to 64 1,865 2,126 2,881 2,772 2,427 1,973 1,332 15,376
65 to 69 562 887 1,059 879 596 500 506 4,989
70 & up 147 312 458 282 158 130 204 1,691
Total 44,087 33,694 36,712 27,227 17,573 10,705 4,977 174,975
Enrolled Retirees and Covered Spouses
Retirees Spouses Total
Under 65 21,283 8,373 29,656
65 and Older 59,695 19,929 79,624
Total 80,978 28,302 109,280

Page 32
CERTIFICATED TEACHERS VALUATION GROUP
Active Employees by Age and Service
Service
Age Under 5 5 to 9 10 to 14 15 to 19 20 to 24 25 to
29 30 and
Up Total
Under 25 1,081 1 1,082
25 to 29 8,346 2,011 4 10,361
30 to 34 4,151 6,737 2,518 4 13,410
35 to 39 2,866 3,499 7,409 2,044 3 15,821
40 to 44 2,297 2,635 4,445 6,335 1,585 1 17,298
45 to 49 1,910 2,193 3,526 3,821 5,093 1,305 5 17,853
50 to 54 1,149 1,360 2,482 2,273 2,277 3,198 874 13,613
55 to 59 625 835 1,711 1,877 1,896 1,876 1,413 10,233
60 to 64 364 405 1,013 1,082 1,162 1,027 760 5,813
65 to 69 84 124 310 305 241 193 229 1,486
70 & up 18 24 47 52 37 35 44 257
Total 22,891 19,824 23,465 17,793 12,294 7,635 3,325 107,227
Enrolled Retirees and Covered Spouses
Retirees Spouses Total
Under 65 16,815 6,768 23,583
65 and Older 40,142 13,352 53,494
Total 56,957 20,120 77,077
Page 33
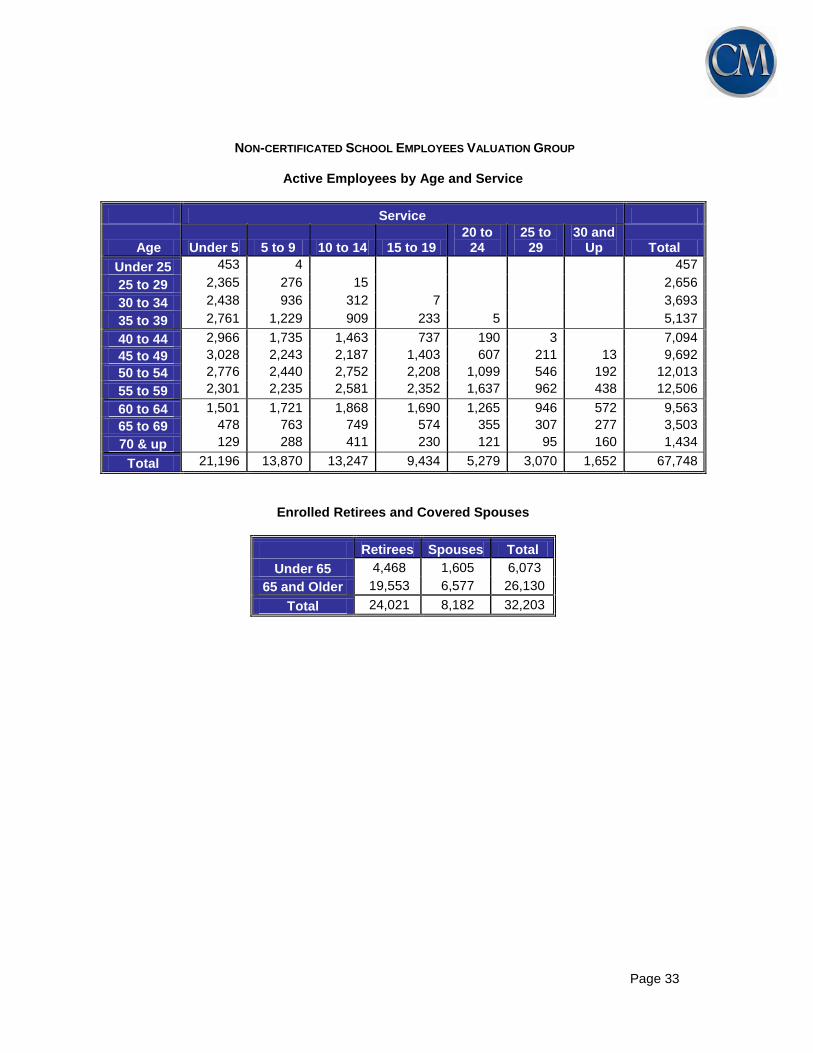
NON-CERTIFICATED SCHOOL EMPLOYEES VALUATION GROUP
Active Employees by Age and Service
Service
Age Under 5 5 to 9 10 to 14 15 to 19 20 to
24 25 to
29 30 and
Up Total
Under 25 453 4 457
25 to 29 2,365 276 15 2,656
30 to 34 2,438 936 312 7 3,693
35 to 39 2,761 1,229 909 233 5 5,137
40 to 44 2,966 1,735 1,463 737 190 3 7,094
45 to 49 3,028 2,243 2,187 1,403 607 211 13 9,692
50 to 54 2,776 2,440 2,752 2,208 1,099 546 192 12,013
55 to 59 2,301 2,235 2,581 2,352 1,637 962 438 12,506
60 to 64 1,501 1,721 1,868 1,690 1,265 946 572 9,563
65 to 69 478 763 749 574 355 307 277 3,503
70 & up 129 288 411 230 121 95 160 1,434
Total 21,196 13,870 13,247 9,434 5,279 3,070 1,652 67,748
Enrolled Retirees and Covered Spouses
Retirees Spouses Total
Under 65 4,468 1,605 6,073
65 and Older 19,553 6,577 26,130
Total 24,021 8,182 32,203

Page 34
SECTION III - ASSETS
Schedule B shows information regarding assets for valuation purposes. As of June 30, 2016, assets held in
trust solely to provide benefits to retirees and their beneficiaries in accordance with the terms of the Fund
equal $95,406,837.
Although the School Employee OPEB Fund intends to begin pre-funding benefits, the current assets have
not yet accumulated to the level needed for significant long term investment. Therefore, the discount rate
used to determine the present value of benefits needs to be reflective of the expected investment return on
cash and other very short-term investments. For the June 30, 2016 valuation, a discount rate of 4.50% has
been used for the School Employee OPEB Fund.

Page 35
SECTION IV - COMMENTS ON VALUATION
1. Schedule A of this report outlines the results of the actuarial valuation. The valuation was prepared
in accordance with the actuarial assumptions and the actuarial cost method, which are described in
Schedule C, and the summary of plan provisions, which are described in Schedule D.
2. The valuation shows that the School Personnel OPEB Fund has an actuarial accrued liability of
$6,311,300,907 for benefits expected to be paid on account of the present active membership,
based on service to the valuation date.
3. The School Personnel OPEB Fund’s liability on account of benefits payable to retirees and covered
spouses amounts to $4,248,101,354.
4. The total School Personnel OPEB Fund actuarial accrued liability amounts to $10,559,402,261.
5. Against these liabilities, the Fund has present assets for valuation purposes in the amount of
$95,406,837. Therefore, the total unfunded actuarial accrued liability for the School Personnel
OPEB Fund is $10,463,995,424.
6. The normal contribution is equal to the actuarial present value of benefits accruing during the current
year. The normal contribution for the School Personnel OPEB Fund is determined to be
$420,239,915.
Page 36
SECTION V - CONTRIBUTIONS PAYABLE UNDER THE PLAN
ACTUARIALLY DETERMINED EMPLOYER CONTRIBUTION
For Fiscal Year Ending June 30, 2019
Actuarially Determined Employer Contribution (ADEC):
$
School Personnel OPEB Fund
Normal $ 420,239,915
Accrued Liability 413,050,702
Total $ 833,290,617
1. The valuation indicates that the normal contribution for the School Personnel OPEB Fund is
determined to be $420,239,915.
2. The unfunded actuarial accrued liability amounts to $10,463,995,424 and is for employees, retirees
and covered spouses that will receive benefits paid from the School Personnel OPEB Fund.
3. An accrued liability contribution for the School Personnel OPEB Fund of $413,050,702 is sufficient
to amortize the unfunded actuarial accrued liability over a 30-year period, based on the assumption
that the contribution will increase by 3.25% annually.
4. The total Actuarially Determined Employer Contribution for the School Personnel OPEB Fund is,
therefore, $833,290,617.
Page 37
SECTION VI - COMMENTS ON LEVEL OF FUNDING
1. The monthly contribution for retirees to opt into the medical plan is based on plan election, Medicare
eligibility and election, and dependent coverage election. Claims, premiums and associated costs
paid by the employer, on behalf of the retiree, as well as contributions placed in trust will be considered
as contributions towards the ADEC. All employer contributions shown in this report are net of retiree
monthly contributions, which are shown in Schedule D as Retiree Premiums.
2. The valuation indicates that an increase in the recommended employer contribution rate for the
School Personnel OPEB Fund from last year’s recommended amount of $824,872,368 to this year’s
recommended amount of $833,290,617 is required to fund the School Personnel OPEB Fund. This
contribution of $833,290,617 is required to meet the cost of benefits currently accruing and provide
for the amortization of the unfunded actuarial accrued liability over a period of 30 years.
4. The increase in the recommended contribution is primarily due to the contribution shortfall. The
increase is offset somewhat by favorable claims and retiree premium experience.
Page 38
SECTION VII - ACCOUNTING INFORMATION
The information required under the Governmental Accounting Standards Board (GASB) Statements No. 74
and 75 will be issued in separate reports. The following information is provided for informational purposes
only.
1. Schedule of Funding Progress and Schedule of Employer Contributions
SCHEDULE OF FUNDING PROGRESS
School Personnel OPEB Fund
Actuarial Accrued Actuarial Liability (AAL) Unfunded
Actuarial Valuation
Value of Assets
Projected Unit Credit
AAL (UAAL)
Funded Ratio
Date ( a ) ( b ) ( b - a ) ( a / b )
6/30/2011 0 11,143,125,071 11,143,125,071 0.0% 6/30/2012 0 10,869,929,923 10,869,929,923 0.0% 6/30/2013 0 10,788,794,736 10,788,794,736 0.0% 6/30/2014 0 8,514,320,187 8,514,320,187 0.0% 6/30/2015 30,853,207 10,543,010,090 10,512,156,883 0.3% 6/30/2016 95,406,837 10,559,402,261 10,463,995,424 0.9%
A data audit was performed and data collection procedures and assumptions were changed beginning with the 6/30/2012 valuation. Assumptions were changed beginning with the 6/30/2015 valuation to reflect the retirement systems’ experience studies.
SCHEDULE OF EMPLOYER CONTRIBUTIONS
School Personnel OPEB Fund
Fiscal Year Ending
Annual Required Contribution
(ARC)
Actual Employer Contribution
Percentage of ARC
Contributed Date ( a ) ( b ) (b) / (a)
6/30/2011 1,050,850,962 339,220,960 32.3% 6/30/2012 1,054,708,002 380,858,538 36.1% 6/30/2013 982,120,099 362,527,218 36.9% 6/30/2014 943,310,062 408,422,277 43.3% 6/30/2015 873,277,873 408,537,847 46.8% 6/30/2016 873,735,876 432,437,545 49.5%

Page 39
2. The information presented in the required supplementary schedules was determined as part of the
actuarial valuation at June 30, 2016. Additional information as of the latest actuarial valuation
follows.
Valuation date 6/30/2016
Actuarial cost method Projected unit credit
Amortization method Level percent of pay, open
Remaining amortization period 30
Asset valuation method Market Value of Assets
Actuarial assumptions:
Investment Rate of Return* 4.50%
Healthcare cost trend rate*
Pre-Medicare Eligible
Medicare Eligible
7.75%
5.75%
Ultimate trend rate
Pre-Medicare Eligible
Medicare Eligible
5.00%
5.00%
Year of Ultimate trend rate 2022
*Includes inflation at 2.75%

Page 40
SCHEDULE A
Benefit of Prefunding Actuarially Determined Employer Contributions and Invested to Earn 6%
SCHOOL PERSONNEL OPEB FUND
($ shown in thousands)
Benefit of Prefunding
Discount Rate Discount Rate
4.50% 6.00%
ACTUARIAL ACCRUED LIABILITY
Present value of prospective benefits payable in respect of:
(a) Present active members $ 6,311,301 $ 4,767,224
(b) Present retired members and covered spouses 4,248,101 3,626,422
(c) Total actuarial accrued liability $ 10,559,402 $ 8,393,646
PRESENT ASSETS FOR VALUATION PURPOSES
$ 95,407
$ 95,407
UNFUNDED ACTUARIAL ACCRUED LIABILITY
$ 10,463,995
$ 8,298,239
CONTRIBUTIONS FOR FISCAL YEAR ENDING
JUNE 30, 2018:
Normal $420,240 $303,193
Accrued Liability $413,051 $394,649
Total $833,291 $697,842
Page 41
SCHEDULE B
PLAN ASSETS
GASB defines plan assets as resources, usually in the form of stocks, bonds, and other classes of
investments, that have been segregated and restricted in a trust, or equivalent arrangement, in which (a)
employer contributions to the plan are irrevocable, (b) assets are dedicated to providing benefits to retirees
and their beneficiaries, and (c) assets are legally protected from creditors of the employers or plan
administrator, for the payment of benefits in accordance with the terms of the plan. Assets in the trust may
be used to pay health benefits to current retirees and their beneficiaries.
As of June 30, 2016, assets held in trust solely to provide benefits to retirees and their beneficiaries in
accordance with the terms of the State Personnel OPEB Fund equal $95,406,837.
Although the School Employee OPEB Fund intends to begin pre-funding benefits, the current assets have not
yet accumulated to the level needed for significant long term investment. Therefore, the discount rate used
to determine the present value of benefits needs to be reflective of the expected investment return on cash
and other very short-term investments. For the June 30, 2016 valuation, a discount rate of 4.50% has been
used for the School Employee OPEB Fund.

Page 42
SCHEDULE C
OUTLINE OF ACTUARIAL ASSUMPTIONS AND METHODS
VALUATION DATE: June 30, 2016 DISCOUNT RATE: 4.50% per annum, compounded annually ANNUAL EXPECTED MEDICAL/RX CLAIMS (AGE ADJUSTED TO AGE 65): PRE-MEDICARE Following is a chart detailing expected claims for pre-65 retirees blended based on assumed plan elections and normalized to age 65.
Pre-Medicare* $ 11,677
*Retirees selecting one of the HRA plans will also receive annual credits to use for eligible medical expenses. For 2016, the credits are $400 for the Gold Plan, $200 for the Silver Plan and $100 for the Bronze plan. For members participating in the BCBSGa or UnitedHealthcare plans, wellness credits up to $480 are available to those completing certain wellness requirements. It is assumed that 50% of eligible plan participants receive the additional wellness credits. MEDICARE ELIGIBLE Effective January 1, 2010, the Medicare Advantage Plans are mandatory for Medicare-eligible retirees to receive the State subsidy. The Medicare Advantage Plan monthly retiree premiums for members with Medicare Parts A and B as of January 1, 2017 are as follows:
Medicare Advantage Plan
Retiree Premium
UHC Standard MA $ 25.38
UHC Premium MA $ 108.22
BCBSGa Standard MA $ 47.51
BCBSGa Premium MA $ 135.24
Following is a chart detailing expected claims costs for Medicare Advantage Plan retirees blended based on assumed plan elections and normalized to age 65. It is assumed that 75% of retirees will choose UHC plans and 25% of retirees will choose BCBSGa plans. It is further assumed that 42% choose a Premium plan and 58% choose a Standard plan.
Medicare Advantage* $ 1,531
*An adjustment is made for current retirees with no Medicare Part A coverage.
Page 43
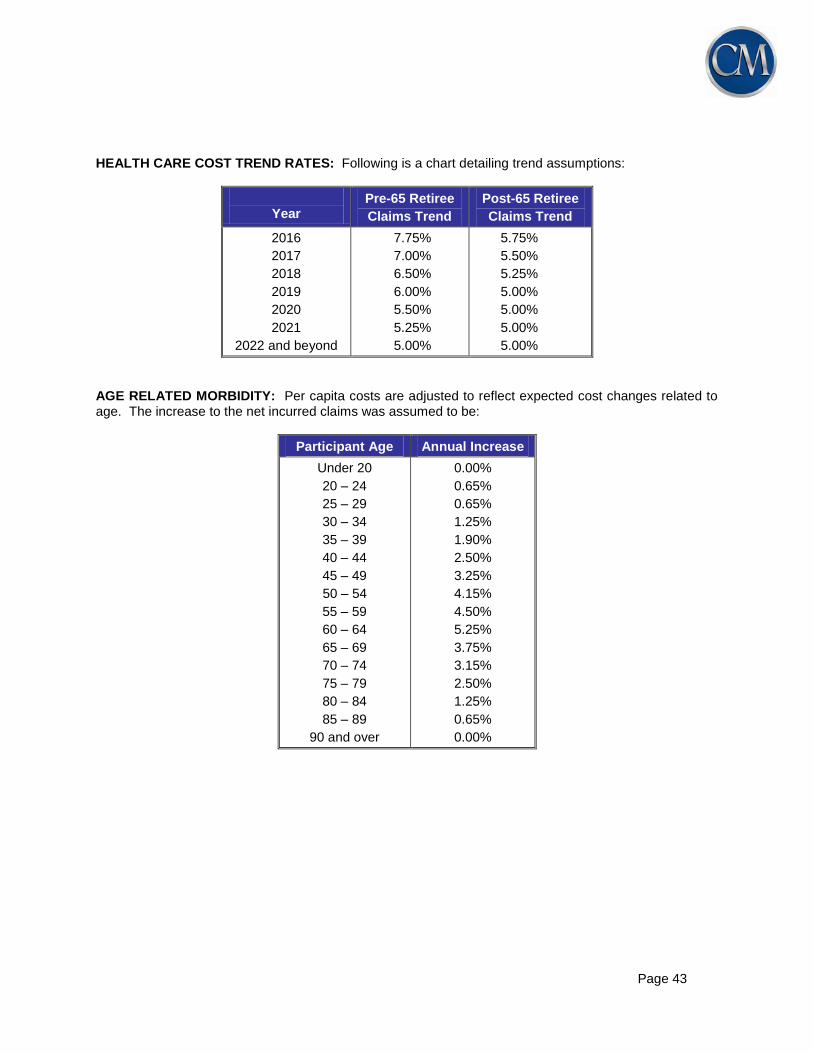
HEALTH CARE COST TREND RATES: Following is a chart detailing trend assumptions:
Year
Pre-65 Retiree
Claims Trend
Post-65 Retiree
Claims Trend
2016
2017
2018
2019
2020
2021
2022 and beyond
7.75%
7.00%
6.50%
6.00%
5.50%
5.25%
5.00%
5.75%
5.50%
5.25%
5.00%
5.00%
5.00%
5.00%
AGE RELATED MORBIDITY: Per capita costs are adjusted to reflect expected cost changes related to age. The increase to the net incurred claims was assumed to be:
Participant Age Annual Increase
Under 20
20 – 24
25 – 29
30 – 34
35 – 39
40 – 44
45 – 49
50 – 54
55 – 59
60 – 64
65 – 69
70 – 74
75 – 79
80 – 84
85 – 89
90 and over
0.00%
0.65%
0.65%
1.25%
1.90%
2.50%
3.25%
4.15%
4.50%
5.25%
3.75%
3.15%
2.50%
1.25%
0.65%
0.00%

Page 44
ANTICIPATED PLAN PARTICIPATION: Representative values of the assumed annual rates of member participation and spouse coverage are as follows:
State
Participation if currently participating in health coverage 100%
Participation if currently waiving health coverage 0%
Spouse Coverage 40%
ACTUARIAL METHOD: Costs were determined using the Projected Unit Credit Actuarial Cost Method. The annual service cost is the present value of the portion of the projected benefit attributable to participation service during the upcoming year, and the actuarial accrued liability (AAL) is equal to the present value of the portion of the projected benefit attributable to service before the valuation date. Service from hire date through the date of full retirement eligibility was used in allocating costs.
ACTUARIAL VALUE OF ASSETS: Market Value
Page 45
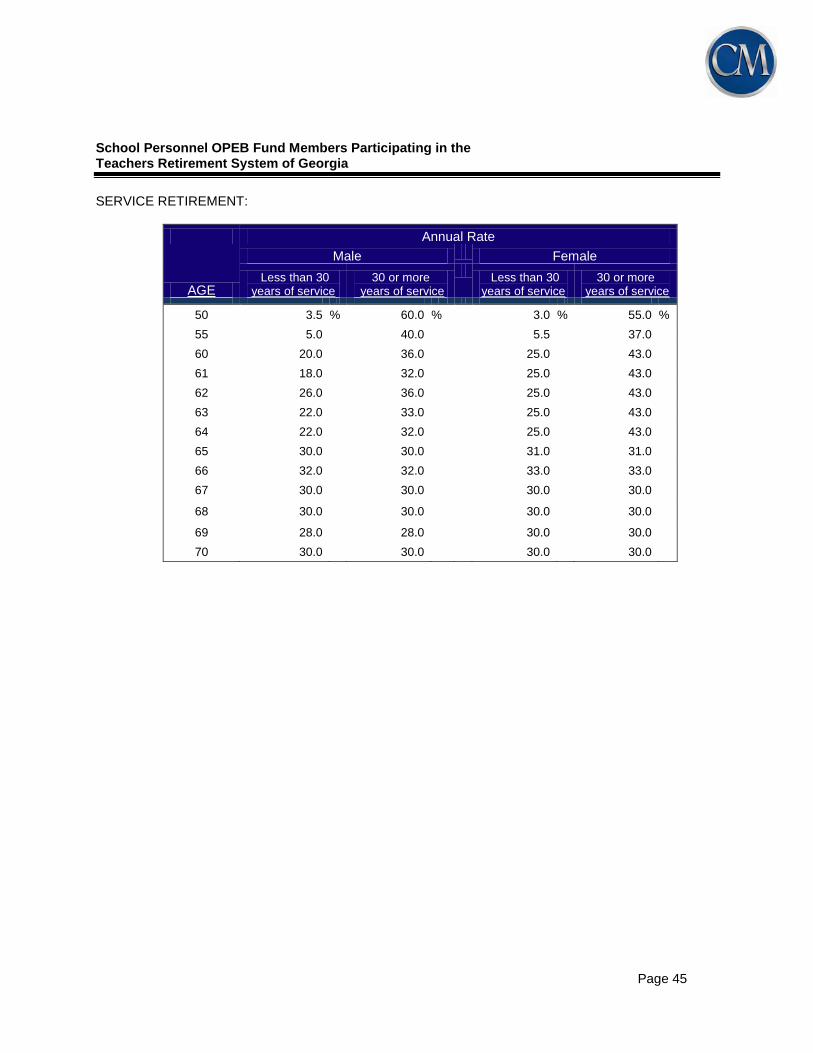
School Personnel OPEB Fund Members Participating in the Teachers Retirement System of Georgia
SERVICE RETIREMENT:
Annual Rate
AGE
Male Female
Less than 30 years of service
30 or more years of service
Less than 30
years of service 30 or more
years of service
50 3.5 % 60.0 % 3.0 % 55.0 %
55 5.0 40.0 5.5 37.0
60 20.0 36.0 25.0 43.0
61 18.0 32.0 25.0 43.0
62 26.0 36.0 25.0 43.0
63 22.0 33.0 25.0 43.0
64 22.0 32.0 25.0 43.0
65 30.0 30.0 31.0 31.0
66 32.0 32.0 33.0 33.0
67 30.0 30.0 30.0 30.0
68 30.0 30.0 30.0 30.0
69 28.0 28.0 30.0 30.0
70 30.0 30.0 30.0 30.0
School Personnel OPEB Fund Members Participating in the Teachers Retirement System of Georgia
Page 46
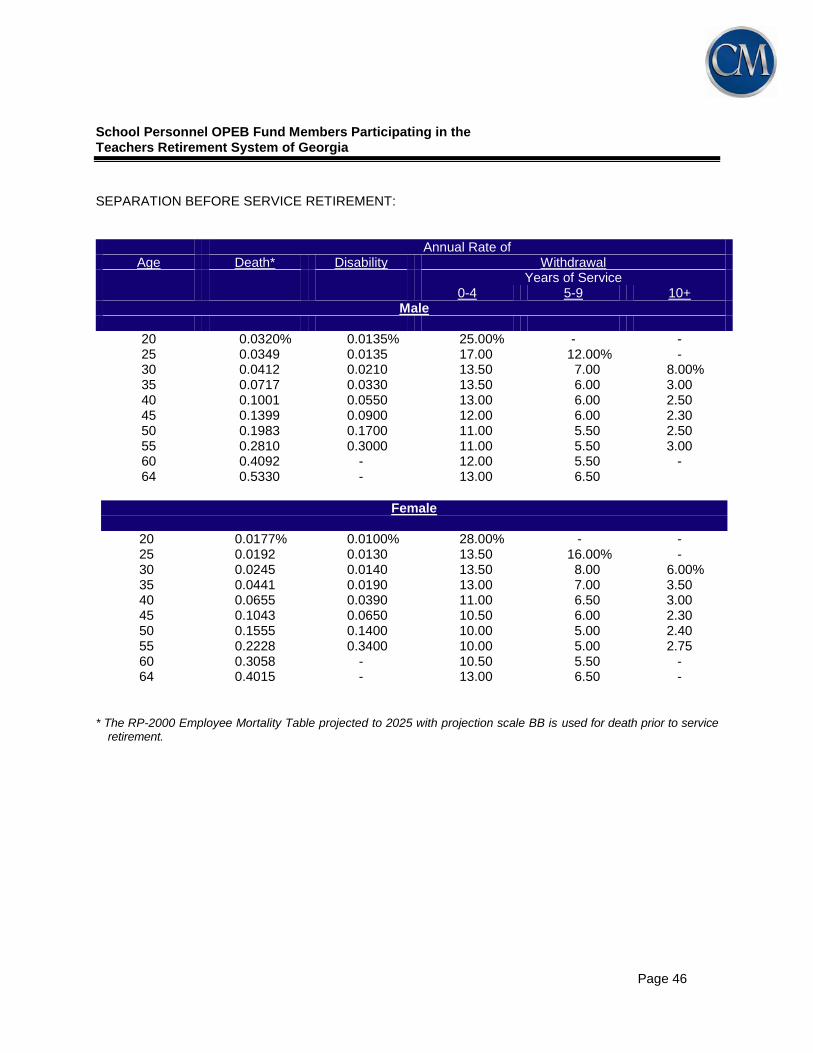
SEPARATION BEFORE SERVICE RETIREMENT:
Annual Rate of
Age Death* Disability Withdrawal Years of Service
0-4 5-9 10+ Male
20 25 30 35 40 45 50 55 60 64
0.0320% 0.0349 0.0412 0.0717 0.1001 0.1399 0.1983 0.2810 0.4092 0.5330
0.0135% 0.0135 0.0210 0.0330 0.0550 0.0900 0.1700 0.3000
- -
25.00% 17.00 13.50 13.50 13.00 12.00 11.00 11.00 12.00 13.00
- 12.00% 7.00 6.00 6.00 6.00 5.50 5.50 5.50 6.50
- -
8.00% 3.00 2.50 2.30 2.50 3.00
-
Female
20 25 30 35 40 45 50 55 60 64
0.0177% 0.0192 0.0245 0.0441 0.0655 0.1043 0.1555 0.2228 0.3058 0.4015
0.0100% 0.0130 0.0140 0.0190 0.0390 0.0650 0.1400 0.3400
- -
28.00% 13.50 13.50 13.00 11.00 10.50 10.00 10.00 10.50 13.00
- 16.00% 8.00 7.00 6.50 6.00 5.00 5.00 5.50 6.50
- -
6.00% 3.50 3.00 2.30 2.40 2.75
- -
* The RP-2000 Employee Mortality Table projected to 2025 with projection scale BB is used for death prior to service
retirement.
School Personnel OPEB Fund Members Participating in the Teachers Retirement System of Georgia
Page 47
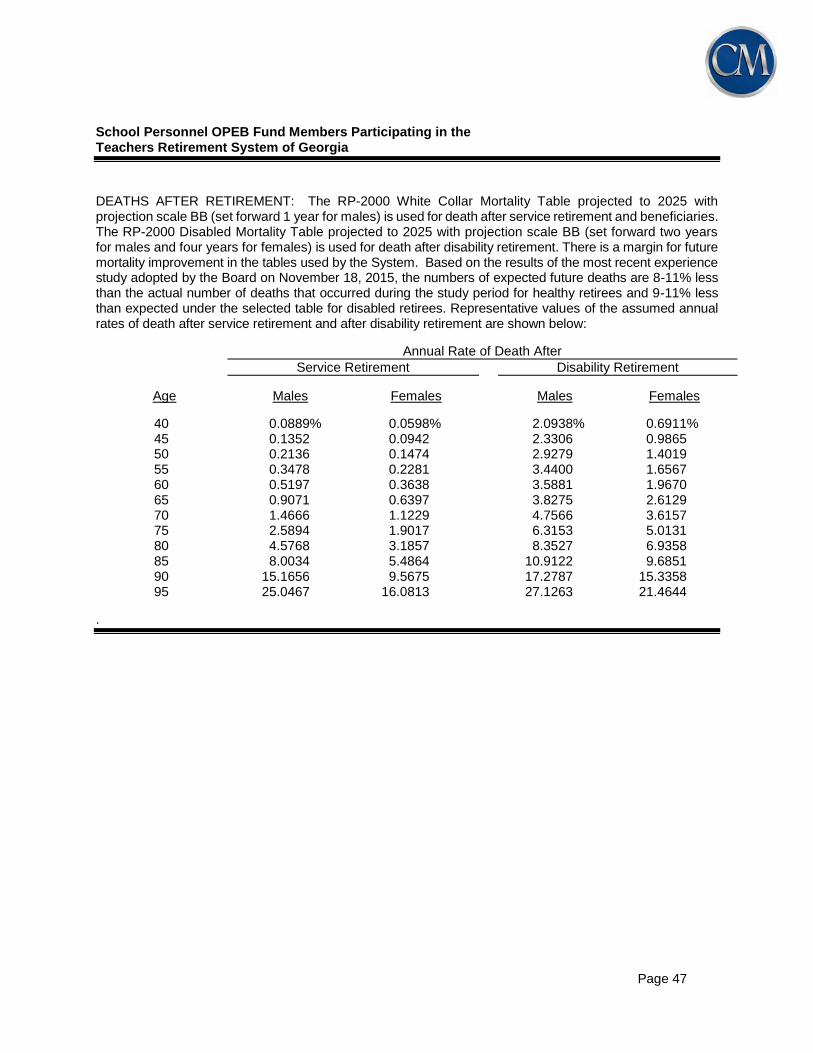
DEATHS AFTER RETIREMENT: The RP-2000 White Collar Mortality Table projected to 2025 with projection scale BB (set forward 1 year for males) is used for death after service retirement and beneficiaries. The RP-2000 Disabled Mortality Table projected to 2025 with projection scale BB (set forward two years for males and four years for females) is used for death after disability retirement. There is a margin for future mortality improvement in the tables used by the System. Based on the results of the most recent experience study adopted by the Board on November 18, 2015, the numbers of expected future deaths are 8-11% less than the actual number of deaths that occurred during the study period for healthy retirees and 9-11% less than expected under the selected table for disabled retirees. Representative values of the assumed annual rates of death after service retirement and after disability retirement are shown below:
Annual Rate of Death After
Service Retirement Disability Retirement
Age Males Females Males Females
40 45 50 55 60 65 70 75 80 85 90 95
0.0889% 0.1352 0.2136 0.3478 0.5197 0.9071 1.4666 2.5894 4.5768 8.0034 15.1656 25.0467
0.0598% 0.0942 0.1474 0.2281 0.3638 0.6397 1.1229 1.9017 3.1857 5.4864 9.5675 16.0813
2.0938% 2.3306 2.9279 3.4400 3.5881 3.8275 4.7566 6.3153 8.3527 10.9122 17.2787 27.1263
0.6911% 0.9865 1.4019 1.6567 1.9670 2.6129 3.6157 5.0131 6.9358 9.6851 15.3358 21.4644
.
School Personnel OPEB Fund Members Participating in the Georgia Public School Employees Retirement System
Page 48
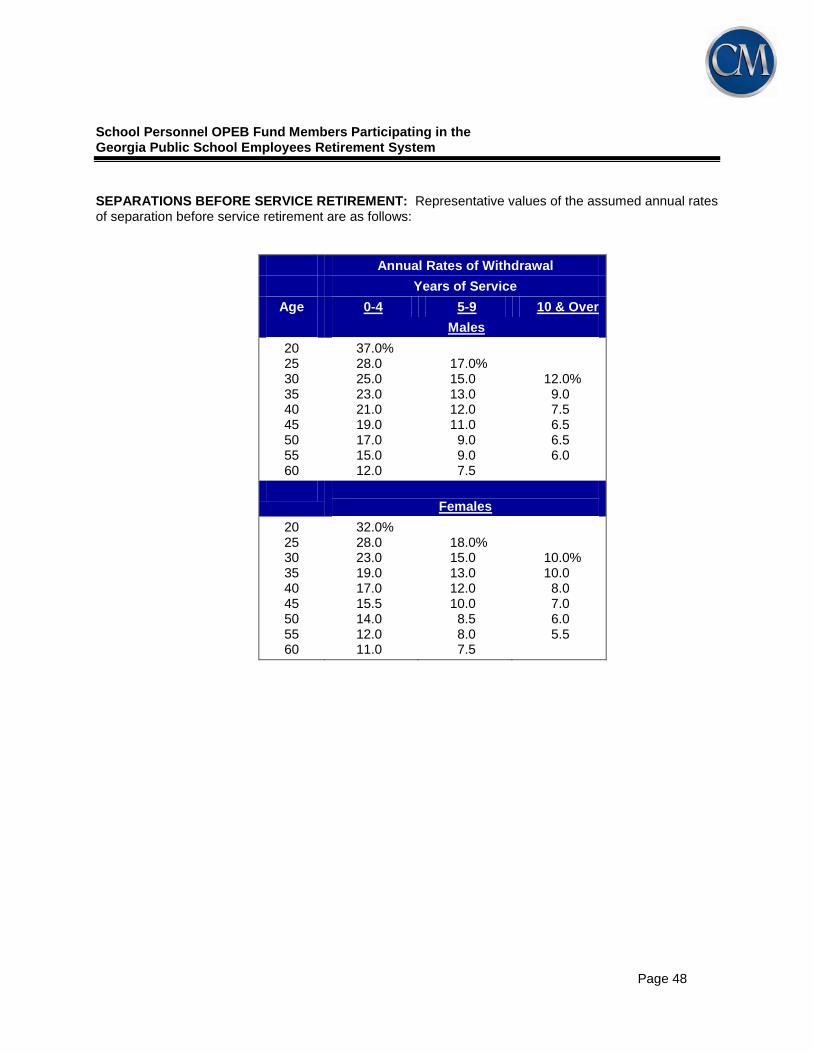
SEPARATIONS BEFORE SERVICE RETIREMENT: Representative values of the assumed annual rates of separation before service retirement are as follows:
Annual Rates of Withdrawal
Years of Service
Age 0-4 5-9 10 & Over
Males
20 25 30 35 40 45 50 55 60
37.0% 28.0 25.0 23.0 21.0 19.0 17.0 15.0 12.0
17.0% 15.0 13.0 12.0 11.0 9.0 9.0 7.5
12.0% 9.0 7.5 6.5 6.5 6.0
Females
20 25 30 35 40 45 50 55 60
32.0% 28.0 23.0 19.0 17.0 15.5 14.0 12.0 11.0
18.0% 15.0 13.0 12.0 10.0 8.5 8.0 7.5
10.0% 10.0 8.0 7.0 6.0 5.5
School Personnel OPEB Fund Members Participating in the Georgia Public School Employees Retirement System
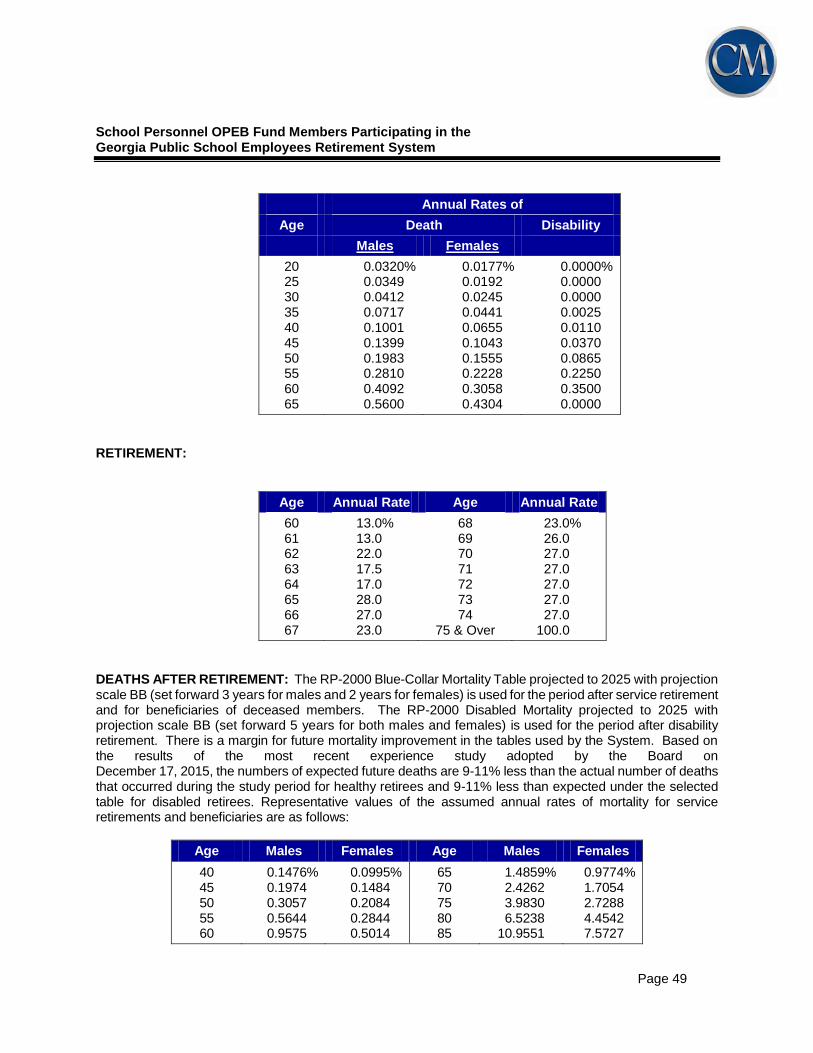
Page 49
Annual Rates of
Age Death Disability
Males Females
20 25 30 35 40 45 50 55 60 65
0.0320% 0.0349 0.0412 0.0717 0.1001 0.1399 0.1983 0.2810 0.4092 0.5600
0.0177% 0.0192 0.0245 0.0441 0.0655 0.1043 0.1555 0.2228 0.3058 0.4304
0.0000% 0.0000 0.0000 0.0025 0.0110 0.0370 0.0865 0.2250 0.3500 0.0000
RETIREMENT:
Age Annual Rate Age Annual Rate
60 61 62 63 64 65 66 67
13.0% 13.0 22.0 17.5 17.0 28.0 27.0 23.0
68 69 70 71 72 73 74
75 & Over
23.0% 26.0 27.0 27.0 27.0 27.0 27.0
100.0
DEATHS AFTER RETIREMENT: The RP-2000 Blue-Collar Mortality Table projected to 2025 with projection scale BB (set forward 3 years for males and 2 years for females) is used for the period after service retirement and for beneficiaries of deceased members. The RP-2000 Disabled Mortality projected to 2025 with projection scale BB (set forward 5 years for both males and females) is used for the period after disability retirement. There is a margin for future mortality improvement in the tables used by the System. Based on the results of the most recent experience study adopted by the Board on December 17, 2015, the numbers of expected future deaths are 9-11% less than the actual number of deaths that occurred during the study period for healthy retirees and 9-11% less than expected under the selected table for disabled retirees. Representative values of the assumed annual rates of mortality for service retirements and beneficiaries are as follows:
Age Males Females Age Males Females
40 45 50 55 60
0.1476% 0.1974 0.3057 0.5644 0.9575
0.0995% 0.1484 0.2084 0.2844 0.5014
65 70 75 80 85
1.4859% 2.4262 3.9830 6.5238
10.9551
0.9774% 1.7054 2.7288 4.4542 7.5727

Page 50
SCHEDULE D
SUMMARY OF MAIN PLAN PROVISIONS AS INTERPRETED FOR VALUATION PURPOSES
School Personnel OPEB Fund Eligibility
Retiree medical eligibility is attained when an employee retires, and is immediately eligible to draw a retirement annuity from any of these systems:
Teachers Retirement System o Service Retirement: 25 years of service or age 60 with 10 years of service o Disability Retirement: 10 years of service o Active Death Surviving Spouse: 10 years of service
Public School Employees Retirement System o Service Retirement: age 60 with 10 years of service o Disability Retirement: 15 years of service o Active Death Surviving Spouse: age 60 with 10 years of service
TRS eligibility requirements were assumed for members in the Other category of the School Fund. Coverage starts immediately at retirement, provided the retiree makes proper premium payments or has the premiums deducted from the annuity check. If elected, dependent coverage starts on the same day as retiree coverage. A change from single to family coverage as a retiree is allowed only with a qualified change in status. A tobacco surcharge of $80 per month is charged to those tobacco users not participating in the Medicare Advantage plans. Of the retirees not participating in the Medicare Advantage plans, it is assumed that 10% pay the tobacco surcharge.
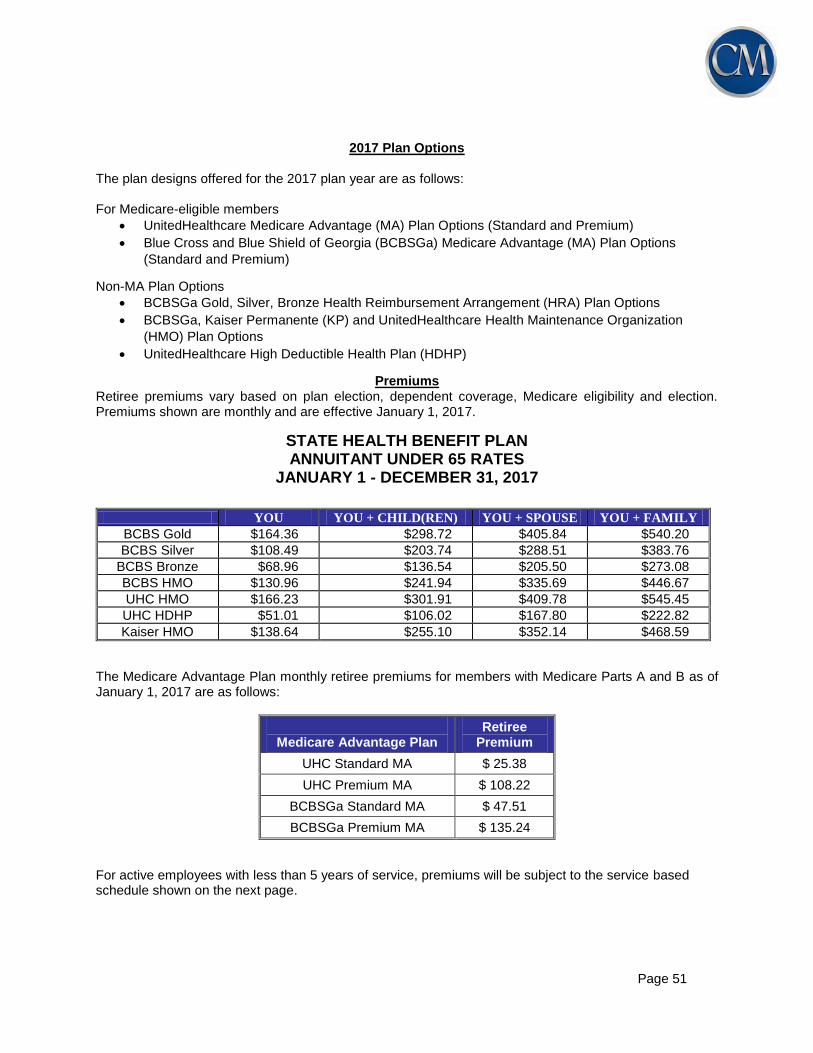
Page 51
2017 Plan Options
The plan designs offered for the 2017 plan year are as follows: For Medicare-eligible members
UnitedHealthcare Medicare Advantage (MA) Plan Options (Standard and Premium)
Blue Cross and Blue Shield of Georgia (BCBSGa) Medicare Advantage (MA) Plan Options
(Standard and Premium)
Non-MA Plan Options
BCBSGa Gold, Silver, Bronze Health Reimbursement Arrangement (HRA) Plan Options
BCBSGa, Kaiser Permanente (KP) and UnitedHealthcare Health Maintenance Organization
(HMO) Plan Options
UnitedHealthcare High Deductible Health Plan (HDHP)
Premiums Retiree premiums vary based on plan election, dependent coverage, Medicare eligibility and election. Premiums shown are monthly and are effective January 1, 2017.
STATE HEALTH BENEFIT PLAN ANNUITANT UNDER 65 RATES
JANUARY 1 - DECEMBER 31, 2017
YOU YOU + CHILD(REN) YOU + SPOUSE YOU + FAMILY
BCBS Gold $164.36 $298.72 $405.84 $540.20
BCBS Silver $108.49 $203.74 $288.51 $383.76
BCBS Bronze $68.96 $136.54 $205.50 $273.08
BCBS HMO $130.96 $241.94 $335.69 $446.67
UHC HMO $166.23 $301.91 $409.78 $545.45
UHC HDHP $51.01 $106.02 $167.80 $222.82
Kaiser HMO $138.64 $255.10 $352.14 $468.59
The Medicare Advantage Plan monthly retiree premiums for members with Medicare Parts A and B as of January 1, 2017 are as follows:
Medicare Advantage Plan
Retiree Premium
UHC Standard MA $ 25.38
UHC Premium MA $ 108.22
BCBSGa Standard MA $ 47.51
BCBSGa Premium MA $ 135.24
For active employees with less than 5 years of service, premiums will be subject to the service based schedule shown on the next page.

Page 52
CONTRIBUTIONS (Actives with less than five years of service as of January 1, 2012): The Health Benefit Fund will pay a portion of the blended contribution rate for the Bronze Plan or the UHC Standard MA Plan based on the retirees’ service at retirement. The retiree or spouse will pay the remainder of the premium for the chosen plan, not less than the premium paid by those with more than five years of service as of January 1, 2012.
Service at Retirement
Health Benefit Fund’s Share of Contribution
Rate
Retiree’s Share of Contribution
Rate
Retiree Spouse Retiree Spouse
30 and above 75% 55% 25% 45%
29 72% 53% 28% 47%
28 69% 51% 31% 49%
27 66% 49% 34% 51%
26 63% 47% 37% 53%
25 60% 45% 40% 55%
24 57% 43% 43% 57%
23 54% 41% 46% 59%
22 51% 39% 49% 61%
21 48% 37% 52% 63%
20 45% 35% 55% 65%
19 42% 33% 58% 67%
18 39% 31% 61% 69%
17 36% 29% 64% 71%
16 33% 27% 67% 73%
15 30% 25% 70% 75%
14 27% 23% 73% 77%
13 24% 21% 76% 79%
12 21% 19% 79% 81%
11 18% 17% 82% 83%
10 15% 15% 85% 85%
9 and below 0% 0% 100% 100%