Embed Size (px)
Citation preview

Winning A er the Storm
R
G P

The Boston Consulting Group (BCG) is a global manage-ment consulting fi rm and the world’s leading advisor on business strategy. We partner with clients in all sectors and regions to identify their highest-value opportunities, address their most critical challenges, and transform their businesses. Our customized approach combines deep in sight into the dynamics of companies and markets with close collaboration at all levels of the client organization. This ensures that our clients achieve sustainable compet-itive advantage, build more capable organizations, and secure lasting results. Founded in 1963, BCG is a private company with 71 offi ces in 41 countries. For more infor-mation, please visit www.bcg.com.

Winning A er the StormG P
bcg.com
Alenka Grealish
Stefan Mohr
Carl Rutstein
Jürgen Schwarz
Niclas Storz
Michael Urban
February 2011

© The Boston Consulting Group, Inc. 2011. All rights reserved.
For information or permission to reprint, please contact BCG at:E-mail: [email protected]: +1 617 850 3901, attention BCG/PermissionsMail: BCG/Permissions The Boston Consulting Group, Inc. One Beacon Street Boston, MA 02108 USA

W A S
Contents
Executive Summary 4
A Time of Transition 7
Retail Payments: Europe 11Structural Differences in European Payments Markets 11Scale Versus Complexity 13SEPA: An Update 14
Retail Payments: The Americas 15Transforming the Credit Card Business 15Beyond the Checking Account: Deepening Client Relationships 17Staying Smart in the Digital Financial-Services Game 19Brazil: From Disruption to Innovation 20
Retail Payments: Asia-Pacific 22
The Global Wholesale Transaction-Banking Market 25Why Transaction Champions Outperform 25Building a Transaction Champion 26
Appendix: An Overview of Volumes, Values, and Revenues in the Payments Marketplace, 2010–2020 30
For Further Reading 37
Note to the Reader 38

T B C G
T he Boston Consulting Group’s tenth compre-hensive study since 1995 of the worldwide payments landscape appears at a time when unprecedented changes are sweeping the pay-ments industry. Amid growing competition and
price pressure, increasing regulatory constraints and scruti-ny, rising macroeconomic volatility, changing demographic patterns, and shi ing customer demands, only those institu-tions that are able to adapt, transform, and optimally link their business and operating models will prosper and seize a greater share of revenues and profi ts over the next decade. The size of the prize is too large not to take action: we estimate that the global payments market will be worth $782 trillion in noncash transaction value and $492 billion in transaction revenues by 2020.
In our last report, Weathering the Storm: Global Payments 2009, we concentrated on the actions that fi nancial institu-tions needed to take to withstand the global fi nancial crisis and emerge from the downturn in a strong position. In this report, we focus on developing optimal business models (tar-get customer segments, product portfolios, regions, and chan-nels) and operating models (target processes, IT, sourcing, and organization) that will drive successful and sustainable growth strategies in payments and transaction banking “a er the storm.”
We defi ne payments revenues as direct and indirect reve-nues generated by a payment service. These include transac-tion-specifi c revenues, card and account maintenance fees, and spread income generated from current accounts—also known as checking or demand-deposit accounts (DDAs). Fees for overdra s and nonsuffi cient funds are considered trans-action-specifi c revenue. (See the Appendix for details.) Given this defi nition, payments make up approximately one-third to one-half of most banks’ revenues. We defi ne transaction
banking as products and services related to payments, such as cash management services for corporate clients.
Despite the fundamental strength of payments-relat-ed businesses, some of these businesses have showed weaknesses in recent years. Global transaction vol-umes and revenues have slumped, and checking-account balances have slipped in certain customer segments. The relatively cyclical credit-card business, traditionally a powerful revenue engine in certain markets, has taken an extraordinary hit—especially in the U.S., where high losses have been linked to ris-ing unemployment.
Payments businesses are generally recovering today ◊ despite widespread macroeconomic uncertainty. But some fi nancial institutions have yet to recoup sizable chunks of income lost through regulatory disruption. Global payments revenues fell at a compound annual rate of 7 percent from year-end 2008 through 2010. But overall volumes and values (up 5 percent and 3 per-cent on a compound annual basis, respectively, over the same period) are back to precrisis levels in most countries.
Payments players wishing to fully capture the resur-◊ gence must scrutinize their business and operating models and determine whether current models are well suited to shi ing industry dynamics. In the proc-ess, they will face the daunting challenge of meeting essential segment, product, and country requirements while minimizing operational complexity.
In Europe, average annual retail-payments values and volumes remained relatively fl at from year-end 2008 through 2010 at roughly $10 trillion and 70 billion
Executive Summary

W A S
transactions, respectively, but with ample variation by market. Retail transaction revenues slipped from $62 billion in 2008 to $60 billion in 2010.
Payments market dynamics vary widely among the ◊ northern, central, and southern regions of Western Europe, as well as among the countries of Central and Eastern Europe (CEE). In order for European pay-ments players to forge clear and far-reaching strate-gies, they must thoroughly understand these structural and regional diff erences.
Given Western Europe’s highly evolved infrastructure, ◊ product mix, and bedrock of well-established business models—as well as signifi cant margin pressure—the next developmental stage in the region’s payments market will be focused on refi ning operating models. By contrast, in the CEE countries, where infrastructure is less sophisticated and payments effi ciency is still rel-atively nascent, forging winning business models will be the key success factor.
The Single Euro Payments Area (SEPA) has been a ◊ work in progress for many years. Today, although acceptance of certain SEPA instruments (such as cred-it transfers) has been steadily increasing, a number of the original objectives of SEPA—let alone a full replacement of fragmented national payments sys-tems—do not seem achievable without further regula-tory intervention.
In the U.S., the payments industry has undergone considerable disruption. From year-end 2008 through 2010, total payments revenues fell at a compound an-nual rate of 4 percent despite steady payments values and a 3 percent annual rise in volumes driven by steady growth in automated clearing-house (ACH) and debit card transactions. Total revenues are ex-pected to grow in 2011 but will remain about 6 per-cent below the 2007 peak level of $162 billion—a lev-el not likely to be surpassed for another few years.
New fi nancial regulations such as the Credit Card ◊ Accountability, Responsibility, and Disclosure (CARD) Act of 2009, the Durbin Amendment (within the Dodd-Frank Wall Street Reform and Consumer Protection Act of 2010), and modifi cations to Regulation E will have a dramatic eff ect on U.S. payments businesses. As much as $25 billion in annual retail-transaction reve-
nues—about 29 percent of total retail-transaction revenues—will be “regulated away” from U.S. fi nan-cial institutions as the new guidelines take eff ect.
As a result, banks and other institutions active in the ◊ payments industry must rethink their business models and develop new value propositions. Three specifi c initiatives are most important: transforming credit card businesses, moving beyond the checking account to deepen client relationships, and staying smart in the digital fi nancial-services game.
In Asia-Pacifi c, payments and transaction banking are primed for growth. Banks will have to tailor their business and operating models in order to balance growth aspirations with effi ciency goals. Key success factors for mature markets in the region will diff er considerably from those for emerging markets.
In the mature Asia-Pacifi c countries, much as in North ◊ American and Western European markets, growth dis-cussions focus on existing customers—more specifi cal-ly, on opportunities to increase share of wallet by improving the convenience of payment solutions for consumers and merchants.
In emerging Asia-Pacifi c markets, by contrast, growth ◊ will be generated by the gradual fi nancial inclusion of unbanked consumers and the rapidly expanding foot-print of the electronic-payments infrastructure. Shi s in spending behavior and payment preferences, espe-cially on the part of the emerging digital generation and those consumers moving from rural to urban areas, will also be a prime factor.
The fi nancial crisis has highlighted the attractiveness of wholesale transaction banking. Although business-es such as deposit and payment services, cash man-agement, and trade services were not unscathed by the downturn, they fared relatively well. Over the full economic cycle, these businesses o en provide reli-able fee and spread revenues, rich deposit volumes, and high profi tability. Return on equity is typically above 40 percent for best-practice institutions.
In the postcrisis era, transaction banking will remain a ◊ significant opportunity for financial institutions. Wholesale payments volume is expected to grow at a compound annual rate of 9 percent globally from year-

T B C G
end 2010 through 2020, and total wholesale payments revenues are expected to increase from $169 billion to $471 billion. Leading global institutions are assigning more importance to transaction banking from an organizational perspective.
Despite the strengths of transaction-banking business-◊ es, there are hurdles to overcome. Getting diff erent silos within the bank—such as the corporate-banking sales force, cash-management and trade-service spe-cialists, and operations and IT groups—to align around making transaction banking a top priority can be a tall order. Some institutions struggle in defi ning their core target markets (from both a segment and a regional perspective) and in smoothing out uneven customer experiences across channels and regions.
Price pressure is becoming more severe as competition ◊ for market share and scale heats up—a dynamic com-plicated by the tightening regulatory climate. Tradi-tional operating models are being tested as wholesale banks face increasing tradeoff s between effi ciency and standardization on the one hand and service excel-lence and customization—both across borders and across segments—on the other.
About the AuthorsAlenka Grealish is a topic specialist in the Chicago offi ce of The Boston Consulting Group. You may contact her by e-mail at [email protected]. Stefan Mohr is a partner and managing director in the firm’s Sydney offi ce. You may contact him by e-mail at [email protected]. Carl Rutstein is a senior partner and managing director in BCG’s Chicago offi ce. You may contact him by e-mail at [email protected]. Jürgen Schwarz is a senior partner and managing director in the fi rm’s Toron-to offi ce and the global leader of BCG’s wholesale-bank-ing practice. You may contact him by e-mail at [email protected]. Niclas Storz is a partner and manag-ing director in the fi rm’s Munich offi ce. You may contact him by e-mail at [email protected]. Michael Urban is a principal in BCG’s Düsseldorf offi ce. You many con-tact him by e-mail at [email protected].

W A S
S ince the global fi nancial crisis fi rst unfolded several years ago, leading banks have increas-ingly recognized the importance of their pay-ments and transaction-banking businesses. In the short term, these businesses serve as a rela-
tively stable source of revenues; in the long term, they provide a solid platform on which to build customer loy-alty and increase share of wallet. In addition, with the ex-ception of credit cards, these businesses typically possess structural advantages that include consistent, predictable volumes and relatively low (non-capital-intensive) risk factors. They also serve as a low-cost source of funding.
In 2009 and 2010, however, some payments-related busi-nesses showed glaring weaknesses. Global transaction volumes and revenues slumped, and balances in demand deposit accounts (DDAs) slipped in certain customer seg-ments. The relatively more cyclical credit-card business—traditionally a powerful revenue engine in certain mar-kets—took an extraordinary hit, especially in the U.S., where high losses were linked to rising unemployment. Also, structural cracks appeared in the underlying eco-nomics of credit cards and DDAs in the U.S. market as new regulations began to whittle away historically strong profi t levers.
In Europe, Single Euro Payments Area (SEPA) legislation has forced banks to rethink their operating models, espe-cially in regard to their IT architecture. Banks are strug-gling with the key issue of whether—from both a func-tionality and a profi tability outlook—one IT platform for payments across Europe would be preferable to using multiple local IT platforms.
In general, payments businesses are recovering today despite widespread macroeconomic uncertainty. Some
fi nancial institutions have yet to recoup sizable chunks of income lost through regulatory disruption. Indeed, global payments revenues fell at a compound annual rate of 7 percent from year-end 2008 through 2010. But overall vol-umes and values (up 5 percent and 3 percent on a com-pound annual basis, respectively, over the same period) are back to precrisis levels in most countries.1
Payments players wishing to fully capture this recent resurgence must scrutinize their business and operating models and determine whether present models are well suited for shi ing industry dynamics. In the process, they will face the daunting challenge of meeting essential seg-ment, product, and country requirements while minimiz-ing operational complexity.
Indeed, striking the optimal balance between standard-ization and customization has become a top priority. Banks must be more intelligent than ever both in design-ing the right business models and in identifying which elements of core operating models can (and cannot) be consolidated and used effi ciently across diff erent mar-kets, customer segments, and products. (See Exhibit 1.)
The question of how payments players strike this balance hinges on another critical dimension of the global land-scape: whether the target market is a mature or transi-tioning one. Broadly speaking, transitioning markets are characterized by a high percentage of unbanked consum-ers, above-average real-income growth, and relatively young and fast-growing populations; mature markets tend to have the opposite characteristics. (See Exhibit 2.)
A Time of Transition
1. In 2010, BCG updated its global payments database to incorpo-rate additional data and adjust its forecast models; data from previ-ous reports may have been revised accordingly.

T B C G
Archetype models are the basis ... ... for an intelligent consolidation
Hom
ogen
eity
of m
arke
ts
Markets andbusiness
model
Operating model
Identical
Multiple operating models
Fullyintegrated
One business modelbut separate
operating models
Standardizationof local processes
Intelligent consolidation with the aim ofcombining the advantages of “both worlds”◊ Achieve scale effects where possible◊ Remain flexible where necessary
Cost reduction
Diverging/complementary
Fully integratedbusiness model
and operating model
Completely separatebusiness model and
operating model
One operating modelacross markets butseparate business
models
Cross-countryconsolidation
Selective localoutsourcing
Source: BCG analysis.
Exhibit 1. Intelligent Combinations of Business and Operating Models Will Be Required Across Markets
Unbanked consumers (%)80
70
60
50
40
30
20
10
0
–100 1 2 3 4 5 6 7 8 9
Average real-income growth (%)
Japan
Italy
United Kingdom
United StatesSpain
France
Central andEastern Europe
Mature markets(median age: 40 years)
Southeast Asia
Middle East
India
Brazil
China
Transition markets(median age: 28 years)
>1 0–0.9 <0Annual population growth (%)
GDP
Sources: Euromonitor International; World Bank, World Development Report 2009; BCG analysis.Note: Growth rates are calculated for 2008 through 2013.
Exhibit 2. Mature and Transitioning Markets Have Fundamental Differences That Affect Payments Businesses

W A S
In addition, transitioning markets are typically poised for developments such as migration from cash to card-based or mobile payments, unbanked-consumer acquisition, payment-method innovation, and the entry of new types of players.
What’s more, mature and transitioning markets usually have diff erent development paths. For example, in ma-ture markets such as the U.S. and Western Europe, barri-ers to entry are high, large players can leverage their advantaged scale positions, product penetration is deep, and margins are thinner. Such markets are typically ripe for operational improvements and cost cutting as well as revenue growth through relationship banking and in-creasing share of wallet.
By contrast, in transitioning markets such as Latin Amer-ica and most of Asia-Pacifi c, the infrastructure is expand-ing and products and target customer segments are still in fl ux. For example, sizable opportunities still exist in e-payments and mobile payments as well as in highly
populous unbanked and underbanked customer seg-ments. As a result, business model design (that is, addressing which products and which segments to tar-get) is o en at the top of the agenda, ahead of operating-model design. Obviously, fi nancial institutions cannot pursue all products and segments in emerging markets because the required infrastructure investments are too high. This constraint is leading to operating models that involve more partnerships than typically exist in mature markets. For example, in transitioning markets, fi nancial institutions are more likely to partner with telecommu-nications companies, whereas in mature markets, telcos are seen as a potential threat. Of course, as we have seen, regulatory disruption can trigger dramatic transforma-tions in either type of market.
Overall, the winning fi nancial institutions will be those that analyze the distinct characteristics and development paths of their diff erent markets (and customer segments) and make wise choices about how to approach them over the long term. (See the sidebar below.) Accordingly, given
There are a number of characteristics that can aff ect the development paths of payments markets in diff erent re-gions.
Macro/socioeconomic Factors:Demographics. ◊ A higher proportion of young people in the regional or national population could lead to faster adop-tion of new payment methods (such as m-payments).
“Unbanked” Population. ◊ A high proportion of consumers with no formal banking relationship will also lead to a rapid uptake of new payment methods (such as prepaid cards) and channels.
GDP Growth. ◊ Rapidly growing economies generate a greater number of new market entrants and faster adoption of new types of payment methods.
Average Real-Income Growth. ◊ Markets with relatively high real-income growth foster increases in average pay-ments values and favorable returns on investments in payments innovation.
Export-Import Balance. ◊ Cross-border trade growth leads to greater opportunities for high-margin payments prod-ucts (but also heightens competition).
Regulatory Outlook. ◊ Rigorous government regulation can have a dramatic impact on payments economics, some-times necessitating strategic transformations. Such regulation is currently having a major eff ect on the U.S. market and a substantial (but lesser) eff ect on the Western European market. These two markets each accounted for about 25 percent of global payments rev-enues in 2010.
Infrastructure. ◊ Active government involvement in build-ing payments infrastructure can have large implica-tions on the pace of market evolution and potential profi t pools. Poor, stagnant infrastructure can lead to faster adoption of next-generation payment vehicles.
Industry Factors:Mix of Payments Instruments. ◊ Greater use of cash and checks can generate high potential to capture new payments fl ows (from the migration away from cash and checks toward card and e-payments), resulting in new market entrants and the likelihood of more inno-vation.
Effi ciency Level. ◊ In ineffi cient markets with a low degree of operational excellence, new market entrants are more likely to excel.
Key Factors in Assessing Payments Markets

T B C G
the diverse nature of current payments markets—and their likely development paths over the next decade—we have structured this report by region. We will fi rst address the challenges and opportunities facing institutions that are active in retail payments in Europe, the Americas, and Asia-Pacifi c, respectively, focusing on issues most
pertinent to each market. We will then look at the global wholesale transaction-banking market. As will become evident, creative and innovative strategies will be needed in order for banks and other payments players to gain and maintain competitive advantage.
W A S
T his section of the report provides an over-view of the European retail-payments mar-ket, examines structural diff erences among subregions (as defi ned in the Appendix), addresses the critical question of balancing
scale and complexity in operating models, and takes a quick look at the ongoing SEPA initiative.
In Europe, average annual retail-payments values and volumes remained relatively fl at from year-end 2008 through 2010 at roughly $10 trillion and 70 billion trans-actions, respectively, but with ample variation by mar-ket. Western European countries showed fairly similar trends in payments values, with the two-year compound annual growth rate (CAGR) in payments values ranging from –3 percent to 1 percent in most countries. In Cen-tral and Eastern Europe (CEE), there was wider variation by country. Russia, with a two-year CAGR of 8 percent in payments values, showed the strongest growth—followed by Poland with a two-year CAGR of 4 percent. In the Baltic countries, however, the two-year CAGR was –11 percent.
Payments revenues from transactions and accounts told a diff erent story, however. Retail payments revenues fell dramatically in Europe, from $173 billion in 2008 to $136 billion in 2010. The dynamics were somewhat simi-lar in both Western Europe and the CEE countries, with two-year CAGRs in revenues of –12 percent in the former and –10 percent in the latter. The majority of the decline occurred in account revenues, with a CAGR in spreads of –17.5 percent from year-end 2008 through 2010.
From year-end 2010 through 2020, we expect wide varia-tion among the payments markets in Western Europe and those of the CEE countries. We estimate that pay-
ments values in Western Europe will rise at a CAGR of about 5 percent, with CAGRs for most countries in the 4 to 5 percent range. Such growth would lead to an an-nual payments value of around $155 trillion by 2020. The CEE region should show a signifi cantly higher CAGR—about 11 percent—which will be somewhat evenly dis-tributed by country. But the driving force of growth will continue to be Russia, with a CAGR of about 12 percent. By 2020, the CEE payments market will reach an estimat-ed annual value of roughly $53 trillion.
On the payments revenue side, we estimate CAGRs of about 7 percent in Western Europe and 9 percent in the CEE region from year-end 2010 through 2020. We also ex-pect the revenue mix to change. Transaction revenues in Europe will likely be fl at at best, owing to competitive pressure on prices, the progress of SEPA, and government restrictions on fl oat income. Although account (interest spread) revenues in Europe have been hurting for the past few years, we expect them to recover once interest rates start rising again—and to post a CAGR of about 10 percent from year-end 2010 through 2020.
Structural Differences in European Payments Markets
In order for European payments players to forge clear and far-reaching strategies, they must understand struc-tural and regional diff erences thoroughly. To aid this eff ort, we have divided the European payments market into four areas: the northern, central, and southern regions of Western Europe, and Central and Eastern Eu-rope. Overall, these regional markets show wide varia-tions that will aff ect banks and other market participants diff erently. (See Exhibit 3.)
Retail Payments: Europe

T B C G
The Northern Region: A Highly Mature Payments Market. The northern region of Western Europe is char-acterized by an affi nity for noncash payments, especially electronic credit transfers and debit cards. This trend is illustrated by the high annual rate of debit card transac-tions per capita—roughly 170, compared with about 40 in the rest of Western Europe—and the fact that value-add services such as drawing money from debit cards in supermarkets are routinely off ered. Given the northern region’s strong payments infrastructure, we do not expect mobile payments or other potential innovations to have a great impact in the coming years.
The Central Region: A Mature Market with Legacy Card Issues. Like the northern region, the central part of Western Europe is also a mature market characterized by the high use of electronic credit transfers—although cash usage is somewhat higher than in the north. The main diff erence is on the card side. In the northern region, the ratio of debit-card to credit-card payment values is about 90 to 10, whereas in the central region it is closer to 75 to 25. Also, the share of debit cards versus credit cards is
more varied among countries in the central region, and direct debits play a more signifi cant role.
In the future, we expect structural changes in this region to be minimal. There may, however, be further move-ment away from credit cards toward debit cards. With interest spreads extremely low in the central region owing to the current low-interest policy of the European Central Bank (ECB), account revenues are at a relatively low level. They should rise again once interest rates pick up, and we expect a CAGR in account revenues of rough-ly 12 percent from year-end 2010 through 2020. Transac-tion revenues, by contrast, will likely fall at a compound annual rate of about 1 percent over this period—and the transaction-revenue share of total revenues could de-crease from 41 percent to 18 percent.
The Southern Region: Still Maturing Amid High Pric-es. The southern region is the least mature market in Western Europe in terms of the use of cash, checks, and paper-based credit transfers. There is also more variation among countries in terms of product mix. That said, the
Northern Central Southern
Central andEastern Europe
10–20
0
20
40
60
80
100
RevenuesVolume RevenuesVolume RevenuesVolume RevenuesVolume
Account revenuesCAGR 2010–2020
Western Europe
Proportion ofconsumer spending
in cash (%)
Infrastructuredevelopment
Retailinstrument
mix (%)
15–30 40–60 50–70
5 5 5 9 3 6 9 10
Debit card Credit card CheckDirect debit Electronic credit transfer Paper-based credit transfer
Source: BCG analysis.
Exhibit 3. In Europe, Regional Payments Markets Show Wide Variation
W A S
infrastructure necessary to bring the market to the level of the central and northern regions is largely in place.
Average revenues per transaction in 2010, at $1.70, were significantly higher than elsewhere in Western Eu-rope—$0.72 in the north and $0.50 in the central region—as well as in the CEE region ($0.83). Direct-debit and electronic credit transfers in the south-ern region yield revenues per transaction that are twice as high as elsewhere in Western Europe. Revenue growth is driven by Italy, which accounts for 60 percent of total payment revenues from the southern region (but only 29 percent of payment volumes).
Overall, southern Europe is still a very high-margin region, and should remain so in the near to medium term. We believe that the Western European payments market will continue to evolve toward a highly effi cient, account-centered, homogeneous state.
CEE: High Growth Potential but Young Infrastructure. The product split in the CEE countries is far more diverse than in the northern and central regions of Western Europe, and the use of cash is even higher than in the southern region. In 2010, the CEE countries averaged about 26 noncash transactions per capita, compared with 191 in Western Europe. This gap will likely narrow some-what to a ratio of about 63 to 212 by 2020. Advanced pay-ments infrastructure is nonexistent in CEE, so innovative products such as mobile payments may end up playing a signifi cant role, and product mixes will be less predictable than in Western Europe. Also, growth potential will be signifi cantly higher.
Scale Versus Complexity
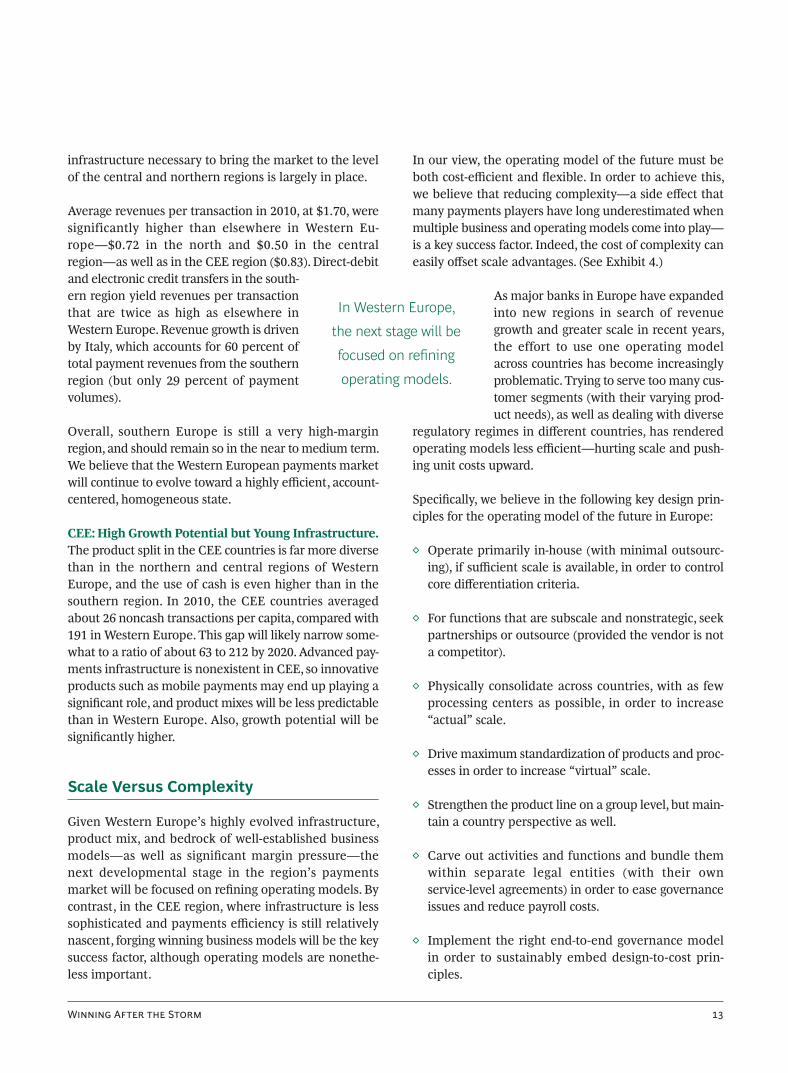
Given Western Europe’s highly evolved infrastructure, product mix, and bedrock of well-established business models—as well as signifi cant margin pressure—the next developmental stage in the region’s payments market will be focused on refi ning operating models. By contrast, in the CEE region, where infrastructure is less sophisticated and payments effi ciency is still relatively nascent, forging winning business models will be the key success factor, although operating models are nonethe-less important.
In our view, the operating model of the future must be both cost-effi cient and fl exible. In order to achieve this, we believe that reducing complexity—a side eff ect that many payments players have long underestimated when multiple business and operating models come into play—is a key success factor. Indeed, the cost of complexity can easily off set scale advantages. (See Exhibit 4.)
As major banks in Europe have expanded into new regions in search of revenue growth and greater scale in recent years, the effort to use one operating model across countries has become increasingly problematic. Trying to serve too many cus-tomer segments (with their varying prod-uct needs), as well as dealing with diverse
regulatory regimes in diff erent countries, has rendered operating models less effi cient—hurting scale and push-ing unit costs upward.
Specifi cally, we believe in the following key design prin-ciples for the operating model of the future in Europe:
Operate primarily in-house (with minimal outsourc-◊ ing), if suffi cient scale is available, in order to control core diff erentiation criteria.
For functions that are subscale and nonstrategic, seek ◊ partnerships or outsource (provided the vendor is not a competitor).
Physically consolidate across countries, with as few ◊ processing centers as possible, in order to increase “actual” scale.
Drive maximum standardization of products and proc-◊ esses in order to increase “virtual” scale.
Strengthen the product line on a group level, but main-◊ tain a country perspective as well.
Carve out activities and functions and bundle them ◊ within separate legal entities (with their own service-level agreements) in order to ease governance issues and reduce payroll costs.
Implement the right end-to-end governance model ◊ in order to sustainably embed design-to-cost prin-ciples.
In Western Europe,
the next stage will be
focused on refining
operating models.

T B C G
SEPA: An Update
The Single Euro Payments Area has been a work in prog-ress for many years. Today, although acceptance of cer-tain SEPA instruments (such as credit transfers) has been steadily increasing, a number of SEPA’s original objec-tives—let alone a full replacement of fragmented nation-al payments systems—do not seem achievable without further regulatory intervention.
The slow pace of SEPA’s progress led the European Com-mission and the ECB to call for the fi rst meeting (held in June 2010) of the recently created SEPA Council. This meeting brought together the demand and supply sides of the European payments market. The main issues dis-cussed were the conditions necessary both for establish-ing SEPA migration deadlines and for planning a SEPA for payment cards.
SEPA credit transfers, following rapid growth over the previous two years, accounted for 8.8 percent of total credit-transfer volume in the euro zone in June 2010. The number of SEPA direct-debit transactions remained insig-nificant, however, with a 0.05 percent share of total direct-debit volume in the euro zone. Clearly, high con-version costs have deterred many fi nancial institutions from committing to total migration to the SEPA scheme.
Overall, it is becoming increasingly clear that SEPA should not be the key principle for banks in designing their end-to-end operating models. The first priority should be country-specifi c customer demands, with SEPA compliance a second priority.
Shi of focus from scale effects ... ... toward the cost of complexity
Number of transactions
Cost per unit
Driven byscale
Driven bycomplexity
Singular focus on scale neglects rising complexity◊ Underestimation of the cost of complexity◊ Overlooked impact of market expansion (such as cross-border issues) and new customer needs
Focus on complexity as a significant cost driver◊ Cost of complexity quickly offsets scale advantages◊ Scrutiny of how customer scope and product/ service customization affect unit cost
Segregating operating models may even reduce cost
Common customer needsand standardized services
Number of transactions
Cost per unit
Driven byscale
Driven bycomplexity
Increasingly heterogeneous needsand customized services
Source: BCG case experience.
Exhibit 4. The Cost of Complexity Can Offset Scale Advantages

W A S
In analyzing the Americas, we will dedicate most of our discussion to the U.S. market. It is the world’s largest, with an annual payments value of $87 trillion in 2010 (representing 26 percent of the global total and 75 percent of the Americas
total). The second-largest market in the region is Brazil, with an annual payments value of $11 trillion in 2010.
The U.S. market has undergone considerable disruption in recent years. From year-end 2008 through 2010, payments revenues fell at a compound annual rate of 4 percent, despite steady payments values and a 3 percent annual rise in volumes driven by growth in automated clearing-house (ACH) and debit card transactions. Total revenues are expected to grow in 2011 but will remain about 6 per-cent below the 2007 peak level of $162 billion—a level they are not likely to surpass for another few years. Retail yields (revenues relative to transaction values) will likely remain below the 2008 level of 54 basis points until 2016.
In the longer term, we expect a general recovery. From year-end 2010 through 2020, payments revenues are ex-pected to post a CAGR of 5 percent—with payments val-ues and volumes posting CAGRs of 4 percent and 6 per-cent, respectively. Moreover, the stability of the U.S. payments industry has been tested not only by the Great Recession but also by signifi cant regulatory develop-ments—which we refer to as the “Great Regulations.” Among these new regulations are the following:
The Credit Card Accountability, Responsibility, and ◊ Disclosure (CARD) Act of 2009, which was aimed at curbing excessive interest-rate hikes and hidden fees.
Regulation E: older legislation that was recently modi-◊ fi ed to require customers to “opt in” for debit point-of-
sale (POS) and ATM overdra protection on their demand-deposit accounts.
The Durbin Amendment (within the Dodd-Frank Wall ◊ Street Reform and Consumer Protection Act of 2010), which authorizes the U.S. Federal Reserve to set limits on debit-card interchange rates and eliminate network exclusivity. This act also creates an independent Bureau of Consumer Financial Protection, whose wide mandate can directly aff ect how payments products are created, priced, and managed.
According to our estimates, as much as $25 billion in annual retail-transaction revenues—about 29 percent of total retail-transaction revenues—will be “regulated away” from U.S. fi nancial institutions as the new guide-lines take eff ect. As a result, banks and other institutions active in the payments industry must rethink their busi-ness models and develop new value propositions. In our view, three specifi c initiatives are most important: trans-forming credit card businesses, moving beyond the check-ing account to deepen client relationships, and staying smart in the digital fi nancial-services game.
Transforming the Credit Card Business
The credit card business continues to be plagued by above-average charge-off s, the eff ects of the CARD Act, and shi s in consumer behavior. Income before loss pro-visions was down by an estimated 18 percent in 2010.
Unfortunately, better days do not seem to be near. Al-though the level of charge-off s is declining slowly, persis-tently high unemployment—which is not expected to fall from its current levels until 2013 at the earliest—will
Retail Payments: The Americas

T B C G
hinder rapid improvement. In addition, the impact of the CARD Act is expected to be long lasting, which will inten-sify competition for a shrinking group of attractive cus-tomers. Lower-value customers will face limited access to credit.
What’s more, the Durbin Amendment establishes a regula-tory precedent and the threat of a material reduction in credit-card interchange reve-nues as well—which would further erode profi ts and trigger signifi cant industry re-structuring. The likely consequences could include reduced investment in product innovation, lower rewards values on card purchases, higher annual fees, and the in-ability to serve certain customer segments.
Compounding these structural developments is a U.S. consumer trend toward lower debt accumulation. This trend is adding momentum to the shi from credit cards (with revolving credit lines) to debit cards. Also, we expect to see the rise of newer products such as prepaid cards, delayed-debit cards, and charge cards. Meanwhile, the migration from paper to electronic payment vehicles will continue. As a result of these and other factors, cred-it card profi tability is unlikely to return to its precrisis lev-els over the next several years.
Indeed, in our view, the credit card industry has arrived at an infl ection point that will require banks to rigorously rethink their business and operating models. In order to overcome signifi cant near-term tactical challenges and develop long-term sustainable strategies, card issuers need to excel in the following areas: product bundling and pricing, product innovation, channel management, risk management, analytics, and cost management.
Product Bundling and Pricing. Retail banks have a wealth of insight into the transaction behavior and pref-erences of their checking-account customers that can be leveraged to develop attractive product combinations. Institutions with large retail-customer bases have the potential to become leaders in the new environment if they can successfully use this knowledge to develop prod-uct bundles that include fl exible pricing and payment op-tions.
Bundling will be particularly important given the signifi -cant decline in overdra and interchange fees. Many cus-
tomers will be profi table only if they have active credit and debit cards (which will o en carry annual fees to help off set lower interchange), a checking account (pos-sibly with a monthly fee), and perhaps loan products as well. To succeed at bundling, however, banks must devel-op eff ective internal incentives, as well as revenue- and cost-sharing policies across business units and product
silos. The most successful bundling eff orts will merge product functionality with new value propositions.
One particular credit-card product—the cobranded reward card—will undergo ma-jor attrition over the next decade. Amid eroding profit margins, only large pro-grams such as those linked to major air-
lines and hotel chains will likely survive. Moreover, in the new era of a stronger focus on customer relationships, some issuers will want to build their own brands. Their objective will not be to save on reward costs, which will remain the same as with cobranding deals (75 to 100 ba-sis points), but to more tightly link the card off ering to other products in order to gain a higher share of wallet.
Product Innovation. Innovation will help lead to new pricing structures. It will also lead to bundles that include both deposit and credit off erings, as well as creative com-binations of revolving and nonrevolving credit products. Innovation will extend to information delivery as well. Banks will send alerts to customers on their mobile phones to notify them of low account balances, funds transfer options, and retail purchase opportunities (based on the customer’s known preferences and geographic lo-cation) in real time. Whatever the innovation, banks should focus primarily on easing “pain points” in their customers’ daily lives.
Channel Management. Better channel management will be increasingly important to support product innova-tion, new customer-acquisition strategies, and low-cost operations. As the direct-mail universe shrinks, card issu-ers need to develop eff ective e-mail, Internet, and branch-acquisition approaches—including multichannel promo-tions (such as a credit card invitation that, if fulfi lled online, off ers larger sign-up rewards). Banks will also need to ensure a superior customer experience across all channels, and effi ciently serve low-value, single-product accounts through low-cost channels. Regardless of the channel, however, the highest-value customers should
Banks will need to
ensure a superior
customer experience
across all channels.

W A S
receive the highest-priority service, much as business-class airline travelers wait in shorter queues and have access to superior departure lounges.
Risk Management. Given the regulatory impact on cred-it card economics, it is essential for issuers to improve their risk-management skills. First, they must identify the right pricing structure and credit-line size at the outset of the customer relationship. As issuers use additional vari-ables that are based on the analysis of DDA fl ows, risk management capabilities are expected to improve.
Analytics. Banks also need to li their performance in customer analytics, particularly when it comes to un-derstanding the drivers of product selection and usage. The Internet will be an increasingly important platform for segmentation, rapid product testing, and multichan-nel management. We also expect advanced analytics (coupled with new channel technology) to support highly targeted, merchant-funded rewards. Such rewards will be geared toward increasing spending on a given issuer’s card (as opposed to other cards or using other payment vehicles).
Cost Management. Given fundamental changes in revenue drivers, issuers will have to lower their costs in order to improve their return on assets. Operating models will have to be reexamined and restructured. Many banks will discover that they need to right-size through some degree of outsourcing, off shoring, and forging new partnerships.
Ultimately, over the next decade, issuers will diff erentiate themselves by their performance on the above initiatives. The winners will be those that move beyond the product-silo and mass-market approach toward building profi t-able, multiproduct relationships. Some institutions are already merging their credit-card business with their deposit and debit-card businesses, gaining an advantage over slower-moving rivals.
Beyond the Checking Account: Deepening Client Relationships
Similar to the credit card business, the checking-account domain is also undergoing a major upheaval in the U.S. In recent years, fee revenues for overdra s and nonsuffi -cient funds have topped $35 billion annually, enabling
U.S. banks to off er free checking and to subsidize a major-ity of customers—those who did not generate apprecia-ble fees or high spread income. Growing debit inter-change revenues (which totaled $16 billion in 2009) also supported these subsidies.
But Regulation E modifi cations and the Durbin Amend-ment will permanently alter DDA economics. (See Exhib-it 5.) As much as $10 billion of annual industry revenues will be lost owing to Regulation E. This translates to roughly 23 percent of all DDA net revenue or 38 percent of DDA pretax profi ts. Moreover, up to $9 billion of debit interchange revenues could be lost as a result of the Durbin Amendment. Generally speaking, these dynamics will signal the end of free checking and lead to greater emphasis on using other means (such as credit products) to expand share of wallet.
Banks will react by rethinking parts of their overall busi-ness models. Indeed, many leading institutions are steadi-ly shi ing from a product-centric model to a relationship-based model by focusing on segment needs and by developing product bundles that cut across silos.
In order to rebuild revenue streams, banks will need to undertake both tactical and strategic initiatives. We are likely to see more-sophisticated product bundling, true relationship-based pricing, next-generation data analytics and segmentation, a greater focus on targeting profi table segments, and a drive to better understand fully allocat-ed and marginal costs by segment. Competition for high-income, high-balance customers will intensify, with banks off ering generous incentives for customers to consolidate their banking relationships. At the other end of the spec-trum, single-product, low-balance customers will see less-favorable pricing and reduced service levels. Such cus-tomers may eventually lose their access to traditional accounts.
Clearly, if fi xed costs are fully allocated, a relatively high percentage of customers will be classifi ed as unprofi table, causing banks to rationalize them through pricing or ser-vice restrictions (such as Internet-only accounts). More specifi cally, most banks are reinstituting monthly mainte-nance fees, even at the risk of some customer attrition, in order to improve profi tability.
However, banks will have to be watchful to avoid losing customers who are incrementally profi table—those who

T B C G
would become attractive if, for example, they added an-other product or increased their card-transaction volume. To be sure, competition for these “near profi table” cus-tomers will intensify as low-cost providers (possessing dif-ferent cost structures) take advantage of pricing disrup-tions and customer churn to capture share.
Generally speaking, diff erent approaches for diff erent customer segments will be critical. For mass-market customers (average DDA balances of $500 to $3,000), tru-ly free checking is essentially dead—although qualifi ed free checking will still encourage profi table relationship building. Simply put, banks will move to a new revenue model that includes “free” checking provided other revenue-generating or cost-to-serve qualifi cations are met. Potential requirements will include minimum DDA balances combined with online bill payment or an active credit card (or other potential product combina-tions).
Beyond qualifi ed free checking, many banks will try to develop products and services that help shi the relation-ship dynamic toward more of a partnership than a “who’s
getting the best of the deal” construct. Overall trust can be improved, for example, by helping customers achieve prudent fi nancial planning. Creating this new spirit, along with a broader value proposition, will require working across product silos—not an easy task, but one that is attainable if a bank grasps the following key success factors:
Understand total-household profitability, not just ◊ account profi tability.
Leverage all internal (transaction-level) and external ◊ (credit bureau) customer data.
Stay in frequent touch with customers and develop a ◊ thorough understanding of their fi nancial needs.
Ensure early and active internal cross-silo engagement.◊
Innovate and try new approaches (even if they may ◊ have short-term negative aspects).
Monitor competitor moves.◊
PreregulationDDA economics
0
200
400
600
800
1,000Annual revenues ($)
Customer DDA balances(deciles)
CostSpreadOther fees
DebitOD/NSF1
Scenario:
Modifications toRegulation E cutOD/NSF revenuesby 35 to 40 percent1
Durbin Amendmentreduces debitinterchange by50 percent2
0
200
400
600
800
1,000Annual revenues ($)
Hypothetical postregulationDDA economics
1 2 3 4 5 6 7 8 9 10Customer DDA balances
(deciles)
1 2 3 4 5 6 7 8 9 10
Significant set ofcustomers with very
low or no profitability
Source: BCG case experience (sanitized); FDIC.1OD/NSF = overdraft/nonsufficient funds; assumes debit/ATM OD is ~70 percent of total OD and a ~55 percent reduction in OD items.2After banks have undertaken mitigating actions such as monthly or annual fees (estimated).
Exhibit 5. Regulation E Modifications and the Durbin Amendment Will Permanently Alter DDA Economics

W A S
Closely coordinate internal and external communica-◊ tions.
Ensure senior leadership commitment.◊
For low-balance customers, banks can provide alternative products that generate sustainable profi ts. Potential pro-grams include the following:
Low-Line Credit Card. ◊ Credit card competition in the subprime space has understandably declined. None-theless, some providers will profi tably serve this seg-ment by enhancing their pricing capabilities, risk ana-lytics, and ability to determine optimal credit lines. Banks that provide DDAs to the subprime segment have income and transaction data to incorporate into the analytics but may prefer to focus their resources on prime customers.
Delayed-Debit or Charge Card. ◊ Another means of improving the profi t of DDA customers is to off er a delayed-debit card or charge card that is paid off (either automatically or by the customer) on a bi-monthly or monthly basis (as is commonly off ered in Europe). Such cards emphasize the control aspect of debit cards but can provide the issuer with interchange rates that are higher than those on debit cards. The in-terchange gap, if not eventually regulated away, is suf-fi ciently large to warrant product innovation and to off er DDA customers incentives to use this type of vehicle. Furthermore, there are tools that provide con-trol features on traditional credit cards through which customers can choose which charges must be paid out of their DDA immediately following the transaction (such as all charges under $25).
Prepaid Card. ◊ With this type of card, fees would be a function of average balances and transaction volume (to maximize spread and interchange revenue) and could include an option to migrate to a limited DDA (such as an Internet-only account with only a debit capability and no checks). Such a card, combined with online bill payment, could provide a transaction-like account without the branch costs while earning higher than debit-card interchange revenues.
No-Frills Account.◊ This is a no-minimum-balance, online-only account with multiple aspects (such as prepaid or debit cards as well as a savings-account
option). The off ering could include fi nancial-manage-ment tools available online or by mobile phone in addition to online rewards (such as iTunes) aimed at a younger customer segment.
For high-balance customers, banks need to be creative in promoting cross-selling and increasing product stickiness. Online bill payment, for example, has been highly success-ful for many institutions in achieving both aims. Other possibilities include relationship rewards that provide in-centives for customer use, selective fee waivers (based on total balances), and reward points or cash-back programs.
In addition, accounts with bundled, nontraditional ser-vices (such as ID the protection, roadside assistance, travel insurance, and special call-center support) can be off ered with fees waived in return for a greater share of the customer’s wallet. Credit products (such as auto loans, mortgages, and home equity loans) can be incorporated into the bundle. Banks can also leverage their ability to analyze customers’ transaction fl ows in order to refi ne interest-rate levels on the basis of better credit-risk in-sight. Successful banks will continue to innovate with re-gard to how various products interact so that the custom-er will benefi t from both a price and a functionality standpoint.
Staying Smart in the Digital Financial-Services Game
As banks and other payments institutions react to the challenges caused by the new regulatory environment, they must also look ahead to the next wave of digital innovation. The online channel is already the preferred U.S. banking channel (based on the number of transac-tions), and people are using a growing number of fea-tures. Moreover, mobile banking should come increasing-ly to the fore, playing a vital role in building transaction volumes, lowering cost-to-serve, and opening new oppor-tunities to win market share.
Mobile banking is not merely about transferring online banking to a small, smartphone screen. It is about linking banking services with everything that mobile-phone ap-plications and location-based technology have to off er. Possibilities for customers include receiving real-time text alerts about bills that are due, being able to snap a pic-ture of a check for remote deposit, and receiving direc-

T B C G
tions to fi nd a bank branch or a merchant that off ers re-wards on their cards. If banks can provide both customers and merchants with the right incentives and functional-ity—and market mobile capabilities clearly and eff ective-ly—mobile payments will fl ow strongly into the payments mainstream in the U.S. over the next decade.
Banks in the U.S. must therefore invest prudently to stay in touch with digital advancements and consumer habits, developing products that will meet their customers’ evolving needs. Part of this process will involve simply being where the customers are—such as on Facebook and Twitter. Banks that do not keep pace with the grow-ing presence of digital products in everyday life risk los-ing the customer relationship to nonbanks that have already established digital beachheads.
While it may be diffi cult to imagine people having their monthly paychecks deposited directly to Apple, it is easy to see iTunes intermediating between customers and their fi nancial institutions for many online transactions. Like PayPal, both iTunes and Amazon simplify the pur-chase process and provide value-adds such as reviews of consumer goods. And as PayPal has proved by its strong growth both on and off eBay, “simple” is good business. Both Mint.com and Intuit, which acquired Mint, know this as well.
Although it is clear that banks and payment networks must make progress in the world of mobile payments, navigating a smart path and prudently pursuing initia-tives that have the greatest chance of success is a tall order. And because capturing value may be elusive in the early stages, a “relationship banking” approach will again prove critical to profi tability.
Banks can most eff ectively motivate merchant accep-tance and consumer use of mobile payments through pricing and reward incentives. Banks are in a stronger po-sition than mobile-telecommunications carriers, which cannot provide FDIC insurance and are unlikely to ex-tend credit or be holders of large deposit balances. Also, while mobile carriers may own the SIM card, they do not own the merchant or customer relationship. But they do know where their customers are all day long—extremely valuable information if they use it intelligently.
In particular, banks should monitor opportunities in the e-wallet space and leverage their ability to link products,
act as an aggregator, and provide a general-purpose pay-ment service—for example, a virtual wallet coupled with a reward card. Ultimately, the prize will be not only a greater share of the steadily growing e-payment transac-tion volume—as consumers migrate away from using cash and checks—but also an opportunity to infl uence the migration itself.
In this area, more than most, how one lives inside the payments ecosystem will be critical for success. As banks build out their own applications, other entities are mov-ing aggressively into the mobile space. Players include both the payment networks (Visa, MasterCard, Discover, and American Express) and the carrier networks (AT&T, Verizon, T-Mobile, and Sprint) along with handset manu-facturers and operating systems (such as Google’s Droid). Knowing where your strengths lie in the value chain, as well as how to successfully partner and extract value, will be the key.
Brazil: From Disruption to Innovation
Brazil is by far the largest payments market in Latin America. In 2010, total noncash payments in Brazil were valued at $11 trillion, representing 52 percent of total payments value in the region. Payments revenues were $43 billion, of which $19 billion came from transaction revenues.
A central theme in Brazil today is the transformation of the card market, a shi that is having a signifi cant eff ect on the country’s overall fi nancial-services industry. And the stakes are high. Unlike mature markets, in which the battle for credit and debit card share is waged in terms of basis points, the fi ght in Brazil is for percentage points—gains that will lead to a solid platform for growth.
The market has recently undergone considerable disrup-tion, most of it centered on the acquiring and network businesses—with collateral impact on the issuing busi-ness. Merchant acquiring has long been a very profi table and fast-growing activity in Brazil, with EBITDA of 60 to 70 percent of revenue and annual growth of 25 percent. In July 2010, however, regulatory pressure opened up the acquiring market, eliminating a structure in which each acquirer was affi liated with a single card network. This development is likely to put pressure on merchant dis-count rates (MDRs) as well as on point-of-sale terminal
W A S
rental margins (which currently account for roughly 20 percent of acquirer revenues). It has already brought in new players, and we expect others to enter the market over the next few years.
One example is the joint venture between Banco San-tander Brasil and GetNet (a Brazilian IT products and services provider specializing in electronic payment transactions), which is competing in the acquiring business. Meanwhile, San-tander Brasil is off ering discounts on POS terminals and account service fees, incen-tives to open new accounts, higher work-ing-capital and prepayment lines, and con-cessions on overdra s.
Credicard, a wholly owned subsidiary of Citigroup, and Elavon, a wholly owned subsidiary of U.S. Bancorp and a leading global payments provider, have also announced their entry into the acquiring business. They have signed a binding agreement to establish a joint-venture mer-chant-services company that will off er a full suite of pay-ment solutions in the Brazilian market.
New entrants will have to compete with two strong in-cumbents, Cielo and Redecard. These established players were started by—and are still closely associated with—the leading Brazilian banks. They have become publicly listed companies and are among the largest acquirers globally in terms of market capitalization.
Despite the increased competition, however, payment margins in Brazil are attractive and are likely to remain that way compared with those in other countries—en-abling local payments players to continue investing in marketing, distribution, infrastructure, operating effi cien-cies, and, above all, innovation. Indeed, the Brazilian pay-ments market has some distinct characteristics that make it ripe for innovation-driven strategies:
High cash use (some 50 percent of transaction volume)◊
A relatively young, steadily growing population ◊
Relatively strong household-income growth◊
A central bank and regulators eager to migrate trans-◊ actions from cash and checks to cards and e-payments, as well as to bring banking services to the unbanked
One recent example of innovation has been the move by three top Brazilian banks—Banco Bradesco, Banco do Bra-sil, and Caixa (the latter two government controlled)—to form a new card network called Elo. This development illustrates how established players can restructure and extend their market reach and at the same time fend off new entrants such as nonbank players. Elo also demon-
strates how traditional banks can cooper-ate to form a useful new utility. The Elo network will target the low-income seg-ment—typically underbanked or unbanked consumers—which represents a vast op-portunity with double-digit growth poten-tial, particularly in migrating government benefi ts to Elo prepaid cards.
Beyond the card business, Brazilian banks are cooperat-ing and innovating in e-payments. In October 2009, Bra-zil’s Interbank Payment Clearing-house (CIP), which is owned by 42 banks, launched the direct-debit account—a full electronic bill presentation and payment (EBPP) service. Unlike the U.S. market, in which there are com-peting third-party EBPP networks, Brazil is forming a sin-gle utility that enables banks to accelerate the network eff ect and scale benefi ts. The direct-debit account system already has 3 million payees registered, out of a potential 34 million Internet-banking clients.
Another highly useful (and diff erentiating) feature is that the system has no preferences with regard to the particu-lar bank. Payers register using a taxpayer identifi cation number and are then able to access the service from any account at any participating bank. (In Brazil, consumers o en have checking accounts at multiple banks.) Current-ly, payers are not charged to use the direct-debit account. Instead, banks charge payees for registration and then for clearing and settlement.
Developments in Brazil demonstrate how established players and new entrants can respond to market disrup-tion with innovations aimed at securing share in a rap-idly growing region. Payments providers in other transi-tioning markets in which the government is a key player (such as India and China) should monitor Brazil’s evolu-tion over the next fi ve years.
Payment margins in
Brazil are attractive
and are likely to
remain that way.

T B C G
Asia-Pacifi c remains a growth area for pay-ments and transaction banking. In 2010, both total volume (up 11 percent from 2009) and the total value of transactions (up 13 percent) grew signifi cantly. More-
over, this growth is expected to continue as large pools of unbanked consumers gradually enter the market—and as some of the largest economies in the region, in-cluding China and India, invest heavily in their national payments infrastructures.
Overall, Asia-Pacifi c is a highly diverse region that pre-sents a unique set of challenges for fi nancial institutions. Banks will have to tailor their business and operating models in order to balance growth aspirations with effi -ciency goals. Generally speaking, there are two sets of markets:
Mature markets, such as Japan, Australia, Singapore, ◊ and Hong Kong, which are characterized by well-developed payments infrastructures and regulatory environments
Emerging markets, such as China and India (as well as ◊ some Southeast Asian countries), where consumers still make payments primarily in cash but where the reach of electronic payments systems is dramatically increasing and mobile-payment models are beginning to gain traction
In the mature Asia-Pacifi c countries, much as in the North American and Western European markets, growth discus-sions focus on existing customers—more specifi cally, on opportunities to increase share of wallet by improving the convenience of payment solutions for consumers and merchants.
In Hong Kong, for example, the Octopus card—a “con-tactless” smart card that was fi rst introduced in 1997 as a simple prepaid card for public transport—has now been enhanced with top-up facilities and links to credit card accounts. Now widely accepted at convenience stores, food shops, and retailers, Octopus has become a market leader in terms of consumer and merchant adop-tion. What’s more, it off ers additional utility to consum-ers by functioning as a means of entry into secured buildings.
Similarly, in Australia, contactless cards are seen as one of the next frontiers in electronic payments, having the potential to displace cash for small purchases at the point of sale. The market potential is signifi cant, with more than 60 percent of purchases in some categories (such as takeout food) still paid for in cash. Some banks have begun to invest in contactless-card and terminal solutions and are promoting their use through consumer educa-tion campaigns. Such banks could potentially gain ground by targeting consumers and merchants of fi nancial insti-tutions that do not off er contactless solutions. Such a strategy is not without its challenges, however. To be successful, contactless solutions must provide benefi ts across the value chain from merchant to consumer. In particular, consumers must have incentives to use these cards.
In emerging Asia-Pacifi c markets, by contrast, growth will be generated by the gradual fi nancial inclusion of un-banked consumers and the rapidly expanding footprint of the electronic-payments infrastructure. Shi s in spend-ing behaviors and payment preferences, especially on the part of the emerging digital generation and those con-sumers moving from rural to urban areas, will also be a prime factor.
Retail Payments: Asia-Pacifi c

W A S
In India, for example, the government has started an am-bitious and successful rural employment program called the Mahatma Gandhi National Rural Employment Guar-antee Act (MNREGA). Under the program, small pay-ments to rural manual laborers are made through direct credit into “no frills” bank accounts held by the workers. Another parallel initiative, Unique Identifi cation Author-ity of India (UIDAI), is attempting to allot a unique ID number to each resident of India. This project could make “know your customer” initiatives much easier and ensure more rapid inclusion of the large portion of the population that is still un-banked.
In China, personal credit cards are growing rapidly in popularity. By the end of 2009, there were around 185 million cards in circulation, a gain of 30 per-cent over the previous year. Transaction volumes and val-ues are increasing at similar rates. Large Chinese banks continue to aggressively expand their card bases by off er-ing incentives such as annual-fee waivers or welcome gi s. In addition, some banks have launched innovative products such as “combo” cards that off er convenient payment solutions by combining credit, debit, and IC/RFID (integrated circuit/radio frequency identifi cation)functions into a single card. At the same time, banks and other payment companies are rapidly rolling out POS ter-minals. Finally, the public-transport sector is contributing to the growth in electronic payments by actively imple-menting and promoting prepaid products.
The diff erences between mature and emerging markets are further illustrated by the way in which banks view telecommunications companies. In mature markets, elec-tronic payment systems enjoy geographically wide cover-age and operational stability. Interactions between par-ticipants—banks, network providers, merchants, and, ultimately, consumers—are well established. Any per-ceived disruption to this well-functioning ecosystem is likely to trigger a protective response from established players. Indeed, although telecommunications providers in these markets may have an attractive off er for consum-ers—such as payments via near-fi eld communication (NFC) technology at the point of sale—they are not viewed as absolutely critical partners.
In emerging markets, by contrast, telecommunications companies have a signifi cant value-add proposition for
payments ecosystems that are still constrained by limited physical and electronic infrastructures. In addition, gov-ernments, central banks, and regulatory bodies have a vested interest in the migration from cash to electronic payments and therefore are key stakeholders—infl uenc-ing payment infrastructure development and potentially even pricing. Hence, there is a strong rationale for collab-
oration among banks, telcos, governments, and other nonbank players to increase fi -nancial inclusion and drive electronic-pay-ments growth. In India, the central bank has recently taken steps to allow banks greater leeway in using nonbanks (includ-ing telcos) as “business correspondents” to facilitate transactions in remote places us-ing hand-held devices and mobile phones.
Back in 2003, mobile provider China Mobile and the card network China UnionPay established UMPay to try to capture the nascent domestic mobile-payments opportu-nity. More recently, in 2010, China Mobile purchased 20 percent of Shanghai Pudong Development Bank, with which it is expected to jointly develop mobile-payments services. Separately, China UnionPay has formed an alli-ance with commercial banks, mobile operators, phone manufacturers, and other industry players to establish specifi cations and business models for the overall mobile-payments industry.
In some cases, telecommunications providers in develop-ing economies have pushed ahead on their own to fi ll gaps in the market. For example, India’s largest mobile player, Bharti Airtel, recently obtained a payment-service provider license that will allow the company to off er semiclosed-loop payment solutions to customers.
When it comes to regulation of the payments industry in Asia-Pacifi c, the climate also diff ers between mature and emerging markets. In the former, the principal aim of reg-ulators is to enable effi cient payment mechanisms and to maintain a competitive market structure. In emerging markets, the focus is much more on creating the basic framework for the payments business—as well as on fos-tering a thriving market. For example, National Payments Corporation of India (NPCI), a new organization promot-ed by banks, is building infrastructure to facilitate better interbank connectivity. In addition, Indian regulators have mandated free customer access to the ATMs of all banks. The ATM switch operated by NPCI has facilitated
In emerging markets,
telecom providers have
pushed ahead to offer
payments solutions.

T B C G
this fundamental shi in India’s payment ecosystem. As a next step, NPCI has been charged with developing a do-mestic card network called RuPay (originally announced as IndiaPay) as an Indian alternative to international card off erings.
The divergent market characteristics in the Asia-Pacifi c region provide an interesting set of challenges for banks with both local and regional aspirations. A clear view of regional and segment priorities will be required in order
to guide investments. Most local banks will concentrate on opportunities in their domestic markets. That said, some large players are starting to build out their franchis-es to support cross-border payment fl ows. But regardless of whether the geographic focus is domestic or regional, banks need to think through their operating models—especially concerning possible cooperation with other banks and nonbank players—as well as explore opportu-nities to leverage payments systems across markets and segments.

W A S
T he global fi nancial crisis has highlighted the attractiveness of transaction banking. Al-though businesses such as deposit and pay-ment services, cash management, and trade services were not unscathed by the down-
turn, they fared relatively well. Over the full economic cycle, these businesses o en provide reliable fee and spread revenues, rich deposit volumes, and high profi t-ability. Return on equity is typically above 40 percent for best-practice institutions. Moreover, BCG’s Corporate Banking Benchmarking Survey has shown that “transac-tion champion” business models—those that generate a diversifi ed mix of credit, treasury, cash-management, and payment revenues as opposed to those dominated by credit-related revenues—can be pivotal in gaining com-petitive advantage across customer segments.
In the postcrisis era, transaction banking will remain a sig-nifi cant opportunity for fi nancial institutions. Wholesale-payments volume is expected to post a CAGR of 9 percent globally from year-end 2010 through 2020, and total wholesale payments revenues are expected to in-crease from $169 billion to $471 billion. Moreover, leading global institutions are elevating transaction banking from an organizational perspective. They are refocusing sales eff orts and making signifi cant investments in improving overall capabilities, client coverage, and regional scope. They are taking these steps in the belief that an increasing emphasis on transaction banking will bring long-term benefi ts. Let’s explore some of the reasons for this belief.
Why Transaction Champions Outperform
Our benchmarking demonstrates that transaction cham-pions have continued to outperform other types of banks
despite adverse trends such as narrowing deposit spreads and lower volumes. The reason is a relatively resilient revenue mix consisting of spreads earned on deposit bal-ances and fee income earned on transaction and value-added services. In 2009, among banks focused on serving midsize corporations (those with between $25 million and $250 million in annual sales revenues), transaction champions posted revenues per risk-weighted assets of 600 basis points, compared with only 250 basis points for credit-heavy corporate banks—and their return on regu-latory capital was 31 percent, versus 8 percent for credit-heavy banks.2 Since 2007, return on equity has risen for most transaction champions and has fallen for all credit-heavy banks in our benchmarking survey.
What are the dynamics behind these trends? Generally speaking, transaction champions exhibit a comprehen-sive approach to building their franchises along dimen-sions such as the following:
Organization.◊ Commercial-, corporate-, and investment-banking businesses are fully aligned and have transac-tion-banking objectives. Cross-silo product develop-ment, pricing, and bundling (such as FX risk hedging) are encouraged and supported. In addition, a collab-orative model exists between the front offi ce (the busi-ness units) and the back offi ce (IT and operations).
Relationship Management.◊ A distinct coverage model exists, including appropriate incentives, that enables eff ective teaming between relationship managers and specialists in treasury and other product areas. Strong emphasis is placed on fully understanding customers’
2. Based on the worst three-year average of actual or expected loan losses.
The Global Wholesale Transaction-Banking Market

T B C G
present and future needs. When serving large corpora-tions and MNCs (multinational corporations), global product groups team with relationship managers as well.
Product Capabilities.◊ Excellence in the core products and services needed by target clients is provided, ulti-mately enabling clients to optimize their working capital. Cutting-edge pricing models, superior bundled-service pack-ages, and the ability to off er short-term credit (such as supply chain fi nancing) is the norm. The greatest challenge is in serving MNCs, which require sophisti-cated, integrated, cross-border payment services.
Customer Service and Product Delivery. ◊ Both on-site and remote support is robust, enabling swi problem reso-lution. Online cash-management and treasury services are user-friendly and effi cient. The execution of trans-actions is automated, accurate, and fast. We have ob-served that banks with relatively deep online-portal penetration rates tend to have higher transaction-banking revenues.
Infrastructure. ◊ Core systems are reliable, secure, scal-able, and easily integrated with customers’ systems. In addition to having a sophisticated online treasury-management platform, transaction champions serving large corporations and MNCs must be able to off er their clients access to the bank’s treasury and pay-ments applications via the clients’ own enterprise-resource-planning (ERP) and treasury systems.
The above attributes contribute to transaction champi-ons’ frequent ability to gather more deposits and gener-ate more revenues than banks whose focus lies else-where. Yet the sales forces of transaction champions are not necessarily larger, nor are their overall product ranges always wider. Their secret lies simply in achieving the vir-tuous circle of cross-selling: sell more transaction services, increase deposit balances, and win more cash-manage-ment mandates. As account revenues gradually become more important, an increasing share of a client’s deposits will be a critical revenue driver.
Most banks, however, are not transaction champions. Our benchmarking has revealed that a majority of banks are
leaving potential revenues on the table, with only a small minority exploiting the transaction-banking possibilities presented by their deposit and loan clients. (See Exhibit 6.) Moreover, even those banks that excel at transaction banking can improve their performance. But in order for all banks to raise their games in this area, they need to review—and potentially retool—their business and oper-
ating models.
Building a Transaction Champion
Despite the strengths of transaction-bank-ing businesses, there are multiple chal-lenges to be overcome before the full op-
portunity can be captured. For instance, getting diff erent silos within the bank—such as the corporate-banking sales force, the cash-management and trade-service spe-cialists, and the operations and IT groups—to align around making transaction banking a top priority can be a tall order.
What’s more, some institutions struggle in defi ning their core target markets (both from a segment and geograph-ic perspective) and in smoothing out uneven customer experiences across channels and regions. A winning strategy in North America or Western Europe, for exam-ple, might not be optimal in Asia. (See the sidebar “Transaction Banking in Asia: Forging a Sustainable Franchise.”)
In addition, price pressure is becoming more severe as the competition for market share and scale heats up—a dynamic complicated by the tightening regulatory cli-mate. Traditional operating models are being tested as wholesale banks face increasing tradeoff s between effi -ciency and standardization on the one hand and service excellence and customization—both across borders and across segments—on the other.
In our work with clients, we have observed that building a transaction champion depends on making the right de-cisions and investments along multiple dimensions. These dimensions include geographic footprint, product breadth, product quality, product and service innovation, distribution infrastructure, customer service and support, and credit capacity (along with the related risk appetite). For example, banks aspiring to be transaction champions
Transaction champions
achieve the
virtuous circle of
cross-selling.

W A S
for small to midsize corporations (as opposed to large-caps or MNCs) should focus on getting product breadth, distribution, and customer support right, as well as assur-ing that suffi cient credit capacity is available.
As for product breadth, many banks have pursued an “everything to everybody” strategy. As a result, they are supporting an unwieldy range of products, some of which are subscale, negative- to low-profi t products. Yet our benchmarking shows that banks can achieve above-average cross-selling (measured by revenues per client) without a full product set—and that other factors are im-portant drivers. (See Exhibit 7.)
In our view, banks should home in on core, profi table products, ensuring that their off ering remains competi-tive, while jettisoning or “white labeling” (using generic versions of) noncore, low-profi t products. White labeling has become an increasingly viable proposition as top-tier banks build multibank product platforms and off er interesting terms. Our recent discussions with banks re-veal that many see partnering in global transaction
banking as an increasingly important part of their growth strategy.
Regarding distribution, most banks have room for im-provement in achieving a collaborative organization structure between relationship managers and transac-tion-product specialists, with a commensurate opportu-nity to increase their share of customer wallet. A useful place to start is to undertake a “wallet sizing” exercise. Such an initiative should be aimed at understanding each client’s revenue composition, current product use, and future potential with regard to client segment, region, product, and relationship manager. Wallet-sizing method-ologies tend to vary by segment.
Customer service and support is another critical area. In-deed, poor customer service is the root of most attrition. If a bank is to maximize the lifetime value of its custom-ers, sharp distribution infrastructure must be coupled with customer service excellence. Best-practice players are developing centers of excellence to support specifi c products and services and ensure that service-level agree-
7.5Deposits per client group ($millions)
0
100
200
1.00.0
50
2.0 4.0
Total revenues per client group($thousands)
0.5 1.5
Asia-PacificCentral and Eastern Europe
AmericasWestern Europe Size = transaction-banking
revenue/deposit volume
Most banks have room to leveragetheir deposit clients
A minority of banks have heavilyleveraged their deposit clients
Sources: BCG Corporate Banking Benchmarking Database, mid-cap segment (data are from 2009); BCG analysis.
Exhibit 6. Most Banks Do Not Achieve the Full Potential of Their Transaction-Banking Business

T B C G
ments are met and improved upon. Such institutions establish delivery teams (both physical and virtual) to assure quick customer onboarding, and they designate client-specifi c support teams for the largest, most profi t-able customers.
Of course, banks must be willing and able to provide capital-intensive products, including corporate loans, lines of credit, and (to a lesser degree) trade fi nance. For the latter, a bank may fi nd that partnering with another bank is optimal. The ability to provide credit is critical to max-imizing transaction-banking revenues from midsize to
large corporations. As one of our clients said, “It is impos-sible to divorce the conversation about credit from cash management.” The reverse is true as well. Transaction champions o en will not renew a line of credit for credit-only customers unless the customer shi s some of its transaction-banking business to the bank. As Basel III capital requirements adversely aff ect the return earned on credit products, cross-selling to credit clients will be-come critical to improving performance.
Although crisp execution along the above dimensions requires a sizable commitment in terms of fi nancial and
For major payments players, making the most of transac-tion-banking growth opportunities in Asia is largely a mat-ter of focusing on three segments: Western multinational corporations (MNCs) that are evolving in the region, Asian MNCs with expanding cross-border needs, and midsize Asian corporations (which tend to be underserved).
In building up a competitive overall off ering, a new en-trant can o en use tailored trade solutions as a door opener, with a heavy focus on structuring, cross-selling, and diff erentiating the bank’s off ering from those of pure-ly local banks. Product capabilities can be advanced grad-ually to capture new fl ow businesses. Regional e-banking can be used to enhance visibility, with progressive expan-sion into full regional cash-management off erings.
More specifi cally, in order to excel at serving Western MNCs, banks need to understand how an MNC is organ-ized globally and have a strong relationship with its head-quarters—be it in Europe or the Americas—as well as with its regional divisions in Asia. Although regional divi-sions may take their lead from the home offi ce in seeking out transaction-banking products and credit facilities, the bank’s relationship with the MNC’s Asian division or af-fi liate needs to be managed locally—“on the ground”—in order to truly capture and meet the full range of local needs. Moreover, in order to sell transaction-banking ser-vices, credit lines must be available at the local level.
But nonlocal banks will have to beef up their local knowl-edge and capabilities if they hope to succeed with Asian operations of Western MNCs. They must be able to devel-op—either directly or through partnerships—a complete and sophisticated set of local off erings, backed by prod-ucts and services tailored to specifi c Asian markets.
When it comes to serving leading Asian MNCs, banks must be especially thoughtful in choosing target compa-nies and countries. They must also establish regional coverage teams to serve their targets, as many Asian MNCs have signifi cant transaction-banking and credit needs outside their home markets. Initial attention should be placed on Asian MNCs’ divisions in rapidly growing economies such as China and India. O en, a banking relationship can be built up by off ering credit lines in non-home markets, which can then enable the bank to win cash management mandates. Such man-dates, in turn, can enable the bank to provide lucrative treasury services.
As for midsize Asian corporations, which tend to be un-derserved, vast potential exists for meeting their transac-tion-banking needs. This opportunity can bring signifi -cant rewards. As with the other two segments, however, winning requires a high level of local knowledge and an ability to provide suffi cient credit facilities. In addition, banks that can off er diff erentiated trade services in rap-idly developing economies will capture market share. Trading companies, in particular, are an attractive seg-ment to serve, but they require relatively large credit fa-cilities and a corresponding risk appetite. Banks with lim-ited risk tolerances can target Asian companies that have a multicountry presence by off ering regional and interre-gional cash-management services.
Even though the investment required to be a winner in Asia is large, it can be made incrementally—and either di-rectly or through partnerships. But there is no time to lose, as many leading global banks have been ramping up their Asian investments during the downturn.
Transaction Banking in AsiaForging a Sustainable Franchise

W A S
human resources, the investment will likely result in a sus-tainable business model and profi table growth. Not only do transaction champions increase customer retention through superior service and credit off erings but they also tend to attract the best customers of other banks as well.
Finally, a transaction champion must be able to design and implement appropriate business and operating mod-els for its target segments. This task o en involves balanc-ing a “design to cost” perspective for the small and mid-
size segments with a “service excellence” perspective for large corporations and MNCs. A bank must have a fl exi-ble operating model that allows it to achieve scale and low costs within an infrastructure that supports all client segments. At the same time, the model must support the separate platforms required to deliver customized servic-es to MNCs. Banks that achieve this balance will have not only a sustainable cost (and pricing) advantage but also a service advantage. These benefi ts will be the growth drivers of the future.
0
20
40
60
80
100
120
20 40 60 80 100
Deposits/loans (%)
Product offering index1 Product offering index1
Banks that offer more products tendto attract relatively more deposits...
...but strong cross-selling is also drivenby other factors
0
50
100
150
20 40 60 80 100
Revenues per client group($thousands)
AmericasEuropeAsia-Pacific
Strong cross-selling canbe achieved withouta full product suite
Sources: BCG Corporate Banking Benchmarking Database, mid-cap segment (data are from 2009); BCG analysis.1The product offering index indicates the number of products offered out of a list of 18 key products (each is weighted equally); an index value of 100 means that all 18 products are offered.
Exhibit 7. A Broad Product Range Attracts More Deposits but Is Not Mandatory for Strong Cross-Selling

T B C G
The vitality of the global payments marketplace is meas-ured by volume (the number of noncash transactions), value (the monetary amount of noncash transactions), and revenue (the amount of income generated for banks and other market participants by noncash transactions). This Appendix provides a detailed forecast of the pay-ments marketplace evolution from 2010 through 2020.
We defi ne payments revenues as direct and indirect reve-nues generated by a payment service. These include transaction-specifi c revenues, card and account mainte-nance fees, and spread income generated from current accounts—also known as checking or demand-deposit ac-
counts (DDAs). Fees for overdrafts and nonsufficient funds are considered transaction-specifi c revenue. We de-fi ne transaction banking as payments-related products and services, such as cash management services for corporate clients. All numbers in the Appendix are for noncash pay-ments. In the tables that follow, total revenues are the sum of account revenues and transaction revenues. Num-bers may not add exactly to totals because of rounding. In 2010, BCG updated its global payments model to incor-porate additional data, add new countries (now 55), ad-just the forecast models to account for the global reces-sion, and extend the forecasts to 2020. Data from previous BCG reports may have been revised accordingly.
Worldwide Payments, 2010 and 2020
Source: BCG Global Payments database, 2010.
North America
Latin America
Western Europe
Central and Eastern Europe
Asia-Pacifi c
Middle East and North
AfricaRest of world Total
Volume (millions) 116,700 29,000 78,000 11,900 65,400 4,000 1,200 306,300
Value ($millions) 95,595,100 20,841,600 98,739,100 18,647,000 90,913,100 5,314,600 1,323,200 331,373,700
Total revenues ($millions)
159,900 71,200 146,600 40,300 140,400 29,200 2,400 589,900
North America
Latin America
Western Europe
Central and Eastern Europe
Asia-Pacifi c
Middle East and North
AfricaRest of world Total
Volume (millions) 206,700 109,000 125,200 30,400 212,500 37,500 28,500 749,800
Value ($millions) 137,480,600 71,254,100 154,780,000 52,909,400 301,147,200 34,751,600 29,682,800 782,005,700
Total revenues ($millions)
284,500 195,200 276,200 97,400 533,800 132,300 60,000 1,579,400
AppendixAn Overview of Volumes, Values, and Revenues
in the Payments Marketplace, 2010–2020
2010
2020

W A S
Volume of Payments
Region/country 2010 2020 CAGR, 2010–2020 (%)
Units: millions of transactions
Americas 145,800 315,700 8North America 116,700 206,700 6 Canada 9,500 15,800 5 United States 107,200 190,900 6
Latin America 29,000 109,000 14 Brazil 18,900 67,900 14 Mexico 3,500 8,500 9 Other Latin America 6,600 32,600 17
Europe 90,000 155,600 6Western Europe 78,100 125,200 5 France 14,300 21,500 4 Germany 18,800 33,200 6 Italy 3,600 4,100 1 Netherlands 4,500 7,600 5 Spain 4,800 5,700 2 United Kingdom 14,400 24,100 5 Other Western Europe 17,600 29,000 5
Central and Eastern Europe 11,900 30,400 10 Czech Republic 1,800 3,200 6 Poland 1,900 3,900 7 Russia 2,800 9,200 13 Other CEE 5,400 14,100 10
Asia-Pacifi c 65,400 212,500 13 Japan 7,600 9,800 3 Australia 5,200 11,900 9 New Zealand 2,000 3,600 6 China 22,400 105,200 17 Taiwan 800 1,100 4 Hong Kong 800 1,200 3 Singapore 2,600 4,600 6 South Korea 11,000 20,800 7 Indonesia 2,400 7,800 13 Malaysia 1,400 2,400 6 Philippines 3,600 14,000 15 Thailand 1,200 3,000 10 India 2,900 19,400 21 Other Asia-Pacifi c 1,700 7,700 16
Middle East and North Africa 4,000 37,500 25
Rest of world 1,200 28,500 37
World 306,300 749,800 9
Source: BCG Global Payments database, 2010.

T B C G
Volume of Retail and Wholesale Domestic and Cross-Border Payments
Region/payment type 2010 2020 CAGR, 2010–2020 (%)
Units: millions of transactions
North America 116,700 206,700 6 Retail domestic 94,800 172,500 6 Retail cross-border 1,700 3,700 8 Wholesale domestic 20,000 29,800 4 Wholesale cross-border 300 600 7
Latin America 29,000 109,000 14 Retail domestic 20,400 83,000 15 Retail cross-border 400 1,200 12 Wholesale domestic 8,100 24,700 12 Wholesale cross-border 30 200 21
Western Europe 78,100 125,200 5 Retail domestic 63,100 102,100 5 Retail cross-border 1,600 2,600 5 Wholesale domestic 13,300 20,100 4 Wholesale cross-border 200 300 4
Central and Eastern Europe 11,900 30,400 10 Retail domestic 9,200 23,700 10 Retail cross-border 200 400 7 Wholesale domestic 2,400 6,000 10 Wholesale cross-border 100 400 15
Asia-Pacifi c 65,400 212,500 13 Retail domestic 42,600 132,500 12 Retail cross-border 2,800 14,400 18 Wholesale domestic 19,700 64,600 13 Wholesale cross-border 300 1,000 13
Middle East and North Africa 4,000 37,500 25 Retail domestic 3,300 33,300 26 Retail cross-border 100 500 17 Wholesale domestic 600 3,600 20 Wholesale cross-border 10 30 12
Rest of world 1,200 28,500 37 Retail domestic 900 21,600 37 Retail cross-border 30 900 41 Wholesale domestic 300 5,900 35 Wholesale cross-border 4 100 38
World 306,300 749,800 9
Source: BCG Global Payments database, 2010.

W A S
Value of Payments
Region/country 2010 2020 CAGR, 2010–2020 (%)
Units: $millions
Americas 116,436,700 208,734,700 6North America 95,595,100 137,480,600 4 Canada 8,100,500 13,755,800 5 United States 87,494,600 123,724,800 4
Latin America 20,841,600 71,254,100 13 Brazil 10,961,900 34,585,400 12 Mexico 3,096,500 9,933,900 12 Other Latin America 6,783,100 26,734,800 15
Europe 117,386,200 207,689,400 6Western Europe 98,739,100 154,780,000 5 France 16,594,300 24,827,600 4 Germany 22,563,000 35,291,400 5 Italy 9,927,000 14,135,400 4 Netherlands 4,664,800 7,273,100 5 Spain 8,685,700 13,091,700 4 United Kingdom 14,462,800 23,363,000 5 Other Western Europe 21,841,400 36,797,800 5
Central and Eastern Europe 18,647,000 52,909,400 11 Czech Republic 1,025,500 2,084,100 7 Poland 2,203,000 4,703,300 8 Russia 8,026,800 25,023,100 12 Other CEE 7,391,600 21,098,900 11
Asia-Pacifi c 90,913,100 301,147,200 13 Japan 21,045,700 27,234,100 3 Australia 3,009,700 5,002,000 5 New Zealand 763,400 1,585,600 8 China 43,975,500 181,964,500 15 Taiwan 2,409,600 5,543,600 9 Hong Kong 1,500,300 2,982,500 7 Singapore 734,500 1,882,300 10 South Korea 6,503,000 14,555,200 8 Indonesia 1,304,500 5,950,500 16 Malaysia 982,900 2,479,300 10 Philippines 1,355,500 5,283,000 15 Thailand 845,300 2,447,100 11 India 4,468,800 35,265,100 23 Other Asia-Pacifi c 2,014,400 8,972,400 16
Middle East and North Africa 5,314,600 34,751,600 21
Rest of world 1,323,200 29,682,800 36
World 331,373,700 782,005,700 9
Source: BCG Global Payments database, 2010.

T B C G
Value of Retail and Wholesale Domestic and Cross-Border Payments
Region/payment type 2010 2020 CAGR, 2010–2020 (%)
Units: $millions
North America 95,595,100 137,480,600 4 Retail domestic 16,056,700 20,720,400 3 Retail cross-border 108,700 198,800 6 Wholesale domestic 77,496,500 112,650,600 4 Wholesale cross-border 1,933,300 3,910,800 7
Latin America 20,841,600 71,254,100 13 Retail domestic 1,969,600 6,542,800 13 Retail cross-border 44,300 111,600 10 Wholesale domestic 18,107,200 60,372,000 13 Wholesale cross-border 720,400 4,227,700 19
Western Europe 98,739,100 154,780,000 5 Retail domestic 8,633,500 13,719,900 5 Retail cross-border 188,600 321,400 5 Wholesale domestic 85,061,200 130,764,900 4 Wholesale cross-border 4,855,700 9,973,800 7
Central and Eastern Europe 18,647,000 52,909,400 11 Retail domestic 1,336,300 3,906,000 11 Retail cross-border 18,500 46,100 10 Wholesale domestic 16,234,700 44,722,800 11 Wholesale cross-border 1,057,500 4,234,500 15
Asia-Pacifi c 90,913,100 301,147,200 13 Retail domestic 5,833,400 21,331,200 14 Retail cross-border 329,400 1,666,400 18 Wholesale domestic 79,674,000 253,561,200 12 Wholesale cross-border 5,076,300 24,588,500 17
Middle East and North Africa 5,314,600 34,751,600 21 Retail domestic 508,200 4,969,000 26 Retail cross-border 10,100 49,800 17 Wholesale domestic 4,253,600 27,624,500 21 Wholesale cross-border 542,600 2,108,300 15
Rest of world 1,323,200 29,682,800 36 Retail domestic 137,700 2,809,100 35 Retail cross-border 2,800 94,500 42 Wholesale domestic 1,125,900 24,843,900 36 Wholesale cross-border 56,900 1,935,300 42
World 331,373,700 782,005,700 9
Source: BCG Global Payments database, 2010.

W A S
Total Revenues (Account and Transaction Revenues)
Region 2010 2020 CAGR, 2010–2020 (%)
Units: $millions
North America 159,900 284,500 6Latin America 71,200 195,200 11Western Europe 146,600 276,200 7Central and Eastern Europe 40,300 97,400 9Asia-Pacifi c 140,400 533,800 14Middle East and North Africa 29,200 132,300 16Rest of world 2,400 60,000 38
World 589,900 1,579,400 10
Source: BCG Global Payments database, 2010.
Revenues per Transaction (Based on Transaction Revenues Only)
Region 2010 2020 CAGR, 2010–2020 (%)
Units: $
North America 0.89 0.75 –2Latin America 1.06 0.77 –3Western Europe 0.58 0.29 –7Central and Eastern Europe 0.83 0.50 –5Asia-Pacifi c 0.89 0.67 –3Middle East and North Africa 1.40 1.09 –2
World (includes rest of world) 0.83 0.66 –2
Source: BCG Global Payments database, 2010.

T B C G
Domestic Transaction Revenues
Source: BCG Global Payments database, 2010.
Region 2010 2020 CAGR, 2010–2020 (%)
Units: $millions/$ Total Per transaction Total Per transaction Total Per transaction
North America 96,400 0.84 142,200 0.70 4 –2
Latin America 28,900 1.01 79,800 0.74 11 –3
Western Europe 39,400 0.52 27,600 0.23 –3 –8
Central and Eastern Europe 8,700 0.75 12,700 0.43 4 –5
Asia-Pacifi c 45,500 0.73 98,600 0.50 8 –4
Middle East and North Africa 4,900 1.28 38,100 1.03 23 –2
World (includes rest of world) 224,700 0.75 414,700 0.57 6 –3
Cross-Border Transaction Revenues
Source: BCG Global Payments database, 2010.
Region 2010 2020 CAGR, 2010–2020 (%)
Units: $millions/$ Total Per transaction Total Per transaction Total Per transaction
North America 6,700 3.48 12,200 2.79 6 –2
Latin America 1,300 2.67 3,900 2.92 12 1
Western Europe 5,600 3.23 8,600 2.93 4 –1
Central and Eastern Europe 1,100 3.96 2,500 3.29 9 –2
Asia-Pacifi c 12,400 3.97 44,300 2.88 14 –3
Middle East and North Africa 600 5.65 2,900 5.23 17 –1
World (includes rest of world) 27,800 3.62 77,400 2.93 11 –2

W A S
For Further Reading
The Boston Consulting Group pub-lishes other reports and articles that may be of interest to senior fi nancial executives. Recent examples are list-ed here.
Global Retail Banking 2010/2011: The Road to ExcellenceA report by The Boston Consulting Group, December 2010
The Solvency II Challenge: Anticipating the Far-Ranging Impact on Business StrategyA White Paper by The Boston Consulting Group, October 2010
Leveling the Playing Field: Upgrading the Wealth Management Experience for WomenA White Paper by The Boston Consulting Group, July 2010
In Search of Stable Growth: Global Asset Management 2010A report by The Boston Consulting Group, July 2010
Crisis as Opportunity: Global Corporate Banking 2010A report by The Boston Consulting Group, June 2010
Regaining Lost Ground: Global Wealth 2010A report by The Boston Consulting Group, June 2010
Life Insurance in Asia: New Realities and Emerging OpportunitiesA White Paper by The Boston Consulting Group, April 2010
Risk and Reward: What Banks Should Do About Evolving Financial RegulationsA White Paper by The Boston Consulting Group, March 2010
Building a High-Powered Branch Network in Retail BankingA White Paper by The Boston Consulting Group, March 2010
A er the Storm: Creating Value in Banking 2010A report by The Boston Consulting Group, February 2010
Leveraging Consumer Insights in InsuranceA White Paper by The Boston Consulting Group, February 2010
Retail Banking: Winning Strategies and Business Models RevisitedA White Paper by The Boston Consulting Group, January 2010
The Near-Perfect Retail Bank A White Paper by The Boston Consulting Group, November 2009
Come Out a Winner in Retail Banking A White Paper by The Boston Consulting Group, September 2009
Value Creation in Insurance: Laying a Foundation for Successful M&A A White Paper by The Boston Consulting Group, September 2009

T B C G
Note to the Reader
AcknowledgmentsFirst and foremost, we would like to thank the fi nancial institutions that participated in our current and previ-ous research, as well as other organi-zations that contributed to the in-sights contained in this report.
Within The Boston Consulting Group, this report would not have been possible without the dedication of many members of BCG’s Finan-cial Institutions practice, including Ashwin Adarkar, Brent Beardsley, Jorge Becerra, Vikrant Bhatia, David Bronstein, Vincent Chin, Allard Creyghton, Stefan Dab, Martin Danoesastro, Laurent Desmangles, Jürgen Eckel, John Garabedian, Keith Halliday, Nicolas Harlé, Richard Helm, Brad Henderson, Jérôme Hervé, Marty Huang, Sunil Kappago-da, Nadeem Khan, Monish Kumar, Vinoy Kumar, Huib Kurstjens, Jeanne Kwong Bickford, Brian Landry-Wilson, Frankie Leung, Emilia Lopez,
Marshall Lux, Flávio Magalhães, Kate Manfred, Helena Marrez, Nicole Mönter, Hans Montgomery, Neil Mumm, Federico Muxi, Ron Nicol, Kentaro Ogata, Carlos Palácios, David Rhodes, Ignazio Rocco, David Roylance, Tjun Tang, Paul Thiekötter, Steve Thogmartin, Andrew Toma, Pablo Tramazaygues, Saurabh Tripathi, Masao Ukon, André Xavier, and Kuba Zielinski. We would also like to thank Marta Asencio, Alejandro Carabba, Amy Chou, Rafael Cicco, Petra Demski-Etterling, Khushnuma Dordi, Olga Kim, Jayoon Kim, David Le, Mats Lindh, Sonja Meierl, Jenniza Ramli, Kanchanat U-Chukanokkun, and Minji Xu.
Finally, our special thanks go to Philip Crawford for his editorial di-rection, as well as to other members of the editorial and production teams, including Gary Callahan, Angela DiBattista, and Janice Willett.
For Further ContactIf you would like to discuss your pay-ments business with The Boston Consulting Group, please contact one of the authors.
Alenka GrealishTopic SpecialistBCG Chicago+ 1 312 993 [email protected]
Stefan MohrPartner and Managing DirectorBCG Sydney+61 2 9323 [email protected]
Carl Rutstein Senior Partner and Managing DirectorBCG Chicago+ 1 312 993 [email protected]
Jürgen SchwarzSenior Partner and Managing DirectorBCG Toronto+1 416 955 [email protected]
Niclas StorzPartner and Managing DirectorBCG Munich +49 89 231 [email protected]
Michael Urban Principal BCG Düsseldorf +49 2 11 30 11 30 [email protected]

For a complete list of BCG publications and information about how to obtain copies, please visit our website at www.bcg.com/publications.
To receive future publications in electronic form about this topic or others, please visit our subscription website at www.bcg.com/subscribe.
2/11

Abu DhabiAmsterdamAthensAtlantaAucklandBangkokBarcelonaBeijingBerlinBostonBrusselsBudapestBuenos AiresCanberraCasablanca
ChicagoCologneCopenhagenDallasDetroitDubaiDüsseldorfFrankfurtHamburgHelsinkiHong KongHoustonIstanbulJakartaKiev
Kuala LumpurLisbonLondonLos AngelesMadridMelbourneMexico CityMiamiMilanMinneapolisMonterreyMoscowMumbaiMunichNagoya
New DelhiNew JerseyNew YorkOsloParisPerthPhiladelphiaPragueRomeSan FranciscoSantiagoSão PauloSeoulShanghaiSingapore
StockholmStuttgartSydneyTaipeiTel AvivTokyoTorontoViennaWarsawWashingtonZurich
bcg.com