Embed Size (px)
Citation preview
Manual
Cytoskeleton, Inc.
The Protein
Experts
cytoskeleton.com Phone: (303) 322.2254 Fax: (303) 322.2257
Customer Service: [email protected]
Technical Support: [email protected]
V 3.2
G-LISA® Ras Activation Assay Biochem Kit™
(Absorbance Based)
Cat. # BK131

cytoskeleton.com Page 2
cytoskeleton.com Page 3
Section I: Introduction
Background --------------------------------------------------------------------------------- 5
The Ras G-LISA® Advantage ---------------------------------------------------------- 5
Assay Principle ----------------------------------------------------------------------------- 6
Section II: Purchaser Notification --------------------------------------------------------------- 7
Section III: Kit Contents ----------------------------------------------------------------------------- 8-9
Section IV: Reconstitution and Storage of Components ------------------------------ 10-11
Section V: Important Technical Notes
A. Notes on Updated Manual Version ------------------------------------------- 12
B. Growth and Treatment of Cell Lines ------------------------------------------ 12
C. Assay Preparation for G-LISA®------------------------------------------------- 12-14
D. Timing and Intensity of Ras Activation --------------------------------------- 14
E. Rapid Processing of Cells-------------------------------------------------------- 14-15
F. Protein Concentration Equivalence ------------------------------------------- 16
G. Assay Linearity ---------------------------------------------------------------------- 16
H. Use of a Multi-channel Pipettor ------------------------------------------------ 17
I. Removal of Solutions from Wells ---------------------------------------------- 17
J. Plate Shaker Recommendations ---------------------------------------------- 17
K. Spectrophotometer Settings----------------------------------------------------- 17
Section VI: Assay Protocol
Assay Preparation ------------------------------------------------------------------------- 18
Lysate Collection --------------------------------------------------------------------------- 19-20
G-LISA® Assay------------------------------------------------------------------------------ 21-23
Section VII: Data Analysis -------------------------------------------------------------------------- 24-25
Section VIII: Troubleshooting --------------------------------------------------------------------- 26
Section IX: References ------------------------------------------------------------------------------- 27
APPENDICES
Appendix 1 Evaluating the “controlled” and “responsive” state of the cells---------- 29-30
Appendix 2 Experiment Record Sheet ---------------------------------------------------------- 31
Appendix 3 Plate Record Template -------------------------------------------------------------- 32
Appendix 4 Protein Quantitation with Precision Red Advanced Protein Reagent - 33-34
Appendix 5 Table of Ras activators ------------------------------------------------------------- 35
Manual Contents

cytoskeleton.com Page 4

cytoskeleton.com Page 5
Background
The Ras small G-proteins act as molecular switches that transmit cellular signals through
an array of effector proteins. The mammalian Ras subfamily of proteins (H-Ras, N-Ras, K
-Ras4A and K-Ras4B) play important roles in many cellular functions including the control
of cell proliferation, differentiation and cell death (1).
The Ras switch operates by alternating between an active, GTP-bound state and an
inactive, GDP-bound state (2-4). Oncogenic mutations that lead to the expression of
constitutively active/GTP-bound Ras are found in ~30% of human malignant tumors
derived from a diverse range of tissues (5).
The fact that many Ras effector proteins will specifically recognize the GTP bound form
of the protein has been exploited experimentally to develop affinity based separation
methods that allow for the isolation and detection of activated Ras in biological samples
(6-8). These Ras “pull-down” activation assays typically utilize the Ras binding domain
(RBD) of a Ras effector protein coupled to agarose beads, which allows the active Ras to
be separated from the bulk of the biological sample by virtue of its interaction with the
RBD. The sample is then analyzed by Western blot to determine the levels of active Ras
that were bound to the beads. This method suffers from several drawbacks, however,
such as being time consuming, requiring large amounts of total cellular protein, being
limited in the number of samples that can be handled simultaneously and yielding only
semi-quantitative results.
The Ras G-LISA® Advantage
With the new Ras G-LISA® kit you can now measure Ras activation from cell and tissue
samples in less than 3 h. G-LISA® requires only 1-5% of the material needed for a conventional
pull-down assay. You will also be able to handle large sample numbers and generate
quantitative results. The G-LISA® advantages are summarized in Table 1.
Table 1: The G-LISA® Advantage
* Clarification is still recommended for low sample numbers. Screening applications that omit clarification have
been developed.
** Numerical readouts and fewer sample handling steps make this assay more quantitative.
Traditional pull-down G-LISA®
Assay Time 10-12 h (2 days) <3 h
Cell material per assay 0.5-2 mg protein
(100 mm plate)
10-50 µg protein
(12-well plate)
Lysate clarification needed* Yes No
Sample handling Up to 10 samples Up to 96 samples (or
more)
Quantitative Data** Semi Yes
I: Introduction

cytoskeleton.com Page 6
Assay Principle
The Ras G-LISA® kit contains a Ras GTP-binding protein linked to the wells of a 96 well plate.
Active, GTP-bound Ras in cell/tissue lysates will bind to the wells while inactive GDP-bound Ras
is removed during washing steps. The bound active Ras is detected with a Ras specific
antibody. The degree of Ras activation is determined by comparing readings from activated cell
lysates versus non-activated cell lysates. Inactivation of Ras is generally achieved in tissue
culture by a serum starvation step (see Section V: Important Technical Notes, B: Growth and
Treatment of Cell Lines). A basic schematic of the steps involved in the G-LISA® is shown in
Figure 1. Typical G-LISA® results are shown in Figure 2.
Ras activation by EGF measured by G-
LISA®. HeLa cells were serum starved for
24 hours and treated with EGF (Cat. #
CN02; 100 ng/ml for 2 min). 25 µg of cell
lysates were subjected to the G-LISA®
assay. Absorbance was read at 490 nm.
Data are background subtracted.
Figure 1: Simple and Quick Protocol Figure 2: Typical G-LISA® Results
I: Introduction (Continued)
cytoskeleton.com Page 7
Limited Use Statement
The G-LISA® kits are based on technology developed at Cytoskeleton Inc. and are the
subject of patent applications assigned to Cytoskeleton Inc. (Patent# 7,763,418 B2). The
purchase of this product conveys to the buyer the non-transferable right to use the
purchased amount of product and components of product in research conducted by the
buyer. The buyer cannot sell or otherwise transfer this product or any component thereof
to a third party or otherwise use this product or its components for commercial purposes.
Commercial purposes include, but are not limited to: use of the product or its components
in manufacturing; use of the product or its components to provide a service; resale of the
product or its components.
The terms of this Limited Use Statement apply to all buyers including academic and for-
profit entities. If the purchaser is not willing to accept the conditions of this Limited Use
Statement, Cytoskeleton Inc. is willing to accept return of the unused product with a full
refund.
II: Purchaser Notification

cytoskeleton.com Page 8
This kit contains enough reagents for 96 assays. When properly stored, kit
components are guaranteed stable for a minimum of 6 months. You can assay
anywhere from 2 to 96 samples at a time for your own convenience. Table 2
summarizes the kit contents.
Table 2: Kit Contents and storage upon arrival
* Items with part numbers (Part #) are not sold separately and available only in kit format. Items with
catalog numbers (Cat. #) are available separately.
Reagents Cat. # or Part # * Quantity Storage
96 well Ras-GTP binding
plate
Part # GL64 12 strips of 8
wells
Desiccated 4°C
Anti-Ras antibody
(recognizes H-Ras, K-Ras
and N-Ras)
Part # GL11 1 tube, lyophilized Desiccated 4°C
Secondary antibody - horseradish peroxidase
conjugate (HRP)
Part # GL02 1 tube, lyophilized Desiccated 4°C
Ras control protein
(constitutively active H-
Ras)
Part # RSCA
12 tubes,
lyophilized
Desiccated 4°C
Cell Lysis Buffer Part # GL36 1 bottle,
lyophilized
Desiccated 4°C
Binding Buffer Part # GL37 1 bottle,
lyophilized
Desiccated 4°C
Wash Buffer Part # GL38 1 bottle,
lyophilized
Desiccated 4°C
Antigen Presenting Buffer Part # GL45 1 bottle, 30 ml Room temperature
Antibody Dilution Buffer Part # GL47 1 bottle,
lyophilized
Desiccated 4°C
HRP Detection Reagent A Part # GL43 1 tablet, silver
pack
Desiccated 4°C
HRP Detection Reagent B Part # GL44 1 tablet, gold
pack
Desiccated 4°C
HRP Stop Solution Part # GL80 1 bottle, 8 ml 4°C
Precision Red™ Advanced Protein Assay
Reagent
Part # GL50
(available as 500 ml
size Cat. # ADV02)
1 bottle, 100 ml Room temperature
(4°C for long term)
Protease Inhibitor Cocktail Cat. # PIC02 1 tube, lyophilized Desiccated 4°C
Strip holder Strip holder 1 plate Room temperature
III: Kit Contents

cytoskeleton.com Page 9
The reagents and equipment that you will require but are not supplied:
Cold 4°C PBS pH 7.2 buffer (10 mM phosphate buffer pH 7.4, 140 mM NaCl, 3 mM
KCl)
Concentrated sulfuric acid (need to add 1 ml to HRP Stop Buffer)
Cell scrapers
Liquid nitrogen for snap freezing cell lysates.
Multi-channel or multi-dispensing pipettor for 25-200 µl range.
Multi-channel pipettor solution basins (available from VWR Cat. # 21007-970). Used
for liquid handling.
Two orbital microplate shakers. Optimal shaker speed is 400 rpm (200 rpm is the
minimal speed required). One at room temperature and one at 4°C
Microplate spectrophotometer (see Section V: Important Technical Notes for
information on settings etc.)
III: Kit Contents (Continued)
cytoskeleton.com Page 10
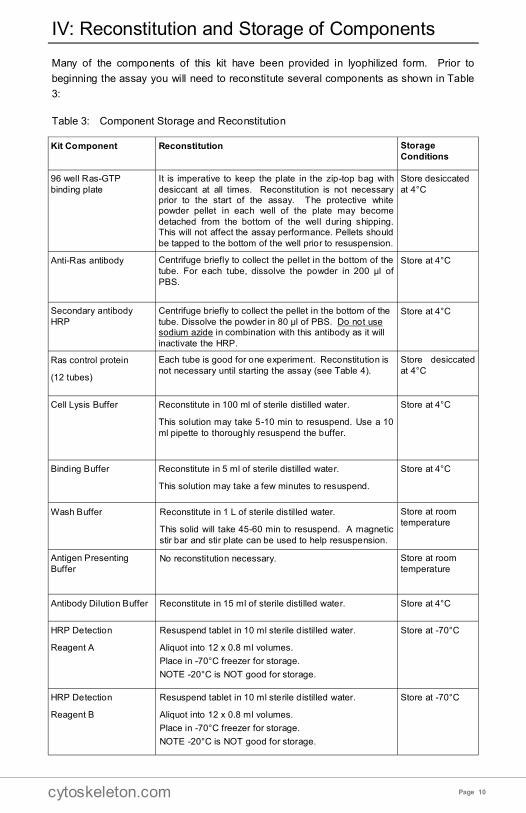
Many of the components of this kit have been provided in lyophilized form. Prior to
beginning the assay you will need to reconstitute several components as shown in Table
3:
Table 3: Component Storage and Reconstitution
Kit Component Reconstitution Storage
Conditions
96 well Ras-GTP
binding plate
It is imperative to keep the plate in the zip-top bag with
desiccant at all times. Reconstitution is not necessary prior to the start of the assay. The protective white powder pellet in each well of the plate may become
detached from the bottom of the well during shipping. This will not affect the assay performance. Pellets should
be tapped to the bottom of the well prior to resuspension.
Store desiccated
at 4°C
Anti-Ras antibody Centrifuge briefly to collect the pellet in the bottom of the
tube. For each tube, dissolve the powder in 200 µl of
PBS.
Store at 4°C
Secondary antibody
HRP
Centrifuge briefly to collect the pellet in the bottom of the
tube. Dissolve the powder in 80 µl of PBS. Do not use sodium azide in combination with this antibody as it will
inactivate the HRP.
Store at 4°C
Ras control protein
(12 tubes)
Each tube is good for one experiment. Reconstitution is
not necessary until starting the assay (see Table 4).
Store desiccated
at 4°C
Cell Lysis Buffer Reconstitute in 100 ml of sterile distilled water.
This solution may take 5-10 min to resuspend. Use a 10
ml pipette to thoroughly resuspend the buffer.
Store at 4°C
Binding Buffer Reconstitute in 5 ml of sterile distilled water.
This solution may take a few minutes to resuspend.
Store at 4°C
Wash Buffer Reconstitute in 1 L of sterile distilled water.
This solid will take 45-60 min to resuspend. A magnetic
stir bar and stir plate can be used to help resuspension.
Store at room
temperature
Antigen Presenting
Buffer No reconstitution necessary. Store at room
temperature
Antibody Dilution Buffer Reconstitute in 15 ml of sterile distilled water. Store at 4°C
HRP Detection
Reagent A
Resuspend tablet in 10 ml sterile distilled water.
Aliquot into 12 x 0.8 ml volumes.
Place in -70°C freezer for storage.
NOTE -20°C is NOT good for storage.
Store at -70°C
HRP Detection
Reagent B
Resuspend tablet in 10 ml sterile distilled water.
Aliquot into 12 x 0.8 ml volumes.
Place in -70°C freezer for storage.
NOTE -20°C is NOT good for storage.
Store at -70°C
IV: Reconstitution and Storage of Components

cytoskeleton.com Page 11
Table 3: Component Storage and Reconstitution (Continued)
IV: Reconstitution and Storage of Components (Continued)
Kit Component Reconstitution Storage Conditions
HRP Stop Solution Carefully add 1 ml of concentrated sulfuric acid (18 M)
to HRP Stop Solution. Check the box on the top of the bottle to indicate acid
has been added. Mix well and store at 4°C.
Store at 4°C
Precision Red™
Advanced Protein
Assay Reagent
No reconstitution necessary. Store at room tem-
perature
(4°C long term)
Protease Inhibitor
Cocktail Reconstitute in 1 ml of dimethyl sulfoxide (DMSO) for
100x stock. Store at 4°C. The
cocktail will freeze at
4°C
cytoskeleton.com Page 12
A) Notes on Updated Manual Version
1) Anti-Ras antibody resuspended in PBS pH 7.4 rather than water.
B) Growth and Treatment of Cell Lines
The health and responsiveness of your cell line is the single most important parameter for
the success and reproducibility of Ras activation assays. Time should be taken to read
this section and to carefully maintain cell lines in accordance with the guidelines given
below.
For Ras activation assays, adherent fibroblast cells such as 3T3 cells should be ready at
50-70% confluency or for non-adherent cells, at approximately 6 x 10⁵ cells per ml (this is
a generally higher confluency than suggested for Rho family proteins that give good
activation results in 3T3 cells at 30-40% confluency). Briefly, cells are seeded at 1 x 10⁵
cells per ml and grown for 3-5 days. Serum starvation (see below) or other treatment
should be performed when cells are approximately 50% confluent. It has been found that
cells cultured for several days (3-5 days) prior to treatment are significantly more
responsive than cells that have been cultured for a shorter period of time. Other cell
types may require a different optimal level of confluency to show maximum
responsiveness to Ras activation. Optimal confluency prior to serum starvation and
induction should be determined for any given cell line (also see Appendix 5 for cell line
specific references).
When possible, the untreated samples should have cellular levels of Ras activity in a
“controlled state”. For example, when looking for Ras activation, the “controlled state”
cells could be serum starved. Serum starvation will reduce the cellular levels of active
Ras and lead to a much greater response to a given Ras activator. The duration of serum
starvation should be evaluated for each cell type.
Cells should also be checked for their responsiveness (“responsive state”) to a known
stimulus. Examples of known Ras stimuli are given in Appendix 5 and include epidermal
growth factor (EGF). In many cases poor culturing technique can result in essentially non
-responsive cells. An example of poor culturing technique includes the sub-culture of
cells that have previously been allowed to become overgrown.
Typically, Ras activation is quite robust but transient in nature (see subheading D in this
section). In the event that you don’t see Ras activation under your experimental
conditions, it is possible to evaluate the cellular response to your Ras activator by probing
your cell lysates for downstream signals. See Appendix 1 for more information.
If you are having difficulty determining a “controlled state” for your experiment then
contact technical assistance at 303-322-2254 or e-mail [email protected].
C) Assay Preparation For G-LISA®
It is critical to get the assay components ready before preparing cell lysates or thawing
previously prepared lysates because the GTP-bound form of Ras is labile and should be
assayed as soon as possible after cell lysate preparation or thawing frozen lysates.
V: Important Technical Notes
cytoskeleton.com Page 13
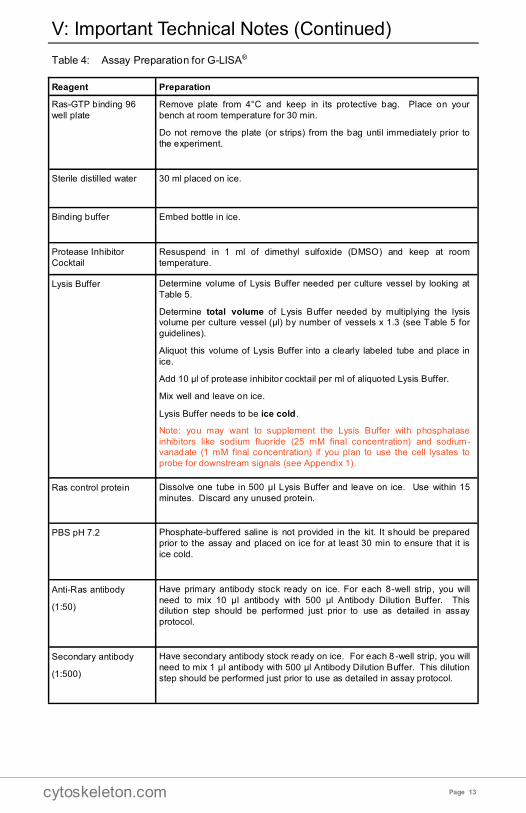
Table 4: Assay Preparation for G-LISA®
V: Important Technical Notes (Continued)
Reagent Preparation
Ras-GTP binding 96
well plate
Remove plate from 4°C and keep in its protective bag. Place on your
bench at room temperature for 30 min.
Do not remove the plate (or strips) from the bag until immediately prior to
the experiment.
Sterile distilled water 30 ml placed on ice.
Binding buffer Embed bottle in ice.
Protease Inhibitor
Cocktail
Resuspend in 1 ml of dimethyl sulfoxide (DMSO) and keep at room
temperature.
Lysis Buffer Determine volume of Lysis Buffer needed per culture vessel by looking at
Table 5.
Determine total volume of Lysis Buffer needed by multiplying the lysis volume per culture vessel (µl) by number of vessels x 1.3 (see Table 5 for
guidelines).
Aliquot this volume of Lysis Buffer into a clearly labeled tube and place in
ice.
Add 10 µl of protease inhibitor cocktail per ml of aliquoted Lysis Buffer.
Mix well and leave on ice.
Lysis Buffer needs to be ice cold.
Note: you may want to supplement the Lysis Buffer with phosphatase
inhibitors like sodium fluoride (25 mM final concentration) and sodium-vanadate (1 mM final concentration) if you plan to use the cell lysates to
probe for downstream signals (see Appendix 1).
Ras control protein Dissolve one tube in 500 μl Lysis Buffer and leave on ice. Use within 15
minutes. Discard any unused protein.
PBS pH 7.2 Phosphate-buffered saline is not provided in the kit. It should be prepared
prior to the assay and placed on ice for at least 30 min to ensure that it is
ice cold.
Anti-Ras antibody
(1:50)
Have primary antibody stock ready on ice. For each 8-well strip, you will
need to mix 10 µl antibody with 500 µl Antibody Dilution Buffer. This dilution step should be performed just prior to use as detailed in assay
protocol.
Secondary antibody
(1:500)
Have secondary antibody stock ready on ice. For each 8 -well strip, you will
need to mix 1 µl antibody with 500 µl Antibody Dilution Buffer. This dilution
step should be performed just prior to use as detailed in assay protocol.

cytoskeleton.com Page 14
Preparation for G-LISA® (Continued)
D) Timing and Intensity of Ras Activation
Upon stimulation, Ras proteins are generally activated very rapidly and transiently.
Maximal activation ranges from 30 s to 30 min and declines thereafter to basal levels.
For potent activators such as EGF, the intensity of maximal Ras activation over “control
state” (serum starved) cells is generally in the order of 2-5 fold. However, using a single
time point you are more likely to miss this maximum activation peak. It is therefore critical
to take timed samples for at least the first experiment with an unknown activating entity.
Recommended time points are 0, 1, 3, 6, 12 and 30 min, which fit nicely into a 6 well
culture plate (the time course is also recommended for Ras inactivation studies).
In practical terms the timed experiment should be performed sequentially. This allows
rapid processing of each single time point. Once one time point lysate is collected, it
should be snap frozen in “experiment sized” aliquots immediately and kept at -70oC. The
G-LISA® kit uses 25 µl of lysate (0.25-1 mg/ml lysate protein concentration) per assay.
We recommend duplicate or triplicate samples per time-point or condition, therefore 60-
100 µl aliquots are recommended for snap freezing.
E) Rapid processing of cells
GTP bound (active) Ras is a labile entity and the bound GTP is susceptible to hydrolysis
by Ras-GAPs during and after cell lysis, resulting in Ras inactivation. Rapid processing at
4°C is essential for accurate and reproducible results. The following guidelines are useful
for rapid washing of cells.
V: Important Technical Notes (Continued)
Reagent Preparation
Antibody Dilution
Buffer Place reconstituted buffer on the bench and use at room temperature.
Wash Buffer Place on the bench and use at room temperature.
Antigen Presenting
Buffer Place on the bench and use at room temperature.
HRP Detection
Reagents A and B
The 0.8 ml aliquots of these reagents can remain at -70°C until secondary
antibody addition as detailed in the assay protocol.
HRP Stop Solution
Make sure that the box on top of the bottle is checked, indicating sulfuric acid
has been added to the solution.
Place the bottle on your bench and allow to warm to room temperature.
Precision Red™
Advanced Protein
Assay Reagent
Place on the bench and use at room temperature.
cytoskeleton.com Page 15
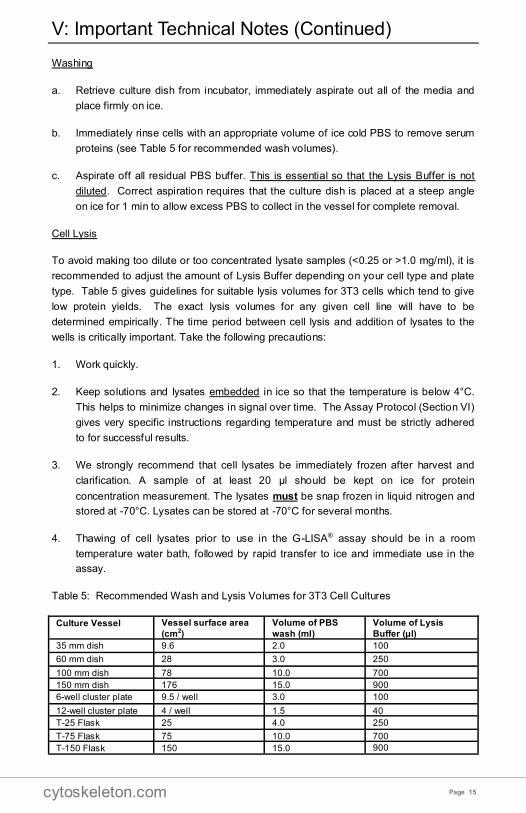
Washing
a. Retrieve culture dish from incubator, immediately aspirate out all of the media and
place firmly on ice.
b. Immediately rinse cells with an appropriate volume of ice cold PBS to remove serum
proteins (see Table 5 for recommended wash volumes).
c. Aspirate off all residual PBS buffer. This is essential so that the Lysis Buffer is not
diluted. Correct aspiration requires that the culture dish is placed at a steep angle
on ice for 1 min to allow excess PBS to collect in the vessel for complete removal.
Cell Lysis
To avoid making too dilute or too concentrated lysate samples (<0.25 or >1.0 mg/ml), it is
recommended to adjust the amount of Lysis Buffer depending on your cell type and plate
type. Table 5 gives guidelines for suitable lysis volumes for 3T3 cells which tend to give
low protein yields. The exact lysis volumes for any given cell line will have to be
determined empirically. The time period between cell lysis and addition of lysates to the
wells is critically important. Take the following precautions:
1. Work quickly.
2. Keep solutions and lysates embedded in ice so that the temperature is below 4°C.
This helps to minimize changes in signal over time. The Assay Protocol (Section VI)
gives very specific instructions regarding temperature and must be strictly adhered
to for successful results.
3. We strongly recommend that cell lysates be immediately frozen after harvest and
clarification. A sample of at least 20 µl should be kept on ice for protein
concentration measurement. The lysates must be snap frozen in liquid nitrogen and
stored at -70°C. Lysates can be stored at -70°C for several months.
4. Thawing of cell lysates prior to use in the G-LISA® assay should be in a room
temperature water bath, followed by rapid transfer to ice and immediate use in the
assay.
Table 5: Recommended Wash and Lysis Volumes for 3T3 Cell Cultures
V: Important Technical Notes (Continued)
Culture Vessel Vessel surface area
(cm2)
Volume of PBS
wash (ml)
Volume of Lysis
Buffer (µl)
35 mm dish 9.6 2.0 100
60 mm dish 28 3.0 250
100 mm dish 78 10.0 700
150 mm dish 176 15.0 900
6-well cluster plate 9.5 / well 3.0 100
12-well cluster plate 4 / well 1.5 40
T-25 Flask 25 4.0 250
T-75 Flask 75 10.0 700
T-150 Flask 150 15.0 900

cytoskeleton.com Page 16
F) Protein Concentration Equivalence
Equal protein concentration in all samples is a prerequisite for accurate comparison
between samples in Ras activation assays. Cell extracts should be equalized with ice
cold Lysis Buffer to give identical protein concentrations. For example, cell lysates of
protein concentrations ranging from 0.3–1.3 mg/ml would all need to be diluted to 0.3 mg/
ml. We highly recommend that the final concentration of equalized lysates lies between
0.25–1 mg/ml. Protein concentrations below 0.25 mg/ml often will not work with sufficient
accuracy to warrant performing the assay. It is not necessary to equalize protein
concentrations if the variation between them is less than 10%.
The Precision RedTM Advanced Protein Assay Reagent (Part # GL50) is included with the
kit in order to measure protein concentration with a rapid one-step procedure. Precision
RedTM Advanced Protein Assay Reagent is ideal for this analysis because it is rapid and
simple to perform. The protein assay can be performed in a 1 ml cuvette format as
described in the Assay Protocol section. Alternatively, a 96-well format can be used
where 10 μl of sample is pipetted into a well followed by the addition of 290 μl of Protein
Assay Reagent. In this case the absorbance reading at 600 nm is multiplied by 3.75 to
obtain the protein concentration in mg/ml (see Appendix 4).
G) Assay Linearity
The assay is linear between 50 pg - 1 ng of bound activated Ras. The positive control
protein is at 0.5 ng, therefore any assay readings that are more than double the positive
control will be out of the linear range of the assay. In such cases you should reduce the
amount of total cell protein per assay. The lower level of detection of the assay is
approximately 10% above the background reading of Lysis Buffer only (0.3– 0.5).
Readings lower than this require increased concentration of cell lysates to give increased
protein per assay. A typical linearity test of the lysate concentration is shown in Figure 3.
Figure 3. Ras activation by EGF measured by G-LISA™.
HeLa cells were serum starved (SS)
for 24 h and treated with EGF (100
ng/ml for 2 min). 25, 12.5, 5, 1.25 µg of cell lysates were subjected to the
G-LISA™ assay. Absorbance was read at 490 nm. Data are
background subtracted.
V: Important Technical Notes (Continued)

cytoskeleton.com Page 17
H) Use of a Multi-channel Pipettor
When processing more than 16 wells, it is imperative to use a multi -channel or multi-
dispensing pipettor with a range of 25 to 200 μl per dispense. Critical steps such as lysate
addition, post-binding wash step and the Antigen Presenting Buffer step all have
requirements for accurate and timely additions. Attempting to perform >16 assays with a
single channel pipettor will also increase the likelihood of allowing wells to dry out before
reagent addition can be completed, resulting in variable signals. Therefore, use a multi-
channel or at least a multi-dispensing pipettor wherever possible. If neither of these
pipettor options is available, we highly recommend that you limit each experiment to a
maximum of 16 wells.
I) Removal of Solutions from Wells
Removal of solutions from the wells is accomplished by turning the plate upside down and
flicking out the well contents into a waste bin. This is followed by patting the plate several
times on a paper towel to get rid of residual solution. It has been found that the complete
removal of solutions from the well requires a vigorous flick of the plate and a vigorous
series of pats onto paper towels (5-7 hard pats). The complete removal of solution from
wells between steps of the G-LISA is very important as it avoids high background
readings in the buffer only wells. The buffer only wells should read between 0.3 – 0.5 at
an absorbance of 490 nm. If background readings are significantly higher then a more
vigorous removal of solutions from the wells may be required. The constitutively active
Ras positive control wells should give a reading between 0.7 – 1.0 (background
subtracted) at an absorbance of 490 nm.
J) Plate Shaker Recommendations
It is recommended to use an orbital plate shaker at 400 rpm. As a back-up you can use a
200 rpm orbital shaking culture incubator or a normal orbital rotating platform. Signals will
be lower with the 200 rpm option.
K) Spectrophotometer Settings
The majority of the work in the design of this assay has been based on the Molecular
Devices SpectraMax 250. The parameters of a protocol file for the instrument are given
below as a reference:
Table 6. Spectrophotometer settings. Please inquire to Technical assistance for help
in setting up other machines (call 303-322-2254 for immediate help, or e-mail
[email protected] for assistance within 24 h).
V: Important Technical Notes (Continued)
Parameters Character Contents
Wavelength 490 nm Bandwidth 2 nm (can be ± 20 nm for filter based machines)
Protocol End point Standard end point assay
Shaking Medium, orbital 5 s
Temperature 24°C Room temperature is also fine for readings
cytoskeleton.com Page 18
It is crucial to the success of this assay that the section entitled “Important
Technical Notes” be read thoroughly and followed accurately. The sign
indicates steps that have particularly critical “Important Technical Notes”. Have
copies of Appendices 2 and 3 ready to fill out as you go through the assay. Filling these
out will be a good reference for you and will help facilitate any questions for technical
support.
To keep the assay in the linear range we highly recommend you titrate the “controlled
cell” (serum starved in most cases) lysate concentration with a G-LISA® assay. Choose
the lysate concentration that gives an OD reading (after buffer blank subtraction) between
0.1-0.5. By doing this, the OD readings of “activated cell” vs. “controlled cell” are more
likely to stay in the linear range.
STEP 1: Assay Preparation
At least one hour prior to beginning the assay, prepare all G-LISA® assay components as
described in Section IV and Section V: Important Technical Notes, Table 4. Use the
check-off list below to confirm that the following reagents are ready:
Ras plate, at room temperature in the desiccant bag □
Wash Buffer, resuspended at room temperature □
Precision RedTM Advanced Protein Assay Reagent, room temperature □
Water, 30 ml, ice cold □
Binding Buffer, ice cold □
HRP Stop Solution, acid added and at room temperature □
Lysis Buffer, ice cold with protease inhibitors (see Table 5) □
PBS, ice cold (see Table 5) □
1.5 ml microfuge tubes, ice cold □
Ras Control Protein, resuspended in Lysis Buffer on ice □
Antibody Dilution Buffer, room temperature □
Ice buckets containing ice □
(it is useful to have a separate ice bucket for cell harvesting)
Cell scraper for cell collection □
Liquid nitrogen for lysate snap freezing lysates □
VI: Assay Protocol
cytoskeleton.com Page 19
STEP 2: Lysate Collection
We strongly recommend that you snap freeze your cell lysates in liquid nitrogen right after
you harvest and clarify. This is especially necessary if you have many samples. It is
recommended to freeze lysates in 100 µl aliquots and to save a small amount of each
lysate (approximately 20 – 30 µl) for protein quantitation.
Cells Grown in Tissue Culture Vessels as Monolayers
1. Grow cells in appropriate culture conditions. It is important to keep cells in a
“controlled state” prior to Ras activation. See Section V (B): Important
Technical Notes.
2. Treat cells with Ras activator (or inactivator) as your experiment requires.
3. After treatment, place culture vessel on ice, aspirate media, wash with ice cold
PBS. See Table 5, Section V for recommended volumes.
4. Aspirate off PBS. Tilt plates on ice for an additional 1 min and re-aspirate all
remnants of PBS. Residual PBS will adversely affect the assay.
5. Lyse cells in an appropriate volume of ice-cold Cell Lysis Buffer. See Table 5,
Section V for recommended volumes.
6. Harvest cell lysates with a cell scraper. It is useful to incline the culture plate for
this method because the Lysis Buffer is spread thinly on the surface.
7. Transfer lysates into the pre-labeled sample tubes on ice.
8. Immediately clarify by centrifugation at 10,000 x g, 4°C for 1 min. (For well
characterized experiments, the clarification step can be omitted).
9. At this point each lysate volume should not exceed 130% of the original Lysis
Buffer volume.
10. Save at least 20 µl of lysate in a clean microcentrifuge tube for protein
quantitation.
11. Aliquot and snap freeze the remaining cell lysates in liquid nitrogen. Store at -
70°C for future use. It is recommended to aliquot into 100 µl volumes per
condition (100 µl is sufficient for triplicate G-LISA assays).
12. Measure lysate protein concentrations.
Add 20 µl of each lysate or Lysis Buffer into disposable 1 ml cuvettes.
Add 1 ml of room temperature Precision RedTM Advanced Protein
Assay Reagent (Part # GL50) to each cuvette.
Incubate for 1 min at room temperature.
VI: Assay Protocol (continued)
cytoskeleton.com Page 20
Blank spectrophotometer with the Lysis Buffer + Protein Assay
Reagent cuvette at 600 nm.
Read absorbance of lysates samples.
Multiply the absorbance by 5 to obtain the protein concentration in
mg/ml (Appendix 4).
13. Move on to next time point or condition and process the lysate as described
above.
14. Calculate how to equalize the cell extracts with ice cold Lysis Buffer to give
identical protein concentrations. It is essential to have equal protein
concentration in each sample for a successful assay. It is also important that
the equalized protein concentration is not higher than 1.0 mg/ml or below 0.25
mg/ml. Specifically, we recommend the final concentration of 1 mg/ml for 3T3
and HeLa cells. It is not necessary to equalize protein concentration if the
sample variation is less than 10%.
The volume of cold cell Lysis Buffer to be added to the more concentrated
samples can be calculated as follows:
Where A is the higher concentration lysates (mg/ml) and B is the concentration
of the most dilute sample (mg/ml)
NOTE: If you have previously titrated the lysate and know the optimal protein
concentration for your G-LISATM, you can calculate and may dilute all the samples to
desired lystate concentration separately before snap freezing. Be aware of the length of
time cell lysates stay on ice (should not exceed 10 min), since Ras GTP hydrolysis will
occur quickly.
VI: Assay Protocol (continued)
A – B
——— x (volume of A) = __________________ µl
B

cytoskeleton.com Page 21
STEP 3: G-LISA® Assay
1. Aliquot 60 µl of Lysis Buffer into a labeled microfuge tube and dilute with 60 µl
of ice cold Binding Buffer, mix well. This is your buffer blank sample. It is
normal for the buffer blank to have a raw reading between 0.3 – 0.5.
2. Resuspend a fresh tube of RSCA (Ras control protein) in 500 µl of Cell Lysis
Buffer (Cat# GL36). Aliquot 6 µl of RSCA into a labeled microfuge tube and
dilute with 54 ul of ice cold Lysis Buffer. Dilute further by adding 60 µl of ice
cold Binding Buffer. Mix well and place on ice. This is your positive control
sample. NOTE: The unused Ras control protein must be discarded as it will
denature. It is normal for the positive control protein to have a reading between
0.7-1.0 (after background subtraction) at an absorbance of 490 nm.
3. Take the Ras-GTP binding plate out of its bag. Gently peel up the seal from the
strips and pull out the number of strips required. Place strips in the extra strip
holder provided, and place on ice. Immediately after removing the strips
needed, put the rest of the plate back in the pouch with desiccant, seal well and
place back in storage.
4. Dissolve the powder in the wells with 100 µl ice cold water, keeping the plate on
ice. NOTE: The protective white powder pellet in each well of the plate may
become detached from the bottom of the well during shipping. This will not
affect the assay performance. Pellets should be tapped to the bottom of the well
prior to resuspension.
5. Thaw the snap frozen cell lysates in a ROOM TEMPERATURE water bath.
Immediately place on ice after they are thawed.
6. Based on the calculation of equalization, add required amount of Lysis Buffer to
respective tubes to equalize all lysate concentration.
Note: It is recommended to calculate the dilution factors required BEFORE
thawing out lysates as this allows rapid sample processing.
7. Immediately aliquot sufficient lysate for duplicate (60 µl) or triplicate (90 µl)
assays into fresh ice cold microcentrifuge tubes.
8. Add an equal volume of ice-cold Binding Buffer to each tube. Mix well, keep on
ice.
9. Completely remove the water from the microplate wells as follows:
Complete removal of solutions from the well requires a vigorous flick of the
plate and a vigorous series of pats onto paper towels (5-7 hard pats). The
complete removal of solution from wells between steps of the G-LISA is very
important as it avoids high background readings in the buffer only wells. The
buffer only wells should read between 0.3 – 0.5 at an absorbance of 490 nm. If
background readings are higher then a more vigorous removal of solutions from
VI: Assay Protocol (continued)
cytoskeleton.com Page 22
the well should be practiced. The RSCA positive control wells should read
between 0.7 – 1.0 (after subtraction of Blank) at an absorbance of 490 nm.
10. Put plate back on ice.
11. Immediately add 50 µl of equalized cell lysate to duplicate or triplicate wells.
12. Pipette 50 µl of buffer blank control into duplicate wells.
13. Pipette 50 µl of Ras positive control into duplicate wells.
14. Immediately place the plate on a cold orbital microplate shaker (400 rpm
recommended, 200 rpm minimum) at 4°C for exactly 30 min.
NOTE: An ORBITAL microplate shaker set to a minimum of 200 rpm must be used.
Slower shakers or rockers will not be sufficient.
15. During the incubation, dilute the anti-Ras primary antibody to 1/50 in Antibody
Dilution Buffer by adding 10 µl of antibody to every 500 µl Antibody Dilution
Buffer. Note: The final volume of 500 µl is adequate for one strip (8 wells).
16. After 30 min, flick out the solution from the wells and wash twice with 200 µl
Wash Buffer at room temperature using a multi-channel pipettor. Do not leave
this plate unattended at this time. Vigorously remove the Wash Buffer after
each wash by flicking and patting the plate as detailed in step 9.
17. Place plate on the bench.
18. Immediately pipette 200 µl of room temperature Antigen Presenting Buffer
into each well using a multi-channel pipettor and incubate at room
temperature for exactly 2 min.
19. Vigorously flick out the Antigen Presenting Buffer, patting the inverted plate 5-7
times on a stack of paper towels as outlined in step 9.
20. Immediately wash the wells three times with 200 µl of room temperature Wash
Buffer. Vigorously remove Wash Buffer after each wash as detailed in step 9.
21. Add 50 µl of diluted anti-Ras primary antibody to each well and leave the plate
on the orbital microplate shaker (200-400 rpm) at room temperature for 45 min.
22. During the primary antibody incubation, dilute the secondary HRP labeled
antibody to 1/500 in Antibody Dilution Buffer by adding 1 µl of antibody to every
500 µl Antibody Dilution Buffer. Note: The final volume of 500 µl is adequate
for one strip (8 wells).
23. Vigorously flick out the anti-Ras primary antibody, patting the inverted plate 5-7
times on a paper towel as outlined in step 9.
VI: Assay Protocol (continued)
cytoskeleton.com Page 23
24. Immediately wash the wells three times with 200 µl of room temperature Wash
Buffer. Vigorously remove Wash Buffer after each wash as detailed in step 9.
25. Add 50 µl of diluted Secondary antibody to each well and leave the plate on a
microplate shaker (200–400 rpm) at room temperature for 45 min.
26. During the secondary antibody incubation thaw HRP detection reagents A and B in a
room temperature water bath and remove as soon as they are thawed. Components
A and B should be mixed in equal volumes immediately prior to use. Unused mixed
solution should be discarded.
27. Immediately prior to the end of the secondary antibody incubation, mix HRP
detection reagents A and B in equal volumes.
28. Vigorously flick out the secondary antibody, patting the inverted plate 5-7 times on a
paper towel as outlined in step 9.
29. Wash the wells three times with 200 µl of Wash Buffer, patting the inverted plate 5-7
times on a paper towel as outlined in step 9.
30. Pipette 50 µl of the mixed HRP detection reagent into each well and incubate at
room temperature for 15 min.
31. Add 50 µl of HRP Stop Buffer to each well.
32. Check that the wells are free of bubbles; if bubbles form, they must be removed prior
to continuing.
33. Read the signal by measuring absorbance at 490 nm using a microplate
spectrophotometer as described in Section V: Important Technical Notes. Designate
Lysis Buffer only wells as the assay Blank.
VI: Assay Protocol (continued)

cytoskeleton.com Page 24
1. It is recommended to use the Lysis Buffer wells as reference blanks in all studies
with this kit. Based on the operator designating the appropriate wells, most
machines have associated protocols that perform this operation automatically. Call
Technical Help for the company supplying the plate reader for information on how to
perform this function. When the data are “Lysis Buffer subtracted” (Lysis Buffer only
samples have been allocated as Blanks in the assay), then you can import them into
a simple graph software like Excel or Sigma Plot. Alternatively, the Lysis Buffer
background can be subtracted manually or in the spreadsheet application.
2. Data should be arranged in columns where the headings are “Sample”, “Mean”,
“Standard Deviation”, “rep1”, “rep2”, “rep3” and “rep4” for the number of replicates
performed on each sample. E-mail [email protected] or visit
www.cytoskeleton.com for a free Excel Template.
3. List your samples under the “Sample” column in the same order that they were
assayed in the plate.
4. Enter the following formula into the first sector under “Mean”, “=average(Xn:Yn)”
where X = the column designator for “rep1”, Y = column designator for “rep4”, and
n= row designator of the row that you are working on. Repeat for each sector under
the “Mean” header until there are sufficient rows to cover the number of samples in
your experiment.
5. Enter the following formula into the first sector under “Standard Deviation”, “=stdev
(Xn:Yn)” where X = the column designator for “rep1”, Y = column designator for
“rep4”, and n= row designator of the row that you are working on. Repeat for each
sector under the “Standard Deviation” header until there are sufficient rows to cover
the number of samples in your experiment.
6. Enter your replicate data into rep1, rep2 etc. It doesn’t matter if you only have
duplicates because the program will ignore any sectors that do not contain data. The
program will calculate the Mean and Standard Deviation of your replicates.
7. When the data has been entered select the Sample, Mean and Standard Deviation
data sectors by the click and drag method. Then select the chart making function, in
Excel this looks like a clickable square with a mini-bar chart inside. This will guide
you through the chart making process with the data you have selected. Choose
“column chart” initially, designate the Mean numbers for input values. The Standard
Deviation column for the y-axis error bars needs to be designated after the Mean
numbers chart is made. This is achieved by double clicking on the graph bars, and
selecting the “Y-axis error” tab, then entering the location of the Standard Deviation
data by clicking the “Custom” option and selecting the area in the worksheet. E-mail
[email protected] for a free Excel Template. An example of a typical
Excel layout and data plot is shown in Figures 4 and 5.
VII: Data Analysis

cytoskeleton.com Page 25
Ras activation by EGF measured by G-
LISA™. HeLa cells were serum starved
for 24 hours and treated with EGF (100
ng/ml for 2 min). 25 µg of cell lysates were
subjected to the G-LISA™ assay.
Absorbance was read at 490 nm. Data
are background subtracted.
Note: Refer to our website for timely updates on technical tips for G-LISATM assays.
VII: Data Analysis (Continued)
Figure 5: Typical G-LISA®
Results Figure 4: Typical Excel Layout
cytoskeleton.com Page 26
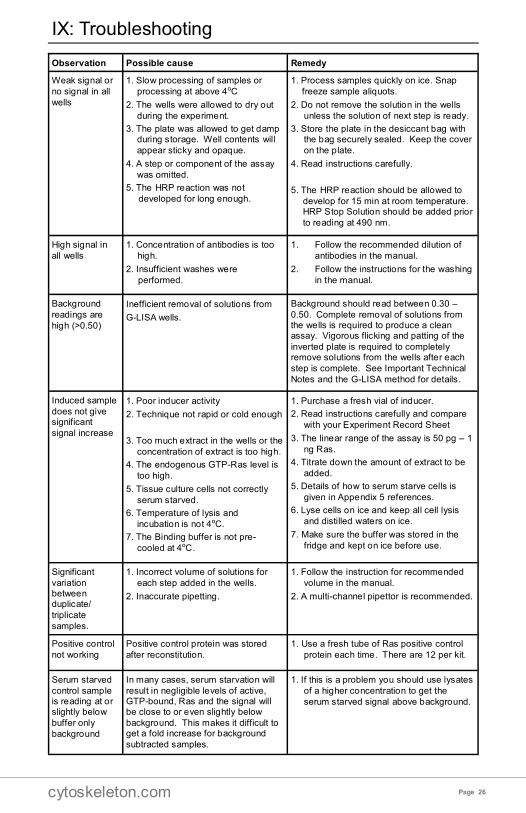
IX: Troubleshooting
Observation Possible cause Remedy
Weak signal or
no signal in all
wells
1. Slow processing of samples or
processing at above 4oC
2. The wells were allowed to dry out
during the experiment.
3. The plate was allowed to get damp during storage. Well contents will
appear sticky and opaque.
4. A step or component of the assay
was omitted.
5. The HRP reaction was not
developed for long enough.
1. Process samples quickly on ice. Snap
freeze sample aliquots.
2. Do not remove the solution in the wells
unless the solution of next step is ready.
3. Store the plate in the desiccant bag with the bag securely sealed. Keep the cover
on the plate.
4. Read instructions carefully.
5. The HRP reaction should be allowed to
develop for 15 min at room temperature. HRP Stop Solution should be added prior
to reading at 490 nm.
High signal in
all wells
1. Concentration of antibodies is too
high.
2. Insufficient washes were
performed.
1. Follow the recommended dilution of
antibodies in the manual.
2. Follow the instructions for the washing
in the manual.
Background
readings are
high (>0.50)
Inefficient removal of solutions from
G-LISA wells.
Background should read between 0.30 –
0.50. Complete removal of solutions from the wells is required to produce a clean assay. Vigorous flicking and patting of the
inverted plate is required to completely remove solutions from the wells after each
step is complete. See Important Technical
Notes and the G-LISA method for details.
Induced sample
does not give significant
signal increase
1. Poor inducer activity
2. Technique not rapid or cold enough
3. Too much extract in the wells or the
concentration of extract is too high.
4. The endogenous GTP-Ras level is
too high.
5. Tissue culture cells not correctly
serum starved.
6. Temperature of lysis and
incubation is not 4oC.
7. The Binding buffer is not pre-
cooled at 4oC.
1. Purchase a fresh vial of inducer.
2. Read instructions carefully and compare
with your Experiment Record Sheet
3. The linear range of the assay is 50 pg – 1
ng Ras.
4. Titrate down the amount of extract to be
added.
5. Details of how to serum starve cells is
given in Appendix 5 references.
6. Lyse cells on ice and keep all cell lysis
and distilled waters on ice.
7. Make sure the buffer was stored in the
fridge and kept on ice before use.
Significant
variation between duplicate/
triplicate
samples.
1. Incorrect volume of solutions for
each step added in the wells.
2. Inaccurate pipetting.
1. Follow the instruction for recommended
volume in the manual.
2. A multi-channel pipettor is recommended.
Positive control
not working
Positive control protein was stored
after reconstitution.
1. Use a fresh tube of Ras positive control
protein each time. There are 12 per kit.
Serum starved
control sample is reading at or slightly below
buffer only
background
In many cases, serum starvation will
result in negligible levels of active, GTP-bound, Ras and the signal will be close to or even slightly below
background. This makes it difficult to get a fold increase for background
subtracted samples.
1. If this is a problem you should use lysates
of a higher concentration to get the
serum starved signal above background.
cytoskeleton.com Page 27
Section X: References
1. Castellano, E. & Santos, E. 2011. Functional specificity of Ras isoforms: So similar
but so different. Genes & Cancer. 2, 216-231.
2. Bourne, H.R., Sanders, D.A. & McCormick, F. 1990. The GTPase superfamily: a
conserved switch for diverse cell functions. Nature. 348, 125-132.
3. Milburn, M.V. et al. 1990. Molecular switch for signal transduction: structural
differences between active and inactive forms of proto-oncogenic ras proteins.
Science. 247, 939-945.
4. Schlichting, I. et al. 1990. Time-resolved conformational change in Ha-Ras p21
protein on GTP hydrolysis. Nature. 345, 309-315.
5. Fernandez-Medarde, A. & Santos, E. 2011. Ras in cancer and developmental
diseases. Genes & Cancer. 2, 344-358.
6. De Rooij, J. & Bos, J.L. 1997. Minimal Ras-binding domain of Raf1 can be used as
an activation-specific probe for Ras. Oncogene. 14, 623-625.
7. Herrmann, C., Martin, G.A. & Wittinghofer, J. 1995. Quantitative analysis of the
complex between p21ras and the Ras-binding domain of the human Raf-1 protein
kinase. J. Biol. Chem. 270, 2901-2905.
8. Taylor, S.J., Resnick R.J. & Shalloway, D. 2001. Nonradioactive determination of
Ras-GTP levels using activated ras interaction assay. Method Enzymol. 333, 333-
342.

cytoskeleton.com Page 28

cytoskeleton.com Page 29
If the G-LISA results suggest that there was no apparent activation of Ras under your
assay conditions, it may be worth conducting another experiment to probe the cell lysates
for signals downstream of Ras. There are generally two scenarios where this could
happen. It should be possible to resolve this issue in both scenarios by probing for
downstream signals in the cell lysates while optimizing the conditions of cell growth or
treatment. It is important, however, that your cell lysates were prepared using Lysis
Buffer that contains both protease inhibitors and phosphatase inhibitors such as NaF (25
mM) and sodium vanadate (1 mM).
Scenario 1: Both the “controlled” state and “responsive” state cell lysates are giving high
absorbance readings relative to the background wells and they are not significantly
different from each other.
Typically this means you need to optimize the conditions for your controlled state,
which may mean optimizing your serum starvation conditions depending on your
experimental design
Consider running a Western blot to probe for signals downstream of Ras while
varying your serum starvation conditions (or other conditions if relevant). When you
have found growth conditions that minimize the basal level of Ras pathway activation
as determined by the downstream signal, repeat your original experiment.
Scenario 2: Both the “controlled” state and “responsive” state cell lysates are giving
roughly equal absorbance readings to the background wells.
Results of this nature can occur for several reasons, some of which are listed in the
Troubleshooting section. Other reasons include…
1. You’ve missed the optimal window for Ras activation by your chosen stimulus.
Ras activation can be very transient and you may have missed the peak
activation timepoint when preparing your cell lysates.
2. Your Ras activator is not biologically active. The “controlled” state of the cells is
excellent, but your cells are not responding to the non-functional Ras activator
3. Your Ras activator does not work in the cell type you’ve chosen.
Consider running a Western blot to probe for signals downstream of Ras while
varying your activation conditions. When you have found growth conditions that
maximize Ras pathway activation as determined by the downstream signal, repeat
your original experiment.
See the next page for antibody recommendations to probe your cell lysates for Ras
Appendix 1: Evaluating the “controlled” and
“responsive” state of the cells
cytoskeleton.com Page 30
downstream signaling
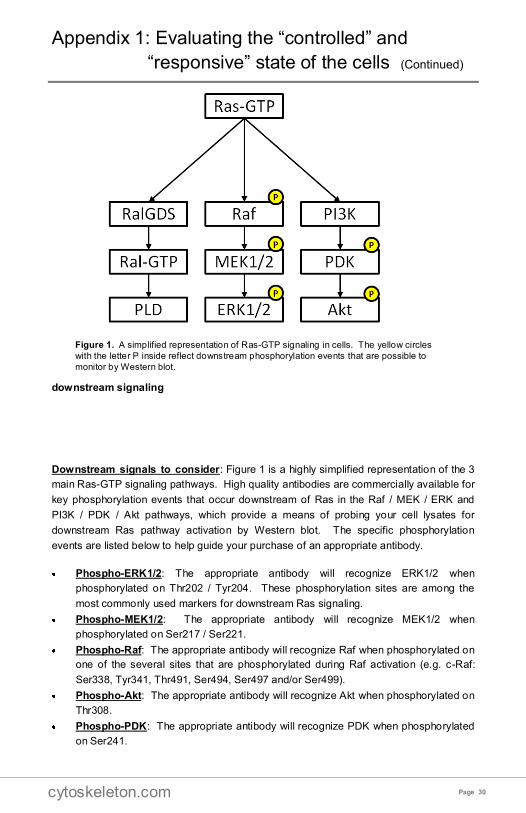
Downstream signals to consider: Figure 1 is a highly simplified representation of the 3
main Ras-GTP signaling pathways. High quality antibodies are commercially available for
key phosphorylation events that occur downstream of Ras in the Raf / MEK / ERK and
PI3K / PDK / Akt pathways, which provide a means of probing your cell lysates for
downstream Ras pathway activation by Western blot. The specific phosphorylation
events are listed below to help guide your purchase of an appropriate antibody.
Phospho-ERK1/2: The appropriate antibody will recognize ERK1/2 when
phosphorylated on Thr202 / Tyr204. These phosphorylation sites are among the
most commonly used markers for downstream Ras signaling.
Phospho-MEK1/2: The appropriate antibody will recognize MEK1/2 when
phosphorylated on Ser217 / Ser221.
Phospho-Raf: The appropriate antibody will recognize Raf when phosphorylated on
one of the several sites that are phosphorylated during Raf activation (e.g. c-Raf:
Ser338, Tyr341, Thr491, Ser494, Ser497 and/or Ser499).
Phospho-Akt: The appropriate antibody will recognize Akt when phosphorylated on
Thr308.
Phospho-PDK: The appropriate antibody will recognize PDK when phosphorylated
on Ser241.
Appendix 1: Evaluating the “controlled” and
“responsive” state of the cells (Continued)
Figure 1. A simplified representation of Ras-GTP signaling in cells. The yellow circles
with the letter P inside reflect downstream phosphorylation events that are possible to
monitor by Western blot.

cytoskeleton.com Page 31
Scientist Name ………………………………….
Contact Tel. # ………………………………….
e-mail ………………………………….
Kit Cat. # / Lot # ………………………………….
STEP Comments or Changes
1. Type of cells or tissue ………………………………………………………
2. How were the cells prepared prior to lysis? ……………………. days in culture
…………………...% confluency
…………………… inducer
………...mg/ml of protein in lysate
3. How long were the ice cold solutions on ice before lysis? ……………….. Min
4. Time that cultures were removed from incubator? ………………. am or pm
5. Was Binding Buffer added? ……………….. Y or N
6. Time that binding reactions were placed on the shaker? ……………….. am or
pm
7. Did you add 50 µl of extract per well? ……………….. Y or N
8. What locations are the 50 µl Lysis Buffer controls? ………………. Wells
9. What speed and time was the shaking for the binding reaction? …… rpm ………min
10. How long did you wait after the post-binding wash step? ………………. s or min
11. What was the time when the anti-Rho primary antibody reaction was started? .am or
pm
12. What was the time when the Secondary antibody reaction was started?........... am or
pm
13. What was the time when detection reagent was added? ………..… am or pm
14. What was the time when the plate was read? ………….. am or pm
Appendix 2: Experiment Record Sheet
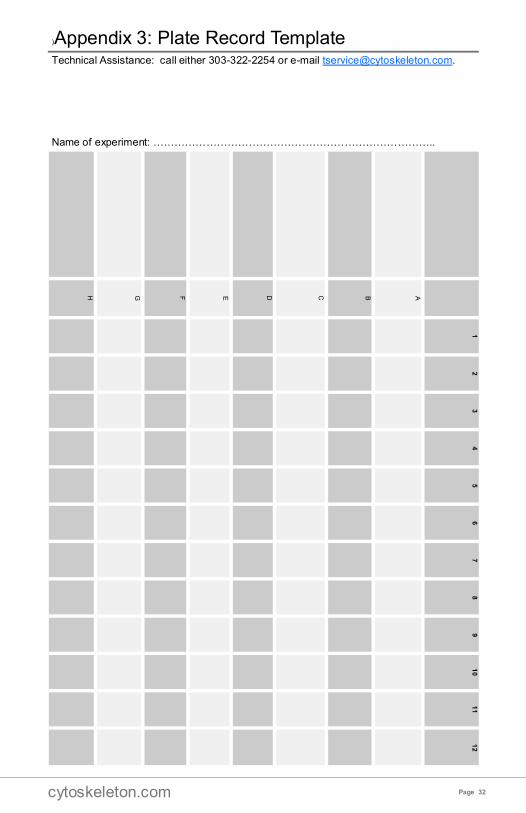
cytoskeleton.com Page 32
Technical Assistance: call either 303-322-2254 or e-mail [email protected].
Name of experiment: ……………………………………………………………………..
1
2
3
4
5
6
7
8
9
10
11
12
A
B
C
D
E
F
G
H
)Appendix 3: Plate Record Template

cytoskeleton.com Page 33
Date of experiment: ………………………………………………………………………
Technical Assistance: call either 303-322-2254 or e-mail [email protected]
Background
The Precision Red Advanced Protein Assay Reagent is a simple one step procedure that
results in a red to purple/blue color change characterized by an increase in absorbance at
600 nm. The reagent is supplied in this kit as Part # GL50. It is also sold separately as
Cat. # ADV02.
The assay exhibits low variance in readings between different proteins of the same
concentration and high reproducibility of the colorimetric response. This allows one to
utilize a generally applicable standard curve (Fig. 1) for protein quantitation. The assay
can also be performed in approximately 1-2 minutes. These properties are particularly
valuable when applied to the labile lysates required for G-LISA assays.
Quick Protein Concentration Method for 1 ml Cuvette (recommended)
Add 20 µl of each lysate or Lysis Buffer into disposable 1 ml cuvettes.
Add 1 ml of Precision RedTM Advanced Protein Assay Reagent (Part # GL50) to
each cuvette.
Incubate for 1 min at room temperature.
Blank spectrophotometer with 1 ml of GL50 plus 20 µl of Lysis Buffer at 600 nm.
Read absorbance of lysate samples.
Multiply the absorbance by 5 to obtain
the protein concentration in mg/ml
Fig. 1: Standard Curve for Protein
Quantitation in a 1ml Cuvette
Legend: The standard curve shown in Fig. 1
represents the average absorbance reading
of several common proteins (e.g., actin, BSA,
casein) measured in a 1 ml cuvette format
using 1 ml of GL50 reagent. The protein
reading pathlength for a cuvette is 1 cm. Linear range of this assay is 0.05 - 0.6.
Example Calculation
Assume a 20 µl sample of cell lysate added to 1 ml of GL50 gives an absorbance reading
of 0.1.
C = A = 0.1 x 50 = 0.5 mg/ml
ε x l 10 x 1
Where c = protein concentration (mg/ml), A = absorbance reading, l = pathlength (cm),
ε = extinction coefficient ([mg/ml]-1 cm-1) and the multiplier of 50 is the dilution factor for
the lysate in GL50 (20 µl lysate in 1 ml GL50).
Appendix 4: Protein Quantitation (with Precision Red Reagent)
cytoskeleton.com Page 34
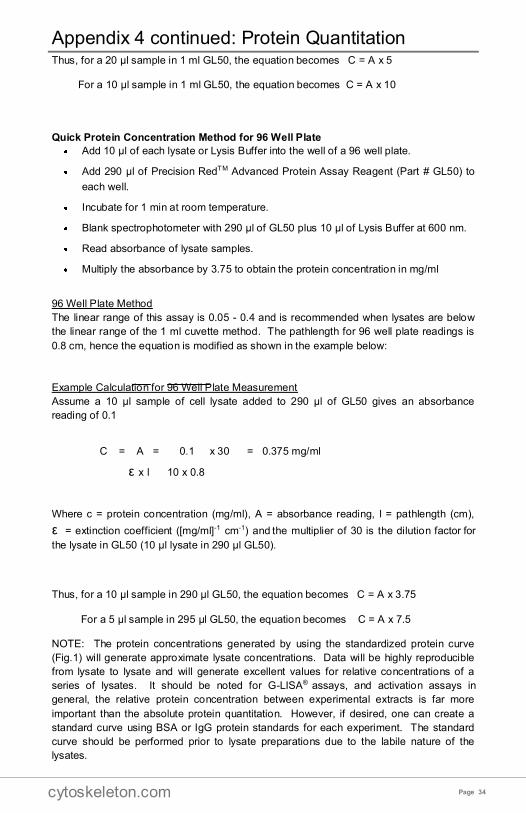
Thus, for a 20 µl sample in 1 ml GL50, the equation becomes C = A x 5
For a 10 µl sample in 1 ml GL50, the equation becomes C = A x 10
Quick Protein Concentration Method for 96 Well Plate
Add 10 µl of each lysate or Lysis Buffer into the well of a 96 well plate.
Add 290 µl of Precision RedTM Advanced Protein Assay Reagent (Part # GL50) to
each well.
Incubate for 1 min at room temperature.
Blank spectrophotometer with 290 µl of GL50 plus 10 µl of Lysis Buffer at 600 nm.
Read absorbance of lysate samples.
Multiply the absorbance by 3.75 to obtain the protein concentration in mg/ml
96 Well Plate Method
The linear range of this assay is 0.05 - 0.4 and is recommended when lysates are below
the linear range of the 1 ml cuvette method. The pathlength for 96 well plate readings is
0.8 cm, hence the equation is modified as shown in the example below:
Example Calculation for 96 Well Plate Measurement
Assume a 10 µl sample of cell lysate added to 290 µl of GL50 gives an absorbance
reading of 0.1
C = A = 0.1 x 30 = 0.375 mg/ml
ε x l 10 x 0.8
Where c = protein concentration (mg/ml), A = absorbance reading, l = pathlength (cm),
ε = extinction coefficient ([mg/ml]-1 cm-1) and the multiplier of 30 is the dilution factor for
the lysate in GL50 (10 µl lysate in 290 µl GL50).
Thus, for a 10 µl sample in 290 µl GL50, the equation becomes C = A x 3.75
For a 5 µl sample in 295 µl GL50, the equation becomes C = A x 7.5
NOTE: The protein concentrations generated by using the standardized protein curve
(Fig.1) will generate approximate lysate concentrations. Data will be highly reproducible
from lysate to lysate and will generate excellent values for relative concentrations of a
series of lysates. It should be noted for G-LISA® assays, and activation assays in
general, the relative protein concentration between experimental extracts is far more
important than the absolute protein quantitation. However, if desired, one can create a
standard curve using BSA or IgG protein standards for each experiment. The standard
curve should be performed prior to lysate preparations due to the labile nature of the
lysates.
Appendix 4 continued: Protein Quantitation
cytoskeleton.com Page 35
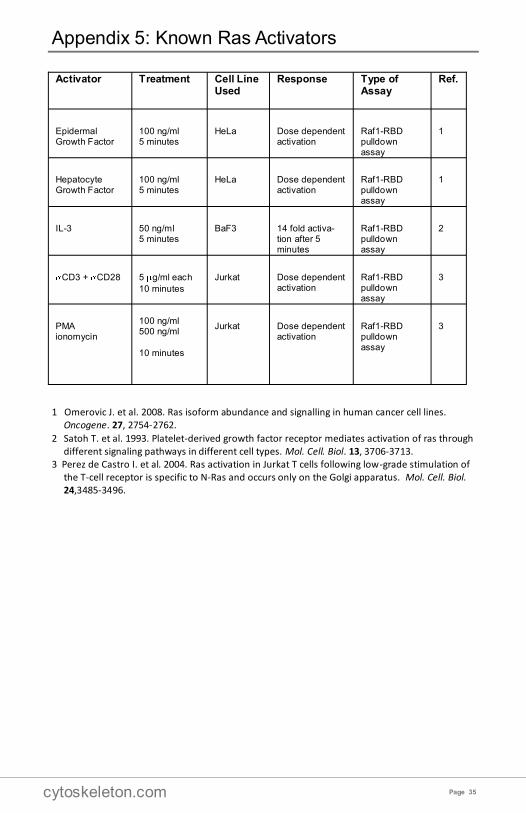
1 Omerovic J. et al. 2008. Ras isoform abundance and signalling in human cancer cell lines. Oncogene. 27, 2754-2762.
2 Satoh T. et al. 1993. Platelet-derived growth factor receptor mediates activation of ras through different signaling pathways in different cell types. Mol. Cell. Biol. 13, 3706-3713.
3 Perez de Castro I. et al. 2004. Ras activation in Jurkat T cells following low-grade stimulation of the T-cell receptor is specific to N-Ras and occurs only on the Golgi apparatus. Mol. Cell. Biol. 24,3485-3496.
Appendix 5: Known Ras Activators
Activator Treatment Cell Line Used
Response Type of Assay
Ref.
Epidermal Growth Factor
100 ng/ml 5 minutes
HeLa Dose dependent activation
Raf1-RBD pulldown assay
1
Hepatocyte Growth Factor
100 ng/ml 5 minutes
HeLa Dose dependent activation
Raf1-RBD pulldown assay
1
IL-3 50 ng/ml 5 minutes
BaF3 14 fold activa-tion after 5 minutes
Raf1-RBD pulldown assay
2
CD3 + CD28 5 g/ml each
10 minutes
Jurkat Dose dependent activation
Raf1-RBD pulldown assay
3
PMA ionomycin
100 ng/ml 500 ng/ml
10 minutes
Jurkat Dose dependent activation
Raf1-RBD pulldown assay
3

cytoskeleton.com Page 36
NOTES:

cytoskeleton.com Page 37
NOTES:

cytoskeleton.com Page 38
NOTES:

cytoskeleton.com Page 39

cytoskeleton.com Phone: (303) 322.2254 Fax: (303) 322.2257
Customer Service: [email protected]
Technical Support: [email protected]


![Research Article EVALUATION OF ANTI-INFLAMMATORY … · Percentage inhibition= [(absorbance of blank – absorbance of sample)/(absorbance of blank)]×100 1 In-vitro anti-inflammatory](https://img.pdfslide.us/doc/110x75/5e832a1607bd17145979ab05/research-article-evaluation-of-anti-inflammatory-percentage-inhibition-absorbance.jpg)