Embed Size (px)
Citation preview
AD-AO91 813 VIRGINIA COMMONWEALTH UNI ' RICHMOND
DEPT OF BIOPHYSICS F G 6/18
INVESTIGATION OF THE BIOLOGICAL EFFECTS OF PULSED ELECTRICAL FI-ETC(U)JAN 77 S F CLEARY. R HOFFMAN, L LIU NOOOIN7-TS.336
UNCLASSIFIED ML
EmmnmhhmhuEEE ,hhEhEmllllillnhUhlEEnnnnEEmhnmmI

liz iS 125 M14
MICROCOPY RESOLUTION TEST CHARTNATIONAL BUREAU OF STANDARDS-1963-A

CONTRACT N 4
ANNUA I., GES, R PORT
REPORT I'TBER 2
(CI INVESTIGATION OF THE BIOLOGCA EFFECTS
OF PULSED ELECTRICAL FIELDS.
'-'N
II
.- 1 M-ITTED BY:
O"\ / : S. F. Cleary R./Hoffutan,4 L. /Liu /Departnrnt of Bi6phys4.cs
Lyirginia Coinonwealth UniversityRichmond, Virgiiiia Z22Z
SUBMITTED TO:
Physiology ProgramOffice of Naval Research
Department of the NavyArlington, Virginia 22217
- - -77
Feb 76- -, 1677 .
LA-I
s. -*-,*.

I. INTRODUi-TION:
Research conducted during the past contract period has involved an exten-
sion of an investigation of the physiological effects of exposure of Dutch
rabbits to electromagnetic pulse (EMP) fields and the development of in vitro
biological model systems to investigate the physico-chemical effects of transient
electrical and electromagnetic -fields. Physiological studies performed during
this period have included: 1) a continuation of a study of the effect of EM,
exposure on sodium pentobarbital-induced sleeping time in the Dutch rabbit
which was initiated during the previous contract year; 2) investigation of
EMP and heat stress effects on rabbit serum chemistry; 3) electromagnetic
pulse effects on serum triglyceride levels and, 4) alterations in creatine
phosphokinase (CPK) isoenzyme levels induced by EK1P and nonradiation heat-
stress exposures. Model systems used to investigate the mechanisms of
interaction of transieLL electric and electromagnetic fields included arti-
ficial bilayer lipid membranes and mamialian erythrocyccs. The dependent
variables for the in vitro studies included dielectric breakdown and po-
tassium and hemoglobin membrane permeabilities. The independent variables
were voltage field strength, pulse duration, and exposure duration. Analysis
of data from the in vitro studies has led to the formulation of a preliminary
theoretical model for voltage-induced transient alterations in cell membrane
permeability.
II. IN VIVO STUDIES OF EMP FFFECTS IN TUE DUTCH RABBIT.
The almost total lack of data regarding the biological effects of exposure
to EMP fields dictated the need to screen for various types of physiological
alterations in mammalian systems. The Dutch rabbit was chosen for this study
based on the availability of extensive data on the response of this species to
'C.A.

maicrowave radia:ioii. The results of EM? expos-ure may be qUalitaltively and.
quantiz:ativelv compared to thc! effects of micrownve exposure, thus providing
a 1-B-zi fzar an evaluation o" --he relative biological effects of these radiation
::.-S. - .ie raabit is also a nractical choice for this study since the total
blood -:olu-e of this spcs large enough to permit serial serum samples
drawn frz'r serum and enzymie determinations.
tfc-ct of FYP Expos-2re on Drug-induced Sleeping Time.
In previousz stud_-.cz5 of the effects of 2.45 and 1..7 Cliz microwave exposure
" ave detectc-' sig-' ~ cant docreases in the man duration of sodium pento-
Zar f I- ind U Ced s I D C; t ine ii i th e Du tch rabb it expos ed t o r ad iatLion intEn s :~ Liv s
of rTLa 5 to 50 =W:,'ccr (1). In contratit to. these findinigs, the initia stUdic.S
0f-e effects of E" a..aosure at 1.9 KV/cm and 24 11z or 1.4 KV/cni and 10 1"Z
no c re -i ~ the duration of sodiumi pentobarhital sleeping ti:-e i
-- !,I)it . In faz:., ':hi! Cata sugge'sted thie possibiliLy of an increase i~n
so~:ngtim, -sars-Alt of exposure to thme JO liz El11' fields, (2). In on>,1.r
-:3 obtain more ee:.:edata on this respo-ise variable, additional sleepingc
tine experir :nts w~cconducted during this; reporting period. The technique.;
L.saf which have hen reviously described in detail (1,2), consisted of detcr:2.,ining;
the =aan duraticn of SleePfng (i.e. duration of the loss of the righitig reflex:
in ani-.als anesthetizc& '~- 22 mg/kg of sodium pentob~arbital by int ravenoiis
injectilon inothe rar-Iinal ear vein, followed by either shami irrodiation or exIpo.'ure
to an D? fi*eld of 0.9 Kl/cn at a pulse ropetition rate (PRF) of 30 1lf . D11C, to thr'
operating characteristics of tho IP simulator, it was not possible to dupi -icate
the 1.4 KV/cm, 10 11Z eXPOSUre conditions.
The results of sham or EN? exposure under these conditions are summnari.zed In
Table 1. The mean sleeping time and standard error of the mean for five Dlutch
rabbits exposed to the FDIP field were 63 + 9.9 min. Vhc corrspodi ung va I ics for
the sham-exposed1 eont.rol group were 62./4 + 6. 7 min. Th 11.data
-2

TABLE 1
Effect of Electromagnetic Pulse Exposure onSodium Pentobarbital Induced Sleeping Time inthe Dutch Rabbit. Pulser Voltage 0.9kV/cni&PuiseRepetition Rate 10 11z.
Sham Irradiated Controls EM F-%p,,ed
Sleeping Time Rectal Temp. Sleeping Time Rectal Temp.
(min) Change (ATOC) (min) Chanpe (ATOC)
55 -1.8 44 -1.0
53 -0.6 101 -0.9
52 -1.6 51 -0.9
64 -0.9 59 -0.3
88 -0.1 60 -0.6
Sample meani 62.4 -1.00 63.0-07
Std. dev. 15.08 0.70 22.21 0.29
Std. error 6.73 0.31 9.92 0.13
Acces'ofl For-
IITIS ntCTIC TI1 -Ic
C.tl
c
Coo
3-

do not, therefore,provide any evidence of an alteration in sleeping time
resulting from EIMP exposure. This result is not inconsistent with the results
obtained in studies of the effects of microwave exposure on sleeping time.
The statistically significantreduction in the mean duration of pentobarbital
sleeping time consequent to microwave exposure is assumed to be an indirect effect.
of low-level microwave-induced thermal stress, leading to redistribution of
the drug from the brain to other body compartments due to increased circulation.
The reduction in sleeping time in animals exposed -o microwave radiation was,
in general, correlated with an increase in rectal temperature, thus suLggesting
the involvement of thermal stress. In the case of EIT exposure, the mean and standard
error of the mean rectal temperature were -0.84 + 0.13°C for the exposed animals
and -1.00 + 0.310 C for sham irradiated controls. Thus, there was no evidence
of thermal strcss from EI4P exposure of the type employed in this study. If
the observed reduction of sleeping timen following microwave exposure is due
to thermnalllyztlrulated drug redistribution, it is not surprising that E'
exposure did not detectably alter this response variable.
Effect of EMI on Rabbit Serum Chemistry:
In view of the fact that physiological stresses of various kinds arc known
to result in alterations in serum components, a study was undertaken of the
effects of acute exposure of Dutch rabbits to EP fields on the following serum
components: calcium, inorganic phosphate, glucose, blood nitrogen (B1N), uric
acid, cholesterol, total protein, albumin, total bilirubin, alkaline phosphatase,
lactic dehydrogenase (LDH), and serum glutamic oxalacetic transaminase (SCOT),
'frevious studies revealed that stress induced by exposure of rabbits to 1.7
-. 2and 2.45 GHz microwave radiation at intensities of 10 mW/cm
2 or greater result-
ed in transient alterations in the serum components: glucose, BUN, uric acid,
bilirubin, and various serum enzymes (3,4). These results and data on the
-4-
I -.

thermal response of rabbits to microwaves suggest that such exposure may alter
serum components as an indirect effect of low-level thermal stress, although
other mechanisms of interaction cannot be ruled out at this time. In view
of the purported effect of thermal stress on rabbit serum chemistry alterations,
it was decided that nonradiation heat stress would be used as a comparison
stress for EMP exposure effects. Dutch rabbits were exposed to an ambient tem-
perature of 40 C for 2 hr, the same duration as the EXP exposure, and pre-
and post-exposure samples were analyzed and compared to samples obtained from
EUP exposed animals.
The procedure used for the investigation of EMP radiation effects on
serum chemistry consisted of obtaining pre-exposure baseline serum samples
from a group of 10 Dutch rabbits 10 days prior to exposure. Following the
measurement of rectal temperatures, single animals were exposed for 2 hrs. to
the EMT field. During exposure the animals were confined to the central region
of the EMP simulator by the use of 2" thick styrofoam blocks with ample pro-
vision being made for free circulation of air during exposure. Although the
animal was restrained to this area, there was ample room for the animal to move
about within the exposure chamber. The exposures were performed using the E12
simulator at the Electromagnetic Radiation- Bio Effects Laboratory at the Naval
Surface Weapons Laboratory, Dahlgren, Virginia. The staff of the Electromagnetic
Radiation-Bio Effects Laboratory is hereby acknowledged for their aid in per-
forming this phase of the study and for the use of their facilities.
A detailed description of the EHP simulator has been previously given (2).
The exposure conditions for the study of serum chemistry changes were a field
strength of 1.5 KV/cm, pulse repetition rate of 38 + 2 Hz, and an exposure duration
of 2 hrs. The total number of pulses to which the animal was exposed was
2.73 x 10⁵ + 1.44 x 10 . The variation in the pulse repetition rate of the
EMP simulator was due to the operatiig characteristics of the "free-running" spark j
-5-1

'3%. 0 I C4
* H +1 +1 I +1N LPI %0 cc LON
0 0
+ + + +
z 0 0 00 0
-1 C- 00 4
+ + + +
an C0 cc) 0-ii- +1 ; -H +1+1 +1 4
a' 0n IT ~ LA 0 l
7-1
en Loll. CNIC
C14-
C4 CI14 s.D aN
C ~ 4 co co 00 0
A- 0! 4H1 + +1 4j +1Ai Np r3 (A c-ci-
9 ., * . * P u
U) -r4 r4 V-- 00 C) W
- 0 m- 10 1- % W- 10 C4 V
A4 $4 P r 1 n
N "4 C- 4 H U 4-4C4JUt 4V
A C

'-4 cc
r- 4 0; 4 C4It+1 +I + I +I + I + I
CA ClLA C CO C
po 0 .-4 IA I? %:r C4 co
U ~ ~ ~ 1 Cl ClN n -
a 1. -4 cn r-4 ( "+~ +1 + +0zc A- + 1 I1 + +1
co -
za C4 lr r-f
c- +1 ++ -I- A % 1 , +w1~ .C u2 td trA r-M C C1
< < co .- 4 M LA . ' %
~fE- C4L'
cn C
P N - * Cl 4d
'- w o oo4c + +1 +1 tI +1 I1 +1
g14H 4 ,m~r N4 N ,-40
014 1- *
o H
£14
£1, C: V-4 ,-4 ml .4 (nN
N~ ~~~~ 00coo 1 ± + 1 +Cl~~a CO'0C -
co C
0 2 (a 0 41; i 0 s
ca1. 00!- n0 c A( 10. i 0l : C l -1 -
4) (A ~ r Pan~ I cl .0 CL.C:w cw4 $4 r4 F~ 0. r-
S K.- A. .14 5fl UH C4 W 4 U) I

gap ue- tv trigger the pulser. The si",.:lator pulse may be described as a
e::~ ~.aly ecayincg cosine wave, the amplitude of which decreases to on(!-
.-. ...- I vcltage in 4 cycles. The characteristic frequency of the EIMP
S a r is 23.5 111z and the slmulator pulse duration is thus approximately
0. 4 ;sez. The rise tinme of iheo pulse is less than 0.1 It see.. All exposures
-~eat nc-nal room te-.Pperpture (22 + 1 0C).
ir-=edi:aLely following- ex~osur_ ,the rectal temperature was detcri-iined an.d
a 5 ral blood' sample %,:s obtained from the marginal ear vein of the! experimazital
anna.In a-i attemnot to detect exposure effects with longer lateuicies anothIer
bloo3 samnple was tal-en 24 hours post EMP exposure. Sham--rradiated control
anamals were tr-eated identically except thant the Ipulser was not energized during
the 2 hr sha::i expjosurce. Serum chemistry analyl.;cs were performed by
the uso of an SM- 12,60 aiutoanalyzer. The snippling procedure for the lnvsti-
gat.onoftji e::e'tofe nonradiation heat stress wa-; as previouslydeoa.c.
Inl this case, the aniii2als w-cre cxposced sinfly for twoc hours to a~n arlbient
temperature of 40 0 C in an environmental cabr
The resu2ts of EMI and nontradiation beat stress exposure on rab~bit serum co-
pazents are sumn'arized in Table 2. No statistically zsignificatit alterations
in the serum- chemistry of Dutch rabbits were detecte, as a result- of EMP expjosure.
Aithu~ithe levels of certain response varlibles such as; the cnzyo-ic?. alkaline
:~saotseand SCOT appenr to have beenl eevatted in the i mned Late post Cixpo:'uj:e
saz:asthe variabil ity or the data is sucli thait no st.;itistival -.Igni ficanice
can be attached to these findings. It should be noted that the levels of
alkalinec phiosphatase, Lull, and SCOT were increased as a res-ult of nonradiation
heat stress, whereas no significant alterations In otlivr ,;orum components were
detected except for an increase in calcium. Increas~ed levels of rserum enzyim.es

are generally attributed to cell death or to alterations in cell membrane
permeability.
( It may be concluded that the EM exposure under the condition of this experi-
!ment did not result in significant alterations in serum components compared to
sham irradiated controls. Exposure to EM radiation for 2 hrs resulted in a
15% increase in serum alkaline phosphatase, whereas heat stress for the same
duration caused a 25% increase. The levels of SCOT were increascd by 53% fo]low.12g
EMP exposure as compared to a 45.' increase foliowing heat stress. Nonradiation
heat stress led to a 22% increase in LDH in contrast to a 2% decrease in the
EMP exposed animals. Themeanand standard error of the mean rectal temperature
change were0.28 + 0.21°C for the EkfP exposed animals and 0.10 + 0.260 C for the
sham irradiated controls. Exposure to an ambient temperature of 400 C produced
a mean rectal temperature elevation of 2.1 + 0.4 0 C.
The significance -f -hese basically negative fiudiugs iL limited by the
small. sanple nizt.. cs. -ployed which, in view of the inhcrent inter- and intra--
animal variability in serum components, reduces the sensitivity of this study.
Additional serum chemistry, studies, especially of enzyme levels, in which
larger sample sizes are used are needed to evaluate the effects of EMP exposure.
Serum Triglyceride St".iy
The effects of acute stress on the mammalian system produces a generalized
response mediated by the neuroendocrine system. One reported consequence of
this stress responsc is the activation of the pituitary gland leading to
the release of growth hormone which in turn causes an inhibition of cellular
glucose uptake leading to increased serum glucose. Growth hormone also
causes the release of free fatty acids from tissue storage deposits resulting
in elevations of serum triglycerides. We have determined that low-level mi-
crowave exposure results in elevations in both serum glucose and triglycerides.
Consequently we have investigated the effects of EMP exposure on these
response variables. The results of the serum glucose study were indicated-9-

in Table 2. No increase in serun viucoi-e -.as detected in animals exposec!o M
for 2 r. peariods as described i~n the Previous section of this report. S er um
tr~z.-:r~elevels wore det-ermined in a group of 6 Dutch rabbits immodi:Ltely
- -a 2 hr exposure to EM- radliation using, the sqme exposure parameters
as es.rhdin the preceding section. The mean and standard error of the Pmean
ser--i trinlceride level were 38.3 + 4.1 rcg/dl as compared to a M-tn level of
-. 5. 9 Obtained from a sa~le of 5 sham irradiated rabbits. There was
t h.:s no ev4 'ence that EM? e x23sur-e of the type employed in this study alt ered
serum- trig:ceride lovels.
Effe~ct of -EN? H:iieat Stress on CP1K )soenzymes
Creatine- phcliok In)-aso, an enzyme which catalyzes the conversion of ecatine
phosphate to cr:eatIne, resulting in the fsynthosls of ATP, exists as three
distinct isoa:nz%->2s in body tissues. The MM1 isocuzyme is found pri-marily in
skeletal muscle, M3 is located in heart muscle, arid the BB isoenzyme is
associated wisbrain tissue. Cell deathi or increased cell membrancs hit'
is thought to account for increased level.,, of these enzymes in the seru:m..
Analysis of C?3I isoenzyme levels thus provides a means of detecting tissuc!-
soccific effects of physiological stress such as that induced by EM? radiation
expr)surc. CK isoenzyme levels were determined by the method described by
Nealcn and Fenderson (5). The procedures used for the eXPOSUre of Dutch
rabbits to FIM? radiation were as previously described. Serum samples were tk~
1~mec'ate!) ujpon cessatioin of EMP e-xposure and at 24 hrs post exposure. Fo r
purp-:sos or comparis;on of EN?, effects with a well known phiysioloeicalI Stress,
a c'roti-p of rabbits was exposod for 2 hrs. to nonradiation heat stress in an
environmental chamber maintained at 40 0C. The mean rectal temperature change An the
heat stressed animal6 was 2.1 + 0.4 0 C.
Creat ine phosjhk1.naISe iSOcOzyme concentrations are a ffected by storage
t in,( betwveen samnpline, and ijfly.0t5. ais wellI as by the- age and general muetabol ic t i:
Jo

of the experile:atal animals. For these reasons and due also to limitations
on the availability of the EMP exposure facility and animal holding
facilities, CPK isoenzyme studies were conducted with three groups of experi-
mental animals at three different times during the contract year. Due to the
aforementioned sampling problems it is not feasible to pool the results of
these experiments, consequently the results are analyzed in each case by
comparing the EI-M exposed group valu es with the sham-exposed group values
obtained at the same time (ie. within the same period of experimentation).
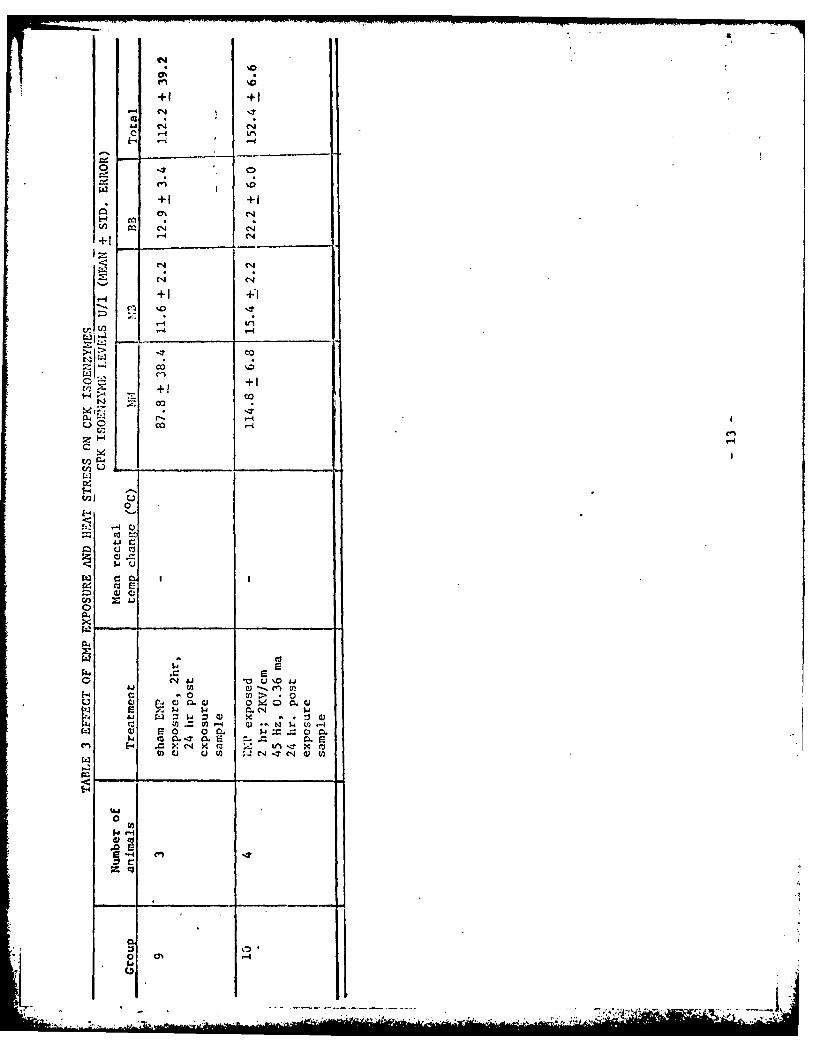
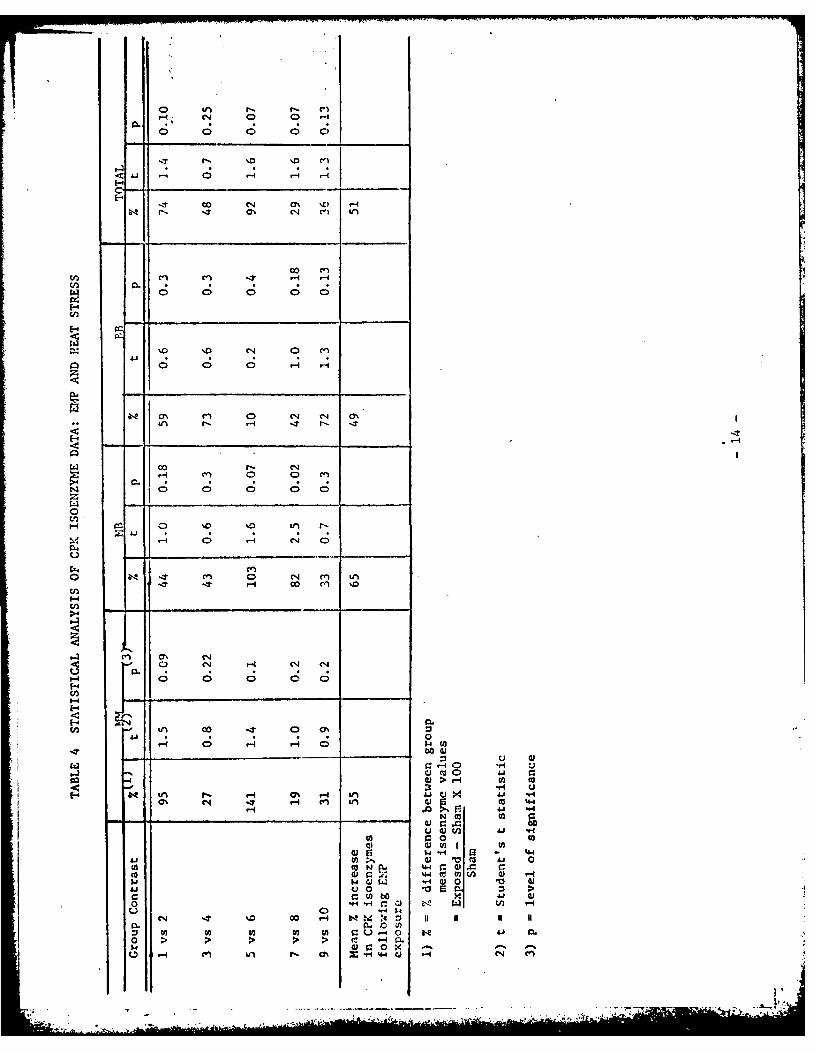
The effects of exposure to the MrP field and nonradiation heat stress on
CPK isoenzyme levels are summarized in Table 3 and the statistical analysis
of these data, using the Student's t test is presented in Table 4. Exposure
to either heat stress or EMP radiation, in all cases, led to an increase in
the serum levels of total CPK isoenzyme~s and in each separate isoenzyme
fraction as shown in Figure 1. A mean isoenzyme elevation of 65% occurred
for the NM fraction of EP exposed animals whereas heat stress produced a
maximum elevation of 95% in the I24 fraction. Statistical analysis of the data
obtained from individual experiments revealed, however, that with the exception
of the elevation in the MB fraction for the EI exposed group 8 compared to
its control group (ie. group 7), the differences were not statistically signi-
ficant at the 5% level. This may be attributed to the inherent inter-animal
variability in CPK isoenzyne levels and to the relatively small sample sizes
employed. Exposure to nonradiation heat strcss resulted in elevations in all
CPK isoenzyme levels which again were not statistically significant at the 5%
level. The overall significance of the consistent increase in CPK isoonzyme
levels following EMP exposure may alternatively be evaluated by use of the
binomial or sign test applied to the twelve independent determinations of CPK
isoenzyme levels (ie 3 enzyme fractions in 4 separate experiments; excluding
the total CPK values which, being a sum of the M i, MB, and BB fractions, are not
- 11 - '

+ + +1 +1 + + -as IT'-4 00 0 IT co + +1
o4 0 % Co Q6 C COo E- 11 0 -I N~ 'awN .q C14 (Nco
14 C
C: ++ +1 +14 +En~ 0) r( fl, en ~ I 0 0 N.4C
W m
N - co -( .70 NIwA CO- O 4-
1.4 1
0 c-c :fn4 1-4 0-
!.. N- .- I A 4(N(
+ +1
*n C) .n C4-coN+a r-~C .0-*(
0 ___ __ _ _ _ _ _ _
c I-0%( -q_ _ _ I' C'.4 CO4
(N -
Ai (C 41 V(NC 1 V 0 .. 1e 1 " 4C ,IC3~ -4 * t - o a 1 0 m (.) cc MC LO 0 c J . 0 * 0n.00 WL %N ri cq 0. 04 :r0 V0 0 0 . r 0 4 C
-4 C)" )V - )(0) 41 w. C) 0 W (.-46 r m w N Q 0 iC4 C
x ci ri a0 .0 aE X, l O(a C4 -H C14V (Na i 44wLA qul U 4 4 o W 4kJr caA- ) (A WN ~ CN Z
44C C 4- C 4 -W ) J-0 0 W CI-4CA 0* CI CJ
SrCz .. 0 Na-t in 30 %0 0 . L40 0 *.
4-i C( ~ ~ a0- .- 0
0C .0 *M co2 Z~.) X .0 N c 0 z ~
01 C~ 3 4A0 1 Cl~ 4 .. CCV 4 7
+11
LI ~CC4
co -C.
+ 1 +
Iz
+1 +1
co
C,' -~.++
QO co
00
w I
0
1- U2cU.-
%41
00
00)
C4~ C 0 0 .-4
o~c o 0 0 C)
En r- c .o 'T
0~ 0 0 0 r4
C-)
Cl Cl .iH
N 0) 0 0 0 CD
0
N, T~ 0~ N 0 CL
4-i
Hl 0) c 0t N N :3
0'.
ta -A-V
0- 0 C0 41ui rtoi 0) >- N IA c
-n I.. r- 0%cc& ci 41
N c
'-44
C.) 10 M.w
0 0 0
C: to c0 -. 0) 0U 4 0
%04 0o H4 14 0 1 .4rA. --- U)
(A VHO U) U) U q01
IJ 0 iU xccC W>H U)

-.
low.
.- r_~pi~z~
1 -T.17
PI 7 7, -
EiIZ7Z 2w

indepc-n-fent mea.ures of enzylae concentration). The probability of the CPK
en7--:z 1Cvei be- ILng greater in all twelve determinations following EMP exposure
fact ther-e is no treatme-nt effect (ii'. the probability that the enzynme
levE:s follz-wing DIP ex.ipces-:re, on any trial, exceeds the control value is
equal to the probability, r:h-at the control value exceeds the EMP value; both
12:rbbii~ being -ca o 1/2) is (1/2) =0.00024. The coiabined results
of the C?.-- isoenzv~o C' tern-inationis from the It experimen1ts thus suggest that
exposure to :,:? fLioe ' results. in a consistent and statistically significant
(< 0. 01) increncse 1-I enzyme level.s. The response patterns of the CPK isoenzy-<7:.,-
6not indicate any )b-vious tissue specific effects of EMP exposure althou, h
rlz--re 4s somie :nof heightened soliitivity of cardiac muscle. Additional
ztnis require- s- s'.Lbstantiate these findings.
1N VITPO STUX%1-S 0? PULSED ELECTRICAL FIELDS
7he complexfz:; -5 -in-nalian systems and the llt.tons imposed on.. the
-- 7*,sure facil;.t ic's za-cabl. of providing? the desired range of field strcen-lhs,
pulse durations ;L-- puls e repetition rates, provides the rational for inv\esti-
;rations ol uie el ectrical field effects in biological model systemns. WC!
have therefore initf.:ted an investigation of the effects of pulsed fields on
artificial bilaver 14i:.id membranes and mammalian erythrocytIes. The 1lipid
bilay.ers --re thle most elenentary taodel systeims availablc and since such
syst&::s closeoly simu~late biological nembranes in many of their propertLies, they
of-fer a means for inet ti'basic iehnL. of ~interact~ ioni ofi IIne..lSadLs
with electrical fields. In recognition, howc'ver, of the differenes in the
physical properties of artificial. and biological membranes there are limitation.,
on the usefulness of artificial bil-ayers for the interpretation of pulsed
field effects in more highily orranized biological systems. For this reason
-16--
-,....... .I

m imammalian erythrocytes have also been used as a cell model system. Erythrocytes
offer the advantages of being a relatively simplified cell model that can
potentially provide information or both basic interaction mechanisms as well as
data of direct physiological relevance in the evaluation of the effects of EMP
radiation on mammalian systems. The somewhat limited data on the in vivo
effects of EMP exposure of the Dutch rabbit obtained in this investigation suggest
that such exposure alters cell membrane permeability as reflected in the release
of intracellular enzymes. This finding indicates the need for an investigatio -
of pulsed field effects on membranes, with special ephasis being directed toward
the mechanisms for the alteration of cell membrane permeability.
Due to differences in the modes of coupling of pulsed electrical fields to
biological systems under different exposure conditions it is necessary to con-
sider effects of both inductive and conductive fields. In recognition of the
differences in the ma.goitude of such coupling, it is evident that significantly
larger external field strengths are required in the case of inductive field
interactions than conductive interactions to induce a given field strength in a
model system such as a cell membrane. Preliminary theoretical and experimental
studies have thus been undertaken of both inductive and conductive field exposures
in an attempt to establish the conditions under which each type of field alters
biological systerc. Since the basic interaction mechanisms at the membrane
level should be dependent only upon the field characteristics at the membrane,
the results of experiments with conductive or inductive fields should be directly
relateable, even though the external field parameters differ. Limitations on
the presently available apparatus for the exposure of model systems to inductive
or capacitive fields in our laboratory have precluded a direct comparison of
such fields with conductive fields. The preliminary inductive field exposure
of erythrocytes reported here were at both lower field strengths and shorter
pulse durations than the conductive field exposures. Experiments were also
in ti.ated to determine the effect of the transient voltage waveform on cell
- 17 -I~F.7TT7.

perrea-ility b-y the use of Fu are waves and exponentially decaying
puss. Ae! S n, the avallabie s,-.,are wave pulse generating equipment did nc't
-. 'ie suff izient voltage Co:put to provide a direct comparison of waveform
&:f . The future ava2abc2i:y of such equipment would permit a direct con-
parison e i both induct 'ae conductive field effects as well as waveform cci-
-. so-
In order to provide a comparison of pulsed electric or electromagnetic fields
with a more wfdely s-zied and somewhat better charncterized form of nonionizing
-2diation, erythroc' :-e suspension were exposed to 2.45 G1lz microwaves in a
-,-euide irradiation chamber. The effects of such exposure on erythrocyte
-. _.rane permleabili:v have been studied by dterminjngt1h potassium and
Z2-lobin ef--c i irradiated and control cells.
Artificial Xa--_---e Studies
One of the _ -ary functions of the cell membrane is its selective pvr-O-
T - .ty to vari ecules and Ions which enables the cell to obtinin anc?
retain substa.-.c -r it requires and to prcvcut the entry of undecirbe
substances. It is ciear that the introduction of large pores into the cell
-cmrane would al!c-- r Tsuztnces to pass through the membrane thus destroying
the importtnt p.se2-tiwe function. The major question we have sought toanswer in th:s nv iation Is whether clectric field pulses can induce pores
which alter membrane perz-eability.
The possibility loa. l.ng lasting pores might exist is ,uggosted by the
obE.e-v. Ljons of Yafu,,o e al. (6) on aged, oxidized cholesterol. .iprid b;l:ayor
menbranes. In these ne.'branes step changes In current while the membrane
was held at a constant voltage suggested the formation of pores or channels
in the nembrane. The membranes were not permselectlve to Na and K. Although
moderate voltages cau,;(ed conductance increascs in the neo-Mransc, higher vol 1 a ag
were often observed to cau,,c a conductance decire;e in stcj)wJ,!; failshion, i
indicating that the hi gher voltages cauised the channels to clo!sc.. We hiav
- 18 -

confir...- t' :se basic observations -;n a previous investigation (7).
z, Crastic typ of pore z:or7-,-ton is th1. actual breakdown of the
~nis referred to as "dielectric brOakdomn". In the case of a
s - 2a-yer lipid1 morabrane such breakdown causEs the complete destruction
Of ch:zczbrane. However, in a cell or i~n a discontinuous arrangement of a
-.- -0 .rV Snall -Inbranzs, di'4octric brc-ekdownm nay be localized. The di-
=-!::icbre-'kdown of cells ha-s been investigated by ZinMmerean' ct al. (8,9,10)
whle Ohki ('--) has observed localized breakdow.n ii it grid-like system of
mem":r nes. Cro-wicy (12) haw; studied the theorotical aspects, of dielectric
breia-7wn of beUartificial a-nd cellular membraneIs. Previous investigantors
hava deterined t-he voltacge which produes dielectric 1)rcaldow under D.C.
conditions (11,7,.3). Alt bough it is recobit izvd that the breakdown volta , 2-
crcase..s as tho c~a~nof t he vol tage pulse (lecreases (14)) tis- phenu,:,,. -nc:'. Las
not to our knvca e .en :Lv~tgtdqutm-rtUtive1y. Inl the Ipresent worh* W:
haxeectrminc tc beakdo.;a Voltago of an artificial bil. ayci lipid ine;i.bzrenie
-s a function of zhe v'oltacgo -pulse durat-ion. In addition wk2 relport On attu.:7pts to
o*-servc conductzance cnanges in the membrane following the application of voILtge
puls-Ec approacling the breakdown level..
Oxidized cholesterol was prepared according Lo the method described by
Tien (15), and the dried prc'duct was dissolved in dtecane to forin a saturated
solu I . Memranes xqere ore by app) )ii~j, the chol estecrol sc;Oution w.i thi .
bn:kor -,r-icropi petL (16,1-J) a-iross a hole in a tct 1ojihal r. Jmmorsecd fin 0. 1 M 1(CJ
Figure 2 shows the major cozr.ponents of the. expcrimentil appjirat us. The membrimne
was viewod uinder refilected light withI a 40 X inicroscope. The standard procedure
was to wait a minimum of two minutes after the imeimbrzme had blecome Wlack, NAich
-19-

..... ....- !
-. -~ < V C) 0 -.J (
rL4 : II F ILL
(0~~~ 27_ 77~-
IxI
-I -I
* U. ~ '~-~ L ~ il'-+ -I ___ ~ s,

indicates r-e transition to a bilaver, b-2-ore raking any electrical measurenients.
The cx ~~swere conducted aL n,-rmAa roo: t emperature of 22 + 2o0 ..
~r-zl connection to the :7 1z.)rane was r-ede by a pair of Ag-A~ 2
.e::voring electrodes and a pair of potential measuring calomel e1-OCL)o,'c
to eithcr sidc of' th- niraae by M~-agar salt bridges. The time
conF:ant for charring the me-rane capacitance was 7 11s. Current flow through,
.br~was meaSur.ed With an cleutromacter operational aiaplifier in the
c- E-at-to-voltage coniversion mode . With the feedback res;istanc. ]Q0 0, the 10,_ t C
90-- rise ti7:! was IS ziS and decreased to 7 ps with a feedback resistance of 10r6 C-
Ge-erally the ze:st sensitive2 setting with the feecdbac(.k resistance at: 10~ :7,uc
* used. The vo';.a e azross the membranne was men.;ured with a differentia" elcte
neter amplifier with ain in-put iniped0ance of at- least 1013 q at either- i 1, z
and a 10/7 to 9; rczponse time to a 250 MY\ step change of less than 1 L~s.
S~uare -pulsez -.::r cbta incd either frow a 1IP214dA pulse generator, or a ulse
genac'rator of o,,: cw- de!,:i
This ara zetwas suit 1 be for D.C. or slowly var-ying signals,, Ih-!t whien
fast rising ue are ap plied to the meubrane the current chazrging, the momnbrra:Ii
cacitaace (5 rF) sat urptes the cu 'rent to vcoltrigo converter, which rec'uire
1 00~ =S or le:-ger to recover. To overcome, the effect of the capacit~mcc chargiing
Cl~rezlt tWO MethOdS were U.sed. In thP first 11,tho1d, a relay was act-ivated
vTl~n . the . ';e,,c and w~as I~1to sliort out; th2feebc resistance in tlie currc,-
to-voltage convert er. In tie second me,,thiod, adapted from,. Sargent (38,19), a cur-:_I!
-1a o but vppo,;-i t in i ;a from tlio capac it anre charg Lug~o cuirrent wa.s ad&!e
to the mem-brane current, effectively nulling the capacitance charging current.
Using either method produced a transient. artifact at the output- of theo current-
to-voltage converter which occurred after the applied voltage pulse. The worst
case condition msngr th., rclay method produced an art I fact pillse will.11, api ~O'
of 2 x 10⁻¹⁰ A and a hr 1f widt)h of 8 1,10, wilfl wi t lic cu o rnul 11 iet. hod tH.
transienlt arti fact was a daimped one ilii i on with a nmax.1 muml U f !several hunidrcd
- 21 .**'

picoamperes and a decay constant of about 8 mS. The worst case condition was fwith a feedback resistance of 109 Q in either method. The electrical noise
of the current-to-voltage converter using the relay method was 10 pA peak-to
peak and 40 pA peak-to-peak using the current nulling circuit.
For the determination of membrane breakdown voltage as a function of pulse
width, the membrane voltage was held at 50 mV between pulses by using thc !).C.
offset of the pulse generator. One or two pulses were applied at each voltage
increment with a one or two second delay between pulses. The pulse voltage
was incre.ised in approximately 25 mV increments until the membrane was brolen.
Membrane current and/or voltage vere recorded on a Tektronix storage oscillo-
scope for each sequence of pulses.
The storage oscilloscope v:as also used for the determination of membrane
current following the opplication of a voltage pulse in our attempt to
determine whether or zint- long lasting conductance change: were produced by
the voltage pulses. In thesc expcrl,-ents, the current through the nembrane
was recorded following the application of a voltage pulse across the membrane.
The voltage pulse was added to a normal holding voltage of 50 mV, so that
following the voltage pulse one would expect the current to immediately return
to the normal value produced by the 50 mV holding voltage . A change in ner.br."no
conductance would be indicated by a change in the current produced by the
holding voltage following the application of the voltage pulse.
The results of the determination of membrane breakdown voltage for various
pulse widths are shown in Fig. 3. The results represent experlments on 13
membranes for both the 3011S and 300 piS pulses and 5 membranes for the 10 mS
pulses. The error bars shown in Fig. 3 denote standard deviations. A definite
dependence of breakdown voltage on pulse width is demonstrated, and the
experimental results indicate the following relationship between the breakdown
voltage (Vb) and the pulse duration (T).
Vb 465 - 109 log ( T)
- 22 -
-J - xa k- Z -!

'I 0
'3r %f AC,. .TEC

where the pulse width, T, is in msc, and the breakdown voltage, Vb , is
in mV. The breakdown voltage increases by 109 mV for each decade decrease in
the pulsc. width.
It must be emphasized that these results apply only to oxidized cholesterol
membranes at 24°C in 0.1 M KC1 and that the membrane breakdown voltage depends
on many factors including the composition of the membrane, temperature, p11, and
the baLhing salt solution (11, 13, 20). However, if the mechanism for membrane
bre-]kdown is the same in other membranes as in the oxidized cholesterol menbranes,
then one would cxpect a qalitatively similar, though not necessarily quanti-
tatively identical, dependence of breakdown voltage on pulse width. This may help
explain why the determination of the breakdown voltage of cell membranes using
voltage pulses yields breakdown voltages of 0.8 to 1.6 volts (9,10), while
the breakdown voltages of artificial membranes for D.C. voltages is usually not
greater than 0.4 to 0.6 volts (13) and often less tl-n 0.3 V (11). There are,
of course, many other factors which ight contrilute to this difference such a:u
actual differenccs between artificial and biological membranes.
Our attempts to observe persistant conductance increases using either the
relay method or current nulling technique have yielded no positive results,
and we tentatively conclude that voltage pulses below the breakdown voltage
do not produce persistant conductance changes of durations greater than 10 T.S
in oxidized cholesterol membrnnes under. our experimental conditions. These
results do not contradict results reported by Saigent (19) on oxidized cholest(-rol
membranes. Sargent was not seeking,nor did he discuss,persistcnt conductance
changes following step changes in the membrane voltage. Rather he sought and
observed transient currents apparently due to membrane capacitance relaxation
phenomena. To observe persistent conductance changes due to a voltage pulse
would rcquire the observation of the current following a voltage change from
a higher (in magnitude)voltage to a lower non-zero voltage. Unfortunately
Sargent does not: report any experiments of this type. We mu,,t also note thlat oxl. .I- 24 -

dized cholesterol membranes are among tLe most stable artificial lipid merbranes.
Phospholipid membranes have much lower breakdown vol tages (11) and may be more
likely to show a long lasting effect of voltage pulses on membrai.e conductance.
Additional studies using other types of membranes are thus required before conclq-
sions can be drawn regarding the generality of the relationship between breakdcni
voltage and voltage pulse duration as well as the effects, or lack thereof,
of transient voltages on membrane conductance. Based on the results obtained
with erythrocyte me, branes, to be discussed in the next section, it is suggested
that in view of the general correlation betw:=,2n tha pilse duraticn and dielectric
breakdown in artificial membranes, on the one hand, and permeability alterations
in erythrocyte amebranes, the two phenomena may be related mechnistically.
Effects of Pulsed Electric Fields on Erythrocytes
The effects of pulsed electric fields on erythiocytes have been the sub-
ject of a number of investigations. In general, electric field strengths of
2 to 30 kV/cm anJ pulse durations of 1 to 100 lJs have been used, and suspensions
of erythrocyte; Lave bec: exposed to one or a fc-.; pulras. Hemolysis (8,9,21--24)
potassium rele.;e and sodium uptake (23), glucose uptake (24), light scattering
relaxations (25,26), and enzyme uptake (27) are among the reported effects.
Erythrocytes lysed by electric field pulses have been examined by electron
microscopy and the cell membrane appears to remain intact. (28) Microorganisms
and phospholipid vesicles have also been investigated (23,28-32). Some
investigators have reported that the primary effect on cells is dielectric
breakdown of the cell membrane (8-13,21-23,27, 33-34), while others suggest
that the effects may be due to both the electric current and temperature increase
(25) . A mechanism (or mechanisms) which satisfactorily describes all the data
available in the literature has not been presented.
With one exception (25), previous Investigators have exposed cells to only
one or a few pulses. Barnnski et al. (35) have reported that low lvel micro-
wave irradiation of I to 10 rW/c.,. produced significant leakage of potassium
-25-

and hemoglobin from erythrocytes after exposures of up to 3 hours. It hi's
also been reported (36) that pulsed microwave fields are often more effective
than continuous wave fields in producing alterations in biological systems.
In view of these reports and the results of the in vivo experiments discussed
in the precedinig section of this report, ve decided to investigate the effects
of exposure of erythrocytcs to relatively low intensity electric field pulses
using long exposure times. In the present work we report on the results of
such exposures using both induced and conductive electric fields. We also report
on an attempt to confirm the results obtained by Baranski et al.(35) by exposir.g
erythrocytes to low intcnsity microwave radiation.
The procedures used in this study included the drawing of blood from apparently
healthy dogs, rabbits, or humans into a heparinized syringe (20 I.U. per ml of blcc).
The blood was inmediately centrifuged for 10 minutes At 1,500 g and the plasma,
buffy coat, aiLd top layer of cells were removed. The packed ce!la were then
washed twice in cold, potassium-free, buffered saline containing 90g NaCl,
13.6g Na2 HF0 4 , 2.15 g NaH2PO4"112 0 per liter &f solution. The p1l of the buffer
was 7.4 and it was osmotically equivalent to 0.9% NaCI. The washed cells were
resuspended in the buffer in a concentration ratio which varied from 1:9 to 1:1
packed cells: buffer.
Exposure of Erythrocytes to Pulsed Capacitive Field
In these experiments current did not flow directly from the voltage source
through the cell suspension, but rather an electric field and thus a current was
induced in the cell suspension by the changing electric field between a pair
of capacitor plates. The capacitor plates were 25 cm x 25 cm and were spaced
4 cm apart. The capacitor thus formed was part of the energy storage capacitor
of a commercial high voltage discharge circuit (TRW Model 31B). Measurement
- 26 -

of the capacitor voltage during the discharge of the circuit was limited by the
re3ponse speed of the Tektronix Model P6015 high voltage probe used. It was de-
termined that the major part of the capacitor discharge had a 90% to 10% fall tjh.' of
< 4 nsec. Assuming for simplicity that the pulse was approximately exponential,
this corresponds to a decay time constant of < 1.8 nsec. The manufacturer's
specifications for the TRW Model 31B indicate2 thrit the duration of the pulse is
4 nsec so that a time constant of 1.8 nsee for the decay of the voltage across
the energy storage capacitor is reasonab!. The ri,.a time for charging the
capacitor was 120 Psec. Three milliters of the cell suspun-ion were placed in a
snall vinyl bag and susp.cnded by a nylon striug in the center of and bctween
the capacitor plates. Assuming that the volim c of the cell suspension is
spherical, the field induced in the sample (El) by a changing, initially
uniform electric field (Ee) is calculated in Apcndi:- I to be-l
E i = o dEe/dt (1)
where w0o is a constant which is dependent upon the condu.tlvity of the sn.ple.
For a decyir'g exponential external field with tii-. cont.:L I the r aimw
field induc(:d in the cell suspension is
max max I max.Ei = Ee ,WoT = 0.019 E
under the conditions o = 2.96 x 10¹⁰ radians /sec and T 1.8 nsec. No
appreciable field .s induced in the sample during the charging of the ca2pacitor
due to the long rise time of the pulse. The maxinum capacitor voltage was
varied between 4 kV and 5.5 kV so that the induced field varied fron
approximately 75 to 104 V/cm. The pulse repetition rate ,,as MIz, and the
exposure time was 3 or 6 hours. Control samples were treated exactly as the
exposed samples except that they were not exposed to the field. For each
exposed sample and its control, the supernate remaining after centrifugation
for 10 minutes at 1,500 g was analysed for potassium concentration using an
Instrumentation Laboratory Model 343 flame photorieter and for heiogobin by de-
termining the absorbance at 540 nm by means of a Beckman Mudel 25 spectrophotooa'tr.
27
F3 ... . . . . . . . . . . .

The results of exposure of dog, rabbit, and human crythrocytes to pulbed
capacitive electric fields are summarized in Table 5. No consistent or statis-
tically significant alterations in potassium or hemoglobin efflux from dog or
rabbit erythrocytes were detected. E':posure of human erythrocytes resulted
in a 52% increase in potassium release with no increase in he!molysis. A though
the data for human erythrocytes indicates an effect of pulsed induced electrical
fields on potassium release, additional data is reuircd in order to establish
the statistic:al significance of this result. It should be noted, however, that
the results of exposure of erythrocytes to pulsed conductive fields, discussed
in the next section, suggest that of the three species that were studied, hu:an
cells appear to be the most sensitive to the electric field effects. The in-
duced field strength in these experimonts was 75 V/cr- with the exception of ex-
periment 4 in which case the field strength was 104 V/cm.
Exposure to Pulsed Conductive Field
The chamber for the exposure of erytlbr-ocytL,' to pul e,! cotiductive fields
consisted of a pair of flat platinum foil electrodes separated by a 3.3 mm
thick rubber insulator containing a cavity into which the cell suspension was
placed. The volume of the sample cavity was 0.5 ml. For most experiments
the exposure chamber containing the sample was the discharge resistor for a
high voltage discharge circuit, shown in Fig. 4, controlled by a needle
point spark gap. The charging resistor Re (100 M a) determines the time
required to charge the energy storage capacitor C to the c;'itical v']tage Vc
at which the spark gap discharges the charge stored in C through the cell
suspension resistance R in the exposure chamber. The cell suspension is
thus exposed to an exponentially decaying electric field with a time constant
determined by RC and maximum voltage Vc. For most experiments Rs was 100 Q
so that the ratio of charging time to discharge time was 106 and was independent
of the value of capacitor C, which ranged from 0.00431jF to 0.0611F. The time
- 28 -
A.

w ; cN0
'N 04 C.4 C4 C0 1-4 r4
ci 1-4 C) 0 0 0 4 .- 00) 0
1-4.- 0 0 0 l 0 l 0 * 0 0j 41+ +1 +1 +1 *4- +1
04 c o f -I 0- -4 -'J r- Ln ('0 0 0- 0A 0T 0z 0
to -4 3w
(I) 0L C) -o - ' ** .
*0 +1 +1 +1 + +1 +1+cr C14 1-4 ON r-. e' cq -w -II ~4 r4 0 (4 cl n
H!0 0 0
i -H
4U.ci
1- CQ 2 0 C0
u- 0-
<0
Uc: c
0.0
CI U4C '0 C '0
4-1- 0
E-4I
*4 cc.l4-PS . 0o b w .$4) 0 0- 0 0~ 0 0 0U-
I)41 44i9:4.
a) 44
C) 044q e % a
H 0V

,4
0 , '. * 03
U) 0 0 % r1 04 IT 11 -- -0 .7 U 0 1 -
-4 -4
CflO '.o 0 en V-9- r-4
C1 4 0 0 110 -1 0 a* 0 0N 0Aol r-W
v 4 14 8 C 8 C
94 ) uI-f r o ~ ~ *t ca 0
1-4 P4 r_ 1-4 P-4 -i -t - -4 1-0..C 0- 4- 0 04 0
0-4
t. j 0. r4)
L4
N44f
Wia C)-
W -4
LM
0
60 Cl C '0 C '3 C
* 0~ i- 0
014 1ri
n-f C4t 0* IT3 0n %0 0 0-
4-iy

17-I
T I7
77- 7
I a
w rn 7 LJ~i 7If'N
I 7T -
a y
F ~j ia7-7 .7E~
7--
between pulse., ranged from approximately 1 second using the 0.0043 VF capacitor
to approximat:ly 12 seconds using the 0.06 UF capacitor. In Appendix II it
is shown that. under these conditions the average energy dissipated in the s.mpl.e
was less than 10 mW. The sample was a 1:1 suspension of cells in buffer and
the volume of sanple in the exposure chamber was typically 0.2 ml. Thus the
average specific heting rate of the sample was less than 50 mW/cm 3. The voluie
of sa ple was very small compared with the size of the expcsure chamber, and the
average temperature increase m asurcd with a iriniatur:e thur~nimtor was found
to be less than 0.3 0 C. The temperature jump produced by a single pul];e ii cal-
culated in Appendix II and found to be less than 0.1 0 C. In experiments Where
less than the total voltage Vc was to be applied to the sampla, a resistor RI
was addcd in series with Rs . The resistance Rs was adjusted so that the
total resistance R1 + Rs was 100 S. The voltage pulses across R were mnonitored
with an oscilloscope and gave a Vc of 1.6 kV with a vwriatiou of + 0.3 kV. This
was in agreement with the voltage calcuT.atL.I on he basis of the charrin, ti: of
capacitor C. For the shortest pulses (RsC = 0.43 psec) oscilloscope triggering
was difficult and erratic and some observations gave apparent values for Vc of
only 1.0 kV for these pulses. However, based on the time required to chirge
capacitor C we calculated a Vc of 1.6 kV. In those experiments in which square
electric field pulses of 300 volts/cm were used, the pulses were produced by a
Hewlett Packard model 21.4 A pulse generator. In this case the sample volume
was adjusted so thit the sample resistance was equal to the 50 S1 characteristic
impedance of the connecting ca ble. The rise time of these pulses was 15 niece.
Controls for these experiments were kept at room temperature. For both control
and exposed samples the potassium release and absorbance were determined as for
the samples exposed to pulsed capacitive fields. In addition, osmotic fragility
of the cell membranes was measured in some experimunts. For this determination
a 10 i L aliquot of the exposed or control cell suspcinsion was added to 2 ml of
0.5% saline and mainraind at room temperat.ure for 30 minutos. The suspen.Jon
- 32
I...,.- -

was then centrifuged to remove the cells, and the absorbance of the supernate
was determined at 540 am.
The results of the exposures of rabbit erythrocytcs to exponential voltage
pulses are shovn in Figures 5 a, b and 6, and the results for human erythro-
cytes exposed to exponential pulses are summarized in Figurcs 7 to 10.
Exposure of dog erythrocytes to exponential pulses in a scries of preliminary
experirents. gave results similar to thes'e obscrved for rabbit erythrocytc!s.
In another series of exper:imeuts rabbit erythrocytul Were expos'd for 2 hours
to square wave electrical pulses of 30OV//i with pulse widths of 0.50 and 2.5
psec. No significnnt diffenice was noted in pota. 'sium and hemoglobin release
between exposed sa~nples and controls. For tabbit and hunan crythrocytes,
pota--.,lua rcica.s! occurs mutih more read.13 than do,_ hemoS ob:U release followin-1
exposure to couductive expoiential voltage pulses. This has clso been observed
by lincmnn et al. (23) in human erythro-ytus eXpoel to single pulses. The
more r'apid relcae of potn. ium throu(;h the cell m:trbr-ne is not surprisin3 since
the ion is significantly smaller than the henoglobin molecule. These results
suggest that less pronounced reibrane alteration& are sufficient to per-m.it
tie passage of potassium than are required for the release of hemoglobin.
A second obvious feature of the results obtained in this study is the strong
dependence of both potassium and hemoglobin relcase on the decay time constant
of the pulse. It is shown in Appendix II that under the conditions of this
experiment the average power delivered to the s-uiple is independent of the
time constant of the pulse. It is also shou-n that the average time that the
voltage across the cell suspension is greater than a given value is independent
of the pulse decay time. Figure 11 shows the effect of temperature on human
erythrocytes. A 3-hour incubation at 370C results in potassium and hemoglobin
relese that is small compared with that which occurs due to pulsed field
exponre. Thus, temperature and average power can ho. ruled out as possihlo
causes for the dependence of the effects on the pulse time constant. This
33I

7 --j-.-.7 -!! --- T
17~
7..
- - ~ -~ ....i!..- __ 1
--------- ~ 4 iLL*
0.0jkLI
---------m~
~i.
3; .NV- 7 - 'l.0
050
C00
- -- - - - -7 7 7____ I I7
I.I
I--
--r.7jiw 'm 7
fj a
.K - -/~4Q~ -
19 1s A7 ON 3 ''.,/*

Id
L71
7-7-j
77..I - .
L.. . . . . . .1. . . .A -. I.

V. 7---- 7--- - -
1
I.77-
FI 7iI 7.
Il-
-- LLJ
_ _
- -.-- -

5 a-
* ..-----. ~......
* IjJi.. ..
- K:
o -
-k.. . I
---- <*-->- -.
~.- t~j ~ :.. ___ -
I -
.......... ~-rNJ~ - -....
Co .-
I. LJ=.J.~ I
vI---- ~' I ________
CC) ~ .
I I -'.- ~7
L~ Q a ~.1 K
-ii C)(D
I- ~
I. II
I..- I, I,.., -
I Q j F -.
______________________ .1 _______________________________
-l __ _____
L
I I
L I
L .-. KH '.. . U _
K. KI I
v
~ \~I 'j~j. -. -.
I A --
1171-F
I--
I I .IT I I -j ;...
r __ I

-IL
71
, O1~J -AT/0
1-7~)
V 7--

. . -- . .-
I. .. - . U-i::-440
I. _ _ -_
I U!4.J ~.:I~jjj~ ,~
I -
- ..---.
.... :.L>~ I --
I. - .. ~-~e-J --.. r-
I *(.. I . ___L... 4- --
- 1 r~ nIl I~-~7....1 ~C-~& L mu.izmV. Lj ~ -
-- - . Ii)* 0 <~ ~
~.L= Ic) I I.-LI. I ____ _______ 'L ::~~:A~.J. ~y.-b,~.
I *' LI I I
.144
-~ _______r--- 3 ____ ~
- F~ '%J..II I
I-- ~-...iii .11 I . -j
_______ ___________ 0 _____
~-
L- .j ~ I ~I'
* __ T _
z :. - I I -. .-
.. .
I i.. ~ ~ -----------0 _
-~ i ;. -
I.. -- I -- -
- ,----I -.- -L ___________ .-.------I .--.- -
r - -. .~ - -. --L A I -
'...I~i:9 .... +.---...j-- ----
___________ ~ *1~~~.
-- 1 -~.....i. .*** I -.
-. I ... . I . -..
I ________
~
- . .

EFFECT OF E~XPSURE' OPP UI4AAI>ERYTHROCYTES 70 6)SCCOR 6HMh1
i... - - .*.
I.!-I L ST EN -.7...
I- r
17-1
-j a
___ 2: v;~~~V77OL t
.... .... .... ...
__ow_
. . I. H ___ C .if
1A>IG*1 . 1 .
Lo. .-.-.-.--
* t. ,70

.. , QZr12
. - - --- "01
S.T T
I. 1~ fN * *
Ii 3-.T

7.
-- 7 - _ I-
~i~) :I - I _ _
-z .=T7

I. t
.. I'
- I
____ _____ ~1
I ---. .~..-l - .-.
I-- -.--...-- I- -.- I
- -I I. --I. 0::z~Zi. -~ .........z:u... ____
I, .-- ---
V3e~~~ I. ilYXjJ[.~. ~< -. ~U7L
(\j. N.~t
fl ti4
- ~ 1, -
iC I IZvJ! II;
............................................................................... 1, CD
-' ii It I. -J
-Lj 1 7 I -- LiiI.' I
I I ~-
~rnr~
,.trtT7 F I I ~ '~1~I (
-- I 'I,
I II- -
.......................................K..XL~7J33 40NlVV4Y..T..~LI~ 2 1<.7i7H~..~ - 2. 7;
* -.. i . . I I
.1 . . . I
I -. ~1-
Li

V1-
dependence on pulse time constant has also been noted by Riemann et al. (23),
who suggest that: the time required to charge the cell membrane capacitance is of
the order of 10 psec. If this is true, then a reasonable explanation for the
dependence of the effects on the pulse time constant, for time constints less
than 10 jsec Is that the cell membrane becomes only partially charged and only
a fraction of the maxii:ium possible voltage is developed across the membrane.
We believe that a raore reasonable estimate for the tirme constant for the chergJ.
of the cell membrane capacitance is 0.1 psec or less. This time constant can be
calculated from either experimental observations or theoretical calculations
on the dispersion of cell suspensions. Schwan (37) has shown that the rela-
tionship between the chcracteristic frequency, and the relaxation time con:stint
for a dispersive tedium is
T -(27fo)- (3)
For a cell suspen,ion, the dispc sJ~ion and the relixation process are due to
charging of the cell membrane capacitance. Bernhardt and Pauly (38) have
calculated the characteristic frequency for various cell shapes. For disk
shaped cells the size of erythrocytes in dilute 0.9% NaCl solution, they
obtain the following values. With the short semi-axis of the cell parallel
to the external field fo is 4.8 MHz, for which the corresponding relaxZ:ticn
time is 33 nsec. With the short semi-axis of the cell perpendicular to the
external field, fo i.' 2.2 Mhz, which corresponds to a relaxation time of 72
nsec. Sale and Hamilton (22) used a spherical model for the erythrocyte and
estimated that the membrane charging time constant was less than 0.1 11s.
Bernhardt and Pauly state that the experimental values of relaxation frequencies
for suspensions of ceils of this type are in the range they calculate. It is
shown in Appendix III that if the relaxation time constant is Tr, and the external
electric field applied to the cull suspension Is a decaying exponential. given by
Ee(t) ,,E o exp (-t/ p) (4)
46p

then the voltage across the ccll membrane Vm(t), at points on the membrane
where this voltage is a maximum, is given by
Vm(t) = FjajEo p 1. {e-t/TP - e-t/Tr] , (5)
Tp -Tr
where Fj is a dimensionless shape factor specific for a given cell and its
orientation relative to the field and aj is the semi-major axis parallel to
the external field. In Figure 12 we have plotted this equation for the case
of the erythrocyte type cell with the minor semi-a.xis perpendicular to the
applied field (Tr = 72nsec) and for tim, constants of 6 p sec and 0.4_usec for
the applied pulse. These are the long~st and shortest pulses used in our
experiments. The peak merabrane voltage produced by the 0.43 psec pulse is about
3/4 of that produced by the 6 p sec pulse. However, a 6 ,Isec pulse with a peak
amplitude of 3.6 kV/cm is much more effective than a 0.43 lsec pulse with a
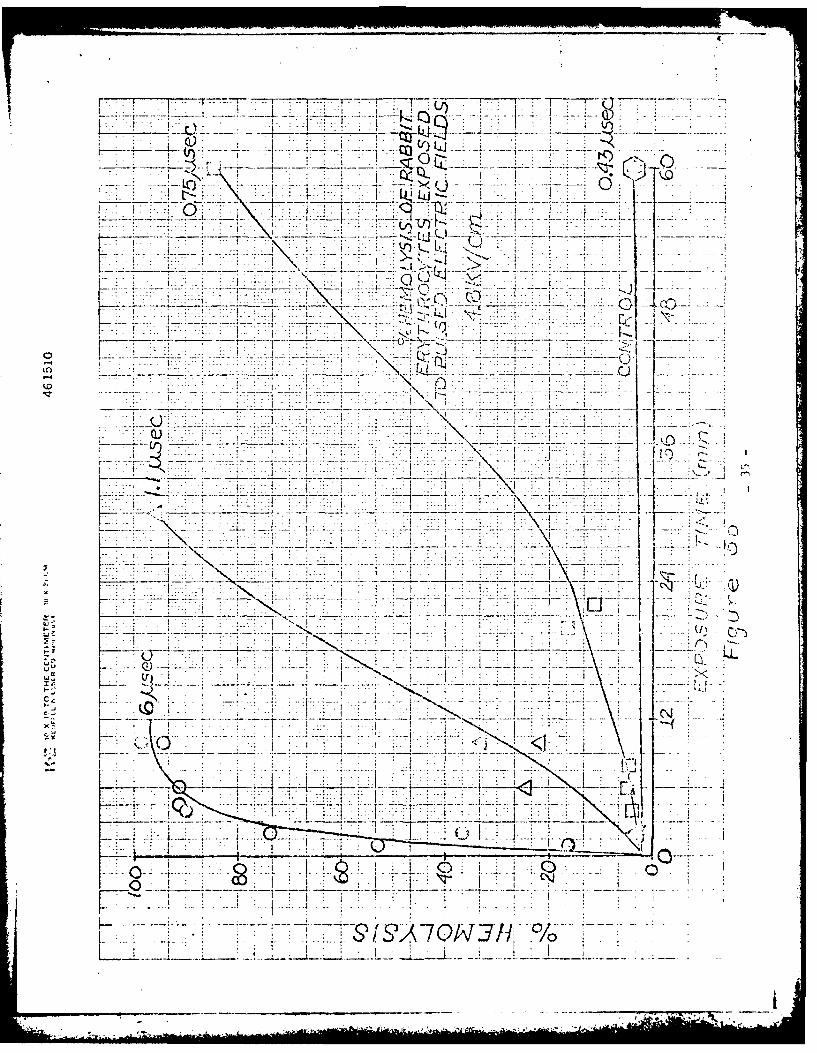
peak amplitude of 4.8 kv/cm. For example, compariig Prigures 7a and 7 d we see
that the 6 JIsec pulse produced a 96% potzsium release and 65 hc.- 'lysis after a
6 minute exposure, whereas the 0.43 psec pulse produced only an 8% potassium
release and no hemolysis above the control after the same exposure time at a field
strength of 4.8 kV/cm. Even after a 60 minute exposure, the 0.43 11sec pulse
produced only about 40-50% potassium release and a negligible amount of hemolysis.
Possible causes for the time constant dependence will be discussed later.
A third notable feature of the data is the sigmoid relationship of
hemoglobin release to exposure time. That the si-moid character of the curve
is not evident for the exposure of rabbit erythrocytes to 6 psec pulses (Fig. 5b)
is probably due to the absence of data at very short exposure times corresponding
to 1 or a few pulses. The sigmoid shape of the hemoglobin release versus exposure
time curve is evident for human erythrocytes for 6, 1.1., and 0.75 ,sec pulses
(Figs. 7 and 10). No hemolysis was observed for rabbit and human erythrocyte,. wit]
0.43 psec pulses. The ex.pou,;ure time dependency appears to indicate a progrev;:ive
weakening of the cell membrane by the electric field pulses until the membrane Is
- 47 -
* - * , * , .. "

[L U - !V7T~~~~.77-7 7Th. --
1J.
w ~ CC (
.........
VlTG

sufficiently altered to allow the release of hemoglobin.
Further evi:dence that the pulses weaken the cell membrane is prcvided by the
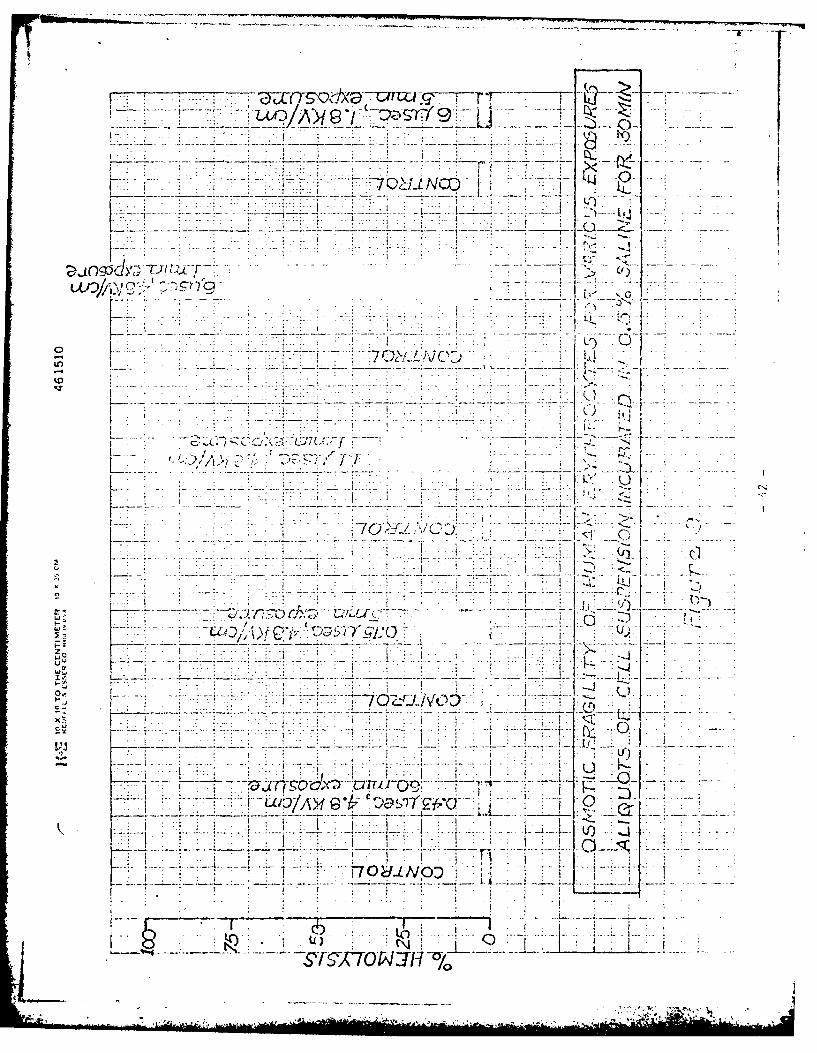
osmotic fragili:y experiments summarized in Figures 9 and 10. As shown in
Fig. 9, the conditions under which there is no effect of the pu]ses on the
osmotic fragility are for time constants of 0.43 psec or less and field strengths
of 1.8 kV/cm or less. For longer time constants and higher voltages the osmotic
fragility of the cells is increasedas shown in Fig. 10. A substant.ial increase
in osmotic fragility occurs under conditions where hemolysis is negligible.
We can surarize the data by saying that the first effect of the clectric
field pulse is to alter the membrane permeability resulting in the efflux of intra- Icellular potassium. Further pulse eiposure continues to waken the incmbrrncs
such that hemoglobin lea1:s out when the cells are s-;u.pended in hypotonic 0.5% sal:i.n,.
Finally, when a critical number of pulses have bcen applied to the cells, the
membrane is altered tc: the extent that hcmoglobin c cut of the cells
under isotonic conditions. We also note, as jndicL:t.-d in Fig. 13, tiht humra
erythrocytes are more sensitive to the effects of the pulses than are rabbit
erythrocytes. Although there is insufficient data at present, it appears from
preliminary experiments that dog erythrocytes are also more resistent to
the effects of pulsed conductive fields than human red cells.
Based on our results, it is useful to consider separate mechanisms for
potassium release and for the effect on osmotic fragility and hemoglobin
release. Rieinan eL al. (23) also conclude that hbumioglobin rcle:se Is not
necessarily associated with the dielectric breakdown mechanism they propose
to account for cellular potassium releas.e. We have not yet determined a
mechanism for the effects on osmotic fragility and hemoglobin release. Sale and
Hamilton (22) considered the effect of uniform healing of the cell membranes.
- 49 -

'LIi
CJ Q)
ALI

by voltage pulses and found it to be negligible. Tsong et al. (25) have
suggested that a thermal gradient which might be produced across the membrne
may have a large effect, even if the gradient is of very short duration.
Zfmmerman et al. (9) considered a theory proposed by Ncumann and Rosenheck
(32) in which the ion cloud surrouuding a cell is displaced by an electric
field pulse. They conclude that for cells the size of bovine erythbrocytcs
the time constant for the effezt is 820-psce, which is iuch lonrel Lhan the
pulses ued in our, and others', experiments on, erythroc tcs. Thus, ic-. cloud
displacemLnt is not a feasible Liechanism for the effects we have detected.
The mechanism that has pr.viously been proposed for p:oacsium relec';e is
dielectric brc.kdoa, of the cell membrane (23). A difficulty with this theory
is related to the fact that Ricmann et al. calculate that the time revquired
for the bieakdown process is of the order of nanoseconds (23), yet wo have foun
thot there is a strong of penC:.,ce fpota':;ru .. relcau:. on the pulsc decay ti:
consta nt for values lvs ,- thanl 10 ccC. Thoir cughstioa that this is due to a
10 psec tim e constant for charging of the cell rmcbrane does not appear to be
valid, as previously discussed. Our data indicate that a miniium time cestant
of approximately 0.4 1sec and a minimum field strength of approxim.ately 2 kV/c:m
are simultaneously required in order to cause cellular potassium release. Thc.e
facts can be incorporated into a model which suggcsts that the releai;e of potas:.w::w
as a result of exposure to 0.75 pjsec and 0.43 Dsc pulsi-:s will be an exponeriial
fuInction oz the exposure time.
Model for Electric Field-Induced Potassium Rclea!3e
Assume that an electric field acting upon a cell membrane producos a pore or
channel in the membrane through which potassium and other ions diffuse. The
dependence of the potassium concentration in the extraceilular solution as a
function of time may he determrin.d by app]ication of diffl;ci en theory.
If it Is Isskimod th.,r the concentration gradient of potassium In the pork I:;
- 51VIA

linear, then the following relationship is obtained from Fick's law of diffusion
(40)
dN/dt =-DA (Cin - Cout) x (6)
where N - number of moles of potassium in the cell,
D - pore area or the total area of all pores if there is more than onecell,
X = the length f the pore,
Cin= concentration of potassium inside the cell
and Cout=concentration of potassium outside the cell.
It will be assumed further that Cin and Cout are uniform inside and outsid±
of the cell.
Since the total number of potassium ions is conserved, we have
dN/dt = VindCin/dt = -.Vou t dCout/dt (7)
where Vin and Vout are the interior and exterior cell volm.:rs, respectively.
If there is more than one cell, Vin is the total interior vclunmn of all cells.
From Eq (7) we have
dCout = -Vin dCin
(8)dt Vou t dt
Taking the time derivative of both sides of Eq. (6) and using Eq. (7) gives,
Vou t d2Cout DA dCin - dCouit2 -{ - -
dt X dt dt
Using Eq. (8),Vout d2cou t _ DA Vo t+ dout-D v0 + i} dC 0ut
dt " X Vin dt
- 52 -
.-' ,:

or XVou t Vin d 2 Cut + dCut =0
DA Vout + Vjin -- dt
orTD d2C0ut + dCout 0 (9)
dt dt
where D= XVout Vin
DA V0 U + Vi 1
The solution of Eq. (9) is
Cou t = C0 + (C - C) (1 - e.p (-L/- )D (10)
where CO and C are the initia! and fin~1 corcentrations, resp~c-L'ively. If th.
pore is transient in duration ,t in Eq. (10) is replac ed by t e , t.ie effect ie tim'o durirc.
which the channel is clean. lWe can write
te = Ft,
where t is the actual tine of exposure to the electric field and F is the fracti.-n
of the exposure time that the cell membrane pore is open.
An expression for F may be derived on the basis of the following model.
When the cell membrane potential have beon above a threshold voltage V for a
time to, a pore upe's in the rembrane. The pore persists as long as the mcembrne
voltage reiains above Ve and closes when the volt.ige drops below Ve . Assuming
for simplicity, thaL to a first approxination the voltage across the mcnbrane
Vm is exponential "il time.
Vm = V0 exp (-t/T P).
Vc and V0 are related by
V /V' - exp (-cO - exp (-tf/ T ) (11)
where t T is the time during a single exponential pulse that the voltage
- 53 -

iIa c r os --- iranc is greater Chan or equal to V . The tiae tfe that
th- cuKsc. is effective in jroducing a pore is
tf e t.: . tc .
I ' I the pulse repetition rate, we have
F =
A;.:endix iI it is sho; _ :hit
f = (C>:-] = ((B lyc) -
'r = C)- (tf - e c) - I (ay t)
,- = RsC (z-e Ai.ix II), so thatp-
-=C (-/' te r t/ T) (12)
Equation 12 gives t-. fraction of the total exposure time during which potassium
diffuses from t-- cell. For every type of ion or molecule that diffuses through
the pore, a ti-_ de-3ndent . concentration will develop according to Eq. (10),Each
species of ion or nolecule will. have a different value ofT D whcreas the value of F
will be the same for all ions or molecules.
In su.ary, we thus assune that after the vol tagr across the cell membrane
has ea,:ceded a critical voltnge VC for a time to, a pore or channel is produced
in the membrane. The channel persists as long as the membrane voltage remains
above VC and closes when the voltage drops below Ve . During the time the pore is
open, ions are assumed to diffuse into and out of the cell through the field-
induced pore. The diffusion leads to an exponential change in the ion concentrations.
which has the time dependence exp (-te/TD) where t:- is the effective
time the membrane channel js open and ) depend:, on the diffut ion
-54-

coefficient and the relative sizes of the channel, the cell, and the external
solution. F is the fraction of Lhe exposure time that a pore is open. Thus,
F has a dependence on the pulse decay time constant T of the form
F = a-b/Tp'
where a and b are constants as defined in Eq. 12.
For a given amount of potassium release te is a constant, C. Thus, if T
is the actual exposure time required to produce the potassium release, we have
(a - b/Tp) T = Cp
ora-b/Tp = C/T
-1 -1A plot of T vs T should be a straight line if the theory is correct. The
p
present data are not sefficient to deter,:iue the validity of this relation,.,iip,
however. Furth,,r work will include exposures to pulses with several different
decay tiiLe constants less than 0.75 lisec and belov: 0.4 psec. The determinat',iu
of the tir, . T eq, ircd for a giJven frac-'icnal potissill reica;'., for eoch *p N: I
then be plotted as described above to test the theory.
Exposure to 3 GHz Microwaves
For the exposure of erythrocytes to continuous wave microwave radiation,
6 ml of 1:1 suspension of erythrocytcs was placed in a plastic tube centered
in a section of S band waveguide. The electric field in the waveguide w.2-
parallel to the axis of the sample tube. The measured power absorbed by the
tube and cell suspension was 245 mW or 41 mW/cm3 . This was approximately equivalent
to a 40 mW/cr 2 irradiation in the far field. One control wa6 held at 31 0 C while
a second was kept at room temperature, 250 C. The frequency of the microwave
radiation was 3GHz, and the exposure time was 3 hours.
The results of the exposure of rabbit erythrocytes to 3 GHz microwaves are
summarized in Table 6. There is no significant differences in the dependent vari.bics
between the irradiated sample and the room temnperature (250 C) control
-55-
;:, -. " .... ..,,. .. ' .. . - - V -: i ; .- i 'a .. 4, -" : '
- a .. .V

In
00m co (i
+1
0- 0f I) Q)
In 0L 1- - "., )
V) C* C)UI k

gample. These results are not consistent with those of Baranski et al. (35), who
2
reported that :a 3 hour exposure of rabbit erythrocyte,; to 3G11z microwaves at lMW/cri
producod 10.8 m&% potassium release (equivalent to 19.4% potassium release) and
at a far field power density of 10 mW/cm2 an 18.0 mg% potassium *release (cquivalent
to 32.4% release) was re-ported. This contrasts with our result of 3.1% potaSCiU:i
release using the equivalent power densIty of approximately 40 wli/cm2 during a
3 hr irradiation. Sinilar disagreemz:ent is found for the hemolycis results. The
osmotic fragility riesult3 are riot directly comparable with thu! e of Baran~ki et al.
(35). Our results are compatiblc with the results of the pulied tflutive field
study which shows that a ninirinun field Of the order of 2kV/cm is re.0re torodle
any effect on the erythrocyte membrane.. The maxim electric field in the
wavegtLii('e- in ouir L periric;,t was on the order of only 10 V/cm. Tl,ui,: 011L W1
not exp-, ot any micro-waIve effect on the erythrocyte rmeinhrane pe-mc:-,')i.lity for
potassium o:--~g~'- if it is assumred tha~t the a11LOL. ion5 eenet
only upoa. the i-,dt-cd field etre-n~th in the mrlenihraL n the, pul .e. durat ion.
Micro,.wave irradiation resulted in a 26%1 inlcrease in os-motic fragility but exposu're
of erythrocytes to a temperature of 370 C for the same duration (ie. 3 hr) led to
a 54% increase thus suggesting that the apparea1t increase in the e-xposeCd
sample is attributable to microwave-induced heating.
IV S2!AYAND CO:' CLUSIO-oS
)2The Inves~tigationl of thec ffects of pulsed electrical fields on ma-mma]ian
erythrocytes indicates th:'c such fields produce tran sient pores or channels in
the cell membrane as evidencEd by the release of intracellular potassium ions an~d
hemoglobin (and perhaps other intracellular prote in molecules). The rcl)case
ha s been found to be strongly dependent upon the dutation of the electric fiel.d
pulse as Wull as the amplitude of the clectric field. Significant intracellular
potassili-M re~lease occurs uinder exposure conditions that do not restilt inI rcleS
of protein mo lecuh's, jugsiI ehtt'~s~ o f the indured port, is dependent:
upon thn. Induced 11 l, strc-ngth and the duration of the field. The mechn f ~-
-57-

- dielectric breakdowa of cell membranes does not adequately account for these
results. Thus ;the mechanism for increased membrane permeability is not presently
understood and additional studies are required to develop such a mechanism.
-fThe results of studies of the relationship of field strength and pulse duration
for the rupture of an artificial bilayer lipid membrane (oxidized cholesterol)
indicate a dependency on the pulse duration that is cinsistent with the effects
upon cell merrbrane parmeability. It: is not possible, at this tinc,however, to
directly relate these effects since the mechanis;ms are not well enough understood
in either instance. The fact that electrical field-induced alterations in
in vitro membrane model system:; have been determined to depend upon field strcugth
and pulse duration su~gcrt the need for adutional investigations of the
involve-mnt of these indevcndet variabiles in in v-vo c.1posure of nm.i.n
systems.
The 1-n viv, s w ridl, r -t-ondurted have invz!vccl the e.x-pos.are to Dutch
rabbit.; tol O tie ]-d el.ct ror,c-ni1tic field.s in aa EY .i~lator.
exposur,, has not been found to result in significant alteretions in a number of
physiological respoLIse variablus including the duration of drug induced sleeping
time a-id serum chemnistry changes, althiough there is some suggest ion (non-
statistically significant) of a post-exposure increase in certain seruri enzymes.
More exten.Aive studies on the effects of IM10 exposjre on the. serum levels of creatine
phosphokinase isoen:zymes suggest a consistint, al.bcit, small enzymie elevation.
In view of the abs.-nce of changes in the other re:ponsc variables it does nut
appear that the elevations in Cr*k isoc.nzyme levels are due to cell death.
An alternative explanation for these enzymac elevations is an increase in cell
membrane permeability induced by EMP exposure. Although this mechanism of
interaction is consistent with the in vitro results in the modl systems inves-
tigated, the differences in the exposure conditions in the in vivo and in vitro
studies preclude a dirtct comparison of the;e nsult. at this time. The condi icns
for the in vivo I exposuro ar,, such that the piil. duration cannot be varied
- 58 -
.... ,

and the field strength cannot be varied independently of the pulse repetition
rate. The in vitro Investigations of model membrane systems can be used to
define the conditions for the induction of transient alterations in membrane
permeability but the application of such findings to an assessment of rn vivo
effects in mammalian systems will require the use of an exposure facility with
greater flexibility than that presently available.
- 59 -
* - .. -----

Refer7.-es
1) C:eary, S.F. and Wangezann, R.T. Effect of Microwave Radiation on Pentobar-bital-induced Sleeping 7-.ie Proc. 1975 Annual Meeting, U.S. Nat. Comm. Inter.tCnion of Radio Science (in press).
2) Cleary, S.F. Investiga:ion of the Biological Effects of Pulsed ElectrcnagneticFIelds, Report No. 1 C:ncract No. NOOO 14-75-C-0334, Office of Naval ResearchArlington, Va. Jan. :975.
3) Cleary, S.F. Effects of Low Intensity Microwave Radiation on Mammalian SerumComponents, Report No. 4. Contract No. DADA 17-72-C-2144, U.S. Army MedicalResearch and Develop=ent Command, Washington, D.C. June 1976.
4) Wangemann, R.T. and Cleary, S.F. In vivo Effects of 2.45 GHz Microwave Radiationon Rabbit Seru= Components. Rad and Environ Biophysics.13, 89 (1976).
5) Nealon, D.A. and Henderson, A.R. Separation of Creatine Kinase Isoenzyes
in Serum by Ion-Exchange Column Chromatography. Clinical Chem. 21, 392, (1975).
6) Yafuso, M., Ke=edy, S.J., and Freeman, A.R.: Spontaneous Conductance Charges,XMultilevel Conduztance States and Negative Differential Resistance in OxidizedCholesterol 37azk Lipid Membranes J. Membrane Biol, 17, 201 (1974).
7) Eoffman, R.A.,!.3g, D.D., Arndt, R.A. and Roper, L.D.: Voltage Clan px eri-nents on Ox -e Cholesterol Membranes Modified with Excitability Inz"irigMaterial and C=_--arison with a Model. Biochim. Biophys. Acts (In Press).
3) Zimmerman,.7., ?ilwat, G., and Riemann, F.: Preparation of Erythrocyte Ghostsby Dielectric 3raakdovn of the Cell Membrane. Biochim. Biophys. Acta, 375,209 (1975).
9) Zmeran=,U., ?ilwat, G., and Riemann, F.: Dielectric Breakdown of Cell Mem-branes. Biophysical J., ii. 881 (1974).
10) Coster, H.G.L., azd Zi=ermanq U.: Dielectric Breakdown in the Membranesof Valonia Utricularis, the Role of Energy Dissipation. Biochim. Biophys.
Acta.382, 410 (1975).
11) Ohki, S.: Excitability of Artificial Membrane as an Analogy to Excitable3iological Membranes. Annals N.Y. Acad. Sci., 195, 457 (1972).
12) Crowley, J.M.: Electrical Breakdown of Bimolecular Lipid Membranes as anElectromechanical Instability. Biophysical J., 13, 711 (1973).
13) Tien, H.T. and Diana, A.L.: Black Lipid Membranes in Aqueous Media: TheEffect of Salts on Electrical Properties. J. Colloid and Interface Sci,
24, 287 (1967).
14) Feldberg, S.W. and Kissel, G.: Charge Pulse Studies of Transport Phenomena
in Bilayer Membranes, I. Steady-state Measurements of Actin-and Valinomycin-
Mediated Transport in Glycerol monooleate Bilayers. J. Membrane Biol., 20, 269
(1975).
- 60 -

15) T~n H.J.: Bilaver Li-.3f Mebanes 'BLM) Theory and Practice. Marcel Dekker,
In:., N.Y. (1974) p. 483.
16) See references lS.,pp. 471-473.
17.) ERma, A.: The Electrical Properties of Oxidized Cholesterol BilayerLUpid XMeranes Modified with Excitability-Inducing Material. Ph.D Thesis,rirginia Polytechnic 'n"s~jtute and State University (1975).
18) Sargent, D.F.: An :',a~atus for the Measurement of Very Small MembraneRelaxation Currents. 1=alytical Biochem., 70, 100 (1976).
19) Sargent, D.F.: Voltage Jump/Capacitance Relaxation Studies of BilayerStructurxe and Dynamics.' J. Membrane Biol., 23, 227 (1975).
20) See reference 13, pp. 459-461.
2)Pilvat, G., Zi.erma'nU., and Riemann, F.: Dielectric Breakdown Measurementsof Human and Bovine Erythrocyte Membranes using Benzyl Alcohol as a ProbeMolecule. Biochin. Biophys. Acta, 406, 424 (1975).
22)" Sale, A.J.E. and Hamilton, W.A.: Effects of High Electric Fields on Micro-organisms 111. Lysis of Erythrocytes and Protoplasts. Biochim. Biophys.Acta., 163, 37 (1968)
2.3) Ulemann, F., Ziermann, U., and Pilvat, G.: Release and Uptake of u:.z~oslobin(and Ions in Blood Cells Induced by Dielectric Breakdown. Biochi"=.Biophys. Ac:z, 394, 449, (1975).
24) Tsong, T.Y. am! KZingsley, E.: Hemolysis of Human Erythrocytes Induced by aRapid Te~erattz.e Jump. J. Biol. Chein., 250, 786 (1975).
25) Tsong, T.Y., Ts~n&, T.T., Kingsley, E., and Siliciano, R.: Relaxation Phenomenain Human Et:hrocyre Suspensions. Biophysical J., 16, 1091 (1976).
26) Owen, J.D., Betnion, B.C., Holmes, L.P., Eyring, E.M., Berg, M.W. andLords, J.L.: Temperature Jump Relaxations in Aqueous Saline Suspensionsof Human 'rythrocytes. Biochim. Biophys. Acta.0_203, 77 (1970).
27) Zizer-aa, U., Rienann, F., and Pilvat, G.: Enzyme Loading of ElectricallyHomogenous Human Red Blood Cell Ghosts Prepared by Dielectric Breakdown.3iochim. Biophys. Acts., 436, 460 (1976).
28) Hamilton, W.A. and Sale, A.J.H.: Effects of High Electric Fields on Micro-organisms 11. Mechanism of Action of the Lethal Effect. Biochim. Biophys.Acts, 148, 789 (1967).
29) Sale, A.J.H. and Hamilton, W.A.: Effects of High Electric Fields on Micro-organisms 1. Killing of Bacteria and Yeasts. Biochem. Biophys. Acta., 148,781 (1967).
-61-

30) Har.es, G.G. and Tallman, D.E.: Application of the Temperature-JumpTech=iques to the Study of Phospholipid Dispersions J. Am. Chem. Soc.,92, 6042 (1970).
31) Owen, J.D., Hemmes, P., and Eyring, E.M.: Light Scattering Temperaturei-zp Relaxations in Mixed Solvent Suspensions of Phosphatidyicholinevesicles. Biochim. Biophys. Acta., 219 276 (1970).
32) Neu=a=n, E. and Rosenheck, K.: rermeability Changes Induced by ElectricImpulses in Vesicular Xean.ranes. J. Membrane Biol, 10 , 279 (1972)
33) Coster, H.G.L. and Ze-rmanu,U.: Direct Demonstration of Dielectric Break-
down i:n the Membranes of Valonia Utricularis. Z. Naturforsch, 30 C, 77 (1975).
34) Coster, H.G.L. anrI ZimnermannU.: The Mechanism of Electrical Breakdown inthe Membranes of Valonia Utricularis. J. Membrane Biol. 22, 73 (1975).
33) Baranski, S., Sznigielski, S., and Moneta, J.: Effects of Microwave Irradiationin vitro on Cell Membrane Permeability. In Biologic Effects and HealthHazards of Microwave Radiation. Symposium Proceedings. Polish MedicalPublishers (1974).
35) Frey, A.H.: Differential Biologic Effects of Pulsed and Continuous Electro-magnetic Fields and Mechanisms of Effect. Annals N.Y. Acad., Sci., 238, 273(1974).
37) Schwan, H.P.: Electrical Properties of Tissue and Cell Suspensions. InKi Advances in 3ological and Medical Physics. J.H. Lawrence and C.A. Tobias,
eda. Acadenic ?ress, Inc. N. Y. (1957) Vol. V pp. 147-209.
38) Bernhardt, 3. a=d Pauly, H.: On the Generation of Potential Differencesacross the Me:hranes of Ellipsoidal Cells in an Alternating ElectricalField. Biophysik.,2, 89 (1973).
39) Schwan, H.?.: Xicrowave Radiation: Biophysical Considerations and StandardsCriteria. IEEE Trans. Biomed. Eng, BME-19, 304 (1972).
40) Guy, A.W.: A Note on EM Safety Hazards. IEEE Trans. Biomed. Eng., BME-22,464 (1975).
41) Timothy, L.K. and Bona, B.E.: State Space Analysis: an Introduction. McGraw-Hill, N.Y. (1968)
42) Gardner, M.F. and Barnes, J.L.: Transients in Linear Systems. John Wileyand Sons, Inc. N.Y. (1942). Vol. 1.
43) Rothschild, L.: The Theory of Alternating Current Measurements in Biologyand its application to the Biophysical Properties of the Trout Egg. J.Experimental Biol., 23, 77 (1946).
44) Fricke, H.: The Complex Conductivity of a Suspension of StratifiedParticles of Spherical or Cylindrical Form. J. Physical Chem., 59 168,(1955).
C45) Nystrom, R.A.: Membrane Physioloty.Prentice-Hall Inc. Englewood Cliffs ,
N.J. (1973). P. 65.
- 62 -

F7 7Appendixr I Field Induced in a Sphere by an Electric Field Pulse
As a first step in the calculation we calculate the field induced in a
s-:z-r by an A.C. Field. The model is the following, a sphere of conductivity
;-a~d alielectric constant £2is imbedded in a medium of conductivity or 1 and
dielectri.c constant e A uniform, harmonic electric field of frequency (a3 is
applied. We will find the electric field at all points in the sphere.
0i - condpctivity in region i.
w1~i £j - peruiitivity in region i.
(72.)C2.a - sphere radius
Far away from the sphere the electric field is E =EoeJ ~ Z or
1) 0 (X) uE..Ei Z a-EoeJ W r cosO
This is one boundary condition.
The second boundary condition is the equality of the normal components of
the total current J. Jin a 2n on the sphere boundary, were Jin is the nor--al
component of J in region i. In terms of a and E this condition is
2)Ol E In -02 E2n on the sphere boundary, where Eln - normal component of
E in region L. The last boundary condition is,
3) Elt E2 t on the sphere boundary, where Eit is tangential component of
E in region i. We have assumed no sources of charge or current in the volume
of interest so that
V total- [a -Y~£("7111
Since E is harmonic we have (.I)-j (ai, so that
V *0

In general E -7 0- _r f we can neglect the vector potential A'sat
contribution (i.e.. j wAl<</IV*l) we have
4) V2f - 0,
which is Laplace's equation. In spherical coordinates 4) is
!2
where r, B , and-# are the usual spherical coordinates. Separating variables
so that 4 (r,e ( ,) - f (r) P (8) X(*) gives the solution in terms of
the spherical harmonics.
5) , ,,' = (An.m *' + Bnmt -' ) Yr(e,)ytao m=-n
where An,, and Bn, are constants to be determined, and y are the sphericala~ n
harmonics. Since we have axial symmetry there is no # dependence and only
the m - 0 terms, - 1, remain n (5).and Yo - Pn (cos), where P. (cos
is the Legenendre polynomial . Now we write a general solution of ) in regions
1 and 2. In region 1 as ra 0, 1 or cosO - EorP1 (cosG).
Thus the most general solution in region I is
6) E - o e + E " r"'P, (cose) , where C are constants
F-6to be determined. In region 2, must be finite for r - 0, thus
eOs
n,,o
Now we use the boundary couditionsEqs. 2) and 3)
E~r~&bgo) A
A A Awhere r, and are the unit vectors in the spherical coordinate system.
1-2

Thus En=
Et Eo E here E .4 andE- -
Since 0 we have
Et 86+
Instead of continuity of Et we can use continuity off -as the second
boumdary condition. Both lead to the result above that at the boundary, where
r a,(2)
7) - C. &
8) (o1 ) (2)
(1) 2 n+1 (2)9) C -aU C ,a>2
(1) (2)Since the potential is arbitrary to a constant, we set CO - 0, Co o 0.
Nov using 2) and the fact that P 'a are orthogonal gives
(2)
lo) -I R'e o- 2. = -2 Ci"- ,[-(f'I (I1 2) =~' _--(.T C-n : (2).-
lz - n (5 2
Comparing 9) and 11) givesC(1) =c (2) , u> 2
We rwrite 7) and 10) as
0 (1) 3 (2) 37) C1 a C1 + Eo a
-3

Fo, C2 1 a C, (Eoa. Substituting in lo) gives
a C j +E
3- ( 51 /(:2C, + (Y)Eo
EEj + 3
201+1
Thus inside the sphere
t geeral 6 i.4 ond + i j.U 07od + JWQ.'6o, e.' - dielectric constant in mKS
mits.
So we can make the replacement ; or by factoring JCL* we have-1 *0
UAi = I we.'":L'.
TWO 2) 3 AJ Ab0
26;+& C
1"4

That is, inside a sphere in a uniform harmonic electric field E.we have
(siphere) 3 3C ) A
± is the complex dielectricconstant of the external
Smedium.
2Is the complex dielectric con-2stant of the sphere.
if the external medium is air
If the frequency is sufficiently low
2. gaa
is. the fields inside and outside the sphere are 90 out of phase and
11)1 gphere) -(teo~E
For biological tissueT 2t 10' mho -cm I= 1 mho -m
c, M (36V X IO I -c~s /mn =f UrI2f a1
where f is the frequency in Hertz.
Thus for a sphere of biological tissue of conductivity 10 -2 mlio-cm'1 in a
uniform harmoic external field E~eiAt, the field In the sphere i5 approximately
g(sphare) ,( ._4R-)E whre B unit vector In the Z direction and
C.L'

( This isz the result obtained by. Schwan
C' Usi; :he general expression in equation (11) we can derive the field induced
-7 a pulse by using the tec:inque of Fourier analysis. For a harmonic
varia:on in the external field Eo () ,t) the field induced in the sphere is
wherew C& 13P -s a constant dependent on the conductivity of the sphere.
We can consider the -Wt) to be the Fourier components of a complex wave - e.g.
a pulse, in which case the field induced in the sphere is given by the Fourier
ij-n:gral do
f o . it
COat dw
Thus
AThis is the x component of a similar expression derived by Guy for an
electromagnetic pulse (40).
1 6-
Thus
-1- !.12!w E•t
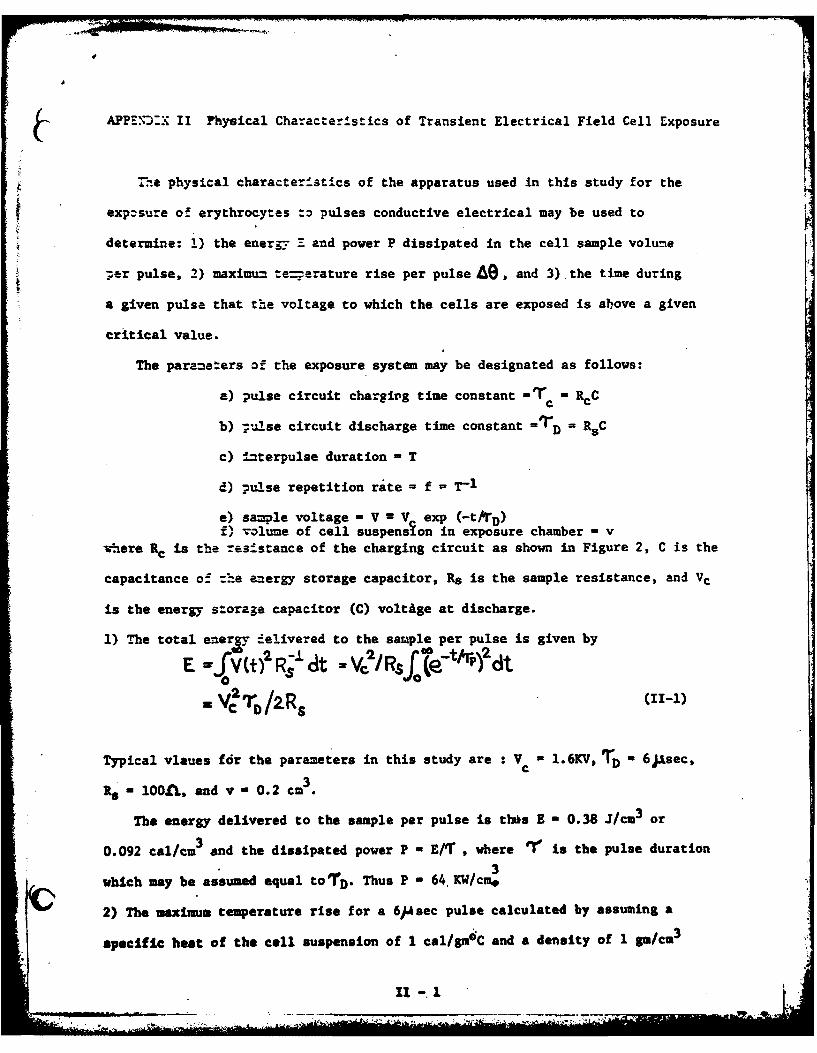
9-W
APPEN X II Physical Characteristics of Transient Electrical Field Cell Exposure
The physical characteristics of the apparatus used in this study for the
expzsure of erythrocytes -o pulses conductive electrical may be used to
determine: 1) the energy E and power P dissipated in the cell sample volume
-er pulse, 2) maximum te--.erature rise per pulse 6, and 3) the time during
a given pulse that the voltage to which the cells are exposed is above a given
critical value.
The parameters of the exposure system may be designated as follows:
a) pulse circuit chargirg time constant =r = RcCc c
b) .--,Ise circuit discharge time constant ='ID = RsC
c) interpulse duration - T
d) pulse repetition rate = f - T- 1
e) sample voltage - V- V exp (-t/rD)f)v olume of cell suspension in exposure chamber - v
*.ere Rc is the resistance of the charging circuit as shown in Figure 2, C is the
capacitance o! :.a energy storage capacitor, Rs is the sample resistance, and VC
is the energy storage capacitor (C) voltAge at discharge.
1) The total energy delivered to the sample per pulse is given by
E f)ORj1 (it W V/ Rsf(t- NO) dt
Typical vlaues for the parameters in this study are : V = 1.6KV, TD - 6jsec,c
- 100A1., and v - 0.2 cm3.
The energy delivered to the sample per pulse is thtks E - 0.38 J/cm3 or
0.092 cal/cm3 and the dissipated power P - E/1T , where 'I Is the pulse duration
3which may be assumed equal torD. Thus P - 64 KW/cm*
2) The maximum temperature rise for a 6/Asec pulse calculated by assuming a
specific heat of the cell suspension of 1 cal/gmC and a density of I gm/cm3
i lII -. 1
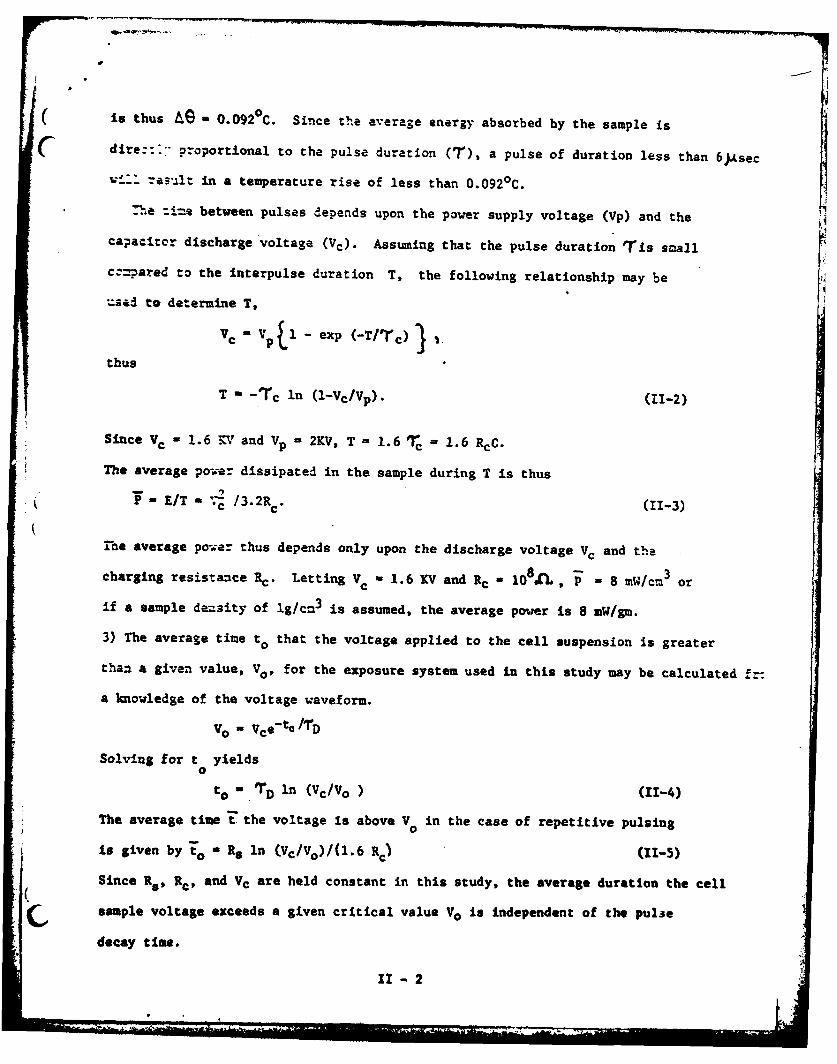
is thus G 0.092 C. Since the average energy absorbed by the sample is
C dire::-- proportional to the pulse duration (T), a pulse of duration less than 6)Asec
wll result in a temperature rise of less than 0.0920 C.
l T-,e :iue between pulses depends upon the power supply voltage (Vp) and the
capacitor discharge voltage (Vc). Assuming that the pulse duration Tis small
cz-ared to the interpulse duration T, the following relationship may be
..sad to determine T,
Vc - V,[1 - exp (-T/rc)
thus
T - -Tc in (l-Vc/Vp). (11-2)
Since Vc - 1.6 KV and VP = 2KV, T - 1.6'T = 1.6 RcC.
* The average pow-er dissipated in the sample during T is thus
SE/T - P /3.2R (11-3)
T1he average power thus depends only upon the discharge voltage Vc and the
charging resistance Rc . Letting Vc - 1.6 KV and Rc 108.L P 8 mW/cm3 or
if a sample de=3ity of lg/cM 3 is assumed, the average power is 8 mW/gm.
3) The average time to that the voltage applied to the cell suspension is greater
than a given value, Vo, for the exposure system used in this study may be calculated f-
a knowledge of the voltage waveform.
Vo - vce'to/ D
Solving for t yields0
to . T D in (vc/Vo ) (11-4)
The average time t the voltage is above V in the case of repetitive pulsing
is given by to - R. In (Vc/Vo)/(1.6 RC) (11-5)
Since Re, Re, and Vc are held constant in this study, the average duration the cell
sample voltage exceeds a given critical value Vo is independent of the pulse
decay time.
II - 2

7 1I
C APPENDIX III Calculation of the Voltage across Cell Membranes Produced by an
External Electric Field.
tAs discussed in the text, the charging time constant for the capacitanceBT
of a cell membrane is the same as the relaxation time constant m measured
( In dielectric dispersion studies. Given that the response of the membrane voltage
to a sep change in the external electric field is an exponential change with
time constant TR, we can use the concepts of the transfer function and
Laplace transform (41) to determine the membrane voltage for an arbitrary applied
field pulse. We will first calculate the membrane transfer function and then
use the transfer function to calculate the membrane voltage for an applied
field which is an exponentially decaying pulse.
The transfer function H(S) is defined in the transformed domain, S, by
H(S) R (III-])I (S)
where I (S) is the input and R(S) is the response in the transformed domain.
If i(t), and r(t) are the input and response in the time domain then
r(t) L- 1 (I(S) H (S)),
where L71 is the inverse Laplace transform.
The voltage across the cell membrane at points on the membrane where the
voltage is a maximum is related to a uniform D.C. electric field Eo as follows
(38).
V- FjaE-o , (111-2)
where Fj is a dimensionless form factor specific for a given cell shape and
orientation relative to the field and aj is the semi-major axis of the cell
parallel to the external field. This result and those to follow are exact
only in the case of an infinitely dilute suspension of cells. However, related
theories have been shown to be accurate to within a few percent for solid
spheres in a concentration of 36Z (43) and to give good agreement with

experie-. for suspensions of u=iform spherical cells near total packing (44).
The results should apply quite well to the experiments of Riemann et al. (23)
ir, -hch the cell concentrations were 1% - i0%.
for a step charge of Eo we have
r(t) - V t) - Fa aj Zo (1 - exp (-t/TR)). (111-3)
Using a table of Laplace transforms in Ref. 42 we find that for a unit step
change i(t) we have
I(S) -1
And
R~ F ai Es(0+-TRSThus B(S) -R(S)II(S) = J-j (1 + TRS)- (111-4)
f the input is now
iCt) -Eo exp €-t/Ir',),
."e=
SI(S) -E0oT (I + r S)->5
In erting 4) a=z. 5) i Eq. 1) gives the voltage across the membrane
The maxim- value of V(t) is found to be at a time tmax given by
The maximum value of Vm(t) is then
CE
III- ?.. l

(7 Some useful limits are
2*Vm (t) Fija E. r
ivm(t) =F.1E:,,
III - 3