Embed Size (px)
Citation preview
G. Cowan Lectures on Statistical Data Analysis Lecture 2 page 1
Statistical Data Analysis: Lecture 2
1 Probability, Bayes’ theorem2 Random variables and probability densities3 Expectation values, error propagation4 Catalogue of pdfs5 The Monte Carlo method6 Statistical tests: general concepts7 Test statistics, multivariate methods8 Goodness-of-fit tests9 Parameter estimation, maximum likelihood10 More maximum likelihood11 Method of least squares12 Interval estimation, setting limits13 Nuisance parameters, systematic uncertainties14 Examples of Bayesian approach
G. Cowan Lectures on Statistical Data Analysis Lecture 2 page 2
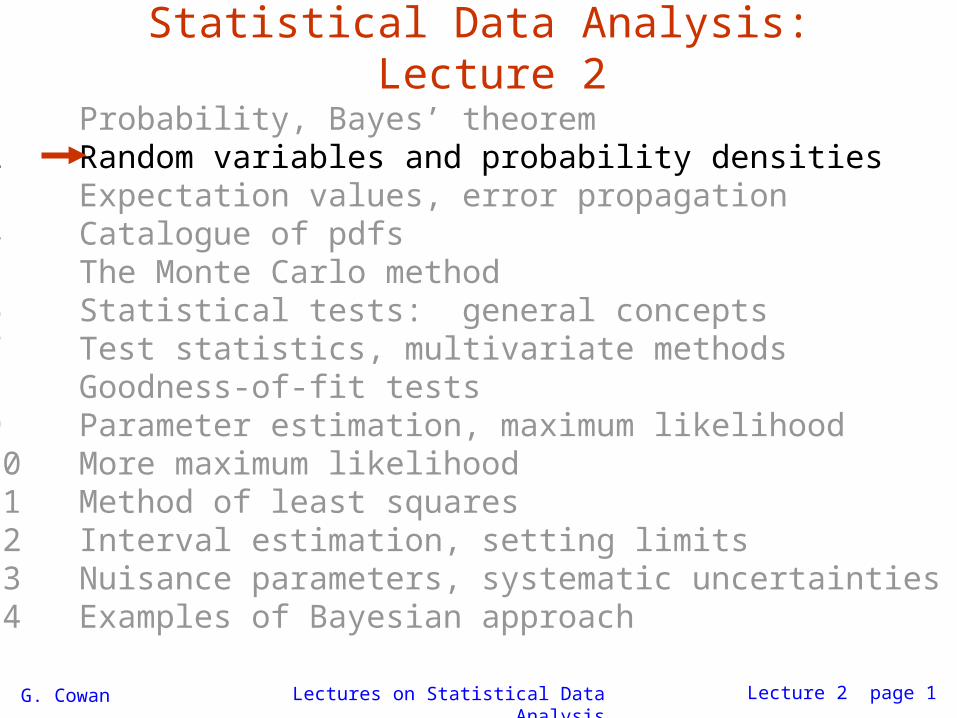
Random variables and probability density functionsA random variable is a numerical characteristic assigned to an element of the sample space; can be discrete or continuous.
Suppose outcome of experiment is continuous value x
→ f(x) = probability density function (pdf)
Or for discrete outcome xi with e.g. i = 1, 2, ... we have
x must be somewhere
probability mass function
x must take on one of its possible values
G. Cowan Lectures on Statistical Data Analysis Lecture 2 page 3
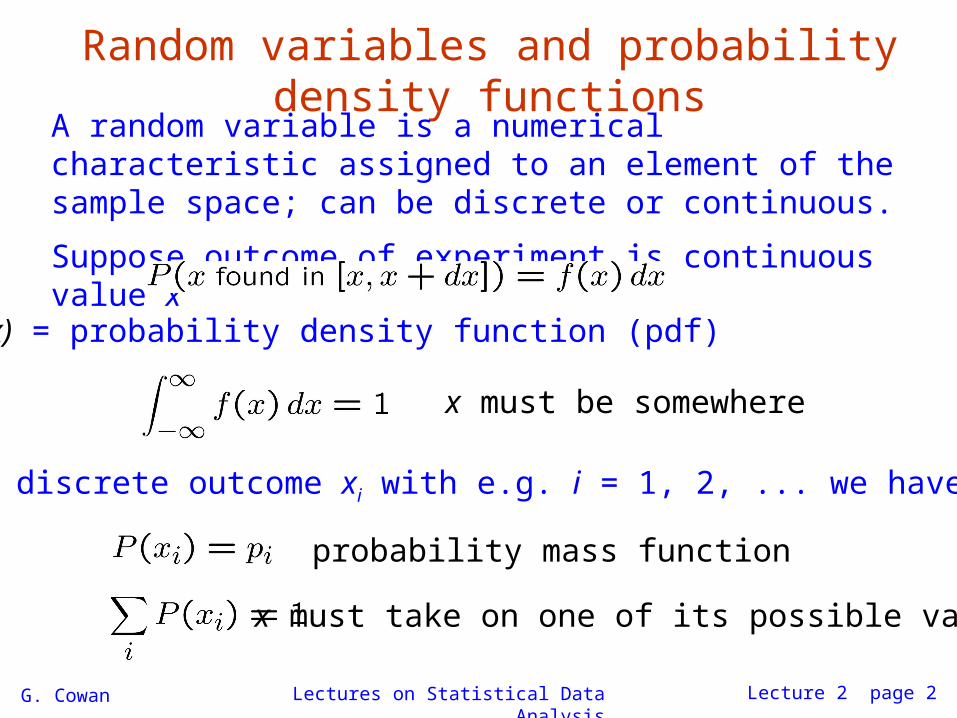
Cumulative distribution functionProbability to have outcome less than or equal to x is
cumulative distribution function
Alternatively define pdf with
G. Cowan Lectures on Statistical Data Analysis Lecture 2 page 4
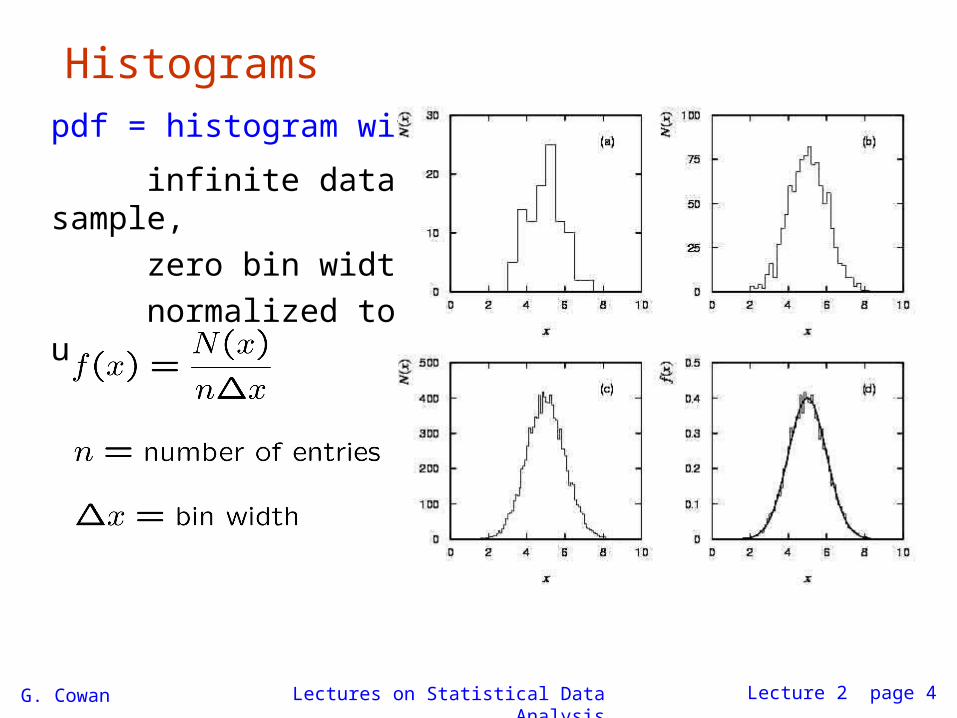
Histogramspdf = histogram with
infinite data sample,
zero bin width,
normalized to unit area.
G. Cowan Lectures on Statistical Data Analysis Lecture 2 page 5
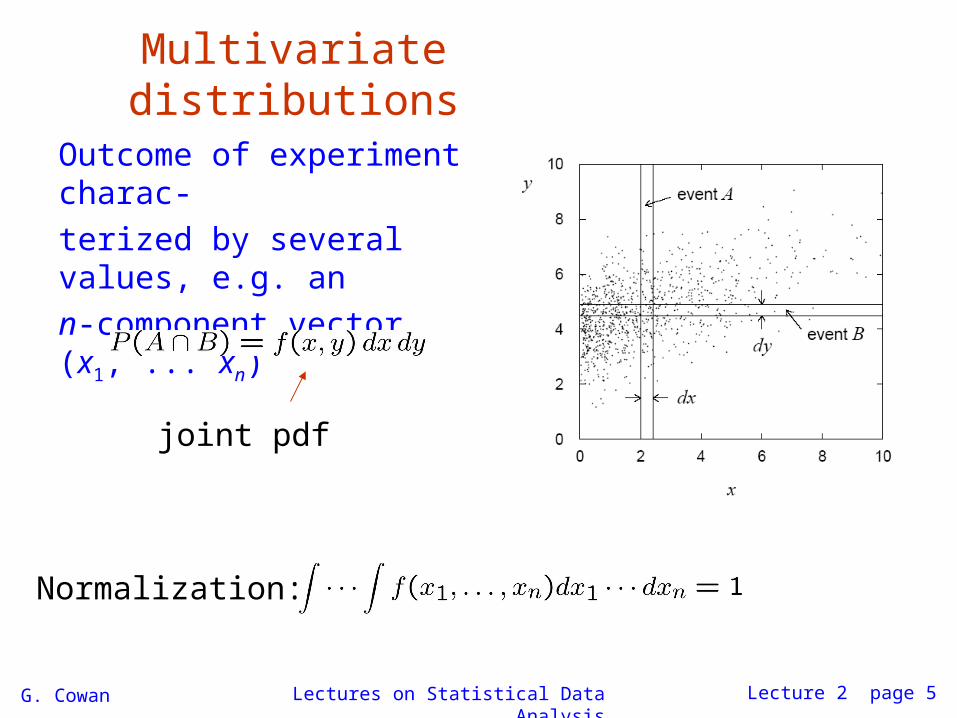
Multivariate distributions
Outcome of experiment charac-
terized by several values, e.g. an
n-component vector, (x1, ... xn)
joint pdf
Normalization:
G. Cowan Lectures on Statistical Data Analysis Lecture 2 page 6
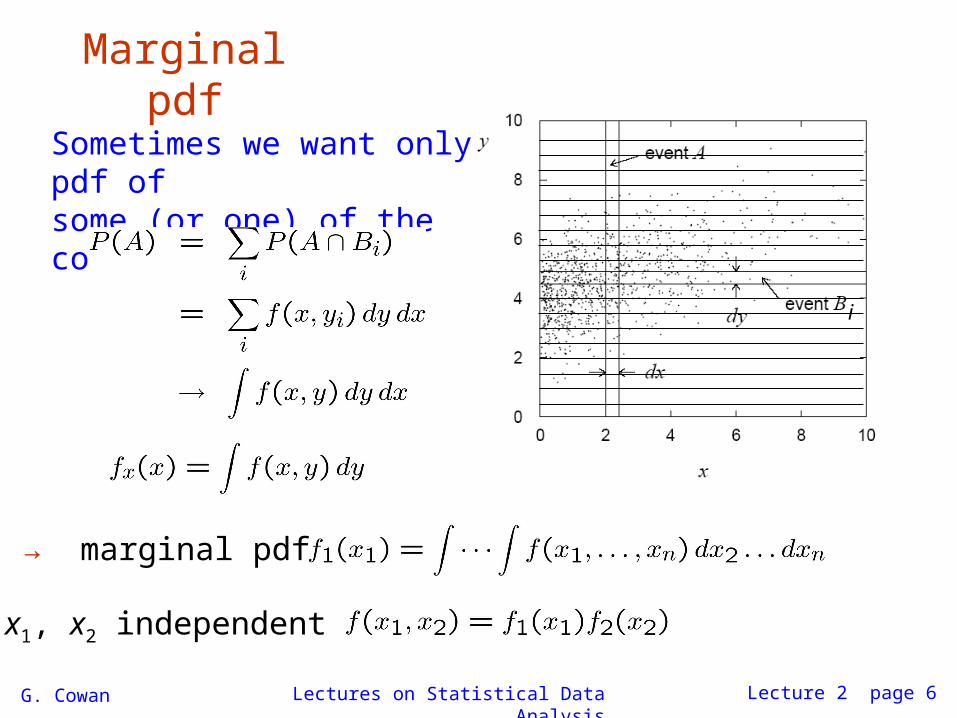
Marginal pdf
Sometimes we want only pdf of some (or one) of the components:
→ marginal pdf
x1, x2 independent if
i
G. Cowan Lectures on Statistical Data Analysis Lecture 2 page 7
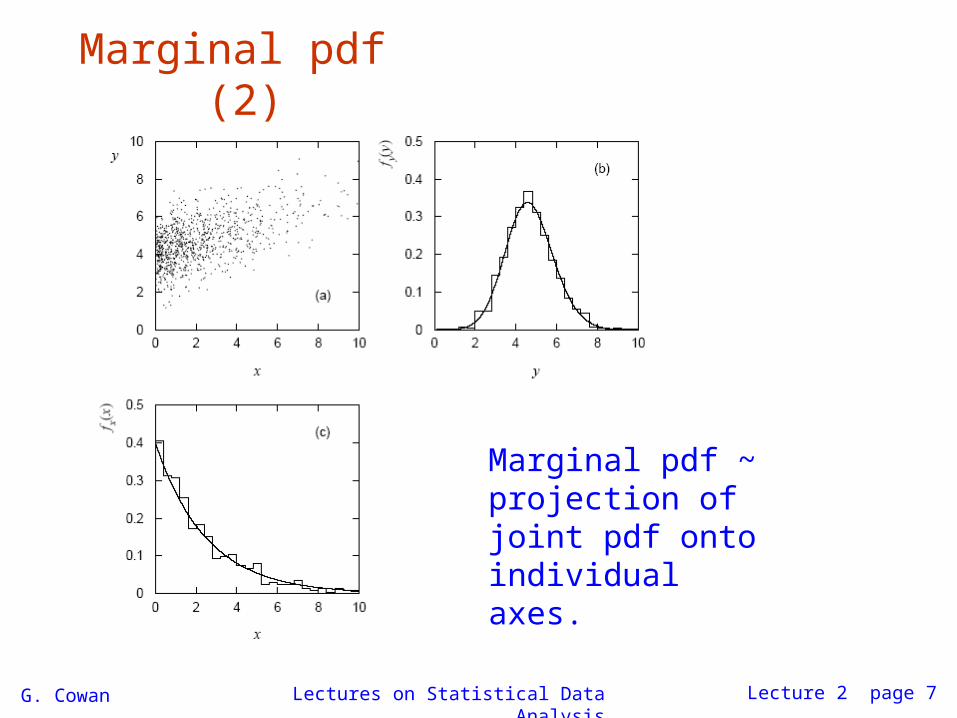
Marginal pdf (2)
Marginal pdf ~ projection of joint pdf onto individual axes.
G. Cowan Lectures on Statistical Data Analysis Lecture 2 page 8
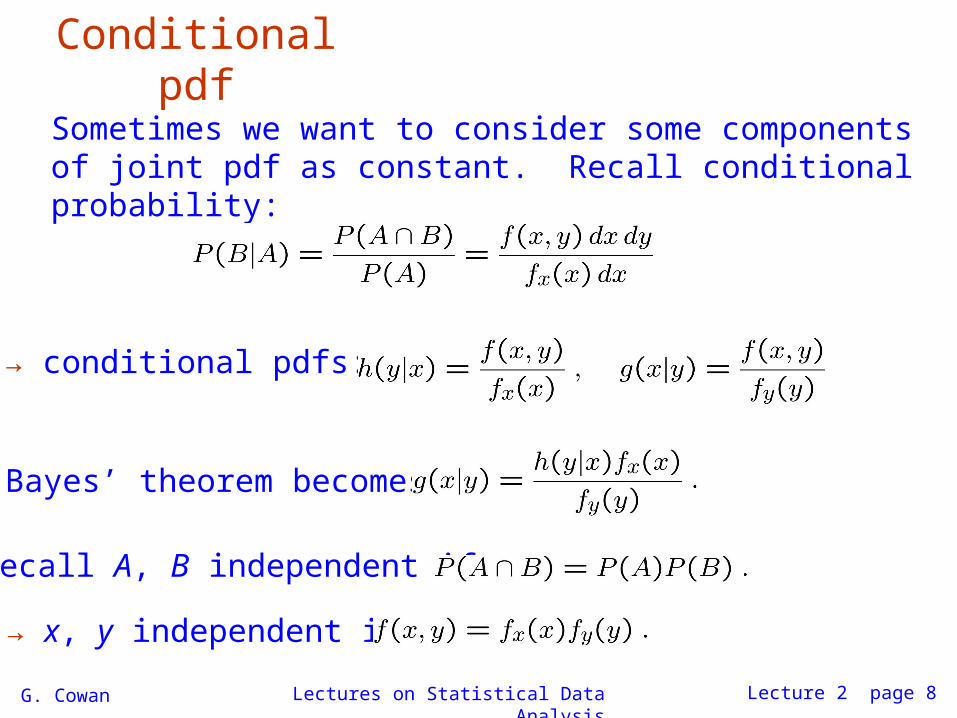
Conditional pdf
Sometimes we want to consider some components of joint pdf as constant. Recall conditional probability:
→ conditional pdfs:
Bayes’ theorem becomes:
Recall A, B independent if
→ x, y independent if
G. Cowan Lectures on Statistical Data Analysis Lecture 2 page 9
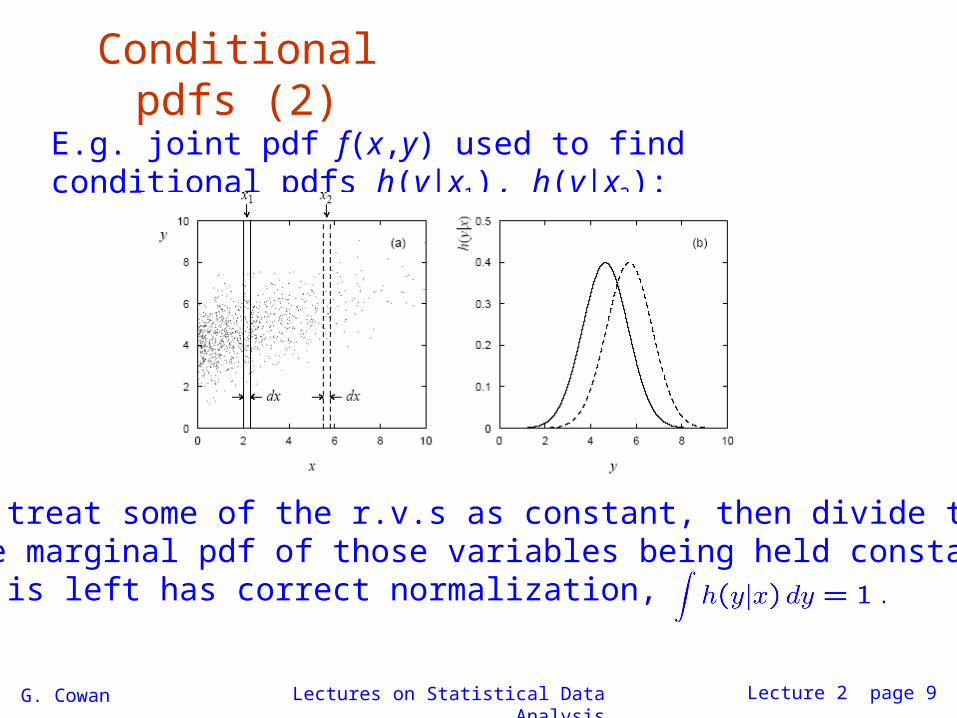
Conditional pdfs (2)
E.g. joint pdf f(x,y) used to find conditional pdfs h(y|x1), h(y|x2):
Basically treat some of the r.v.s as constant, then divide the joint pdf by the marginal pdf of those variables being held constant so that what is left has correct normalization, e.g.,
G. Cowan Lectures on Statistical Data Analysis Lecture 2 page 10
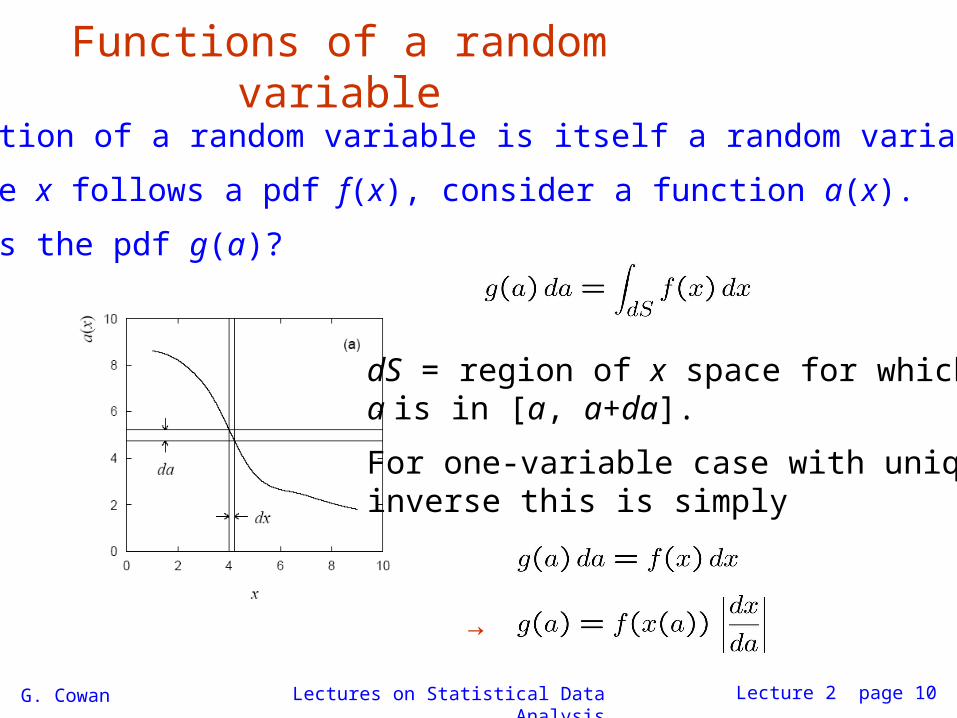
Functions of a random variable
A function of a random variable is itself a random variable.
Suppose x follows a pdf f(x), consider a function a(x).
What is the pdf g(a)?
dS = region of x space for whicha is in [a, a+da].
For one-variable case with uniqueinverse this is simply
→
G. Cowan Lectures on Statistical Data Analysis Lecture 2 page 11
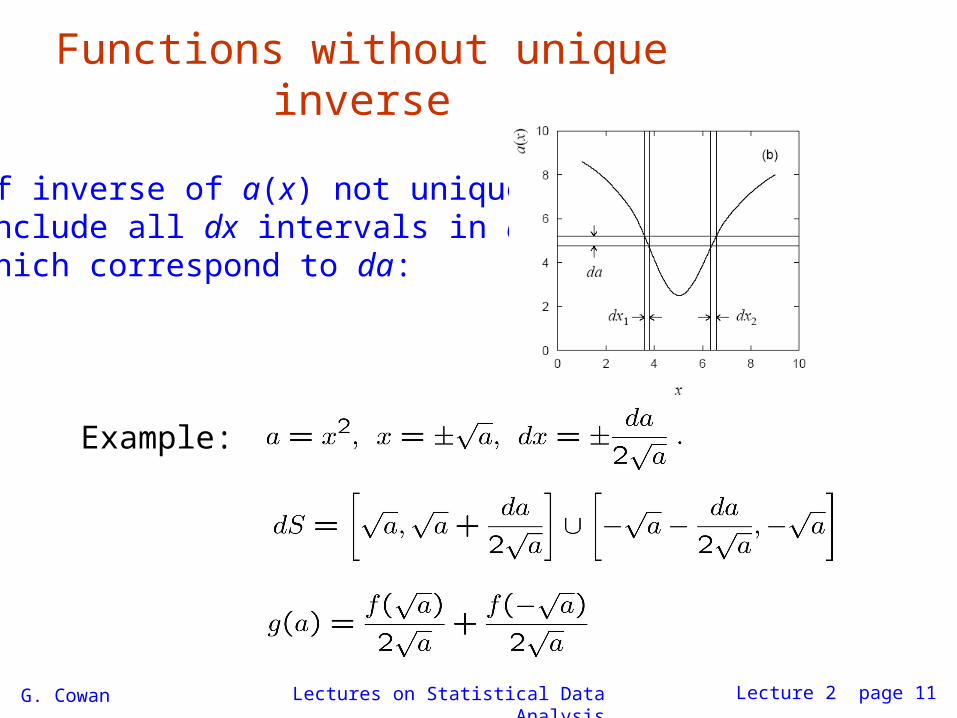
Functions without unique inverse
If inverse of a(x) not unique, include all dx intervals in dS which correspond to da:
Example:
G. Cowan Lectures on Statistical Data Analysis Lecture 2 page 12
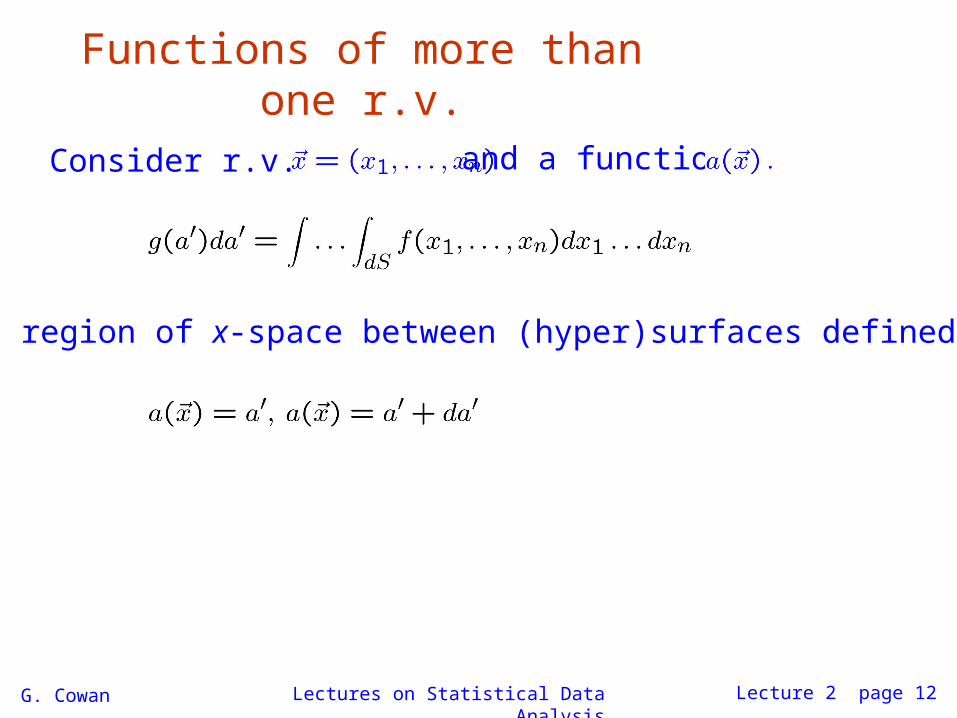
Functions of more than one r.v.
Consider r.v.s and a function
dS = region of x-space between (hyper)surfaces defined by
G. Cowan Lectures on Statistical Data Analysis Lecture 2 page 13
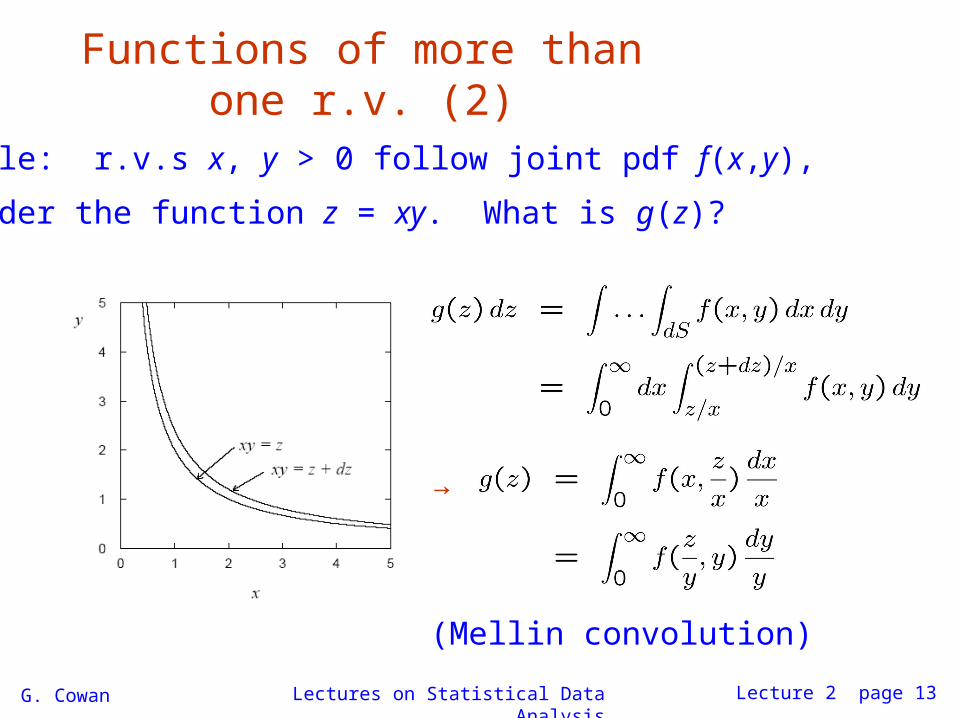
Functions of more than one r.v. (2)
Example: r.v.s x, y > 0 follow joint pdf f(x,y),
consider the function z = xy. What is g(z)?
→
(Mellin convolution)
G. Cowan Lectures on Statistical Data Analysis Lecture 2 page 14
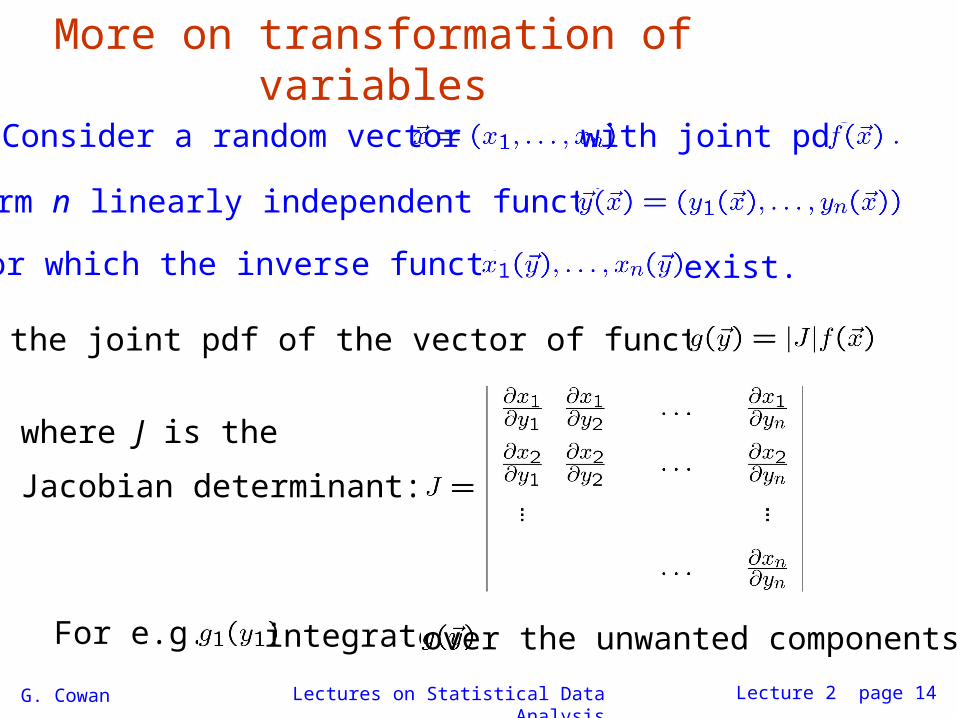
More on transformation of variables
Consider a random vector with joint pdf
Form n linearly independent functions
for which the inverse functions exist.
Then the joint pdf of the vector of functions is
where J is the
Jacobian determinant:
For e.g. integrate over the unwanted components.
G. Cowan Lectures on Statistical Data Analysis Lecture 2 page 15
Wrapping up lecture 2
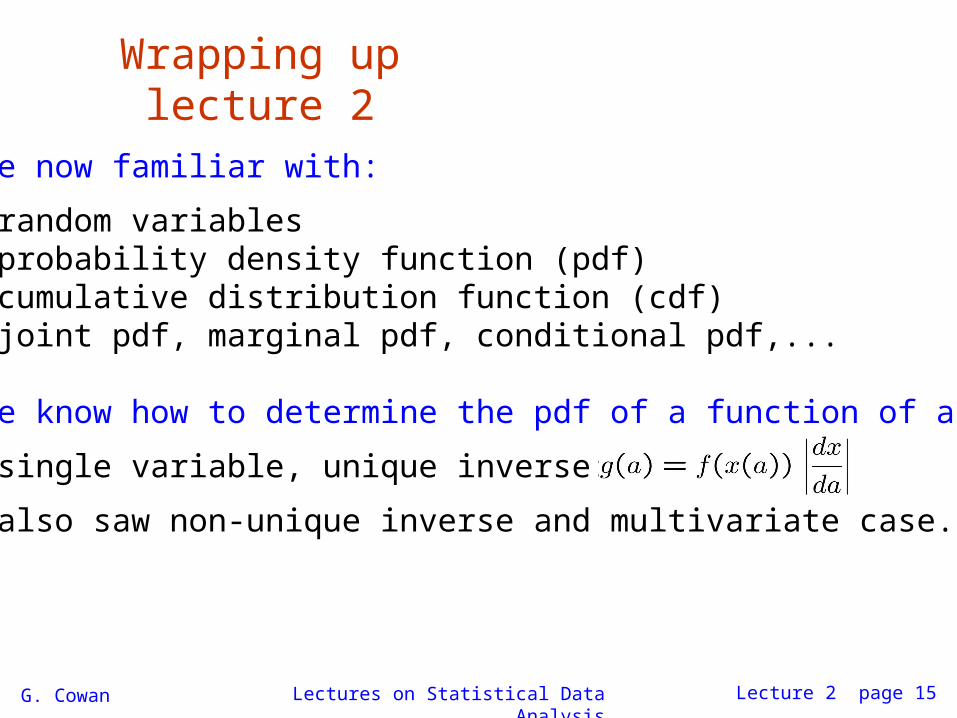
We are now familiar with:
random variablesprobability density function (pdf)cumulative distribution function (cdf)joint pdf, marginal pdf, conditional pdf,...
And we know how to determine the pdf of a function of an r.v.
single variable, unique inverse:
also saw non-unique inverse and multivariate case.