Embed Size (px)
Citation preview

G
J
Ri
Pa
b
a
ARRAA
JFI
KPLPD
1
tiafibticut
u
CdfTB
(
0d
ARTICLE IN PRESS Model
HE-1510; No. of Pages 16
Journal of Health Economics xxx (2011) xxx– xxx
Contents lists available at ScienceDirect
Journal of Health Economics
j ourna l ho me page: www.elsev ier .com/ locate /econbase
egulatory policy and the location of bio-pharmaceutical foreign directnvestment in Europe�
amina Koeniga,∗, Megan MacGarvieb
University of Rouen and Paris School of Economics, 48 bd Jourdan, 75014 Paris, FranceBoston University and NBER, Boston University School of Management, 595 Commonwealth Ave, Boston, MA 02215, United States
r t i c l e i n f o
rticle history:eceived 20 March 2009eceived in revised form 29 June 2011ccepted 7 July 2011vailable online xxx
EL classification:23
a b s t r a c t
This paper examines the relationship between cross-country differences in drug price regulation andthe location of biopharmaceutical Foreign Direct Investment (FDI) in Europe. Simple theory predicts thatprice regulation in one country might affect total investment, but not the location of that investment, ifsales are global. Nevertheless, some manufacturers threaten that the introduction of price regulation ina country will motivate them to move their investments to other countries. Are such threats cheap talk,or is there evidence that firms avoid price-controlling countries when making FDI location choices? Weuse data on 527 investments initiated in 27 European countries between 2002 and 2009 and find that
18
eywords:harmaceutical industryocation choicesrice regulations
investors are less likely to choose countries with price controls, after controlling for other determinants ofinvestment. We also observe a relative decline in investment in countries that increased the stringency ofregulatory regimes during our sample period. The effect is restricted to non-manufacturing investmentsand is most robust for those related to administrative functions.
© 2011 Elsevier B.V. All rights reserved.
nrrrdtrenap“
iscrete choice model
. Introduction
Pharmaceutical firms’ decisions to invest abroad are at the cen-er of public attention in Europe, as part of the broader debate overnternational outward investment. Can rich countries remain anttractive location for manufacturing firms when confronted witherce competition from low-wage countries? A frequent responsey economists to concerns about such off-shoring is that rich coun-ries have a comparative advantage in high-tech skill-intensivendustries, and that outflows of traditional manufacturing will beompensated for by inflows or creation of innovation-based man-facturing plants. The pharmaceutical industry is one example of
Please cite this article in press as: Koenig, P., MacGarvie, M., Regulatory polin Europe. J. Health Econ. (2011), doi:10.1016/j.jhealeco.2011.07.005
his type of industry.The European pharmaceutical industry is among the most reg-
lated in the world. Regulation takes the form of strong safety
� This paper was prepared for the NBER Location of Biopharmaceutical Activityonference. We thank Fabrice Hatem, Sylvie Montout and the Agence Francaisees Investissements Internationaux (AFII) for providing the FDI data. We are grate-ul to Iain Cockburn, Mercedes Delgado, Jeff Furman, Margaret Kyle, Keith Maskus,hierry Mayer and Sam Thompson for helpful suggestions. Vanessa Wong and Abbyourgeois provided excellent research assistance.∗ Corresponding author.
E-mail addresses: [email protected] (P. Koenig), [email protected]. MacGarvie).
r“wtaUpoptidt
167-6296/$ – see front matter © 2011 Elsevier B.V. All rights reserved.oi:10.1016/j.jhealeco.2011.07.005
orms with certification processes for drugs, intellectual propertyights, and price control mechanisms. Governments justify priceegulation as a means to promote equity in access to drugs andeduce costs to national health care systems. Simple theory pre-icts that price regulation in any particular country might affecthe total investment of the pharmaceutical industry, if regulationeduces total expected profits from investment. However, to thextent that the market for pharmaceuticals is a global one, we mightot expect to observe any correlation between regulatory regimesnd the location of investment. And yet it has been suggested thatharmaceutical firms respond to controversial policy choices byvoting with their feet” and avoiding locations with stricter priceegulation. A report of the U.S. Trade Representative observes that,R&D in the United States quadrupled between 1990 and 2003,hile R&D in Europe grew by only 2.6 times. One of the factors
hat may be contributing to this relative decline is the regulatorynd competitive environment for pharmaceuticals in Europe” (see.S. Dept. of Commerce, 2004, p. 34). Most recently, in response torice cuts of up to 23% on patented drugs in Spain, the presidentf the Spanish pharmaceutical industry association Farmaindustriaredicted job losses and said that the cuts “will mean the destruc-
icy and the location of bio-pharmaceutical foreign direct investment
ion of the current model of pharmaceutical industry that operatesn Spain.” (The Pharmaletter, May 17 2010, “Spain announces bigrug-price cuts, aiming for 1.6 billion savings”). Merck was saido be “re-evaluating” its investment in Brazil after that country
ING Model
J
2 f Hea
iAA2cepApiajdr
opvtscpfNatd
tEtopS
2i
cel
2
astccaadcchmpvp(ao
ekdfscpgoScbipU
reptT
udtL2gLusadwdiGN2Kwtcserarkaeioaswapeutic reference pricing) in the empirical section of this paper.We define a country as having a reference pricing regime whenit sets reimbursement levels for drugs with reference to prices of
ARTICLEHE-1510; No. of Pages 16
P. Koenig, M. MacGarvie / Journal o
mposed compulsory licensing on efavirenz, Merck’s anti-retroviralIDS drug. (The Economist, May 10 2007, “Brazil’s AIDS Program:
conflict of goals”). In response to reform proposals in Germany002, the Pharma Marketletter reported that the pharmaceuticalompany Merck KGaA “warned that the reforms could . . . influ-nce where it locates a new 300-million euro biopharmaceuticalsroduct plant, its largest-ever investment.” Die Welt reported onugust 25, 2003 that “the American pharmaceutical firm Pfizerlans to reduce certain activities in Germany following upcom-
ng reforms to the health system. Pfizer has decided to transfern R&D group from Freiburg, Germany to the United Kingdom. 150obs will be affected by this decision.” There is also evidence thatrug launches are delayed in countries with more stringent priceegulations (Danzon et al., 2004; Kyle, 2006, 2007a).
In this paper, we investigate the determinants of the locationsf foreign investments in the biopharmaceutical sector in 27 Euro-ean countries between 2002 and 2009. We investigate whetherariation in policy regimes across countries helps explain varia-ion in the locations of foreign investments in the pharmaceuticalector. We present the first evidence of the impact of regulatoryonstraints on the location choice of affiliates by multinationalharmaceutical firms. Our empirical results suggest that manu-acturing investments are not associated with regulatory policy.on-manufacturing investments in Western Europe are negativelyssociated with the strength of price regulation in a given coun-ry. However, these findings appear to be driven in large part by aecline in investments related to administrative functions.
The rest of the paper is structured as follows. Section 2 describeshe regulatory policy schemes in the pharmaceutical industry inurope and sketches the theoretical framework. Section 3 presentshe empirical strategy to estimate the effect of regulatory policyn the location choices of pharmaceutical firms. In Section 4 weresent the investment data, Section 5 explains the results andection 6 concludes.
. Regulatory policy and investment in the pharmaceuticalndustry
We first describe the different policies used by Europeanountries to control the pricing of drugs and reimbursement ofxpenditures. Then we discuss the theoretical effect of price regu-ations on the location of pharmaceutical investment.
.1. Price regulation policies in Europe
The pharmaceutical industry is perhaps the industry mostffected by regulatory choices. Policies concerning the duration andtrength of exclusivity awarded by patents are particularly impor-ant. The latter policies are essentially consistent across Europeanountries (although the pharmaceutical industry has expressedoncern over the enforcement of these rights in some countries),s are policies relating to advertising, wholesale distribution, pack-ging and labeling of drugs. These homogenized policies are byefinition not expected to influence the profitability of the differentountries. This is however not the case in the medical sector. As dis-ussed at length by Permanand and Mossialos (2005), “Despite thearmonizing imperative of the SEM, there is still no single Europeanarket in medicines.” European countries retain control over the
ricing of drugs and reimbursement of expenditures. Countriesary in the use of reference pricing, fixed pharmacy profit margins,
Please cite this article in press as: Koenig, P., MacGarvie, M., Regulatory polin Europe. J. Health Econ. (2011), doi:10.1016/j.jhealeco.2011.07.005
rofit controls for manufacturers, as well as along other dimensionssee Table 2 of Kyle (2007a) as well as Jacobzone (2000)). Countrieslso vary in their attitudes to parallel trade, or the re-importationf drugs from countries in which prices are lower. All EU countries
tPf
PRESSlth Economics xxx (2011) xxx– xxx
xert some degree of influence over expenditures on drugs mar-eted within their boundaries, but individual governments employifferent policies. Governments may use formularies (lists of drugsor which patients will be reimbursed), controls on doctors’ pre-cribing behavior, pharmacists, reimbursements of prescriptionosts, and/or price controls. A common mechanism for controllingrices is to set a price not higher than that of a currently availableeneric substitute, or to set the price with reference to pricesf the same drug in neighboring countries. Some countries (likepain and the UK) place controls on the profits of pharmaceuticalompanies. Others, like Denmark, do not control the price chargedy the manufacturer, but prohibit price increases after a drug is
ntroduced. Many EU countries also regulate the profit margins ofharmacists. Some countries (like Belgium, France, Spain and theK) also regulate expenditures on drug marketing (Kyle, 2007a).
Our empirical investigation concentrates on the following priceegulation policies, which we now define: price controls, refer-nce pricing, and therapeutic reference pricing, in each of whichrice freezes and price cuts can be introduced. Detailed informa-ion on the use of these polices in different countries is available inables 1–3.
Price controls refer to policies that directly control the man-facturer’s, wholesale, or retail price of pharmaceuticals. Theeterminants of the price vary from country to country. Coun-ries like Belgium, Spain, France, Hungary, Poland, Latvia, andithuania set prices after negotiation with drug companies (Kyle,007a; Kanavos, 2002; Mossiolos et al., 2004). Other countries (Bul-aria, Czech Republic, Estonia, Finland, Greece, Hungary, Ireland,atvia, Lithuania, Norway, Poland, Romania, Slovenia, Sweden)se a weighted average of prices charged for the same drug inelected other countries (Norway substituted reference pricing for
price cap starting in 2003 for a limited number of off-patentrugs (Brekke et al., 2008)). Reference pricing is a practice inhich governments set a maximum reimbursement amount forrug purchases with reference to prices of substitute drugs. It
s used in Belgium, Bulgaria, Czech Republic, Denmark, Estonia,ermany, Greece, Hungary, Italy, Latvia, Lithuania, Netherlands,orway,1 Poland, Portugal, Romania, Slovakia, and Spain (Kyle,007a; Mossiolos et al., 2004; Podnar et al., 2007). Danzon andetcham (2003) notes that it has typically been used in countriesithout price controls, and is seen as a less stringent alternative
o explicit price controls. However, Danzon notes, “In practice,ertain forms of reference pricing can be de facto at least astringent. . .particularly for new products.” The stringency of ref-rence pricing largely depends on which drugs’ prices are used foreference. In some cases, only generic equivalents with the samective ingredient fall into the reference group. In other cases, theeference group consists of any therapeutic substitute on the mar-et, and the drug’s prices in other countries are taken into consider-tion. Most, but not all, countries exempt patented drugs from ref-rence pricing schemes. As Danzon notes, “The decision whether tonclude on-patent products and to cluster on-patent products withff-patent products raises a critical trade-off between cost controlnd incentives for R&D, in addition to the issues of therapeutic sub-titutability.” These two forms of price setting for reimbursementill be respectively denoted RP (reference pricing) and TRP (ther-
icy and the location of bio-pharmaceutical foreign direct investment
1 Norway uses a step-price system known as “trinnpreiser” for off-patent drugshat clusters at the ATC5 level and resembles a reference price system (PPRI Countryrofile, Norway). We follow Kyle (2007a,b), in which this is classified as a RP systemor the purposes of data analysis.

ARTICLE IN PRESSG Model
JHE-1510; No. of Pages 16
P. Koenig, M. MacGarvie / Journal of Health Economics xxx (2011) xxx– xxx 3
Table 1Main price regulation variables used in this study.
Price control Reference pricing Therapeutic RP Number of benchmarking countries in EU
Austria Yes No No 8Belgium Yes No No 8Bulgaria Yes No No 3Czech R. Yes Yes Yes 9Denmark No Yes No 7Estonia Yes Yes No 4Finland Yes No No 4France Yes No No 14Germany No Yes Starting in 2004 14Greece Yes No No 6Hungary Yes Yes Starting in 2003 9Ireland Yes No No 7Italy Yes Yes No 11Latvia Yes Yes Starting in 2005 5Lithuania Yes Starting in 2003 No 6Luxembourg Yes No No 6Netherlands No Yes Yes 8Norway Yes Yes No 2Poland Yes Yes Starting in 2005 8Portugal Yes Starting in 2003 No 8Romania Yes Yes No 4Slovakia Yes Yes Yes 4Slovenia Yes Starting in 2003 No 5Spain Yes Yes (except 2005–2006) No 8Sweden Yes Yes No 7Switzerland Yes No No 3UK No No No 10
Source: Austria, Belgium, Czech, Finland, France, Greece, Ireland, Norway, Sweden, Switzerland, UK: Kyle and Jacobzone. UK, Italy: Kyle, Jacobzone and Huttin. Spain andHungary: Kyle, Jacobzone, and Kalo et al. Denmark and Germany: Kyle, Jacobzone, Puig and Kaiser. Poland, Slovenia, Bulgaria: PhRMA. Slovakia and Lithuania: USITC. Estonia,L ber of benchmarking countries” refers to the number of other European countries thatr e market. Source of information on countries included in benchmark lists: OECD (2008),p
spiCcits
c
TP
S
Table 3Changes to reference pricing programs.
Country Date Description
Portugal 2003 Begins reference pricingHungary 2003 Begins therapeutic reference pricingLithuania 2003 Begins reference pricing
atvia, Romania: WHO. Luxemburg: Huttin. Portugal: Huttin and Mossiolos. “Numeference the listed country’s drug prices when setting the price of drugs in the hom. 103, and PPRI.
ubstitute drugs or the same drug in other markets. Most referencericing systems make price comparisons at the level of the active
ngredient (or level 5 of the Anatomical Therapeutic Chemical (ATC)lassification system used by the World Health Organization). Byontrast, we call a country’s system a therapeutic reference pric-ng regime when the price comparisons are made between drugs
Please cite this article in press as: Koenig, P., MacGarvie, M., Regulatory polin Europe. J. Health Econ. (2011), doi:10.1016/j.jhealeco.2011.07.005
hat are in the same therapeutic class but have different moleculartructures (e.g., level 4 of the ATC system or broader).
Germany established its reference pricing system in 1989. Theomparison group for some products was drugs with the same
able 2rice cuts and freezes, 2002–2009.
Country Date Description
Germany October 2002 toDecember 2004
Manufacturers must submit revenuefrom price increases to government.
Germany October 2003 16% reduction in reimbursed prices forpatented medicines.
Hungary 2004 15% price cut April–June.UK 2005 7% cut in branded drug prices.Spain 2005–2006 Compulsory 4.2% price cut from March
2005 and a 2% price cut from March2006 for all products not subject toreference prices and with a pricehigher than EUR 2.
Germany November 2005 toMarch 2008
Manufacturers must submit revenuefrom price increases to government.
Italy 2006 Temporary 5% cut on the price of drugsused by the country’s National HealthService.
Poland 2006 13% price cut for imported products.Finland 2006 5% cut of approved wholesale prices.Ireland 2006 Wholesale prices frozen.Denmark 2007–2008 Price ceilings imposed.UK 2009 5% price cut.
ource: PPRI Country Profiles.
Slovenia 2003 Begins reference pricingSpain 2004 Expansion of reference price regime to
include more products; mandatoryprescription of lowest-price generic
Germany 2004 Patented drugs included in therapeuticreference pricing scheme.
Denmark 2005 Reference price changed from averageof other European countries to lowestdomestic price in reference group.
Poland 2005 Begins therapeutic reference pricingLatvia 2005 Begins therapeutic reference pricing
S
ac2erttrLJ(
Greece 2005 Begins reference pricing
ource: Vogler et al. (2009), Kaiser (2010), Puig-Junoy (2007).
ctive ingredient, but for others the comparison group includedhemically distinct products with similar therapeutic effects. As of000, roughly half of drug expenditures were covered by the refer-nce pricing system.2 Germany exempted patented drugs from theeference pricing scheme in 1996. However, in 2004 this exemp-ion was removed, causing the sales of a number of on-patent drugso fall dramatically. This policy shift was preceded in 2003 by a 16%eduction in reimbursed prices on patented medicines. Poland andatvia instituted TRP regimes in 2005 (Adamski et al., 2008; Puig-
icy and the location of bio-pharmaceutical foreign direct investment
unoy, 2010). Hungary introduced a limited TRP regime in 2003Kalo et al., 2007; Sood et al., 2008, p. 131) and expanded it to
2 Danzon et al. (2004), p. 7.
ING Model
J
4 f Hea
5p
tteta2aslb2epatlbolfcprArVgpcpdTb
csiewpcTat
dfooiLoS2Ico
ii
occctstocsiPcsol
2
aOfftdmumbillbiamtfw
ARTICLEHE-1510; No. of Pages 16
P. Koenig, M. MacGarvie / Journal o
0 additional therapeutic groups representing over a third of therescription market in 2005.3
Two additional reforms to countries’ reference pricing regimeshat took place over the course of our sample period are relevanto our study. Both cases constitute changes to the RP regime thatffectively shifted the comparison group to lower-priced drugs. Upo 2005, Denmark set the reference price of a drug as the Europeanverage price for drugs with the same active ingredient (ATC5). In005, the reference price became the minimum price in Denmarklone for drugs with the same active ingredient. Kaiser et al. (2010)how that this change led to a substantial decline in prices, withist prices declining by 27% on average and reference prices fallingy 33%.4 Spain also “radically modified” (Vogler et al., 2009, p.21) its reference pricing system in 2004 and 2006. Spain’s ref-rence pricing system, established in 2000, calculated referencerices for products for which a bio-equivalent generic was avail-ble. The reference price was based on the weighted average ofhe lowest-priced substitutes with a combined market share of ateast 20%. Patients would be reimbursed up to the reference price,ut could opt to buy drugs at higher prices and pay the differenceut of pocket.5 As of 2004, however, the reference price was calcu-ated as the average of the three lowest costs per treatment per dayor the products in the group, for each form of administration.6 Inases in which the price of a prescribed drug is above the referencerice and there is a generic in the reference group, pharmacists areequired to dispense the cheapest generic in the reference group.7
lso, the prices of generics that are above the reference price in theeference group must be reduced to at most the reference price.ogler et al. (2009) note that these reforms to the Spanish systemradually expanded the share of the market covered by referencericing to roughly half the market by 2008. One reason why thishange was significant is that in Spain, in contrast to other Euro-ean countries, customers no longer had the option of paying theifference between the reference price and a pharmacy retail price.hus, the price impacts of the aforementioned reforms are likely toe particularly large.8
In the analysis that follows, we consider the impacts of thesehanges to reference pricing regimes that took place during ourample period. We create a “policy change” dummy variable thatndicates that a government undertook a major change to the ref-rence pricing system aimed at reducing prices. The policy changese include in this category are (1) the shifts from RP to TRP that tooklace in Germany, Hungary, Latvia and Poland, and (2) the majorhanges to the RP systems that took place in Denmark and Spain.9
Please cite this article in press as: Koenig, P., MacGarvie, M., Regulatory polin Europe. J. Health Econ. (2011), doi:10.1016/j.jhealeco.2011.07.005
he dummy variable is equal to zero in the years before the changend one afterwards. We also include a “price freeze” dummy, equalo 1 in countries and years in which there was a price freeze or cut
3 “Hungary widens Rx reference pricing”, The PharmaLetter, July 4, 2005.4 Kaiser et al. (2010), p. 3.5 Moreno-Torres et al. (2007), p. 5.6 Vogler et al. (2009), p. 222.7 Puig-Junoy (2007).8 Vogler et al. (2009), p. 222.9 Slovenia introduced reference pricing (at the ATC5 level) in 2003, and Greece
id the same in 2005. Because reference pricing is generally considered to be a softerorm of regulation than price controls or TRP, we do not include these changes inur “policy shift” variable, which is intended to capture increases in the stringencyf regulation. However, because there are so few investments in these countries,ncluding or excluding their changes in policy has very little impact on the results.imited therapeutic reference pricing was also initiated in 2006 in the Italian regionsf Puglia and Abruzzo for Proton Pump Inhibitors and in Liguria for PPIs, statins,SRIs and treatments for benign prostatic hypertrophy. However, a law passed in008 ruled out further changes to the reference pricing scheme by the regions (CRAnsights). Because these changes affected only a small share of the Italian pharma-eutical market, we do not classify Italy as having therapeutic reference pricing inur analysis.
pipaammt
ldpto
tSc(p
PRESSlth Economics xxx (2011) xxx– xxx
n effect, and 0 otherwise. The relevant freezes and cuts are listedn Table 2.
Changes like those that took place in Germany are a key elementf this study. Most countries do not change their regulatory poli-ies during the time frame of our sample. For example, all of theountries with explicit price controls in our sample maintain theseontrols throughout the time frame. As a result, it may be difficulto separate the effects of these invariant policy choices from unob-erved, invariant characteristics of the country. However, countrieshat change their policies during the sample period provide anpportunity to examine investment patterns before and after thehange. The change in Germany’s reference pricing scheme is oneuch opportunity. Other changes to reference pricing schemes dur-ng our period took place in Denmark, Hungary, Latvia, Spain, andortugal. Additional variation in the drug price policy environmentan be obtained from price freezes and cuts that were instituted ineveral countries during our period. Table 1 contains informationn the use of these policies in different countries and Tables 2 and 3ist all the policy changes relevant to this paper.10
.2. The effect of price regulations on the location of investment
We will test the hypothesis that these differences in regulationscross countries have side-effects on the location of investments.ur FDI dataset includes investments in manufacturing plants, R&D
acilities, and other investments related to administrative or salesunctions of the firm. In most industries, the location of manufac-uring investments is mainly driven by considerations of cost andemand. Firms may locate manufacturing investments near largearkets in order to minimize the cost of transporting finished prod-
cts to those markets. Alternatively, if transport costs are low, firmsay prefer to locate in the lowest-cost region, and location will
e dictated more by tax rates and production costs than by prox-mity to demand. The pharmaceutical industry is characterized byarge sunk development costs, low transport costs, and a strongink between government regulation and profitability. As statedy the OECD, “the market for pharmaceutical products is increas-
ngly a global one (. . .). New active ingredients are launched inn average of ten countries, although manufacturers often releaseultiple versions of their on-patent products in different markets
o reflect consumer preferences and to reduce opportunities bothor prospective buyers to make external price comparisons and forholesalers to engage in parallel trade” (OECD, 2008, p. 11). Whilerice regulation clearly affects the overall level of anticipated prof-
ts and therefore the overall level of investment, the location ofroduction may not be tied as closely to the location of demands for some other products that have higher transport costs or thatre customized to particular markets. Conditional on the size of thearket in terms of income, we might therefore not expect to seeore pharmaceutical production in countries with higher prices if
hose countries also have high production costs.We expect that the location of R&D investments will typically be
oosely linked to the location of demand. This is because R&D pro-
icy and the location of bio-pharmaceutical foreign direct investment
uces ideas which can be costlessly transferred to the location ofroduction. R&D location decisions will then be influenced more byhe cost of employing skilled researchers than by any considerationf the location of demand, and we will tend to see R&D located in
10 An increasingly important and controversial factor in the pricing of drugs inhe EU is parallel trade, or the re-export of drugs from low-price countries (likepain, Portugal and Greece). While parallel trade has the potential to lead to priceompression within the EU (and has been found to do so in non-drug markets), Kyle2007b) shows that in fact parallel trade has had little impact on drug prices, due inart to strategic responses by pharmaceutical companies.

ING Model
J
f Hea
ceifid
tiprm
SmWtogost
emTBofirophp
oicitocsf
Guppf1lthutoe(
tr
a
Eaea
Gowmiimrr
aunatiiliblietme
poatWdo(pmratttic
rttrk
ARTICLEHE-1510; No. of Pages 16
P. Koenig, M. MacGarvie / Journal o
ountries with high concentrations of workers with advanced sci-ntific training.11 As an alternative to the purely global view of thendustry, Fabrizio and Thomas (forthcoming) find that patenting byrms in particular therapeutic classes is positively associated withemand for that type of drug in the firms’ home countries.
And yet, as evidenced by some of the quotes in the introduc-ion, some pharmaceutical firms threaten to restrict investmentn countries with strict regulation. Is this just cheap talk? Or doharmaceutical firms actually shift the location of investment inesponse to the imposition of stricter price controls by govern-ents?The theory of “private firms subject to political influence,” of
hleifer and Vishny (1994) provides one illustration of why firmsight reduce investment in countries that tighten price regulation.hile Shleifer and Vishny’s model is motivated largely by a desire
o understand the behavior of publicly controlled firms, the authorsbserve that “Many private firms in Europe and the United Stateset subsidies and tax breaks in exchange for hiring more people,r locating in particular areas.” One can consider an increase in thetrictness of price regulation as the weakening of a type of subsidyo pharmaceutical firms.
In this model, a politician and a manager bargain over L,xcess employment by the firm (workers hired above the profit-aximizing level) in exchange for transfers from the government,
. The politician earns a political benefit from employing people(L), and incurs a political cost of giving the firm a subsidy C(T). Inur case, we think of the subsidy T as the difference in revenues therm earns relative to some counterfactual level of profits in a moreigid price control regime. The politician and the manager bargainver L and T. The politician controls T, but either the firm or theolitician can be assumed to control L. In cases in which politiciansave strong bargaining power vis-a-vis firms, we can think of theolitician choosing L to maximize his utility.
Consider the example of Germany in 2004, where the stringencyf regulation increased and investment in R&D fell. With a decreas-ng marginal benefit of employment and an increasing marginalost of the transfer, if the marginal political cost of the subsidyncreases for the politician (perhaps in response to a shift in voters’astes for drug price regulation), the increase in the marginal costf the transfer would generate an inward shift in the set of optimalombinations of L and T. This will result in a reduction in the sub-idy to firms accompanied by a reduction in investment that is theocus of our empirical analysis.
As one of the largest markets in Europe, actions taken byermany may affect other markets in two ways. Many countriesse external price benchmarking – the calculation of an averagerice of a drug in certain other countries – to guide the setting ofrice or reimbursement limits. Prices for drugs charged in Germanyactor into other countries’ pricing or reimbursement decisions in4 other EU countries. As a result, lower prices in Germany lead to
ower prices elsewhere. The median number of referencing coun-ries in our sample is 7.12 Moreover, Germany’s policy changes mayave been viewed by the pharmaceutical industry and other reg-lators as a test case - if the industry did not react strongly tohe change, such changes may have appeared more attractive in
Please cite this article in press as: Koenig, P., MacGarvie, M., Regulatory polin Europe. J. Health Econ. (2011), doi:10.1016/j.jhealeco.2011.07.005
ther countries. Germany was the first country to establish refer-nce pricing in 1989, followed by the Netherlands and Hungary1991), Sweden, Denmark and New Zealand (1993), and 14 other
11 For example, Furman et al. (2006) show that pharmaceutical patents in a par-icular therapeutic class and location are positively associated with the number ofelated scientific articles in that location.12 Source: OECD (2008) and PPRI (2007). We were unable to determine which (ifny) countries were used for price comparisons in Romania.
aapls
P
PRESSlth Economics xxx (2011) xxx– xxx 5
uropean countries in later years.13 Pharma Marketletter quoted Merrill Lynch analyst who pointed out the potential snowballffects of Germany’s shift to TRP, asking, “what’s to stop Francend Italy following guidance from Germany?”14.
Softer price regulation in very influential countries likeermany thus generates much larger subsidies for firms becausef the follow-on effects of their policies in other countries. Mean-hile, other less influential countries would have to reduce pricesuch more to generate the same implicit subsidy to firms. This
s one reason why the equilibrium level of investment in less-nfluential countries will be lower. We test this prediction of the
odel by examining differences in the response of firms to priceegulation in different countries, according to how that market’segulatory decisions affect prices elsewhere (see Table 8).
An alternative mechanism through which price regulation couldlso affect investment is through its effects on incentives for stim-lating demand. It is worth noting that the non-manufacturing,on-R&D investments in our sample include sales offices (classifieds bureau commercial ou de liaison), distribution or logistics cen-ers, and offices providing administrative support. Some of thesenvestments will resemble R&D facilities in that they are perform-ng administrative functions that are not necessarily linked to theocation of demand. Other types of non-manufacturing, non-R&Dnvestment, specifically those engaged in marketing functions, maye more likely made in markets with growing demand or with
ess stringent price regulation, because investments in influenc-ng consumers’ preferences may have a higher return. We mightxpect these investments to decline after changes in the regula-ory regime if marketing efforts are less profitable when prices are
ore tightly controlled. We will investigate this possibility in thempirical section.
The existing literature highlights the influence of regulatoryolicies on the decision-making of pharmaceutical firms in termsf product launch, or pharmaceutical employment. Kyle (2007a), in
detailed analysis of international drug launch strategies, showshat drug launches are delayed in countries with price controls.
ith a focus on developing countries, Lanjouw (2005) shows thatrugs are launched earlier in countries with stronger enforcementf Intellectual Property Rights (IPRs). On the other side, Ahlering2004), in a study of the relationship between regulatory andolicy variables in a particular country and the share of a phar-aceutical company’s employment in that country, finds little
elationship between employment in a country and such factorss intellectual property protection (using the Ginarte-Park indexo measure the strength of IP), drug approval times, corporateax rates, and R&D incentives. Ahlering finds evidence of a posi-ive relationship between the number of price control mechanismsn a country and the share of a company’s employment in thatountry.
It is worth noting here that our analysis focuses on the officialegulatory policies in place in our sample countries, rather thanhe actual price level. It is possible that policies may not be effec-ively enforced, or softened by other interventions with the netesult of no significant reduction in prices relative to other mar-ets. If this is the case, there may not be a significant link betweennnounced policies and investment choices. Revisiting the liter-ture on price regulation and launch decisions, and measuring
icy and the location of bio-pharmaceutical foreign direct investment
rices directly, Danzon and Epstein (2008) show that price regu-ation does deter product launches in markets in which regulationucceeds at reducing prices.
13 Vogel et al. (2009).14 “Govt drug price controls continue to threaten Europe’s pharma industry”,harma Marketletter, December 23, 2002.

ING Model
J
6 f Hea
wi
3
lccts
cTtstt
p(o(pmdl
msdfltamita
tccrutaritl
ttmcrik(icid
eaKcicmairnlpim
tctpeitttdptW
aopfti
V
pdi
P
pdtHwmare made based on the observable characteristics of the alterna-tives. In this case, we model profits as a function of the choiceattributes described above and a common set of parameters. Chung
ARTICLEHE-1510; No. of Pages 16
P. Koenig, M. MacGarvie / Journal o
The following section develops our empirical strategy to testhether pharmaceutical companies are deterred to locate new
nvestments in countries with more stringent price regulations.
. The empirical strategy
The literature on the choice of location for FDI has focusedargely on the influences of proximity to demand, productionosts, taxes and subsidies, and potential spillovers. Our empiri-al approach builds upon this framework, while recognizing thathe location of pharmaceutical investment may also be affected bytrategic considerations relating to price regulation.
Carlton and Dennis (1983) was the first paper to use a dis-rete choice model to study choice of production sites by firms.he subsequent literature analyzed location choices of FDI with theraditional elements of the expected profit in each location, sometudies however including a more complete form of demand withhe income of contiguous locations (Head et al., 1999), as well ashe location of competitors (Head and Mayer, 2004).
A set of contributions have investigated the influence of publicolicies on the decision to locate in different countries. Head et al.1999) study the influence of US states’ incentives on the decisionsf Japanese affiliates to locate within the United States. Crozet et al.2004) analyze whether regional policies have an effect on locationatterns within France, while Devereux et al. (2007) apply similarethods to the English case. Those papers end up with mixed evi-
ence of the impact of public policies. In this paper, we enrich theocation choice model to incorporate a role for regulatory policy.
We consider a pharmaceutical firm located in country r. Our esti-ated equation is a reduced form of the profit of the firm which
ells in r and exports to all other markets. This aggregate profit is aecreasing function of the costs of production in r and an increasingunction of aggregate demand. We specify the cost as a function ofocal wages wr (specified here as the unit labor cost of production athe country level) and add the local statutory tax rate taxr, which islso likely to affect location decisions as a determinant of the laborarket situation. In order to take into account the bilateral cost of
nvestment, we add two variables to the estimation, measuring dis-ance between the investing and the potential host country (Distir),nd whether these countries share a common language (Langir).
Governmental regulations of the pharmaceutical market enterhe estimated equation through PRr, a matrix of dummy variablesapturing various price regulations. These dummy variables indi-ate whether the country (1) controls prices explicitly, (2) employseference pricing schemes to control the amounts reimbursed, (3)ses therapeutic reference pricing, (4) made a significant changeo the pricing regime or (5) has frozen or cut the prices of drugs at
given point in time. We can think of countries with stricter priceegulation as offering lower subsidies – and therefore lower prof-ts – associated with locating in the country. Our regressions willest the hypothesis that these implicit subsidies matter for firms’ocation decisions.
Proximity to demand may also be a factor. In most indus-ries, this is a key determinant of location choice and as a resulthe trade and investment literature has focused on the role of
arket potential (see Head and Mayer, 2004). In the pharma-eutical sector, where transport costs are low and products areelatively standardized across markets, this factor may be lessmportant. Nevertheless, some customization to particular mar-ets does occur, among other reasons to prevent parallel tradesee Kyle, 2007b). Furthermore, countries may be most likely to
Please cite this article in press as: Koenig, P., MacGarvie, M., Regulatory polin Europe. J. Health Econ. (2011), doi:10.1016/j.jhealeco.2011.07.005
mpose tighten price regulation when spending on pharmaceuti-als is growing, and this may also be associated with incentives fornvestment. As a result, it is important to control for demand in theestination country. To measure the potential demand a firm can
aod
PRESSlth Economics xxx (2011) xxx– xxx
xpect to face when located in a particular country, we follow Headnd Mayer (2004) who used the Krugman market potential Mr. Therugman market potential applied to the pharmaceutical sector inountry r sums the pharmaceutical consumption in all countriesmporting from r (including r). This sum is weighted by transactionosts between country r and destination countries j, and by an indexeasuring the degree of competition in each market. The demand
ddressed to a pharmaceutical firm planning to locate in r is thusncreasing with consumption in all importing markets including. This consumption is, however, reduced by two items: (1) theumber of other pharmaceutical firms in each market, and (2) the
evel of transaction costs between r and each market.15 The marketotential variable is constructed from the estimation of bilateral
nternational trade flows, using the Redding and Venables (2004)ethod explained in Section 4.Next, we consider the clustering of research-intensive firms in
he same location. We include an agglomeration effect variable,omputed as the number of pharmaceutical investments in coun-ry r in year t. We hence assume that, controlling for the marketotential in country r, and controlling for the competition effectmanating from the presence of competitors in the same industryn country r, the presence of other related firms may be beneficialo a firm considering choosing r. The positive effect may arise fromechnological spillovers decreasing the input cost cr, or decreasinghe transaction cost �rj. Furman et al. (2007) (among others) haveocumented the tendency of biopharmaceutical firms to locate inlaces with greater R&D capabilities, and as a result we also includehe country’s annual R&D spending in the pharmaceutical sector.
e denote these spillover-related variables Spillr .The location choice literature typically specifies the profit of
firm located in region i in r as being decomposed into the partbserved by the researcher, Vir and the unobserved aspects of therofit eir. The unobserved elements refer for example to bilateralactors between the firm and the host country affecting the produc-ivity or the firm’s production cost. The form of the observed parts specified as the vector of parameters ˇ that we will estimate:
ir = ˇ0 + ˇ1 ln wr + ˇ2 ln taxr + ˇ3Distir + ˇ4Langir
+ ˇ5 ln Mr + ˇ′6PRr + ˇ′
7Spillr . (1)
We assume that firms choose the location yielding the highestrofit. With error terms distributed according to an extreme valueistribution, the probability that a firm located in i chooses to invest
n country r is expressed in the following logit form:
ir = exp(Vir)∑
j
exp(Vij)(2)
We thus estimate the determinants of location choices in theharmaceutical industry using a logit model, on the data that areescribed in the next section. Following several papers in the loca-ion choice literature (among many others, Coughlin et al., 1991;ead et al., 1999; Guimaraes et al., 2000; Head and Mayer, 2004),e estimate a Conditional Logit model of location choices. Thisodel is particularly well suited to applications in which choices
icy and the location of bio-pharmaceutical foreign direct investment
15 This expression appears as the most rigorous measure of demand used in tradend geography models and can be compared to the original Harris (1954) formf market potential, in which trade costs are set equal to the inverse measure ofistance and where the competition index is absent.
ING Model
J
f Hea
aaWir
asaiceiaunag
T�v(oada
4
i2
4
dihinomobbit4dliep
i
wisbdl
afpniwaoprbofrcompoc
wMcmttrfppa
atltdtwvid
4
nI(Ed
ARTICLEHE-1510; No. of Pages 16
P. Koenig, M. MacGarvie / Journal o
nd Alcacer (2002) use the Random Parameters Logit model, whichllows the effect of location characteristics to vary across investors.hile we do not pursue this estimation strategy, we do exam-
ne whether different types of investment respond differently toegulation in some specifications.
Because neighboring countries are economically linked, shocksre likely to be correlated across countries belonging to theame local economy. There may be substitution effects, whereby
change in price regulation in Germany leads to a reductionn investment in Germany and an increase in France, as firmshoose a nearby alternative location (there may also be incomeffects if a reduction in prices in Germany reduces global prof-ts for firms, leading to less investment across all countries). Wellow for correlation across geographically proximate countries,sing standard errors adjusted for spatial correlation in a man-er based on Conley (1999) and Rappaport and Sachs (2003). Weccount for spatial correlation by applying a weighting functionij to the estimated variance–covariance matrix of the parameters.
he estimator solves∑
t
∑iSit(�) = 0, where Sit(�) = ı log Lit(yit,
)/ı�, the vector of derivatives of the log-likelihood for obser-ation it. The standard error formula takes the form Var(�) ≈H)−1[
∑i
∑t
∑j
∑kSit(�)S′
jk(�)gij](H)−1, where H is the matrix
f second derivatives of the likelihood function, H = ıS′it
(�)/ı�,nd gij = (1 − (distanceij/1000)2) if distanceij < 1000 km, and 0 ifistanceij > 1000 km. We compute the distance between countriess the distance between capital cities.16
. Data
We estimate a model of location choice on 527 investmentsn the biopharmaceutical sector in 27 European countries during002–2009.
.1. Investment data
The data on inward FDI comes from the Agence franc aisees investissements internationaux (AFII, France’s agency for
nternational investments). The database is the result of a compre-ensive search by web-crawlers of public announcements of new
nvestments from a variety of sources, including press releases,ewspapers and the trade press, and Lexis–Nexis. We originallybtained a dataset containing announcements of foreign invest-ents in all sectors, in Europe, between 2002 and 2006. We later
btained access to updated data for 2007–2009, but only for theiopharmaceutical industry. The total number of announcementsetween 2002 and 2006 is 13,903, among which 672 investments
n biotechnology and drugs and cosmetics, which are the two indus-ry classifications we focus on. Between 2007 and 2009 there are37 investments in pharmaceuticals and biotechnology. The AFIIataset contains information on the date of the announcement, the
ocation of the investment (country, and sometimes city), the activ-ty undertaken (R&D, manufacturing, distribution, administrative,tc.), the identity and country of origin of the investor, and the
Please cite this article in press as: Koenig, P., MacGarvie, M., Regulatory polin Europe. J. Health Econ. (2011), doi:10.1016/j.jhealeco.2011.07.005
rojected number of jobs created (in some but not all cases).While the AFII database contains information on both new
nvestments and expansion of existing investments, we restrict our
16 To incorporate spatially correlated errors in the Conditional Logit model,e modified code originally written by Conley and posted at the follow-
ng website http://faculty.chicagobooth.edu/timothy.conley/research/gmmcode/tatacode.html. This code uses a Cartesian distance measure based on the distanceetween coordinate points. We calculate distances using the distance betweenegrees of longitude at the 45th parallel (81 km), which is approximately the median
atitude in our dataset.
crFarp
dFdSv
PRESSlth Economics xxx (2011) xxx– xxx 7
ttention to investments which represent the creation of a newacility. Investing firms may be producers of branded drugs, genericroducers, medical services manufacturers, contract research orga-izations, and suppliers of intermediate inputs. These firms were
dentified by reading the text of the investment announcement,hich typically contained a description of the firm’s main activity,
nd by looking up companies on the web. Among these we focusn producers of branded drugs and analyze the behavior of genericroducers separately. Our hypothesis is that only investments byesearch-driven pharmaceutical firms may be negatively affectedy the regulatory regime, since it is primarily the profit marginsf these firms that are affected by price regulation. We thereforeocus on research-driven firms in our main analysis. We includeesults restricted to generic firms in a separate table as a robustnessheck. Finally, investments vary by the main activity. Out of a totalf 527 investments, there are 205 announcements of new invest-ents in sales offices or distribution facilities, 121 manufacturing
lants, 124 new R&D facilities, 59 headquarters and administrativeffices, and 18 other types of announcements (distribution centers,all centers, etc.).
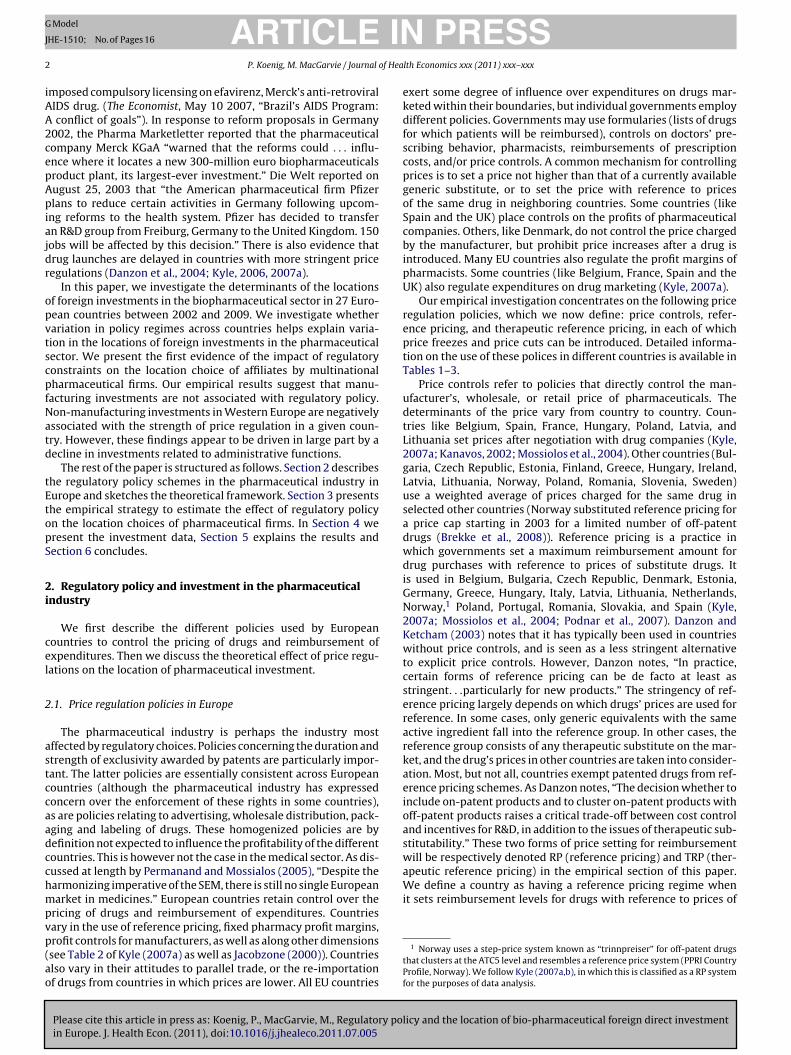
The origin countries of investing firms are in all parts of theorld. Destination countries are the current EU members, minusalta and Cyprus and plus Norway, Switzerland, so in total 27
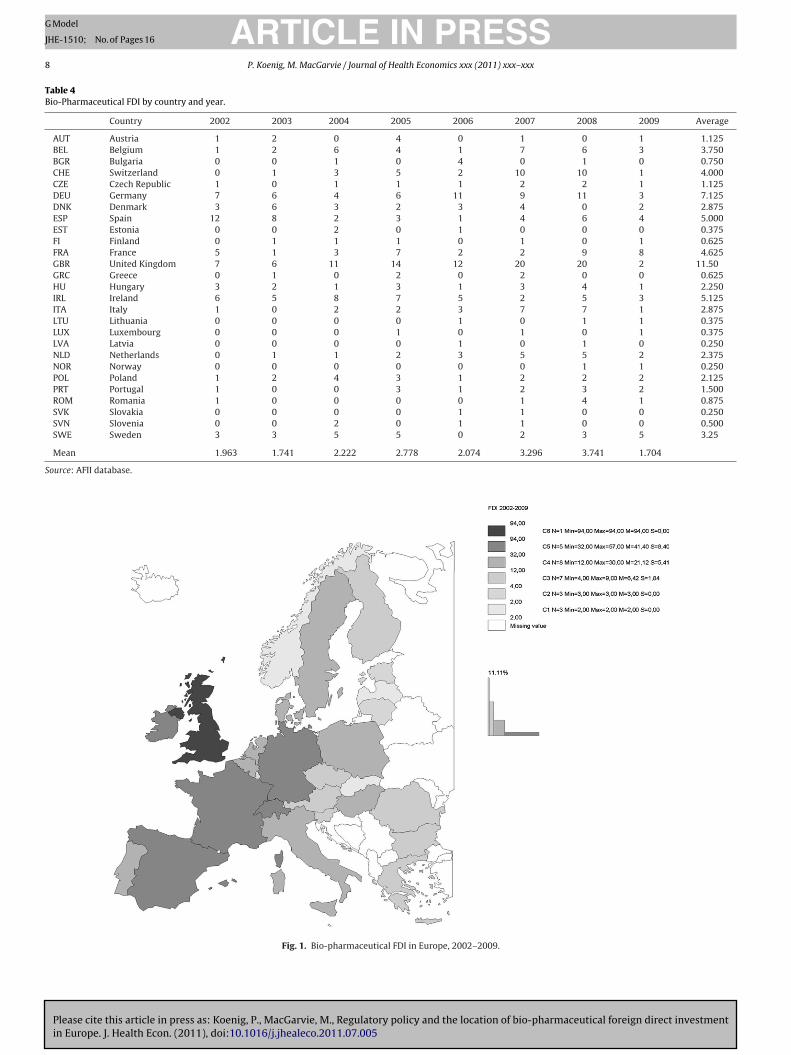
ountries. Table 4 and Fig. 1 summarize the number of invest-ents by country. The United Kingdom, Germany and Ireland are
he three countries receiving the largest number of biopharmaceu-ical investments over the period. These three countries receive aelatively stable number of investments each year, whereas Spainor example exhibits a decreasing trend, and Switzerland dis-lays an increase in investment, particularly toward the end of theeriod. The Baltic countries, Norway and Luxembourg saw the leastmount of investment during 2002–2009.
Table 5 displays the number of investments as a percentage ofll investments in our sample countries for countries that increasedhe stringency of pricing regimes during the period. While the abso-ute number of investments may have increased in some cases,he table shows that all of these countries experienced a relativeecline in investment when compared with other potential des-inations after the change in policy (with the exception of Latvia,hich went from 0% of European investments to 0.5%). This pro-
ides preliminary support for the hypothesis that firms re-directednvestment away from countries that tightened price regulationuring the sample period.
.2. Explanatory variables
Our explanatory variables include the traditional FDI determi-ants and our main variable of interest, drug price regulations.
nformation on regulatory policies mainly comes from Kyle2007a), and was supplemented with data on a larger set ofuropean countries and a later time period using the sourcesescribed in Appendix A.
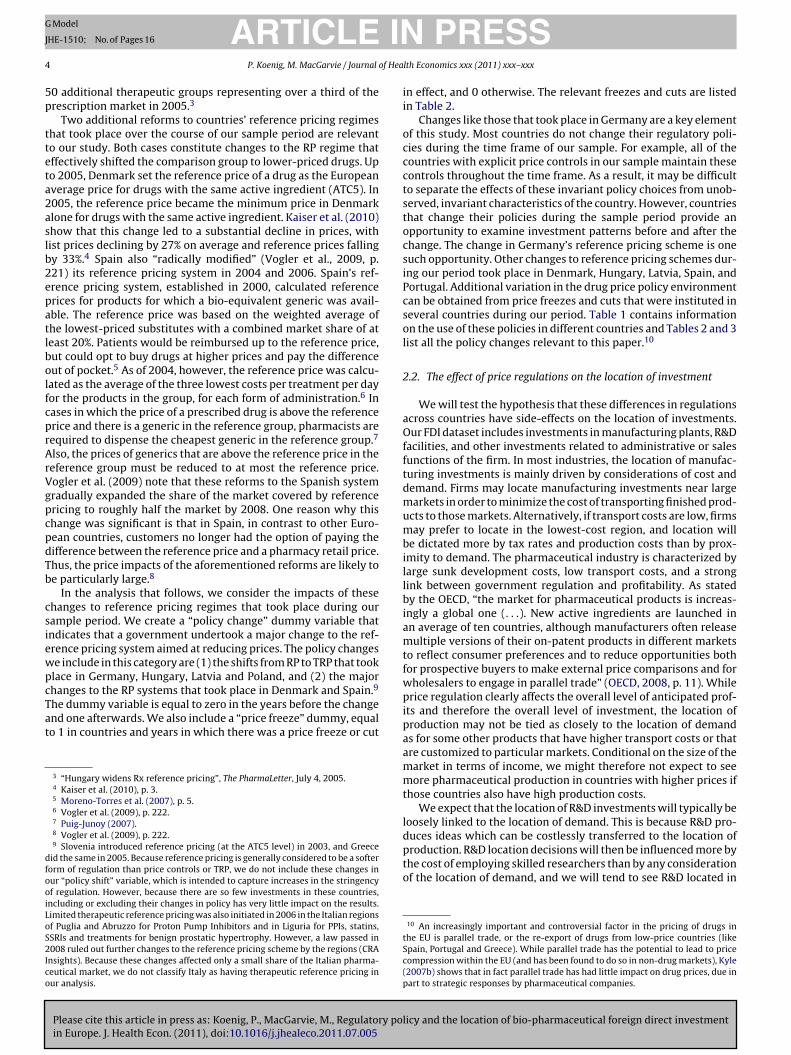
Price regulations are in the form of three dummy variables indi-ating whether each country uses each price policy: price control,eference pricing and therapeutic reference pricing. Table 1 andig. 2 summarize this information. We use two additional vari-bles explaining which countries have experienced changes in theiregulatory framework during the 2002–2009 period. These are dis-layed in Tables 2 and 3.
The remaining explanatory variables refer to the traditionaleterminants of FDI used in the location choice literature.
icy and the location of bio-pharmaceutical foreign direct investment
ollowing Eq. (1), we start with variables relative to local pro-uction costs: unit labor costs come from the Structural Businesstatistics database from Eurostat’s Industry, Trade and Ser-ices division. Eurostat’s data are available through 2007. We
Please cite this article in press as: Koenig, P., MacGarvie, M., Regulatory policy and the location of bio-pharmaceutical foreign direct investmentin Europe. J. Health Econ. (2011), doi:10.1016/j.jhealeco.2011.07.005
ARTICLE IN PRESSG Model
JHE-1510; No. of Pages 16
8 P. Koenig, M. MacGarvie / Journal of Health Economics xxx (2011) xxx– xxx
Table 4Bio-Pharmaceutical FDI by country and year.
Country 2002 2003 2004 2005 2006 2007 2008 2009 Average
AUT Austria 1 2 0 4 0 1 0 1 1.125BEL Belgium 1 2 6 4 1 7 6 3 3.750BGR Bulgaria 0 0 1 0 4 0 1 0 0.750CHE Switzerland 0 1 3 5 2 10 10 1 4.000CZE Czech Republic 1 0 1 1 1 2 2 1 1.125DEU Germany 7 6 4 6 11 9 11 3 7.125DNK Denmark 3 6 3 2 3 4 0 2 2.875ESP Spain 12 8 2 3 1 4 6 4 5.000EST Estonia 0 0 2 0 1 0 0 0 0.375FI Finland 0 1 1 1 0 1 0 1 0.625FRA France 5 1 3 7 2 2 9 8 4.625GBR United Kingdom 7 6 11 14 12 20 20 2 11.50GRC Greece 0 1 0 2 0 2 0 0 0.625HU Hungary 3 2 1 3 1 3 4 1 2.250IRL Ireland 6 5 8 7 5 2 5 3 5.125ITA Italy 1 0 2 2 3 7 7 1 2.875LTU Lithuania 0 0 0 0 1 0 1 1 0.375LUX Luxembourg 0 0 0 1 0 1 0 1 0.375LVA Latvia 0 0 0 0 1 0 1 0 0.250NLD Netherlands 0 1 1 2 3 5 5 2 2.375NOR Norway 0 0 0 0 0 0 1 1 0.250POL Poland 1 2 4 3 1 2 2 2 2.125PRT Portugal 1 0 0 3 1 2 3 2 1.500ROM Romania 1 0 0 0 0 1 4 1 0.875SVK Slovakia 0 0 0 0 1 1 0 0 0.250SVN Slovenia 0 0 2 0 1 1 0 0 0.500SWE Sweden 3 3 5 5 0 2 3 5 3.25
Mean 1.963 1.741 2.222 2.778 2.074 3.296 3.741 1.704
Source: AFII database.
Fig. 1. Bio-pharmaceutical FDI in Europe, 2002–2009.

ARTICLE IN PRESSG Model
JHE-1510; No. of Pages 16
P. Koenig, M. MacGarvie / Journal of Health Economics xxx (2011) xxx– xxx 9
Table 5Investments in EU countries reforming pricing regimes during sample period.
Year Total DEU DEU, % of total DNK DNK, % of total HUN HUN, % of total
2002 53 7 13% 3 6% 3 6%2003 47 6 13% 6 13% 2 4%2004 60 4 7% 3 5% 1 2%2005 75 6 8% 2 3% 3 4%2006 56 11 20% 3 5% 1 2%2007 89 9 10% 4 4% 3 3%2008 101 11 11% 0 0% 4 4%2009 46 3 7% 2 4% 1 2%
Pre-reform 13% 8% 6%Post-reform 10% 3% 3%
Year POL POL, % of total ESP ESP, % of total LVA LVA, % of total
2002 1 2% 12 22% 0 0%2003 2 4% 8 17% 0 0%2004 4 7% 2 3% 0 0%2005 3 4% 3 4% 0 0%2006 1 2% 1 2% 1 2%2007 2 2% 4 4% 0 0%2008 2 2% 6 6% 1 1%2009 2 4% 4 9% 0 0%
Pre-reform 4% 19% 0%Post-reform 3% 5% 0.50%
ons in
ed
tdf
oF
Fig. 2. Price regulati
xtrapolate each variable forward to 2009 from 2001 to 2007ata.
Please cite this article in press as: Koenig, P., MacGarvie, M., Regulatory polin Europe. J. Health Econ. (2011), doi:10.1016/j.jhealeco.2011.07.005
Data on corporate taxes come from three sources. The first ishe Devereux et al., 2002Devereux, Griffith and Klemm (2002)atabase, available from the IFS. This dataset omits informationor the new EU members and stops in 2005. We fill in information
iDoe
Europe as of 2009.
n statutory tax rates in new EU members in 2003 and 2004 frominkenzeller and Spengel (2004). We supplement this data with
icy and the location of bio-pharmaceutical foreign direct investment
nformation from KPMG’s Corporate Tax Rate Surveys 2006–2009.ata accounting for spillovers (R&D spending and the numberf firms in the pharmaceutical sector for each country) are alsoxtracted from the Eurostat database.

ING Model
J
1 f Hea
tiFetfi
X
Iltab1sp
mwiecwttofTaaod
5
pt
5
vstpttcta
caamt
as
Enst5aspafi
mhobt9mtrbcrtcnct
asniifivnlctmtcpo
bErecresults restricted to Eastern Europe because all countries in EasternEurope use price controls, so we cannot estimate the effect of pricecontrols within this region. The effect of reference pricing is also
ARTICLEHE-1510; No. of Pages 16
0 P. Koenig, M. MacGarvie / Journal o
The construction of a market potential variable requires data onhree elements: trade costs between countries r and j, consumptionn pharmaceuticals in country j, and the competition index in j.ollowing Redding and Venables (2004), we obtain these terms bystimating gravitational trade equations. Bilateral exports from ro j, Xrj, can be written as the amount exported by a representativerm from r, prjqrj, multiplied by the number of firms in r:
rj = nrprjqrj = nrc1−�r �1−�
rj
Yj
Gj.
n logs, the latter equation writes: ln Xrj = ln(nrc1−�r ) + ln �rj +
n(Yj/Gj). �rj = �1−�rj
represents the freeness of trade between thewo countries, and is specified as depending on distance, bordersnd language as follows: �rj = d−ı
rje[−(ˇj−�Lrj)Brj+�rj]. drj is distance
etween r and j, Lrj and Brj two dummy variables taking the value if countries r and j respectively share a common language orhare a common border. �rj is an error term and ˇj and � are twoarameters to estimate.
We use bilateral trade data for the years 2002–2009 in the phar-aceutical industry, and following Redding and Venables (2004)e estimate the trade equation with fixed effects for the export-
ng and the importing countries, respectively FXr and FMj. Thisstimation allows to obtain a dummy per importing country, andoefficients on distance, common border and common language,ith which we can build the trade costs variable. The next step is
o construct the market potential variable for each country usingrade costs and the importers’ fixed effects: Mr =
∑j�rjYj/Gj. Data
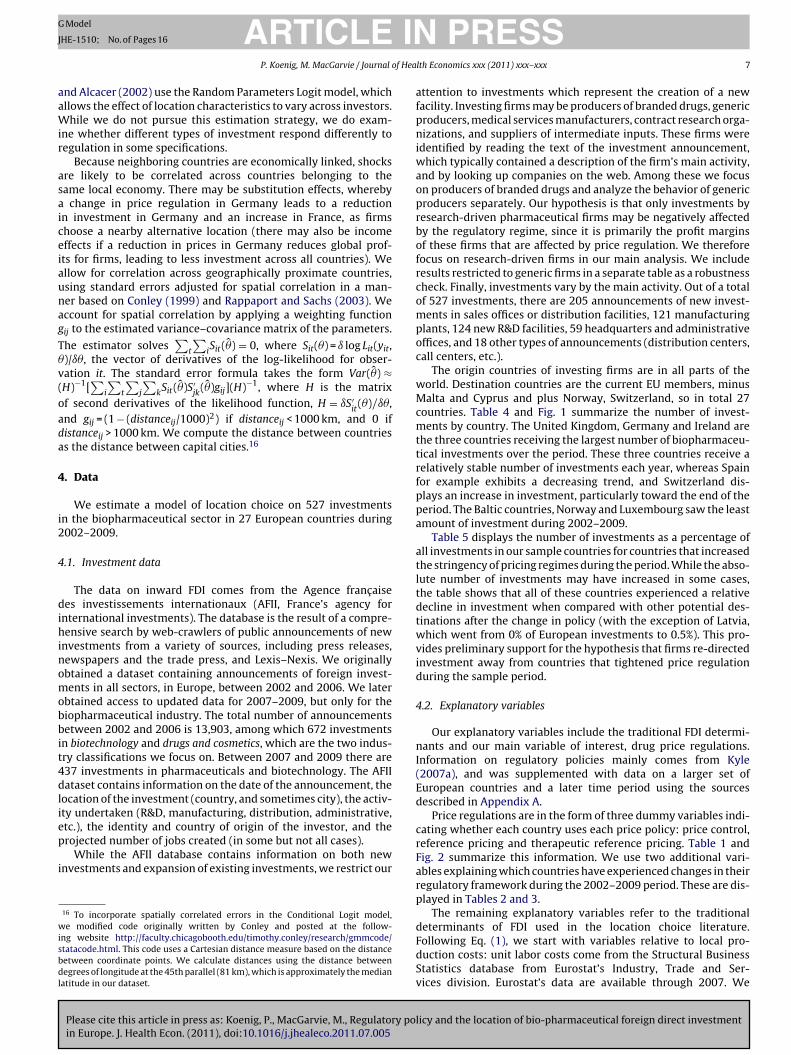
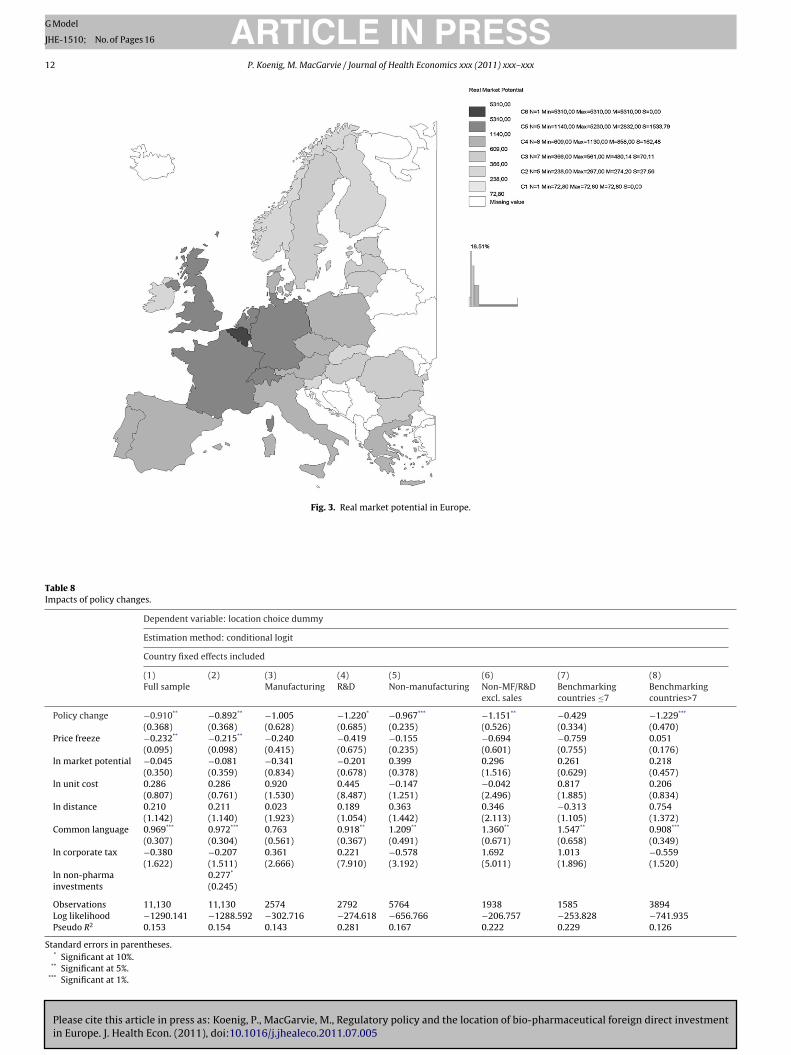
n common languages and on distance between countries comerom CEPII, a French research center in International Economics.rade data come from Eurostat’s structural indicators and are avail-ble online. Fig. 3 displays the differences in market potentialcross European countries, reflecting for instance the importancef Belgium as a central market, due to vicinity to large centers ofemand.
. Empirical results
We first present the results obtained from the cross-sectionalrice regulation dummy variables in Tables 6 and 7, and then turno the results on the time-varying regulatory variables (Table 8).
.1. Cross-sectional results
The first column of Table 6 includes only the set of explanatoryariables related to price regulation. These unconditional estimateshow that overall, countries with price controls (PC) are less likelyo be chosen as a destination for investment than countries withoutrice controls. Countries with reference pricing (RP) and coun-ries with therapeutic reference pricing (TRP) are also less likelyo receive investment, but the effect is not as strong as for priceontrols and is not statistically significant for TRP. And countrieshat combine all three systems (price controls, reference pricing,nd therapeutic reference pricing) see the least investment.
However, this regression omits important confounders, and inolumn 2, we add the market potential variable, which is positivelynd significantly related to the location of FDI.17 In column 3 we
Please cite this article in press as: Koenig, P., MacGarvie, M., Regulatory polin Europe. J. Health Econ. (2011), doi:10.1016/j.jhealeco.2011.07.005
dd variables relating to trade costs. These are a dummy for a com-on language between investors and potential recipient countries,
he distance between countries, and a dummy variable for Eastern
17 We do not have information on bilateral trade in pharmaceuticals for Norway,nd as a result this country is omitted from subsequent regressions. Results areimilar when imputed data is used and Norway is retained.
Sod
2mfiad
PRESSlth Economics xxx (2011) xxx– xxx
uropean destinations. The first and third of these are highly sig-ificant, though the price control dummy retains its negative andignificant association with the probability of investment. We con-inue to add the elements of the profit function in columns 4 and. As expected, the log of the nominal corporate tax rate is neg-tively associated with investment (though it is only statisticallyignificant for manufacturing investments), while the unit cost ofroduction has a positive coefficient (presumably reflecting vari-tion in productivity or labor quality across locations). The latternding is consistent with Head and Mayer (2004).18
When the “spillovers” variables are included in column 6, thearket potential variable becomes insignificant, reflecting the
igh positive correlation between these variables. The coefficientn the price control dummy increases from −0.514 to −0.251,ut remains significant at the 1% level. We separate manufac-uring and non-manufacturing investments in columns 7 and 8,, and find that the association between regulation and invest-ent appears to be driven by non-manufacturing investments as
he regulatory coefficients are insignificant in the specificationestricted to manufacturing. Column 9 includes the log of the num-er of non-pharmaceutical investments in the AFII database byountry and year,19 which controls for other, non-pharmaceuticalelated motives for investment. There is no significant correla-ion between pricing policy and manufacturing investment, butolumns 8 and 9 show that countries with price controls see feweron-manufacturing investments than those without, even afterontrolling for the amount of non-pharmaceutical FDI in the coun-ry.
The inclusion of the spillover variables is somewhat problem-tic. While the theory suggests an important role for inter-firmpillovers, the variable with which we measure spillovers (theumber of pharmaceutical establishments in the country) makes
t difficult to separately identify spillovers from other motives fornvestment. If the regulatory regime affects the location choices ofrms, this will influence the number of establishments that pre-iously located in the country. Thus, by controlling for the existingumber of establishments, we are picking up the effect of the regu-
atory regime on the change in the number of establishments in theountry. As a result, our preferred specifications for interpretinghe effects of the time-invariant regulatory variables on invest-
ent will be those that exclude the spillovers variables. We willhen turn to an analysis of time-varying regulatory variables withountry fixed effects, exploiting policy changes during our sampleeriod to identify the effects of an increase in regulatory stringencyn changes in investment choices.
Given that investment patterns may differ substantiallyetween Western European countries and locations in Easternurope and the Baltic states, we present models estimated sepa-ately for these two regions in Table 7. Regulation has no negativeffect on location decisions in Eastern Europe (in fact, the coeffi-ient on RP is positive). It is somewhat difficult to interpret the
icy and the location of bio-pharmaceutical foreign direct investment
18 The number of observations falls in column 4 due to missing data on costs inwitzerland, Estonia, Greece and Luxembourg. These countries have little influencen the results due to the relatively small number of investments that take place thereuring this period (32 in Switzerland, 3 in Estonia, 5 in Greece, and 3 in Luxembourg).19 We only have the full dataset until the end of 2006. We extrapolated data for007–2009 using OECD FDI data (we regressed the number of non-pharma invest-ents on the total dollar amount of FDI investment, computed fitted values, and
lled in the missing data with the fitted values). Where OECD data were not avail-ble, we used linear projections based on the trend in the number of investmentsuring 2002–2006.

Please cite this article in press as: Koenig, P., MacGarvie, M., Regulatory policy and the location of bio-pharmaceutical foreign direct investmentin Europe. J. Health Econ. (2011), doi:10.1016/j.jhealeco.2011.07.005
ARTICLE IN PRESSG Model
JHE-1510; No. of Pages 16
P. Koenig, M. MacGarvie / Journal of Health Economics xxx (2011) xxx– xxx 11
Table 6Baseline results including all countries, types of investments, investors.
Dependent variable: location choice dummy
Estimation method: conditional logit
(1) (2) (3) (4) (5) (6) (7) (8) (9)
Full sample Manufacturing Non-manufacturing
Price regulation −1.309*** −0.444*** −0.363*** −0.336*** −0.514*** −0.251*** 0.036 −0.438*** −0.591***
(0.155) (0.070) (0.067) (0.126) (0.093) (0.091) (0.158) (0.151) (0.132)Reference pricing −0.547*** −0.485** −0.16 −0.056 0.348*** 0.248** 0.107 −0.081 0.353**
(0.234) (0.204) (0.204) (0.246) (0.089) (0.110) (0.387) (0.208) (0.129)Therapeutic RP −0.304 −0.355*** −0.125 −0.079 −0.195 −0.238** 0.214 −0.176 −0.292**
(0.381) (0.160) (0.143) (0.182) (0.139) (0.109) (0.262) (0.152) (0.127)ln market potential 0.576*** 0.395*** 0.302** −0.14 0.123 0.068 0.364** −0.051
(0.118) (0.110) (0.129) (0.090) (0.106) (0.111) (0.147) (0.101)ln distance 0.169 0.282** 0.276** 0.265 0.006 0.358** 0.352**
(0.207) (0.141) (0.120) (0.134) (0.168) (0.159) (0.137)Common language 0.949*** 1.022*** 1.022*** 0.965*** 0.854*** 1.052*** 1.053***
(0.280) (0.182) (0.177) (0.134) (0.395) (0.184) (0.191)Eastern Europe −0.740** −0.404* −0.605** 0.047 −0.477 −0.397* −0.636**
(0.315) (0.202) (0.130) (0.103) (0.309) (0.207) (0.170)ln unit costs 0.443*** 0.592*** 0.532*** 0.595** 0.358** 0.519***
(0.132) (0.050) (0.148) (0.157) (0.175) (0.132)ln corporate tax −0.24 −0.401*** −1.222*** −1.090*** 0.21 −0.065
(0.346) (0.127) (0.172) (0.236) (0.408) (0.202)ln non-pharma
investments0.603*** 0.579***
(0.051) (0.071)ln RD expenditure 0.063
(0.042)ln # firms 0.552***
(0.082)
Observations 14,229 13,650 13,650 11,130 11,130 10,739 2574 8556 8556Log likelihood −2160.83 −1560.549 −1525.519 −1350.462 −1309.037 −1759.336 −325.283 −1005.58 −977.351Pseudo R2 0.046 0.088 0.108 0.114 0.141 0.106 0.079 0.141 0.165
Standard errors in parentheses.* Significant at 10%.
** Significant at 5%.*** Significant at 1%.
Table 7Comparing across types of investment.
Dependent variable: location choice dummy
Estimation method: conditional logit
(1) (2) (3) (4) (5) (6) (7) (8)Eastern Europe Western Europe Western Europe WE, manufacturing WE, R&D WE, other WE, other, excluding sales
Price regulation −0.397*** −0.570*** 0.051 −0.342 −0.645*** −0.386* −0.486**
(0.137) (0.086) (0.217) (0.303) (0.132) (0.208) (0.180)Reference pricing 15.070*** −0.068 0.355*** 0.028 −0.339 0.012 −0.306 0.018
(0.843) (0.225) (0.104) (0.380) (0.242) (0.205) (0.275) (0.177)Therapeutic RP −0.315 −0.159 −0.266 0.319 −0.217 −0.322 −0.541* −0.565**
(0.193) (0.267) (0.215) (0.383) (0.302) (0.215) (0.296) (0.288)ln market potential 1.505*** 0.278** −0.138 0.084 0.391** 0.272* 0.319 −0.038
(0.250) (0.124) (0.085) (0.126) (0.202) (0.150) (0.163) (0.129)ln distance −0.225 0.405*** 0.446*** 0.155 0.336 0.592*** 0.557*** 0.630***
(0.579) (0.126) (0.093) (0.181) (0.221) (0.180) (0.153) (0.165)Common language 1.050*** 1.051*** 0.866* 1.112*** 1.061*** 0.838*** 0.855***
(0.182) (0.174) (0.460) (0.142) (0.233) (0.277) (0.276)ln unit costs 0.742 0.415** 0.527*** 0.681 1.326*** −0.042 0.454 0.447
(0.069) (0.068) (0.438) (0.507) (0.207) (0.286) (0.449)ln corporate tax −0.776* −0.160 −0.407*** −1.166*** −0.089 0.763* 0.993 0.639
(0.485) (0.323) (0.129) (0.294) (0.398) (0.415) (0.668) (0.430)ln non-pharma 0.593*** 0.493***
investments (0.049) (0.116)
Observations 414 6376 6376 1372 1635 3369 1039 1039Log likelihood −94.434 −1082.523 −1048.902 −234.162 −256.447 −565.743 −243.581 −239.117Pseudo R2 0.115 0.074 0.103 0.071 0.146 0.083 0.069 0.086
Standard errors in parentheses.* Significant at 10%.
** Significant at 5%.*** Significant at 1%.
Please cite this article in press as: Koenig, P., MacGarvie, M., Regulatory policy and the location of bio-pharmaceutical foreign direct investmentin Europe. J. Health Econ. (2011), doi:10.1016/j.jhealeco.2011.07.005
ARTICLE IN PRESSG Model
JHE-1510; No. of Pages 16
12 P. Koenig, M. MacGarvie / Journal of Health Economics xxx (2011) xxx– xxx
Fig. 3. Real market potential in Europe.
Table 8Impacts of policy changes.
Dependent variable: location choice dummy
Estimation method: conditional logit
Country fixed effects included
(1) (2) (3) (4) (5) (6) (7) (8)Full sample Manufacturing R&D Non-manufacturing Non-MF/R&D
excl. salesBenchmarkingcountries ≤7
Benchmarkingcountries>7
Policy change −0.910** −0.892** −1.005 −1.220* −0.967*** −1.151** −0.429 −1.229***
(0.368) (0.368) (0.628) (0.685) (0.235) (0.526) (0.334) (0.470)Price freeze −0.232** −0.215** −0.240 −0.419 −0.155 −0.694 −0.759 0.051
(0.095) (0.098) (0.415) (0.675) (0.235) (0.601) (0.755) (0.176)ln market potential −0.045 −0.081 −0.341 −0.201 0.399 0.296 0.261 0.218
(0.350) (0.359) (0.834) (0.678) (0.378) (1.516) (0.629) (0.457)ln unit cost 0.286 0.286 0.920 0.445 −0.147 −0.042 0.817 0.206
(0.807) (0.761) (1.530) (8.487) (1.251) (2.496) (1.885) (0.834)ln distance 0.210 0.211 0.023 0.189 0.363 0.346 −0.313 0.754
(1.142) (1.140) (1.923) (1.054) (1.442) (2.113) (1.105) (1.372)Common language 0.969*** 0.972*** 0.763 0.918** 1.209** 1.360** 1.547** 0.908***
(0.307) (0.304) (0.561) (0.367) (0.491) (0.671) (0.658) (0.349)ln corporate tax −0.380 −0.207 0.361 0.221 −0.578 1.692 1.013 −0.559
(1.622) (1.511) (2.666) (7.910) (3.192) (5.011) (1.896) (1.520)ln non-pharma 0.277*
investments (0.245)
Observations 11,130 11,130 2574 2792 5764 1938 1585 3894Log likelihood −1290.141 −1288.592 −302.716 −274.618 −656.766 −206.757 −253.828 −741.935Pseudo R2 0.153 0.154 0.143 0.281 0.167 0.222 0.229 0.126
Standard errors in parentheses.* Significant at 10%.
** Significant at 5%.*** Significant at 1%.
ING Model
J
f Hea
cidtacw
ptcf(sitlis
ditkisa(“stcofcrictnwp
dnoatpRthioct
tc
me
icibTnmotdfifoaf
5
tFticteasicSibofisoacp
dinftibatata
ARTICLEHE-1510; No. of Pages 16
P. Koenig, M. MacGarvie / Journal o
learly difficult to estimate due to the small number of investmentsn these countries and little variation in the RP dummy, as evi-enced by the very large coefficient on this variable.20 In contrasto Eastern Europe, price controls are significantly associated with
33% reduction in the odds of investment in Western Europeanountries (column 2).21 TRP regimes are not significantly associatedith investment in the full Western European sample.
The distinction between Eastern and Western Europe mayartly reflect the types of investment taking place in these loca-ions. Indeed, we find that when restricting to Western Europeanountries, price controls are not significantly related to investmentor manufacturing or R&D announcements. For R&D investmentcolumn 5), TRP is associated with a borderline (at the 5% level)tatistically significant reduction of 44% in the probability ofnvestment.22 Price controls are, however, associated with a reduc-ion in other types of investment statistically significant at the 1%evel. The latter types of investment include headquarters, admin-strative offices, sales offices, logistical and distribution centers, andervices to the firm.
Some of the latter investments may support the marketing ofrugs to consumers. If countries with price controls are less prof-
table targets for marketing initiatives, we will expect to see less ofhis type of investment. In order to test the hypothesis that mar-eting efforts are driving the results, we drop from the analysisnvestments classified as follows: “Bureau commercial ou de liai-on” (sales offices), “Commerce et services aux entreprises” (salesnd services to firms), “Commerce et services aux particuliers”sales and consumer services), “Point de vente” (sales location) andPrestations de services” (provision of services). The results are pre-ented in columns 7 and 8 of Table 7. We find that dropping theseypes of investments does indeed reduce the coefficient on priceontrols, and the standard error increases (note that omitting thesebservations results in the number of investments in this categoryalling from 258 to 85) so that the coefficient on price controls inolumn 7 is now significant only the 10% level. The effect of TRPegimes (calculated as the sum of the RP and the TRP coefficients)s −0.847, but is also only significant at the 10% level. However, afterontrolling for non-pharma investments in the destination country,he coefficient on price controls is more negative and is again sig-ificant at the 5% level, as is the coefficient on the TRP dummy. Weill investigate this question further in the specification includingolicy changes and country fixed effects.
There are some additional interesting differences between theifferent types of investment. The corporate tax rate is stronglyegatively associated with manufacturing investments but not thether types, while market potential is positively but insignificantlyssociated with manufacturing investment (evidence in favor ofhe “global market” hypothesis). Somewhat surprisingly due to ourriors about the lack of importance of proximity to demand for&D investments, market potential is positively associated withhis type of investment. However, because market potential is soighly correlated with income and therefore education levels, it
s possible that this positive coefficient reflects the attractiveness
Please cite this article in press as: Koenig, P., MacGarvie, M., Regulatory polin Europe. J. Health Econ. (2011), doi:10.1016/j.jhealeco.2011.07.005
f destinations with many skilled workers. Note that when weontrol for non-pharma investments in the country, which cap-ures the countries’ general attractiveness for investment to other
20 All of the 54 investments in Eastern Europe in this sample were made in coun-ries and periods in which reference pricing was in force, and the latter observationsonstitute 92.5% of the Eastern European sample.21 Calculated as exp (ˇ) − 1.22 Note that since all countries with TRP also have RP regimes, the two coeffcientsust be added together to interpret the effect of TRP. The variance of this sum as
stimated in Column 5 is 0.083.
inoodTltom
t
PRESSlth Economics xxx (2011) xxx– xxx 13
ndustries, the coefficient on market potential becomes insignifi-ant and close to zero. Common language matters for R&D and othernvestments, reflecting the greater importance of communicationarriers in these types of investment relative to manufacturing.he distance between the country of origin and potential desti-ation countries is not significantly related to location choices foranufacturing and R&D investments, but it increases the likelihood
f other investments (at the 10% level). The insignificance of dis-ance for manufacturing again supports the view that proximity toemand matters little for this type of investment. The positive coef-cient on distance for “other” investments may reflect incentives
or the establishment of distribution centers and administrativeffices associated with distant headquarters. Companies may beble to service neighboring countries from their base, but newacilities are required when expanding in more remote locations.
.2. Results on price policy changes
The specifications presented in Tables 6 and 7 are informa-ive about the general association between price regulation andDI in European countries. In these specifications, we have con-rolled for many of the key drivers of location choice. However, its possible that there are country-specific determinants of locationhoice that we have omitted and that are correlated with regula-ory regimes. In order to guard against this possibility, country fixedffects should be included. However, given that the price controlnd reference pricing dummies are mostly constant throughout theample period, it is difficult to measure their coefficients in a spec-fication that includes country fixed effects. We thus exploit policyhanges that took place during the sample period (listed in Table 2).everal countries made significant changes to their reference pric-ng regimes with the goal of reducing prices or froze or cut pricesetween 2002 and 2009. The results presented in Table 8 focusn these time-varying regulatory variables, and include countryxed effects. They resemble a “difference in differences” analysis,ince we control for country-specific variation in the average levelf investment through the country fixed effects, and identify thedditional variation in investment that takes place in countries thathange their policies relative to countries that do not change theirolicies.
We find that countries that reformed their pricing regimesuring the period in question have a 59.7% lower probability of
nvestment following the policy change than countries that didot change their policies (column 1 of Table 8). Price cuts or
reezes are associated with a smaller, but still significant reduc-ion in the probability of investment, on the order of a 21% declinen the probability of investment. When the data is broken downy type of investment, R&D investments see the largest percent-ge decline (column 4), but the coefficient is significant only athe 10% level. Most of the country characteristics are insignificantfter controlling for country fixed effects, with the exception ofhe common language dummy, which varies by investor countrynd which has a strong positive association with the likelihood ofnvestment. The results are robust to a control for the number ofon-pharmaceutical investments, our proxy for the general levelf attractiveness to foreign investment (see column 2). The resultsn non-manufacturing, non-R&D investments are also robust toropping sales and marketing-related investments (column 6).his suggests that the decline in investment is not only related toower incentives for marketing. However, if there are administra-ive activities related to marketing that are not classified as such in
icy and the location of bio-pharmaceutical foreign direct investment
ur data, the decline in investment could be explained by reducedarketing incentives.In columns 7 and 8, we cut the data according to whether or not
he set of destination countries is below the mean of the number of

ARTICLE IN PRESSG Model
JHE-1510; No. of Pages 16
14 P. Koenig, M. MacGarvie / Journal of Health Economics xxx (2011) xxx– xxx
Table 9Results restricted to generics producers including all countries, types of investment, and investors.
(1) (2) (3) (4) (5) (6)
No country F.E.s Country F.E.s
Full sample MF Non-MF Full sample MF Non-MF
Price controls 0.121 0.812 −0.299(0.359) (0.618) (0.311)
Reference pricing 0.469 1.100** 0.009(0.603) (0.546) (0.658)
Therapeutic RP −0.438 −0.359* −0.598(0.300) (0.214) (0.620)
Policy change −0.598 −1.858 0.248(0.507) (1.208) (1.566)
Price freeze 0.498 1.486 0.344(0.644) (2.035) (2.282)
ln market potential 0.120 0.007 0.231 0.588 2.030 −0.166(0.214) (0.301) (0.216) (1.328) (4.503) (2.681)
ln distance −0.112 −0.384 0.269 −0.194 −0.670 0.301(0.163) (0.176) (0.294) (0.355) (0.450) (0.532)
Common language 0.182 0.454 −0.383 0.232 1.068 −0.352(0.423) (0.749) (0.546) (0.455) (1.189) (0.773)
Eastern Europe −0.138 0.042 −1.605(0.489) (0.635) (1.249)
ln unit costs −0.029 −0.157 0.372 −0.829 −0.815 −0.764(0.261) (0.335) (0.410) (6.450) (6.588) (42.609)
ln corporate tax 0.842 0.294 1.120 1.643 3.404 −5.535(0.784) (0.885) (1.327) (3.964) (7.910) (26.033)
Observations 2033 1060 973 2033 1060 973Log likelihood −343.489 −176.856 −150.559 −229.964 −107.954 −95.091Pseudo R2 0.023 0.039 0.102 0.141 0.229 0.255
Standard errors in parentheses.*
oitrnscpopcp
ahmdrwldditpiapmtir
itpimipbwiaiifiip
lOirmswtnt
Significant at 10%.** Significant at 5%. ***Significant at 1%.
ther countries listing the country in their external price compar-son groups (the mean and median are 7 countries). We find thathe policy changes are only related to investment for the countrieseferenced by a number of countries at or above the average (theumber of referencing countries is listed in Table 1). This findingupports our hypothesis that firms react most strongly to policyhanges in high-profile countries, in other words, countries whoseolicies have the potential to affect prices in a larger number ofther markets. It also suggests that increasing the stringency of thericing regime will have no effect on investment in lower-profileountries (countries whose pricing decisions have little impact onrices across Europe).
Next, we consider the relationship between price regulationnd investment by generics producers. Since these firms do notave incentives to attempt to influence policy by shifting invest-ent away from countries with more stringent price controls, we
o not anticipate that the negative relationship observed betweenegulatory stringency and investment by research-oriented firmsill be repeated. If anything, generic producers may be more
ikely to locate in countries that tightly regulate prices of brandedrugs because these countries have greater demand for genericrugs. In Table 9, we repeat our key regressions after restrict-
ng the dataset to generic firms. In the full sample (column 1 ofhe table), we find no significant relationship between regulatoryolicy and investment. However, when we restrict attention to
nvestments in manufacturing facilities in column 2, we observe positive relationship between price controls and investment (asredicted by the preceding argument about higher demand). Non-
Please cite this article in press as: Koenig, P., MacGarvie, M., Regulatory polin Europe. J. Health Econ. (2011), doi:10.1016/j.jhealeco.2011.07.005
anufacturing investments are, as expected, insignificantly relatedo the policy regime. Columns 3–5 repeat the analysis of Table 8ncluding country fixed effects, and here we observe no significantelationship between policy changes and investment.
tspt
To summarize the results discussed above, we find that foreignnvestors are less likely to locate new investments in coun-ries with explicit price controls than countries with referencericing regimes or no price regulation. However, this finding
s only observed in Western European countries and for non-anufacturing investments. The latter result may reflect stronger
ncentives for investments in marketing in countries in whichrices are not directly controlled, rather than a strategic actiony pharmaceutical firms seeking to send a message to countriesith stringent regulatory regimes. When country fixed effects are
ncluded, so that we examine the change in investment patternsssociated with changes in regulatory policy, we find that newnvestments significantly reduced in countries that imposed signif-cant changes to reference pricing regimes after 2002, and that thisnding appears to be driven by a reduction in non-manufacturing
nvestments in countries whose prices have a broad impact onrices elsewhere.
The finding that non-manufacturing investments are particu-arly affected by regulatory regimes may at first seem surprising.ne might ask why, if firms seek to influence government pol-
cy by re-directing investment to countries with more favorableegulatory regimes, they do not do so with manufacturing invest-ents. Manufacturing facilities are less closely tied to the specific
cience or skill base of a location, and one would expect that firmsould incur lower foregone profits in choosing a second-best loca-
ion for manufacturing. However, if governments believe that newon-manufacturing facilities create more high-skilled jobs, con-ribute more to the tax base and generate greater spillovers for
icy and the location of bio-pharmaceutical foreign direct investment
he region than do manufacturing facilities, they may be more sen-itive to variations in the location of such investments. Thus theotential benefit in terms of political influence associated withhe choice of non-manufacturing location may be greater, and this

ING Model
J
f Hea
mmnfrpometma
cikvtipttwfar
aiisiiap1cheowT
ieem3Detv
ruc
ie“pn
Saiptcalo
gccrltraba
6
dciwglrltriwif
A
ewcpPP
rS
ARTICLEHE-1510; No. of Pages 16
P. Koenig, M. MacGarvie / Journal o
ay partly explain why the effect is observed among these invest-ents. However, when we distinguish between R&D facilities and
on-manufacturing, non-R&D investments, we see similar effectsor both types of investment. Many of the latter are likely to beelated to marketing functions that become less important whenrices are controlled more aggressively, so it is possible that partf the observed effect is due to reductions in sales staff or otherarketing functions. If the results reflect reductions in marketing
xpenditures, then the normative conclusions to be drawn fromhis analysis are rather different. Less expenditure on marketing
ay actually be considered a benefit of price regulation rather thann unintended cost.
Is it possible that our results are explained by a geographi-ally constrained link between demand and non-manufacturingnvestment? We do observe a positive correlation between mar-et potential and R&D investment, which is consistent with theiew that our results reflect a reduction in investment in coun-ries that have become less profitable markets. However, if thiss the story, we would expect the correlation between marketotential in pharmaceuticals and investment to persist after con-rolling for the number of non-pharmaceutical investments inhe country. The fact that market potential becomes insignificanthen this control variable is added suggests that it is proxying
or other factors attracting non-manufacturing investment suchs the skill level of the workforce or public support for scientificesearch.
The reductions in investment we describe here are statisticallys well as economically significant. Looking at the results reportedn Table 8, for example in column 1, we see that countries thatncreased the stringency of their regulatory regimes during ourample period were approximately 59.7% less likely to receive annvestment than countries that did not change their policies (hold-ng constant time-invariant country characteristics).23 On average,
given country receives 2.45 investments per year during our sam-le period, so a reduction of 60% would amount to approximately.47 fewer investments. The mean number of jobs reported to bereated by an investment is 164.5 (although only approximatelyalf of announcements report the number of jobs created). Theffect of the policy change is comparable in magnitude to the effectf the origin and destination country sharing a common language,hich increases the probability of investment by 54% (column 1 of
able 8).It is difficult to obtain comprehensive evidence on the cost sav-
ngs generated by the policy reforms that we analyze. German totalxpenditures on pharmaceuticals rose steadily from 26.4 billionuro in 1995 to 36.8 billion in 2003. After the inclusion of patentededicines in the reference pricing scheme, expenditures fell to
5.8 billion in 2004 (they rose again to 39.5 billion in 2005).24 Inenmark, Kaiser et al. (2010) estimate a decline in patient and gov-rnment expenditures on statins of 15 and 9%, respectively. At theime of the introduction of TRP in Hungary, the national health ser-ice anticipated savings of 4.30 billion forint (or $21.32 billion).25
Finally, we present some comments and results as additional
Please cite this article in press as: Koenig, P., MacGarvie, M., Regulatory polin Europe. J. Health Econ. (2011), doi:10.1016/j.jhealeco.2011.07.005
obustness checks. First, because these announcements are vol-ntary public disclosures, there is a possibility that the datasetontains a disproportionate share of large, publicly traded firms.
23 This is the result of the comparison of the ratio of the probability firm i investsn reforming country r (P′) to non-reforming countries (P): P ′/P. Since these twostimated probabilities differ only by exp (ˇ) where is the coefficient on thepolicy change” dummy, and the latter coefficient is −0.91, we estimate that therobability of investment in reforming countries is approximately 40.3% of that inon-reforming countries.24 PPRI Country Profile – Germany (2008), p. 27.25 The Pharma Letter, July 4, 2005.
peEO
caP
i
PRESSlth Economics xxx (2011) xxx– xxx 15
ince the R&D-performing pharmaceutical firms tend to be largend publicly traded, we are likely capturing a large majority ofnvestments by these types of firms. However concerns about sam-le selection are likely to be more significant for smaller, privatelyraded biotech firms. It is important to keep in mind the sampleomposition when interpreting our results. If large, public firmsre more likely to alter investment decisions in response to regu-atory changes, our estimates will overstate the effect of regulationn investment by small, private firms.
Second, the data come from published sources in several lan-uages. However, there is a possibility that because our dataome from a French government agency, French-language publi-ations may be over-represented in our database. We performedobustness checks on a dataset that excludes French-language pub-ications, and obtained similar results. In response to a concernhat investments in France or by French companies were over-epresented in our data due to the origin of the dataset, we rannother set of regressions excluding investments made in France ory French companies, and again found similar results. These resultsre available upon request.
. Conclusions
This paper examines the relationship between cross-countryifferences in drug price regulation and the location of biopharma-eutical FDI in Europe. We use data on 527 investments initiatedn 27 European countries between 2002 and 2009 to estimate
hether biopharmaceutical companies are influenced by the strin-ency of price regulations in choosing the countries in which toocate new investments. We find that countries with price controlseceive fewer new non-manufacturing investments, after control-ing for other determinants of investment. Countries that increasedhe stringency of price regulation during the sample period wereelatively less likely to receive an investment after the policy wentnto effect. However, these effects vary across type of investment,
ith the most robust negative effect observed for administrativenvestments, only weakly significant effects for R&D, and no effector manufacturing investments.
ppendix A. Drug price regulation data
Information on regulatory policies by country come from a vari-ty of sources. The starting point was Table 2 of Kyle (2007a). Thisas supplemented with information on a larger set of European
ountries and a later time period using the following sources. Ofarticular value are the country profiles made available by theharmaceutical Pricing and Reimbursement Information (PPRI)rogram, at http://ppri.oebig.at/index.aspx.
Information on policies across countries was also obtained from:Vogler, S., Espin, J., Habl, C., 2009, Pharmaceutical pricing and
eimbursement information (PPRI) – New PPRI analysis includingpain. Pharmaceuticals Policy and Law 11, 213–234.
Additional information on countries’ policies came from:Adamski, J., Klim, A., Splawinski, J., 2008. Cost containment in the
harmaceutical sector: Innovative approaches to contracting whilensuring fair access to drugs. Presented at Peer Review Meeting,uropean Commission DG Employment, Social Affairs and Equalpportunities, June 30 to July 1, 2008.
Danzon, P., Ketcham, J., 2003. Reference pricing of pharma-euticals for medicare: evidence from Germany, The Netherlands
icy and the location of bio-pharmaceutical foreign direct investment
nd New Zealand. National Bureau of Economic Research, Workingaper 10007.
Ferragut Ensenyat, G., 2007. Update on pharmaceutical policyn Spain. Health Policy Monitor (10).
ING Model
J
1 f Hea
a
SOS
pH
LO
PO
EP
N
H
t
N
i
ci
tBC
R
A
B
C
C
C
C
C
D
D
D
D
D
F
F
G
H
H
H
J
U
K
K
K
K
KL
M
M
O
P
P
P
R
R
S
S
ARTICLEHE-1510; No. of Pages 16
6 P. Koenig, M. MacGarvie / Journal o
Huttin, M., 1999. Drug price divergence in Europe: regulatoryspects. Health Affairs 18 (May/June (3)).
Jesse, M., Habicht, J., Aaviksoo, A., Koppel, A., Irs, A., Thomson,., 2004. Health Care Systems in Transition: Estonia. WHO Regionalffice for Europe on Behalf of the European Observatory on Healthystems and Policies, Copenhagen.
Kalo, K., Muszbek, N., Bodrogi, J., Bidlo, J., 2007. Does thera-eutic reference pricing always result in cost-containment? Theungarian evidence. Health Policy 80 (March (3)) 402–412.
Karaskevica, J., Tragakes, E., 2001. Health Systems in Transition:atvia. WHO Regional Office for Europe on behalf of the Europeanbservatory on Health Systems and Policies, Copenhagen.
Kuszewski, K, Gericke, C., 2004. Health Systems in Transition:oland. WHO Regional Office for Europe on Behalf of the Europeanbservatory on Health Systems and Policies, Copenhagen.
Mossiolos, P., et al. (Eds.), 2004. Regulating Pharmaceuticals inurope: Striving for Efficiency, Equity and Quality. Open Universityress.
Mitchell, P., 2008. UK strong arms industry over drug pricing.ature Biotechnology 26, 846–847.
OECD, 2008. Pharmaceutical pricing policies in a global market.ealth Policy Studies.
Office of the U.S. Trade Representative, 2005. 2005 nationalrade estimate report on foreign trade barriers.
Pharmaceutical Research and Manufacturers of America, 2007.ational trade estimate report on foreign trade barriers (NTE).
Puig-Junoy, J., 2007. The impact of generic reference pricingnterventions in the statin market. Health Policy 2007 84, 14–29.
Puig-Junoy, J., 2010. A review of the impact of European pharma-eutical price regulation on generic price competition forthcomingn Pharmacoeconomics.
Vladescu, C., Radulescu, S., Olsavsky, V., 2000. Health Care Sys-ems in Transition: Romania. WHO Regional Office for Europe onehalf of the European Observatory on Health Systems and Policies,openhagen.
eferences
hlering, B., 2004. The Impact Of Regulatory Stringency on the Foreign DirectInvestment of Global Pharmaceutical Firms. ESRC Center for Business ResearchWorking Paper.
rekke, K.R., Grasdal, A.L., Holm, T.H., 2008. Regulation and pricing of pharmaceu-ticals: reference pricing or price cap regulation. European Economic Review 53(2), 170–185.
arlton, Dennis, W., August 1983. “The Location and Employment Choices of NewFirms: An Econometric Model with Discrete and Continuous Endogenous Vari-ables,”. The Review of Economics and Statistics, MIT Press 65 (3), 440–449.
hung, W., Alcacer, J., 2002. Knowledge seeking and location choice of foreign directinvestment in the United States. Management Science 48 (12), 1534–1554.
onley, T., 1999. GMM estimation with cross-sectional dependence. Journal ofEconometrics 92, 1–45.
oughlin, C., Terza, J., Arromdee, V., 1991. State characteristics and the location offoreign direct investment within the United States. The Review of Economics
Please cite this article in press as: Koenig, P., MacGarvie, M., Regulatory polin Europe. J. Health Econ. (2011), doi:10.1016/j.jhealeco.2011.07.005
and Statistics 73 (4), 675–683.rozet, M., Mayer, T., Mucchielli, J.-L., 2004. How do firms agglomerate? A study of
FDI in France. Regional Science and Urban Economics 34, 27–54.anzon, P.M. & Epstein, A.J., 2008.“Effects of regulation on drug launch and pricing
in interdependent markets.” NBERWorking Paper 14041.
D
PRESSlth Economics xxx (2011) xxx– xxx
anzon, P., Ketcham, J., 2003. Reference pricing of pharmaceuticals for medicare:evidence from Germany, The Netherlands and New Zealand. National Bureau ofEconomic Research 1000, 7.
anzon, P., Wang, Y.R., Wang, L., 2004. The impact of price regulation on the launchdelay of new drugs—evidence from twenty-five major markets in the 1990.Health Economics. 14 (3), 269–292.
evereux, M., Griffith, R., Klemm, A., 2002. Corporate Income Tax Reforms andInternational Tax Competition”. Economic Policy 17-35, 451–495.
evereux, M., Griffith, R., Simpson, H., 2007. Firm location decisions, regional grantsand agglomeration externalities. Journal of Public Economics 91, 413–435.
abrizio, K. and LG Thomas, “The Impact of Local Demand on Product Innovation ina Global Industry,” Strategic Management Journal (forthcoming).
inkenzeller, M. and C. Spengel, (2004), “Measuring the Effective Levels of Com-pany Taxation in the New MemberStates: A Quantitative Analysis”, EuropeanCommission Taxation Papers, Working paper no 7/2004.
uimaraes, P., Figueiredo, O., Woodward, D., 2000. Agglomeration and the locationof foreign direct investment in Portugal. Journal of Urban Economics 47 (1),115–135.
arris, C.D., 1954. The market as a factor in the localization of industry in the UnitedStates. Annals of the Association of American Geographers 44 (4), 315-31 and341-48.
ead, K., Ries, J., Svenson, D., 1999. Attracting foreign manufacturing: investmentpromotion and agglomeration. Regional Science and Urban Economics 29 (2),197–218.
ead, K., Mayer, T., 2004. Market potential and the location of Japanese investmentin the European union. The Review of Economics and Statistics 86 (4), 959–972.
acobzone, S., 2000. Pharmaceutical policies in OECD countries: reconciling socialand industrial goals. OECD, Paris.
lrich Kaiser, Susan J. Mendez, Thomas Rønde, 2010.“Regulation of PharmaceuticalPrices: Evidence from a Reference Price Reform in Denmark,” CIE DiscussionPapers 2010-01, University of Copenhagen.Department of Economics. Centrefor Industrial Economics.
alo, K., Muszbek, N., Bodrogi, J., Bidlo, J., 2007. Does therapeutic reference pricingalways result in cost-containment? The Hungarian evidence. Health Policy 80(3), 402–412.
anavos, P., 2002. Pharmaceutical Regulation in Europe, http://www.irpp.org/events/archive/sep02/kanavos.pdf (accessed on July 21, 2010).
yle, M., 2006. The role of firm characteristics in pharmaceutical product launches.RAND Journal of Economics 37 (3), 602–618.
yle, M., 2007a. Pharmaceutical price controls and entry strategies. Review of Eco-nomics and Statistics 89 (1), 88–99.
yle, M., 2007b. Strategic responses to parallel trade. NBER Working Paper #12968.anjouw, J., 2005. Patents, Price controls and access to new drugs: how policy affects
global market entry. NBER Working Paper #11321.oreno-Torres, I., Puig-Junoy, J., Borell-Arque, J.R., 2007. Generic entry into a regu-
lated pharmaceutical market. Working Paper.ossiolos, P., et al. (Eds.), 2004. Regulating Pharmaceuticals in Europe: Striving for
Efficiency, Equity and Quality,. Open University Press.ECD, 2008. Pharmaceutical pricing policies in a global market. Health Policy Stud-
ies.ermanand, G., Mossialos, E., 2005. Constitutional asymmetry and pharmaceutical
policy-making in the European Union. Journal of European Public Policy 12 (4),687–709.
odnar, K., Molj, B., Golob, U., 2007. “How Reference Pricing for Pharmaceuticals CanIncrease Generic Share of Market: The Slovenian Experience”. Journal of PublicPolicy and Marketing 26 (1), 89, Spring.
uig-Junoy, J., 2007. The impact of generic reference pricing interventions in thestatin market. Health Policy 84, 14–29.
appaport, J., Sachs, J.D., 2003. “The United States as a Coastal Nation”. Journal ofEconomic Growth 8 (1), 5–46, March 2003.
edding, S., Venables, A., 2004. Economic geography and International Inequality.Journal of International Economics 62 (1), 53–82.
hleifer, A., Vishny, R., 1994. “Politicians and Firms” Quarterly. Journal of Economics,November 1994.
ood, N., de Vries, H., Gutierrez, I., Lakdawalla, D.N., Goldman, D.P., 2008. The Effect
icy and the location of bio-pharmaceutical foreign direct investment
of Regulation on Pharmaceutical Revenues: Experience in Nineteen Countries.Health Affairs Web Exclusive, pp. w125–w137.
ecember 2004. “Pharmaceutical Price Controls in OECD Countries: Implicationsfor U.S. Consumers, Pricing, Research and Development, and Innovation”. U.S.Department of Commerce International Trade Administration, Washington, D.C.


![Article in Press - cdn.publisher.gn1.link2018;25(3):[article in press] Article in Press 140 hipertensão descompensada, diabetes descompensado, má formações de segmentos nos 141](https://img.pdfslide.us/doc/110x75/6015d4ddd2e1762737317163/article-in-press-cdn-2018253article-in-press-article-in-press-140-hipertenso.jpg)