Embed Size (px)
Citation preview

IV. Environmental Setting and Impacts
April 21, 2011 IV.G.1 Treasure Island / Yerba Buena Island Case No. 2007.0903E Redevelopment Project Final EIR
G. AIR QUALITY
This section discusses the regulatory framework for air quality management and the existing air quality conditions in the area, and analyzes the potential for the Proposed Project to affect existing air quality conditions, both regionally and locally, from activities that emit criteria and non-criteria air pollutants. It also analyzes the types and quantities of emissions that would be generated on a temporary basis due to proposed construction and over the long term due to proposed operation. The section determines whether those emissions are significant in relation to applicable air quality standards, and identifies mitigation measures addressing significant impacts. Finally, the section provides an analysis of cumulative air quality impacts. Emissions of greenhouse gases resulting from the Proposed Project and their potential impacts to climate change and the goals of Assembly Bill 32 are presented and discussed in Section IV.H, Greenhouse Gases, of this EIR.
The analysis in this section is based on a review of existing air quality conditions in the region and air quality regulations administered by the U.S. Environmental Protection Agency (“EPA”), the California Air Resources Board (CARB), and the Bay Area Air Quality Management District (“BAAQMD”). This analysis includes methodologies identified in both the existing (1999) and updated CEQA Air Quality Guidelines adopted by BAAQMD on June 2, 2010.
This section presents estimates of existing and future emissions based on standard air quality modeling techniques recommended by the BAAQMD. This section also presents the results of a health risk assessment undertaken to evaluate potential effects on humans from exposure to emissions of toxic air contaminants (“TACs”) generated by diesel buses and diesel-powered ferry trips into and out of the Project Area.
SETTING
CRITERIA AIR POLLUTANTS
As required by the 1970 Federal Clean Air Act, the United States Environmental Protection Agency (“EPA”) initially identified six criteria air pollutants that are pervasive in urban environments and for which state and federal health-based ambient air quality standards have been established. The EPA calls these pollutants criteria air pollutants because the agency has regulated them by developing specific public health- and welfare-based criteria as the basis for setting permissible levels. Ozone, carbon monoxide (“CO”), particulate matter (“PM”), nitrogen dioxide (“NO2”), sulfur dioxide (“SO2”), and lead are the six criteria air pollutants originally identified by EPA. Since that time, subsets of particulate matter have been identified for which permissible levels have been established. These include particulate matter of 10 microns in diameter or less (“PM10”) and particulate matter of 2.5 microns in diameter or less (“PM2.5”).

IV. Environmental Setting and Impacts G. Air Quality
April 21, 2011 IV.G.2 Treasure Island / Yerba Buena Island Case No. 2007.0903E Redevelopment Project Final EIR
The BAAQMD’s air quality monitoring network provides information on ambient concentrations of criteria air pollutants at various locations in the San Francisco Bay Area. Table IV.G.1 is a five-year summary of highest annual criteria air pollutant concentrations (2005 to 2009), collected at the BAAQMD’s air quality monitoring station at 16th and Arkansas Streets, in San Francisco’s lower Potrero Hill area, which is the closest monitoring station to Treasure Island.1 Table IV.G.1 compares measured pollutant concentrations with the most stringent applicable ambient air quality standards (State or Federal). A complete compilation of both state and federal ambient air quality standards is provided in Table IV.G.2.
Ozone
Ozone is a secondary air pollutant produced in the atmosphere through a complex series of photochemical reactions involving reactive organic gases (“ROG”, also sometimes referred to as volatile organic compounds or “VOC” by some regulating agencies) and nitrogen oxides (“NOx”). The main sources of ROG and NOx, often referred to as ozone precursors, are combustion processes (including motor vehicle engines) and the evaporation of solvents, paints, and fuels. In the Bay Area, automobiles are the single largest source of ozone precursors. Ozone is referred to as a regional air pollutant because its precursors are transported and diffused by wind concurrently with ozone production through the photochemical reaction process. Ozone causes eye irritation, airway constriction, and shortness of breath and can aggravate existing respiratory diseases such as asthma, bronchitis, and emphysema. Table IV.G.1 shows that, according to published data, the most stringent applicable standards (state 1-hour standard of 9 parts per hundred million (“pphm”) and the federal 8-hour standard of 8 pphm were not exceeded in San Francisco between 2004 and 2008.
Carbon Monoxide
CO is an odorless, colorless gas usually formed as the result of the incomplete combustion of fuels. The single largest source of CO is motor vehicles; the highest emissions occur during low travel speeds, stop-and-go driving, cold starts, and hard acceleration. Exposure to high concentrations of CO reduces the oxygen-carrying capacity of the blood and can cause headaches, nausea, dizziness, and fatigue, impair central nervous system function, and induce angina (chest pain) in persons with serious heart disease. Very high levels of CO can be fatal. As shown in Table IV.G.1, the more stringent state CO standards were not exceeded between 2004 and 2008. Measurements of CO indicate hourly maximums ranging between 15 to 25 percent of the more stringent state standard, and maximum 8-hour CO levels that are approximately 30 percent of the allowable 8-hour standard.
1 Data from this single location do not describe pollutant levels throughout San Francisco, as these levels
may vary depending on distance from key emissions sources and local meteorology. However, the BAAQMD monitoring network does provide a reliable picture of pollutant levels over time.

IV. Environmental Setting and Impacts G. Air Quality
April 21, 2011 IV.G.3 Treasure Island / Yerba Buena Island Case No. 2007.0903E Redevelopment Project Final EIR
Table IV.G.1: Summary of San Francisco Air Quality Monitoring Data (2005–2009)
Pollutant
Most Stringent
Applicable Standard
Number of Days Standards Were Exceeded and Maximum Concentrations Measureda
2005 2006 2007 2008 2009
Ozone - Days 1-hour Std. Exceeded 0 0 0 0 0 - Max. 1-hour Conc. (pphm) >9 pphmb 6 5 6 8 7 - Days 8-hour Std. Exceeded 0 0 0 0 0
- Max. 8-hour Conc. (pphm) >7 pphmc 5 5 5 7 6
Carbon Monoxide (CO) - Days 1-hour Std. Exceeded 0 0 0 0 ND - Max. 1-hour Conc. (ppm) >20 ppmb 2.9 2.9 2.7 5.7 ND - Days 8-hour Std. Exceeded 0 0 0 0 0 - Max. 8-hour Conc. (ppm) >9 ppmb 2.1 2.1 1.6 2.3 2.9 Suspended Particulates (PM10)
- Days 24-hour Std. Exceededd 0 3 2 0 0
- Max. 24-hour Conc. (µg/m3) >50 µg/m3 b 46 61 70 41 36
Suspended Particulates (PM2.5)
- Days 24-hour Std. Exceedede 0 3 5 0 1
- Max. 24-hour Conc. (µg/m3) >35 µg/m3 c 44e 54 45 29 36
- Annual Average (µg/m3) >12 µg/m3 b 9.5 9.7 8.7 9.8 ND Nitrogen Dioxide (NO2) - Days 1-hour Std. Exceeded 0 0 0 0 0 - Max. 1-hour Conc. (pphm) >25 pphmb 7 11 7 6 6 Sulfur Dioxide (SO2) - Days 24-hour Std. Exceeded 0 0 0 0 ND - Max. 24-hour Conc. (ppb) >40 ppbb 7 6 6 4 ND Notes: Bold values are in excess of applicable standard. “NA” indicates that data is not available. conc. = concentration; ppm = parts per million; pphm = parts per hundred million; ppb=parts per billion; µg/m3 = micrograms per cubic meter ND = No data or insufficient data. a Number of days exceeded is for all days in a given year, except for particulate matter. PM10 and PM2.5 are
monitored every six days and therefore the number of days exceeded is out of approximately 60 annual samples. b State standard, not to be exceeded. c Federal standard, not to be exceeded. d Based on a sampling schedule of one out of every six days, for a total of approximately 60 samples per year. e Federal standard was reduced from 65 µg/m3 to 35 µg/m3 in 2006. Source: BAAQMD, Bay Area Air Pollution Summary, 2004 – 2008. Available online at: http://www.baaqmd.gov/Divisions/Communications-and-Outreach/Air-Quality-in-the-Bay-Area/Air-Quality-Summaries.aspx and http://www.arb.ca.gov/adam/cgi-bin/db2www/adamtop4b.d2w/start and http://www.arb.ca.gov/adam/topfour/topfour1.php

IV. Environmental Setting and Impacts G. Air Quality
April 21, 2011 IV.G.4 Treasure Island / Yerba Buena Island Case No. 2007.0903E Redevelopment Project Final EIR
Table IV.G.2: State and Federal Ambient Air Quality Standards and Attainment Status
State SAAQsa (Federal) NAAQSb
Pollutant Averaging
Time Standard Attainment
Status Standard Attainment
Status
Ozone 1 hour 0.09 ppm N NA See Note c
8 hour 0.07 ppm Ud 0.075 ppm N/Marginal
Carbon Monoxide (CO) 1 hour 20 ppm A 35 ppm A
8 hour 9 ppm A 9 ppm A
Nitrogen Dioxide (NO2) 1 hour 0.18 ppm A NA NA
Annual NA NA 0.053 ppm A
Sulfur Dioxide (SO2) 1 hour 0.25 ppm A NA NA
24 hour 0.04 ppm A 0.14 ppm A
Annual NA NA 0.03 ppm A
Particulate Matter (PM10)
24 hour 50 µg/m3 N 150 µg/m3 U
Annuale 20 µg/m3 f N 50 µg/m3 A
Fine Particulate Matter (PM2.5)
24 hour NA NA 35 µg/m3 U
Annual 12 µg/m3 N 15 µg/m3 A
Sulfates 24 hour 25 µg/m3 A NA NA
Lead 30 day 1.5 µg/m3 A NA NA
Cal. Quarter NA NA 1.5 µg/m3 A
Hydrogen Sulfide 1 hour 0.03 ppm U NA NA
Visibility-Reducing Particles 8 hour See Note g A NA NA
Notes: A = Attainment; N = Nonattainment; U = Unclassified; NA = Not Applicable, no applicable standard;= ppm = parts per million; µg/m3 = micrograms per cubic meter.
a SAAQs = state ambient air quality standards (California). SAAQS for ozone, carbon monoxide (except Lake Tahoe), sulfur dioxide (1-hour and 24-hour), nitrogen dioxide, particulate matter, and visibility-reducing particles are values that are not to be exceeded. All other state standards shown are values not to be equaled or exceeded.
b NAAQs = national ambient air quality standards. NAAQS, other than ozone and particulates, and those based on annual averages or annual arithmetic means, are not to be exceeded more than once a year. The 8-hour ozone standard is attained when the three-year average of the fourth highest daily concentration is 0.08 ppm or less. The 24-hour PM10 standard is attained when the three-year average of the 99th percentile of monitored concentrations is less than the standard. The 24-hour PM2.5 standard is attained when the three-year average of the 98th percentile is less than the standard.
c The U.S. EPA revoked the national 1-hour ozone standard on June 15, 2005. d This state 8-hour ozone standard was approved in April 2005 and became effective in May 2006. e State standard = annual geometric mean; national standard = annual arithmetic mean. f In June 2002, The California Air Resources Board (ARB) established new annual standards for PM2.5 and PM10. g Statewide visibility-reducing particle standard (except Lake Tahoe Air Basin): Particles in sufficient amount to produce an extinction coefficient of 0.23 per kilometer when the relative humidity is less than 70 percent. This standard is intended to limit the frequency and severity of visibility impairment due to regional haze and is equivalent to a 10-mile nominal visual range. Source: Bay Area Air Quality Management District (BAAQMD), Standards and Attainment Status, May 2006. Website accessed on October 28, 2006: http://www.baaqmd.gov/pln/air_quality/ambient_air_quality.htm

IV. Environmental Setting and Impacts G. Air Quality
April 21, 2011 IV.G.5 Treasure Island / Yerba Buena Island Case No. 2007.0903E Redevelopment Project Final EIR
Particulate Matter
Particulate matter is a class of air pollutants that consists of heterogeneous solid and liquid airborne particles from manmade and natural sources. Particulate matter is measured in two size ranges: PM10 for particles less than 10 microns in diameter, and PM2.5 for particles less than 2.5 microns in diameter. In the Bay Area, motor vehicles generate about one-half of the air basin’s particulates, through tailpipe emissions as well as brake pad and tire wear. Wood burning in fireplaces and stoves, industrial facilities, and ground-disturbing activities such as construction are other sources of such fine particulates. These fine particulates are small enough to be inhaled into the deepest parts of the human lung and can cause adverse health effects. According to the CARB, studies in the United States and elsewhere “have demonstrated a strong link between elevated particulate levels and premature deaths, hospital admissions, emergency room visits, and asthma attacks,” and studies of children’s health in California have demonstrated that particle pollution “may significantly reduce lung function growth in children.” The CARB also reports that statewide attainment of particulate matter standards could prevent thousands of premature deaths, lower hospital admissions for cardiovascular and respiratory disease and asthma-related emergency room visits, and avoid hundreds of thousands of episodes of respiratory illness in California.2
Among the criteria pollutants that are regulated, particulates appear to represent a serious ongoing health hazard. As long ago as 1999, the BAAQMD was reporting, in its CEQA Guidelines, that studies had shown that elevated particulate levels contribute to the death of approximately 200 to 500 people per year in the Bay Area. Compelling evidence suggests that PM2.5 is by far the most harmful air pollutant in the San Francisco Bay Area Air Basin in terms of the associated impact on public health. A large body of scientific evidence indicates that both long-term and short-term exposure to PM2.5 can cause a wide range of health effects (e.g., aggravating asthma and bronchitis, causing visits to the hospital for respiratory and cardiovascular symptoms, and contributing to heart attacks and deaths).3
Table IV.G.1 shows that exceedances of the state PM10 standard have routinely occurred in San Francisco. It is estimated that the state 24-hour PM10 standard of 50 micrograms per cubic meter (“µg/m3”) was exceeded on up to 30 days per year between 2005 and 2009.4 The
2 California Air Resources, Board, “Recent Research Findings: Health Effects of Particulate Matter and
Ozone Air Pollution,” November 2007. Accessed on February 1, 2010. Available on the internet at: http://www.arb.ca.gov/research/health/fs/pm_ozone-fs.pdf. A copy of this document is available for public review at the San Francisco Planning Department, 1650 Mission Street, Suite 400, in Case File No. 2007.0903E.
3 BAAQMD, BAAQMD CEQA Guidelines, California Environmental Quality Act Air Quality Guidelines. June, 2010; p. 5.2. Available on the internet at: http://www.baaqmd.gov/pln/ceqa/ceqa_guide.pdf. Accessed on June 25, 2010.
4 PM10 is sampled every sixth day; therefore, actual days over the standard can be estimated to be six times the numbers listed in the table.

IV. Environmental Setting and Impacts G. Air Quality
April 21, 2011 IV.G.6 Treasure Island / Yerba Buena Island Case No. 2007.0903E Redevelopment Project Final EIR
BAAQMD began monitoring PM2.5 concentrations in San Francisco in 2002. The federal 24-hour PM2.5 standard was not exceeded until 2006, when the standard was lowered from 65 µg/m3 to 35 µg/m3. It is estimated that the state 24-hour PM2.5 standard was exceeded on up to 54 days per year between 2005 and 2009. The state annual average standard was not exceeded between 2004 and 2008.
Nitrogen Dioxide
NO2 is a reddish brown gas that is a byproduct of combustion processes. Automobiles and industrial operations are the main sources of NO2. Aside from its contribution to ozone formation, NO2 can increase the risk of acute and chronic respiratory disease and reduce visibility. NO2 may be visible as a coloring component on high pollution days, especially in conjunction with high ozone levels. Table IV.G.1 shows that the standard for NO2 is being met in the Bay Area, and pollutant trends suggest that the air basin will continue to meet these standards for the foreseeable future.
Sulfur Dioxide
SO2 is a colorless acidic gas with a strong odor. It is produced by the combustion of sulfur-containing fuels such as oil, coal, and diesel. SO2 has the potential to damage materials and can cause health effects at high concentrations. It can irritate lung tissue and increase the risk of acute and chronic respiratory disease.5,6 Table IV.G.1 shows that the standard for SO2 is being met in the Bay Area, and pollutant trends suggest that the air basin will continue to meet these standards for the foreseeable future.
Lead
Leaded gasoline (phased out in the United States beginning in 1973), paint (on older houses, cars), smelters (metal refineries), and manufacture of lead storage batteries have been the primary sources of lead released into the atmosphere. Lead has a range of adverse neurotoxic health effects, which puts children at special risk. Some lead-containing chemicals cause cancer in animals. Lead levels in the air have decreased substantially since leaded gasoline was eliminated. Ambient lead concentrations are only monitored on an as-warranted, site-specific basis in California. On October 15, 2008, EPA strengthened the National Ambient Air Quality Standard for lead by lowering it from1.5 μg/m3 to 0.15 μg/m3. The EPA is in the process of revising the monitoring requirements for lead, with an expected promulgation date of fall 2010. Early versions of the regulation suggest that lead monitors will need to be placed at larger private
5 BAAQMD, CEQA Guidelines, op. cit.; p. B-2. 6 BAAQMD, CEQA Air Quality Guidelines, May, 2010, http://www.oehha.org/air/hot_spots/pdf/HRA
guidefinal.pdf; p. C-16.

IV. Environmental Setting and Impacts G. Air Quality
April 21, 2011 IV.G.7 Treasure Island / Yerba Buena Island Case No. 2007.0903E Redevelopment Project Final EIR
airplane airports. After that regulation is finalized, the BAAQMD will have up to one year to install any required lead monitors.7
TOXIC AIR CONTAMINANTS
Toxic air contaminants (“TACs”) are air pollutants that may lead to serious illness or increased mortality, even when present in relatively low concentrations. Potential human health effects of TACs include birth defects, neurological damage, cancer, and death. There are hundreds of different types of TACs with varying degrees of toxicity. Individual TACs vary greatly in the health risk they present; at a given level of exposure, one TAC may pose a hazard that is many times greater than another.
TACs do not have ambient air quality standards, but are regulated by the BAAQMD using a risk-based approach. This approach uses a health risk assessment to determine what sources and pollutants to control as well as the degree of control. A health risk assessment is an analysis of exposure to toxic substances and human health risks from exposure to toxic substances is estimated, based on the potency of the toxic substances.8
In addition to monitoring criteria pollutants, both BAAQMD and CARB operate TAC monitoring networks in the San Francisco Bay Area. These stations measure 10 to 15 TACs, depending on the specific station. The TACs selected for monitoring are those that have traditionally been found in the highest concentrations in ambient air, and therefore tend to produce the most significant risk. The nearest BAAQMD ambient TAC monitoring station to the Proposed Project is the station at 16th and Arkansas Streets in San Francisco. Table IV.G.3 shows ambient concentrations of carcinogenic TACs measured at the Arkansas Street station, and the estimated cancer risks from a lifetime exposure to these substances is also reported in the table. When TAC measurements at this station are compared to ambient concentrations of various TACs for the Bay Area as a whole, the cancer risks associated with mean TAC concentrations in San Francisco are similar to those for the Bay Area as a whole. Therefore, the estimated average lifetime cancer risk resulting from exposure to TAC concentrations monitored at the San Francisco station do not appear to be any greater than for the Bay Area as a region.
7 BAAQMD, 2009 Air Monitoring Network Report, To be Submitted July 21, 2010, p. 20. Available at
http://www.baaqmd.gov/~/media/Files/Technical%20Services/2009_Network_Plan.ashx. Accessed June 1, 2010.
8 A health risk assessment is required for permitting approval if the BAAQMD concludes that projected emissions of a specific air toxic compound from a proposed new or modified source suggest a potential public health risk. In these instances, a health risk assessment for the source in question must be prepared. Such an assessment generally evaluates chronic, long-term effects, calculating the increased risk of cancer as a result of exposure to one or more TACs.

IV. Environmental Setting and Impacts G. Air Quality
April 21, 2011 IV.G.8 Treasure Island / Yerba Buena Island Case No. 2007.0903E Redevelopment Project Final EIR
Table IV.G.3: Annual Average Ambient Concentrations of Carcinogenic TACs Measured at BAAQMD Monitoring Station, 10 Arkansas Street, San Franciscoa
Substance Conc. Cancer Risk per millionb
Gaseous TACs (ppb) Acetaldehyde 0.39 2 Benzene 0.18 17 1,3-Butadiene 0.036 14 para-Dichlorobenzene 0.15 10 Carbon Tetrachloride 0.094 25 Formaldehyde 2.69 20
Perchloroethylene 0.02 0.8 Methylene Chloride 0.12 0.4 Chloroform 0.015 0.4 Trichloroethylene 0.01 0.1
Particulate TACs (ng/m3) Chromium (Hexavalent) 0.059 9
Total Risk for All TACs 89.7 Notes:
ppb - part per billion, ng/m3 - nanograms per cubic meter. a All values are from BAAQMD 2008 monitoring data for the Arkansas Street station, except for Formaldehyde and
Hexavalent Chromium, which are statewide averages for the year 2008. b Cancer risks were estimated by applying published unit risk values to the measured concentrations. Source: California Air Resources Board, Ambient Air Toxics Summary-2008, available online at: http://www.arb.ca.gov/adam/toxics/sitesubstance.html
BAAQMD provides two public source inventories of TAC emissions sources within its jurisdiction. The first is its TAC Annual Report, the most recent of which was published in 2007 and does not identify any TAC sources on Treasure Island or Yerba Buena Island. The second source is its recently released (May 2010) Google Earth-based inventory of stationary source risks and hazards. This latter source indicates one permitted TAC source on Yerba Buena Island and none on Treasure Island. This single source on Yerba Buena Island is a buoy painting facility operated by the US Coast Guard on the eastern side of the island, approximately 700 feet east of the San Francisco – Oakland Bay Bridge (“Bay Bridge”). BAAQMD identifies a cancer risk of 13.7 in one million associated with this facility, a chronic hazard index9 of 0.0096 and an acute hazard index of 0.00432. These risk values are for the maximally exposed receptor.
9 Hazard Index is a summation of the hazard quotients for all chemicals to which an individual is exposed.
A hazard index value of 1.0 or less than 1.0 indicates that no adverse human health effects (noncancer) are expected to occur.

IV. Environmental Setting and Impacts G. Air Quality
April 21, 2011 IV.G.9 Treasure Island / Yerba Buena Island Case No. 2007.0903E Redevelopment Project Final EIR
Diesel Particulate Matter
Diesel exhaust is a growing concern throughout California. The CARB identified diesel particulate matter (“DPM”) as a toxic air contaminant in 1998, primarily based on evidence demonstrating cancer effects in humans.10 The exhaust from diesel engines includes hundreds of different gaseous and particulate components, many of which are toxic. Many of these toxic compounds adhere to diesel particles, which are very small and can penetrate deeply into the lungs. The toxic substances represented by diesel particulate matter are not included in the concentrations reported in Table IV.G.3, but would be in addition to those when determining total cancer risk from TACs. Mobile sources such as trucks, buses, and, to a much lesser extent, automobiles are some of the primary sources of diesel emissions. Studies show that the estimated cancer risk from exposure to diesel exhaust is much higher than the risk associated with any other toxic air pollutant routinely measured in the region. CARB estimated the average Bay Area cancer risk from DPM, based on a population-weighted average ambient diesel particulate concentration, at about 480 in one million as of 2000. The risk from DPM has declined from 750 in one million in 1990 and 570 in one million in 1995. CARB estimated the average statewide cancer risk from DPM at 540 in one million in 2000.11,12 Other studies have shown that diesel exhaust and other cancer-causing chemicals emitted from cars and trucks are responsible for much of the cumulative cancer risk from airborne toxics in California. Diesel exhaust also contains pulmonary irritants and hazardous compounds that could affect non-cancer health effects in sensitive receptors such as young children, senior citizens, or those susceptible to chronic respiratory disease such as asthma, bronchitis, and emphysema.
Recent air pollution studies have shown an association between respiratory and other non-cancer health effects and proximity to high traffic roadways. The CARB community health risk assessments and regulatory programs have produced air quality information about certain types of facilities for consideration by local authorities when siting new residences, schools, day care centers, parks and playgrounds, and medical facilities (i.e., sensitive land uses). Sensitive land
10 California Air Resources Board, Fact Sheet, “The Toxic Air Contaminant Identification Process: Toxic
Air Contaminant Emissions from Diesel-fueled Engines,” October 1998. Available on the internet at: http://www.arb.ca.gov/toxics/dieseltac/factsht1.pdf. A copy of this document is available for public review at the San Francisco Planning Department, 1650 Mission Street, Suite 400, in Case File No. 2007.0903E.
11 CARB, California Almanac of Emissions and Air Quality - 2009 Edition, Table 5-44 and Figure 5-12. Available on the internet at: http://www.arb.ca.gov/aqd/almanac/almanac09/chap509.htm. Accessed February 1, 2010.
12 This calculated cancer risk values from ambient air exposure in the Bay Area can be compared against the lifetime probability of being diagnosed with cancer in the United States, from all causes, which is more than 40 percent (based on a sampling of 17 regions nationwide), or greater than 400,000 in one million, according to the American Cancer Society. American Cancer Society, “Lifetime Probability of Developing or Dying from Cancer,” Last Revised 07/13/2009, available online at http://www.cancer.org/docroot/CRI/content/CRI_2_6x_Lifetime_Probability_ of_Developing_or_Dying_From_Cancer.asp.

IV. Environmental Setting and Impacts G. Air Quality
April 21, 2011 IV.G.10 Treasure Island / Yerba Buena Island Case No. 2007.0903E Redevelopment Project Final EIR
uses deserve special attention because children, pregnant women, the elderly, and those with existing health problems are especially vulnerable to the non-cancer effects of air pollution. There is also substantial evidence that children are more sensitive to cancer-causing chemicals.13
In 2000, the CARB approved a comprehensive Diesel Risk Reduction Plan to reduce diesel emissions from both new and existing diesel-fueled vehicles and engines. The Plan aims to develop and implement specific statewide regulations designed to reduce DPM emissions and the associated health risk 75 percent by 2010 and 85 percent by 2020. In addition to implementing more stringent engine controls (diesel engines produced today have one-eighth the tailpipe exhausts of a truck or bus built in 1990), diesel fuel is required to have lower sulfur levels. As of June 1, 2006, at least 80 percent of on-road diesel fuel refined in the United States was required to be ultra-low sulfur diesel, which resulted in a reduction in sulfur emissions by 97 percent. All of the diesel fuel sold in California for use with on-road trucks is now ultra-low sulfur diesel. With new controls and fuel requirements, 60 trucks built in 2007 would have the same soot exhaust emissions as one truck built in 1988.14
Despite these dramatic reductions in emission rates, reducing DPM emissions will take time since older trucks will need to be retrofitted or phased out as part of fleet turnover. While these efforts are reducing diesel particulate emissions on a statewide basis, they do not yet capture every site on which diesel vehicles and engines operate. As a result, the CARB recommends that proximity to sources of DPM emissions be considered in the siting of new development. For example, CARB’s guidance is that new sensitive land uses (e.g., residences, schools, daycare centers, playgrounds, or medical facilities) not be located within 500 feet of a freeway or urban roads carrying at least 100,000 vehicles per day.
The CARB notes that these recommendations are advisory and should not be interpreted as defined “buffer zones.” CARB acknowledges that land use agencies must balance other considerations, including housing and transportation needs, the benefits of urban infill, community economic development priorities, and other quality of life issues. With careful evaluation of exposure, health risks, and affirmative steps to reduce risk where necessary, CARB’s position is that infill development, mixed use, higher density, transit-oriented development, and other concepts that benefit regional air quality can be compatible with protecting the health of individuals at the neighborhood level.15
13 California Air Resources Board, Air Quality and Land Use Handbook: A Community Health Perspective,
April 2005 (hereinafter “ARB Air Quality and Land Use Handbook”). Available on the internet at: http://www.arb.ca.gov/ch/handbook.pdf.
14 Pollution Engineering, New Diesel Fuel Rules Start, website accessed on October 30, 2006: http://www.pollutioneng.com/CDA/.
15 CARB Air Quality and Land Use Handbook; see footnote 133, p. 11.

IV. Environmental Setting and Impacts G. Air Quality
April 21, 2011 IV.G.11 Treasure Island / Yerba Buena Island Case No. 2007.0903E Redevelopment Project Final EIR
Traffic Related Pollutants
Engine exhaust, from both diesel and gasoline engines in roadway vehicles, is a complex mixture of particles and gases. As discussed above, vehicle emissions generate both NAAQS criteria air pollutants such as CO, PM, and NOx as well as other non-criteria toxic air contaminants, including benzene, 1,3-butadiene, formaldehyde, acetaldehyde, acrolein, naphthalene, and diesel exhaust. Collectively, these may be referred to as traffic related pollutants (“TRPs”).
While each constituent pollutant in engine exhaust may have a unique toxicological profile, health effects have been associated with proximity or exposure to TRPs collectively as a mixture.16 Individual epidemiological studies have linked roadway proximity or vehicle emissions to impairments of lung function.17 There are currently no exposure standards or risk exposure levels specific to TRPs as a mixture.
ODOR EMISSIONS
The only facilities that would potentially be identified as existing sources of odor emissions in the Development Plan Area are the existing wastewater treatment plant located at the northeastern boundary of Treasure Island. The San Francisco Public Utilities Commission (SFPUC) operates this secondary treatment facility, which is approximately one quarter mile from the closest currently occupied residence. According to BAAQMD records, there have been no odor complaints within the last five years.18
CLIMATE EFFECTS ON REGIONAL AIR QUALITY
Atmospheric conditions such as wind speed, wind direction, and air temperature gradients interact with the physical features of the landscape to determine the movement and dispersal of air pollutants regionally. The Project Area lies between the Peninsula and northern Alameda climatological subregions. Marine air travelling through the Golden Gate is a dominant weather factor affecting dispersal of air pollutants within the region. Wind measurements collected on the San Francisco mainland indicate a prevailing wind direction from the west and an average annual wind speed of 10.6 miles per hour.19 Increased temperatures create the conditions in which ozone formation can increase.
16 Delfino RJ, 2002. Epidemiologic evidence for asthma and exposure to air toxics: linkages between
occupational, indoor, and community air pollution research. Environmental Health Perspectives, 110(S4):573-589.
17 Brunekreef, B. et al. “Air pollution from truck traffic and lung function in children living near motorways.” Epidemiology. 1997; 8:298-303.
18 BAAQMD, Response to Public Records Request received via e-mail January 11, 2010. 19 http://www.wrcc.dri.edu/htmlfiles/westwinddir.html#CALIFORNIA, accessed on June 1, 2010.

IV. Environmental Setting and Impacts G. Air Quality
April 21, 2011 IV.G.12 Treasure Island / Yerba Buena Island Case No. 2007.0903E Redevelopment Project Final EIR
SENSITIVE RECEPTORS
Air quality does not affect every individual in the population in the same way, and some groups are more sensitive to adverse health effects than others. Population subgroups sensitive to the health effects of air pollutants include the elderly and the young, population subgroups with higher rates of respiratory disease such as asthma and chronic obstructive pulmonary disease, and populations with other environmental or occupational health exposures (e.g., indoor air quality) that affect cardiovascular or respiratory diseases. Land uses such as schools, children’s day care centers, parks and playgrounds, hospitals, and nursing and convalescent homes are considered to be more sensitive than the general public to poor air quality because the population groups associated with these uses have increased susceptibility to respiratory distress. Persons engaged in strenuous work or exercise also have increased sensitivity to poor air quality. Residential areas are considered more sensitive to air quality conditions compared to commercial and industrial areas because people generally spend longer periods of time at their residences, with associated greater exposure to ambient air quality conditions.20
Motor vehicles are responsible for a large share of air pollution especially in California. Epidemiologic studies have consistently demonstrated that children and adults living in proximity to freeways or busy roadways have poorer health outcomes, including increased asthma symptoms and respiratory infections, and decreased pulmonary function and lung development in children. Vehicles also contribute to particulates by generating road dust and through tire wear.
There are several sensitive receptors currently on Yerba Buena Island and Treasure Island. The nearest residential buildings within the Project Area are the 725 occupiable housing units on Treasure Island, 80 occupiable housing units on Yerba Buena Island and dormitories on the Job Corp site. These residential buildings would constitute a sensitive receptor. The child development center run by Catholic Charities at Avenue D and 11th Street would also constitute a sensitive receptor.
While there is an elementary school building on Treasure Island, it is not currently used by elementary school children, and therefore does not represent an existing sensitive receptor location. Within the Project Area there are several educational programs for older teens and adults. The Glide YouthBuild Program for teens and young adults to learn job skills and get a GED and the San Francisco Sheriff’s Five Keys School for formerly incarcerated women are located within the Treasure Island School building. The Life Learning Academy for at-risk high school youth and the Treasure Island Clubhouse of the Boy’s and Girl’s Clubs are located elsewhere on Treasure Island. Because these programs do not serve school children, they 20 The factors responsible for variation in exposure are also often similar to factors associated with greater
susceptibility to air quality health effects. For example, poorer residents may be more likely to live in crowded substandard housing and be more likely to live near industrial or roadway sources of air pollution.

IV. Environmental Setting and Impacts G. Air Quality
April 21, 2011 IV.G.13 Treasure Island / Yerba Buena Island Case No. 2007.0903E Redevelopment Project Final EIR
are not considered existing sensitive receptors. There are no hospitals or convalescent homes in the vicinity of the Project Area.
REGULATORY FRAMEWORK
Air Quality Regulations and Plans
Federal Ambient Air Quality Standards
The 1970 Clean Air Act (last amended in 1990) required that regional planning and air pollution control agencies prepare a regional air quality plan to outline the measures by which both stationary and mobile sources of pollutants will be controlled in order to achieve all standards by the deadlines specified in the Clean Air Act. These ambient air quality standards are intended to protect the public health and welfare, and they specify the concentration of pollutants (with an adequate margin of safety) to which the public can be exposed without adverse health effects. They are designed to protect those segments of the public most susceptible to respiratory distress, including asthmatics, the very young, the elderly, people weak from other illness or disease, or persons engaged in strenuous work or exercise. Healthy adults can tolerate occasional exposure to air pollution levels that are somewhat above ambient air quality standards before adverse health effects are observed.
The current attainment status for the San Francisco Bay Area Air Basin, with respect to federal standards, is summarized in Table IV.G.2. In general, the Bay Area Air Basin experiences low concentrations of most pollutants when compared to federal standards, except for ozone and particulate matter (PM10 and PM2.5), for which standards are exceeded periodically.
In June 2004, the Bay Area was designated as a marginal nonattainment area of the national 8-hour ozone standard.21 EPA lowered the national 8-hour ozone standard from 0.80 to 0.75 parts per million (“ppm”) effective May 27, 2008. EPA will issue final designations based upon the new 0.75 ppm ozone standard by March 2011.22 The Bay Area Air Basin is in attainment for other criteria pollutants, with the exception of the 24-hour standards for PM10 and PM2.5, for which the Bay Area is designated “Unclassified.” “Unclassified” is defined by the Clean Air Act Amendments as any area that cannot be classified, on the basis of available information, as meeting or not meeting the national primary or secondary ambient air quality standard for the pollutant.
21 “Marginal nonattainment area” means an area designated marginal nonattainment for the one (1) hour
national ambient air quality standard for ozone. 22 U.S. EPA, Fact Sheet for Extension of Deadline for Promulgating Designations for the 2008 Ozone
National Ambient Air Quality Standards, Available at http://www.epa.gov/air/ozonepollution/pdfs/fs20100106des.pdf , accessed on May 28, 2010.

IV. Environmental Setting and Impacts G. Air Quality
April 21, 2011 IV.G.14 Treasure Island / Yerba Buena Island Case No. 2007.0903E Redevelopment Project Final EIR
State Ambient Air Quality Standards
Although the federal Clean Air Act established national ambient air quality standards, individual states retained the option to adopt more stringent standards and to include other pollution sources. California had already established its own air quality standards when federal standards were established, and because of the unique meteorological problems in California, there is considerable diversity between the state and national ambient air quality standards, as shown in Table IV.G.2. California ambient standards tend to be at least as protective as national ambient standards and are often more stringent.
In 1988, California passed the California Clean Air Act (California Health and Safety Code Sections 39600 et seq.), which, like its federal counterpart, called for the designation of areas as attainment or nonattainment, but based on state ambient air quality standards rather than the federal standards. As indicated in Table IV.G.3, the Bay Area Air Basin is designated as “nonattainment” for state ozone, PM10, and PM2.5 standards. The Bay Area Air Basin is designated as “attainment” for most other pollutants listed in the table.
The California Clean Air Act requires that Air Districts in which state air quality standards are exceeded, must prepare a plan that documents reasonable progress towards attainment. A three-year update is required. In the Bay Area, this planning process is incorporated into its Clean Air Plan.
Air Quality Planning Relative to State and Federal Standards
The BAAQMD is the regional agency responsible for air quality regulation within the San Francisco Bay Area Air Basin. The BAAQMD regulates air quality through its planning and review activities. The BAAQMD has permit authority over most types of stationary emission sources and can require stationary sources to obtain permits, and can impose emission limits, set fuel or material specifications, or establish operational limits to reduce air emissions. The BAAQMD regulates new or expanding stationary sources of toxic air contaminants.
In January 2006, the BAAQMD, in cooperation with the Bay Area Metropolitan Transportation Commission (“MTC”) and the Association of Bay Area Governments (“ABAG”) adopted the Bay Area 2005 Ozone Strategy (“2005 Ozone Strategy”). The 2005 Ozone Strategy is a roadmap showing how the San Francisco Bay Area will achieve compliance with the state one-hour ozone standard as expeditiously as practicable, and how the region will reduce transport of ozone and ozone precursors to neighboring air basins. The control strategy includes stationary-source control measures to be implemented through BAAQMD regulations; mobile-source control measures to be implemented through incentive programs and other activities; and transportation control measures to be implemented through transportation programs in cooperation with the MTC, local governments, transit agencies, and others. The 2005 Ozone Strategy also represents

IV. Environmental Setting and Impacts G. Air Quality
April 21, 2011 IV.G.15 Treasure Island / Yerba Buena Island Case No. 2007.0903E Redevelopment Project Final EIR
the Bay Area’s most recent triennial assessment of the region’s strategy to attain the state one-hour ozone standard and is the most recent plan for the region. Currently, the BAAQMD has released its Draft version of the 2010 Clean Air Plan, which is still pending adoption. The 2010 Clean Air Plan will:
• Update the Bay Area 2005 Ozone Strategy in accordance with the requirements of the California Clean Air Act to implement “all feasible measures” to reduce ozone;
• Consider the impacts of ozone control measures on PM10 and PM2.5, TACs, and GHG, in a single, integrated plan;
• Review progress in improving air quality in recent years; and
• Establish emission control measures to be adopted or implemented in the 2009-2012 timeframe.
Toxic Air Contaminants
In 2005, the CARB approved a regulatory measure to reduce emissions of toxic and criteria pollutants by limiting the idling of new heavy-duty diesel vehicles. The regulations generally limit idling of commercial motor vehicles (including buses and trucks) within 100 feet of a school or residential area for more than five consecutive minutes or periods aggregating more than five minutes in any one hour.23 Buses or vehicles also must turn off their engines upon stopping at a school and must not turn their engines on more than 30 seconds before beginning to depart from a school. Also, state law SB351 (adopted in 2003) prohibits locating public schools within 500 feet of a freeway or busy traffic corridor.
SB 636 required the BAAQMD to complete a Particulate Matter Implementation Schedule, which it did in November 2005. This schedule evaluates applicability of the 103 PM control measures on CARB’s list and discusses how the District implements applicable measures. The BAAQMD implements a number of regulations and programs to reduce PM emissions, such as controlling dust from earthmoving and construction/demolition operations, limiting emissions from various combustion sources such as cement kilns and furnaces, and reducing PM from composting and chipping activities. In addition to limiting stationary sources, the BAAQMD implements a variety of mobile source incentive programs to encourage heavy-duty diesel engines and install after-market emissions control devices to reduce particulates and NOx emissions.
23 There are 12 exceptions to this requirement (e.g., emergency situations, military, adverse weather
conditions, etc.), including: when a vehicle’s power takeoff is being used to run pumps, blowers, or other equipment; when a vehicle is stuck in traffic, stopped at a light, or under direction of a police officer; when a vehicle is queuing beyond 100 feet from any restricted area; or when an engine is being tested, serviced, or repaired.

IV. Environmental Setting and Impacts G. Air Quality
April 21, 2011 IV.G.16 Treasure Island / Yerba Buena Island Case No. 2007.0903E Redevelopment Project Final EIR
San Francisco General Plan Air Quality Element
The San Francisco General Plan (“General Plan”) includes the 1997 Air Quality Element.24 The objectives specified by the City include the following:
Objective 1: Adhere to State and federal air quality standards and regional programs.
Objective 2: Reduce mobile sources of air pollution through implementation of the Transportation Element of the General Plan.
Objective 3: Decrease the air quality impacts of development by coordination of land use and transportation decisions.
Objective 5: Minimize particulate matter emissions from road and construction sites.
Objective 6: Link the positive effects of energy conservation and waste management to emission reductions.
San Francisco Construction Dust Control Ordinance
The Dust Control Ordinance was adopted in July 2008 and requires that all site preparation work, demolition, or other construction activities within the City and County of San Francisco comply with specific dust control measures.25 For projects over one-half�acre, the Dust Control Ordinance requires that the project sponsor submit a Dust Control Plan for approval by the San Francisco Health Department prior to issuance of a building permit by Department of Building Inspection (“DBI”). Building permits will not be issued without written notification from the Director of Public Health that the applicant has a site-specific Dust Control Plan, unless the Director waives the requirement. The Dust Control Ordinance requires project sponsors and contractors responsible for construction activities to control construction dust on the site or implement other practices that result in equivalent dust control that are acceptable to the Director of DBI.
Reclaimed water must be used if required by Article 21, Section 1100 et seq. of the San Francisco Public Works Code. This Article requires the use of reclaimed water for soil compaction or dust control activities unless the Director of Public Works determines in writing that either (1) reclaimed water is not available in sufficient quality and quantity from wastewater treatment facilities located within 10 miles of the construction site, or (2) well water or ground water is not available in sufficient quality and quantity from wells and groundwater sources located within 10 miles of the construction site.
If not required, based on the Director of Public Works’ determination, reclaimed water still should be used whenever possible. Contractors are required to provide as much water as
24 San Francisco Planning Department, Air Quality, an Element of the General Plan of the City and
County of San Francisco, July 1997, updated in 2000. 25 City and County of San Francisco Municipal Code, Health Code Article 22b.

IV. Environmental Setting and Impacts G. Air Quality
April 21, 2011 IV.G.17 Treasure Island / Yerba Buena Island Case No. 2007.0903E Redevelopment Project Final EIR
necessary to control dust (without creating run-off in any area of land clearing and/or earth movement). During excavation and dirt-moving activities, contractors are required to wet sweep or vacuum the streets, sidewalks, paths and intersections where work is in progress at the end of the workday. Inactive stockpiles (where no disturbance occurs for more than seven days) greater than 10 cubic yards or 500 square feet of excavated materials, backfill material, import material, gravel, sand, road base, and soil are required to be covered with a 10 millimeter (0.01 inch) polyethylene plastic (or equivalent) tarp, braced down, or use other equivalent soil stabilization techniques.
The Dust Control Ordinance requires that the applicant submit a Dust Control Plan for approval by the San Francisco Health Department. Site-specific Dust Control Plans require the project sponsor to: submit a map to the Director of Public Health showing all sensitive receptors within 1,000 feet of the site; wet down areas of soil at least three times per day; provide an analysis of wind direction and install upwind and downwind particulate dust monitors; record particulate monitoring results; hire an independent, third party to conduct inspections and keep a record of those inspections; establish shut-down conditions based on wind, soil migration, etc.; establish a hotline for surrounding community members who may be potentially affected by project-related dust; limit the area subject to construction activities at any one time; install dust curtains and windbreaks on the property lines, as necessary; limit the amount of soil in hauling trucks to the size of the truck bed and secure with a tarpaulin; enforce a 15 mph speed limit for vehicles entering and exiting construction areas; sweep affected streets with water sweepers at the end of the day; install and utilize wheel washers to clean truck tires; terminate construction activities when winds exceed 25 miles per hour; apply soil stabilizers to inactive areas; and sweep off adjacent streets to reduce particulate emissions. The project applicant would be required to designate an individual to monitor compliance with dust control requirements.
San Francisco Health Code Article 38
PM2.5 is of particular concern to the San Francisco Department of Public Health (“DPH”) because epidemiologic studies have demonstrated that people who live near freeways and high-traffic roadways have poorer health outcomes, including increased asthma symptoms and respiratory infections and decreased pulmonary function and lung development in children. As a result, DPH sponsored local legislation to require air quality modeling and installation of air filtration systems under specified circumstances, now codified as Article 38 of the Health Code. Article 38 requires that proposed residential projects located near high-volume roadways be subject to air quality modeling conducted to determine if annual average concentrations of PM2.5 from roadway sources within 500 feet of a project site would exceed a concentration of

IV. Environmental Setting and Impacts G. Air Quality
April 21, 2011 IV.G.18 Treasure Island / Yerba Buena Island Case No. 2007.0903E Redevelopment Project Final EIR
0.2 micrograms per cubic meter (annual average).26 According to DPH, this action level (of 0.2 micrograms per cubic meter) represents about 8 percent to 10 percent of the range of ambient PM2.5 concentrations in San Francisco based on monitoring data, and is based on epidemiological research that indicates that such a concentration can result in an approximately 0.28 percent increase in non-injury mortality, or an increased mortality at a rate of approximately 20 “excess deaths” per year per one million population in San Francisco.27 28 If this standard is exceeded, Article 38 requires that the project applicant install a filtered air supply system, with high-efficiency filters, to maintain all residential units under positive pressure when windows are closed.
Figure IV.G.1 presents annual average PM2.5 concentrations around the Bay Bridge. As can be seen from this Figure, any residences located within approximately 800 feet of the Bridge would be exposed to PM2.5 concentrations in excess the Article 38 action level of 0.2μg/m3. Therefore, the project sponsors would be required to install a filtered air supply system, with high-efficiency filters, to maintain all new residential units under positive pressure when windows are closed.
IMPACTS
SIGNIFICANCE CRITERIA
The City and County of San Francisco has not formally adopted significance standards for impacts related to air quality. The Planning Department’s Initial Study Checklist provides a framework of topics to be considered in evaluating potential impacts under CEQA. Implementation of a project could have significant impacts related to air quality, if it were to:
• Conflict with or obstruct implementation of the applicable air quality plan;
• Violate any air quality standard or contribute substantially to an existing or projected air quality violation;
26 For purposes of evaluation of potential effects of PM2.5 exposure, DPH also recommends analysis
where there are more than 50,000 daily vehicles within 330 feet (100 meters) of the site, or more than 10,000 daily vehicles within 165 feet (50 meters). These latter two conditions are included to capture equivalent impacts from lesser concentrations of traffic in smaller areas than the ARB-recommended standard of 100,000 daily vehicles within 500 feet (150 meters) (CARB, Air Quality and Land Use Handbook: A Community Health Perspective, 2005).
27 “Excess deaths” (also referred to as premature mortality) refer to deaths that occur sooner than otherwise expected, absent the specific condition under evaluation; in this case, exposure to PM2.5.
28 San Francisco Department of Public Health, Occupational and Environmental Health Section, Program on Health, Equity, and Sustainability, “Assessment and Mitigation of Air Pollutant Health Effects from Intra-urban Roadways: Guidance for Land Use Planning and Environmental Review,” May 6, 2008. Twenty excess deaths per million based on non-injury, non-homicide, non-suicide mortality rate of approximately 714 per 100,000. Although San Francisco’s population is less than one million, the presentation of excess deaths is commonly given as a rate per million population.

SO
UR
CE
: San
Fra
ncis
co D
epar
tmen
t of
Pub
lic H
ealth
IV.G.19

IV. Environmental Setting and Impacts G. Air Quality
April 21, 2011 IV.G.20 Treasure Island / Yerba Buena Island Case No. 2007.0903E Redevelopment Project Final EIR
• Result in a cumulatively considerable net increase of any criteria pollutant for which the project region is in nonattainment under an applicable federal or state ambient air quality standard (including releasing emissions that exceed quantitative thresholds for ozone precursors);
• Expose sensitive receptors to substantial pollutant concentrations; or
• Create objectionable odors affecting a substantial number of people.
Updated BAAQMD Thresholds
The BAAQMD adopted updated CEQA Guidelines29 and Thresholds of Significance30 in June of 2010, which also provide reference points for considering whether a project would have a significant impact. It is the Air District’s policy that the adopted thresholds apply to projects for which a Notice of Preparation (“NOP”) is published, or environmental analysis begins, on or after the applicable effective date. Because both the NOP and environmental analysis for the Proposed Project began prior to June 2, 2010, these new thresholds and associated guidance are not formally applicable to the Proposed Project. Although not formally applicable, this analysis includes as assessment of project impacts with regard to both the newly-adopted 2010 BAAQMD significance thresholds as well as to the formally applicable 1999 BAAQMD significance thresholds. These guidelines, published for assessing impacts relative to these thresholds, are recommended procedures for evaluating potential air quality impacts during the environmental review process. Additionally, the BAAQMD has adopted new risk and hazard exposure thresholds that will not go into affect until January 1, 2011.
Construction Impacts – Applicable 1999 BAAQMD Thresholds
For construction phase-related impacts, the existing 1999 BAAQMD Guidelines do not require quantification of construction emissions, but recommend that significance be based on a consideration of the control measures to be implemented (BAAQMD, 1999). However, in its response to the NOP for the Proposed Project, BAAQMD specifically requested that construction emissions be quantified in the EIR. Therefore, construction impacts are discussed qualitatively with regard to the applicable BAAQMD-recommended BMPs for dust abatement and are also discussed quantitatively with respect to construction-level exhaust thresholds recently adopted by BAAQMD.
29 BAAQMD, CEQA Air Quality Guidelines, May, 2010, Available at
http://www.baaqmd.gov/~/media/Files/Planning%20and%20Research/CEQA/Draft_BAAQMD_CEQA_Guidelines_May_2010_Final.ashx.
30 BAAQMD, CEQA Guidelines Update, Proposed Thresholds of Significance, May 2010, Available at http://www.baaqmd.gov/~/media/Files/Planning%20and%20Research/CEQA/Proposed_Thresholds_Report_%20May_3_2010_Final.ashx

IV. Environmental Setting and Impacts G. Air Quality
April 21, 2011 IV.G.21 Treasure Island / Yerba Buena Island Case No. 2007.0903E Redevelopment Project Final EIR
Construction Impacts – 2010 BAAQMD Thresholds
Under the updated BAAQMD CEQA thresholds, a project would have a significant air quality impact if it would result in average daily construction-related emissions of ROG, NOx, or PM2.5 (non-inclusive of fugitive dust31) of 54 pounds (25 kilograms) average daily emissions or greater. These Thresholds have a separate emission threshold for PM10 (non-inclusive of fugitive dust32) of 82 pounds (37 kilograms) average daily emissions. The thresholds for PM10 and PM2.5 are inclusive only of construction exhaust emissions. BAAQMD guidance regarding construction-related emission of fugitive dust identifies implementation of Best Management Practices as its threshold of significance (Table 2-1). While the Guidelines do not specifically define what constitute Best Management Practices, they do reference them as the “current” approach and, as such, this analysis considers them to consist of BAAQMD’s list of eight Basic Construction Mitigation Measures Recommended for All Proposed Projects.
The updated BAAQMD CEQA thresholds identify that a project would also have a significant air quality impact if construction activities would result in an incremental increase in localized annual average concentrations of PM2.5 exceeding 0.3 micrograms per cubic meter within a 1,000-foot radius from the property line of the construction area or a receptor. These new PM2.5 thresholds are not applicable until January 1, 2011. A project would also have a significant air quality impact if it would expose persons to substantial levels of TACs (including DPM), such that the probability of contracting cancer for the Maximally Exposed Individual (“MEI”)33 exceeds 10 in one million or if it would expose persons to TACs such that a non-cancer Hazard Index of 1.0 would be exceeded.
A project’s construction activities and operations may also result in localized cumulative air quality impact. If proposed construction activities in addition to all other local sources of PM2.5 result in a cumulative concentration of greater than 0.8 micrograms per cubic meter within a 1,000-foot radius from the property line of the construction area or receptor, then project construction activities would be considered to result in a cumulative impact. A project would also have a significant cumulative construction-related air quality impact if construction activities in addition to existing sources with a 1,000 foot radius of the construction area would expose persons to substantial levels of TACs, such that the probability of contracting cancer for the MEI exceeds 100 in one million or if it would result in exposure of persons to TACs such that a non-cancer Hazard Index of 10.0 would be exceeded. These new cumulative exposure thresholds are not applicable until January 1, 2011.
31 Fugitive dust consists of very small liquid and solid particulate matter that is suspended in the air by the
wind and human activities. Fugitive dust originates primarily from the soil. 32 Fugitive dust is PM suspended in the air by the wind and human activities. It originates primarily from
the soil and is not emitted from exhaust pipes, vents, or stacks. 33 The Maximally Exposed Individual is the person with the highest exposure in a given population.

IV. Environmental Setting and Impacts G. Air Quality
April 21, 2011 IV.G.22 Treasure Island / Yerba Buena Island Case No. 2007.0903E Redevelopment Project Final EIR
Project-Level Operational Impacts Applicable 1999 BAAQMD Thresholds
For project-level impact analyses, the 1999 BAAQMD CEQA Thresholds include various thresholds and tests of significance. For ROG, NOx and PM10, a net increase equal to or greater than 15 tons per year or 80 pounds average daily emissions is considered significant. For CO emissions, a project would be considered to have a significant impact if it leads to or contributes to CO concentrations exceeding the State Ambient Air Quality Standards of 9.0 parts per million, 8-hour average and 20.0 parts per million, 1-hour average.
Under the 1999 BAAQMD thresholds, a project would also have a significant air quality impact if it would expose persons to substantial levels of TACs, such that the probability of contracting cancer for the MEI exceeds 10 in one million or if would expose persons to TACs such that a non-cancer Hazard Index of 1.0 would be exceeded. A Hazard Index is a summation of the non-cancer hazard quotients for all chemicals to which an individual is exposed. A Hazard Index value of 1.0 or less than 1.0 indicates that no adverse human health effects (non-cancer) are expected to occur.
Project-Level Operational Impacts 2010 BAAQMD Thresholds
For project-level impact analyses, the updated BAAQMD CEQA Thresholds include various thresholds and tests of significance. For ROG, NOx and PM2.5, a net increase equal to or greater than 10 tons per year or 54 pounds average daily emissions is considered significant, while for PM10 a net increase equal to or greater than 15 tons per year or 82 pounds average daily emissions is considered significant. For CO emissions, a project would be considered to have a significant impact if it leads to or contributes to CO concentrations exceeding the State Ambient Air Quality Standards of 9.0 parts per million, 8-hour average, and/or 20.0 parts per million, 1-hour average.
Under the updated BAAQMD thresholds, a project would also have a significant air quality impact if it would result in an incremental increase in localized annual average concentrations of PM2.5 exceeding 0.3 micrograms per cubic meter from project operations.
Additionally, a project would also have a significant air quality impact if it would expose persons to substantial levels of TACs, such that the probability of contracting cancer for the MEI exceeds 10 in one million or if would expose persons to TACs such that a non-cancer Hazard Index of 1.0 would be exceeded. A Hazard Index is a summation of the non-cancer hazard quotients for all chemicals to which an individual is exposed. A Hazard Index value of 1.0 or less than 1.0 indicates that no adverse human health effects (non-cancer) are expected to occur.

IV. Environmental Setting and Impacts G. Air Quality
April 21, 2011 IV.G.23 Treasure Island / Yerba Buena Island Case No. 2007.0903E Redevelopment Project Final EIR
Cumulative Impacts
Generally, based on updated BAAQMD thresholds, if a project results in an increase in ROG, NOx, PM2.5, or PM10 of more than their respective daily mass thresholds, then it would also be considered to contribute considerably to a significant cumulative effect. Cumulative air quality impacts relative to emissions of PM2.5 and TACs are new concepts contained in BAAQMD’s updated thresholds.
With regard to cumulative impacts from PM2.5, a significant cumulative air quality impact would occur if localized annual average concentrations of PM2.5 would exceed 0.8 micrograms per cubic meter at any receptor from project operations in addition to existing emission sources and cumulative emissions sources within a 1,000-foot radius of the Development Plan Area, based on BAAQMD’s updated thresholds.
With regard to cumulative impacts from TACs, a significant cumulative air quality impact would occur if the probability of contracting cancer for the MEI would exceed 100 in one million or if the Proposed Project would expose persons to TACs such that a non-cancer Hazard Index of 10.0 would be exceeded at any receptor as a result of project operations, in addition to existing emission sources and cumulative emissions sources within a 1,000 foot radius of the project site.
APPROACH TO ANALYSIS
The EIR for the proposed Treasure Island/Yerba Buena Island Area Plan and Special Use District and the Development Program is both a Plan-level and a Project-level analysis. While the 1999 and updated 2010 BAAQMD CEQA Thresholds do include both plan- and project-level thresholds, given the relatively substantial amount of project-specific detail available for the Proposed Project, this analysis applies the BAAQMD’s project-level criteria. Project-related air quality impacts fall into two categories: short-term impacts due to construction, and long-term impacts due to project operation. During project construction, the Proposed Project would affect local particulate concentrations primarily due to fugitive dust sources, as well as construction equipment exhaust. Over the long term, the Proposed Project would result in an increase in emissions primarily due to increased motor vehicle trips, emissions from new ferry boat operations, and new bus operations. On-site stationary sources (such as natural gas boilers for water and space heating) and area sources (such as landscaping and use of consumer products) would result in lesser quantities of pollutant emissions.
Each impact is assessed relative to both the applicable 1999 BAAQMD thresholds of significance as well as the recently adopted 2010 BAAQMD thresholds of significance. For construction dust impacts, BAAQMD does not require quantification of construction dust emissions for projects, but recommends that significance be based on a consideration of the construction dust control measures (1999 Thresholds) or best management practices (“BMPs”) (2010 thresholds to be

IV. Environmental Setting and Impacts G. Air Quality
April 21, 2011 IV.G.24 Treasure Island / Yerba Buena Island Case No. 2007.0903E Redevelopment Project Final EIR
implemented.34 Therefore, construction impacts are discussed qualitatively with regard to the applicable BAAQMD-recommended BMPs for dust abatement and are also discussed quantitatively with respect to construction-level thresholds recently adopted by BAAQMD for exhaust emissions.
Construction and operational emissions of criteria air pollutants were estimated using the URBEMIS 2007 model (version 9.2.4) and compared to BAAQMD significance thresholds. The model combines information on trip generation with vehicular emissions data specific to different types of trips in the San Francisco area (home-to-work, work-other, etc.) from the CARB’s EMFAC 2007 BURDEN model to create an estimated daily emissions burden for travel within the San Francisco Bay Area Air Basin.
Localized CO concentrations near congested intersections are analyzed using BAAQMD’s new screening criteria. The BAAQMD identifies the following screening criteria to evaluate whether a project would result in a less than significant impact to localized CO concentrations: 1) the project is consistent with an applicable congestion management program (“CMP”) established by the county congestion management agency (“CMA”) and with applicable CMPs for designated roads or highways, regional transportation plan or local CMP; and 2) the project traffic would not increase traffic volumes at affected intersections to more than 44,000 vehicles per hour or 24,000 vehicles per hour where atmospheric mixing is limited (e.g., tunnel, parking garage, bridge underpass, natural or urban canyon, below grade roadway). If all the above criteria are met, then the project would be considered to have a less than significant impact to localized CO concentrations. If any one of the above criteria is not met, then modeling of roadside CO concentrations is required to evaluate if state/federal CO ambient air quality standards are exceeded to evaluate significance.
Last, cumulative impacts of the project were evaluated based on the BAAQMD CEQA Guidelines as discussed under the significance thresholds.
PROJECT IMPACTS
Construction Impacts
Impact AQ-1: Construction of the Proposed Project would result in localized construction dust-related air quality impacts. (Less than Significant with Mitigation)
Demolition, grading and new construction activities would temporarily affect local air quality during the project’s proposed 20-year construction schedule, causing temporary increases in particulate dust and other pollutants. Emissions generated from construction activities include 34 Bay Area Air Quality Management District (BAAQMD), BAAQMD CEQA Air Quality Guidelines, June
2010; Table 2.1, p. 2-2. Available on the internet at: http://www.baaqmd.gov/pln/ceqa/index.htm. Accessed June 25, 2010.

IV. Environmental Setting and Impacts G. Air Quality
April 21, 2011 IV.G.25 Treasure Island / Yerba Buena Island Case No. 2007.0903E Redevelopment Project Final EIR
dust (including PM10 and PM2.5)35 primarily from fugitive sources. For project-level fugitive dust emissions from construction, the BAAQMD CEQA Guidelines use the implementation of BMPs as its threshold of significance. Project-related demolition, excavation, compaction, grading and other construction activities may cause wind-blown dust that could disperse particulate matter into the local atmosphere. Although there are federal standards for air pollutants and implementation of state and regional air quality control plans, air pollutants continue to have impacts on human health throughout the country. California has found that particulate matter exposure can cause health effects at lower levels than national standards. The current health burden of particulate matter demands that, where possible, public agencies take feasible available actions to reduce sources of particulate matter exposure. The San Francisco Construction Dust Control Ordinance (Ordinance 176-08, effective July 30, 2008) discussed in the Regulatory Framework would reduce the quantity of dust generated during site preparation, demolition, and construction work in order to protect the health of the general public and of onsite workers, and to minimize public nuisance complaints. The Ordinance requires that all site preparation work, demolition, or other construction activities within San Francisco that have the potential to create dust or to expose or disturb more than 10 cubic yards or 500 square feet of soil comply with specified dust control measures whether or not the activity requires a permit from DBI.
The Ordinance requires that the applicant and the contractor responsible for construction activities use practices to control construction dust on the site or other practices that result in equivalent dust control that are acceptable to the Director of DBI. Dust suppression measures may include watering all active construction areas sufficiently to prevent dust from becoming airborne; increased watering frequency may be necessary whenever wind speeds exceed 15 miles per hour.
The Ordinance requires that the applicant submit a Dust Control Plan for approval by the San Francisco Health Department. The project applicant would also be required to designate an individual to monitor compliance with dust control requirements.
Current and proposed BAAQMD guidance for assessing construction dust impacts state that for a project to have a less-than-significant air quality impact from construction generated dust that BAAQMD-identified dust control measures (1999 Guidelines) or BAAQMD-recommended BMPs for dust abatement (2010 Guidelines) must be implemented. These measures include the following elements:
1. All exposed surfaces shall be watered two times daily.
2. All haul trucks transporting soil, sand, or other loose material off-site shall be covered.
35 Particles that are 10 microns or less in diameter and 2.5 microns or less in diameter, respectively.

IV. Environmental Setting and Impacts G. Air Quality
April 21, 2011 IV.G.26 Treasure Island / Yerba Buena Island Case No. 2007.0903E Redevelopment Project Final EIR
3. All visible mud or dirt tracked-out onto adjacent public roads shall be removed using wet-power vacuum street sweepers at least once per day.
4. All vehicle speeds on unpaved roads shall be limited to 15 mph.
5. All roadways, driveways and sidewalks to be paved shall be completed as soon as possible. Building pads shall be laid as soon as possible after grading unless seeding or soil binders are used.
6. Idling times shall be minimized either by shutting equipment off when not in use or reducing the maximum idling time to 5 minutes. Clear signage shall be provided for construction workers at all access points.
7. All construction equipment shall be maintained and properly tuned in accordance with manufacturers specifications. All equipment shall be checked by a certified mechanic and determined to be running in proper condition prior to operation.
8. Post a publicly visible sign with the telephone number and person to contact at the Lead Agency regarding dust complaints. This person shall respond and take corrective action within 48 hours. The Air District’s phone number shall also be visible to ensure compliance with applicable regulations.
While the regulations and procedures set forth in the Construction Dust Control Ordinance in the San Francisco Health Code contain some of the BAAQMD-recommended BMPs identified above, each is not specifically identified within the ordinance. Therefore, Mitigation Measure M-AQ-1 requires that all eight of the BAAMD recommended BMPs be included in the Project’s Construction Dust Control Plan, to address potentially significant construction dust air quality impacts. Additionally, Mitigation Measure M-AQ-4 would also reduce particulate emissions.
Mitigation Measure M-AQ-1: Implementation of BAAQMD-Identified Basic Construction Mitigation Measures
The following eight BAAQMD-identified construction mitigation measures shall be incorporated into the required Construction Dust Control Plan for the Proposed Project:
1. All exposed surfaces shall be watered two times daily.
2. All haul trucks transporting soil, sand, or other loose material off-site shall be covered.
3. All visible mud or dirt tracked-out onto adjacent public roads shall be removed using wet-power vacuum street sweepers at least once per day.
4. All vehicle speeds on unpaved roads shall be limited to 15 mph.
5. All roadways, driveways and sidewalks to be paved shall be completed as soon as possible. Building pads shall be laid as soon as possible after grading unless seeding or soil binders are used.
6. Idling times shall be minimized either by shutting equipment off when not in use or reducing the maximum idling time to 5 minutes. Clear signage shall be provided for construction workers at all access points.

IV. Environmental Setting and Impacts G. Air Quality
April 21, 2011 IV.G.27 Treasure Island / Yerba Buena Island Case No. 2007.0903E Redevelopment Project Final EIR
7. All construction equipment shall be maintained and properly tuned in accordance with manufacturers specifications. All equipment shall be checked by a certified mechanic and determined to be running in proper condition prior to operation.
8. Post a publicly visible sign with the telephone number and person to contact at the Lead Agency regarding dust complaints. This person shall respond and take corrective action within 48 hours. The Air District’s phone number shall also be visible to ensure compliance with applicable regulations.
The BAAQMD’s May 2010 Thresholds of Significance document states on page 51 “For fugitive dust emissions, staff recommends following the current best management practices approach which has been a pragmatic and effective approach to the control of fugitive dust emissions. Studies have demonstrated (Western Regional Air Partnership, U.S.EPA) that the application of best management practices at construction sites have significantly controlled fugitive dust emissions. These studies support staff’s recommendation that projects implementing construction best management practices will reduce fugitive dust emissions to a less than significant level.” Therefore, by incorporating these mitigation measures into the required Construction Dust Control Plan, project-generated construction dust would be reduced to a less-than-significant level.
Impact AQ-2: Construction of the Proposed Project could violate an air quality standard or contribute significantly to an existing or projected air quality violation. (Less than Significant under Applicable 1999 Guidelines, Significant and Unavoidable with Mitigation under 2010 Guidelines)
Construction within the Development Plan Area is anticipated to occur continuously for approximately 20 years. Construction activities would include site preparation, grading, placement of infrastructure, placement of foundations for structures, and fabrication of structures. Demolition, excavation and construction activities would require the use of heavy trucks, excavating and grading equipment, material loaders, cranes, concrete breakers, and other mobile and stationary construction equipment. Emissions during construction would be caused by materials-handling, traffic on unpaved or unimproved surfaces, demolition of structures, use of paving materials and architectural coatings, exhaust from construction worker vehicle trips, truck trips, and exhaust from construction equipment such as loaders, graders, and cranes.
Criteria pollutant emissions of ROG and NOx from construction equipment would incrementally add to the regional atmospheric loading of ozone precursors during project construction. The 1999 BAAQMD CEQA Guidelines36 recognize that construction equipment emits ozone precursors, but for the purposes of CEQA analyses, the guidelines indicate that such emissions are included in the emissions inventory that is the basis for regional air quality plans. Therefore, the construction equipment emissions would be consistent with emissions inventory estimates and
36 BAAQMD CEQA Guidelines, Assessing the Air Quality Impacts of Projects and Plans, December, 1999,
p. 13, note 3.

IV. Environmental Setting and Impacts G. Air Quality
April 21, 2011 IV.G.28 Treasure Island / Yerba Buena Island Case No. 2007.0903E Redevelopment Project Final EIR
would not be expected to impede attainment or maintenance of ozone standards in the Bay Area. Therefore, under the applicable 1999 BAAQMD CEQA Guidelines, constructions projects would be presumed to have a less than significant impact.
In June 2010, the BAAQMD adopted its Thresholds of Significance document as part of its updated CEQA Guidelines, which indicates a number of modifications to its previous guidelines, including requirements for the quantification of criteria pollutant from construction activities. Applying the new BAAQMD CEQA Guidelines, the estimated average daily project construction emissions are presented in Table IV.G.4.37 These emissions do not include any reductions in emissions that may result from implementation of Mitigation Measure M-AQ-1. Emissions are greatest during the import of fill materials and earth moving activities. Tug operations, construction crew commuting, and fugitive dust sources contribute a lesser percentage of the overall emissions.38
As indicated in Table IV.G.4, construction related mass emissions of PM10 and PM2.5 would not exceed the 2010 BAAQMD thresholds for construction emissions, and therefore, the impact as it relates to those criteria pollutants is less than significant. Construction related emissions of ROG and NOx would exceed the BAAQMD thresholds for construction emissions. Therefore, Mitigation Measure M-AQ-2 is identified to reduce construction exhaust emissions for ROG and NOx.
Given current technologies, Mitigation Measure M-AQ-2 would achieve a maximum NOx and ROG reduction of approximately 50 percent each. It is therefore unlikely that the mitigation measure identified could achieve either a 95 percent reduction in NOx emissions, the level necessary to reduce emissions from these sources to a level below the BAAQMD’s 54 pounds average daily emissions significance threshold, or a 51 percent reduction in ROG emissions, the level necessary to reduce emissions from these sources to a level below the BAAQMD’s significance threshold. Therefore, the potential impacts of the Proposed Project with respect to the BAAQMD CEQA construction thresholds would be significant and unavoidable for NOx and ROG relative to the 2010 BAAQMD Thresholds, even with implementation of Mitigation Measure M-AQ-2.
37 Annual emissions during construction were estimated based on project sponsors’ estimates of
construction activities during each year. The project sponsors’ estimates were based on construction sequencing assumptions for the representative project, given the representative phasing plan. The actual sequencing assumptions may differ, as the Proposed Project’s DDA permits the phasing to be adjusted to differ from the representative analysis set forth in this EIR.
38 Additional information on the assumptions and methodology for the construction emissions inventory is available for public review at the San Francisco Planning Department, 1650 Mission Street, Suite 400, in Case File 2007.0903E.

IV. Environmental Setting and Impacts G. Air Quality
April 21, 2011 IV.G.29 Treasure Island / Yerba Buena Island Case No. 2007.0903E Redevelopment Project Final EIR
Table IV.G.4: Average Daily Construction Emissions of Criteria Air Pollutants
Construction Phase and Year
Estimated Daily Emissions (pounds per day)
ROG NOx CO PM10 PM2.5
2011 55.8 549 238 32.7 23.0 2012 62.9 601 262 34.3 24.4 2013 127 1,147 508 55.9 43.9 2014 104 884 425 41.7 33.7 2015 89.9 788 359 38.1 30.5 2016 116 892 504 42.0 33.8 2017 109 801 501 40.8 31.1 2018 72.4 509 350 28.9 20.4 2019 96.6 633 473 33.7 24.6 2020 97.6 598 508 29.7 22.8 2021 68.2 395 381 21.6 15.5 2022 56.5 308 322 17.7 12.1 2023 53.9 259 329 19.6 11.4 2024 40.2 191 265 16.6 8.7 2025 24.1 109 167 13.4 5.8 2026 1.1 4.7 9.0 0.2 0.2 2027 3.4 11.6 22.4 0.5 0.4 2028 1.1 4.2 9.0 0.2 0.1 2010 BAAQMD Threshold 54 54 NA 82 54 Significant? Yes Yes NA No No
Source: ESA/KB Environmental, 2010
Mitigation Measure M-AQ-2: Construction Exhaust Emissions
TIDA shall require project sponsors to implement combustion emission reduction measures, during construction activities, including the following measures:
• The contractor shall keep all off-road equipment well-tuned and regularly serviced to minimize exhaust emissions, and shall establish a regular and frequent check-up and service/maintenance program for equipment.
• Off-road diesel equipment operators shall be required to shut down their engines rather than idle for more than five minutes, unless such idling is necessary for proper operation of the equipment.39 Clear signage shall be provided for construction workers at all access points.
39 CARB Heavy-Duty Vehicle Idling Emission Reduction Program, http://www.arb.ca.gov/msprog/truck-
idling/factsheet.pdf California Code of Regulations Title 13, Section 2485.

IV. Environmental Setting and Impacts G. Air Quality
April 21, 2011 IV.G.30 Treasure Island / Yerba Buena Island Case No. 2007.0903E Redevelopment Project Final EIR
TIDA shall require that project sponsors also engage in early implementation of the following combustion emission reduction measures during construction activities:
• The project shall utilize EPA Tier 3 engine standards or better at the start of construction for all off-road equipment, or utilize Retrofit Emission Control Devices which consist of diesel oxidation catalysts, diesel particulate filters or similar retrofit equipment control technology verified by the California Air Resources Board (“CARB”) (http://www.arb.ca.gov/diesel/verdev/verdev.htm), to the extent that EPA Tier 3 equipment or similar retrofit equipment control technology is commercially available.
• The project applicant shall utilize EPA Tier 4 engine standards or better for 50 percent of the fleet at construction initiation, increasing to 75 percent by 2015, and 100 percent by 2018, to the extent that EPA Tier 4 equipment is commercially available.
• The project applicant shall utilize 2010 or newer model year haul trucks, to the extent that they are commercially available.
• Diesel-powered generators for construction activity shall be prohibited as a condition of construction contracts for each Major Phase, unless TIDA has made a finding in writing in connection with the Major Phase that there are no other commercially available alternatives to providing localized power.
Given current technologies, conversion of diesel equipment to EPA Tier 3 standards, would achieve a maximum NOx and ROG reduction of approximately 50 percent. Conversion of all diesel equipment to Tier 4 standards would achieve a NOx reduction of 95 percent and a ROG reduction of 85 percent.40 It is therefore unlikely without full implementation of Tier 4 equipment that the mitigation measures identified could achieve a 95 percent reduction in NOx emissions, the level necessary to reduce emissions from these sources to a level below the BAAQMD’s 54 pounds per day significance threshold. A 51 percent reduction in ROG emissions, the level necessary to reduce emissions from these sources to a level below the BAAQMD’s significance threshold would also not quite be attainable. However, Tier 4 equipment is not currently readily available for earthmoving and other activities proposed by the project, so it is not likely that this mitigation measure could be fully implemented in the near-term. With the implementation of all feasible mitigation measures, NOx and ROG emissions from construction would remain a significant and unavoidable impact of project approval (under the 2010 BAAQMD CEQA Guidelines).
40 http://www.dieselnet.com/standards/us/nonroad.php

IV. Environmental Setting and Impacts G. Air Quality
April 21, 2011 IV.G.30a Treasure Island / Yerba Buena Island Case No. 2007.0903E Redevelopment Project Final EIR
Impact AQ-3: Construction of the Proposed Project could expose sensitive receptors to substantial levels of toxic air contaminants which may lead to adverse health effects. (Potentially Significant and Unavoidable for both 1999 and 2010 BAAQMD thresholds in Phase 2)
The only toxic air contaminant that construction of the Proposed Project would generate at potentially substantial levels would be diesel particulate matter (“DPM”). The Proposed Project could increase cancer risk from exposure to DPM emissions associated with off-road construction equipment, on road haul trucks and tug boats used during construction of the Proposed Project. While the exhaust from diesel engines includes hundreds of different gaseous and particulate components, many of which are toxic, these toxic compounds adhere to diesel particles and are

IV. Environmental Setting and Impacts G. Air Quality
April 21, 2011 IV.G.31 Treasure Island / Yerba Buena Island Case No. 2007.0903E Redevelopment Project Final EIR
included in the risk assessment factors for DPM. The BAAQMD’s 1999 and 2010 CEQA significance threshold for individuals exposed to new TAC sources is an increased cancer risk of 10 in one million or greater (the increased incremental cancer risk) per individual source and/or non-cancer risk annualized Hazard Indices greater than or equal to one.
Emissions rates for construction of the Proposed Project were derived from construction emissions described above under Impact AQ-2. To be conservative, it was assumed that all off-road PM2.5 exhaust emissions would be DPM. Construction emissions were modeled as four distinct phases (see Chapter II, Project Description, for a full description of construction phasing assumptions).
The EPA dispersion model AERMOD was used to determine average DPM concentrations at nearby receptors during construction. The following assumptions were used to determine risk at the Maximum Exposed Individual Resident (“MEIR”):41
• Treasure Island Receptors:
- Existing residents in housing located in the northwest corner of Treasure Island would remain occupied through Phases 1, 2, and 3 of construction and would be removed by about prior to Phase 4 construction;
- New residents in buildings on Treasure Island constructed in Phase 2 would be exposed to DPM emissions generated during construction of Phases 2, 3 and 4;
- New residents in buildings on Treasure Island constructed during Phase 3 would be exposed to DPM emissions generated during construction of Phases 3 and 4; and
- New residents in buildings on Treasure Island constructed during Phase 4 would be exposed to DPM emissions generated during construction of Phase 4; and
• Yerba Buena Island Receptors:
- Existing residents of Yerba Buena Island would be relocated to Treasure Island as part of Phase 1 activities, and would therefore be considered in the Treasure Island existing receptor group, above;
- New residents in buildings on Yerba Buena Island constructed during Phase 2 would be exposed to DPM emissions generated during construction of Phases 2, 3, and 4;
- New residents in buildings on Yerba Buena Island constructed during Phase 3 would be exposed to DPM emissions generated during construction of Phases 3 and 4; and
- During Phase 4 no construction would occur on Yerba Buena Island and all residences would be occupied.
All receptors were modeled at a breathing height of 1.8 meters (typical breathing height). Elevations for receptors and sources were derived from the USGS Oakland West and San 41 The MEIR is the residential receptor or other sensitive receptor with the highest modeled risk exposure
and is based on an assumed exposure of 350 days per year. The MEIW is the commercial or industrial locations with the highest modeled risk exposure and is based on an assumed exposure of 245 days per year.

IV. Environmental Setting and Impacts G. Air Quality
April 21, 2011 IV.G.32 Treasure Island / Yerba Buena Island Case No. 2007.0903E Redevelopment Project Final EIR
Francisco North 7.5 minute digital elevation models (“DEMs”) using AERMAP, an accessory program to AERMOD.
Meteorological data from the BAAQMD’s Port of Oakland Station for 1998 through 2000 was used to prepare hourly meteorological data for use in AERMOD. This station was selected as representative of the project site because it more accurately reflects the wind exposures of the open Bay than meteorological stations in the interior of San Francisco. Airport meteorological data is necessary to operate dispersion models because this data contains elements such as upper air cloud cover that are not collected at non-airport metrological stations. Opaque cloud cover data from the San Francisco Airport was used to supplement the Port of Oakland data for use in AERMOD. Upper air data from Oakland International Airport was used to estimate atmospheric mixing heights for the region.
The maximum incremental cancer risk from exposure to DPM was calculated following the guidelines established by California Office of Environmental Health Hazard Assessment42 (“OEHHA”) in conjunction with the BAAQMD’s Health Risk Screening Analysis (“HRSA”) Guidelines.43 The equation used to determine exposure to DPM through inhalation is presented below. Specific equations for each modeled scenario are presented in Appendix E along with supporting documentation.
Dose-inhalation = Cair * {DBR} * A * EF * ED * 10-6 * CRAF AT Where:
Dose-inh = Dose of the toxic substance through inhalation in milligrams per kilogram of body weight per day (“mg/kg-day”)
10-6 = Micrograms to milligrams conversion, Liters to cubic meters conversion
Cair = Concentration in air (μg/m3) {DBR} = Daily breathing rate (L/kg body weight – day) A = Inhalation absorption factor EF = Exposure frequency (days/year) ED = Exposure duration (years) AT = Averaging time period over which exposure is averaged in days
(25,550 days for a 70 year cancer risk) CRAF = Cancer risk adjustment factor (an age sensitivity factor of 1.7
de4rvided by BAAQMD44)
42 Office of Environmental Health Hazards Assessment (“OEHHA”), 2003. The Air Toxics Hot Spots
Program Guidance Manual for Preparation of Health Risk Assessments, available online at: http://www.oehha.org/air/hot_spots/pdf/HRAguidefinal.pdf, August 2003.
43 BAAQMD, Air Toxics NSR Program Health Risk Screening Analysis (“HRSA”) Guidelines, Draft 2009. 44 BAAQMD, Recommended Methods for Screening and Modeling Local Risks and Hazards, May 2010,
Page 80.

IV. Environmental Setting and Impacts G. Air Quality
April 21, 2011 IV.G.33 Treasure Island / Yerba Buena Island Case No. 2007.0903E Redevelopment Project Final EIR
Modeling results were used to determine the annual average concentration of DPM in the air during construction activities. For residential risk, BAAQMD-HRSA recommended 80th percentile adult breathing rate of 302 L/kg-day was used in the equation and the exposure frequency was assumed to be 350 days per year. Exposure duration for Phases 1, 2, and 3 were assumed to be three years, while exposure duration for Phase 4 was assumed to be nine years. The inhalation absorption factor was assumed to be one, i.e., conservatively assuming all pollution is absorbed.
To determine incremental cancer risk, the estimated dose through inhalation was multiplied by the OEHHA established cancer potency slope factor for DPM, which is 1.1 (mg/kg-day)-1.
The non-cancer adverse health risk, both for acute (short-term) and chronic (long-term) exposure, is measured against a hazard index, which is defined as the ratio of the predicted incremental exposure concentration from the Proposed Project emissions to a published reference exposure level (“REL”) that could cause adverse health effects as established by OEHHA. RELs are expressed in units of μg/m3 for inhalation exposure and represent the concentration at or below which no adverse health effects are anticipated following exposure. The ratio (referred to as the Hazard Quotient) of each non-carcinogenic substance that affects a certain organ system is added to produce an overall Hazard Index for that organ system. Overall, Hazard Indices are calculated for each organ system. If the overall Hazard Index for the highest-impacted organ system is greater than one, then the impact is considered to be significant. OEHHA has assigned diesel exhaust a chronic REL of 5.0 μg/m3. This REL represents the level below which exposure to diesel exhaust would not result in adverse health effects to the respiratory system and is compared to the annual average exposure of the MEIR to determine the HI.
Residential Risk
Risk was evaluated for the four sets of residential receptors on Treasure Island and the two sets of residential receptors on Yerba Buena Island described previously to represent those receptors that would remain on the island during construction activities. The analysis for each of these groups follows.
Existing Treasure Island Residential Receptors
Existing residents located on the northwest corner of Treasure Island would be exposed to DPM emissions generated during construction of Phases 1, 2 and 3 of the Proposed Project. The maximum annual average DPM concentration at any receptor within this neighborhood during construction of Phases 1, 2 and 3 would be 0.25μg/m3, 0.35μg/m3, and 0.05μg/m3, respectively. It should be noted that the maximum annual average DPM concentration for each of these phases would occur at a different receptor within this neighborhood; therefore this analysis presents a conservative analytic assumption as it assumes that an individual receptor would be exposed to

IV. Environmental Setting and Impacts G. Air Quality
April 21, 2011 IV.G.34 Treasure Island / Yerba Buena Island Case No. 2007.0903E Redevelopment Project Final EIR
the maximum concentration throughout construction. As shown in Appendix E, incremental cancer risk at the MEIR in this neighborhood from construction of the Proposed Project would be approximately 8.8 in one million. Application of a recently adopted age sensitivity factor derived by BAAQMD to account for exposure to prenatal and very young children increases this predicted risk to 14.9 in one million. This is exceeds the BAAQMD significance threshold of 10 in one million; therefore impacts associated with incremental cancer risk would be significant at existing residential receptors located on Treasure Island.
The overall non-cancer hazard index associated with the DPM exposure at this receptor would be approximately 0.07 (0.35 μg/m3 / 5.0μg/m3). This is well below the BAAQMD recommended threshold of 1.0; therefore, chronic non-cancer health impacts at existing residential receptors would also be less than significant. No mitigation is required.
Phase 2 Treasure Island New Residential Receptors
New residences constructed on Treasure Island during Phase 2 would likely be occupied during construction of Phases 2, 3 and 4 and would therefore be exposed to elevated concentrations of DPM. During construction of Phase 2, the adjacent receptors within the Phase 2 area during Phase 2 development would be exposed to a DPM concentration in excess of 0.36μg/m3. During construction of Phase 3, the maximum exposed receptor in the area developed during Phase 2 would be exposed to a DPM concentration of up to 0.36μg/m3 and would be located at the southeastern portion of this area. During construction of Phase 4, the maximum exposed Phase 2 receptor would be exposed to a DPM concentration of up to 0.12μg/m3 and would be located near the northern end of the Phase 2 Development Plan Area. It should be noted that the maximum annual average DPM concentration would occur at different receptors within this cluster of receptors during Phases 3 and 4. Thus, considering these individual impacts at the same receptor would render this a conservative conservative analysis. As shown in Appendix E, incremental cancer risk at the MEIR would be 9.9 in one million, which is just below the BAAQMD significance threshold of 10 in one million. However, application of a recently adopted age sensitivity factor derived by BAAQMD to account for exposure to prenatal and very young children increases this predicted risk to 16.8 in one million. Additionally, impacts to Phase 2 occupants during Phase 2 construction could be greater than 16.8 and significant, depending on their location relative to the predominant wind direction.
The overall non-cancer hazard index associated with the DPM exposure at this receptor would be approximately 0.072 (0.36 μg/m3 / 5.0μg/m3). This is well below the BAAQMD recommended threshold of 1.0; therefore, chronic non-cancer health impacts at these receptors would also be less than significant. No mitigation is required.

IV. Environmental Setting and Impacts G. Air Quality
April 21, 2011 IV.G.35 Treasure Island / Yerba Buena Island Case No. 2007.0903E Redevelopment Project Final EIR
Phase 3 Treasure Island Residential Receptors
New residences constructed on the east side of Treasure Island during Phase 3 would likely be occupied during construction of Phases 3 and 4 and would therefore be exposed to DPM emissions associated with construction activities. During construction of Phase 4, the maximum exposed resident on the east side of the island would be exposed to an annual average DPM concentration of approximately 0.14μg/m3. As shown in Appendix E, this would result in an incremental cancer risk of 5.7 in one million. Applying application of a recently adopted age sensitivity factor derived by BAAQMD to account for exposure to prenatal and very young children increases this predicted risk to 9.7 in one million. Additionally, impacts to Phase 3 occupants during Phase 3 construction could be greater than the predicted 9.7 in one million, depending on their location relative to the predominant wind direction. Consequently, as a conservative analysis, occupancy of Phase 3 structures during Phase 3 construction is considered a potential significant impact. This would be below the BAAQMD significance threshold of 10 in one million and impacts would be less than significant.
The overall non-cancer hazard index associated with the DPM exposure at this receptor would be approximately 0.028 (0.14 μg/m3 / 5.0μg/m3). This is well below the BAAQMD recommended threshold of 1.0; therefore, chronic non-cancer health impacts at these receptors would also be less than significant. No mitigation is required.
New Yerba Buena Island Residential Receptors
New residences constructed on Yerba Buena Island during Phases 2 and 3 would likely be occupied during construction of Phases 2, 3, and 4. New Yerba Buena Island residents would be exposed to elevated DPM concentrations during construction of Phases 2, 3, and 4. Summing the calculated maximum incremental cancer risk in this neighborhood for Phases 2, 3, and 4 results in a total exposure risk of 5.7 in one million. Application of a recently adopted age sensitivity factor derived by BAAQMD increases this predicted risk to 9.7 in one million. This risk is less than the BAAQMD threshold of 10 in one million; therefore construction DPM cancer impacts would be less than significant for new Yerba Buena Island residential receptors. No mitigation is required.
The overall non-cancer hazard index associated with the DPM exposure at new Yerba Buena Island residential receptors would be approximately 0.074 (0.37 μg/m3 / 5.0μg/m3). This is well below the BAAQMD recommended threshold of 1.0; therefore, chronic non-cancer health impacts at these receptors would also be less than significant. No mitigation is required.
Conclusion
Based upon the representative project phasing analyzed here, the DPM exposure cancer risk levels associated with each group of receptors described above would be significant for most

IV. Environmental Setting and Impacts G. Air Quality
April 21, 2011 IV.G.36 Treasure Island / Yerba Buena Island Case No. 2007.0903E Redevelopment Project Final EIR
phases. Additionally, because of the flexibility in the proposed DDA between TICD and TIDA that allows for different phasing scenarios, it is possible that the actual phasing and location of sensitive receptors could differ from that of the representative project analyzed here, potentially resulting in other significant impacts to sensitive receptors from toxic air contaminants. Implementation of Mitigation Measure M-AQ-3 would reduce the impact; however, because elements of this Mitigation Measure would only be implemented to the extent feasible, it cannot be concluded with certainty that the mitigation measure would reduce the impacts to a less than significant level. Therefore, even with mitigation, the impact is found to be potentially significant and unavoidable.
Mitigation Measure M-AQ-3
At the submission of any Major Phase application, TIDA shall require that an Air Quality consultant review the proposed development in that Major Phase along with existing uses and uses approved in prior Major Phases to determine whether the actual project phasing deviates materially from the representative phasing plan. If the Air Quality consultant determines the possible impact of the actual phasing could result in a significant impact on any group of receptors, then TIDA shall require that the applicant implement in connection with that Major Phase best management practices to the extent that TIDA determines feasible to reduce construction emissions in accordance with Mitigation Measures M-AQ-1, M-AQ-2, and M-AQ-4.
TIDA shall also determine whether Tier 3 or Tier 4 engines, non-diesel powered generators, or year 2010 or newer haul trucks are commercially available for that phase and, if so, require the use of such engines or haul trucks.
However, because Mitigation Measures M-AQ-2 and M-AQ-4 would only be implemented to the extent that TIDA determines such measures are feasible, it is possible that if a material change in phasing were to occur that even with imposition of these mitigation measures, the impact to one or more sensitive receptors could be significant and unavoidable.
Impact AQ-4: Construction of the Proposed Project would expose sensitive receptors to substantial levels of PM2.5 which may lead to adverse health effects. (Not Applicable to 1999 BAAQMD Thresholds, Significant and Unavoidable with Mitigation for 2010 BAAQMD Thresholds)
The 1999 BAAQMD thresholds did not identify a concentration-based exposure threshold for PM2.5. Therefore this impact is not applicable to assessment relative to the 1999 BAAQMD thresholds.

IV. Environmental Setting and Impacts G. Air Quality
April 21, 2011 IV.G.36a Treasure Island / Yerba Buena Island Case No. 2007.0903E Redevelopment Project Final EIR
Concentrations of PM2.5 generated by earth movement, off-road construction equipment, on-road haul trucks and tug boats used to transport barges for construction of the Proposed Project were evaluated similarly to DPM concentrations described under Impact AQ-3. However, given that the PM2.5 threshold of 0.3μg/m3 is an annualized threshold, as opposed to cancer risk based on lifetime exposure, annual average concentrations were also estimated for the worst case year at sensitive receptor locations discussed in Impact AQ-3. Furthermore, in addition to exhaust

IV. Environmental Setting and Impacts G. Air Quality
April 21, 2011 IV.G.37 Treasure Island / Yerba Buena Island Case No. 2007.0903E Redevelopment Project Final EIR
emissions, fugitive dust emissions were also included in the dispersion model to determine total PM2.5 concentrations at nearby receptors in that analysis.
Modeling results estimated that maximum annual PM2.5 concentrations from construction activities would be as high as 0.84μg/m3 at the closest receptor. This is above the BAAQMD threshold of 0.3μg/m3 that will become effective for projects that submit a Notice of Preparation after January 1, 2011. Consequently, although project construction exhaust emissions of PM2.5 are less than significant on a regional basis (Impact AQ-2) localized PM2.5 concentrations that consider both fugitive dust and emissions would be significant. These estimates assume that fugitive dust control measures specified in Mitigation Measure M-AQ-1 would already be implemented. Mitigation Measure M-AQ-4 below would implement additional mitigation measures recommended by BAAQMD for projects with construction emissions above thresholds.
Mitigation Measure M-AQ-4: Implement Additional Construction Mitigation Measures Recommended for Projects with Construction Emissions Above Thresholds
TIDA shall require the project sponsors to implement all of the following mitigation measures identified by BAAQMD, to the extent feasible, for projects that exceed construction thresholds that would be applicable to reducing PM2.5 emissions. Although there may be some overlap, these mitigation measures are identified by BAAQMD as additional to those identified in Mitigation Measure AQ-1 which BAAQMD identifies as recommended for all projects regardless of whether thresholds are exceeded:
1. All exposed surfaces shall be watered at a frequency adequate to maintain minimum soil moisture of 12 percent. Moisture content can be verified by lab samples or moisture probe.
2. All excavation, grading, and/or demolition activities shall be suspended when average wind speeds exceed 20 mph.
3. Wind breaks (e.g., trees, fences) shall be installed on the windward side(s) of actively disturbed areas of construction. Wind breaks should have at maximum 50 percent air porosity.
4. Vegetative ground cover (e.g., fast-germinating native grass seed) shall be planted in disturbed areas as soon as possible and watered appropriately until vegetation is established.
5. The simultaneous occurrence of excavation, grading, and ground-disturbing construction activities on the same area at any one time shall be limited.
6. Activities shall be phased to reduce the amount of disturbed surfaces at any one time.
7. All trucks and equipment, including their tires, shall be washed off prior to leaving the site.
8. Site accesses to a distance of 100 feet from the paved road shall be treated with a 6 to 12 inch compacted layer of wood chips, mulch, or gravel.

IV. Environmental Setting and Impacts G. Air Quality
April 21, 2011 IV.G.38 Treasure Island / Yerba Buena Island Case No. 2007.0903E Redevelopment Project Final EIR
9. Sandbags or other erosion control measures shall be installed to prevent silt runoff to public roadways from sites with a slope greater than one percent.
10. Minimizing the idling time of diesel-powered construction equipment to two minutes.
11. Same as Mitigation Measure AQ-2.
12. Requiring that all construction equipment, diesel trucks, and generators be equipped with Best Available Control Technology for emission reductions of NOx and PM.
13. Requiring all contractors use equipment that meets CARB’s most recent certification standard for off-road heavy duty diesel engines.
All 13 components of this mitigation measure may or may not be feasible, and thus cannot be assumed to be implemented. Even if all 13 components were implemented, the mitigation would be unlikely to achieve a 65 percent reduction in PM2.5 emissions and resultant concentrations, the level necessary to reduce emissions from these sources to a level below the BAAQMD’s 0.3 microgram per cubic meter significance threshold. Therefore, even with the implementation of all feasible (BAAQMD-identified) mitigation measures, PM2.5 concentrations would remain a significant and unavoidable impact.
Operational Impacts
Impact AQ-5: The Proposed Project’s operations would violate an air quality standard or contribute substantially to an existing or projected air quality violation. (Significant and Unavoidable with Mitigation for both 1999 and 2010 BAAQMD thresholds)
The Proposed Project consists of high-density, compact residential and commercial development located within walking distance of a Transit Hub to maximize walking bicycling, and use of public transportation, and to minimize the use and impacts of private automobiles.
As discussed in Chapter II, Project Description, and the Section IV.E, Transportation, the Proposed Project would include numerous elements that would reduce motor vehicle trips compared to a similar project without trip reduction elements (termed a “business as usual” or BAU project). Specifically the impact analysis considers both the Proposed Project’s base transit scenario and Expanded Transit Service, which is the Proposed Project with implementation of Mitigation Measure M-TR-2, as discussed in Section IV.E Transportation. The Proposed Project would include the following trip-reduction elements:
• Ferry service every 50 minutes (corresponding to a single ferry operating at one of the existing docks in San Francisco);
• AC Transit bus service to downtown Oakland with service every 10 minutes;
• Continued SF Muni line 108 – Treasure Island bus service to Treasure Island with no on-island circulation; and
• On-island fleet shuttle service using alternative-fueled shuttle buses.

IV. Environmental Setting and Impacts G. Air Quality
April 21, 2011 IV.G.39 Treasure Island / Yerba Buena Island Case No. 2007.0903E Redevelopment Project Final EIR
Expanded Transit Service would include the same elements as the Proposed Project’s transit scenario, plus the following additions:
• New ferry service to San Francisco every 15 minutes during peak hours (corresponding to three ferries operating at one of the existing docks in San Francisco);
• Modification of the existing SF Muni line 108 – Treasure Island bus service to increase peak hour frequency from every 15 minutes to every 7 minutes in the AM peak hour and every 5 minutes in the PM peak hour. Additionally, existing buses would be replaced with larger capacity buses; and
• New SF Muni bus service to the San Francisco Civic Center area.
Operational emissions for vehicle trips and some area sources were calculated using the URBEMIS2007 computer model. Trip generation rates of the model were adjusted to reflect the project-specific vehicle trip generation of the Transportation Impact Study (Fehr & Peers, 2009). The model default vehicle trip lengths specific to urban areas of the San Francisco Bay Area Air Basin were adjusted to account for the fact that a majority of the vehicle trips would be destined for off-islands locations. Consequently these trips would necessitate an additional 1.7 miles or 3.2 miles if traveling toward San Francisco or Oakland, respectively. Using a trip distribution ratio of 79 percent toward San Francisco and 21 percent toward Oakland from the Transportation Impact Study included as Appendix C of this EIR, a composite average trip length addition factor of 2.0 miles was assumed for each trip type.
Bus-related emissions were calculated separately not using URBEMIS2007 because the specific number of bus trips and distances were known and are separate from standard vehicle trip assumptions. Bus emissions were estimated using emission factors for diesel buses generated by the EMFAC2007 model of CARB, daily vehicle bus trip generation provided by Fehr & Peers, and trip lengths estimated based on destinations. For proposed new AC Transit service bus trip lengths of 8.3 miles to Downtown Oakland were assumed. Additions to SF Muni bus service under Expanded Transit Service assumed trip lengths from Treasure Island to the Transbay Terminal (3.6 miles) for additions to the existing SF Muni line 108 – Treasure Island line, and to the Civic Center area of San Francisco (5.3 miles) as a new service line (consistent with the Transportation Study).
Emissions from the proposed new ferry service were estimated using data provided by Elliot Bay Design Group specific to the types of ferries under consideration for the Proposed Project.45 These emissions estimates examined three different engine and generator configurations. The worst case configuration was assumed for each pollutant analyzed. The daily profile assumed 15 round trips, 8 percent at commute speed, 10 percent at maneuvering speed, 15 percent at
45 Elliot Bay Design Group, Memorandum to Wilson Meany Sullivan, August 15, 2009. A copy of this
document is available for public review at the San Francisco Planning Department, 1650 Mission Street, Suite 400, in Case File No. 2007.0903E.

IV. Environmental Setting and Impacts G. Air Quality
April 21, 2011 IV.G.40 Treasure Island / Yerba Buena Island Case No. 2007.0903E Redevelopment Project Final EIR
commute speed and a 25 percent at dock during the day. Ferries were assumed to use shore power during non-operational idle time at the dock during off-service nighttime hours. Data provided by Elliott Bay included only bulk particulate matter emissions, not speciation of PM10 and PM2.5, and did not include estimates of ROG emissions. To determine emissions of PM10, PM2.5 and ROG, data ratios from CARB’s 2008 statewide emission inventory for commercial harbor craft were used to scale PM10 and PM2.5 emissions from bulk PM emissions. Similarly, ROG emissions were scaled from statewide NOx emissions for harbor craft.
The Proposed Project would result in a net increase of 30,330 standard vehicle trips per day over existing conditions. New transit trips under the Proposed Project include 120 daily one-way diesel bus trips (AC Transit to/from Oakland only),46 120 daily alternative fuel (assumed to be compressed natural gas based on its ubiquity as an alternative bus fuel) on-island shuttle trips and operation of a single ferry for 15 daily round trips.
Expanded Transit Service would result in a net increase of 25,466 standard vehicle trips per day over existing conditions. Transit trips under Expanded Transit Service include 334 new daily diesel bus trips47 (AC Transit and SF Muni), 120 daily alternative fuel (assumed to be compressed natural gas) on-island shuttle trips and operation of three ferries for 45 daily round trips.
The BAU scenario of the Proposed Project would result in a net increase of 66,304 standard vehicle trips per day over existing conditions. However, ferry emissions and increased transit emissions are presumed to not occur under a BAU scenario.
All scenarios account for area sources that consist of landscape maintenance equipment exhaust, use of consumer products that emit ROGs, and maintenance application of architectural coatings, all of which were calculated using URBEMIS default values for each land use type. Emissions from on-site natural gas combustion were calculated using project-specific natural gas demand data from the Development Energy Study48 and emission factors from URBEMIS 2007.
As shown in Table IV.G.5, the Proposed Project would result in an increase in criteria pollutant emissions that would be considered significant under both 1999 and 2010 BAAQMD thresholds.
46 AC Transit currently has three hydrogen fuel cell buses as part of a demonstration project and 12 more
will be in service in 2010. These 15 AC Transit zero-emission busses represent approximately two percent of its current fleet of 674 buses. Consequently, as a conservative analysis, emissions from new bus service under the Proposed Project are assumed to be entirely diesel.
47 Although San Francisco uses electricity to power its electric buses and trolleys, these vehicles do not and would not serve the Islands. While approximately 17 percent of the SFMTA non-electric bus fleet consist of hybrid buses that reduce fuel usage by 25 percent, as a conservative assumption, all new SFMTA bus trips were assumed to be diesel.
48 ARUP, TICD Treasure Island Development Energy Study Final, December, 2009. A copy of this document is available for public review at the San Francisco Planning Department, 1650 Mission Street, Suite 400, in Case File No. 2007.0903E.
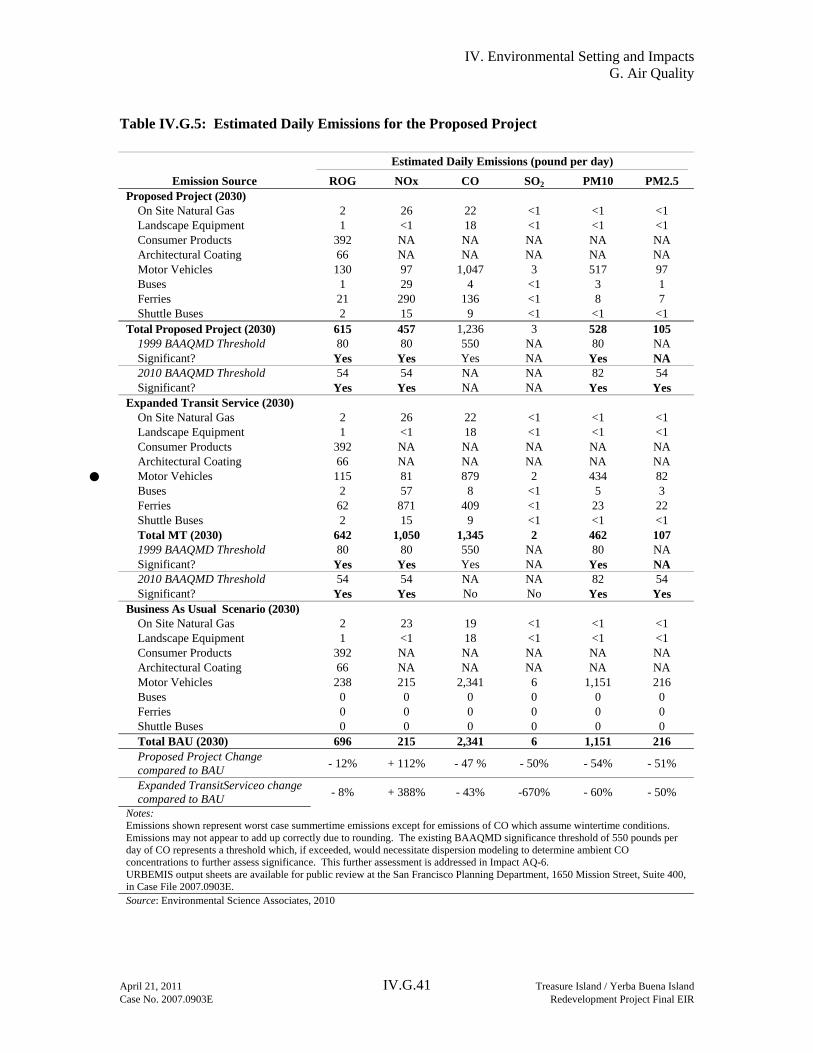
IV. Environmental Setting and Impacts G. Air Quality
April 21, 2011 IV.G.41 Treasure Island / Yerba Buena Island Case No. 2007.0903E Redevelopment Project Final EIR
Table IV.G.5: Estimated Daily Emissions for the Proposed Project
Emission Source
Estimated Daily Emissions (pound per day)
ROG NOx CO SO2 PM10 PM2.5 Proposed Project (2030)
On Site Natural Gas 2 26 22 <1 <1 <1 Landscape Equipment 1 <1 18 <1 <1 <1 Consumer Products 392 NA NA NA NA NA Architectural Coating 66 NA NA NA NA NA Motor Vehicles 130 97 1,047 3 517 97 Buses 1 29 4 <1 3 1 Ferries 21 290 136 <1 8 7 Shuttle Buses 2 15 9 <1 <1 <1
Total Proposed Project (2030) 615 457 1,236 3 528 105 1999 BAAQMD Threshold 80 80 550 NA 80 NA Significant? Yes Yes Yes NA Yes NA 2010 BAAQMD Threshold 54 54 NA NA 82 54 Significant? Yes Yes NA NA Yes Yes
Expanded Transit Service (2030) On Site Natural Gas 2 26 22 <1 <1 <1 Landscape Equipment 1 <1 18 <1 <1 <1 Consumer Products 392 NA NA NA NA NA Architectural Coating 66 NA NA NA NA NA Motor Vehicles 115 81 879 2 434 82 Buses 2 57 8 <1 5 3 Ferries 62 871 409 <1 23 22 Shuttle Buses 2 15 9 <1 <1 <1 Total MT (2030) 642 1,050 1,345 2 462 107 1999 BAAQMD Threshold 80 80 550 NA 80 NA Significant? Yes Yes Yes NA Yes NA2010 BAAQMD Threshold 54 54 NA NA 82 54 Significant? Yes Yes No No Yes Yes
Business As Usual Scenario (2030) On Site Natural Gas 2 23 19 <1 <1 <1 Landscape Equipment 1 <1 18 <1 <1 <1 Consumer Products 392 NA NA NA NA NA Architectural Coating 66 NA NA NA NA NA Motor Vehicles 238 215 2,341 6 1,151 216 Buses 0 0 0 0 0 0 Ferries 0 0 0 0 0 0 Shuttle Buses 0 0 0 0 0 0 Total BAU (2030) 696 215 2,341 6 1,151 216 Proposed Project Change compared to BAU - 12% + 112% - 47 % - 50% - 54% - 51%
Expanded TransitServiceo change compared to BAU - 8% + 388% - 43% -670% - 60% - 50%
Notes: Emissions shown represent worst case summertime emissions except for emissions of CO which assume wintertime conditions. Emissions may not appear to add up correctly due to rounding. The existing BAAQMD significance threshold of 550 pounds per day of CO represents a threshold which, if exceeded, would necessitate dispersion modeling to determine ambient CO concentrations to further assess significance. This further assessment is addressed in Impact AQ-6. URBEMIS output sheets are available for public review at the San Francisco Planning Department, 1650 Mission Street, Suite 400, in Case File 2007.0903E. Source: Environmental Science Associates, 2010

IV. Environmental Setting and Impacts G. Air Quality
April 21, 2011 IV.G.42 Treasure Island / Yerba Buena Island Case No. 2007.0903E Redevelopment Project Final EIR
Both the Proposed Project and Expanded Transit Service would substantially reduce emissions of CO, SO2, PM10 and PM2.5 compared to the BAU scenario. However, because ferries proposed under the Proposed Project and Expanded Transit Service would operate on diesel fuel, emissions of NOx under these two scenarios would substantially increase when compared to the BAU scenario.
Emissions from Proposed Project operations would exceed 1999 BAAQMD thresholds for ROG, NOx, and PM10 and 2010 BAAQMD thresholds for ROG, NOx, PM10, and PM2.5. While NOx emissions can be reduced by up to 85 percent by use of selective catalytic reduction technology, this technology is not feasible because the relatively short ferry trips that would be generated would not allow for adequate engine temperatures to be maintained for catalysis to occur.49 Therefore no feasible mitigation has been identified for NOx emissions. An additional mitigation measure is identified to reduce PM10 and PM2.5 impacts from the ferries.
Mitigation Measure M-AQ-5: Ferry Particulate Emissions
All ferries providing service between Treasure Island and San Francisco shall meet applicable California Air Resources Board regulations. Additionally, all ferries shall be equipped with diesel particulate filters or an alternative equivalent technology to reduce diesel particulate emissions. If diesel particulate filters are operated at the proper temperatures, they are reported to achieve up to 85 percent reduction in particulate emissions. However, because the Water Emergency Transit Authority would operate the ferry service, implementation of this measure is outside the jurisdiction of the City and is not assured.
The Proposed Project already includes substantial Transportation Demand Measures. Public transit improvements and further measures to reduce motor vehicle emissions, which alone would be significant, are not available. ROG emissions would result primarily from use of consumer products and architectural coating applications by future residents (non-construction) which could not feasibly be mitigated. Consequently, regional emissions of ROG, NOx and PM10 would be significant and unavoidable under the applicable 1999 BAAQMD Guideline thresholds. Additionally, emissions of PM2.5 would be significant and unavoidable under the 2010 BAAQMD thresholds.
Impact AQ-6: Operation of the Proposed Project could expose sensitive receptors to substantial pollutant concentrations. (Significant and Unavoidable with Mitigation for both 1999 and 2010 BAAQMD thresholds)
49 Waterhouse, John, Elliot Bay Design Group, meeting notes from telephone conference January 14, 2010.

IV. Environmental Setting and Impacts G. Air Quality
April 21, 2011 IV.G.43 Treasure Island / Yerba Buena Island Case No. 2007.0903E Redevelopment Project Final EIR
Carbon Monoxide
Significance of localized CO emissions from mobile sources is determined by modeling the ambient CO concentration under project and future cumulative conditions, and comparing the resulting one-hour and eight-hour concentrations to the respective state and federal CO standards.
This comparison is presented in Table IV.G.6. The analysis indicates that the state and federal 1-hour and 8-hour standards for CO would not be violated at study intersections during worst-case atmospheric conditions (wintertime conditions when CO concentrations are typically greatest). Moreover, CO concentrations will decrease in the future due to attrition of older, high polluting vehicles, improvements in the overall automobile fleet, and improved fuel mixtures (as a result of ongoing state and federal emissions standards and programs for on-road motor vehicles). Therefore, the Proposed Project would have a less-than-significant impact on local CO concentrations.
Diesel Particulate Matter Emitted by the Proposed Project
The Proposed Project could increase cancer risk from exposure to DPM emissions associated with bus and ferry trips generated by the project operations as well as existing emissions from the Bay Bridge. There are no new point sources of DPM in the Proposed Project but there is one existing point source that could impact new residences of the Proposed Project. The BAAQMD has both a 1999 and a 2010 CEQA significance threshold for individuals exposed to new TAC sources of 10 in one million or greater (the increased incremental cancer risk) per individual source and/or non-cancer risk hazard indices greater than or equal to one.
Vehicle emission rates have been substantially reduced in recent years due to increasingly stringent emissions standards. Therefore, total emissions generated by buses traveling to and from Treasure Island would vary substantially depending on the year in which the engine was manufactured. In response to these varying emission rates, CARB has developed an emissions inventory model commonly referred to as EMFAC2007. When estimating emissions for future years, EMFAC2007 assumes a mix of model years, and it assumes that a certain fraction of vehicles are older models that are not subject to the newest regulations. EMFAC2007 also allows the user to edit model years included in the vehicle fleet mix, thereby adjusting emission rates to reflect specific model years selected. Bus emission rates used to estimate DPM ambient air concentrations associated with the Proposed Project are described in more detail below. For the purpose of this analysis it was assumed that buses traveling to and from the site would be diesel-fueled.
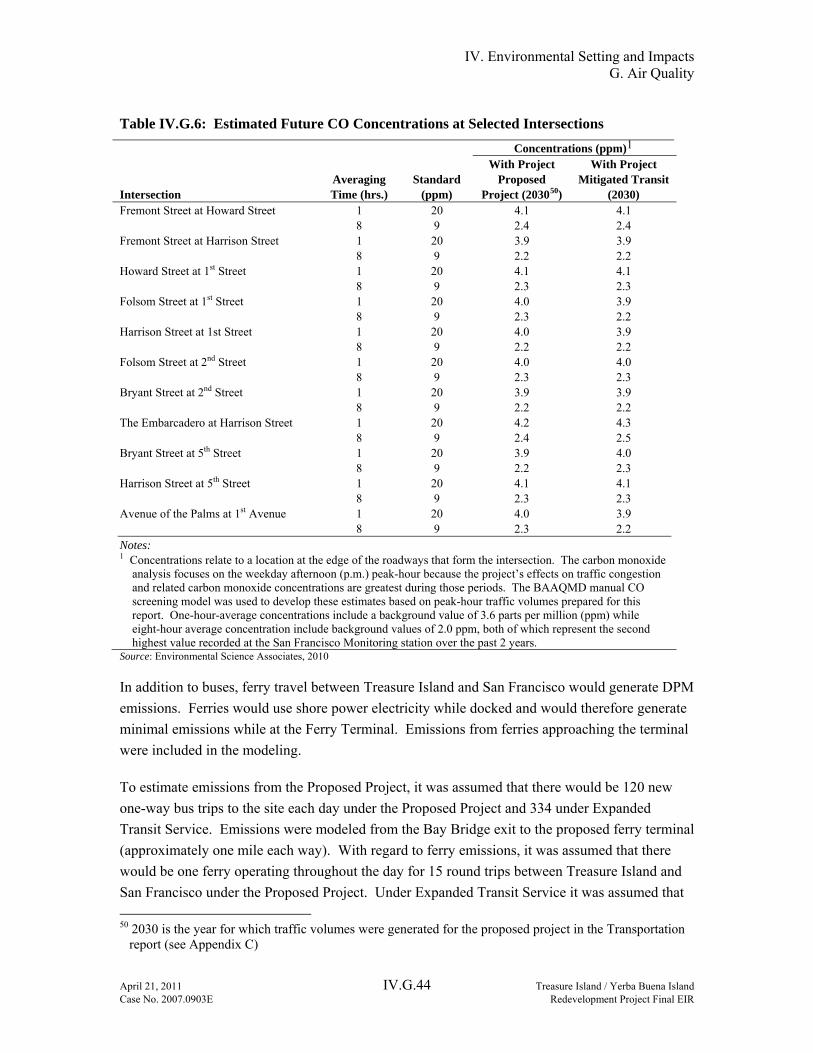
IV. Environmental Setting and Impacts G. Air Quality
April 21, 2011 IV.G.44 Treasure Island / Yerba Buena Island Case No. 2007.0903E Redevelopment Project Final EIR
Table IV.G.6: Estimated Future CO Concentrations at Selected Intersections Concentrations (ppm)1
Intersection
Averaging Time (hrs.)
Standard (ppm)
With Project Proposed
Project (203050)
With Project Mitigated Transit
(2030) Fremont Street at Howard Street 1 20 4.1 4.1 8 9 2.4 2.4 Fremont Street at Harrison Street 1 20 3.9 3.9 8 9 2.2 2.2 Howard Street at 1st Street 1 20 4.1 4.1 8 9 2.3 2.3 Folsom Street at 1st Street 1 20 4.0 3.9 8 9 2.3 2.2 Harrison Street at 1st Street 1 20 4.0 3.9 8 9 2.2 2.2 Folsom Street at 2nd Street 1 20 4.0 4.0 8 9 2.3 2.3 Bryant Street at 2nd Street 1 20 3.9 3.9 8 9 2.2 2.2 The Embarcadero at Harrison Street 1 20 4.2 4.3 8 9 2.4 2.5 Bryant Street at 5th Street 1 20 3.9 4.0 8 9 2.2 2.3 Harrison Street at 5th Street 1 20 4.1 4.1 8 9 2.3 2.3 Avenue of the Palms at 1st Avenue 1 20 4.0 3.9 8 9 2.3 2.2 Notes: 1 Concentrations relate to a location at the edge of the roadways that form the intersection. The carbon monoxide
analysis focuses on the weekday afternoon (p.m.) peak-hour because the project’s effects on traffic congestion and related carbon monoxide concentrations are greatest during those periods. The BAAQMD manual CO screening model was used to develop these estimates based on peak-hour traffic volumes prepared for this report. One-hour-average concentrations include a background value of 3.6 parts per million (ppm) while eight-hour average concentration include background values of 2.0 ppm, both of which represent the second highest value recorded at the San Francisco Monitoring station over the past 2 years.
Source: Environmental Science Associates, 2010
In addition to buses, ferry travel between Treasure Island and San Francisco would generate DPM emissions. Ferries would use shore power electricity while docked and would therefore generate minimal emissions while at the Ferry Terminal. Emissions from ferries approaching the terminal were included in the modeling.
To estimate emissions from the Proposed Project, it was assumed that there would be 120 new one-way bus trips to the site each day under the Proposed Project and 334 under Expanded Transit Service. Emissions were modeled from the Bay Bridge exit to the proposed ferry terminal (approximately one mile each way). With regard to ferry emissions, it was assumed that there would be one ferry operating throughout the day for 15 round trips between Treasure Island and San Francisco under the Proposed Project. Under Expanded Transit Service it was assumed that 50 2030 is the year for which traffic volumes were generated for the proposed project in the Transportation
report (see Appendix C)
IV. Environmental Setting and Impacts G. Air Quality
April 21, 2011 IV.G.45 Treasure Island / Yerba Buena Island Case No. 2007.0903E Redevelopment Project Final EIR
there would be three ferries for 45 daily round trips. Emissions from ferries were modeled from the proposed Ferry Terminal to a point approximately 500 meters southwest of the terminal.
Total mobile DPM emissions from buses along the modeled segment of roadway would be approximately 20 grams per day (“g/day”) under the funded transit option and approximately 54 g/day under the enhanced transit option. Emissions from ferries along the modeled 500 meter segment would be approximately 553 g/day for the funded transit option and approximately 1,659 g/day under the enhanced transit option.
Receptors were modeled on both Yerba Buena Island and Treasure Island. To be conservative, it was assumed that all receptors would be residents. All receptors were modeled at a breathing height of 1.8 meters (typical breathing height).
As with construction modeling of DPM concentrations, meteorological data from the BAAQMD’s Port of Oakland station were used with supplemental opaque cloud cover data from San Francisco International Airport to prepare hourly surface meteorological files for use in AERMOD. Upper air data from Oakland Airport was used to estimate atmospheric mixing heights for the region.
Source and receptor elevations were derived from the San Francisco North and Oakland West 7.5 minute digital elevation models. These elevations were processed and imported using AERMAP, an accessory program to AERMOD. To account for the turbulence induced by moving buses, the bus emissions were modeled as volume sources with a release height of three meters. Ferries were also modeled as volume sources, however the release height for ferry emissions was assumed to be approximately nine meters (~30 feet).
Modeling results from the Proposed Project under the funded transit option demonstrated a maximum annual average DPM concentration of 0.047 μg/m3 at the maximum exposed resident. Of this, approximately 87 percent (or 0.041μg/m3 of DPM) can be attributed to ferry operations with the remaining percentage resulting from bus emissions.
Under Expanded Transit Service, the maximum annual average DPM concentration was calculated to be approximately 0.14μg/m3 at the maximum exposed resident. Of this, nearly 89 percent (or 0.124μg/m3) of DPM can be attributed to ferry operations, with the remaining percentage resulting from bus emissions.
The maximum incremental cancer risk and chronic non-cancer hazard indices from exposure to DPM was calculated following the guidelines established by OEHHA (see discussion under Impact AQ-3 for a full description of methods used).

IV. Environmental Setting and Impacts G. Air Quality
April 21, 2011 IV.G.46 Treasure Island / Yerba Buena Island Case No. 2007.0903E Redevelopment Project Final EIR
Proposed Project Transit Scenario
As shown in the equation below, the maximum incremental residential cancer risk from the Proposed Project operations would be 15.0 in one million. Equations for other scenarios as well as supporting calculation sheets are provided in Appendix E. This predicted risk would be greater than the BAAQMD recommended significance threshold of 10 in one million and impacts would be significant.
Dose-inh = 0.047 μg/m3 * 350 days/year * 70 years * 302 L/kg-day * 1 *10-6 (25,550 days)
= 13.6 * 10-6 Cancer Risk = 13.6 * 10-6 mg/kg-day * 1.1 (mg/kg-day)-1 * Age Adjustment Factor 1.7 = 25.5 * 10-6 ~ 25.5 in one million
As discussed previously, approximately 87 percent of the maximum DPM concentration under the Proposed Project’s transit scenario would be attributed to ferry emissions. Given that risk is directly proportional to concentration, it can be assumed that 87 percent of risk (about 22.2 in one million) can be attributed to ferry emissions. Implementation of Mitigation Measure M-AQ-5 would reduce DPM emissions from ferries by up to 85 percent by requiring ferries to be equipped with particulate traps or similarly capable technology which would result in a 85 percent reduction in risk from ferries. Therefore, with implementation of this measure, risk from ferries would be approximately 3.3 in one million. When added to risk from buses, total risk under the Proposed Project after mitigation would be approximately 6.6 in one million; therefore impacts would be less than significant with mitigation.
The overall hazard index associated with the DPM exposure under the Proposed Project would be approximately 0.009 (0.047 μg/m3 / 5.0μg/m3). This is well below the BAAQMD recommended threshold of 1.0 even without implementation of Mitigation Measure M-AQ-5. Therefore, chronic non-cancer health impacts associated with the Proposed Project would be less than significant.
Expanded Transit Service
The maximum incremental residential cancer risk from Expanded Transit Service would be 44.6 in one million. Applying application of a recently adopted age sensitivity factor derived by BAAQMD to account for exposure to prenatal and very young children increases this predicted risk to 75.8 in one million. This would be greater than the BAAQMD recommended threshold of 10 in one million and impacts would be significant.
As discussed previously, approximately 89 percent of the maximum DPM concentration under Expanded Transit Service would be attributed to ferry emissions. Given that risk is directly

IV. Environmental Setting and Impacts G. Air Quality
April 21, 2011 IV.G.47 Treasure Island / Yerba Buena Island Case No. 2007.0903E Redevelopment Project Final EIR
proportional to concentration, it can be assumed that 89 percent of risk (about 67.5 in one million) can be attributed to ferry emissions. Implementation of Mitigation Measure M-AQ-5 would reduce DPM emissions from ferries by 85 percent51 by requiring ferries to be equipped with particulate traps that would result in a 85-percent reduction in risk from ferries. Therefore, with implementation of this measure, risk from ferries would be approximately 10.1 in one million. When added to risk from buses, total risk under Expanded Transit Service after mitigation would be approximately 18.4 in one million; therefore impacts would be significant with air emissions mitigation.
The overall hazard index associated with the DPM exposure under Expanded Transit Service would be approximately 0.028 (0.14 μg/m3 / 5.0μg/m3). This is well below the BAAQMD recommended threshold of 1.0 even without implementation of Mitigation Measure M-AQ-5. Therefore, chronic non-cancer health impacts associated with Expanded Transit Service would be less than significant.
Diesel Particulate Matter Health Risks from the Bay Bridge
The BAAQMD has published screening tables that indicate the lifetime excess cancer risk from roadways in San Francisco County, including Interstate 80 to Treasure Island and Yerba Buena Island. This data is presented in Table IV.G.7. As can be seen from this table, excess cancer risk from this segment of roadway ranges from 24 in one million at a distance of 100 feet to 0.21 in one million at a distance of 1,000 feet. Consequently, any residences on Yerba Buena Island that would be within approximately 400 feet of the Bay Bridge could be exposed to cancer risks in excess of 10 in one million. This would be a significant impact for several of the residences proposed for Yerba Buena Island. The maximum Health Indices for the Bay Bridge are 0.06, which is less than the 1.0 significance threshold.
Table IV.G.7: Lifetime Cancer Risk Near the San Francisco-Oakland Bay Bridge
Distance East or West of I-80 in San Francisco (feet) 100 200 500 700 1,000
Cancer Risk (1 x 10⁶) 24 17 7.1 3.1 0.28 Source: BAAQMD, 2010
TAC Risks from Stationary Sources in the Proposed Development Plan Area
There are few sources of TACs in the Development Plan Area, none of which are identified by BAAQMD as major emitters. As discussed in the Setting section, the U.S. Coast Guard operates a buoy painting facility on the southern side of Yerba Buena Island, approximately 700 feet south of the Bay Bridge. BAAQMD identifies a cancer risk of 13.7 in one million associated with this
51 Per CARB http://www.arb.ca.gov/msprog/decsinstall/decsinstall.htm accessed June 25, 2010.

IV. Environmental Setting and Impacts G. Air Quality
April 21, 2011 IV.G.48 Treasure Island / Yerba Buena Island Case No. 2007.0903E Redevelopment Project Final EIR
facility, a chronic hazard index52 of 0.0096, and an acute hazard index of 0.00432. These risk values are for the maximally exposed receptor. This source is located more than 1,000 feet from Treasure Island and downwind from the predominant wind direction. Proposed improvements on Yerba Buena Island would also occur upwind of the predominant wind direction and would be separated topographically from the Coast Guard facility. There are no residences proposed for the south side of the Bay Bridge where this facility is located. However, it can reasonably be expected that residences within 300 feet of the north side of the Bay Bridge would be within a 1,000 foot radius of the facility and may be exposed to increased cancer risks.
Health Indices for this Coast Guard facility are 0.0096, which is less than the 1.0 significance threshold.
Project Generated Fine Particulate Matter (PM 2.5)
In addition to diesel-fueled buses, non-diesel fueled passenger vehicles would also emit PM2.5. Annual average PM2.5 concentrations from roadway traffic including busses were modeled similarly to DPM emissions as described above. In addition to exhaust emissions from buses and passenger vehicles, PM2.5 emissions associated with tire and brake wear were included in the modeling.
Under the Proposed Project’s transit scenario there would be approximately 30,330 vehicle trips generated per day. Modeling results of passenger vehicles in addition to buses and ferries demonstrated a maximum PM2.5 concentration of approximately 0.2μg/m3. This increase would not exceed the BAAQMD significance threshold of 0.3μg/m3; therefore, impacts would be less than significant. Mitigation Measure M-AQ-5 would require particulate traps for ferries that would reduce PM2.5 emissions from ferries by 85 percent, further reducing PM2.5 emissions.
Under Expanded Transit Service, there would be approximately 25,466 vehicle trips generated per day. Modeling results of passenger vehicles in addition to buses and ferries demonstrated a maximum PM2.5 concentration of approximately 0.27μg/m3. While passenger vehicle trips would be lower under Expanded Transit Service, annual average PM2.5 concentrations would still be greater that those anticipated under the Proposed Project’s transit scenario. This is due to the fact that a large portion of the PM2.5 concentration associated with Expanded Transit Service can be attributed to ferry and bus emissions rather than passenger vehicle emissions. Nevertheless, this increase would not exceed the pending BAAQMD significance threshold of 0.3μg/m3; therefore, impacts would be less than significant. Mitigation Measure M-AQ-5 would require particulate traps for ferries that would reduce PM2.5 emissions from ferries by 85 percent, further reducing PM2.5 emissions. 52 Hazard Index is a summation of the hazard quotients for all chemicals to which an individual is exposed.
A hazard index value of 1.0 or less than 1.0 indicates that no adverse human health effects (noncancer) are expected to occur.

IV. Environmental Setting and Impacts G. Air Quality
April 21, 2011 IV.G.49 Treasure Island / Yerba Buena Island Case No. 2007.0903E Redevelopment Project Final EIR
Fine Particulate Matter (PM 2.5) Exposure from Bay Bridge
A map presenting annual average PM2.5 concentrations around the Bay Bridge was presented in Figure IV.G-1. As can be seen from this Figure, any residences located within approximately 600 feet of the Bay Bridge would be expose to PM2.5 concentrations in excess of the BAAQMD’s pending significance threshold of 0.3μg/m3. This would be a significant impact with respect to the pending thresholds of the 2010 BAAQMD Guidelines, which become effective January 1, 2011. As discussed in the Setting section, residences exposed to PM2.5 concentrations in excess of 0.2 μg/m3 would need to comply with SF DPH Article 38, including installing appropriate air filtration equipment in new residential buildings.
Impact AQ-7: The Proposed Project could generate odors. (Less than Significant)
The principal proposed use that would have the potential to generate objectionable odors would be the proposed new or upgraded wastewater treatment plant. The new or upgraded wastewater treatment plant (“treatment plant”) would be in the same location as the existing wastewater treatment plant, at the northeastern corner of Treasure Island and would not introduce any new permitted stationary emission sources such as diesel generators. The existing treatment plant treats wastewater from existing development on the Islands. The treatment plant provides secondary treatment and has a peak dry weather treatment capacity of 0.80 mgd.
The BAAQMD CEQA Guidelines require that odor impacts be screened, based on the distance of an emitting facility to nearby sensitive receptors. Wastewater treatment facilities have an odor screening distance of one mile. Existing and proposed sensitive receptors within this distance would consist of all residences, schools, and daycare facilities on Treasure Island. Yerba Buena Island is beyond this one mile screening distance.
As discussed in the Setting section, according to BAAQMD records, BAAQMD has received no odor complaints within the last five years with respect to the existing Treasure Island treatment plant.
As currently envisioned, the new or upgraded treatment plant would have the capacity to treat an average dry weather flow of about 1.3 mgd (the estimated dry-weather flow for project buildout) and a peak wet-weather flow capacity of about 2.9 mgd. The treatment process would start with the existing baseline of primary and secondary treatment and is discussed in detail in Chapter II, Project Description and Section IV.K, Utilities.
Although the Proposed Project would result in an increase in throughput of wastewater, implementation of updated treatment equipment and processes as well as odor control technology with the Proposed Project would be expected to result in a reduction in potential odors compared to existing conditions.

IV. Environmental Setting and Impacts G. Air Quality
April 21, 2011 IV.G.50 Treasure Island / Yerba Buena Island Case No. 2007.0903E Redevelopment Project Final EIR
The facility would be required to comply BAAQMD Regulation 7, which places general limitations on odorous substances and specific emission limitations on certain odorous compounds, BAAQMD Regulation 9, Rule 2, which limits ground level concentrations of hydrogen sulfide and BAAQMD Regulation 8, Rule 8, which limits the emissions of organic compounds from wastewater collection and separation systems that handle liquid organic compounds from industrial processes.
The Proposed Project would result in updated treatment processes and equipment at an existing wastewater treatment plant. There are existing regulatory mechanisms contained in Regulation 7 through which any potential odor impacts would be verified by use of a dynamic olfactometer and corrections made until no odor complaints are received over a one year period. Finally, the Proposed Project would increase the existing buffer distance between the plant and the nearest residences. Consequently odor impacts are expected to be less than significant, and no mitigation is required.
Impact AQ-8: The Proposed Project could conflict with adopted plans related to air quality. (Significant for the Proposed Project and Less than Significant for Expanded Transit Service)
The most recently adopted air quality plan in the San Francisco Bay Area Air Basin is the Bay Area 2005 Ozone Strategy (the 2010 Clean Air Plan is still in Draft form). The 2005 Ozone Strategy is a roadmap showing how the San Francisco Bay Area will achieve compliance with the state one-hour ozone standard as expeditiously as practicable, and how the region will reduce transport of ozone and ozone precursors to neighboring air basins. The control strategy includes stationary-source control measures to be implemented through BAAQMD regulations; mobile-source control measures to be implemented through incentive programs and other activities; and transportation control measures to be implemented through transportation programs in cooperation with the MTC, local governments, transit agencies, and others. The 2005 Ozone Strategy also represents the Bay Area’s most recent triennial assessment of the region’s strategy to attain the state one-hour ozone standard. In this, the 2005 Ozone Strategy replaces the 2000 Clean Air Plan. Under BAAQMD’s methodology, a determination of consistency with the most recently adopted Clean Air Plan (“CAP”), currently the Bay Area 2005 Ozone Strategy, must demonstrate that a plan or project not exceed the population or vehicle miles traveled (“VMT”) assumptions contained in the CAP and that the project or plan implements transportation control measures (“TCMs”) as applicable.
Criterion 1: Population Growth and VMT Consistency
For a project to be consistent with the CAP, BAAQMD requires that the projected increase in VMT associated with a proposed project be less than the projected population increase. Because the majority of vehicle trips from the Proposed Project would be distributed not just to San

IV. Environmental Setting and Impacts G. Air Quality
April 21, 2011 IV.G.51 Treasure Island / Yerba Buena Island Case No. 2007.0903E Redevelopment Project Final EIR
Francisco, but also to Alameda County via the Bay Bridge, percentage increases of VMT and population are compared on a region-wide basis that includes both San Francisco and Alameda Counties.
The MTC maintains an inventory of population VMT for the region and by county,53 the latest version of which was published in 2008. The population estimates of the MTC cite a 2035 Alameda and San Francisco county region-wide population of 2,895,400. As discussed in Section IV.C, Population and Housing, development of the full buildout of the Proposed Project would result in a population increase of approximately 16,820 persons (18,640 future population minus an existing population of 1,820). This represents a regional population increase of 0.58 percent.
As discussed in the analysis of criteria pollutant impacts, the proposed development would result in a net new vehicle trip generation of 30,330 trips per day in the Proposed Project’s transit scenario and 25,466 trips per day under Expanded Transit Service. Using trip length assumptions from the CARB URBEMIS 2007 model, the resulting regional increase in VMT would be 302,185 and 253,731 miles per day for each respective scenario.
The MTC maintains an inventory of VMT for the region and by county.54 For 2030, MTC data shows VMT for the combined counties of San Francisco and Alameda of 49,169,014 miles. The addition of project-related VMT to the 2035 forecast results in a total increase of 0.61 percent in the VMT for the Proposed Project, and a total increase of 0.52 percent in the VMT for Expanded Transit Service.
Consequently, the rate of increase in VMT (0.61 percent) would be more than the rate of increase in population (0.58 percent) for the Proposed Project and would be considered inconsistent with the population and VMT assumptions of the CAP. However, for Expanded Transit Service, the rate of increase in VMT (0.52 percent) would be less than the rate of increase in population (0.58 percent) which would be considered to be consistent with the CAP. Thus, implementation of Mitigation Measure M-TR-2 would reduce this impact to a less-than-significant level.
Criterion 2: Plan consistency with TCMs contained in the CAP
Air pollutant emissions are a function of human activity. The 1988 California Clean Air Act, Section 40919(d) requires regions to implement “transportation control measures to substantially reduce the rate of increase in passenger vehicle trips and miles traveled.” Consistent with this requirement, one of the goals of the Bay Area 2005 Ozone Strategy is to reduce the number of trips and vehicle miles Bay Area residents travel in single-occupant vehicles through the implementation of twenty TCMs. Table IV.G.8 identifies those TCMs that local governments
53 http://www.mtc.ca.gov/planning/2035_plan/Supplementary/T2035-Travel_Forecast_Data_Summary.pdf 54 http://www.mtc.ca.gov/planning/2035_plan/Supplementary/T2035-Travel_Forecast_Data_Summary.pdf

IV. Environmental Setting and Impacts G. Air Quality
April 21, 2011 IV.G.52 Treasure Island / Yerba Buena Island Case No. 2007.0903E Redevelopment Project Final EIR
should implement through local plans to be considered in conformance with the 2005 Ozone Strategy. The BAAQMD recommends that local plans that do not demonstrate reasonable efforts to implement these TCMs be considered inconsistent with the regional air quality plan and therefore have a significant impact. As presented in Table IV.G.8 below, the Proposed Project contains elements consistent with the applicable TCMs in the 2005 Ozone Strategy. This table identifies each applicable TCM and correlates it to a specific element or elements of the project that address the TCM. Therefore, the Proposed Project would be consistent with the TCMs contained in the Clean Air Plan for the San Francisco Bay Area Air Basin.
Overall, the Proposed Project would have a significant impact with regard to conflicts with the Air Quality Plan, while the Proposed Project with Expanded Transit Service would be less than significant with regard to conflicts with the Air Quality Plan. Therefore, the Proposed Project with Expanded Transit Service would represent a mitigated scenario for this significant impact. However, the Proposed Project with Expanded Transit Service would have other air quality impacts related to increased ferry emissions, as discussed in Impacts AQ-5 and AQ-6.
CUMULATIVE IMPACTS
Impact AQ-9: The Proposed Project could result in significant cumulative air quality impacts. (Significant and Unavoidable)
Cumulative Construction Criteria Pollutant Impacts
The applicable 1999 BAAMD guidelines and thresholds do not require quantification of construction emissions. Therefore with inclusion of dust control Mitigation Measures M-AQ-1, the Proposed Project would have a less-than-significant cumulative impact with regard to construction emissions relative to this guidance.
The discussion of thresholds of significance in the 2010 BAAQMD CEQA Air Quality Guidelines state that if a project exceeds the identified significance thresholds (presented in Table IV.G.4), its emissions would be cumulatively considerable, resulting in significant adverse air quality impacts to the region’s existing air quality conditions. As a result, additional analysis to assess cumulative criteria pollutant impacts is deemed unnecessary by BAAQMD.55
As indicated in Table IV.G.4, the proposed Development Plan would exceed BAAQMD construction-related significance thresholds for ROG, and NOx. Consequently, the Proposed Project would result in a significant cumulative impact with regard to regional emissions of these criteria pollutants. Construction activities for the Proposed Project are expected to begin in 2011 and would overlap with construction of the Bay Bridge East Span project for up to about three years and could overlap with the Yerba Buena Island Ramps Improvement Project for about two to five years, depending on when it starts. 55 BAAQMD, CEQA Air Quality Guidelines, 2010, p. 2-1.

IV. Environmental Setting and Impacts G. Air Quality
April 21, 2011 IV.G.53 Treasure Island / Yerba Buena Island Case No. 2007.0903E Redevelopment Project Final EIR
Table IV.G.8: Clean Air Plan TCMs to Be Implemented by Local Governments
TCM in the 2005 Ozone Strategy Elements of the Proposed Project Consistent with the TCM 1. Support Voluntary Employer-Based Trip
Reduction Programs (TCM #1)
The Proposed Project would include formation of a Treasure Island Transportation Management Agency (“TITMA”) responsible for implementing a comprehensive transportation management plan designed to discourage driving and promote use of alternative travel modes. The TITMA would oversee the provision of transit services as well as implement a series of transportation demand management (“TDM”) measures to affect travel behavior.
2. Improve Local and Area wide Bus Service (TCM #3)
Project sponsors would fund the purchase of articulated Muni buses for service to and from the Transbay Terminal via the existing Muni route; ultimately, a second location such as the Civic Center and/or Caltrain Depot at 4th and King Streets are planned via new routes to be established by Muni in coordination with TIDA and TITMA based on future demand. Only the existing Transbay Terminal route is assumed in the Proposed Project. To initiate AC Transit service to the East Bay, project sponsors would fund the purchase of about 8 to 10 buses as necessary for service to the Islands based on the Transportation Plan, to be operated by AC Transit or another operator.
3. Improve Access to Rail & Ferries (TCM #5) The Proposed Project would include construction of a ferry terminal that would be located just north of the causeway, opposite Building 1. It would include two ferry slips for bow-loading ferries. An intra-island shuttle bus would provide residents with access to the proposed ferry terminal.
4. Improve Ferry Service (TCM #7) The Proposed Project would implement new ferry service between Treasure Island and San Francisco. Expanded Transit Service anticipates that ferry service would ultimately be provided to and from San Francisco at 15-minute intervals at peak periods, with the ferry operating between 5:00 a.m. and 9:00 PM. The Proposed Project analyzed in this EIR assumes that one ferry would provide service at approximately 50-minute intervals because only one ferry vessel is proposed to be fully funded by project sponsors; additional ferries and shorter headways are included in Expanded Transit Service.
5. Improve Bicycle Access and Facilities (TCM #9)
The draft Design for Development and Transportation Plan are intended to encourage the use of walking and bicycling as primary on-Island travel modes. The proposed pedestrian and bicycle facilities are illustrated in Figures 12, Proposed Bicycle Routes on Treasure Island, and 13, Proposed Bicycle and Pedestrian Routes on Yerba Buena Island.
6. Improve Arterial Traffic Management (TCM #12)
All of the streets on Treasure Island would be newly constructed, and would meet the requirements of the San Francisco Fire Department (“SFFD”), SFPUC, San Francisco Department of Public Works (“SFDPW”), and the Municipal Transportation Agency’s Division of Parking & Traffic (“DPT”). Major arterial streets would comprise the main east/west and north/south streets on Treasure Island, including the access to the causeway in the transit hub area. The typical sections for these streets would include, in each direction, a 12-foot-wide traffic lane, an 8-foot-wide parking bay, and a 5-foot-wide Class II striped bike lane. Additional ten-foot-wide

IV. Environmental Setting and Impacts G. Air Quality
April 21, 2011 IV.G.54 Treasure Island / Yerba Buena Island Case No. 2007.0903E Redevelopment Project Final EIR
TCM in the 2005 Ozone Strategy Elements of the Proposed Project Consistent with the TCM lanes may be added for exclusive turn lanes in high traffic areas. Landscaping and a sidewalk would be provided on each side of the road.
One secondary arterial street on Treasure Island – First Street – would serve the rest of the transit hub area along the south edge of the island and in front of Building 2. This street would not provide direct access to the causeway and the Bay Bridge; therefore it was not classified as a major arterial. Typical cross sections would include 11-foot-wide traffic lanes and a 7-foot-wide parking bay in the eastbound direction and a 5-foot-wide Class II bicycle lane and an 8-foot-wide parking bay in the westbound direction. Where parking is placed adjacent to the bus route, a 6-foot flex lane would be included between the parking bay and the travel lane. As with major arterials, there would be landscaping and sidewalks on both sides of the street. Building setbacks would typically be about 6 feet from the right-of-way; this space could be used for residential stoops, porches, or gardens related to residential entries in residential buildings.
7. Local Clean Air Plans, Policies and Programs (TCM #15) - Cities are to promote car sharing as a way to reduce parking requirements.
The proposed transit hub would provide a pool of shared bicycles (“bicycle library”) and a car share pod to promote car sharing.
8. Implement Transportation Pricing Reform (TCM #18)
Proposed TDM measures designed to discourage automobile use include parking pricing policies requiring that fees for all visitor parking for the Islands be charged, and that residential parking be leased or purchased separately from the residential unit; a congestion pricing program; and ramp metering on the access ramps to the Bay Bridge. The congestion pricing program would allow for imposition of fees applicable to residents who drive on and/or off the Islands. The congestion pricing fees could be adjusted to reflect traffic patterns, congestion levels, time of day, and other conditions that affect the roadway system.
9. Improve Pedestrian Access and Facilities (TCM #19)
The draft Design for Development and Transportation Plan are intended to encourage the use of walking and bicycling as primary on-Island travel modes. The proposed pedestrian and bicycle facilities are illustrated in Figures 12, Proposed Bicycle Routes on Treasure Island, and 13, Proposed Bicycle and Pedestrian Routes on Yerba Buena Island.
10. Promote Traffic Calming Measures (TCM #20)
The Transportation Plan describes how the Development Plan is designed to encourage walking and bicycling as primary on-Island travel modes. Streets would be designed to be low-speed to create an environment that is compatible with walking and biking; the busiest streets would incorporate Class II bicycle lanes.
Source: Environmental Science Associates, 2010.

IV. Environmental Setting and Impacts G. Air Quality
April 21, 2011 IV.G.55 Treasure Island / Yerba Buena Island Case No. 2007.0903E Redevelopment Project Final EIR
Cumulative Construction Hazard Impacts
The applicable 1999 BAAMD guidelines and thresholds do not identify hazard-related significance criteria for construction impacts. Therefore, the Proposed Project would have a less-than-significant cumulative impact with regard to construction emissions relative to this guidance.
The 2010 BAAQMD CEQA Air Quality Guidelines identify cumulative hazard thresholds relative to cancer risk, Hazard Indices, and PM2.5 concentrations. The following analysis sums the risks from Proposed Project construction in addition to existing stationary sources and roadway sources. This analysis is performed as a worst case screening exercise. If impacts at the maximally impacted receptor from each source is summed and still found to be less than the cumulative significance criterion, then more distant receptors can be assumed to experience lesser concentrations and therefore would also be impacted at a less-than-significant level.
There are few sources of TACs in the Development Plan Area, none of which are identified by the BAAQMD as major emitters. The Community Health Air Pollution Information System (“CHAPIS”) database of the CARB maps facilities which emit inventoried criteria air pollutants and toxic air contaminants throughout California. The CHAPIS database does not indicate any inventoried air toxic or criteria pollutant emitting facilities within a one mile radius of the Development Plan Area. As discussed in the Setting section, the U.S. Coast Guard operates a buoy painting facility on the eastern side of Yerba Buena Island, approximately 700 feet east of the Bay Bridge. The BAAQMD identifies a cancer risk of 13.7 in one million associated with this facility, a chronic hazard index56 of 0.0096 and an acute hazard index of 0.00432. The PM2.5 concentration at the facility fenceline is reported to be 0.149 micrograms per cubic meter. These risk values are for the maximally exposed receptor. This source is located more than 1,000 feet from Treasure Island and downwind from the predominant wind direction. Proposed improvements on Yerba Buena Island would also occur upwind of the predominant wind direction and would be separated topographically from the Coast Guard facility.
The only other potential sources are two emergency diesel-powered generators that would be relocated near the wastewater treatment plant as part of the Proposed Project and would not represent new sources of emissions.
Other cumulative development projects in the area consist of the Yerba Buena Island Ramps Improvement Project, the realignment of the east span of the Bay Bridge, and the expansion of Clipper Cove Marina. The first two of these cumulative projects involve relatively minor relocations of existing mobile sources and, as such, would not introduce a new source of DPM or PM2.5 to the area. Additionally, while the Bay Bridge accommodates a large volume of vehicle
56 Hazard Index is a summation of the hazard quotients for all chemicals to which an individual is exposed.
A hazard index value of 1.0 or less than 1.0 indicates that no adverse human health effects (noncancer) are expected to occur.

IV. Environmental Setting and Impacts G. Air Quality
April 21, 2011 IV.G.56 Treasure Island / Yerba Buena Island Case No. 2007.0903E Redevelopment Project Final EIR
traffic in the Project Area, it is located more than 1,000 feet from Treasure Island and downwind from the predominant wind direction. Proposed improvements on Yerba Buena Island would also occur upwind of the predominant wind direction and would be separated topographically from the bridge. BAAQMD screening tables for cancer risk along this section of I-8057 indicate a cancer risk of 15 in one million at a distance of 200 feet and a chronic and acute hazard index of 0.4 at 200 feet north of the bridge. Cumulative construction-related hazard impacts may be summed. Summing the increased cancer risks from the Bay Bridge (17 in one million at the nearest receptor (200 feet), the Coast Guard facility (13.7 in one million) and the Proposed Project construction (16.8 in one million for Phase 2 Treasure Island receptors with mitigation) results in a cumulative cancer risk of 47.5 in one million. This is less than the BAAQMD cumulative cancer risk threshold of 100 in one million.
Summing the chronic hazard indices from the Bay Bridge (0.4), the Coast Guard facility (0.0096), and the Proposed Project (0.072 for Phase 2 Treasure Island receptors with mitigation) results in a cumulative Hazard Index of 0.48 which is less than the BAAQMD cumulative chronic hazard index threshold of 10.0.
Predicted PM2.5 concentrations from the construction of the Proposed Project alone would exceed the cumulative PM2.5 threshold of 0.8 micrograms per cubic meter (see Impact AQ-4). Therefore, cumulative PM2.5 contributions from other sources at receptors near to the Bay Bridge and the Coast Guard facility would exacerbate these predicted significant PM2.5 concentrations. Consequently there would be significant cumulative PM2.5 construction impacts at residences close to peak Phase 2 construction activities.
Mitigation Measures M-AQ-3 and M-AQ-4 would be unlikely to achieve a 61 percent reduction in PM2.5 emissions and resultant concentrations, the level necessary to reduce emissions from these sources to a level below the BAAQMD’s 0.8 microgram per cubic meter cumulative significance threshold. Therefore, even with the implementation of all feasible (BAAQMD-identified) mitigation measures, PM2.5 concentrations would remain significant and would be a potential significant and unavoidable cumulative impact with respect to pending 2010 BAAQMD thresholds.
Cumulative Regional Criteria Pollutant Impacts
The discussion of thresholds of significance in both the 1999 and 2010 BAAQMD CEQA Air Quality Guidelines state that if a project exceeds the identified significance thresholds (presented in Table IV.G.4), its emissions would be cumulatively considerable, resulting in significant
57 http://www.baaqmd.gov/~/media/Files/Planning%20and%20Research/CEQA/Roadway_Screening_
Tables_May_2010.ashx

IV. Environmental Setting and Impacts G. Air Quality
April 21, 2011 IV.G.57 Treasure Island / Yerba Buena Island Case No. 2007.0903E Redevelopment Project Final EIR
adverse air quality impacts to the region’s existing air quality conditions. As a result, additional analysis to assess cumulative criteria pollutant impacts is deemed unnecessary by BAAQMD.58
As indicated in Table IV.G.5, the Proposed Project would exceed BAAQMD significance thresholds for ROG, NOx, PM10 and PM2.5. Consequently, the Proposed Project would result in a significant cumulative impact with regard to emissions of these criteria pollutants.
Cumulative Risk and Hazard Impacts for DPM, TACs and PM2.5
Like the cumulative construction analysis, the following cumulative project-level analysis sums the risks from Proposed Project construction in addition to existing stationary sources and roadway sources. This analysis is performed as a worst case screening exercise. If impacts at the maximally impacted receptor from each source are summed and still found to be less than the cumulative significance criterion, then more distant receptors can be assumed to experience lesser concentrations and therefore also be impacted at a less than significant level.
Summing the risks from the Bay Bridge (15 in one million), the Coast Guard facility (13.7 in one million) and the Proposed Project (18.4 in one million for Expanded Transit Service with mitigation) results in a cumulative cancer risk of 47.1 in one million. This is less than the BAAQMD cumulative cancer risk threshold of 100 in one million.
Summing the chronic hazard indices from the Bay Bridge (0.4), the Coast Guard facility (0.0096) and the Proposed Project (0.028 for Expanded Transit Service with mitigation) results in a cumulative Hazard Index of cancer risk of 0.61, which is less than the BAAQMD cumulative chronic hazard index threshold of 10.0.
Summing the PM2.5 concentration contributions from the Bay Bridge (0.50 microgram per cubic meter as shown in Figure IV.G-1), the Coast Guard facility (0.149 micrograms per cubic meter) and the Proposed Project (0.27 micrograms per cubic meter for Expanded Transit Service) results in a cumulative PM2.5 concentration of 0.78 micrograms per cubic meter, which is less than the BAAQMD cumulative PM2.5 concentration threshold of 0.8 micrograms per cubic meter. These screening level concentrations are conservative in that they apply the fenceline concentration from the Coast Guard facility and the worst case receptor for the Proposed Project, which is on Treasure Island.
The Clipper Cove Marina expansion would generate a relatively small amount of standard motor vehicle traffic and recreational boat operations. According to the 2005Treasure Island Transfer and Reuse EIR, the marina boats consist of sail boats, diesel-powered boats, and gasoline-powered boats. The anticipated future diesel and gasoline power boats would be a small percent of the total boats at the marina. The total trips associated with power boats from the marina
58 BAAQMD, CEQA Air Quality Guidelines, 2010, pg 2-1.

IV. Environmental Setting and Impacts G. Air Quality
April 21, 2011 IV.G.58 Treasure Island / Yerba Buena Island Case No. 2007.0903E Redevelopment Project Final EIR
would not be substantial, since not all boats would be operating simultaneously. In addition, recreational power boats normally use small engines and operate over short travel distances with limited hours per day. Therefore, the contribution of emissions from marina motorboats to the total estimated emissions associated with the Proposed Project, the Bay Bridge and the Coast Guard buoy painting facility would be negligible. Therefore the proposed cumulative projects in the area are not anticipated to contribute cumulatively considerable emissions in addition to the project.
_________________________
REFERENCES
BAAQMD, Toxic Air Contaminant Trigger Levels, June 15, 2005.
CARB, Methodology for Estimating Premature Deaths Associated with Long-Term Exposure to Fine Airborne Particulate Matter in California, October 24, 2008.
CARB, Aerometric Data Analysis and Management website, http://www.arb.ca.gov/adam/welcome.html, accessed March 3, 2009.


![HEALTH AND THE BUILT ENVIRONMENT: INDOOR AIR QUALITY [Professor Tang G. Lee]](https://img.pdfslide.us/doc/110x75/5476eaae5906b5ae7c8b458d/health-and-the-built-environment-indoor-air-quality-professor-tang-g-lee.jpg)